- 1Key Laboratory of Submarine Geosciences, Second Institute of Oceanography, Ministry of Natural Resources, Hangzhou, China
- 2Huadian Electric Power Research Institute Co., LTD., Hangzhou, China
Polymetallic ferromanganese nodules (PMNs) in the Clarion-Clipperton Zone (CCZ) exhibit significant spatial variability in chemical composition, which complicates exploration efforts and increases associated costs. The primary factors driving this spatial variability remain unclear due to limited understanding of the growth history of these nodules. This study investigated the internal structure and elemental distributions of PMNs from both the eastern and western CCZ using a range of in-situ techniques, including high-resolution element mapping and chemical analysis, to characterize the compositional differences and growth processes of the nodules. Analysis of Nodule BC06 from the eastern CCZ reveals a decreasing Mn/Fe ratio from the inner part (Layer I) to the outer part (Layer II). In contrast, Nodule BC1901 from the western CCZ consists of three layers, with the Mn/Fe ratio increasing from Layer I to Layer II and then decreasing from Layer II to Layer III. Discrimination diagrams indicate that both nodules formed through hydrogenetic and diagenetic processes, with Nodule BC06 showing stronger diagenetic influences. Variations in diagenetic effects from core to rim suggest different geochemical controls in the two regions. In the eastern CCZ, compositional changes are mainly driven by the movement of PMNs away from the equatorial high-productivity zone. In the western CCZ, the variability in deep-water ventilation and the intensity of Antarctic Bottom Water are the key factors influencing nodule composition. These findings enhance our understanding of the growth history and spatial variability of PMNs in the CCZ and provide valuable insights for future resource evaluation.
1 Introduction
Polymetallic manganese (or ferromanganese) nodules (PMNs) contain high concentrations of nickel, copper, and cobalt, as well as other metals such as molybdenum, rare earth elements, and lithium, all of which are critical to high-tech industries and hold significant economic value (Hein et al., 2020). Additionally, the extremely slow accumulation rates of these nodules, combined with their continuous adsorption of dissolved metals from seawater, allow them to record changes in the seawater composition over time (e.g., Glasby, 2006; Kuhn et al., 2017). As a result, studying these PMNs is vital for both exploring critical metal resources in the marine environment and for understanding the environmental changes of seawater (Ren et al., 2024).
Nodule deposits are found throughout the global oceans, but they typically form on the surfaces of abyssal plains at depths of 4,000 to 6,000 m below sea level (Hein and Koschinsky, 2014). Among these, the Clarion-Clipperton Zone (CCZ) is the most prominent nodule field and hosts the largest known nodule resources in the ocean. Currently, 17 out of 19 exploration contract areas for polymetallic nodules, granted by the International Seabed Authority, are located in the CCZ (http://www.isa.org.jm) (Figure 1). Extensive research has been conducted on PMNs in the CCZ for many years, and the chemical composition of bulk PMNs in this region is well-documented (e.g., Menendez et al., 2019; Wegorzewski et al., 2015; Wegorzewski and Kuhn, 2014). In general, PMNs from the CCZ are classified as mixed type, with both hydrogenetic and diagenetic origins (e.g. Hein et al., 2020; Bau et al., 2014; Von Stackelberg, 1997). However, covering an area of approximately 4.5 million km2 and stretching about 7,240 km in length, the chemical compositions of PMNs in the CCZ vary regionally. The manganese and copper contents of the PMNs increase markedly towards the southeast, while the nickel and cobalt contents exhibit a partial trend along the central axis of the CCZ (ISA, 2010). Despite extensive research, relatively little attention has been given to the reasons behind the spatial variations in the compositions of Mn-nodules within the CCZ. With the current demand for deep-sea PMN exploration, the process remains challenging and costly. Therefore, efficiently identifying promising locations requires a theoretical understanding of nodule formation and spatial variability.
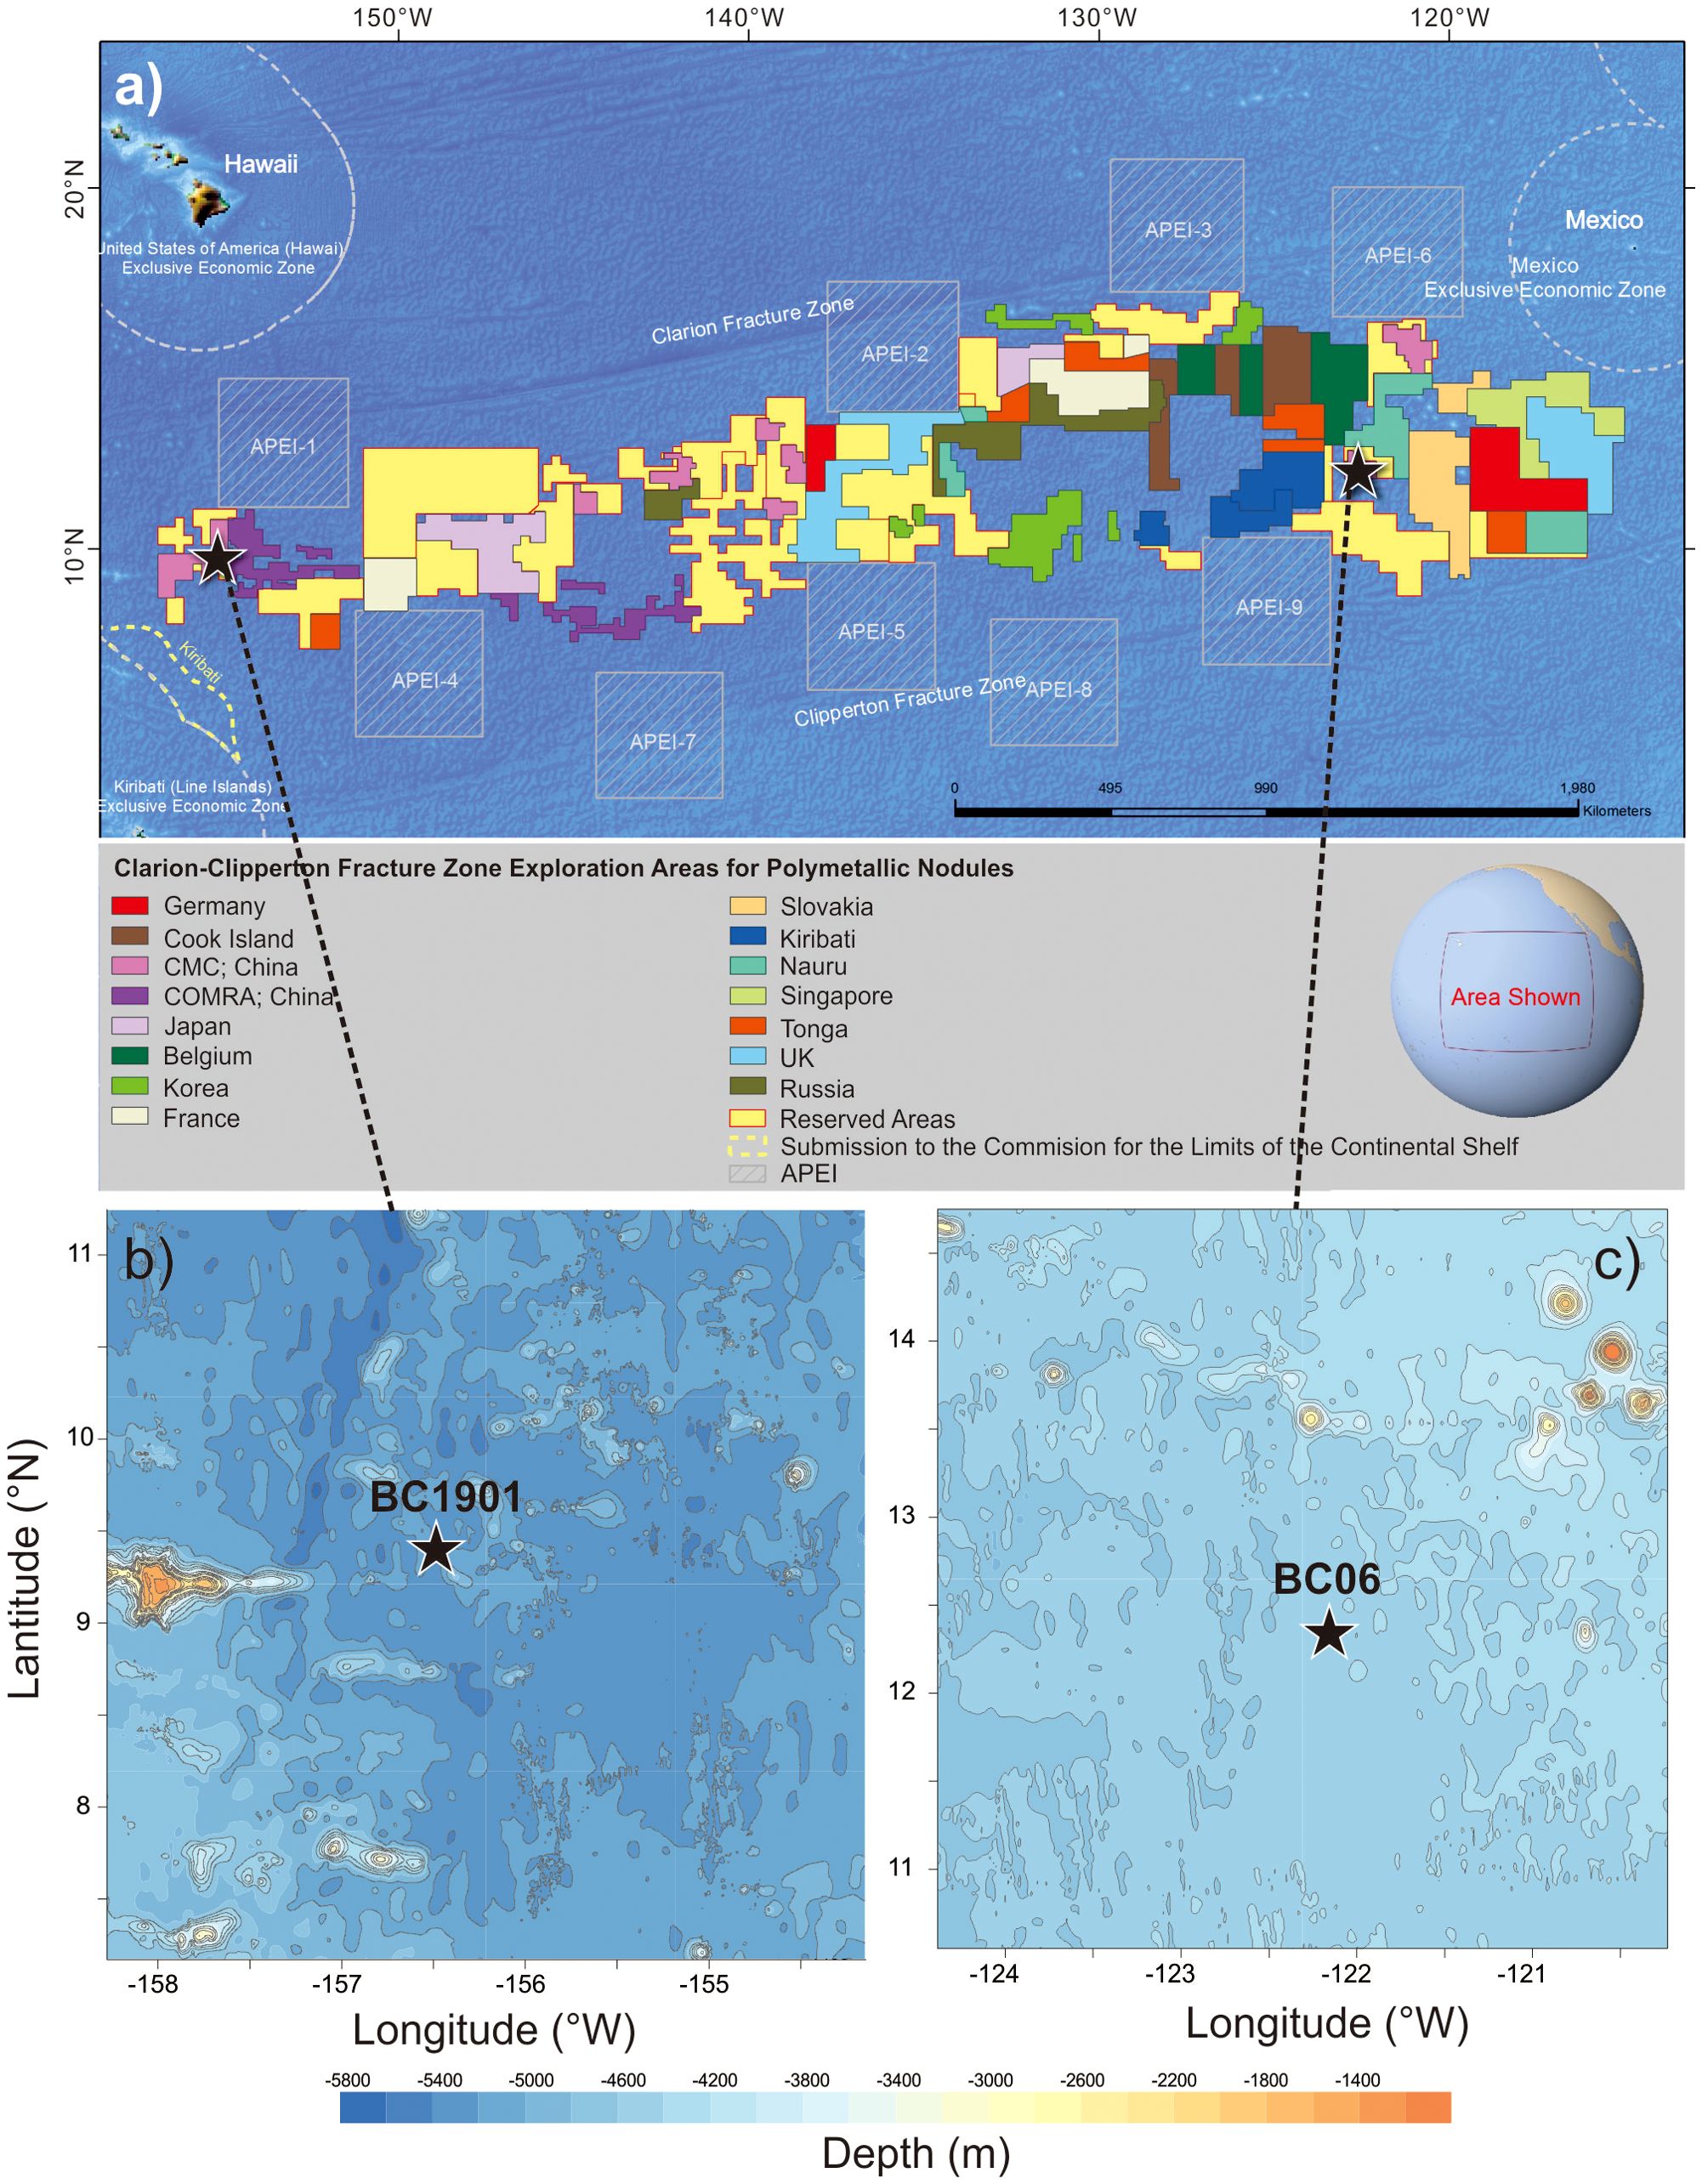
Figure 1. The locations of (A) contract areas for ferromanganese nodule exploration and areas of particular environmental interest (APEI) in the Clarion-Clipperton Zone (CCZ) (modified from the website of the International Seabed Authority (ISA); http://www.isa.org.jm); (B, C) Bathymetric maps showing the locations of the sampling sites in the eastern and western CCZ. The sampling locations are depicted by the red stars.
The varying populations of PMNs in different locations can be attributed to several factors, including the seafloor topography, bottom current activity, and the activity of benthic organisms (Zhong et al., 2019; Wang et al., 2015; Pan and Hua, 1996). While these parameters can be readily measured under modern seafloor conditions, obtaining historical data is significantly more challenging. Since PMNs typically grow over several million years, changes in the geological environment during such a long growth process have a profound impact on their composition. To better understand the factors influencing the chemical composition of PMNs in the CCZ, it is crucial to study their growth history. Numerous studies have examined the individual growth layers of PMNs worldwide. For example, Menendez et al. (2019) conducted an integrated study of the chemical compositions of micro-layers in PMNs from the UK contract area and Areas of Particular Environmental Interest (APEI-6) in northeastern CCZ. It was concluded that the compositional changes in the nodules in these areas are related to plate motion as the PMNs move from high to low productivity zones due to northwestward plate movement. Thus, primary productivity, associated with the activity of benthic organisms, has been identified as the primary factor controlling chemical variations in the study area. However, Menendez et al. (2019) only addressed the vertical variations in the chemical compositions of PMNs in the eastern CCZ. It remains unclear whether lateral variations in the nodule composition across the CCZ can also be ascribed to plate motion, and if this is not determined, the primary factors controlling the differences in the chemical compositions of nodules in the eastern and western parts of the CCZ are still not well understood. A comprehensive understanding of nodule formation requires studying their micro-features. Because individual growth layers of PMNs can serve as an archive of changes in environmental conditions during their formation, they are considered one of the best recorders of geological history.
Therefore, to improve our understanding of lateral variations in the CCZ, in this study, PMNs were collected from both the eastern and western regions. Various in-situ analytical techniques were utilized to investigate the element distributions and mineralogy within the PMNs. We focused on three key aspects: (i) micrographic variations and mineral assemblages during nodule growth; (ii) changes in environmental conditions during nodule development; and (iii) the primary factors influencing the nodule formation process. Understanding the spatial distribution of individual growth layers with varying chemical and mineralogical compositions in PMNs provides valuable insights into the geochemical processes involved in their formation (Park et al., 2023).
2 Geologic setting and samples
The CCZ, located in the Central Eastern Pacific Ocean, north of the equatorial high productivity zone (Antoine et al., 1996), extends from approximately 5°N to 20°N and from 120°W to 160°W. CCZ is bounded by the Clarion Fracture Zone to the north and the Clipperton Fracture Zone to the South, with a total length of approximately 7,240 km and an area of 4.5 million km2 (Figure 1). The fractures trend southwest–northeast in response to the northwestward motion of the Pacific Plate (Von Stackelberg and Beiersdorf, 1991). This area contains one of the largest nodule fields in the ocean and hosts several contract areas for the exploration of polymetallic nodules (e.g., Halbach et al., 1988). The sedimentation rates in the western CCZ are 0.15–0.4 cm ka–1 (Müller and Mangini, 1980), while those in the eastern CCZ are slightly higher (0.20–1.15 cm ka–1) (Mewes et al., 2014; Mogollón et al., 2016; Volz et al., 2018). The study areas are located below the carbonate compensation depth (CCD), which is located at depth of approximately 4,500 m below sea level (Johnson, 1972; Lyle, 2003). The oxygen penetration depths (OPDs) in the eastern CCZ are 1–4.5 m (Mewes et al., 2014; Mogollón et al., 2016; Volz et al., 2018). The sediment in the study areas is mainly siliceous clay (ISA, 2010). The present-day primary productivity decreases slightly from east to west across the CCZ (Glasby, 2006).
The nodules used in this study were collected from box cores obtained during the cruise of the R/V Xiangyanghong 10 in 2019. Site BC06 (122.16°W, 12.34°N) and Site BC1901 (156.50°W, 9.38°N) are located in the eastern and western CCZ, respectively, and have a water depth of ~5000 m. Although considerable variations exist in the morphology and size of the PMNs at these two stations, previous research has reported that morphology and size have minimal impacts on the compositions of the PMNs (DY54 cruise report, 2020). Therefore, in this study, we selected one PMN from each site to represent the sites in the study area (Figure 2). As most of the PMNs from Site BC06 had rough surfaces, we also selected a PMN with a rough surface from Site BC1901 for comparison. The selected PMNs were cut vertically into two equal parts. One part was adhered to glass slides using epoxy resins. After polishing, 300 μm thick thin sections were prepared for in-situ geochemical analysis. Additionally, five subsamples of individual layers were subsequently drilled from the other part, which were used to determine the mineralogical composition.
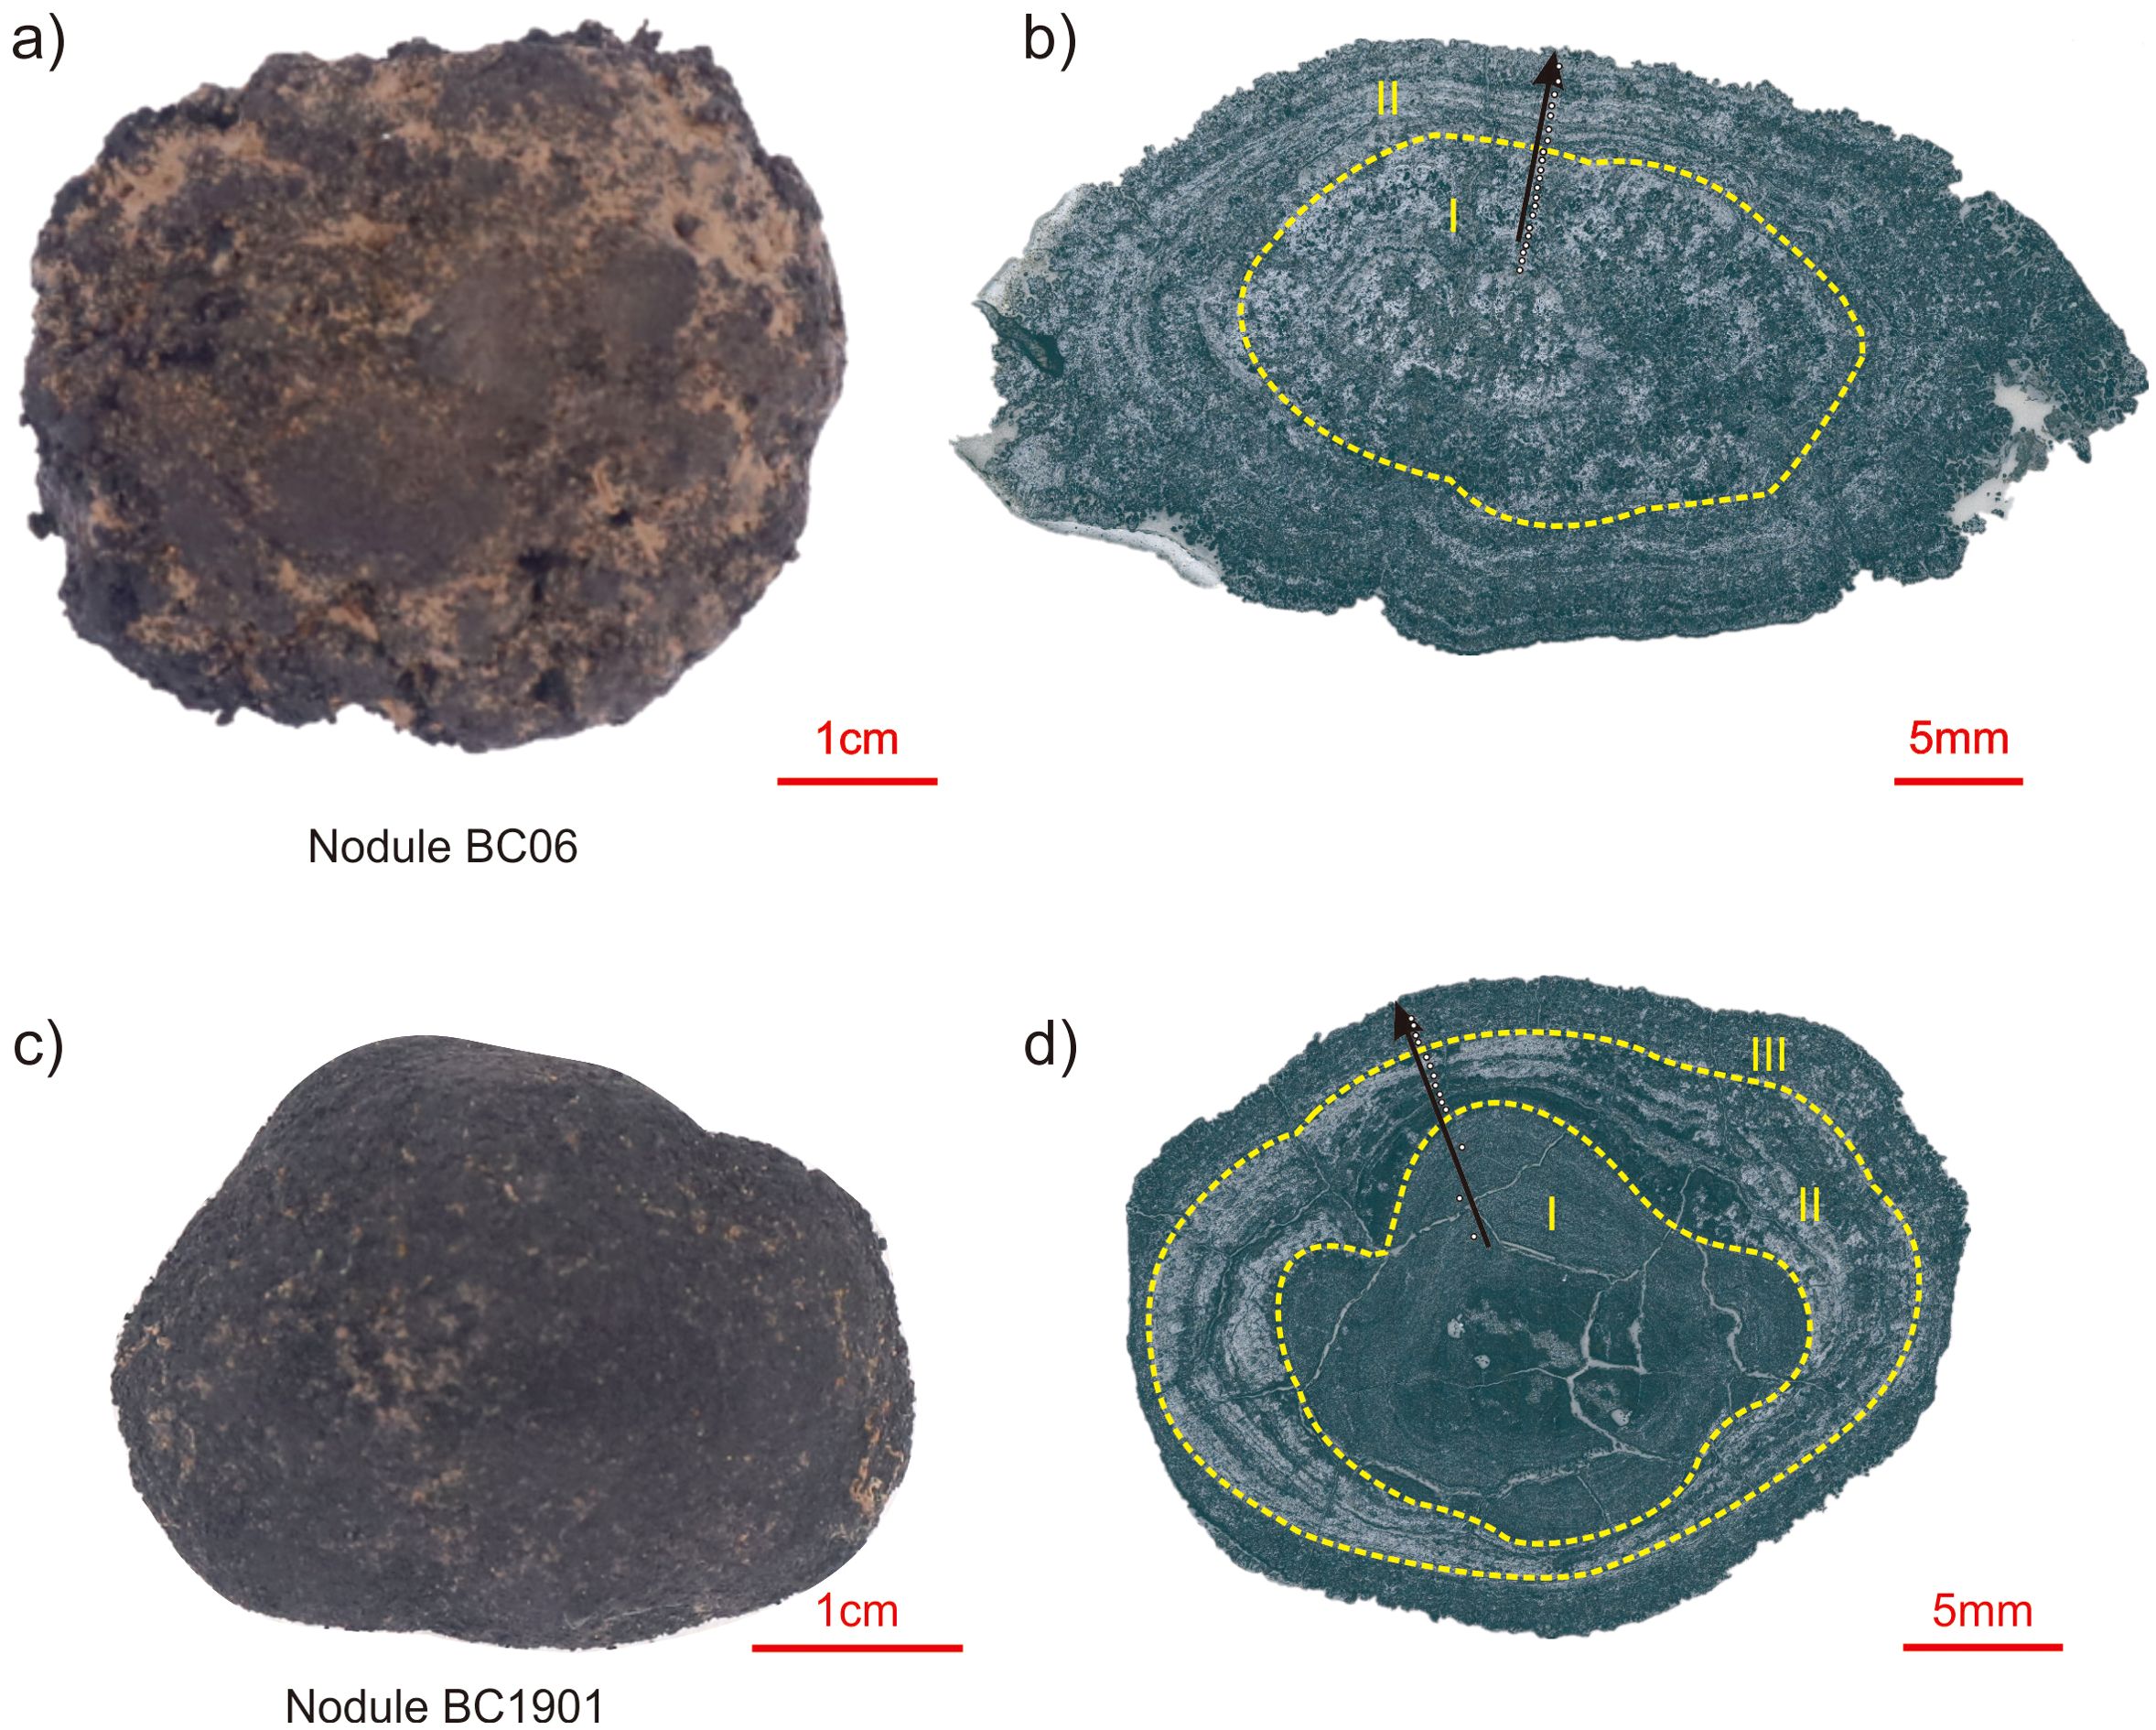
Figure 2. (A, C) Photographs of hand specimens, and (B, D) reflected light microscope images of selected samples. The yellow dotted lines denote the boundaries between the layers. The locations of the LA-ICP-MS line analyses are denoted by the black arrows. The locations of the LA-ICP-MS spot analyses are denoted by the white circles on the lines.
3 Methods
3.1 BSE images
Back-scattered electron (BSE) imaging was performed at the Key Laboratory of Submarine Geosciences, Second Institute of Oceanography, Ministry of Natural Resources, Hangzhou, China. An 8100 electron probe micro-analysis instrument(EPMA, JEOL Corporation, Japan) was utilized to conduct the analysis. The analytical conditions were an acceleration voltage of 10 kV and a probe current of 20 nA. The samples were carbon-coated and observed using the EPMA to examine their micro-textures and structures.
3.2 LA-ICP-MS spot and line analyses
In-situ major and trace element analysis of the individual microlayers within the PMNs was conducted via laser ablation-inductively coupled plasma mass spectrometry (LA-ICP-MS) at the Hefei University of Technology, Hefei, China. A 193 nm ArF excimer laser system (GeoLasPro) was coupled with an Agilent 7900 × ICP-MS instrument. For each analysis, a 50 μm spot size, an energy density of 5 J/cm2, and a repetition rate of 5 Hz were used. At the ablation site, 20 seconds of background measurement were conducted followed by 45 seconds of data acquisition. The chemical compositions of the PMNs were calibrated against fused glass chips of multiple external standards, namely, NIST SRM 610, NIST SRM 612, and BCR-2G. The raw data calculations were conducted offline using an Excel-based software (ICPMS DataCal). A total content normalization strategy without the use of internal standards was employed (Liu et al., 2008). The accuracy and reproducibility of the measurements were assessed using the United States Geological Survey standard nodule NOD-A-1 for quality control. The NOD-A-1 powder was pressed into pellets to more closely resemble the nodule samples. The external reproducibility of the analysis calculated using NOD-A-1 was better than ±10% for most of the major elements and the rare earth elements plus Y (REY), which is in good agreement with the recommended values (Supplementary Table S1). The results for a total of 35 data points on the studied samples are presented in Supplementary Table S2.
Line analysis of the PMNs via LA-ICP-MS was performed at Tuoyan Testing Technology Co., Ltd., Guangzhou, China. A 193 nm ArF Excimer laser ablation system (NWR 193) coupled with a Thermo Fisher iCAP RQ and a dual concentric injector (DCI) plasma torch integrated with a two-volume ablation cell were used. The operating conditions for the laser ablation system and the ICP-MS instrument were as follows: a beam size of 20 μm, an energy density of 4 J/cm2, and a repetition rate of 20 Hz. The laser scan speed was 5 μm/s. Line analysis was performed on selected areas of the PMNs, and these areas covered the micro-layers from the core to the rim (Figure 2). The raw data were calibrated using the Iolite software following the methods of Paton et al. (2011) and Zhu et al. (2017). All of the element concentrations were converted to ppm values from Iolite to Excel and the data were saved as csv files.
3.3 Micro X-ray fluorescence mapping
Major element mapping was conducted using a Bruker M4 plus Tornado micro-X-ray fluorescence (XRF) energy dispersive spectrometer (μ-XRF) at the Tuoyan Testing Technology Co., Ltd., Guangzhou, China. The instrument was equipped with a Rh X-ray tube and two XFlash silicon drift X-ray detectors. A single polished thin section was mapped to obtain the element abundances and phase proportions. The analytical parameters were 50 kV, 300 μA, a spacing of ~20 μm, and a dwell time of 5 ms. After the test was completed, the M4 Tornado V1.6.614.0 software was used to calibrate the raw data, resolve the spectral peaks, and export the element maps.
3.4 X-ray diffraction analysis
The mineralogical compositions of the subsamples were analyzed using a Rigaku SmartLab diffractometer at Westlake University. The X-ray diffraction (XRD) was conducted using Cu-Kα generated at 45 kV and 100 mA. Powder subsamples were scanned from 0° to 80° 2θ at a rate of 2°/min and a step size of 0.03°. The results were analyzed using the Jade 6.5 software. The mineral compositions were determined by comparing the test results with the Crystallography Open Database (COD). Todorokite (or buserite II) and buserite I have peaks at ~10 Å. The peak of unstable buserite I shifts to 7 Å birnessite upon heating to 105°C for 24 hours. Therefore, a heating experiment was conducted to distinguish between the different types of 10 Å manganates (Manceau et al., 2014; Wegorzewski et al., 2015; Reykhard and Shulga, 2019).
4 Results
4.1 Structure
As shown in Figures 2 and 3, both of the studied PMNs exhibited relatively symmetrical structures. The layers grew concentrically around a single nucleus. However, the internal structures of the PMNs were observed to differ under the optical microscope and the electron microscope. The BSE images revealed that the internal structures of the PMNs consisted of areas with medium to high brightness and dark gray regions. The dark/light areas exhibited a variety of different textures, i.e., laminated, dendritic, massive, and detrital (Figure 3). Various textures were present within an individual nodule, and their extents varied among the different PMNs. Nodule BC06 contained two layers, and Nodule BC1901 contained three layers. Specifically, in Nodule BC06, the inner part (Layer I) exhibited a detritic texture, which was characterized by rounded, bulbous, discontinuous layers with pore spaces between circular growths. This texture was unique to Nodule BC06 from the eastern CCZ (Figures 3A, B). The outer part (Layer II) exhibited a highly porous texture and apparently dendritic features (Figures 3C, D). In contrast, Nodule BC1901 exhibited three types of textures, i.e., massive, dendritic, and laminated. The inner part (Layer I) of the nodule exhibited a massive texture with some detrital minerals (Figure 3E). The middle part (Layer II) exhibited a laminated morphology of alternating dark/light layers of the similar thickness (Figure 3F). The outer part (Layer III) predominantly exhibited dendritic textures and was less porous (Figures 3G, H). The manganese oxide minerals exhibited a finely layered, coliform structure with a porous texture (i.e., stromatolitic). Overall, the inner structure of Nodule BC06 was more porous than that of Nodule BC1901.
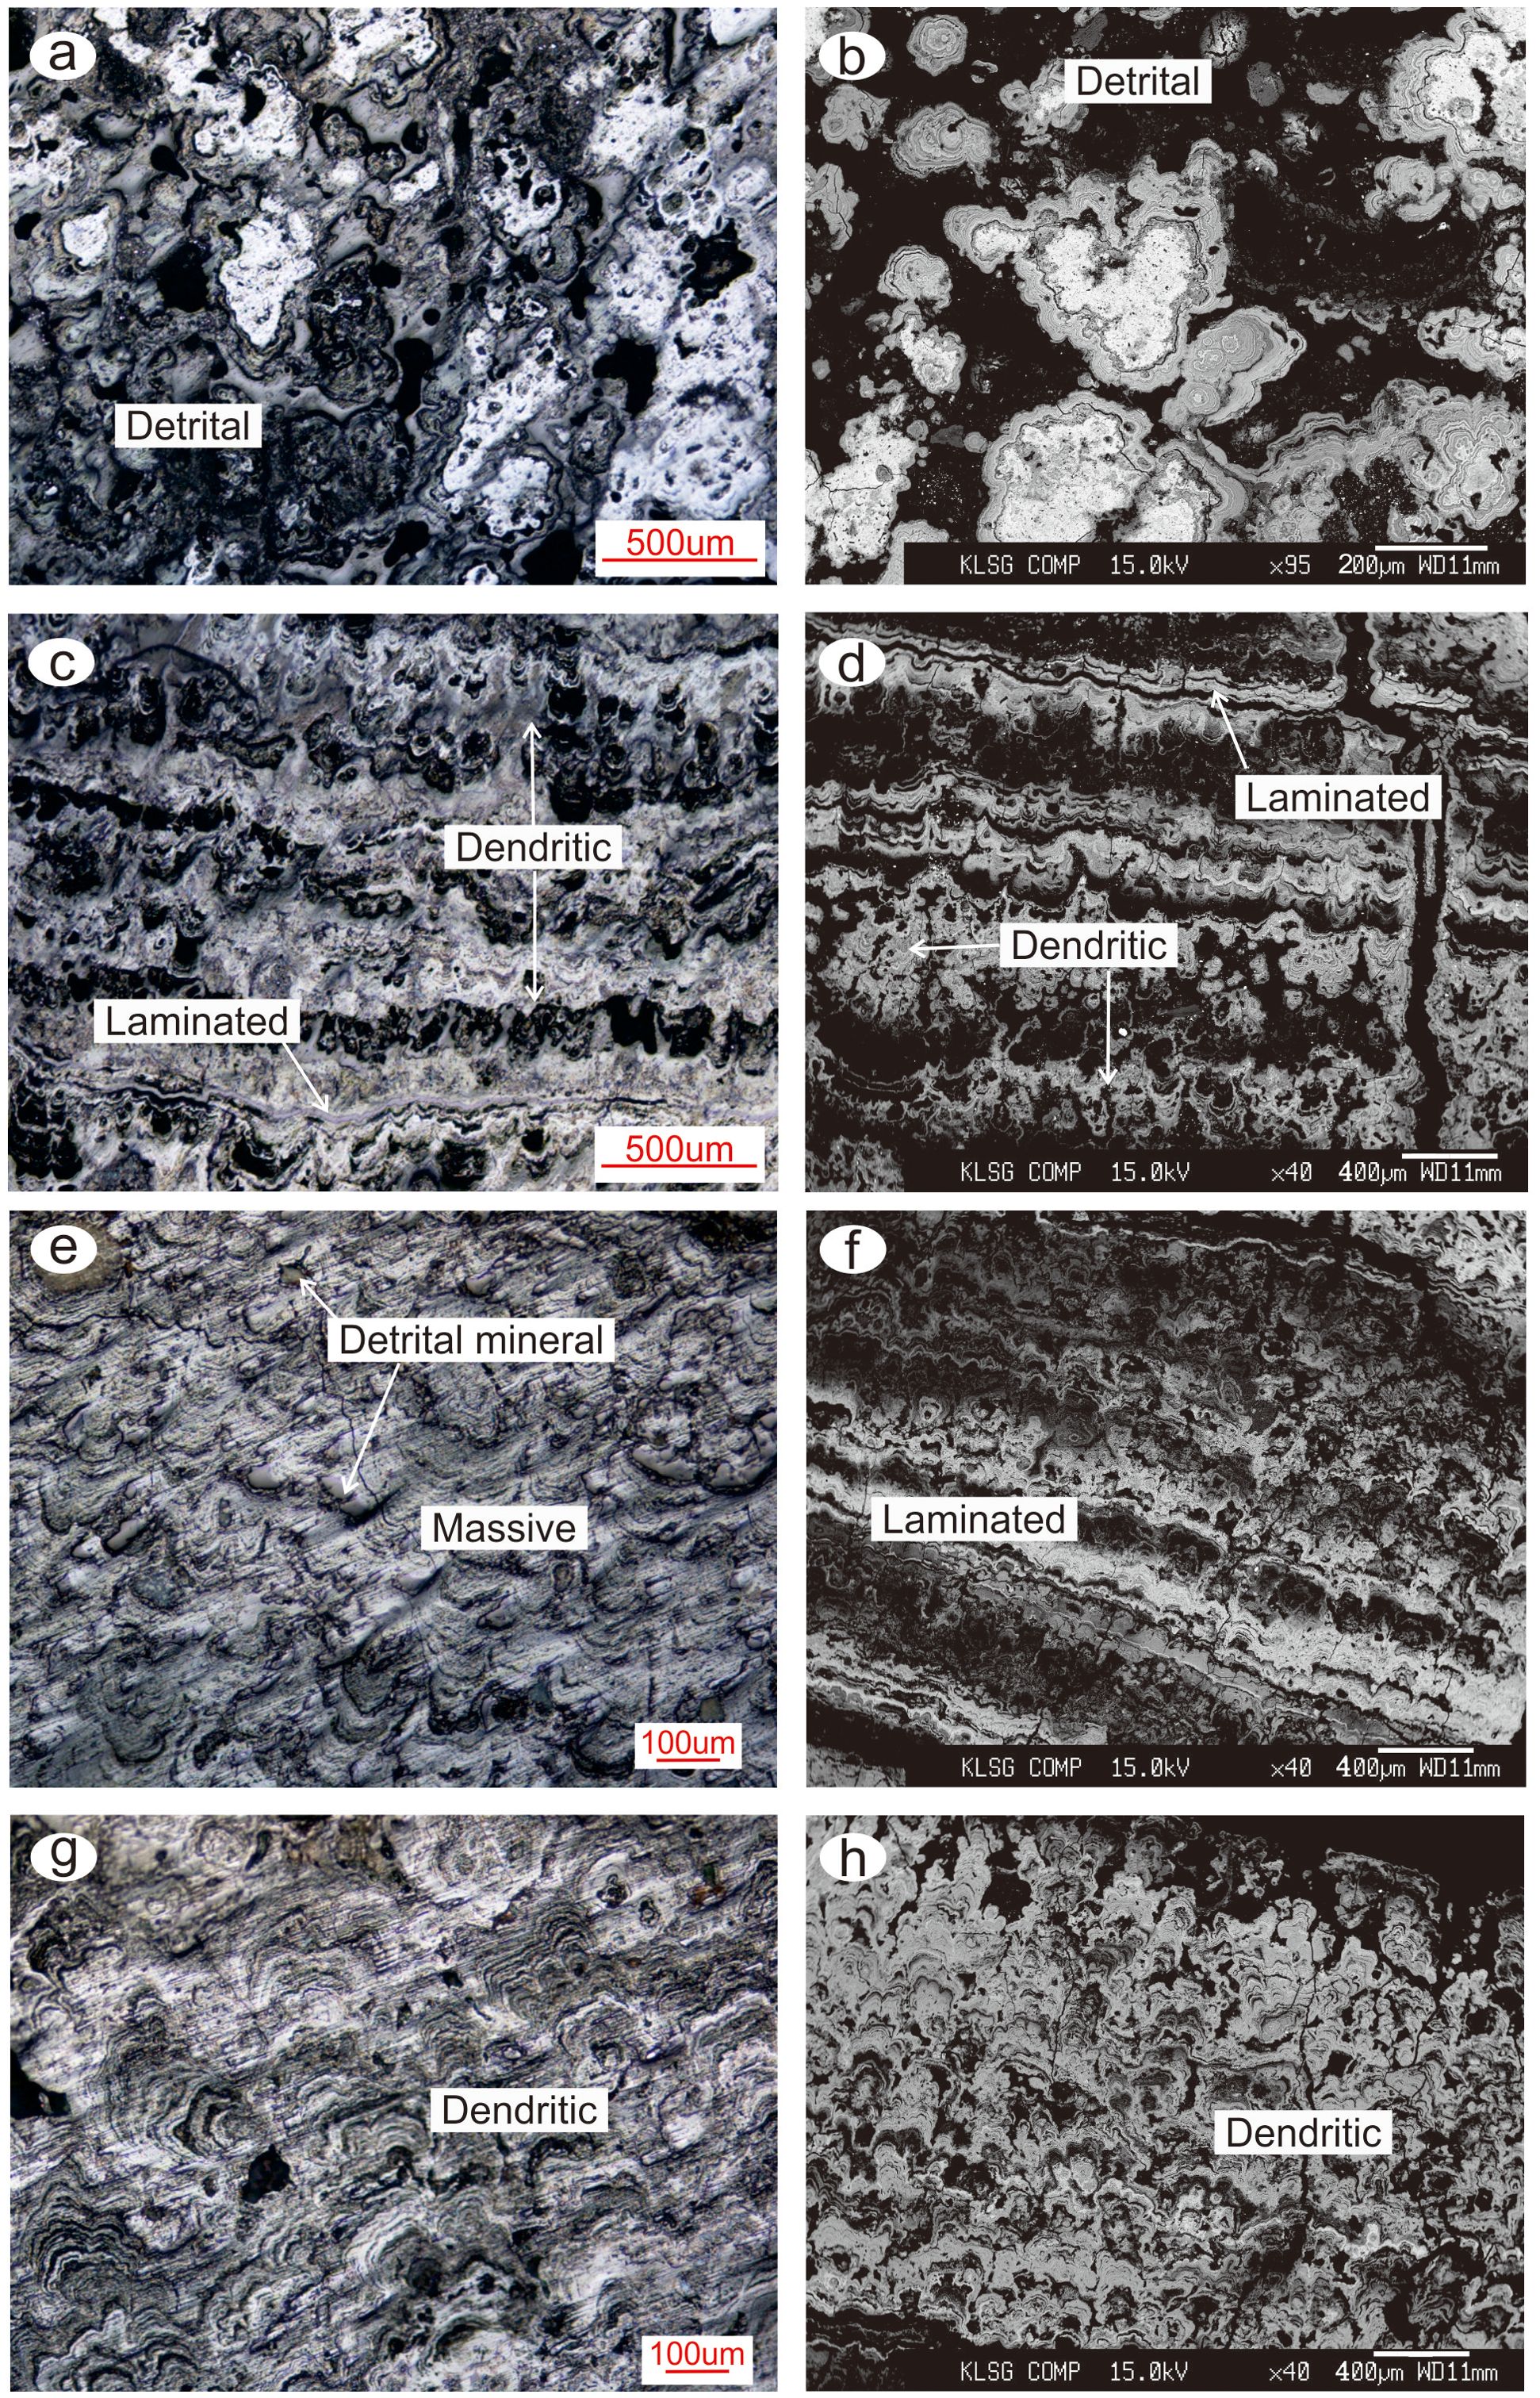
Figure 3. Microphotographs showing the growth textures of the polymetallic nodules analyzed in this study. (A, B) Layer I and (C, D) Layer II of Nodule BC06; (E) Layer I and (F) Layer II of Nodule BC1901; and (G, H) Layer III of Nodule BC1901. The left column contains micro-photographs under reflected light. The right column contains backscattered electron (BSE) images of the two nodules.
4.2 Element mapping
μ-XRF maps of the PMNs’ cross-sections are displayed in Figures 4 and 5, which show the qualitative distributions of the major elements (including Fe, Mn, Cu, Ni, and Co) in the nodules. In both PMNs, Mn and Fe are negatively correlated. The distributions of Ni, Cu, and Mn are generally similar and opposite to that of Fe. The current μ-XRF results show that Mn is considerably more abundant than Fe in the overall region of Nodule BC06, except for the nuclei and some very thin Fe-rich microlayers in Layer II. Compared with Layer I, Layer II of Nodule BC06 has lower Cu and Ni contents and higher amounts of Fe (Figure 4). For Nodule BC1901, Fe is considerably more abundant than Mn in the overall region of Nodule BC1901. The areas with higher Mn, Ni, and Cu contents are mostly located in the middle of the nodule (Layer II) compared to the outer and inner parts. The inner and outer parts contain larger amounts of Fe (Figure 5). Among all of the microlayers in both PMNs, Co is predominantly enriched in some of the thin Fe-rich layers and the nucleus.
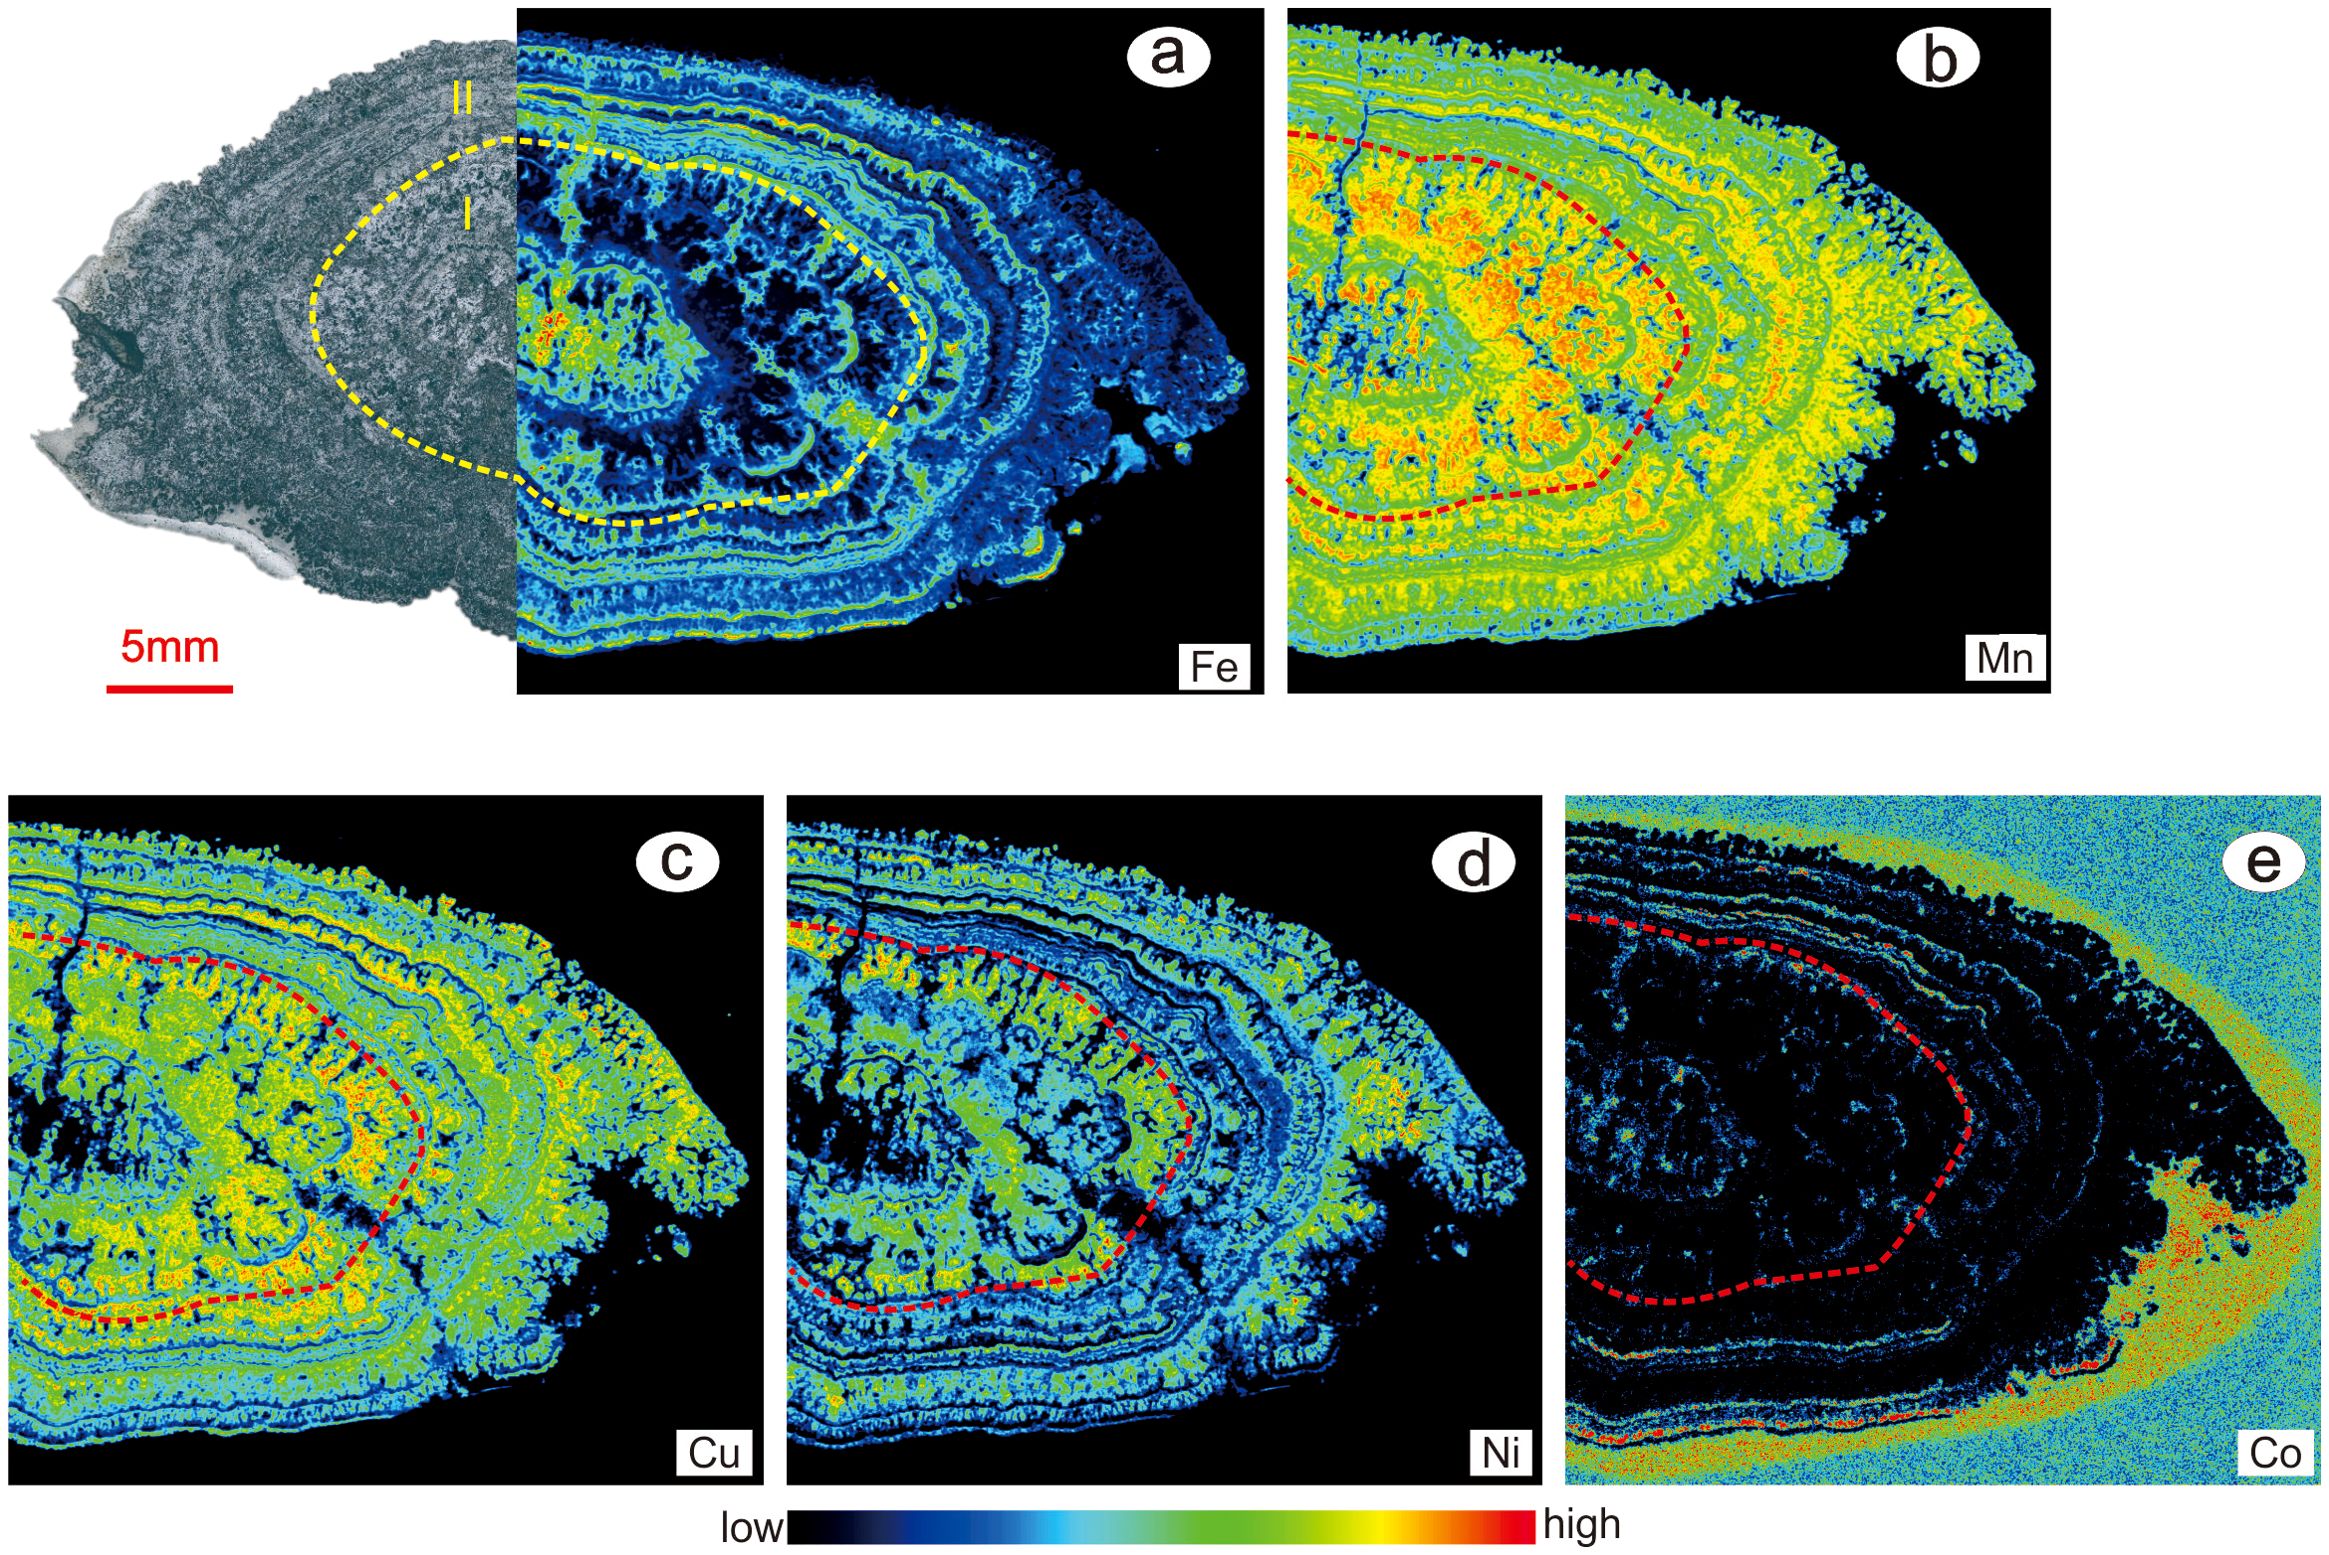
Figure 4. μ-XRF map images of the thin section of Nodule BC06showing the element distributions: (A) Fe; (B) Mn; (C) Cu; (D) Ni; and (E) Co. The microphotograph under reflected light in a) is the same as that in Figure 2B.
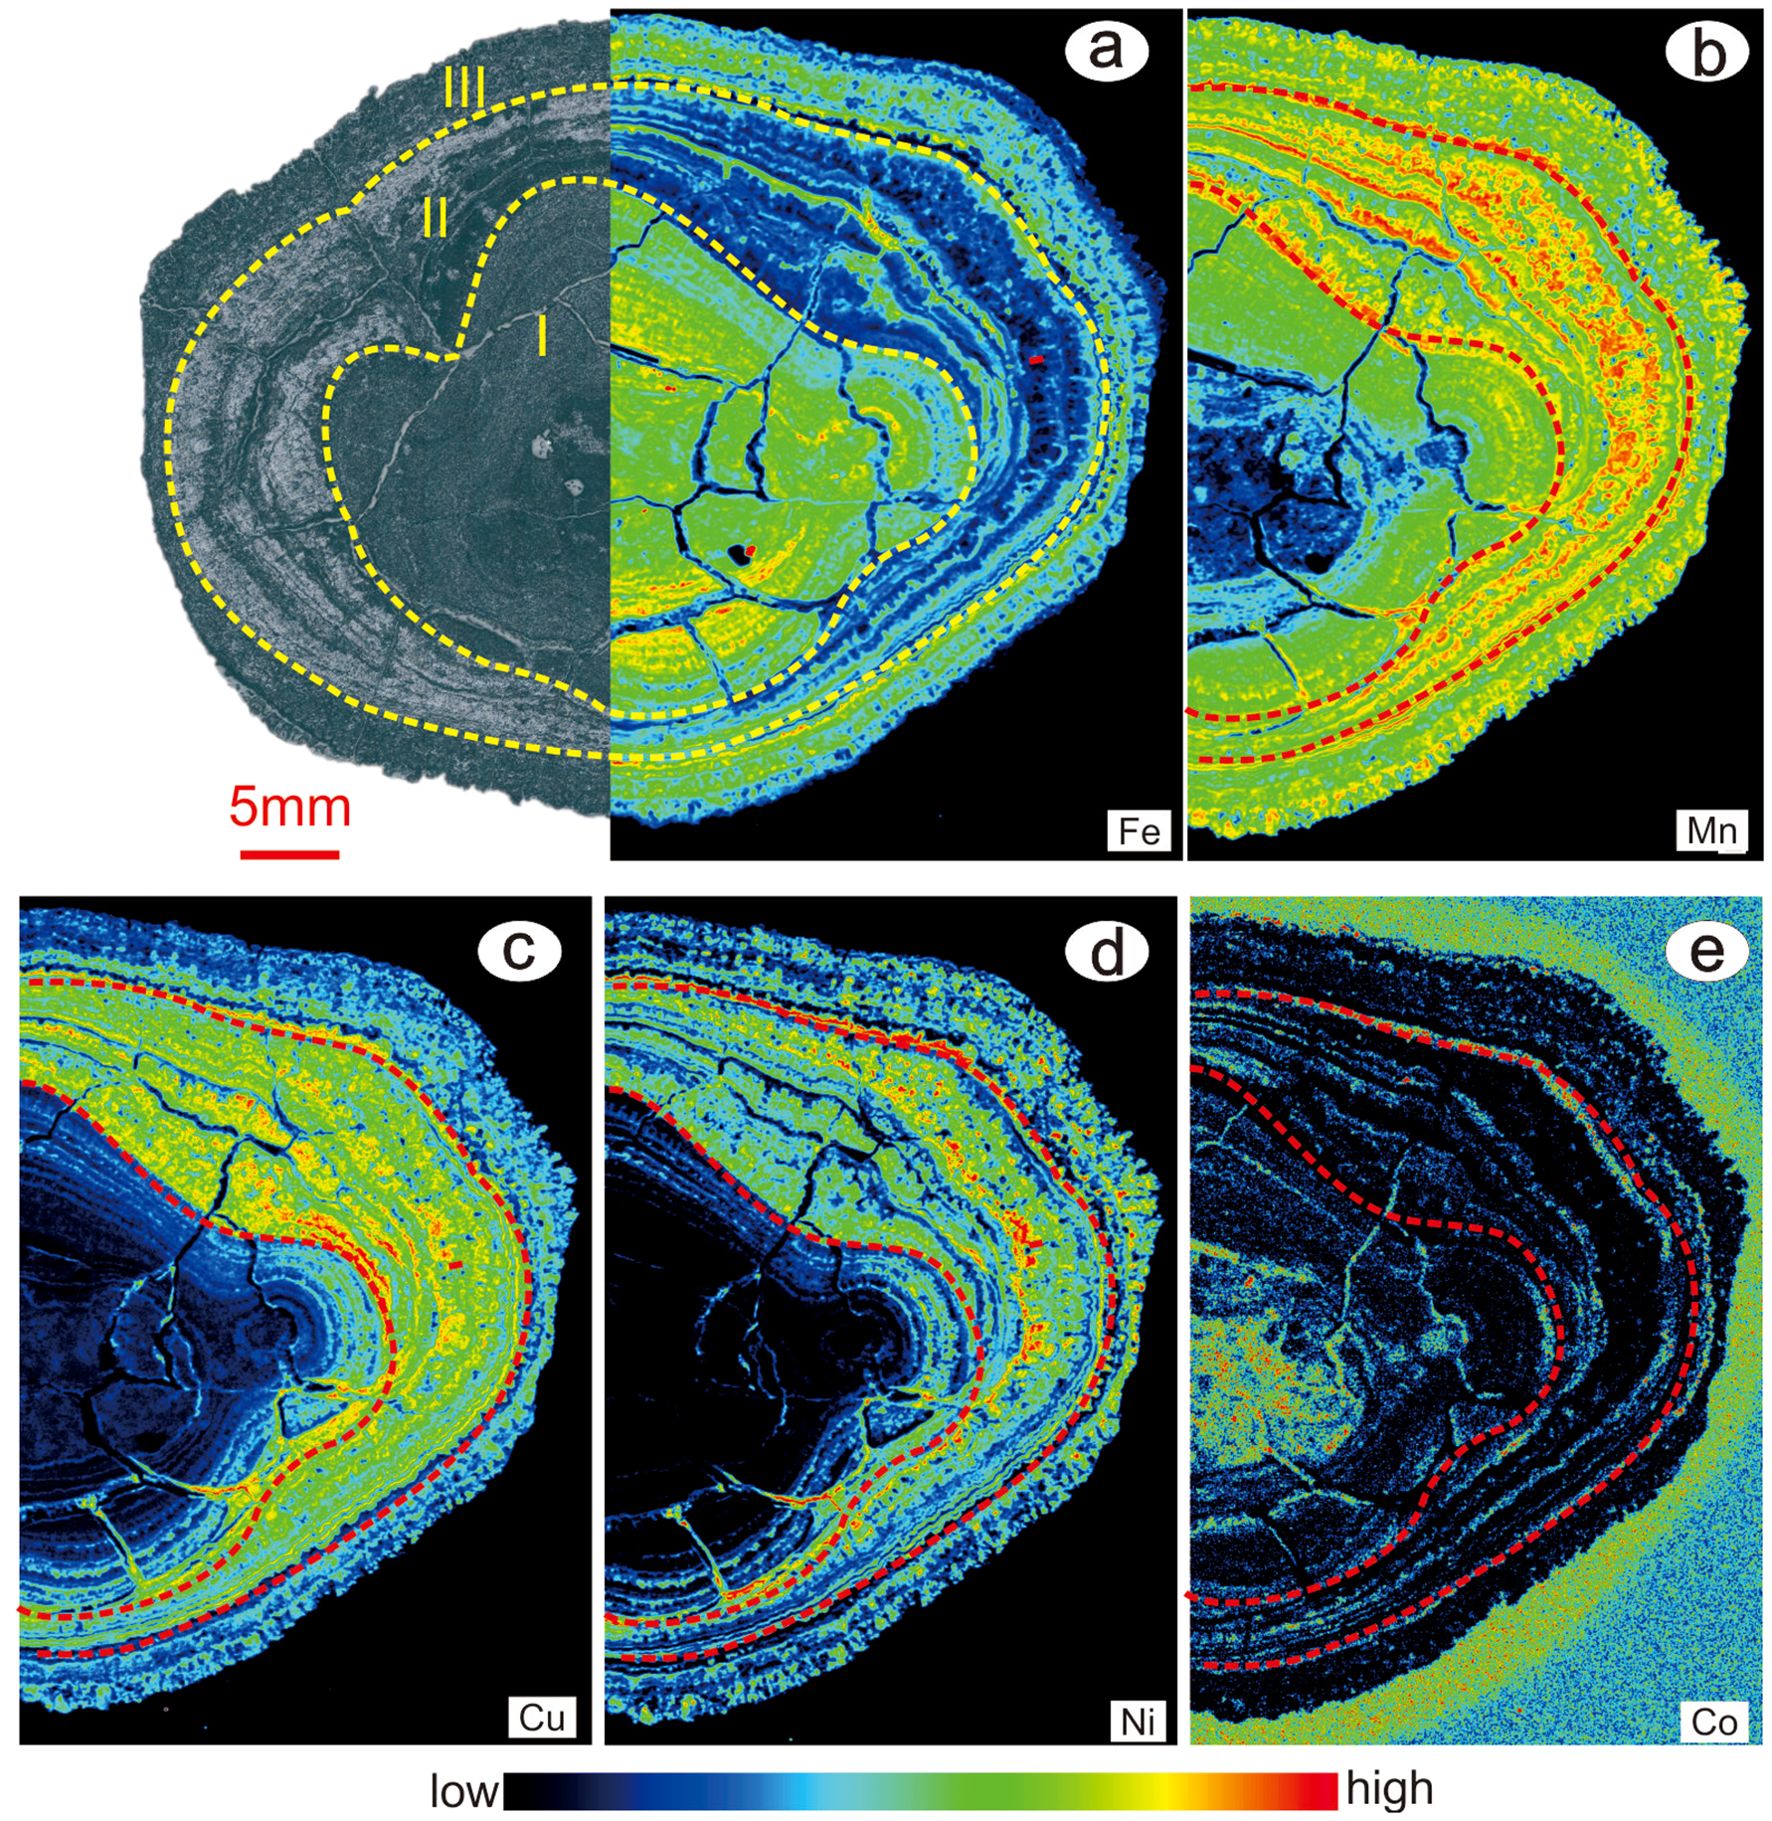
Figure 5. μ-XRF map images of the thin section of Nodule BC1901showing elemental distributions: (A) Fe; (B) Mn; (C) Cu; (D) Ni; and (E) Co. The microphotograph under reflected light in (A) is the same as that in Figure 2D.
4.3 Individual layers
Quantitative analysis was conducted via LA-ICP-MS. The results are presented in Supplementary Table S1. Parts of the PMNs have relatively high Mn contents (up to 35.97 wt.%), with corresponding Cu and Ni contents of up to 2.52 wt.% and 2.87 wt.%, respectively. The Mn-rich layers also tend to have relatively low Fe and Co contents (as low as 0.74 wt.% and 0.01 wt.%, respectively) and high Mn/Fe ratios (up to 44.79). Compared with Nodule BC06 (Fe = 3.84 wt.%, Co =0.17 wt.%), Nodule BC1901 from the western CCZ tends to contain layers with higher Fe and Co contents (8.40 wt.% and 0.19 wt.% on average, respectively). Moreover, these layers have lower Cu and Ni contents (average values of 1.15 wt.% and 1.13 wt.%) compared to those in Nodule BC1901 (Figures 6A–C). The REY contents of the individual layers are also highly variable, with ΣREY values of ~211 μg/g to ~1448 μg/g. On Post-Archean Australian Shale (PAAS) normalized REY plots (Figure 7), the PMNs from both sites exhibit negative Y anomalies. Nodule BC06 from the eastern CCZ has lower δCe values (0.38–1.70) and YN/HoN ratios (0.41–0.74) compared to those of Nodule BC1901 from the western CCZ (δCe = 1.07–1.92; YN/HoN = 0.59–0.84) (Figures 6, 7). The PMNs from both stations exhibit weak positive Eu anomalies, with δEu values of 1.08–1.34. Generally, the low ΣREY contents are associated with small positive or even negative Ce anomalies (as low as ~0.39). These layers are more abundant in Nodule BC06 from the eastern CCZ than in Nodule BC1901. Nodule BC06 has a larger number of layers with low ΣREY contents (average of 462 μg/g), negative Ce anomalies (average of 1.03), and generally lower LREE contents (average of 356 μg/g) compared to Nodule BC1901 (Figure 7). However, both PMNs exhibit light rare earth element (LREE) enrichment (by a factor of 3–4) compared to the heavy rare earth elements (HREEs) (Figure 6F).
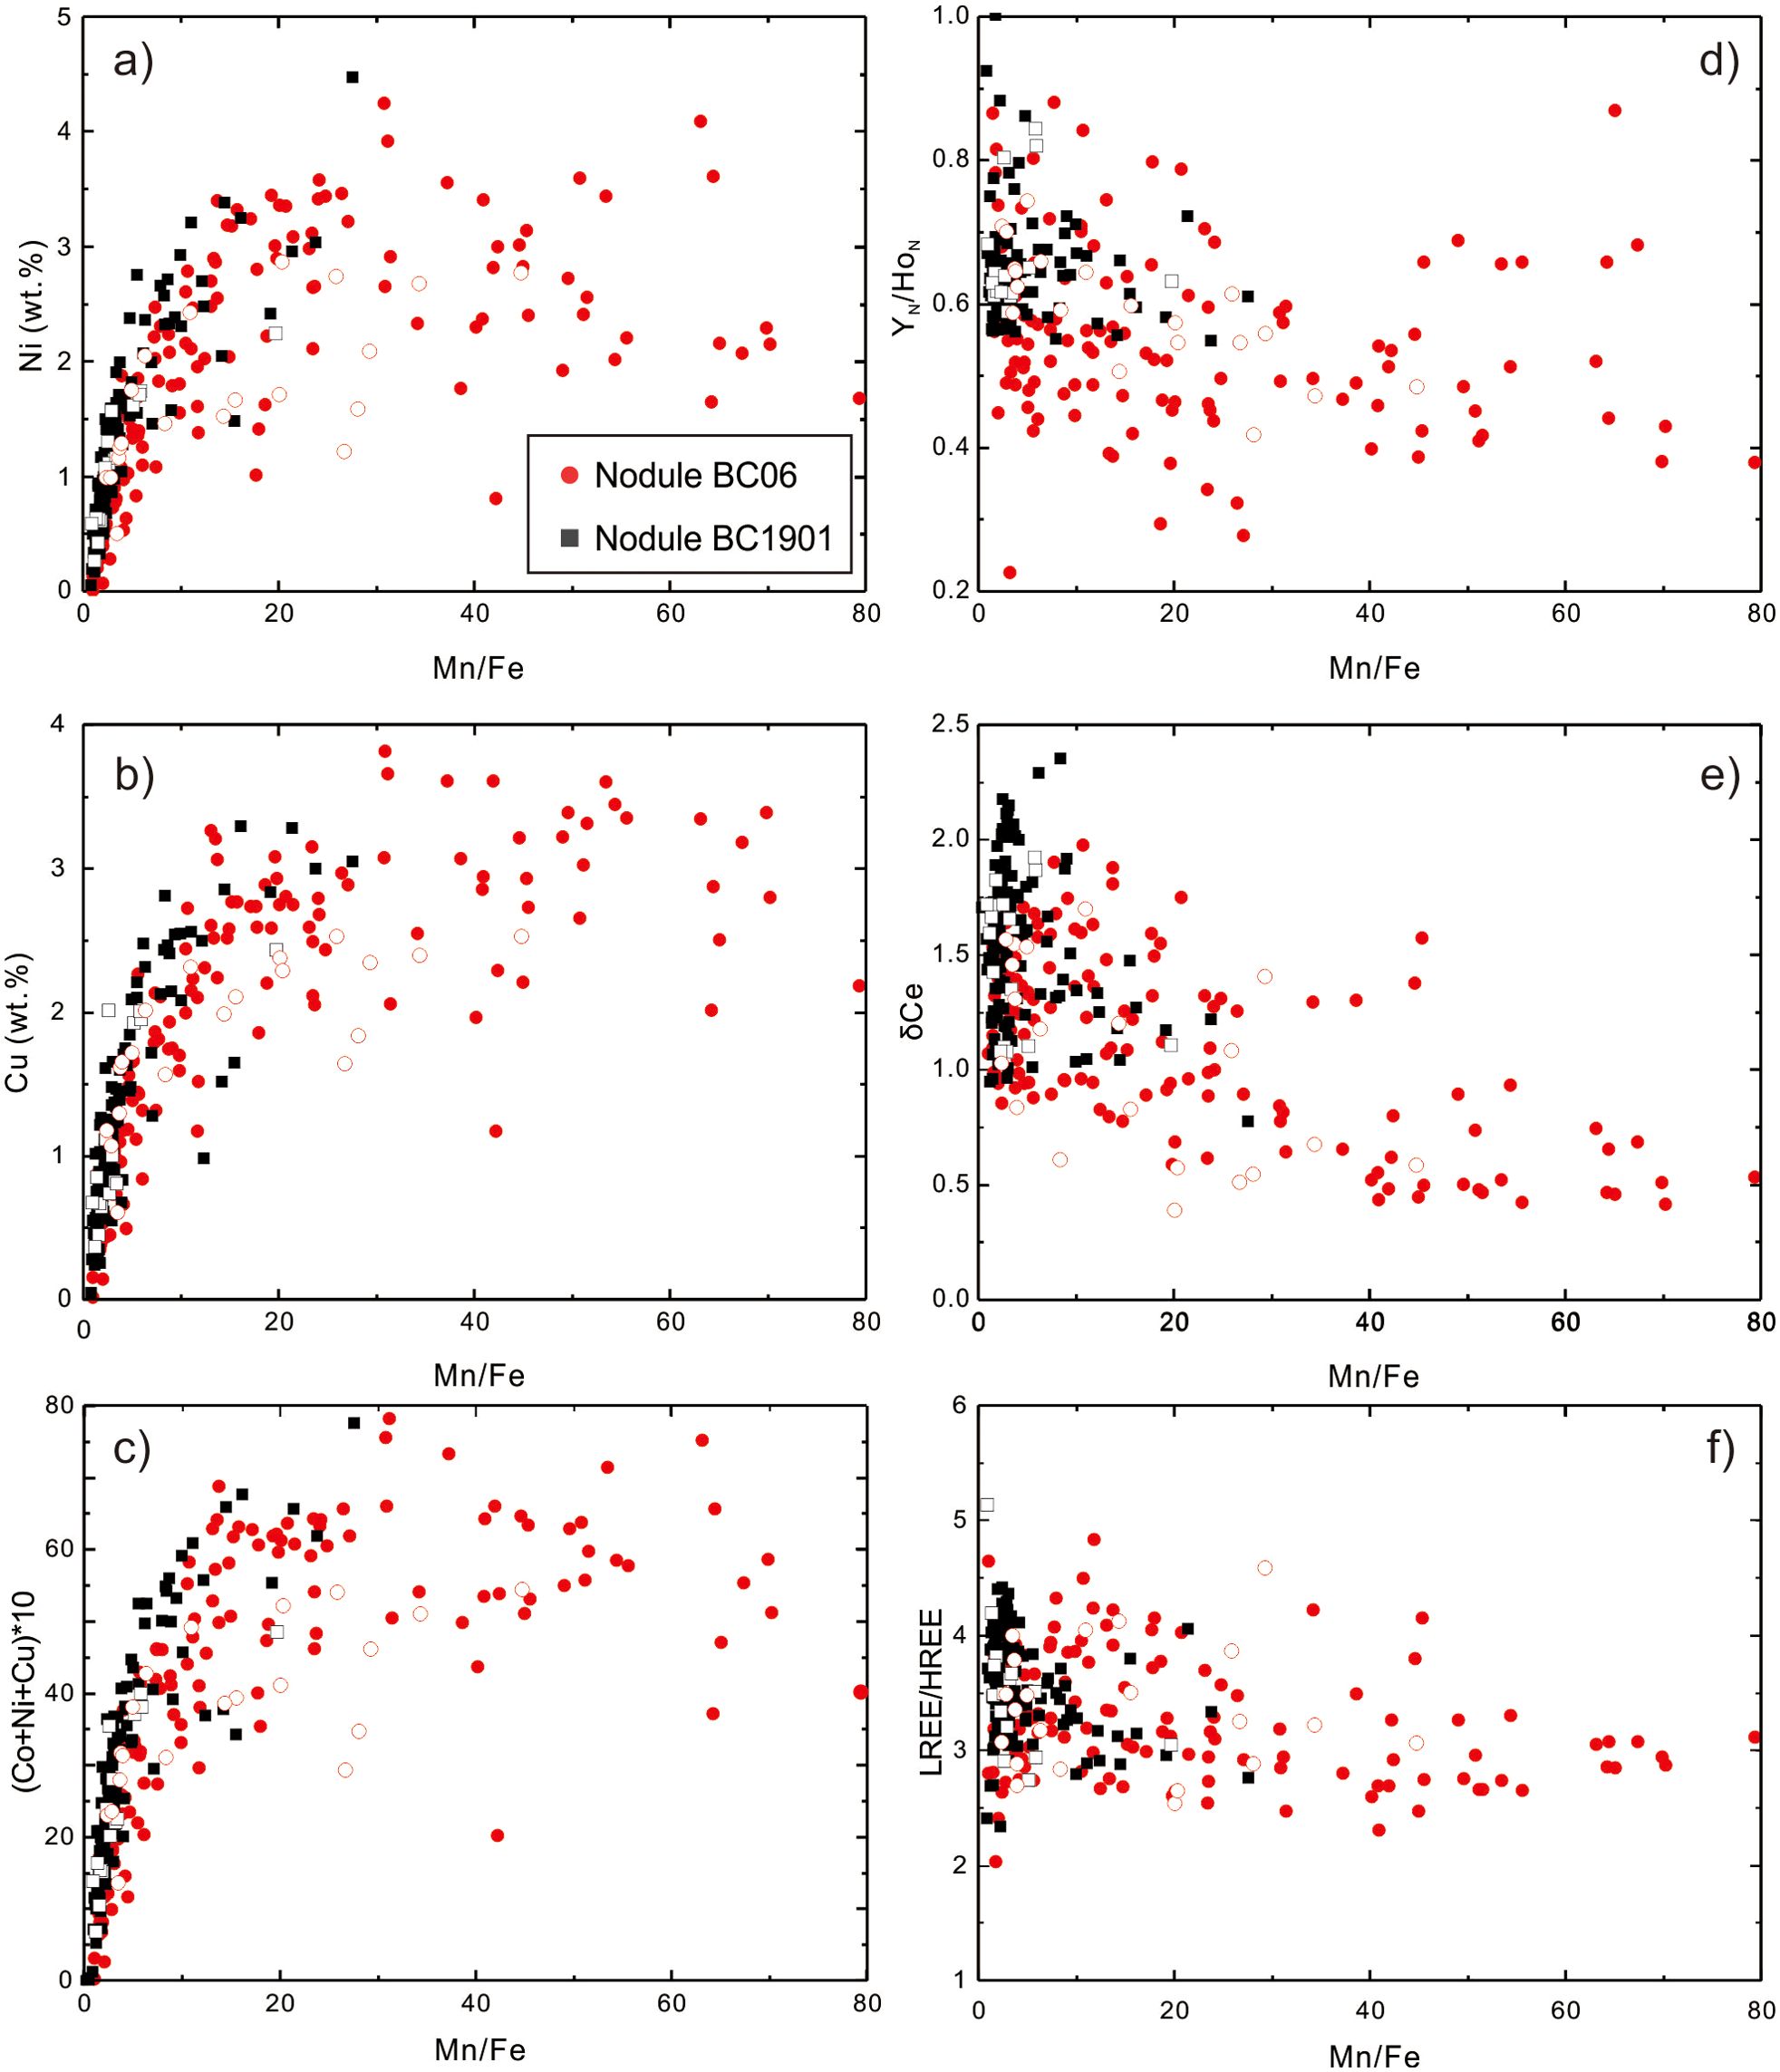
Figure 6. Plots of Mn/Fe vs. (A) Ni; (B) Cu; (C) (Co+Ni+Cu)×10; (D) YN/HoN; (E) δCe; and (F) LREE/HREE for Nodule BC06 and Nodule BC1901. . All of the elements (Ce, La, Pr, Y and Ho) are normalized to Post-Archean Average Shale (PAAS). The values for PAAS are from McLennan (1989). The open and solid symbols denote data obtained via LA-ICP-MS spot and line analyses.
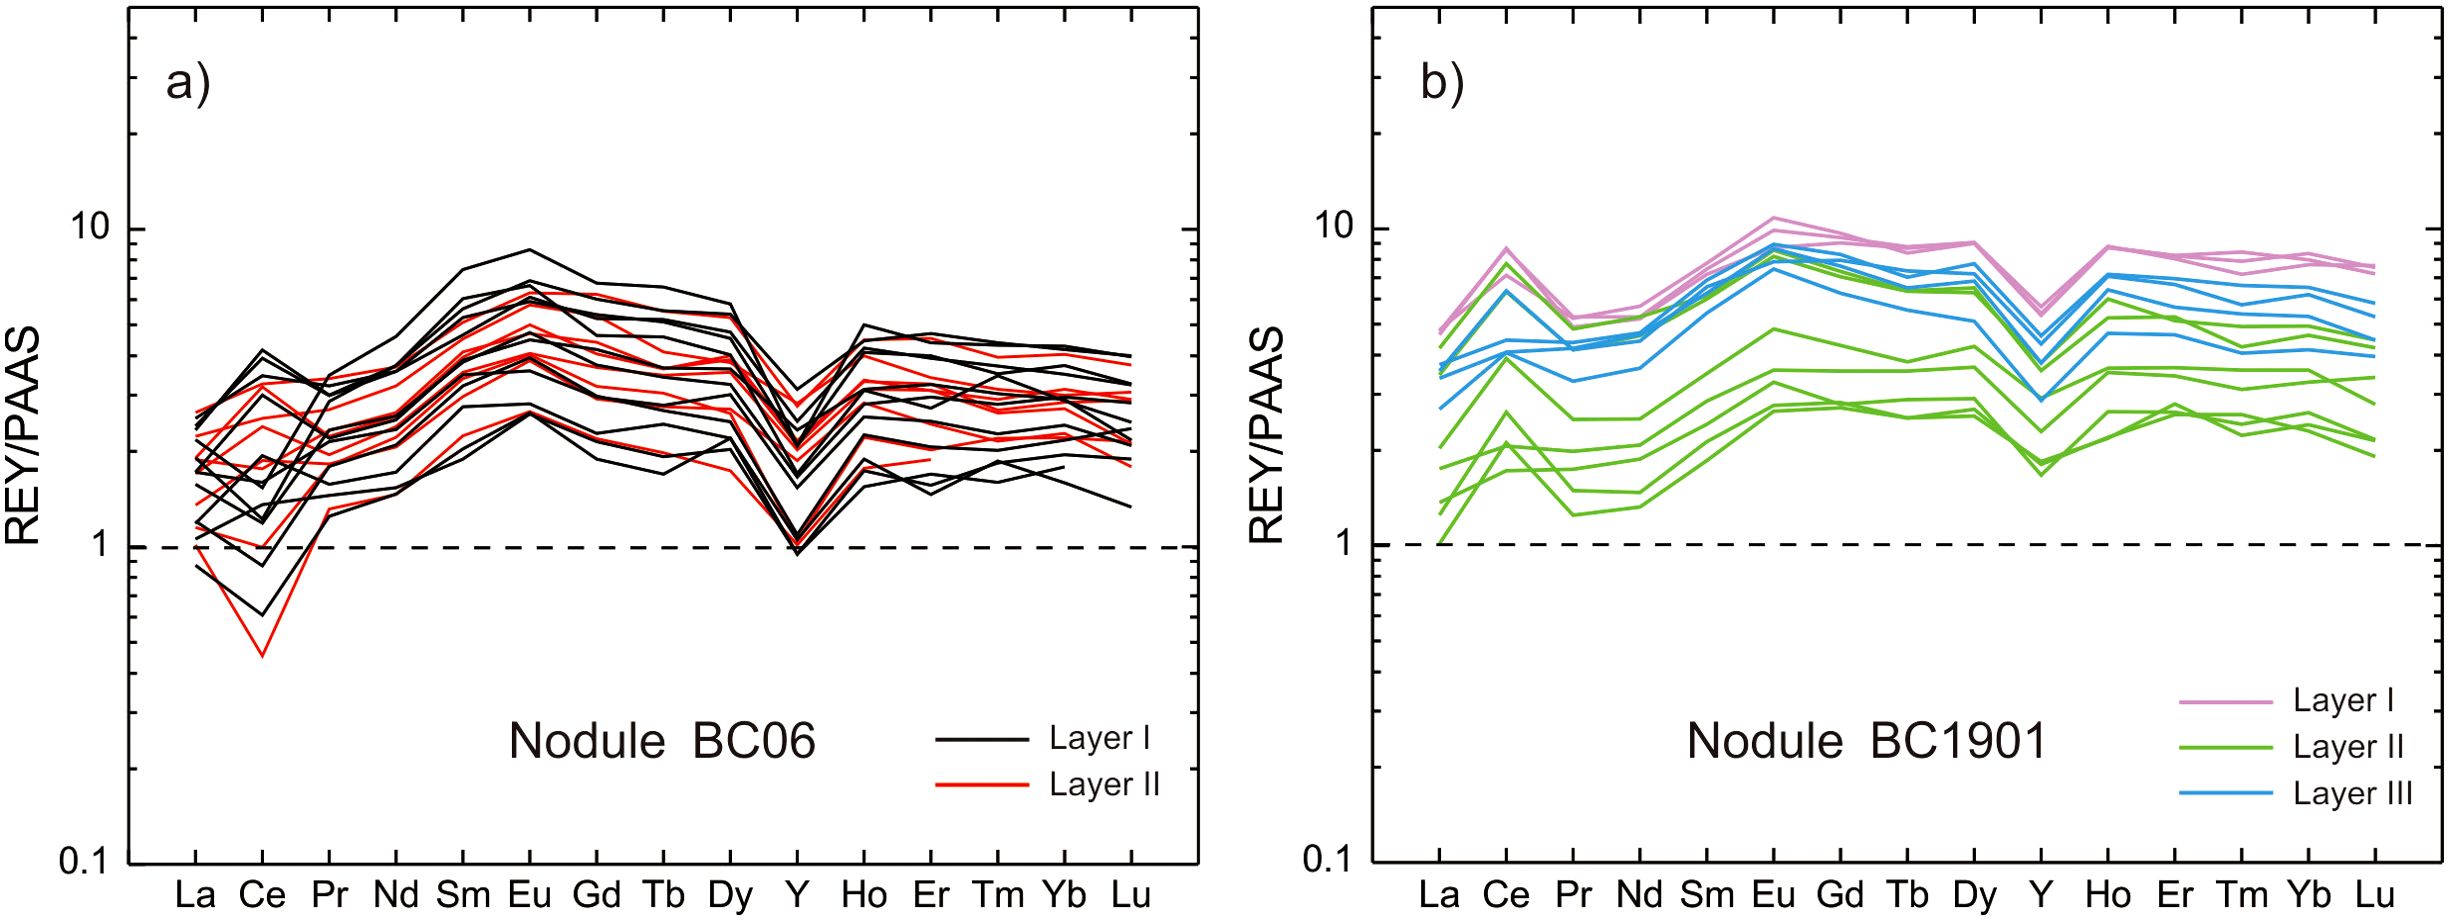
Figure 7. PAAS-normalized REY patterns of ferromanganese nodules. (A) REY patterns of Nodule BC06 from the eastern CCZ; and (B) REY patterns of Nodule BC1901 from the western CCZ.
Vertical profiles of the Mn/Fe and Co/(Cu+Ni) ratios of the studied PMNs are shown in Supplementary Figure S1. The results are consistent with the element mapping data The Mn-rich layer is located close to the nuclei of Nodule BC06, whereas the middle part of Nodule BC1901 contains a greater proportion of Mn-rich layers than the outer and inner parts. Overall, the Mn/Fe ratio of Nodule BC06 is much higher than that of Nodule BC1901 (Figure 8A). With respect to the Co/(Cu+Ni) ratios, Nodule BC06 has a lower Co/(Cu+Ni) ratio than Nodule BC1901 (Figure 8B). Regarding the individual layers, the median values of the layers generally exhibit a trend that is opposite to that of the Mn/Fe ratio. In Nodule BC06, these values increase from Layer I to Layer II, while in Nodule BC1901 they decrease from Layer I to Layer II and then increase from Layer II to Layer III. In both samples, the Ba content consistently decreases from the core to the rim (Figure 8C).
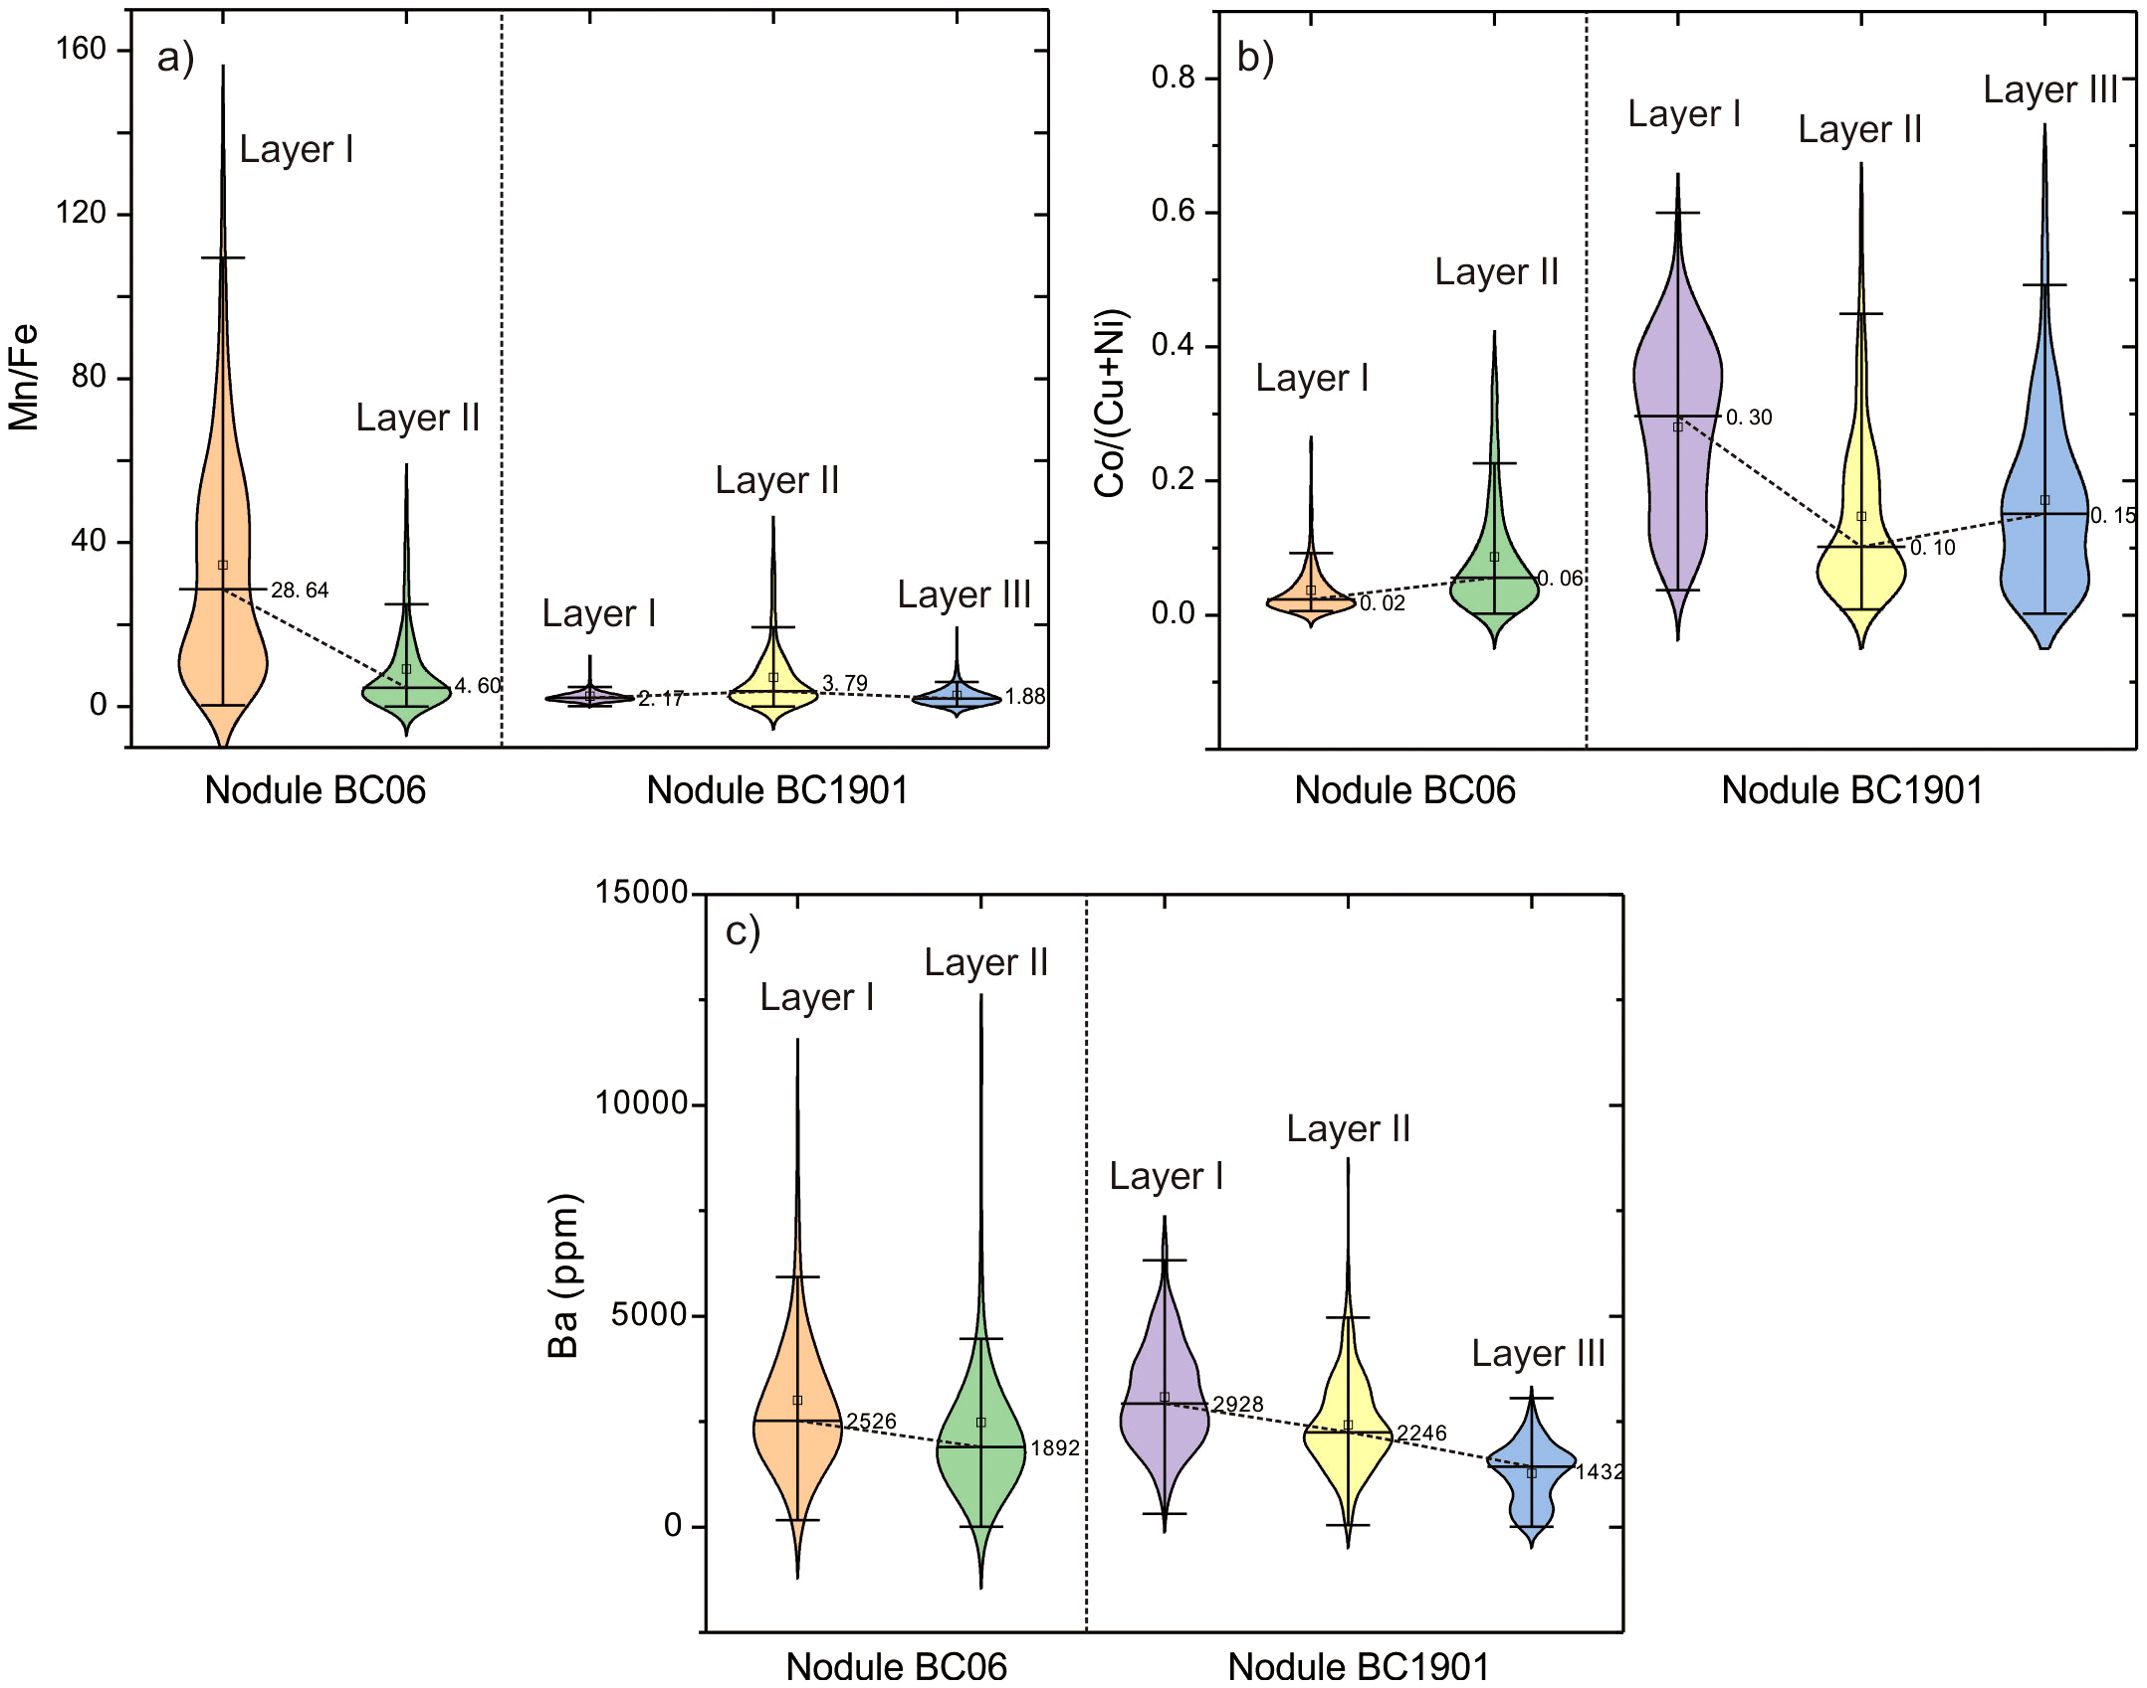
Figure 8. Violin plots of the (A) Mn/Fe ratio; (B) Co/(Cu+Ni) ratio, and (C) Ba content for the different layers of the studied nodules. The lower and upper lines on the violins denote the lower quartile and upper quartile values, respectively. The open squares denote the median values for each layer. The numbers to the right of the violins are the median values.
4.4 XRD patterns
Figure 9 presents the XRD patterns for powdered samples of various layers within Nodules BC06 and BC1901. The XRD patterns contain prominent diffraction peaks at approximately 10 Å (attributed to the 001 reflection) and 5 Å (the 002 reflection of the same mineral). Additionally, there are weaker peaks at around 7 Å, indicative of a different mineral. Notably, the 7 Å reflection is nearly undetectable in Layer I of Nodule BC06. Comparative analysis shows that the 10 Å peaks are more intense and distinct in Nodule BC06 than in Nodule BC1901, and the 10 Å peak is not present in Layer I of Nodule BC1901. For Nodule BC06, the ~10 Å peak is sharpest in Layer I, whereas in Nodule BC1901, it is sharpest in Layer II, indicating a well-ordered mineral structure in these layers. Conversely, Layer III in Nodule BC1901 contains a moderate peak, and Layer I had the broadest peak, indicating a less-ordered arrangement. Two hk bands at approximately 2.45 Å and 1.42 Å are also discernible in all of the samples. The other significant peaks correspond to the diffraction patterns of various minerals, including quartz and phillipsite.
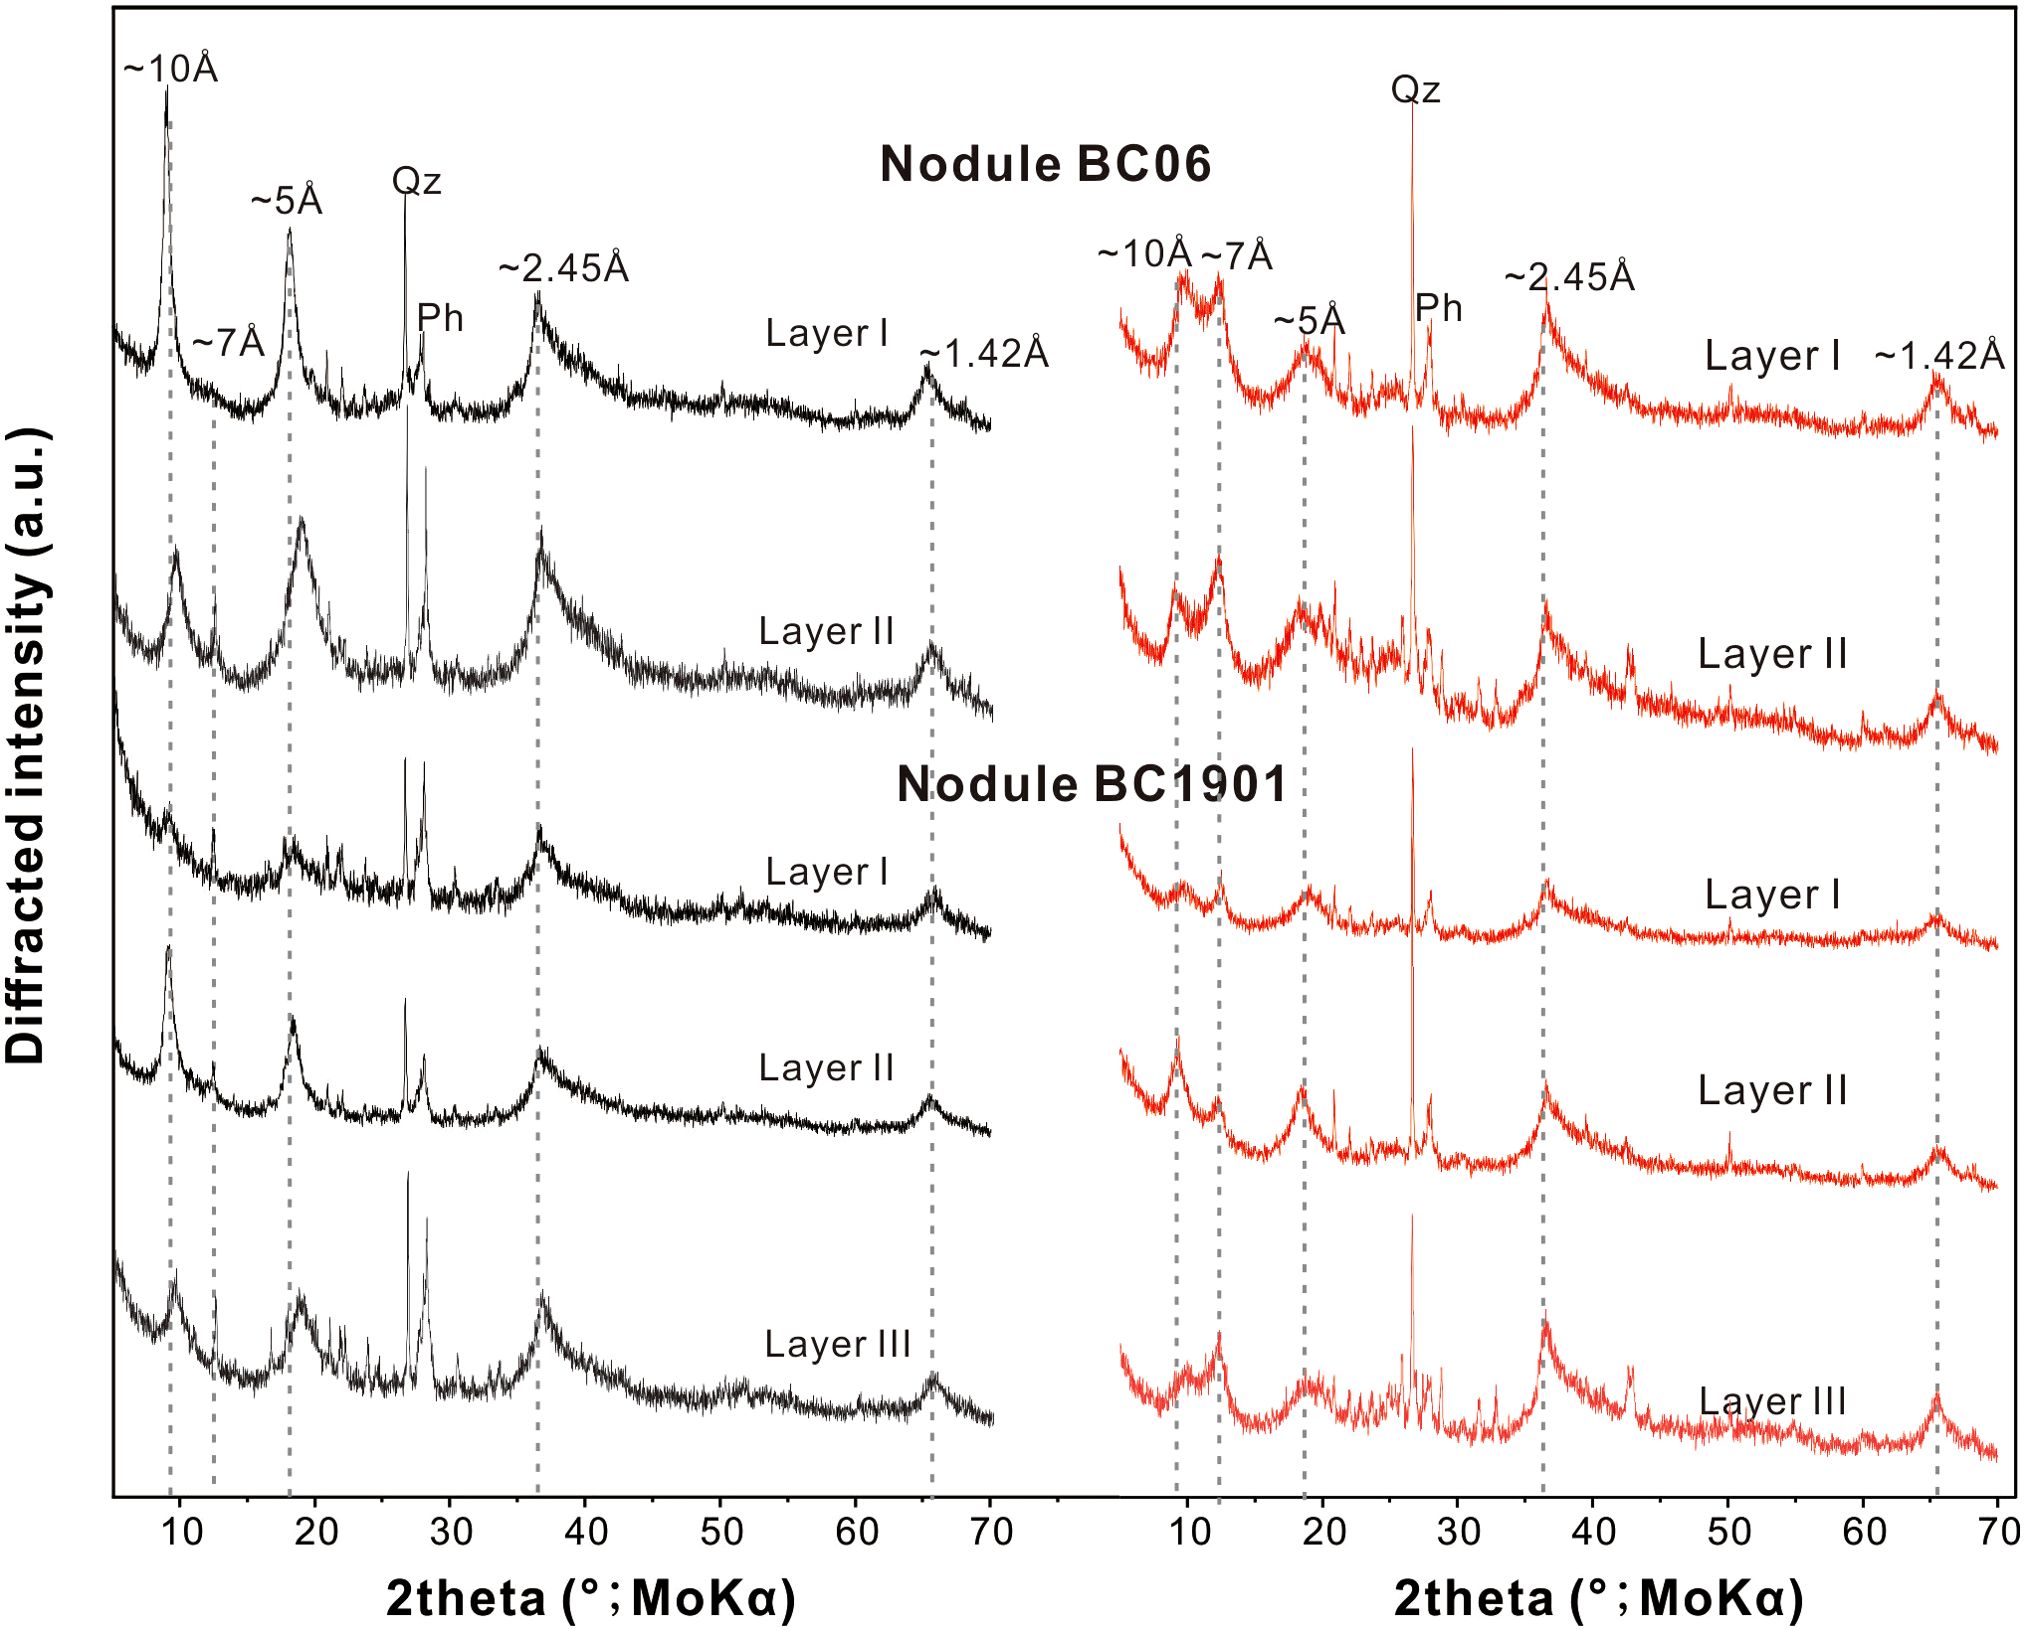
Figure 9. XRD patterns of PMNs analyzed in this study. All of the subsamples were analyzed at room temperature (black pattern) after drying at 105°C (red pattern). The peaks at ~7 Å correspond to 7 Å phyllomanganate. The reflections at ~2.45 Å and ~1.42 Å are typical of Fe-rich vernadite. The broad peaks at ~10 Å and ~5 Å at room temperature correspond to 10 Å Mn-phases (10 Å phyllomanganate/todorokite). The 10 Å and ~5 Å peaks that are still present after heating are characteristic of a stable 10 Å manganite (todorokite/buserite II) phase. The intensified peaks at ~7 Å are indicative of an unstable 10 Å –manganese phase (buserite I), which collapses upon heating at 105°C. Qz = quartz and Ph = phillipsite.
After drying the samples at 105°C, the ~10 Å peak decreased to varying extents, while the 7 Å peak intensified. Specifically, in Layers I and III of Nodule BC1901 and Layer II of Nodule BC06, the ~10 Å peak became less pronounced than the ~7 Å peak. In contrast, after heating, in Layer II of Nodule BC1901 and Layer I of Nodule BC06, the ~10 Å peak significantly decreased but remained more distinct than the ~7 Å peak. Furthermore, some reflections near ~10 Å shifted to lower angle regions (9–9.6 Å) after drying, e.g., in Layer III of Nodule BC1901.
5 Discussion
5.1 Reliability of LA-ICP-MS line-scan analysis
The LA-ICP-MS technique is a powerful tool for geochemical analysis of PMNs and has distinct advantages over traditional EPMA. Unlike EPMA, which has been the standard for major element analysis for some time, LA-ICP-MS can simultaneously acquire both major and trace element data. This capability eliminates the discrepancies that often arise between the major and trace element compositions determined using different analytical methods, especially for PMNs containing micro/nano-layers. Furthermore, LA-ICP-MS provides a more rapid and sensitive determination of the element composition, leading to significant reductions in both time and cost. Advances in this technology have significantly broadened the scope of geochemical investigations, as demonstrated by Menendez et al. (2019), who successfully utilized LA-ICP-MS to conduct simultaneous major and trace element analysis of PMNs. Additionally, the application of the Iolite software by Zhu et al. (2017) and Li et al. (2020) for data reduction has streamlined the process of converting raw line-scan and mapping data into meaningful element concentrations.
The present study further validated the reliability of LA-ICP-MS line-scan analysis. We found that the element concentration ranges obtained via line-scan analysis were in close agreement with those obtained via spot analysis, suggesting that LA-ICP-MS can effectively be used for both line and mapping compositional statistics. This provides a more comprehensive and detailed view of a nodule’s composition. The consistency of the trends of the contents of elements such as Mn, Fe, Co, Ni, Cu, and REY obtained via line-scan analysis and spot analysis (Figure 6) underscores the reliability of using LA-ICP-MS in geochemical investigations.
Although the precision and accuracy of LA-ICP-MS may be influenced by certain limitations, its ability to offer detailed element distributions across a sample’s surface is invaluable. This level of detail is crucial for attaining a nuanced understanding of the geochemical processes occurring during the formation of PMNs. Therefore, when used with careful interpretation and validation against established standards and techniques, LA-ICP-MS line-scan analysis is a robust and reliable method for geochemical analysis of Mn-PMNs.
5.2 Genesis of PMNs
Marine PMNs can be categorized into three groups based on their origin: hydrogenetic, diagenetic, and hydrothermal PMNs (Josso et al., 2017; Bau et al., 2014; Bonatti et al., 1972). These groups are generally distinguished by their different mineral compositions and geochemical compositions. The following discussion explores the genesis of the different layers of the nodules analyzed in this study. We focus on variations in their mineralogy and chemical compositions.
5.2.1 Mineralogy
Hydrogenetic PMNs, which precipitate directly from seawater, are predominantly composed of Fe-rich vernadite, a poorly crystalline form of δ-MnO2. This mineral is intricately interwoven with poorly ordered or amorphous iron oxyhydroxide (δ-FeOOH) and exists in the form of nanoparticles (Koschinsky et al., 2010). Despite their high iron contents, hydrogenetic PMNs typically lack distinct X-ray reflections for Fe-phase minerals due to the poor crystallinity or X-ray amorphous nature of iron oxides/hydroxides. For instance, for Layer I of Nodule BC1901, the XRD pattern lacks sharp reflections, displaying only weak ~7 Å and ~10 Å peaks. In combination with the elevated Fe content, this supports the identification of Fe-bearing vernadite as the primary manganese mineral, which is indicative of a predominant hydrogenetic process (Hein et al., 2013, 2016).
In contrast, diagenetic PMNs form through pore-fluid precipitation, yielding phyllomanganates such as birnessite (~7 Å) and buserite (~10 Å), as well as tectomanganates such as todorokite. Todorokite, buserite I, and II, which are characterized by a ~10 Å peak. However, buserite I is prone to transformation into birnessite after heating at 105°C for 24 hours, while buserite II, which has a high interlayer cation content, exhibits greater thermal stability. The cations in buserite II resist the structural collapse to the 7 Å spacing observed in less stable buserite I after heating (Manceau et al., 2014). Thus, heating experiments are a valuable tool for distinguishing between different 10 Å manganates. In this study, the XRD patterns of all of our samples exhibited a notable reduction in the ~10 Å peak after heating at 105°C, and the ~10 Å peak was predominantly transformed into a ~7 Å peak, suggesting that the original 10 Å phase was predominantly buserite I. The remaining ~10 Å peak was likely caused by a stable manganate phase, such as buserite II or todorokite.
Previous research has revealed that 10 Å phyllomanganates can incorporate more Ni and Cu than todorokite, which typically contains less than 2 wt% of these elements (Bodeϊ et al., 2007). Our analysis of Nodule BC06, which has high Mn/Fe ratios and Ni+Cu contents of greater than 2 wt%, suggests that the layers in this nodule are predominantly composed of buserite II, rather than todorokite. This conclusion is consistent with that of Wegorzewski et al. (2015), who suggested that unstable 10 Å phyllomanganates are the dominant Mn-phase, the stable 10 Å Mn-phase constitutes subordinate mineral components, and todorokite is absent in the central Pacific Ocean.
Unlike Fe-rich vernadite, buserite has a high crystallinity and produces clear X-ray reflections. In Nodule BC06, Layer I exhibits a more pronounced ~10 Å peak compared to Layer II, indicating a higher concentration of buserite and the significant influence of diagenetic processes. Similarly, Layer II of Nodule BC1901 also exhibits a strong ~10 Å peak, indicating a higher concentration of buserite and a more substantial contribution of diagenetic precipitates compared to the other two layers.
5.2.2 Chemical composition
Marine PMNs can be distinguished through analysis of specific element ratios and trace element contents. Discrimination between hydrogenetic, diagenetic, and hydrothermal PMNs can be achieved using the Mn/Fe ratio, (Co+Ni+Cu)×10 value, and trace element compositions (Bonatti et al., 1972; Bau et al., 2014; Josso et al., 2017).
Hydrogenetic PMNs, which precipitate from seawater, are characterized by high Fe concentrations, typically exceeding 10%, Mn/Fe ratios of less than 2.5, and a significant Co concentration, which has been reported for PMNs in the northwestern Pacific and Cook Islands-Penrhyn Basin (Hein et al., 2020; Ren et al., 2022, 2023). In contrast, diagenetic PMNs are distinguished by higher Cu, Ni, and Mn contents compared to their hydrogenetic counterparts. Mixed hydrogenetic-diagenetic PMNs exhibit additional Cu enrichment, while hydrothermal deposits have variable Fe and Mn contents and lower (Co+Ni+Cu) contents than hydrogenetic PMNs (Hein et al., 2020).
In this study, the significant variations in the Mn/Fe ratios and (Co+Ni+Cu)×10 values of the analyzed nodules suggest that their growth was influenced by both hydrogenetic and diagenetic processes, while hydrothermal processes only had a slight impact (Figure 10). Layer I of Nodule BC06, which exhibits a detrital texture and is Mn-rich, has the highest Mn/Fe ratio (44.78) and Ni+Cu contents (reaching 5.30 wt.%). This is indicative of the occurrence of diagenetic processes. Although the μ-XRF mapping results indicate that Layer II is dominated by Mn-rich minerals, characterized by dendritic and laminated textures, the Mn/Fe ratio of this layer (determined via LA-ICP-MS) is lower than that of Layer I. This places Layer II closer to the mixed hydrogenetic-diagenetic field on the genesis discrimination diagram (Figure 10B), suggesting a reduction of the influence of diagenetic processes.
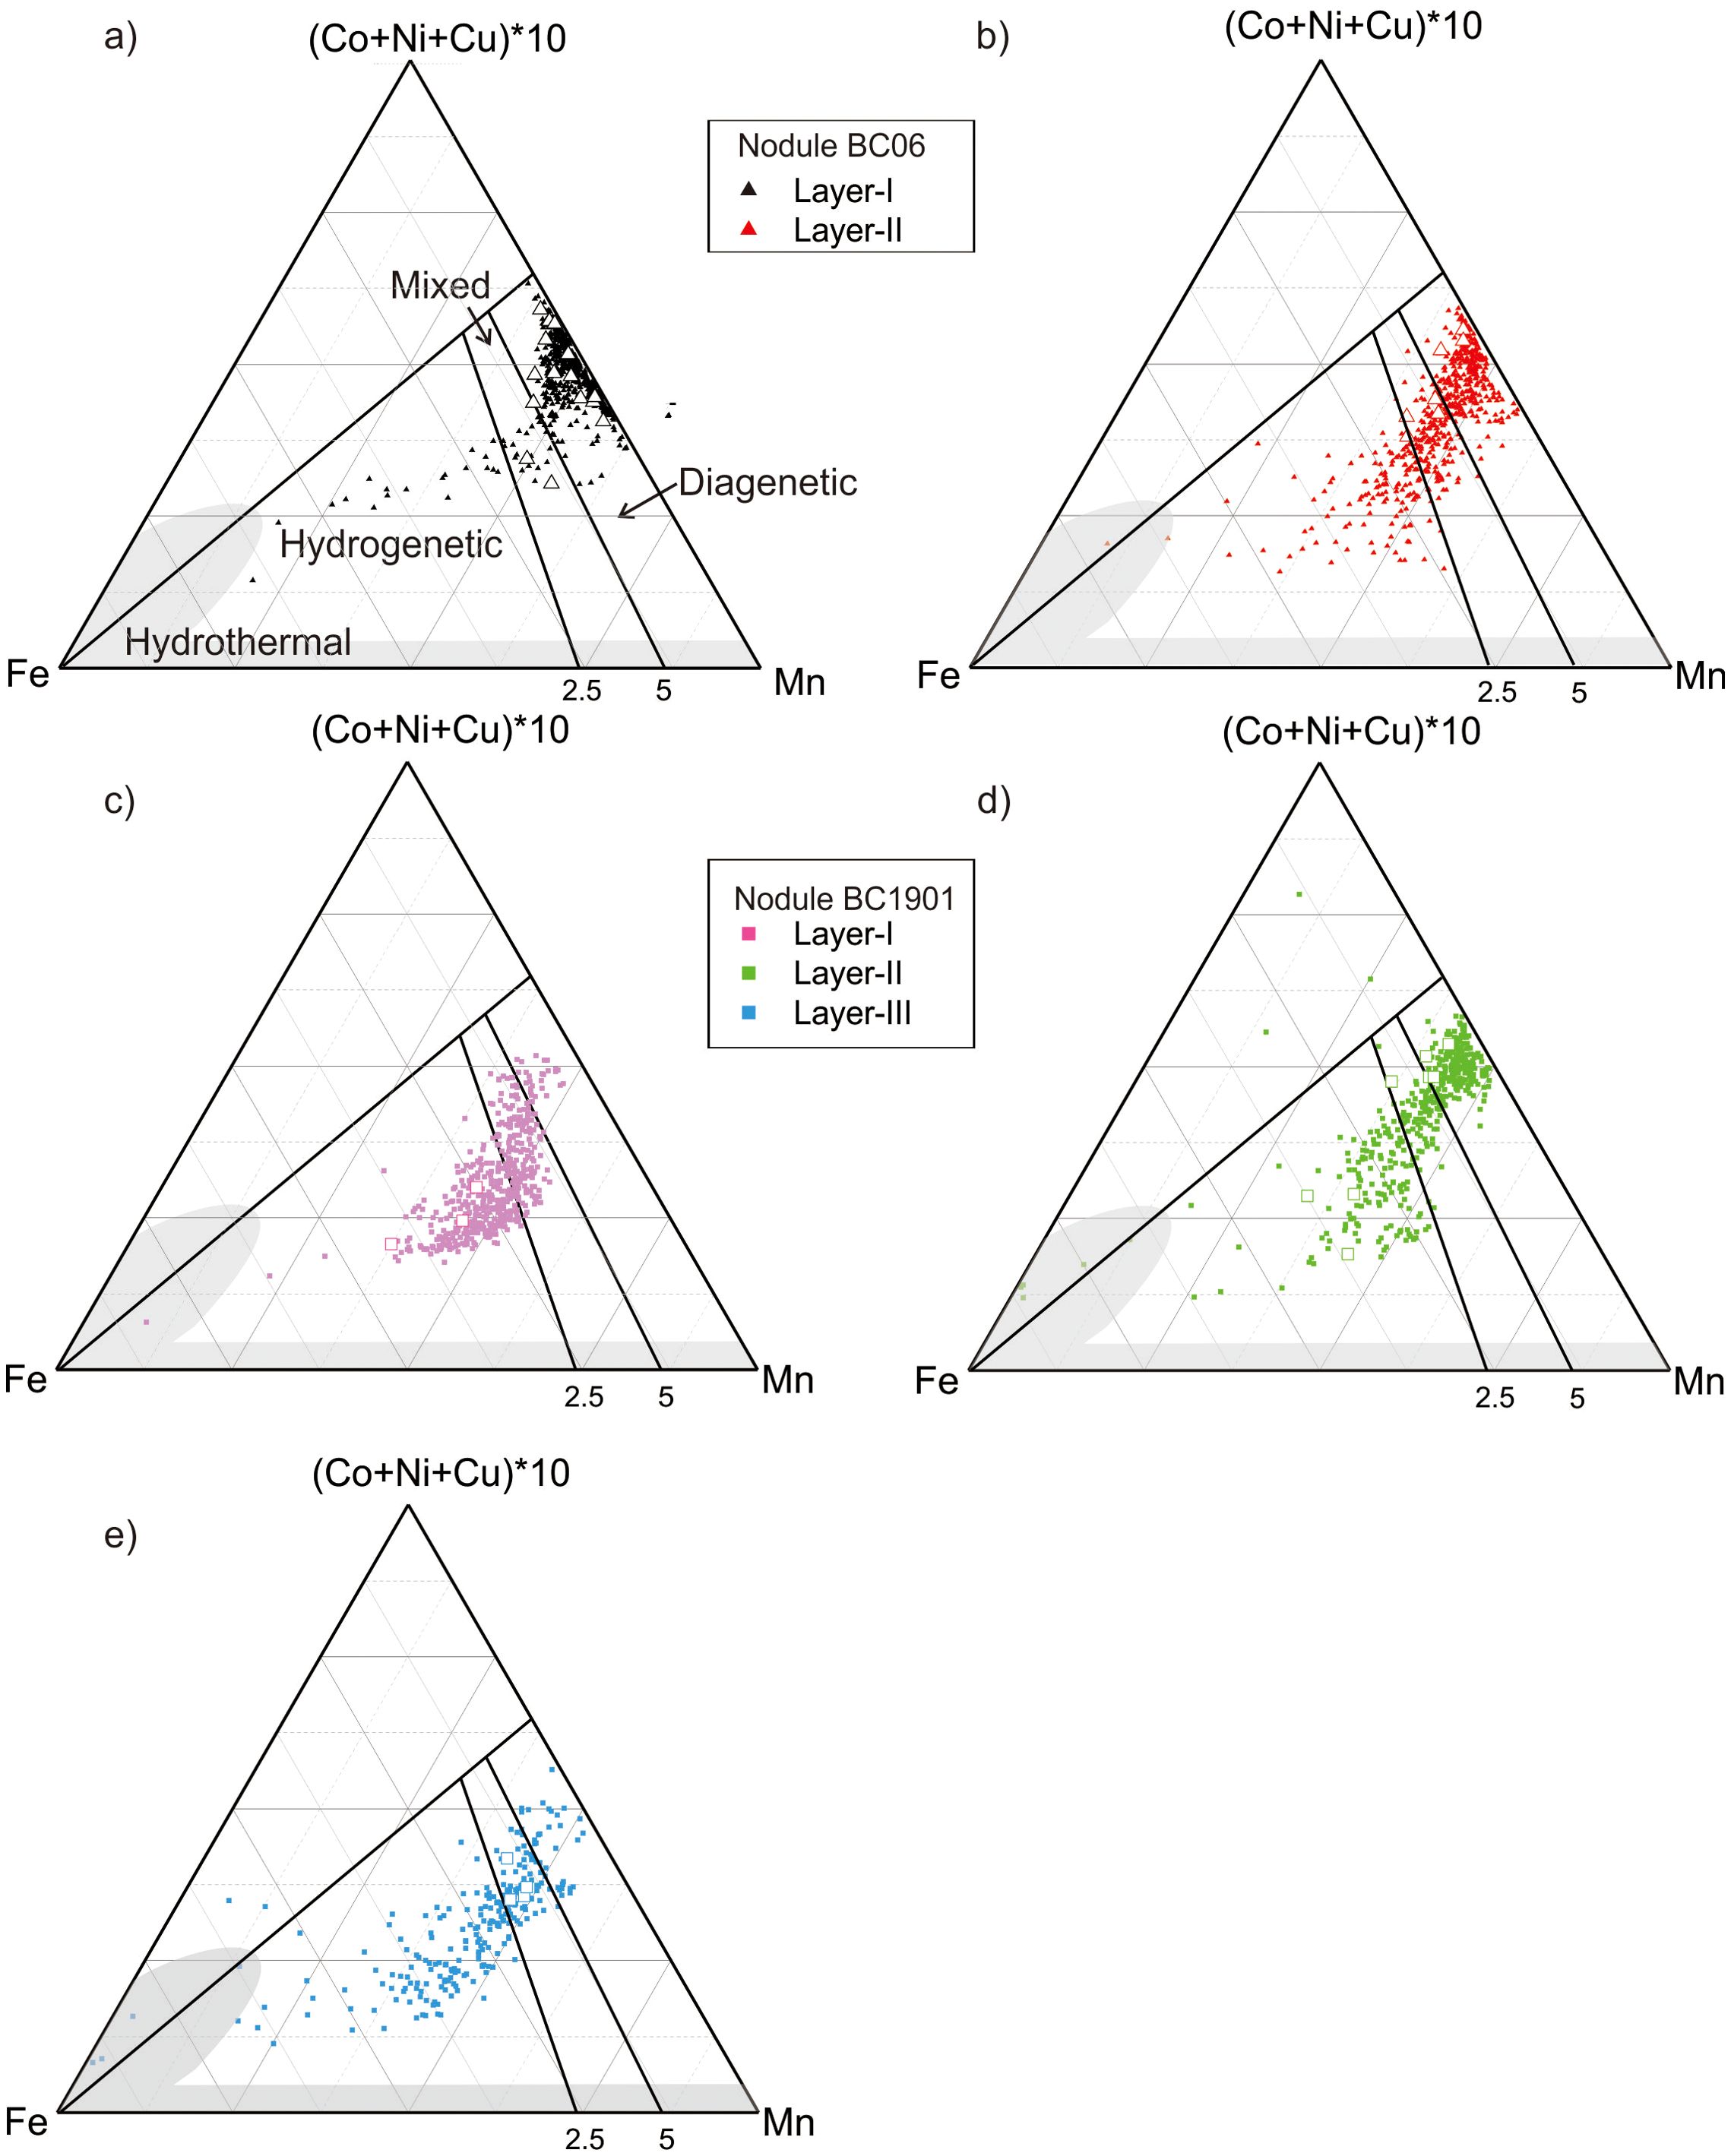
Figure 10. Chemical characteristics of the studied nodules. Nodule BC06: (A) Layer I and (B) Layer II; Nodule BC1901: (C) Layer I, (D) Layer II and (E) Layer III. Ternary diagram of Fe, Mn, and (Cu + Ni) × 10 is following Bonatti et al. (1972). The samples with Mn/Fe ratios of > 2.5 (some refer to 5) indicate a influence by early diagenetic processes. The open and filled symbols denote data obtained via LA-ICP-MS spot and line analyses. The grey shaded area denotes a hydrothermal origin.
Nodule BC1901 generally exhibits higher Fe contents and lower Mn/Fe ratios compared to Nodule BC06, and its Fe-rich layers likely consist of Fe-bearing vernadite. These layers form via precipitation of hydrated Mn and Fe oxide colloids from oxic seawater, as well as metal enrichment via adsorption, complexation, and oxidation (Koschinsky and Hein, 2003; Hein et al., 2013). Typical characteristics of nodules formed via a hydrogenetic formation mechanism are Mn/Fe ratios of up to ~3, low (Ni + Cu) and Ba concentrations, and notably high Co and Ti concentrations (Wegorzewski and Kuhn, 2014). In the case of Nodule BC1901, the highest Mn/Fe ratio determined for Layer I via LA-ICP-MS is 1.82. The μ-XRF mapping results revealed that the Fe is mainly concentrated in Layer I. Combined with its geochemical characteristics, this supports the conclusion that this layer has a predominantly hydrogenetic origin. This is also evident on the ternary discrimination plot, on which the data for Layer I predominantly plot within the hydrogenetic field (Figure 10C). In contrast to Layer I, Layer II and Layer III of Nodule BC1901 plot within both the hydrogenetic and diagenetic fields this discrimination diagram (Figures 10C–E). This distribution suggests that while these layers primarily acquired metals from seawater, they also incorporated metals from sediment pore water. Notably, Layer II has the highest average and maximum Mn/Fe ratios among the layers of Nodule BC1901, indicating that the diagenetic processes had a greater influence. However, this diagenetic signature is weaker in the outer parts of the nodule, suggesting a gradient of the contribution of diagenetic metal enrichment.
In addition to major element data, REY and trace element data provide further insights into the genesis of Mn-nodules. Hydrogenetic layers tend to have high (Zr+Ce+Y) contents and positive δCe values. Whereas fast-growing suboxic diagenetic phases usually have lower (Zr+Ce+Y) contents and negative δCe values (Kuhn et al., 1998; Ohta et al., 1999). In Figures 11 and 12, Layer I of Nodule BC06 plots in the diagenetic field on the discrimination plots created by Josso et al. (2017) and Bau et al. (2014). In contrast, Layer II plots in the mixed diagentic-hydrogenetic field and has higher δCe values and (Zr+Ce+Y) contents. The data for Nodule BC1901 plot in the mixed and hydrogenetic fields and have positive Ce anomalies when normalized to PAAS (average δCe of 1.52, n = 15). The δCe value decreases from Layer I to Layer II and then increases from Layer II to Layer III.
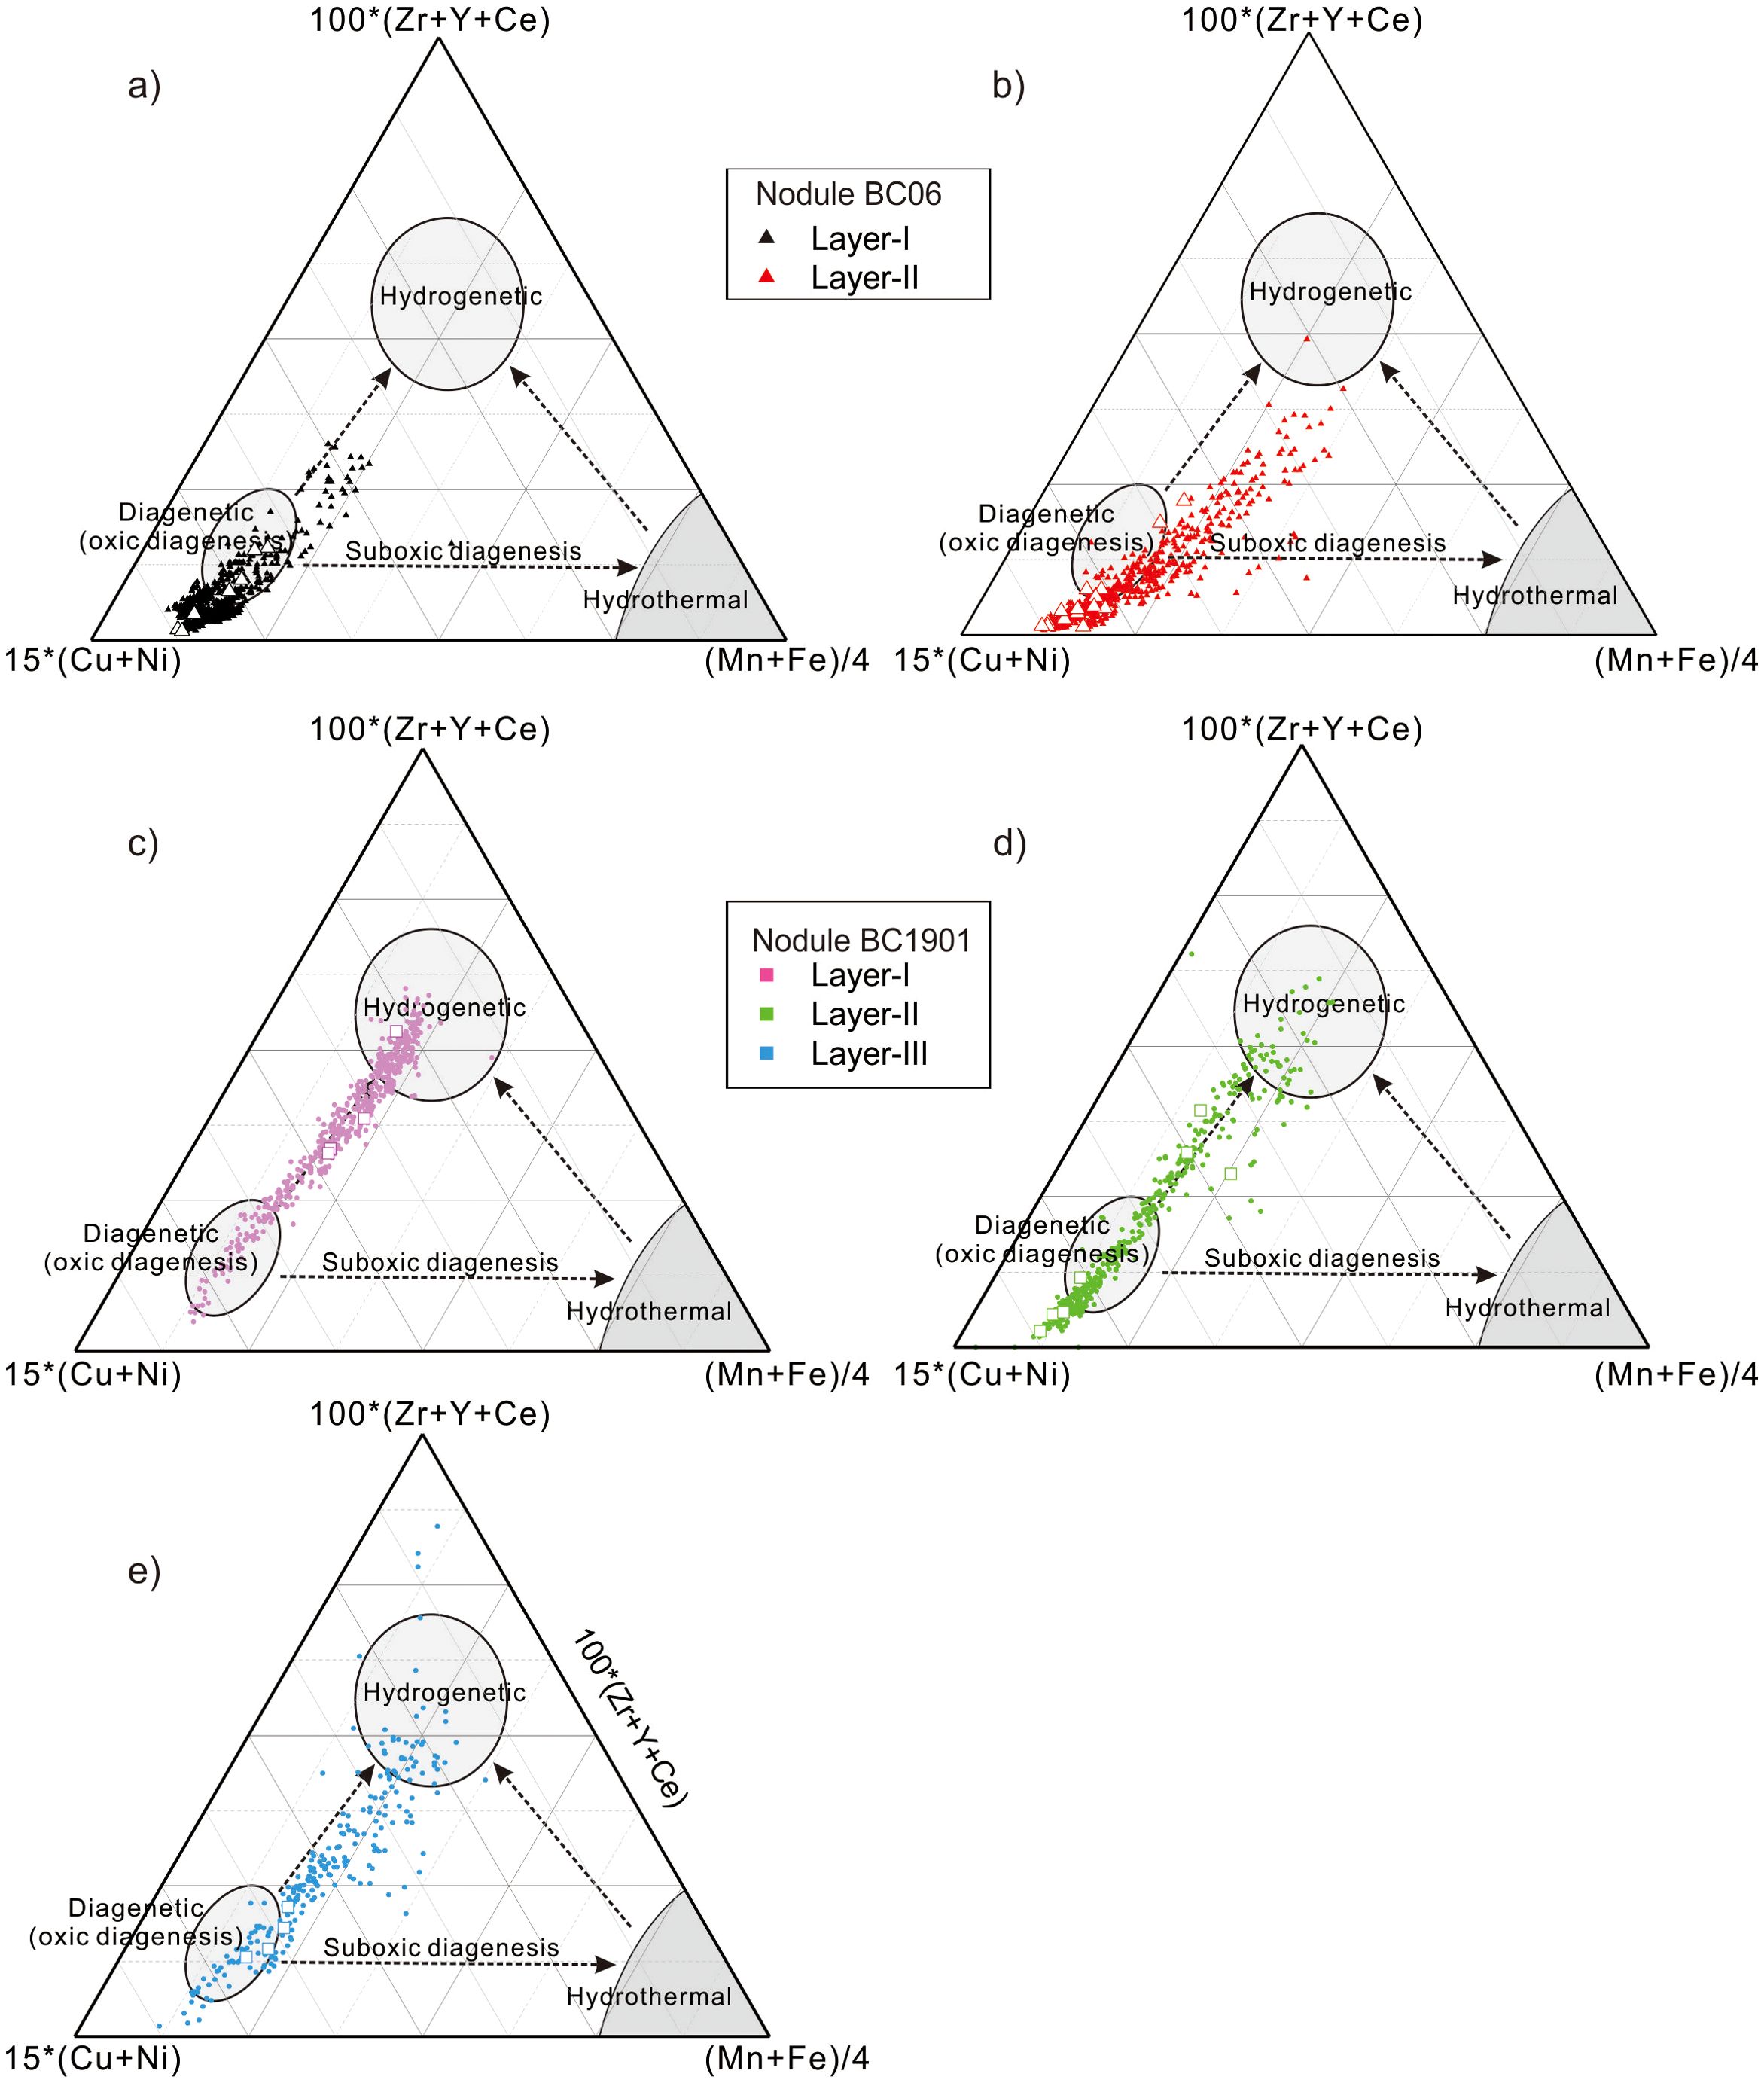
Figure 11. 15×(Cu+Ni)–(Mn+Fe)/4–(Zr+Y+Ce)×100 ternary diagram [after Josso et al. (2017)]. Nodule BC06: (A) Layer I and (B) Layer II; Nodule BC1901: (C) Layer I, (D) Layer II and (E) Layer III. The legend is the same as in Figures 6 and 10. The open and filled symbols denote data obtained via spot and line analyses, respectively.
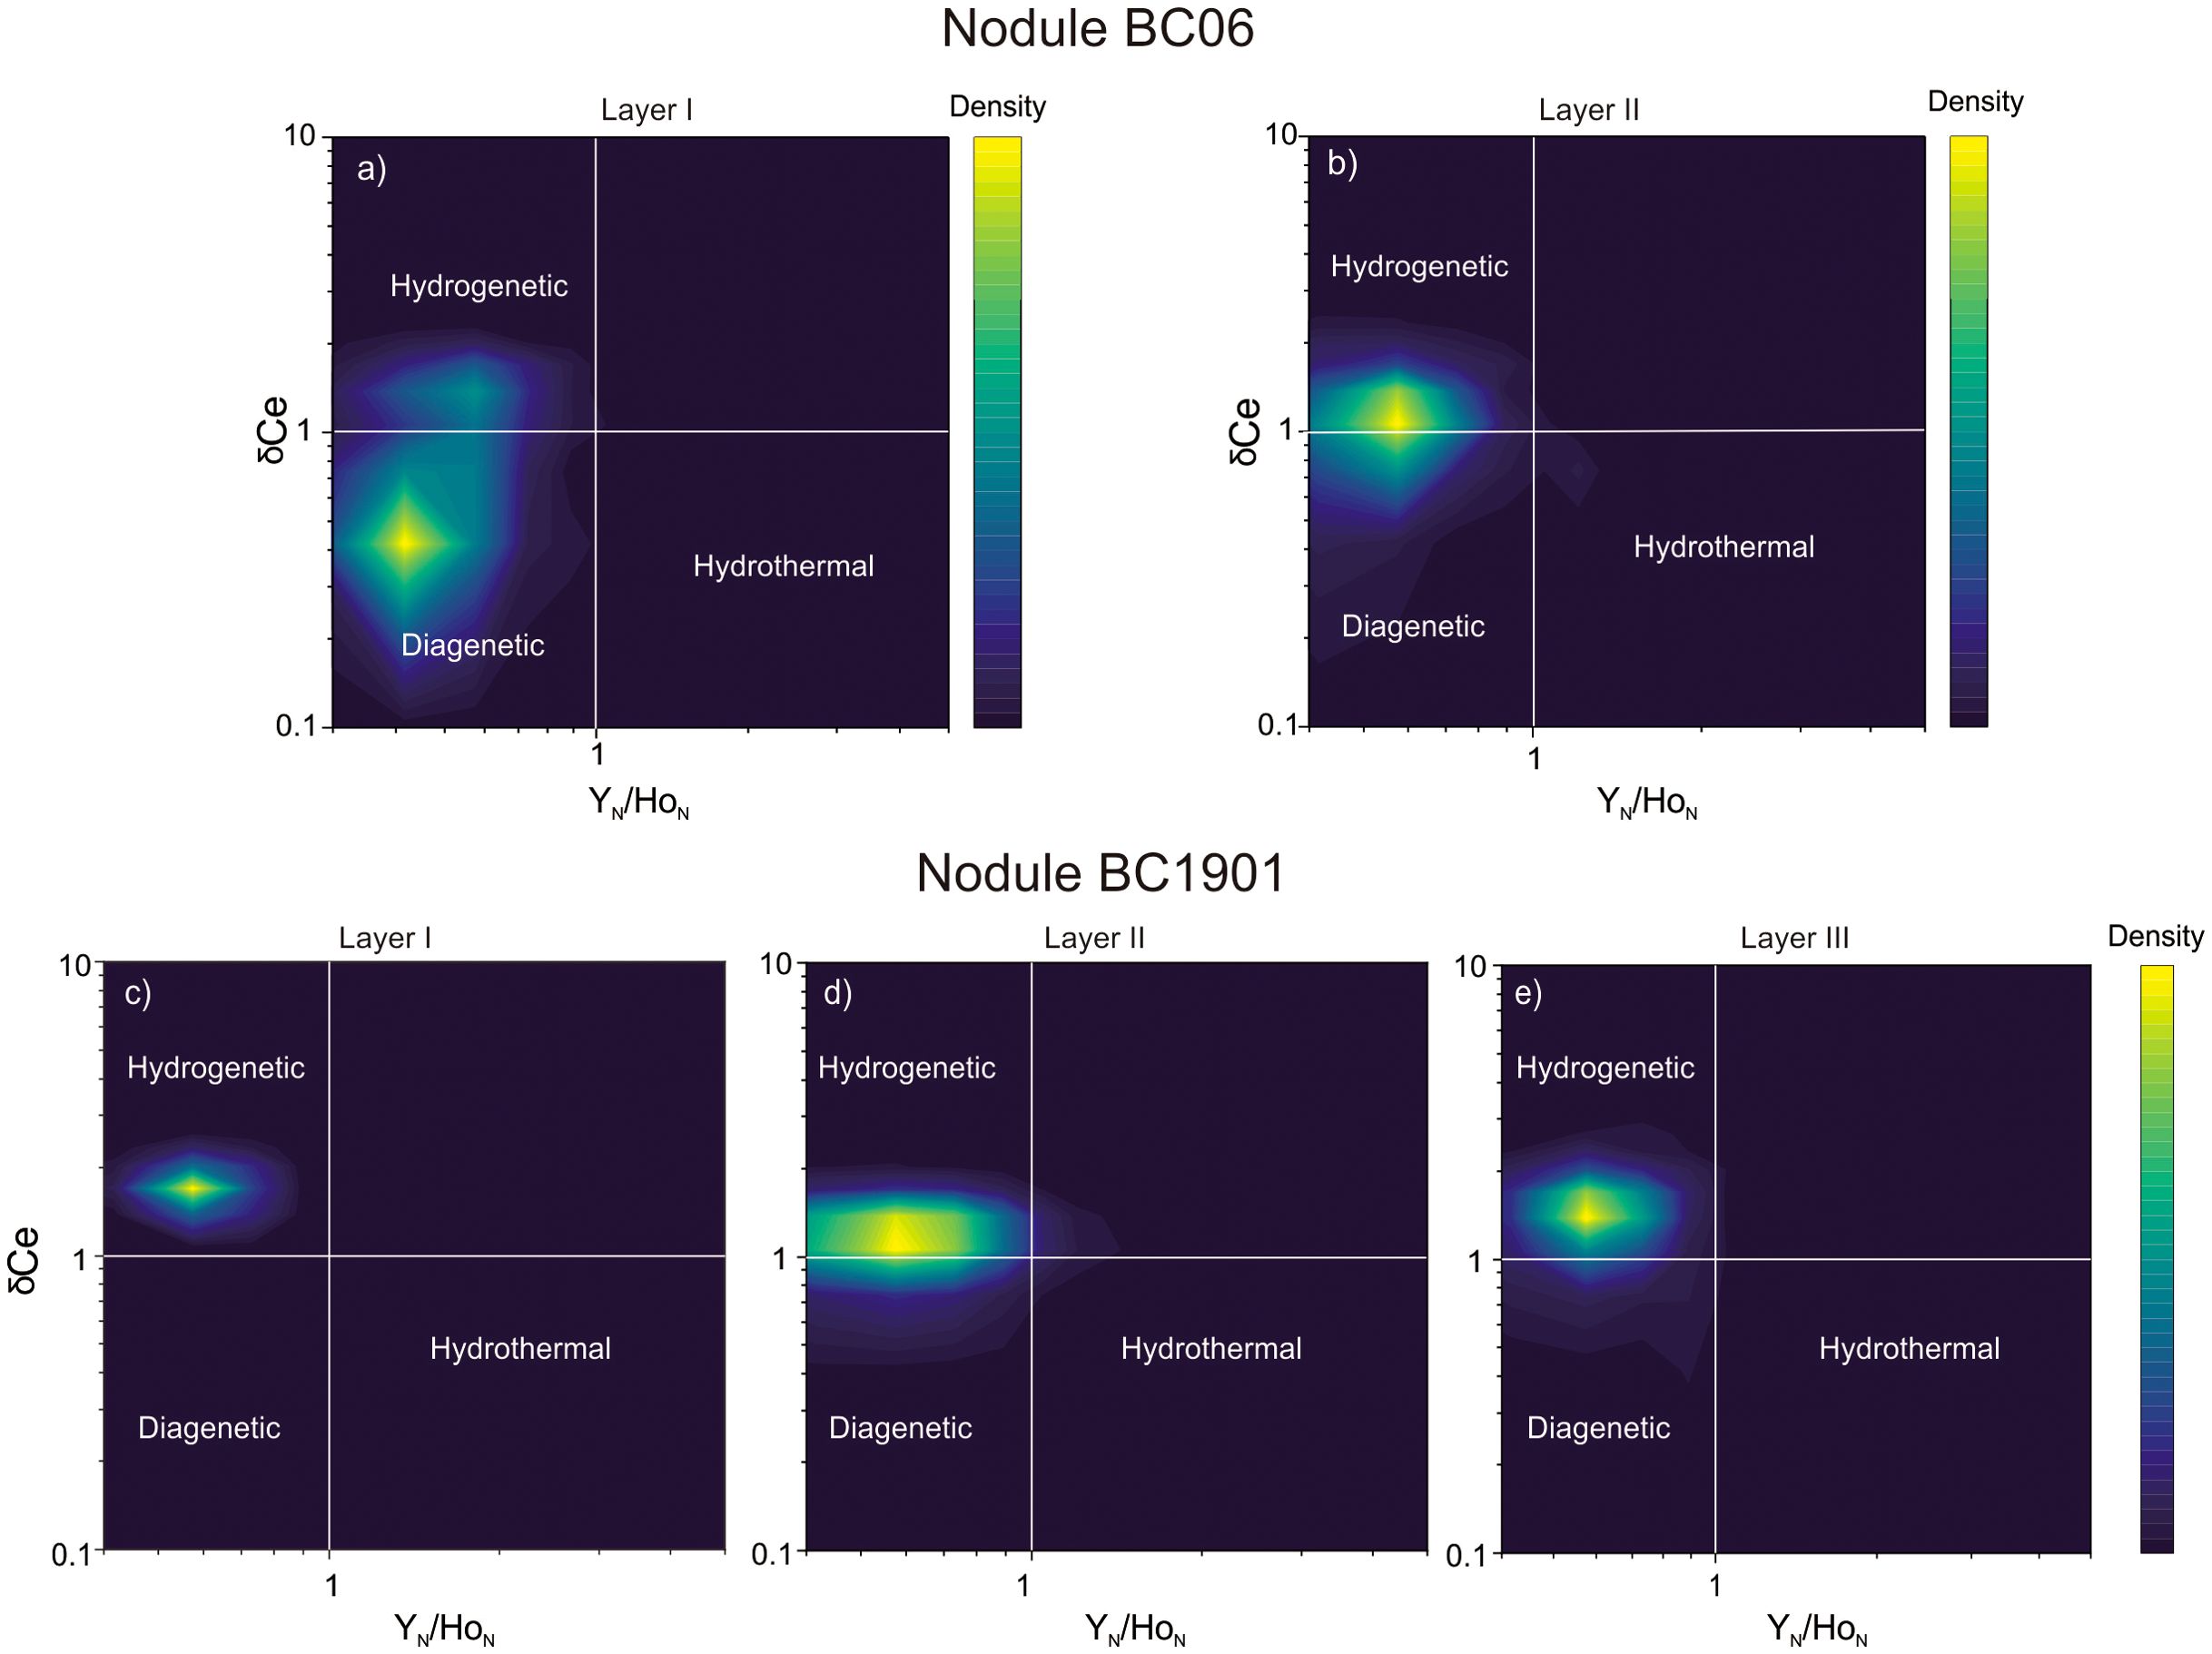
Figure 12. Plots showing the density of the individual layers in the studied nodules. Nodule BC06: (A) Layer I and (B) Layer II; Nodule BC1901: (C) Layer I, (D) Layer II and (E) Layer III. . All of the elements (Ce, La, Pr, Y, and Ho) are normalized to PAAS (McLennan, 1989). The white lines are based on the discriminate diagram of Bau et al. (2014).
There are two explanations for the variations in the Ce anomaly value. One hypothesis suggests that these variations are associated with the redox conditions, under which PMNs selectively absorb tetravalent Ce from seawater. During diagenesis, under suboxic to anoxic conditions, Ce is reduced from insoluble Ce4+ to soluble Ce3+, leading to diagenetic phases having negative Ce anomalies (Bau et al., 1997; Pattan et al., 2005; Bau et al., 2014). An alternative explanation is that these variations are related to the growth rate of the PMN. A slow growth rate results in prolonged contact with seawater, facilitating Ce enrichment and leading to a positive Ce anomaly. These results indicate that the redox conditions may not be the dominant factor controlling the Ce anomaly, thus the δCe values are positive for PMNs with a diagenetic or hydrogenetic source (Cheng et al., 2023; Su et al., 2022). However, in this study, we found that the δCe value is negatively correlated with the Mn/Fe ratio (Figure 6E). Layers with lower δCe values tend to plot closer to the diagenetic field on the ternary discrimination plots compared to layers with higher δCe values (Figures 10, 11). We propose that the lower Ce anomaly values are likely indicative of a greater input from diagenetic precipitation.
In conclusion, Nodule BC06from the eastern CCZ predominantly exhibit characteristics indicative of intensification of diagenetic influences from the core to the rim. In contrast, Nodule BC1901from the western CCZ characteristics indicative of initial intensification of diagenetic processes followed by a trend of weakening of diagenetic processes towards the outer layers. This suggests the occurrence of complex interplay between hydrogenetic and diagenetic processes.
5.3 Major factors controlling the growth of individual layers
Our findings indicate that Nodule BC06 is primarily of diagenetic origin. The decrease in the Mn/Fe ratio (Figure 8) and increase in the δCe value from Layer I to Layer II (Figures 10C, D) suggest a transition from a sub-oxic environment to a more oxic environment. Previous studies have suggested that a reduction of the supply of organic matter to the seafloor can induce a shift in the redox environment (Wegorzewski and Kuhn, 2014). When biological productivity is high enough to increase the amount of organic matter that reaches the seafloor, aerobic respiration decreases the amount of dissolved oxygen in the sediment pore fluid (Kuhn et al., 2017), causing a rapid decrease in the oxygen content and forming a shallower oxic/suboxic front (OSF). Consequently, Layer I likely precipitated when the flux of organic material to the sediments was higher than that during the formation of Layer II (e.g., Halbach et al., 1988). This is further supported by the decrease in the Ba content from Layer I to Layer II (Figure 8C) as the variation in Ba within the PMN reflects fluctuations in the primary biological productivity (Dymond et al., 1984; Hein et al., 1997). During the decomposition of organic matter, Ba is released into the water column and is incorporated into the PMNs. Currently, the high productivity zone is located to the south of our sampling sites. The flux of organic matter to the sediments is likely highest within this high productivity zone, providing optimal conditions for PMN growth via diagenetic processes. According to the movement of the tectonic plates, the Pacific Plate has moved northwestward by 0.3° latitude per million years since 43 Ma (Wessel and Kroenke, 1998). Therefore, the initial location of the site at which Nodule BC06 was collected may have been closer to the equatorial high-productivity zone than it is today. As the Pacific Plate moved, this site likely moved away from this zone. A decrease in the surface primary productivity would have led to oxidizing conditions, causing the OSF to retreat deeper into the sediment. As a result, the diagenetic formation weakened towards the outer parts of the nodule (Figure 13A). Polymetallic nodules from the nearby UK contract area also exhibit this pattern, suggesting it is a regional phenomenon rather than an isolated case (Menendez et al., 2019).
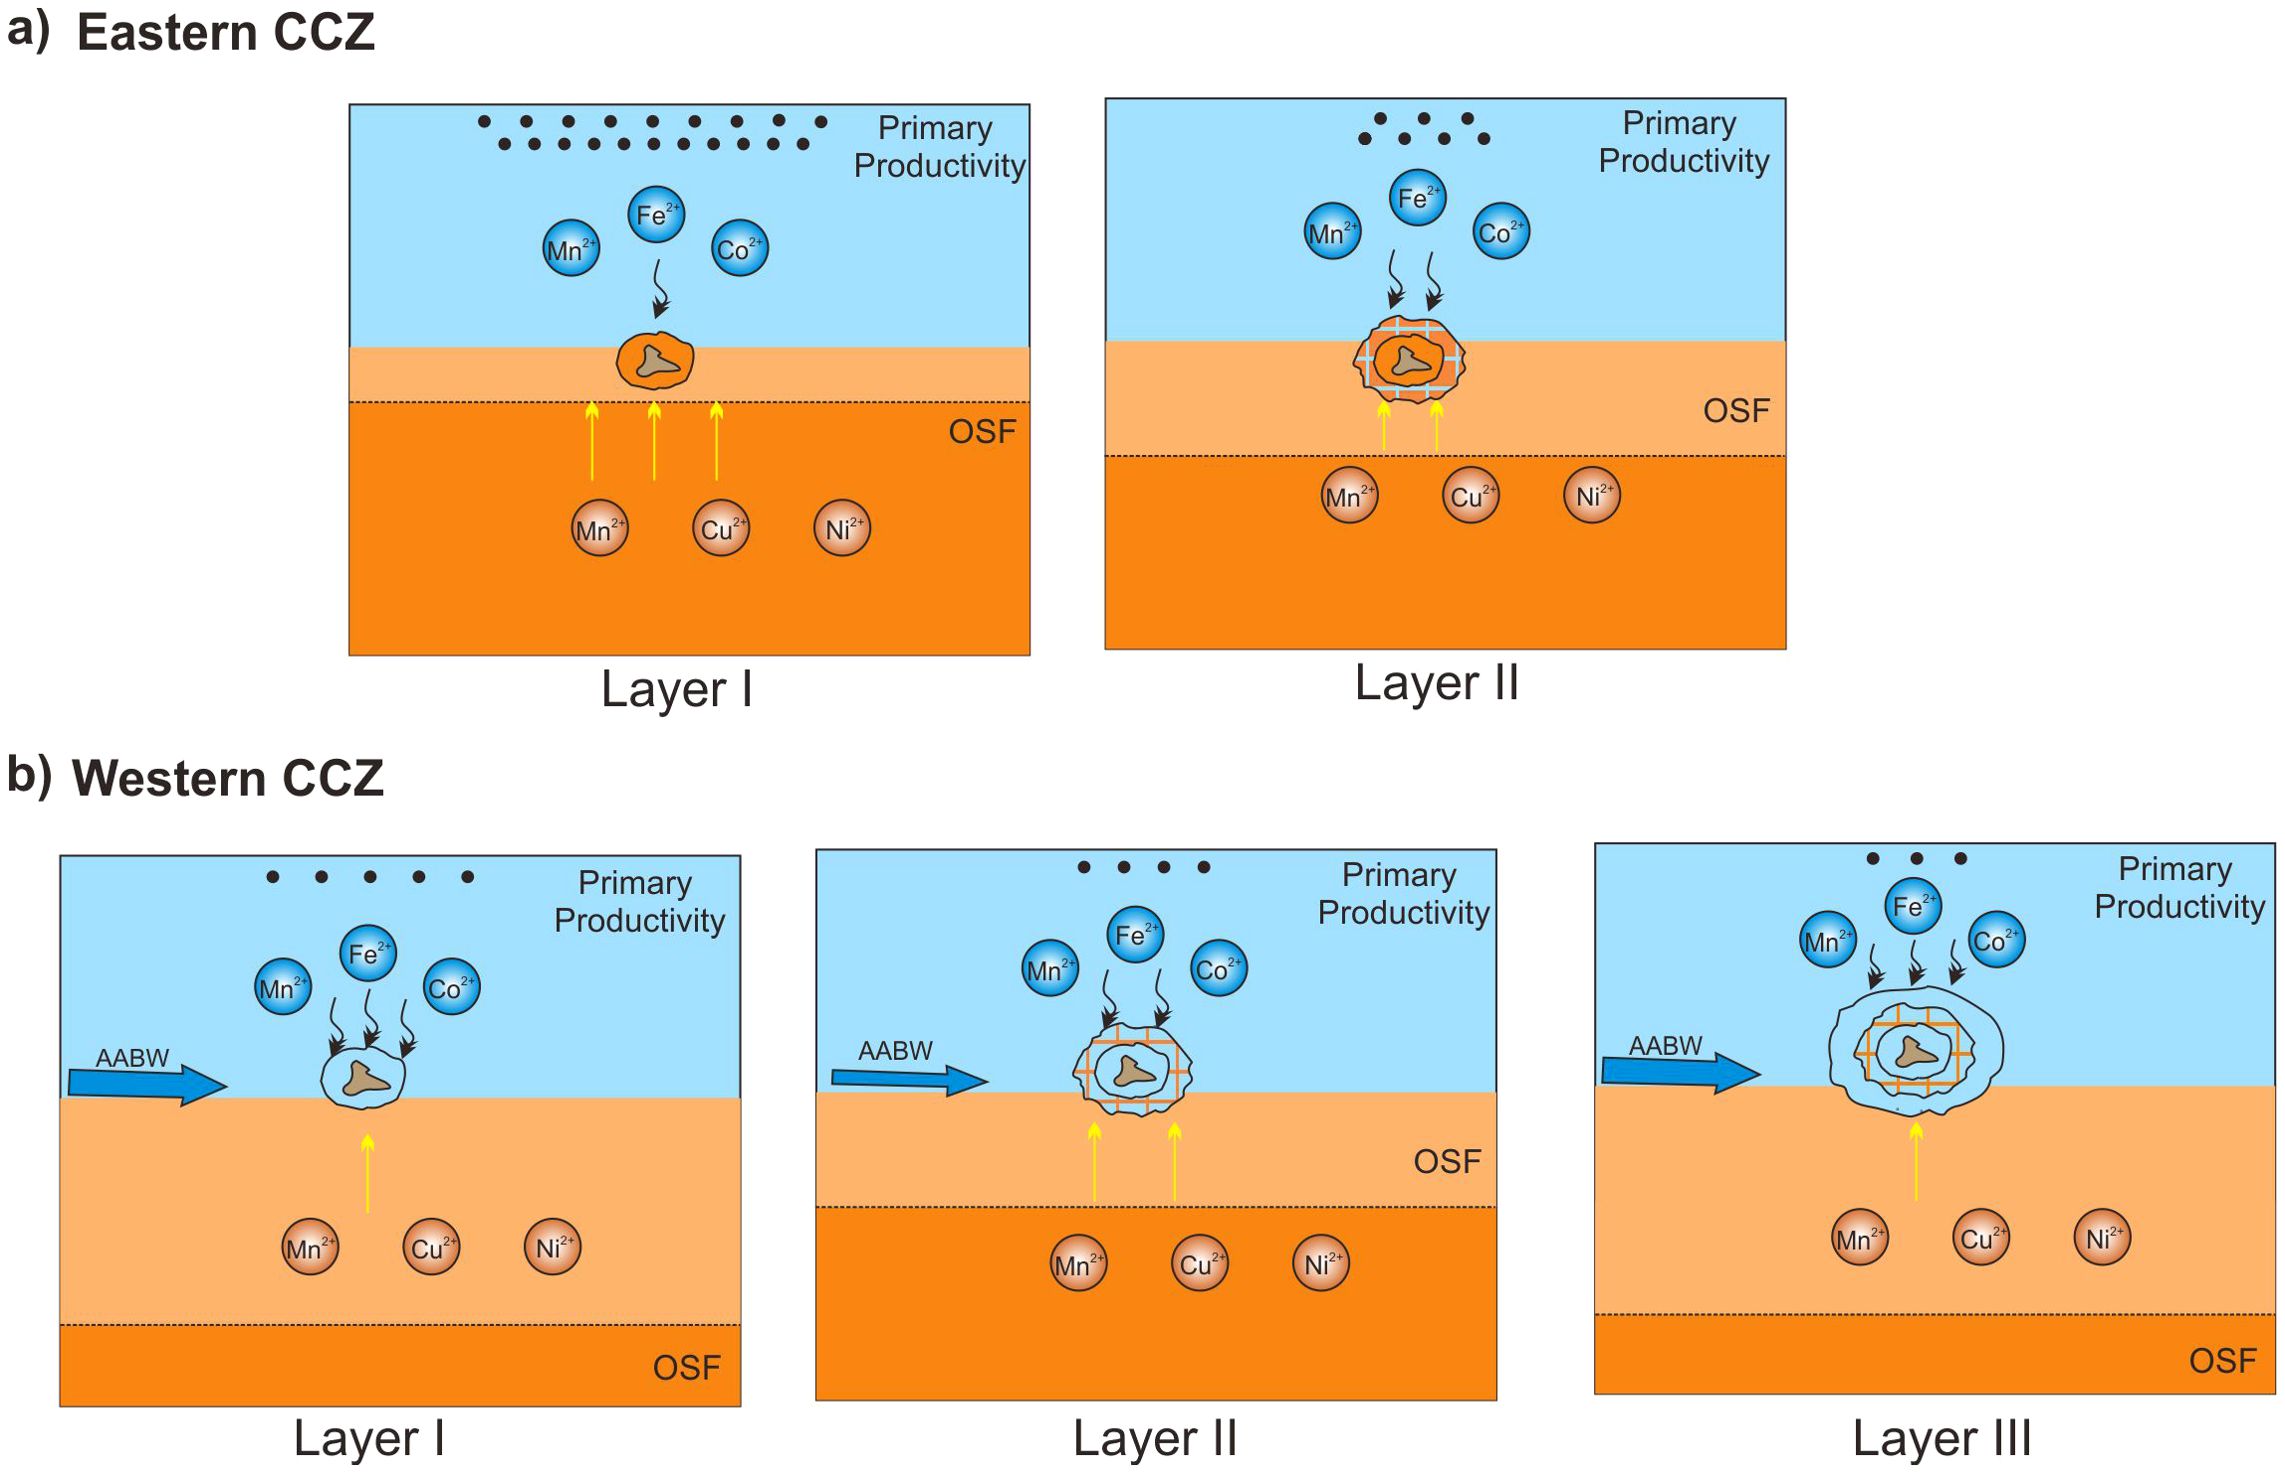
Figure 13. Schematic models illustrating the environmental changes during the formation of the PMNs in the eastern and western CCZ. (A) Nodule BC06 from the eastern CCZ consists of two layers. As the nodule moved away from the equatorial high productivity zone due to tectonic movement of the Pacific Plate, the redox conditions changed from sub-oxic to more oxic. The metal elements were primarily sourced from the pore water, especially during the growth of Layer I. (B) Nodule BC1901 from the western CCZ is composed of three layers. During the growth of Layer I, the nodule began to form on the seafloor under oxic conditions as a result of strengthening of the AABW. The metal elements were mainly sourced from the seawater. As global climate change weakened the bottom currents, the OSF moved closer to the surface of the sediments. The formation mechanism shifted from hydrogenetic to diagenetic, and the metal elements were increasingly sourced from the pore water (Layer II). Subsequently, the strengthening of the AABW led to more oxidizing conditions, causing the OSF to retreat deeper into the sediment. This provided optimal conditions for hydrogenetic formation (Layer III). The yellow arrows represent pore water, and the black arrows represent seawater. The blue and orange colors in the PMNs represent diagenetic and hydrogenetic precipitates, respectively.
In contrast, Nodule BC1901 from the western CCZ initially grew in an oxic environment. The diagenetic processes intensified during the formation of Layer II and then weakened during the formation of the outer layers. This growth history is also supported by the trends of the Mn/Fe ratio and δCe value (Figures 8, 12). If this phenomenon was also driven by plate movement, it would imply that the site from which Nodule BC1901 was collected must have migrated from south of the equator and passed through the high productivity zone before reaching its current location. Based on the present-day distribution of the primary productivity, this site would need to have moved from approximately ~3°S to its current position (~9°N). Because the Pacific Plate moved northwestward by 0.3° latitude/Ma after 43 Ma (Wessel and Kroenke, 1998), the estimated age of nodule is ~40 Ma. However, our estimate of the age of Nodule C1901 is up to ~4.22 Ma obtained via Co chronology (Supplementary Table S2). This is consistent with the estimated age of PMNs with similar sizes and morphologies in this region reported by Yi et al. (2020), who estimated the age of PMNs in this area (10.05°N, 154.32°W) to be ~4.70 Ma (Early Pliocene) using comprehensive methods, including magnetic scanning, 10Be/9Be dating, and Co chronometers. The substantial discrepancy between these estimated ages suggests that the change in the formation mechanism cannot be solely explained by the movement of the Pacific Plate.
Another factor that may have contributed to the fluctuations of the diagenetic formation processes is the variability of the oxygen-rich Antarctic Bottom Water (AABW). When the AABW weakens, the oxygen content in the sediment decreases, causing the OSF to become shallower, thereby intensifying diagenesis (Park et al., 2023). Previous studies have shown that deep-sea ventilation linked to the formation of AABW and its variability is a key factor controlling the ventilation (i.e., the redox conditions) beneath the Eastern Tropical Pacific (Yi et al., 2023). Additional support for this interpretation comes from the lower Co/(Cu+Ni) ratios of Layer II compared to Layers I and III (Figure 8B), which is a proxy for deep-water ventilation conditions (Zhong et al., 2020). Thus, the intensified diagenesis during the formation of Layer II of Nodule BC1901 may have been associated with weakening of the AABW (Figure 13B). According to previous research, Earth experienced a transition from ice-free conditions in the Northern Hemisphere to extensive glaciation due to the onset of Northern Hemisphere glaciation (NHG) at around 3.6 Ma (Studer et al., 2012; Mudelsee and Raymo, 2005). Following the expansion of sea ice, the AABW weakened, creating strongly reducing conditions that caused the OSF to move toward the sediment-water interface. The inferred change in the formation mechanism may be related to these changes in the environment. While the current evidence strongly supports this interpretation, future studies that utilize more precise dating techniques could provide further validation and deeper insights into the timing and dynamics of these changes.
In summary, movement of the Pacific Plate was only a secondary factor influencing the nodule growth in the western CCZ. Instead, variations in the AABW were likely the primary factor controlling the growth of Nodule BC1901. Initially, Nodule BC1901 began to form on the seafloor in an oxic environment with greater deep-water ventilation and stronger AABW. As global climate change led to diminished bottom currents, the nodule formation mechanism shifted from hydrogenetic to diagenetic. Subsequently, intensification of the AABW led to more oxidizing conditions, causing the OSF to retreat deeper into the sediment. Under the new oxygenated bottom water conditions, hydrogenetic growth of PMNs was favored (Figure 13B).
5.4 Implications for spatial variability within the CCZ
As the largest nodule field found on the deep-sea floor of all oceans worldwide, the CCZ contains PMNs with varying chemical compositions. This variability reflects differences in the nodule growth mechanisms within the CCZ. The polymetallic nodules in the eastern CCZ were primarily precipitated from suboxic sediment pore water; whereas, although they also contain diagenetic layers, the polymetallic nodules in the western CCZ were principally formed via hydrogenous precipitation. The Fe oxyhydroxide and Mn oxide colloids formed via hydrogenetic precipitation attracted dissolved Co2+ from the seawater onto the surfaces of the PMNs. At the same time, metal ions (such as Cu2+ and Ni2+) were released via dissolution of Mn oxides, diffused upward into the pore-water, and re-precipitated around the accreting PMNs (Hein et al., 2020; Manceau et al., 2014). Consequently, compared to those in the western CCZ, the PMNs in the eastern CCZ are enriched in Mn and Cu and depleted in Co (ISA, 2010). The formation of this geochemical composition requires spatial variability of the depositional and geochemical conditions, which control the growth mechanisms of the PMNs. In the past, the PMNs in the eastern CCZ were located closer to the equatorial high productivity zone. Although plate motion has moved them to an area with lower productivity, the initial diagenetic layers, which are enriched in Mn and Cu, continue to significantly influence the bulk composition of the PMNs. Furthermore, at present, the primary productivity in the eastern CCZ is still higher than that in the western CCZ, creating conditions suitable for the formation of more diagenetic microlayers with higher Mn and Cu contents in the eastern CCZ. In contrast, the PMNs in the western CCZ have always been located outside the equatorial high productivity zone, making the western CCZ an ideal environment for the formation of Fe-rich layers via hydrogenetic processes.
As a result, the Mn and Cu contents of PMNs increase towards the eastern CCZ. However, the reason for the trend of Ni along the central axis of the CCZ remains elusive. Therefore, future studies are needed to obtain a more detailed characterization of PMNs from different regions within the CCZ, which would be beneficial to exploration efforts. Nonetheless, the results of this study underscore the importance of the growth history of PMNs in explaining the spatial variability of their element distributions.
6 Conclusions
Based on the analysis of the mineralogical and geochemical compositions of polymetallic nodules from the eastern and western CCZ in the Pacific Ocean, we reached the following conclusions.
1. Based on careful interpretation and validation against established standards and techniques, LA-ICP-MS line-scan analysis yielded reliable geochemical data for PMNs.
2. Polymetallic nodules from the eastern and western CCZ had different textures, mineralogical compositions, and chemical distributions. The nodule collected from the eastern CCZ was primarily influenced by diagenetic processes, whereas the nodule collected from western CCZ was influenced by both hydrogenetic and diagenetic processes.
3. The growth history of Nodule BC06 from the eastern CCZ was divided into two periods. The movement of the nodule away from the equatorial high-= productivity zone as a result of plate motion was the principle reason for the change in the growth mechanism. The growth history of Nodule BC1901 from the western CCZ was divided into three periods. Variations in the deep-water ventilation and AABW were the major controlling factors.
4. Studying the growth history of PMNs could help to explain the spatial varieties of some elements in PMNs in the eastern and western CCZ. Therefore, future studies are needed to obtain a more detailed characterization of PMNs in different regions in the CCZ.
Data availability statement
The datasets presented in this study can be found in online repositories. The names of the repository/repositories and accession number(s) can be found in the article/Supplementary Material.
Author contributions
JL: Writing – review & editing, Writing – original draft, Conceptualization. YJ: Writing – review & editing, Methodology, Investigation. HW: Writing – original draft, Methodology, Investigation, Conceptualization. KY: Writing – review & editing, Methodology. ZZ: Writing – review & editing, Investigation, Formal Analysis. XM: Writing – review & editing. XL: Writing – review & editing, Project administration, Funding acquisition.
Funding
The author(s) declare that financial support was received for the research, authorship, and/or publication of this article. This work was supported by the National Key R&D Program of China (Grant No. 2023YFC2811305) and the Chinese Natural Science Foundation (Project 42076084, U2244222).
Conflict of interest
Author YJ was employed by the company Huadian Electric Power Research Institute Co., LTD.
The remaining authors declare that the research was conducted in the absence of any commercial or financial relationships that could be constructed as a potential conflict of interest.
Publisher’s note
All claims expressed in this article are solely those of the authors and do not necessarily represent those of their affiliated organizations, or those of the publisher, the editors and the reviewers. Any product that may be evaluated in this article, or claim that may be made by its manufacturer, is not guaranteed or endorsed by the publisher.
Supplementary material
The Supplementary Material for this article can be found online at: https://www.frontiersin.org/articles/10.3389/fmars.2024.1489184/full#supplementary-material
Supplementary Figure 1 | LA-ICP-MS line analysis results for PMNs in this study. Variability of (A, B) Mn/Fe ratio; (C, D) Co/(Cu+Ni) ratio; and (E, F) Ba content, along the chemical measurement line, i.e., along the growth direction. The grey lines denote the original data; and the red lines denote the 9‐point moving average. The thin black dashed lines in Layers I–III denote distinct textural zones (see Section 4.1 in text and photos under microscope in Figure 2).
References
Antoine D., André J.-M., Morel A. (1996). Oceanic primary production: 2. Estimation at global scale from satellite (coastal zone color scanner) chlorophyll. Global Biogeochem. Cycles 10, 57–69. doi: 10.1029/95GB02832
Bau M., Möller P., Dulski P. (1997). Yttrium and lanthanides in eastern Mediterranean seawater and their fractionation during redox-cycling. Mar. Chem. 56, 123–131. doi: 10.1016/S0304-4203(96)00091-6
Bau M., Schmidt K., Koschinsky A., Hein J., Kuhn T., Usui A. (2014). Discriminating between different genetic types of marine ferro-manganese crusts and nodules based on rare earth elements and yttrium. Chem. Geol. 381, 1–9. doi: 10.1016/j.chemgeo.2014.05.004
Bodeϊ S., Manceau A., Geoffroy N., Baronnet A., Buatier M. (2007). Formation of todorokite from vernadite in Ni-rich hemipelagic sediments. Geochim. Cosmochim. Acta 71, 5698–5716. doi: 10.1016/j.gca.2007.07.020
Bonatti E., Kraemer T., Rydell H. (1972). “Classification and genesis of submarine iron-manganese deposits,” in Ferromanganese deposits on the ocean floor (1st edition). Ed. Horn D. R. (Washington: National Science Foundation), 149–166.
Cheng Y., Xu Y., Yi L., Li D., Lin F., Yin X., et al. (2023). Chronology and critical metals enrichment mechanism of ferromanganese nodules from the Parece Vela Basin, Philippine Sea. Chem. Geol. 630, 121494. doi: 10.1016/j.chemgeo.2023.121494
Dymond J., Lyle M., Finney B., Piper D.Z., Murphy K., Conard R., et al. (1984). Ferromanganese nodules from MANOP sites H, S and R — control of mineralogical and chemical composition by multiple accretionary processes. Geochim. Cosmochim. Acta 48, 931–949. doi: 10.1016/0016-7037(84)90186-8
Glasby G. ,. P. (2006). “Manganese: Predominant role of nodules and crusts,” in Marine geochemistry. Eds. Schulz H. D., Zabel M. (Springer Berlin Heidelberg, Berlin, Heidelberg), 371–427. doi: 10.1007/3-540-32144-6_11
Halbach P. E., Friedrich G., von Stackelberg U. (1988). “The manganese nodule belt of the Pacific Ocean,” in Geological environment, nodule formation, and mining aspects (Ferdinand Enke Verlag, Stuttgart), 1–254.
Hein J.R., Koschinsky A., Halbach P., Manheim F. T., Bau M., Kang J.-K., et al. (1997). Iron and manganese oxide mineralization in the Pacific. Manganese Mineralization: Geochemistry and Mineralogy of Terrestrial and Marine Deposits. Eds. Nicholson K., Hein J.R., Bühn B., Dasgupta S.. London: Geological Society, 123–138.
Hein J. R., Koschinsky A., Kuhn T. (2020). Deep-ocean polymetallic nodules as a resource for critical materials. Nat. Rev. Earth Environ. 1, 158–169. doi: 10.1038/s43017-020-0027-0
Hein J. R., Mizell K., Koschinsky A., Conrad T. A. (2013). Deep-ocean mineral deposits as a source of critical metals for high- and green-technology applications: Comparison with land-based resources. Ore Geol. Rev. 51, 1–14. doi: 10.1016/j.oregeorev.2012.12.001
Hein J.R., Koschinsky A. (2014). Deep-ocean ferromanganese crusts and nodules. In: Treatise on Geochemistry (2nd edition). Eds. Holland H.D., Turekian K.K.. Amsterdam: Elsevier, 273–291.
Hein J. R., Conrad T., Mizell K., Banakar V. K., Frey F.A., Sager W. W. (2016). Controls on ferromanganese crust composition and reconnaissance resource potential, Ninetyeast Ridge, Indian Ocean. Deep Sea Research Part I: Oceanographic Research Papers 110, 1–19.
ISA (International Seabed Authority) (2010). A Geological Model of Polymetallic Nodule Deposits in the Clarion-Clipperton Fracture Zone and Prospector’s Guide for Polymetallic Nodule Deposits in the Clarion-Clipperton Fracture Zone (Kingston: International Seabed Authority Technical Study: No. 6) 210-211, ISBN: ISBN: 978-976-95268-2-2.
Johnson D. A. (1972). Ocean-floor erosion in the aquatorial Pacific. Geol. Soc. Am. Bull. 83, 3121–3144. doi: 10.1130/0016-7606(1972)83[3121:OEITEP]2.0.CO;2
Josso P., Pelleter E., Pourret O., Fouquet Y., Etoubleau J., Cheron S., et al. (2017). A new discrimination scheme for oceanic ferromanganese deposits using high field strength and rare earth elements. Ore Geol. Rev. 87, 3–15. doi: 10.1016/j.oregeorev.2016.09.003
Koschinsky A., Hein J. R. (2003). Uptake of elements from seawater by ferromanganese crusts: solid-phase associations and seawater speciation. Mar. Geol. 198, 331–351. doi: 10.1016/S0025-3227(03)00122-1
Koschinsky A., Hein J.R., Schmidt K., Alexander B., Bau M. (2010). Rare and valuable metals for high-tech applications found in marine ferromanganese nodules and crusts: relationships to genetic endmembers. In: Toward the Sustainable Development of Marine Minerals: Geological, Technological and Economic Aspects. Gelendzhik, Russia: Underwater Mining Institute, 1–13.
Kuhn T., Bau M., Blum N., Halbach P. (1998). Origin of negative Ce anomalies in mixed hydrothermal-hydrogenetic Fe-Mn crusts from the Central Indian Ridge. Earth Planet. Sci. Lett. 163, 207–220. doi: 10.1016/S0012-821X(98)00188-5
Kuhn T., Wegorzewski A., Ruhlemann C., Vink A. (2017). “Composition, formation, and occurrence of polymetallic nodules,” in Deep Sea Mining: Resource Potential, Technical and Environmental Considerations. Ed. Sharma R. (Cham: Springer International Publishing), 23–63.
Li D. F., Fu Y., Sun X. M., Wei Z. Q. (2020). Critical metal enrichment mechanism of deep-sea hydrogenetic nodules: Insights from mineralogy and element mobility. Ore Geol. Rev. 118, 103371. doi: 10.1016/j.oregeorev.2020.103371
Liu Y. S., Hu Z. C., Gao S., Günther D., Xu J. (2008). In situ analysis of major and trace elements of anhydrous minerals by LA-ICP-MS without applying an internal standard. Chem. Geol. 257, 1–2, 34–43. doi: 10.1016/j.chemgeo.2008.08.004
Lyle M. (2003). Neogene carbonate burial in the Pacific Ocean. Paleoceanogr. Paleoclimatol. 18, 1-9. doi: 10.1029/2002PA000777
Manceau A., Lanson M., Takahashi Y. (2014). Mineralogy and crystal chemistry of Mn, Fe, Co, Ni, and Cu in a deep-sea Pacific polymetallic nodule. Am. Mineralogist 99, 2068–2083. doi: 10.2138/am-2014-4742
McLennan S. (1989). Rare earth elements in sedimentary rocks; influence of provenance and sedimentary processes. Rev. Mineral. Geochem. 21, 169–200.
Menendez A., James R. H., Lichtschlag A., Connelly D., Peel K. (2019). Controls on the chemical composition of ferromanganese nodules in the Clarion-Clipperton Fracture Zone, eastern equatorial Pacific. Mar. Geol. 409, 1–14. doi: 10.1016/j.margeo.2018.12.004
Mewes K., Mogollón J. M., Picard A., Rühlemann C., Kuhn T., Nöthen K., et al. (2014). Impact of depositional and biogeochemical processes on small scale variations in nodule abundance in the Clarion-Clipperton Fracture Zone. Deep Sea Res. Part I: Oceanogr. Res. Papers 91, 125–141. doi: 10.1016/j.dsr.2014.06.001
Mogollón J. M., Mewes K., Kasten S. (2016). Quantifying manganese and nitrogen cycle coupling in manganese-rich, organic carbon-starved marine sediments: examples from the Clarion-Clipperton fracture zone. Geophys. Res. Lett. 43, 7114–7123. doi: 10.1002/2016GL069117
Mudelsee M., Raymo M. E. (2005). Slow dynamics of the northern hemisphere glaciation. Paleoceanography 20, PA4022. doi: 10.1029/2005PA001153
Müller P. J., Mangini A. (1980). Organic carbon decomposition rates in sediments of the pacific manganese nodule belt dated by 230Th and 231Pa. Earth Planet. Sci. Lett. 51, 94–114. doi: 10.1016/0012-821X(80)90259-9
Ohta A., Ishii S., Sakakibara M., Mizuno A., Kawabe I. (1999). Systematic correlation of the Ce anomaly with the Co/(Ni+Cu) ratio and Y fractionation from Ho in distinct types of Pacific deep-sea nodules. Geochem. J. 33, 399–417. doi: 10.2343/geochemj.33.399
Pan G. F., Hua Z. G. (1996). Distribution of manganese nodules and its relation to geologic and geographic environment in the Clarion-Clipperton Zone. Oceanol. Limnol. Sin. 27, 405–413.
Park J., Jung J., Ko Y., Lee Y., Yang K. (2023). Reconstruction of the paleo-ocean environment using mineralogical and geochemical analyses of mixed-type ferromanganese nodules from the tabletop of western Pacific Magellan Seamount. Geochem. Geophys. Geosyst. 24, e2022GC010768. doi: 10.1029/2022GC010768
Paton C., Hellstrom J., Paul B., Woodhead J., Hergt J. (2011). Iolite: Freeware for the visualisation and processing of mass spectrometric data. J. Anal. At. Spectrom. 26 (12), 2508-2518. doi: 10.1039/c1ja10172b
Pattan J. N., Pearce N. J. G., Mislankar P. G. (2005). Constraints in using Cerium-anomaly of bulk sediments as an indicator of paleo bottom water redox environment: a case study from the Central Indian Ocean Basin. Chem. Geol. 221, 260–278. doi: 10.1016/j.chemgeo.2005.06.009
Ren J. B., He G. W., Deng X. G., Deng X. Z., Yang Y., Yao H. Q., et al. (2022). Metallogenesis of Co-rich ferromanganese nodules in the northwestern Pacific: Selective enrichment of metallic elements from seawater. Ore Geol. Rev. 143, 104778. doi: 10.1016/j.oregeorev.2022.104778
Ren J. B., He G. W., Yang Y., Yu M., Deng Y. N., Pang Y. T., et al. (2024). Ultraselective enrichment of trace elements in seawater by Co-rich ferromanganese nodules. Global Planet. Change 239, 104498. doi: 10.1016/j.gloplacha.2024.104498
Ren J. B., Yao H. Q., Yang Y., Wang L. X., He G. W., Lai P. X., et al. (2023). Critical metal enrichment in atypical hydrogenetic ferromanganese nodules: A case study in the Central Basin Ridge of the West Philippine Basin. Chem. Geol. 615, 121224. doi: 10.1016/j.chemgeo.2022.121224
Reykhard L. Y., Shulga N. A. (2019). Fe-Mn nodule morphotypes from the NE Clarion-Clipperton Fracture Zone, Pacific Ocean: Comparison of mineralogy, geochemistry and genesis. Ore Geol. Rev. 110, 102933. doi: 10.1016/j.oregeorev.2019.102933
Studer A. S., Martinez-Garcia A., Jaccard S. L., Girault F. E., Sigman D. M., Haug G. H. (2012). Enhanced stratification and seasonality in the Subarctic Pacific upon Northern Hemisphere Glaciatione-New evidence from diatom-bound nitrogen isotopes, alkenones and archaeal tetraethers. Earth Planet. Sci. Lett. 351–352, 84–94. doi: 10.1016/j.epsl.2012.07.029
Su R., Sun F. Y., Li X. H., Chu F. Y., Sun G. S., Li J., et al. (2022). Diverse early diagenetic processes of ferromanganese nodules from the eastern Pacific Ocean: evidence from mineralogy and in-situ geochemistry. Int. Geol. Rev. 65 (13), 2131–2147. doi: 10.1080/00206814.2022.2122087
Volz J. B., Mogollón J. M., Geibert W., Arbizu P. M., Koschinsky A., Kasten S. (2018). Natural spatial variability of depositional conditions, biogeochemical processes and element fluxes in sediments of the eastern Clarion-Clipperton Zone, Pacific Ocean. Deep Sea Res. Part I: Oceanogr. Res. Papers 140, 159–172. doi: 10.1016/j.dsr.2018.08.006
Von Stackelberg U. (1997). Growth history of manganese nodules and crusts of the Peru Basin. In: Manganese Mineralization: Geochemistry and Mineralogy of Terrestrial and Marine Deposits. Eds. Nicholson K., Hein J.R., Bühn B., Dasgupta S.. London: Geological Society, 153–176.
Von Stackelberg U., Beiersdorf H. (1991). The formation of manganese nodules between the Clarion and Clipperton fracture zones southeast of Hawaii. Mar. Geol. 98, 411–423. doi: 10.1016/0025-3227(91)90113-I
Wang H. F., Liu Y. G., Zhu K. C. (2015). Polymetallic nodules distribution in the basin and comparison with nodules in China pioneer area, CC zone. Mar. Geol. Quaternary Geol. 35, 73–79. doi: 10.3724/SP.J.1140.2015.02073
Wegorzewski A. V., Kuhn T. (2014). The influence of suboxic diagenesis on the formation of manganese nodules in the Clarion Clipperton nodule belt of the Pacific Ocean. Mar. Geol. 357, 123–138. doi: 10.1016/j.margeo.2014.07.004
Wegorzewski A. V., Kuhn T., Dohrmann R., Wirth R., Grangeon S. (2015). Mineralogical characterization of individual growth structures of Mn-nodules with different Ni+Cu content from the central Pacific Ocean. Am. Mineralogist 100, 2497–2508. doi: 10.2138/am-2015-5122
Wessel P., Kroenke L. K. (1998). The geometric relationship between hot spots and seamounts: Implications for Pacific hot spots. Earth Planet. Sci. Lett. 158, 1–18. doi: 10.1016/S0012-821X(98)00043-0
Yi L., Medina‐Elizalde M., Kletetschka G., Yao H., Simon Q., Paterson G.A., et al. (2020). The Potential of Marine Ferromanganese Nodules From Eastern Pacific as Recorders of Earth's Magnetic Field Changes During the Past 4.7Myr: A Geochronological Study by Magnetic Scanning and Authigenic 10Be/9Be Dating. Journal of Geophysical Research: Solid Earth 125 (7), 1–15. doi: 10.1029/2019JB018639
Yi L., Medina-Elizalde M., Tan L., Kemp D.B., Li Y., Kletetschka G., et al. (2023). Plio-Pleistocene deep-sea ventilation in the eastern Pacific and potential linkages with Northern Hemisphere glaciation. Science Advances 9 (8), 1–10. doi: 10.1126/sciadv.add1467
Zhong Y., Liu Q., Chen Z., González F. J., Hein J. R., Zhang J., et al. (2019). Tectonic and paleoceanographic conditions during the formation of ferromanganese nodules from the northern South China Sea based on the high-resolution geochemistry, mineralogy and isotopes. Mar. Geol. 410, 146–163. doi: 10.1016/j.margeo.2018.12.006
Zhong Y., Chen Z., Hein J.R., González F.J., Jiang Z., Yang X., et al. (2020). Evolution of a deep-water ferromanganese nodule in the South China Sea in response to Pacific deep-water circulation and continental weathering during the Plio-Pleistocene. Quaternary Science Reviews 229, 106106. doi: 10.1016/j.quascirev.2019.106106
Keywords: micro-layers, ferromanganese nodule, spatial variability, in-situ analysis, clarion-Clipperton zone
Citation: Li J, Jin Y, Wang H, Yang K, Zhu Z, Meng X and Li X (2024) In-situ analysis of polymetallic nodules from the clarion-Clipperton zone, Pacific Ocean: implication for controlling on chemical composition variability. Front. Mar. Sci. 11:1489184. doi: 10.3389/fmars.2024.1489184
Received: 31 August 2024; Accepted: 25 November 2024;
Published: 19 December 2024.
Edited by:
Jiangbo Ren, Guangzhou Marine Geological Survey, ChinaReviewed by:
Kiho Yang, Pusan National University, Republic of KoreaJun Hu, Ocean University of China, China
Copyright © 2024 Li, Jin, Wang, Yang, Zhu, Meng and Li. This is an open-access article distributed under the terms of the Creative Commons Attribution License (CC BY). The use, distribution or reproduction in other forums is permitted, provided the original author(s) and the copyright owner(s) are credited and that the original publication in this journal is cited, in accordance with accepted academic practice. No use, distribution or reproduction is permitted which does not comply with these terms.
*Correspondence: Jie Li, bGlqaWVAc2lvLm9yZy5jbg==; Xiaohu Li, eGhsaUBzaW8ub3JnLmNu
 Jie Li
 Yinjia Jin2
 Xingwei Meng