- 1Key Laboratory of Ministry of Education for Coastal Disaster and Protection, Hohai University, Nanjing, China
- 2College of Harbour, Coastal and Offshore Engineering, Hohai University, Nanjing, China
- 3Virginia Institute of Marine Science, College of William and Mary, Gloucester Point, VA, United States
Effective management of sediment transport in water bodies is crucial for maintaining navigational channels and reducing siltation in harbors. This study introduces the first effort in the development of a Field Instrument for Measuring Bed Erosion Response based on microcosmic analysis. The device is designed to automatically measure the sediment bed responses under a series of selected bed shear stresses to determine the critical bed shear stresses for sediment incipient motion and the erosion rates for selected excess bed shear stresses. Numerical simulations were conducted using computational fluid dynamics software (FLUENT) to ensure a reasonable and uniform distribution of the selected bed shear stress across the sediment bed. A lab version of this device was also built and tested using granular sandy sediments and the results were validated against the Shields curve for incipient motion. During this test, however, a problem of sandy bed liquefaction at the bed center was identified because of the pumping out of water at top center. For enhancing the device performances, modifications of the pumping intake were made to eliminate the liquefaction problem. Further a lab test on kaolinite beds with three consolidated durations also demonstrated the capability of this improved device. The study confirms the basic design parameters of the improved device, including the optimal rotating speeds of its pump and disk motors, which are critical for achieving the desired erosion dynamics. These results highlight the potential of the device to significantly improve the precision and efficiency of sediment transport studies in natural aquatic environments.
1 Introduction
To reduce siltation in navigation channels and harbors remains a significant challenge because many of the sediment transport properties, especially the sediment bed erosion process, are not well understood to date. Because of the complex nature of these fine-grain sediment accumulated in the harbors or navigation channels are usually having enough cohesive sediments, and thus, not be able to duplicate an erosion experiment in laboratory without severely altering these sediment properties, especially the erosion properties at the water-sediment interface. An accurate understanding of their erosion resistance by carrying out an in-situ experiment is urgently needed (Gust and Muller, 1997; Kwon et al., 2003; Maa, 2008; Ha and Maa, 2009; Grabowski et al., 2011; Wright et al., 2022; Andualem et al., 2023; Liu et al., 2023). Previous studies indicate that although erosion formulations have been significantly simplified (Ha and Maa, 2009), field experiments to measure the critically needed data on erosion rate under various conditions are still hard to obtain either because the instrument design is not perfect or the operation cost is too high. For any field measurement of the erosion process, it is shown that the critical bed shear stress for sediment erosion, τcr, and the erosion rate, E, are the two most important parameters (Hanson and Simon, 2001; Maa, 2008; Kim and Hwang, 2023; Kulesza et al., 2024).
These two parameters (i.e., τcr and E) for cohesive sediments are affected by the interactions of physical, biological, and chemical factors (Maa et al., 1998; Kimiaghalam et al., 2016; Wang and Hung, 2023). Initially, laboratory studies focusing on these parameters were conducted (e.g., Partheniades, 1965). It is well-understood that significant disturbance of sediment samples is inevitable for any laboratory experiments, making the interpretation of results particularly challenging. Comparisons between laboratory and field results often reveal substantial differences (Maa, 2008; Noack et al., 2015; Nafchi et al., 2021). Consequently, numerous in-situ devices based on various principles have been developed, all aimed at quantifying the relationship between erosion and hydrodynamic parameters. However, existing devices still have limitations in accurately measuring the distribution of bottom shear stress, particularly in maintaining consistent shear stress and minimizing experimental interference. This study aims to overcome these technical limitations by developing an improved device, offering more accurate and reliable erosion measurement results.
To find these two parameters (i.e., τcr and E), mainly there are three types of approaches: (1) a tripod or quadpod mounted with all necessary instruments (e.g., Optical Backscatter Sensor, Acoustic Doppler Velocimeter, etc.) to measure the natural flow conditions and the change of associated suspended sediment concentrations (e.g., Shi et al., 2014). This approach requires extended experimental durations—typically around 30 days—as it relies on natural events to generate erosion, which may or may not occur as anticipated. (2) A field instrument that generates the erosion force, and then, observes the sediment bed responses (Amos et al., 1992; Maa et al., 1993; Kleeberg et al., 2008; He et al., 2021; Dunne et al., 2022). This approach employs modified devices for in-situ underwater use. The primary advantage of this approach is the minimal disturbance to the sediment conditions, and typically, this method conducts erosion experiments over a relatively large bed surface area (approximately 5000 to 10000 cm²). The entire experiment at a site can be completed in less than 10 hours. This kind of experiment is quite expensive because of the need of support from a vessel for the necessary power or system control. Occasionally, anchoring the supporting vessel can be the most significant challenge. In general, the supporting vessel becomes the most expensive part of the overall operation cost. (3) to carry out the experiment using a lab device but at a location close to the field site. For example, using a box core to take sediment samples, and then, immediately transfer the samples (hopefully with a limited disturbance) to a small erosion chamber, and then, experimenting immediately (Gust, 1990; Williamson and Ockenden, 1996).
The approach proposed by Williamson and Ockenden (1996) has a small gap between the driving force (from a rotating bell head) and the mud bed, i.e., ranging from 2 to 6 mm. This means their device (called ISIS) cannot be for in-situ uses because the gap cannot be precisely controlled for any field deployment. The device (called Microcosmic) suggested by Gust (1990), has a much larger gap, i.e., 10 cm, and thus, can be redesigned to be deployed on the sea floor. Notice, however, that there was no detailed study regarding the bed shear stress distribution, nor the precise relationship between the pumping discharge and the rotation disk for these selected representative bed shear stresses. Additionally, the pressure disturbances on the sediment bed surface are not available. The effect caused by pumping out of water at center is never mentioned, but there is a potential that the center cavitation caused by low pressure may cause bottom liquefaction, and thus, invalid the experiment (Zhang et al., 2018). That simplification, however, is not a logical choice because erosion is caused by shear stress, not pressure disturbance.
The third approach is contingent upon the successful operation of a box core, and the subsequent smaller core-taking process. Furthermore, the erosion process is confined to a small surface area of the core sample, approximately 80 - 100 cm². Given this limited erosion area, it is challenging to accurately represent the original, potentially spatially inhomogeneous seabed. However, this method that combines a selected discharge with a rotating disk to generate a flow that can maintain a reasonably constant bed shear stress across the experimental surface, if appropriately configured, is a great contribution. This suggests that to enlarge the test area (e.g., 5 or 6 times) as well as to enhance the design for underwater, in-situ deployment/operation would be the ideal instrument. The three approaches described above each have their respective advantages and disadvantages. The pressing question thus becomes: “Can a device be developed that combines all the advantages while avoiding the disadvantages of existing approaches?” This question has motivated the current study to explore an ideal Field Instrument for Measuring Bed Erosion Responses. The basic requirements for the device are as follows: (1) It should function as a true field instrument,i.e., eliminating the need to take bed sediment samples; (2) Erosion should be measured across a relatively large seabed surface; (3) A series of bed shear stresses should be consistently maintained across the erosion surface area; (4) The bed erosion response should be readily observable and recorded using in-situ samples to measure eroded sediment mass; (5) The device should operate independently without the need for constant support from an anchored vessel; (6) Erosion experiments at a site should be completed within 10 hours; and (7) Operational costs should be affordable to facilitate widespread use. Based on the above requirements, we propose using a relatively large erosion chamber, similar to that developed by Gust (1990), but mounted on a tripod and deployed from a vessel to the seafloor to carry out erosion tests automatically. The experiment shall be operated automatically. The improved device deployment and retrieve still need to use a vessel, but the vessel does not need to be tied with it. Multiple devices can be deployed sequentially, and later, to be retrieved sequentially. Thus, the cost for carrying out experiment at a specified site can be reduced significantly.
The objective of this study is to develop an improved erosion chamber with an optimal size for mounting on a tripod, facilitating deployment from a vessel, and ensuring good hydrodynamic characteristics, namely reasonably uniform distributions of bed shear stresses. To achieve these goals, a geometry of the benthic erosion chamber called FIMER (Figure 1) is suggested. This chamber is constructed from an aluminum tube with an inside diameter of 25 centimeters, providing an erosion surface area of 490 cm². This size is our first attempt and may be changed later if necessary. The chamber is designed to penetrate the seafloor under its own weight and is halted by a bearing disk, thereby forming an effective erosion chamber. A rotating disk, installed 10 cm above the seafloor, can rotate at various selected speeds. With a combination of selected pumping out rates at the center, reasonable uniform bed shear stresses can be developed over the majority of bed surface in the chamber. By starting with a small bed shear stress for a selected duration, increasing the bed shear stress to next higher level for another selected duration, and repeating this process for preselected numbers of bed shear stresses, a complete erosion experiment can be finished within a few hours.
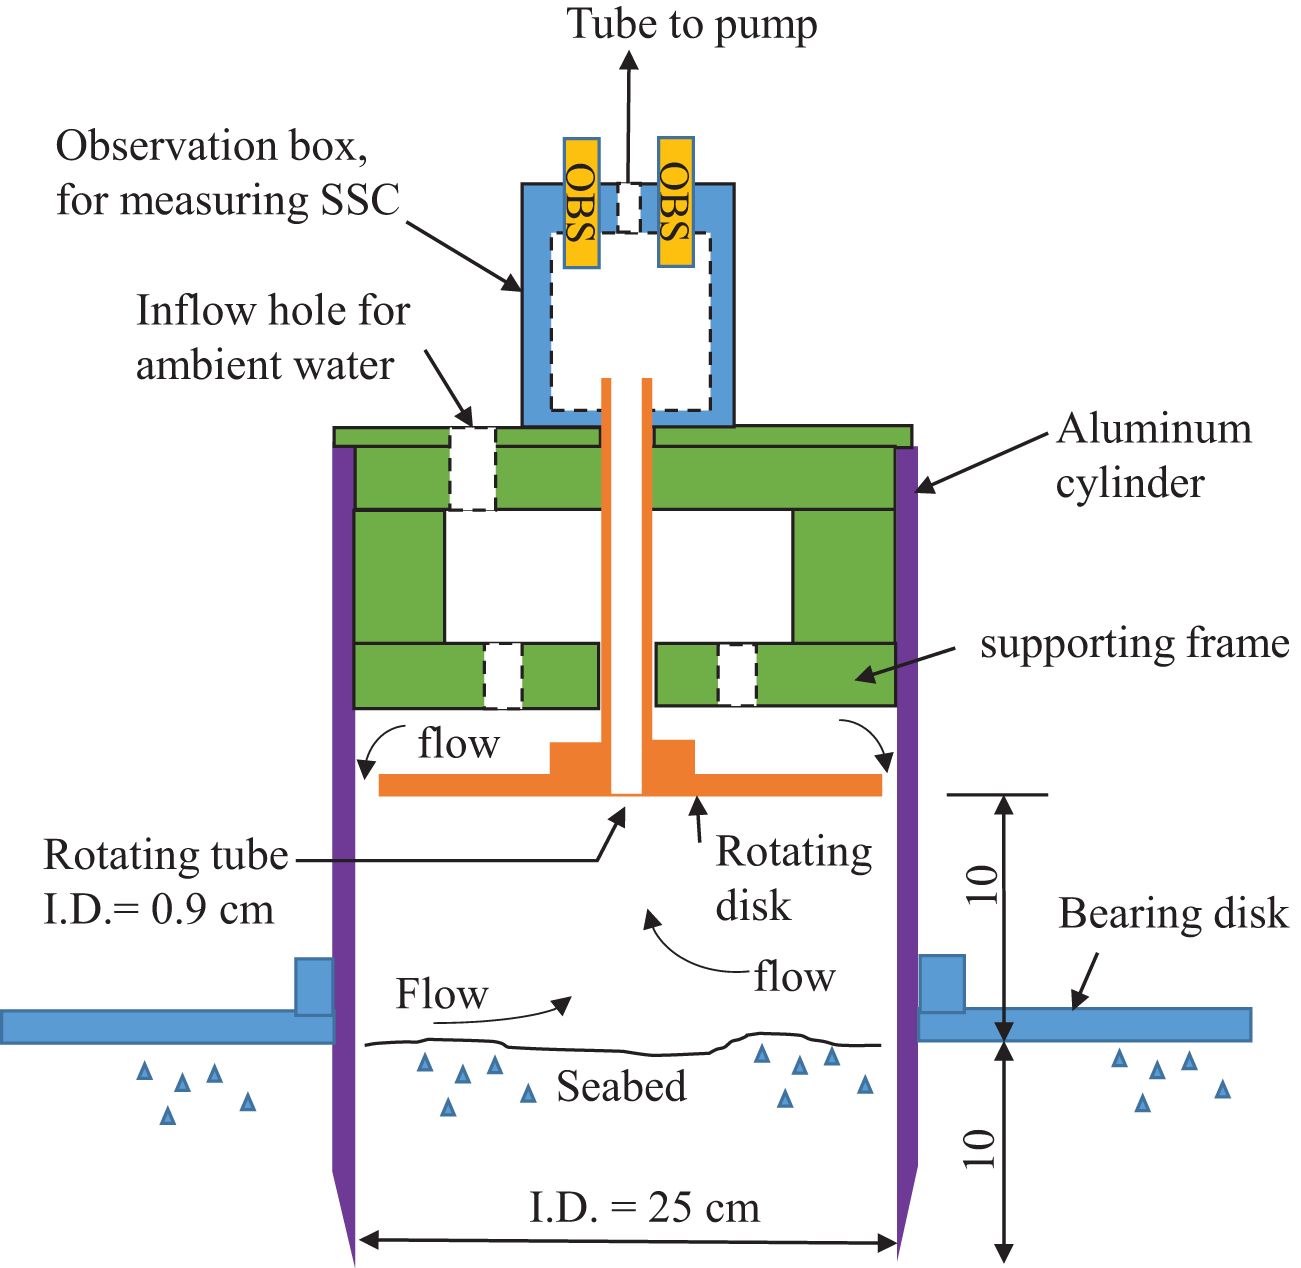
Figure 1. The conceptual diagram of an automatic Field Instrument for Measuring bed Erosion Responses (FIMER). The pumping device, disk rotation mechanism, water sampling, data logger, and the deployment tripod are not shown.
The hydrodynamic characteristics of improved device are quantified using a commercially available software FLUENT (Fluent Inc., 2006). Initially, the model’s performance is validated by comparing it with available data and conducting physical model experiments aligned with the Shields curve. Subsequently, the study reveals the flow patterns of the improved device and the distributions of bed shear stresses.
2 Materials and methods
2.1 Improvement and validation of the erosion device
2.1.1 Improvement of erosion device
During experimental procedures, the improved device apparatus often generated vortices when using the planar shear disc at specific flow rates and low rotational speeds. Vortices, resulting from the interaction between the shear disc and water inflow/outflow, cause sediment to accumulate around the central axis, forming a tornado-like structure. Simultaneously, Optical Backscatter Sensors (OBS) detect changes in sediment concentration. It is crucial to note that the sediment surface does not undergo complete erosion, significantly affecting the accuracy of the erosion experiments. Figure 2 shows that the experimental material used was quartz sand with a median diameter (D50) of 185 µm. The left panel corresponds to a flow rate (Q) of 1.3 L/min and a rotational speed of 15 RPM, distinctly indicating the presence of vortices in the central region. The right panel, associated with a flow rate of 1.8 L/min and a rotational speed of 10 RPM, reveals an earlier onset of vortex formation with increasing flow rates.

Figure 2. Experimental erosion response of quartz sand by Modified Microcosmic. (A) Disk rotating speed = 15 rpm, Q = 1.3 L/min. (B) Disk rotating speed = 15 rpm, Q =1.8 L/min.
In the course of intake design revision, two phases were undertaken. In the first phase, a transition from a flat and straight rotating disk configuration (Figure 3A) to a bell shape (Figure 3B). In other words, the intake size was gradually enlarged from I.D. = 9 mm to several selected size in order to reduce intake velocity and the associated low pressure at bottom center. Despite two attempts has been made, this approach failed as substantial vortices persisted, as well as the liquefaction at the bottom center. It is realized that the small distance between the original I.D. and the enlarged bell-shape mouth cannot effectively reduce the maximum intake speed at the intake center.
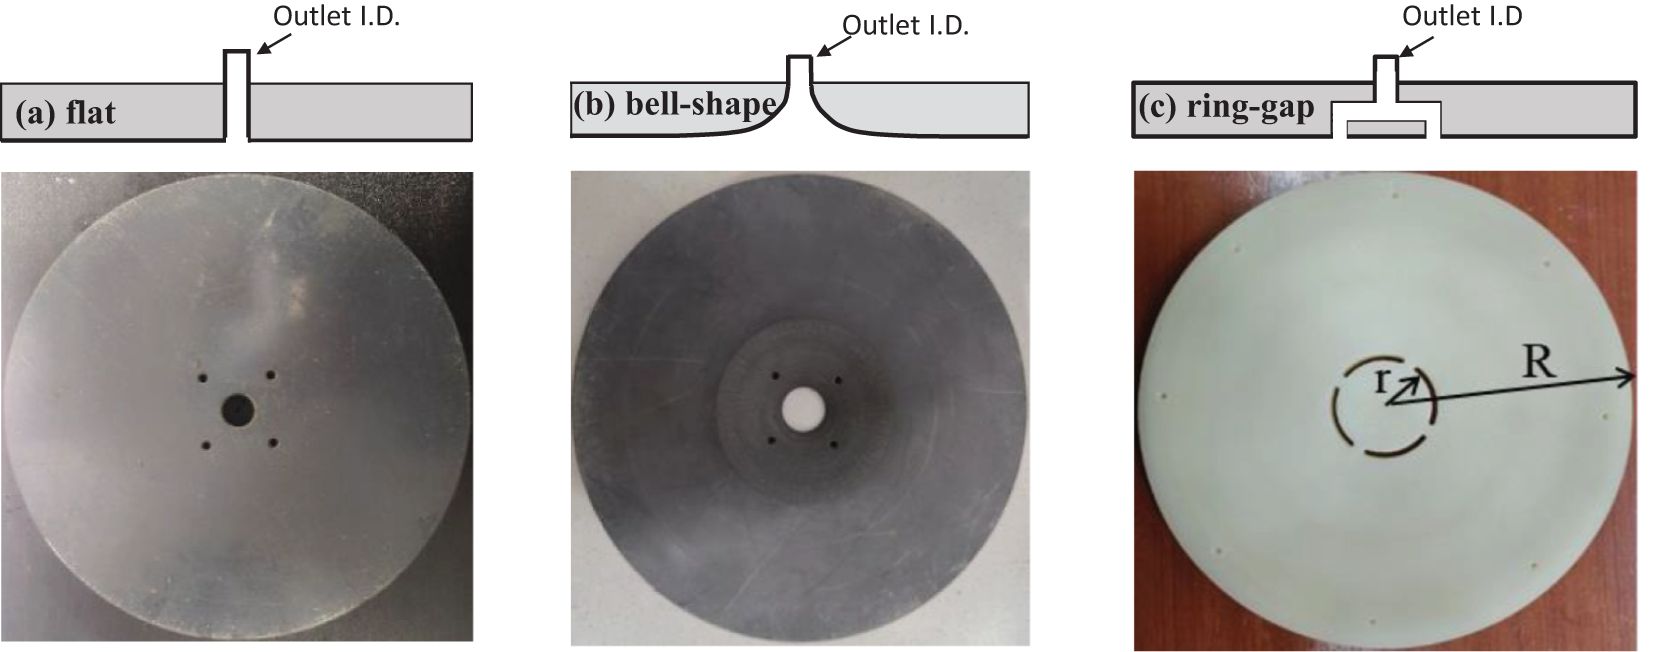
Figure 3. Different design of the rotating disk for checking the bottom pressure distribution. Outlet I.D. for subfigure (A, B) are 9 mm. For subfigure (C), it is 16 mm. In sub-figure c, r = R/5 = 25 mm and the gap is 3 mm.
In the second phase, a completely new intake geometry (i.e., a ring shape intake) was selected, as shown in Figure 3C. The ring geometry has a gap = 3mm and a radial distance = 1/5R = 25 mm. This geometry practically changes the intake cross section from 63 mm2 (I.D. = 9 mm) to 470 mm2. It effectively and significantly reduces the intake velocity, which corresponds to a lower pressure drop, and thus, eliminates the liquefaction at the bottom that under intake.
Further investigation revealed that eliminating inflow-outflow water while maintaining shear plate rotational speed prevented the formation of a central vortex. In response, this study focuses on redesigning and refining the shear plate to mitigate the central vortex by altering the inflow-outflow water configuration.
2.1.2 Validation of the improved erosion apparatus
(1) Introduction to Homemade Indoor Pressure Measurement Device.
Due to the combined effects of shear plate cutting and water inflow-outflow, various pressure gradients appear on the experimental sediment surface, leading to vortex formation. As a result, developing a pressure measurement device is essential to quantify the pressure distribution across the sediment’s working surface. This effort aims to validate the increased effectiveness of the modified shear plate.
A pressure measurement device is essential to quantify the effect on pump intake design that causes pressure drop around the bottom center of intake. Since the flow applied in the erosion chamber is a steady flow, a simple pitot tube that measures the change of water elevation can be used to show the pressure.
Figure 4 shows the setup of the homemade simple pressure measurement device. To obtain better pressure gradients in the radial direction along the bottom, seven sets of copper tubes were positioned at specific locations: the center (r = 0), r = R/16, R/8, 3R/16, R/4, R/3, and 2R/3, respectively. The change of water surface elevations on these seven glass tubes was observed and recorded manually.
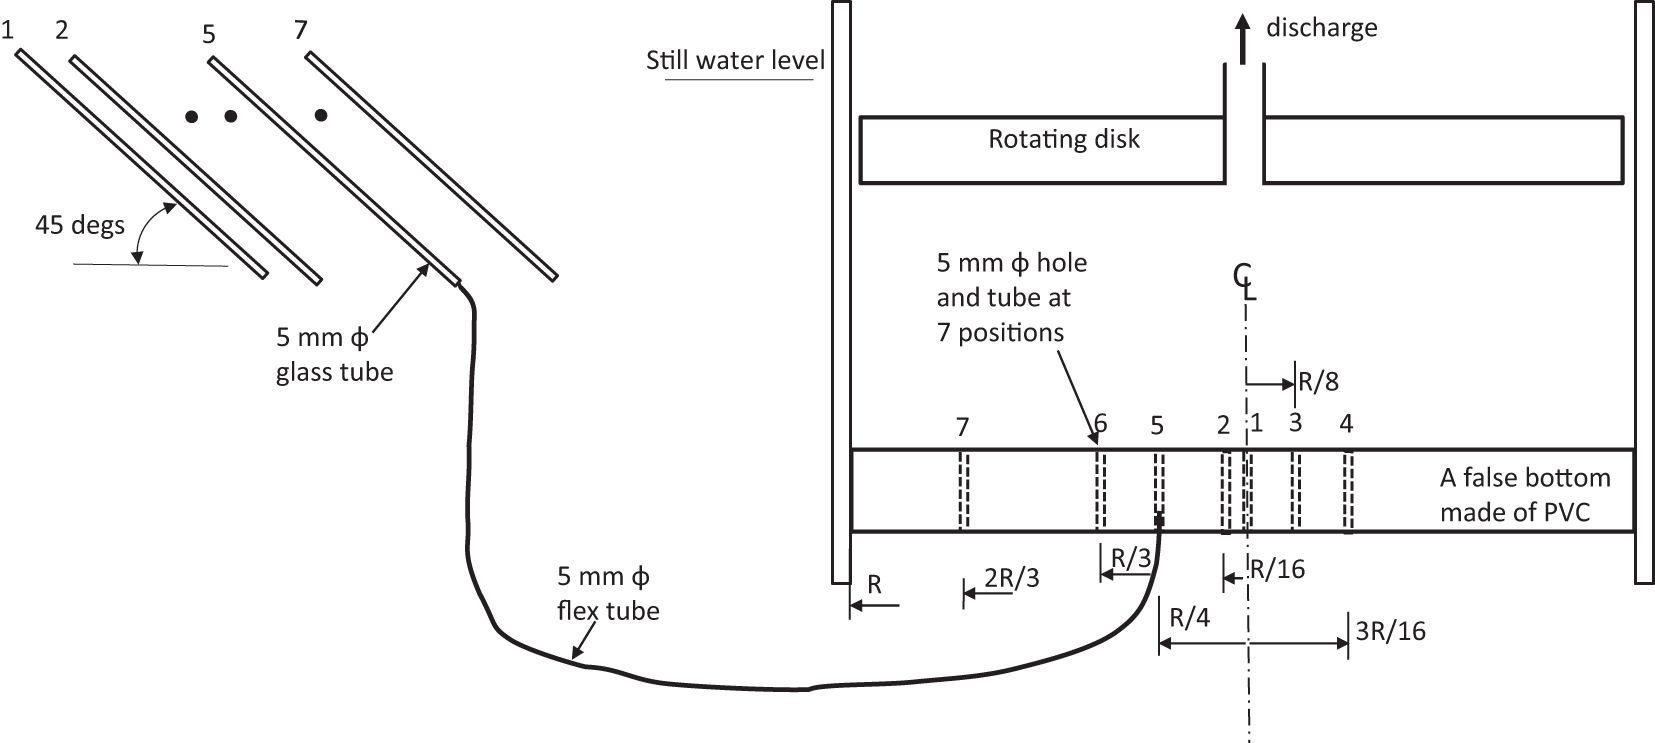
Figure 4. Conceptual drawing to show the pressure measurements on the device’s bottom (i.e., the seabed elevation) by using a false bottom made of PVC and simple Pitot tubes at 7 locations. The first measurement location is at the center. The pitot tubes are inclined at 45 degrees to increase the resolution of measurements.
(2) Experimental Procedure for Pore Water Pressure Measurements.
a). Before starting the experiment, carefully remove any air bubbles from the glass and silicone tubes.
b). Position the glass tube at a 45° tilt, ensuring the liquid level is parallel to that in the improved device apparatus, and record the initial dataset, which includes 7 static pressure values.
c). Gradually adjust the shear plate’s rotation speed from 5 RPM to 60 RPM in 5 RPM increments (12 levels in total), recording data at each setting and maintaining a 10-minute interval between adjustments to ensure data stability.
d). Ensure all glass tubes are uniformly tilted at 45° to improve the clarity of pressure measurements. While achieving consistent liquid levels in all runs may be challenging, ensure each experimental set maintains identical liquid levels in all tubes.
The spatial arrangement between the ring-shaped outflow and the center, as well as pore size considerations, significantly influences the bottom shear stress and its distribution. Understanding these factors thoroughly requires implementing numerical modeling techniques.
These steps highlight the systematic and precise execution of the pressure measurement experiment, ensuring data integrity and facilitating its dissemination in scholarly publications.
2.2 Numerical simulation investigation utilizing FLUENT
2.2.1 Basics of FLUENT model
FLUENT is a commercially available three-dimensional (3-D) Computational Fluid Dynamics (CFD) software which is capable of simulating many complex hydrodynamic processes that are incompressible and isothermal Newtonian fluid flows (Yan et al., 2023). It solves the momentum equation and the continuity equation with the k-ε turbulence model. The version applied in this study is version 6.3 (Fluent Inc., 2006). Since it is a commercially available software and details of the model can be found in the FLUENT User’s Guide, no details will be repeated here, only the special features of the improved device, the boundary conditions, and the initial conditions for the proposed device are given next.
All the aforementioned equations were converted to segregated formulations and solved using a finite-volume technique. A second-order upwind scheme was employed for the numerical simulations. As the benthic chambers exhibit two-dimensional axisymmetric flow, significant reductions in computation time are achieved. The enhanced wall treatment method was selected for modeling the near-wall region to bridge the gap between the viscosity-affected region and the fully turbulent region (Galvan et al., 2011).
2.2.2 Model setup for simulating the flow in the improved device
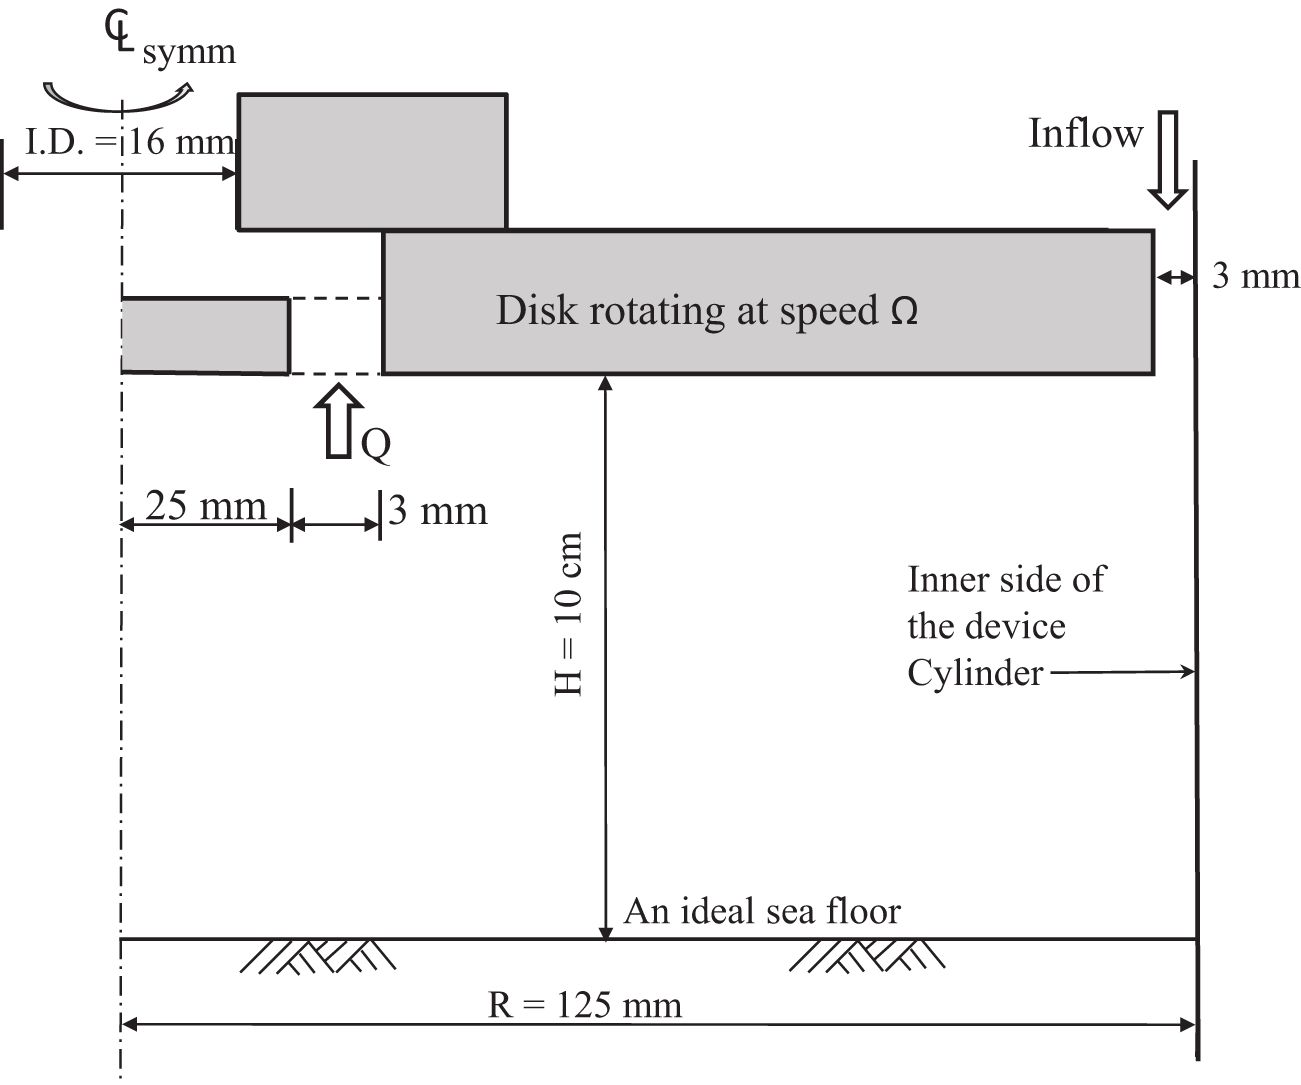
The modeling domain for simulating axially symmetrical flow in the improved device is shown in Figure 5. The distance between the rotating disk and an ideal sea floor is 10 cm and the disk rotates at a selected constant speed, Ω. Water is pumped out from the center at a rate Q with a pipe I.D. = 9 mm, and this pumped-out water is all allowed to flow back into the erosion chamber (after a proper settling in a still water bath, and then through the gap between the rotating disk and improved device’s outer wall) as ambient water. The top and bottom corners near the chamber wall and the center area all have fine meshes for more details. The model comprises 65,563 quadrilateral cells, 66,148 nodes, and 130,542 2-D interior faces in total.
The three boundary conditions are (1) the disk rotating at speed Ω, i.e., at z = 10 cm and 4.5 mm < r < 12.2 mm, the tangential velocity, uθ = rΩ, the vertical component, uz = 0, and the radial component, ur = 0. Between r = 0 and r = 4.5 mm, the sum of uz contributes to the discharge rate Q. Between 12.2 mm < r < 12.5 mm, the uz also contributes to the discharge rate Q, but with their direction opposite to that at the center; (2) At r = 12.5 mm, uθ = uz = ur = 0; and (3) At z = 0, the idealized sediment surface, uθ = uz = ur = 0.
The initial condition is that there is no flow anywhere at the beginning, i.e., uθ = uz = ur = 0 when t = 0. These steps are crucial for determining the effectiveness of the new intake design, which will be further evaluated in the subsequent results section.
3 Results
3.1 Pressure measurement experimental results for the improved device
Although many configurations on the intake revision have been tested, only three measurements (i.e., the original flat, Figure 3A; the bell shape, Figure 3B; and the Ring-gap, Figure 3C) of the pressure distribution on the bottom were presented because they represent the best attempt at that time. Experimental results for Q = 1.8 L/min and Ω = 20 RPM (Figure 6A) show that both the flat and bell-shaped disks exhibit significant negative pressure at the bottom center (which is also the center of intake). Upon increasing the rotational speed to Ω = 60 RPM (Figure 6B), only the ring-gap disk remains effective, with a negligible central negative pressure, while the other disk configurations demonstrate strong negative pressure at center. Notice that when far away from the intake center, i.e., r >> 0, the negative pressure on bottom remains negligible small. The negative pressure on the bottom under the pump intake and the zero pressure when far away from the center also produce a strong pressure gradient near the center. These two forces must cause sediment liquefication at the bottom center.
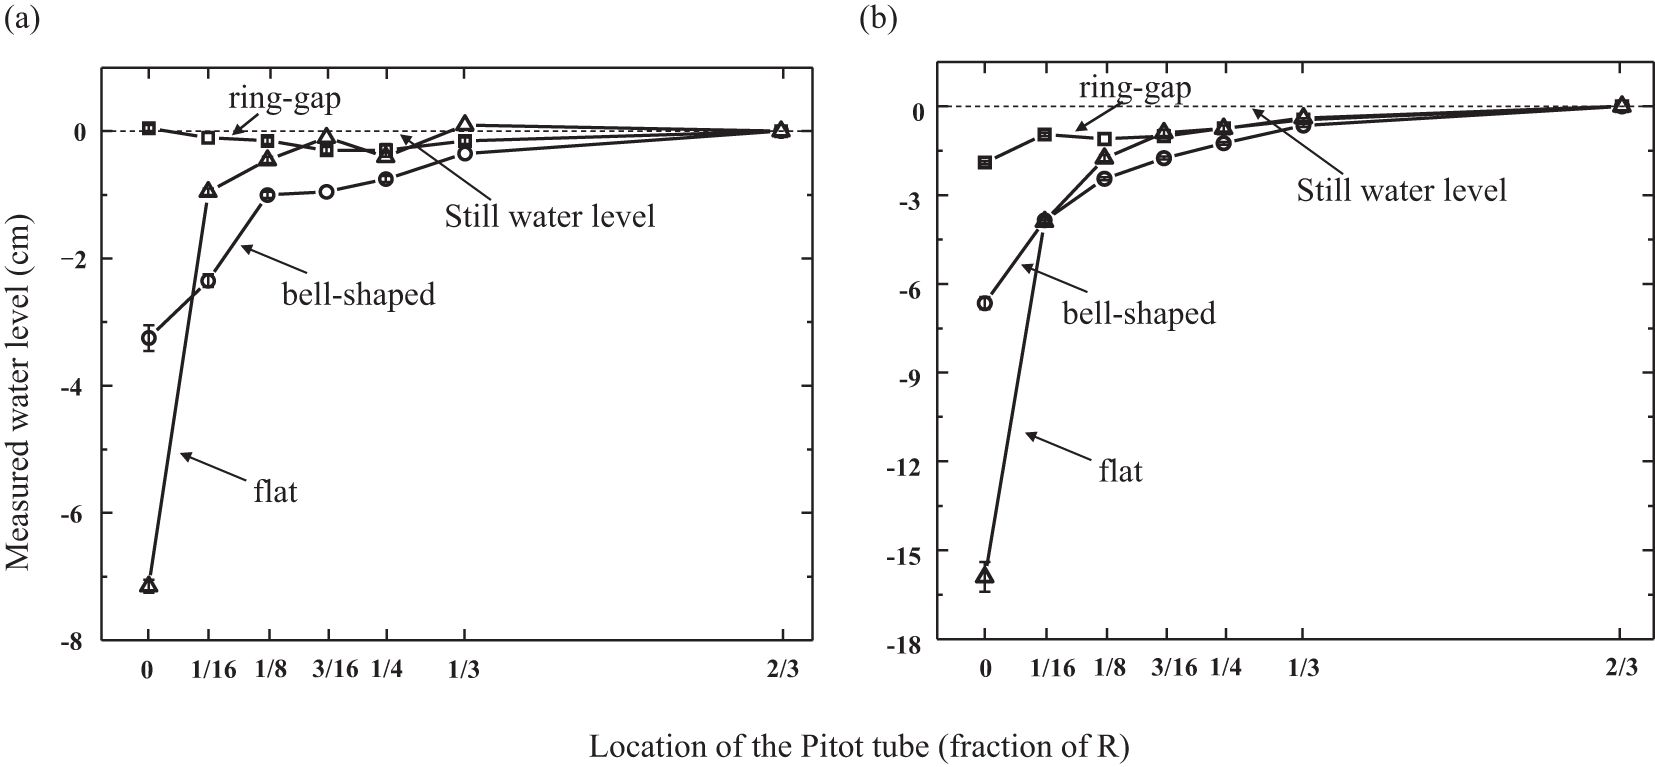
Figure 6. Measured pressure on the sediment surface (or chamber bed) for different shape of the rotating disk. (A) Disk rotating speed = 20 rpm, Q = 1.8 L/min. (B) Disk rotating speed = 60 rpm, Q =1.8 L/min.
The comparison of bed shear stress distributions in two different benthic erosion chambers, all having similar average bed shear stresses (Figure 7), indicates that the improved device exhibits a superior uniformity in τb distribution. The highest bed shear stress of the improved device was less than 25% higher than the average. If excluding the two locations with nearly zero values next to the device’s center and wall, this difference becomes even more pronounced. This demonstrates τa can be used to represent the entire bed shear stress reasonably well except near the center and the side boundary.
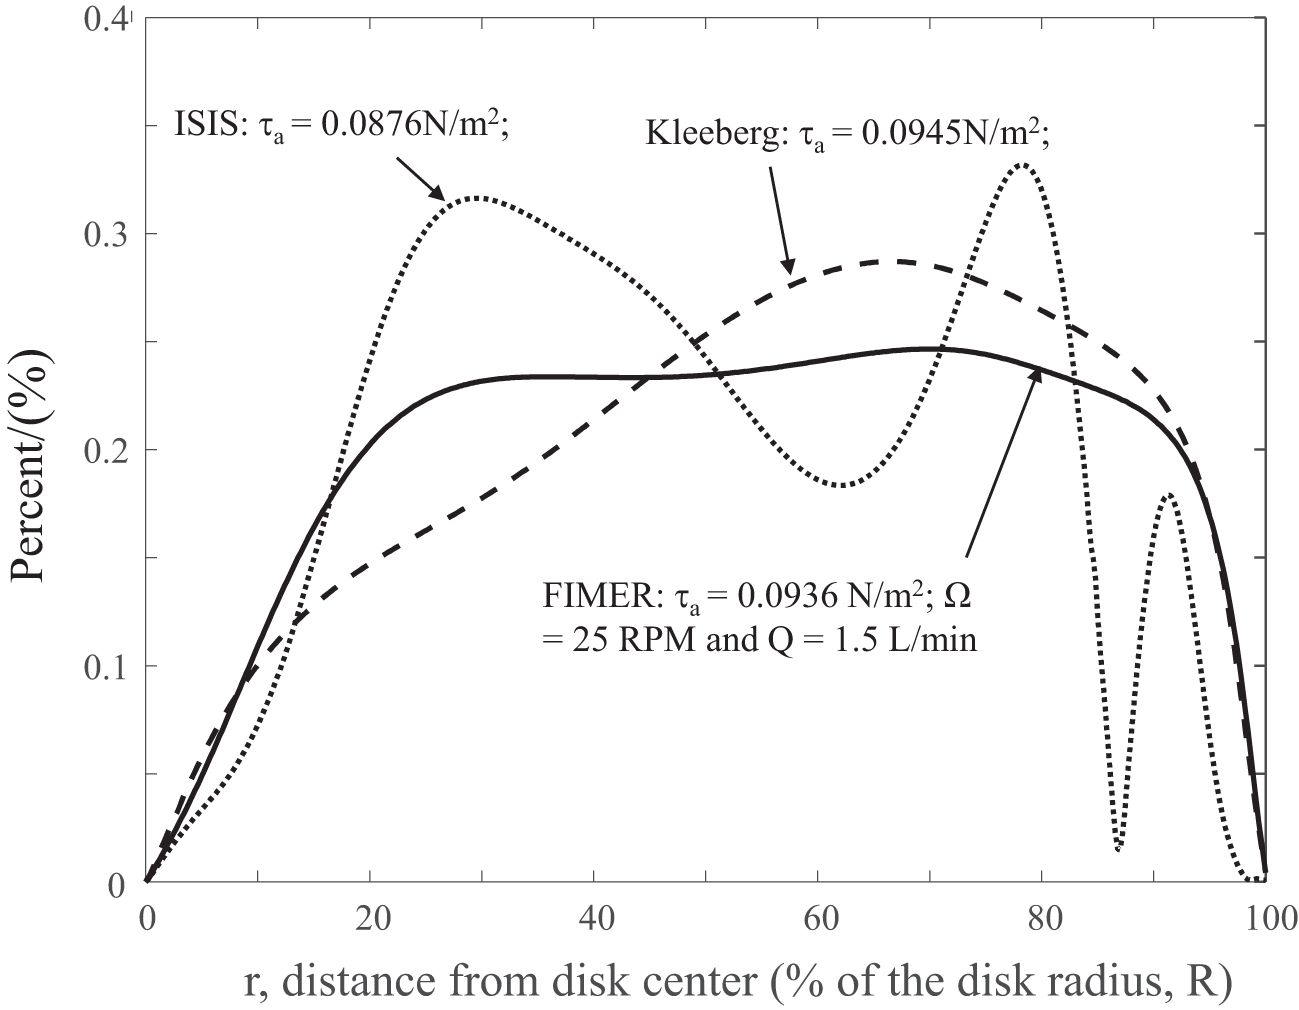
Figure 7. Comparison of model simulated bed shear stress (τb) distribution of two different benthic erosion chambers. The average bed shear stress in the radial direction (τa) across the disk radius, R, is also marked.
It is possible to exclude those area that τb is much small then τa (e.g., for the area that τb < 0.8 τa and redefine τan as the new average bed shear stress to measure the sediment bed response, a slightly different critical bed shear stress for erosion and the erosion rate may be resulted. As a rough estimate of the near-center area (~ 11 cm2 for r < 0.15R) and near the wall area (~ 38 cm2 for 0.96R < r < R) for a total area about 49 cm2 which is about 10% of the entire erosion area. This is something that can be addressed later, but worth to point out at this stage.
3.2 FLUENT simulation findings
Over 100 cases were simulated using FLUENT with varying Ω and Q. The challenge lies in selecting an optimal combination of Ω and Q in order to achieve uniform bed shear stresses (τa) that meet the requirements for erosion experiments. Therefore, a method for evaluating bed shear stress distribution must be determined, and the following steps: 1)Select 501 locations on the idealized bed surface that are equally spaced from the improved device’s center (i.e., r = 0) and the inner wall (i.e., r = rmax = 12.5 cm); 2) Linear interpolation of bed shear stresses is performed at these 501 locations based on the simulation results; 3) Calculate the 500 bed shear stresses that are between two consecutive locations; 4) Sum the 500 bed shear stresses and use this sum as a basis to normalize these stresses. Meanwhile, find the average of those 500 bed shear stresses; 5) Normalize the 501 vector values to percentages by dividing by the maximum radius value to compare results from chambers of different radii; 6) Determine the standard deviation of the normalized bed shear stresses, with the smallest value indicating the most desirable outcome.
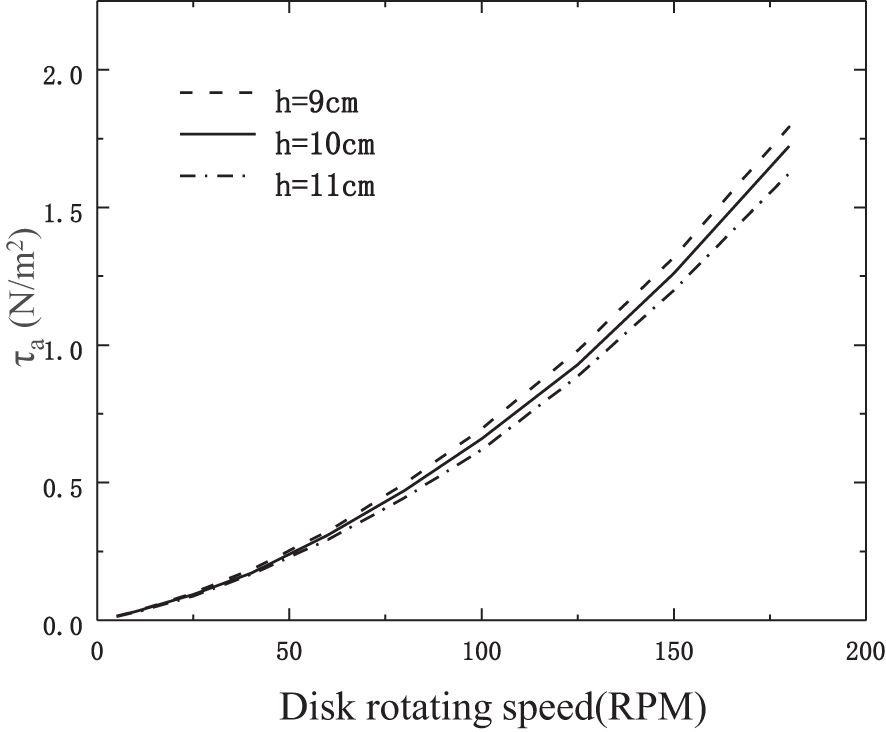
For each Ω, a corresponding Q is incorporated to find the shear stress distributions and the associated standard derivations. In this study, the relationship between τa and Ω can be reasonably described by a quadratic function (τa = 4x10-05 Ω² + 0.0031 Ω - 0.0039). Because Q can also be varied with Ω, another quadratic function (Q = 3x10⁻⁸ Ω² + 0.0058 Ω + 1.3299) was established. A decreasing trend in the standard deviation with increasing Ω indicates that the bed stress becomes more uniform as the disk’s rotational speed increases.
4 Discussion
The recent updates to the FIMER device have notably enhanced its performance. The introduction of a ring-shaped shear plate has successfully addressed concerns regarding central negative pressure and vortex formation, resulting in more dependable and precise erosion threshold determination. Additionally, we have identified optimal combinations of rotational speed (Ω) and discharge (Q) through comprehensive FLUENT simulations, thereby contributing to the attainment of consistent bed shear stresses.
4.1 Erosion experiment with non-cohesive sediment in the FIMER apparatus
To validate the mathematical model results, physical experiments were conducted using a laboratory version of the FIMER apparatus In the lab-FIMER, a false bottom made of a 1” thick PVC plate was inserted to substitute for the sea floor or to carry a selected sediment above. This false bottom can be jacked up or lower down so that the distance between the rotating disk and the top of the PVC plate (or the top of the sand bed) is 10 cm. For this verification test, a layer of quartz sand with eight selected median sand sizes (from 0.089, 0.107, 0.15, 0.186, 0.27, 0.833, 0.954 and 1.651 mm) were successively placed on top of the false bottom, one size at a time, and the average bed shear stress was gradually increased stepwise to check when the sand starts moving. This facilitated the measurement of the critical bed shear stress for incipient motion. These results were compared with the Shields diagram, a well-established empirical relationship between the Gain Reynolds Number, and the critical bed shear stress for incipient motion. The experimental findings (Figure 8), show reasonable agreement, and thus, warrant the model simulating results.
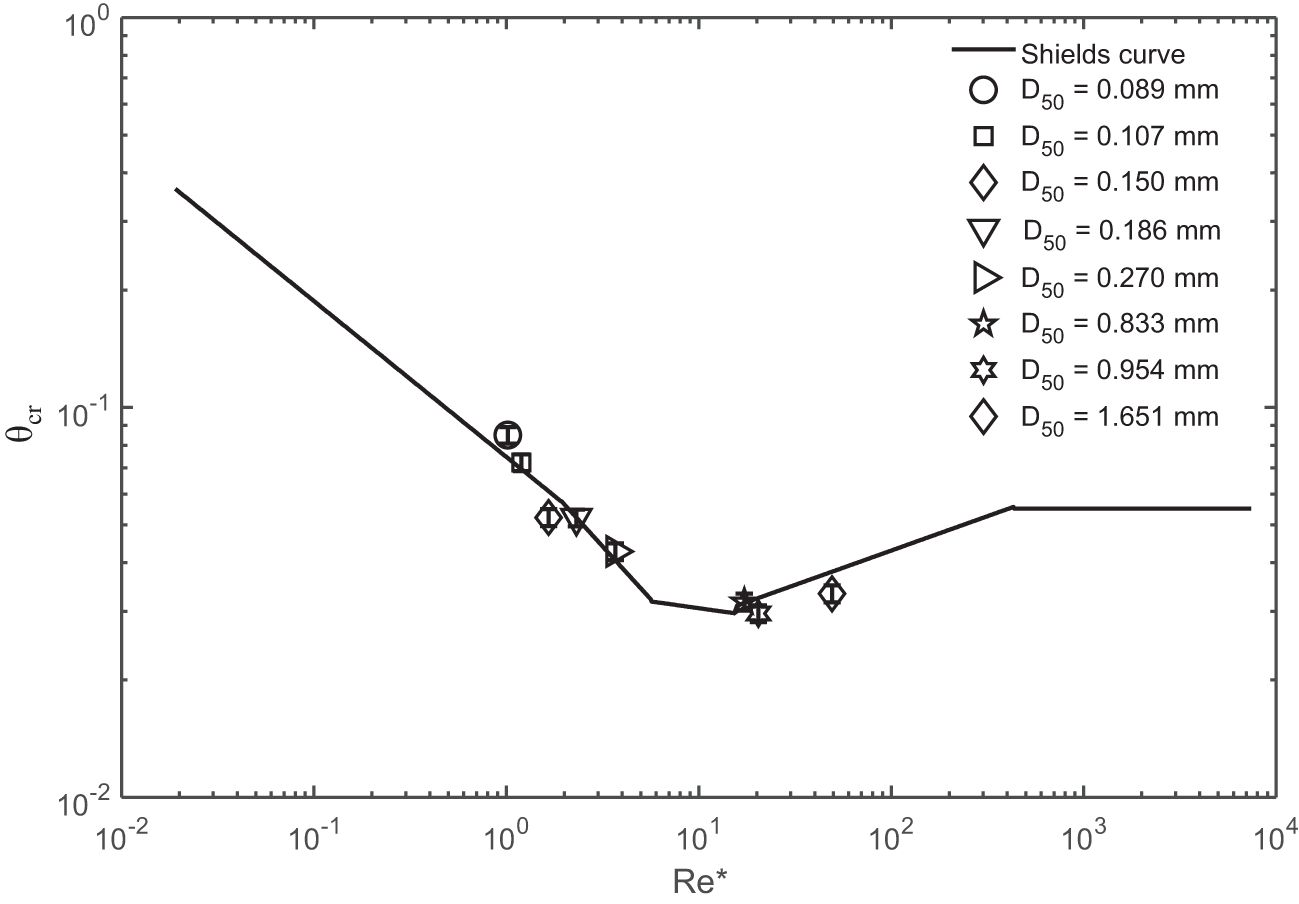
Figure 8. Comparison of the measured non-dimensional average bed shear stress for incipient motion, θcr, in the laboratory version of the FIMER with that from the Shields diagram given by Van Rijn (2007). The eight selected quartz sandy sediments were also marked.
The findings demonstrate a significant concordance between the results from the FIMER apparatus and those derived from the Shields curve. This alignment underscores a high level of consistency between the numerical model outcomes and experimental observations, affirming the reliability of the numerical model. Consequently, these results can be confidently applied for experimental purposes.
4.2 Sensitivity analysis of the FIMER apparatus using the FLUENT numerical model
Although suitable pumps and motors will be used to generate the specified Q and Ω, discrepancies between designed and actual values may occur due to limitations in accuracy. For this reason, sensitivity tests were conducted to check the tolerance. As shown in Figure 9, a 5% difference of discharge may cause a maximum of 2.6% difference on τa, while 5% difference of disk speed may cause a maximum of 13.4% difference on τa. This suggests that the accuracy of the disk motor impacts FIMER performance more significantly than that of the pump motor. Although Ω is more sensitive than Q, the impact of Q on FIMER performance is essential and cannot be omitted (Figure 10). Without the discharge, i.e., Q = 0, the bed shear stress distribution would be unacceptable for carrying out an erosion experiment.
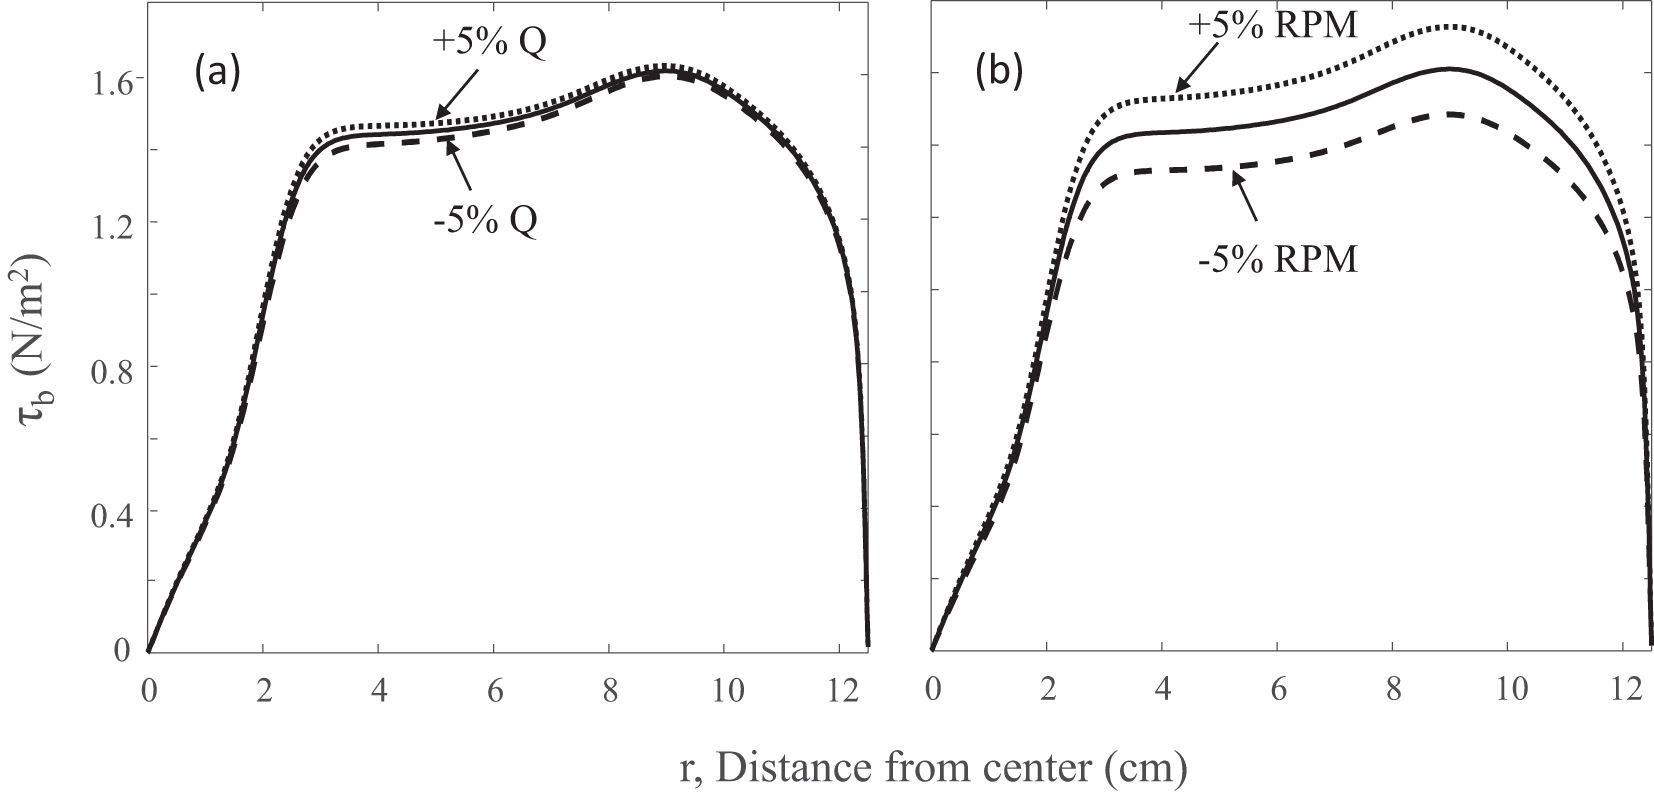
Figure 9. Sensitivity tests to show the effect of changing the pumping discharge and disk rotating speed on the designed bed shear stress profile. The designed operation condition is Ω = 150 rpm and Q = 2.2 L/min. (A) Only when Q changed, and (B) only when Ω changed.
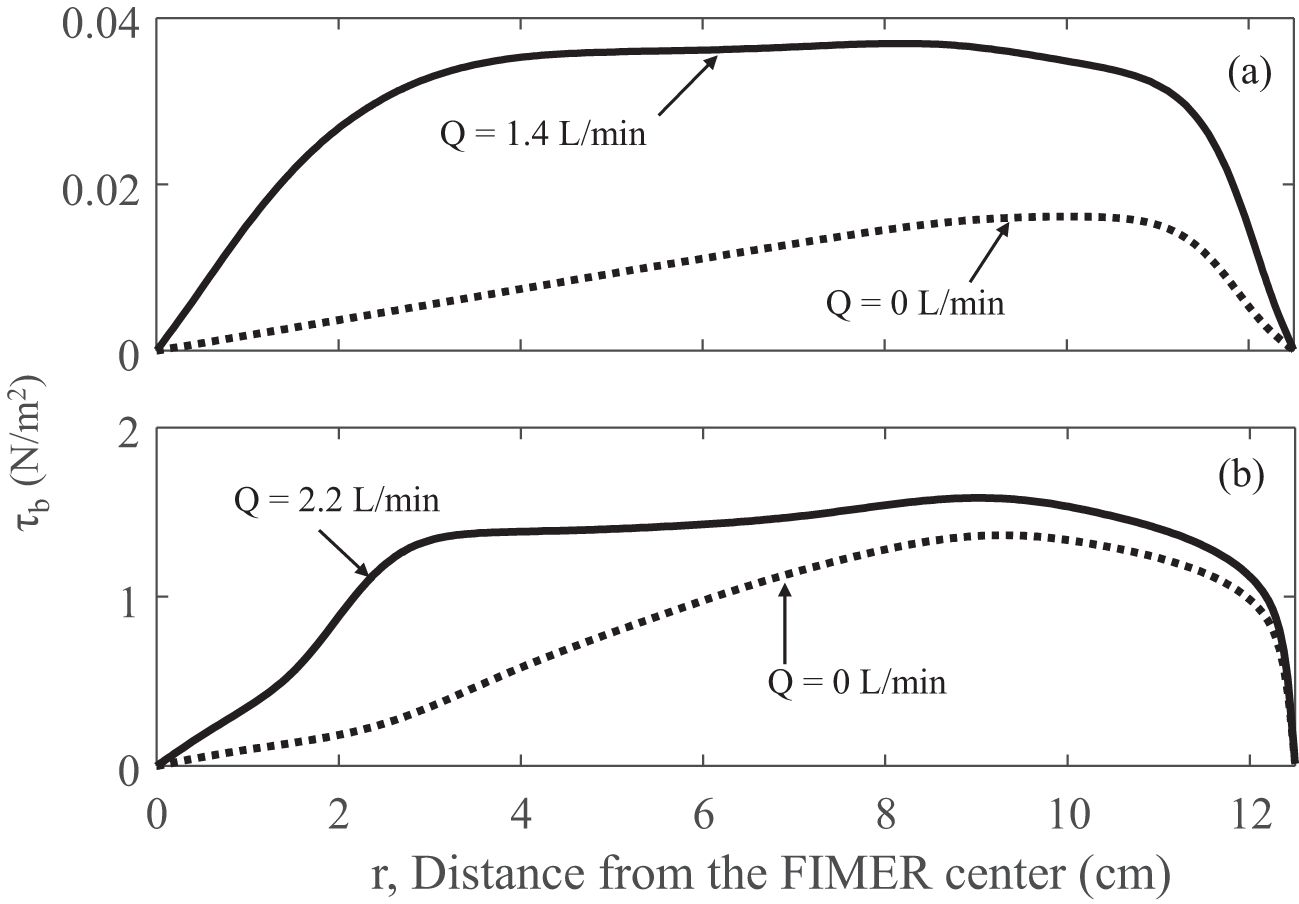
Figure 10. Model simulated bed shear stress distribution for selected operation conditions: (A) Ω = 10 RPM with the optimum discharge Q = 1.4 L/min and (B) Ω = 150 RPM and Q = 2.2L/min. Profiles without discharge (Q = 0) are also included to show the importance of Q.
When applying the FIMER in the field, the actual seafloor may not be perfectly smooth. While a three-dimensional FIMER model that reflects the actual seafloor topology is an ideal but not a practical practice because too many possible scenarios. Utilizing an idealized seafloor remains a practical approach at this stage. Nevertheless, the distance between the rotating disk and the seafloor may vary due to a not-perfect-deployment because the sediment bed is too soft or too hard. Erosion can also result in a depth change, e.g., up to 1 cm if the critical shear stress reaches 0.8 N/m². For this reason, the model is employed to calculate the bed shear stress at three different depths: 9 cm, 10 cm, and 11 cm. The result (Figure 11) is not meant to be a sophisticated evaluation but rather aims to demonstrate a minor difference of about 5%.
4.3 Application of cohesive sediment in the FIMER erosion device
Erosion experiments were conducted with a commercially available cohesive sediment, kaolinite, at three consolidation times (12, 24, and 48 hours). The experimental results (Figure 12) demonstrate that the device consistently produces realistic outcomes. Notably, as consolidation time increases, the critical shear stress of the kaolinite bed rises. The slight increase of Suspended Sediment Concentration (SSC) at the few initial bed shear stresses also indicates the existence of a small fluffy layer, even under the total calm water consolidation. This indicates that in terms of erosion rate, the device accurately reflects the erosion effects.
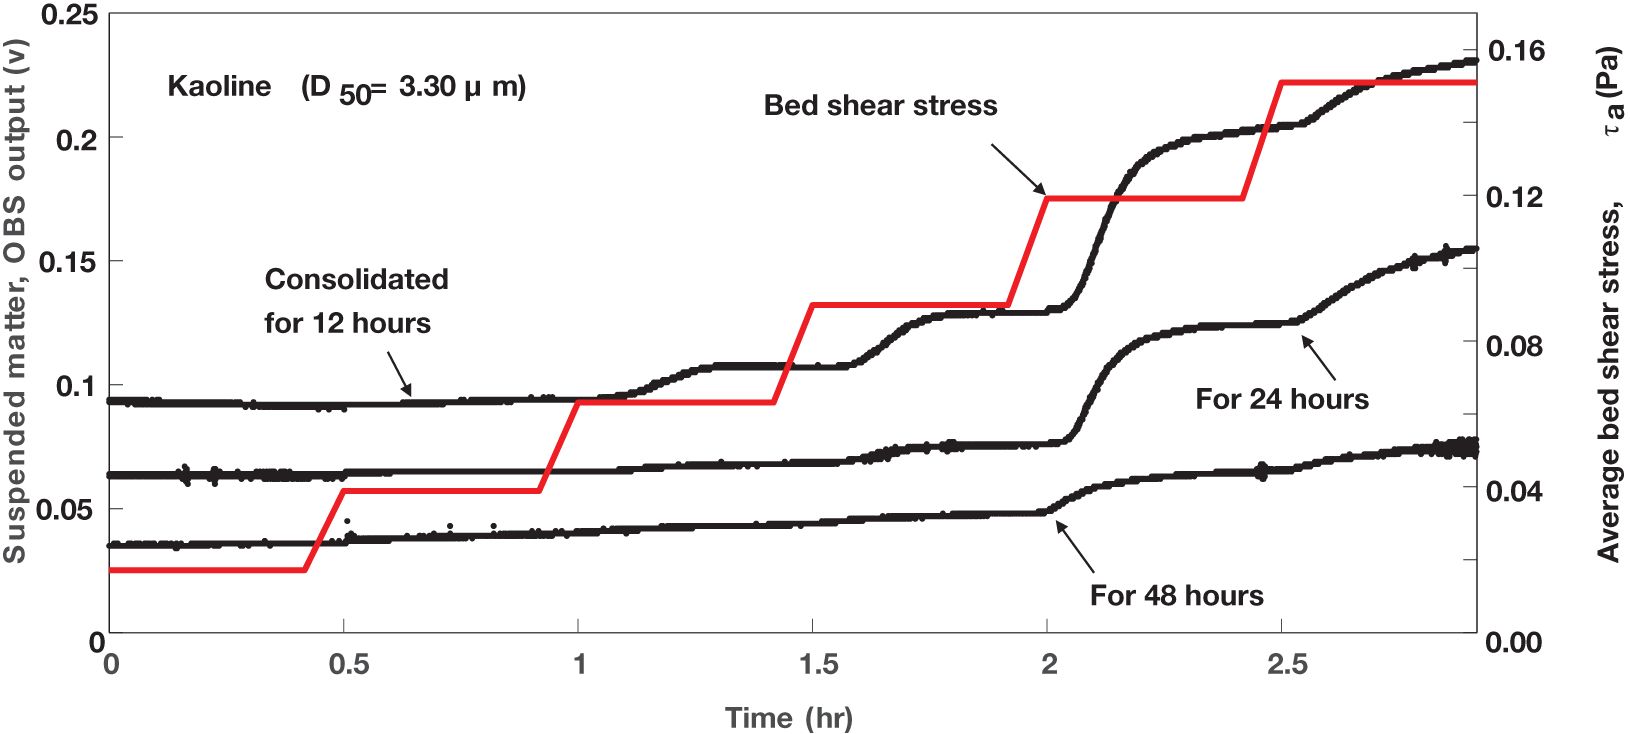
Figure 12. Results of three erosion tests using a commercially available kaolinite with three different consolidation periods. The applied average bed shear stress are all the same, and the sediment before each experiment were totally stirred up and then consolidated for the specified consolidation period.
5 Conclusions
After conducting thorough validation through experimental observations and numerical simulations, we have achieved significant and highly promising results. The enhanced FIMER device has demonstrated superior performance in both controlled laboratory settings and simulated environments, indicating its potential for future applications in field experimental research. Notably, the incorporation of a ring-shaped shear plate and the determination of optimal operational parameters through extensive FLUENT simulations have effectively addressed previous limitations, resulting in more accurate and reliable erosion threshold determinations. As a result, the upgraded FIMER device has emerged as a crucial tool for advancing sediment erosion studies across various environmental conditions. This study demonstrates the approach to finding the correct design of an automatic Field Instrument for Measure Erosion Responses (FIMER). A Laboratory version of the FIMER is also constructed to confirm and enhance the FLUENT model results. This study confirmed a small bed liquefaction area at the bottom center and a solution (i.e., using a ring-gap intake) was found to eliminate that problem. Numerical investigations using the FLUENT model validated the distribution of bed shear stress in the FIMER. The disk rotational speed, Ω, and the flow pumping out rate, Q, are two pivotal parameters for determining the distribution of bed shear stress. A quadratic relationship between the average bed shear stress, τa, and Ω, along with the associated Q, was identified. This study demonstrates that a highly uniform bed shear stress distribution in FIMER can be achieved by judiciously selecting the Ω and Q. This numerical study also shows encouraging results that a 10% variation in the depth between the rotating disc and the seabed only leads to a 5% change in the average bed shear stress.
The success developed and use of the lab-FIMER provide evidence to support the numerical model results, explain the reason of having bed liquefaction at the bottom center area, and more importantly, it helps to find the solution for removing the sediment liquefaction problem. This further concluded that the FIMER is capable of characterizing the erosion properties of cohesive sediments and setting the stage for future in-situ experiments.
Data availability statement
The original contributions presented in the study are included in the article/supplementary material. Further inquiries can be directed to the corresponding author.
Author contributions
YS: Conceptualization, Formal Analysis, Methodology, Writing – original draft. ZZ: Data curation, Investigation, Validation, Writing – original draft. YT: Data curation, Visualization, Writing – original draft. WZ: Funding acquisition, Project administration, Resources, Writing – review & editing. J-YM: Software, Supervision, Writing – review & editing.
Funding
The author(s) declare that financial support was received for the research, authorship, and/or publication of this article. This research was supported by the National Natural Science Foundation of China (U2040203) and National Key Research and Development Program of China (2024YFE0101000).
Conflict of interest
The authors declare that the research was conducted in the absence of any commercial or financial relationships that could be construed as a potential conflict of interest.
Publisher’s note
All claims expressed in this article are solely those of the authors and do not necessarily represent those of their affiliated organizations, or those of the publisher, the editors and the reviewers. Any product that may be evaluated in this article, or claim that may be made by its manufacturer, is not guaranteed or endorsed by the publisher.
References
Amos C. L., Daborn G. R., Christian H. A., Atkinson A., Robertson A. N. D. A. (1992). In situ erosion measurements on fine-grained sediments from the Bay of Fundy. Mar. geol. 108, 175–196. doi: 10.1016/0025-3227(92)90171-D
Andualem T. G., Hewa G. A., Myers B. R., Peters S., Boland J. (2023). Erosion and sediment transport modeling: a systematic review. Land 12, 1396. doi: 10.3390/land12071396
Dunne K. B., Arratia P. E., Jerolmack D. J. (2022). A new method for in situ measurement of the erosion threshold of river channels. Water Resour. Res. 58, e2022WR032407. doi: 10.1029/2022WR032407
Galvan S., Reggio M., Guibault F. (2011). Assessment study of K-ε turbulence models and near-wall modeling for steady state swirling flow analysis in draft tube using fluent. Eng. Appl. Comput. Fluid Mech. 5, 459–478. doi: 10.1080/19942060.2011.11015386
Grabowski R. C., Droppo I. G., Wharton G. (2011). Erodibility of cohesive sediment: The importance of sediment properties. Earth-Sci. Rev. 105, 101–120. doi: 10.1016/j.earscirev.2011.01.008
Gust G., Muller V. (1997). “Interfacial hydrodynamics and entrainment functions of currently used erosion devices,” in Cohesive Sediments. Eds. Burt N., Parker R., Watts J. (Wiley, Chichester, UK), 149–174.
Ha H. K., Maa J. Y. (2009). Evaluation of two conflicting paradigms for cohesive sediment deposition. Mar. Geol. 265, 120–129. doi: 10.1016/j.margeo.2009.07.001
Hanson G. J., Simon A. (2001). Erodibility of cohesive streambeds in the loess area of the midwestern USA. Hydrol. processes 15, 23–38. doi: 10.1002/hyp.v15:1
He C., Taylor J. N., Rochfort Q., Nguyen D. (2021). A new portable in situ flume for measuring critical shear stress on river beds. Int. J. Sediment Res. 36, 235–242. doi: 10.1016/j.ijsrc.2020.08.004
Kim D. H., Hwang J. H. (2023). Estimating bed shear stress distribution over bottom of a channel on the moving vessel. Ocean Sci. J. 58, 3. doi: 10.1007/s12601-022-00095-7
Kimiaghalam N., Clark S. P., Ahmari H. (2016). An experimental study on the effects of physical, mechanical, and electrochemical properties of natural cohesive soils on critical shear stress and erosion rate. Int. J. Sediment Res. 31, 1–15. doi: 10.1016/j.ijsrc.2015.01.001
Kleeberg A., Hupfer M., Gust G. (2008). Quantification of phosphorus entrainment in a lowland river by in situ and laboratory resuspension experiments. Aquat. Sci. 70, 87–99. doi: 10.1007/s00027-007-0935-9
Kulesza S. E., Mathis M. A., Alarcon V. J., Sassenrath G. F. (2024). Critical shear stress variability in claypan soils with depth. J. Soil Water Conserv. 79, 66–77. doi: 10.2489/jswc.2024.00099
Kwon J. I., Maa J. P. Y., Lee D. Y. (2003). “A preliminary implication of the constant erosion rate model to simulate turbidity maximums in the York River, Virginia, USA,” in Estuarine and Coastal Fine Sediment Dynamics INTERCOH, 321–344.
Liu H., Jia Y., Zhang S., Shan H., Xue L., Sun Z., et al. (2023). Field measurement of the erosion threshold of silty seabed in the intertidal flat of the Yellow River Delta with a newly-developed annular flume. Front. Mar. Sci. 10, 1177241. doi: 10.3389/fmars.2023.1177241
Maa J. P. Y. (2008). Sediment erosion characteristics in the Anacostia River. J. Hydraul. Eng. 134, 1102–1109. doi: 10.1061/(ASCE)0733-9429(2008)134:8(1102)
Maa J. P. Y., Sanford L., Halka J. P. (1998). Sediment resuspension characteristics in Baltimore harbor, Maryland. Marine Geology. 146 (1-4), 137–145. doi: 10.1016/S0025-3227(97)00120-5
Maa J. P.-Y., Wright L. D., Lee C.-H., Shannon T. W. (1993). VIMS sea carousel: A field instrument for studying sediment transport. Mar. Geol. 115, 271–287. doi: 10.1016/0025-3227(93)90056-2
Nafchi R. F., Samadi-Boroujeni H., Vanani H. R., Ostad-Ali-Askari K., Brojeni M. K. (2021). Laboratory investigation on erosion threshold shear stress of cohesive sediment in Karkheh Dam. Environ. Earth Sci. 80, 1–15. doi: 10.1007/s12665-021-09984-x
Noack M., Gerbersdorf S. U., Hillebrand G., Wieprecht S. (2015). Combining field and laboratory measurements to determine the erosion risk of cohesive sediments best. Water 7, 5061–5077. doi: 10.3390/w7095061
Partheniades E. (1965). Erosion and deposition of cohesive soils. J. Hydraul. Division 91, 105–139. doi: 10.1061/JYCEAJ.0001165
Shi B. W., Yang S. L., Wang Y. P., Yu Q., Li M. L. (2014). Intratidal erosion and deposition rates inferred from field observations of hydrodynamic and sedimentary processes: a case study of a mudflat–saltmarsh transition at the Yangtze delta front. Continent. Shelf Res. 90, 109–116. doi: 10.1016/j.csr.2014.01.019
Van Rijn L. C. (2007). Unified view of sediment transport by currents and waves. I: Initiation of motion, bed roughness, and bed-load transport. J. Hydraul. Eng. 133 (6), 649–667. doi: 10.1061/(ASCE)0733-9429(2007)133:6(649)
Wang Y. C., Hung R. Y. (2023). Effects of sediment properties on the erosion resistance of natural cohesive soils in Taiwan. Catena 223, 106950. doi: 10.1016/j.catena.2023.106950
Williamson H. J., Ockenden M. C. (1996). “Tidal transport of mud/sand mixtures,” in Field trials at Blue Anchor Bay (HR Wallingford Ltd., Wallingford, Oxon, UK). HR Wallingford Report SR333.
Wright C. L., Friedrichs C. T., Massey G. M. (2022). Controls on sediment bed erodibility in a muddy, partially-mixed tidal estuary. Front. Earth Sci. 10, 805130. doi: 10.3389/feart.2022.805130
Yan J., Zhang L., Xu L., Chen S., Peng G., Wang M. (2023). Three-dimensional numerical simulation of flow structure in annular flume based on CFD study of water. Water 15, 651. doi: 10.3390/w15040651
Keywords: bed shear stress, sediment erosion, field device, laboratory experiments, CFD
Citation: Shao Y, Zhang Z, Tang Y, Zhang W and Maa JP-Y (2024) Improvements and characterization of a microcosmic-based device for sediment erosion. Front. Mar. Sci. 11:1487962. doi: 10.3389/fmars.2024.1487962
Received: 30 August 2024; Accepted: 17 October 2024;
Published: 21 November 2024.
Edited by:
Tingfeng Wu, Chinese Academy of Sciences (CAS), ChinaReviewed by:
Leiping Ye, Sun Yat-sen University, Zhuhai Campus, ChinaJunbiao Tu, Tongji University, China
Hongzhou Xu, Chinese Academy of Sciences (CAS), China
Copyright © 2024 Shao, Zhang, Tang, Zhang and Maa. This is an open-access article distributed under the terms of the Creative Commons Attribution License (CC BY). The use, distribution or reproduction in other forums is permitted, provided the original author(s) and the copyright owner(s) are credited and that the original publication in this journal is cited, in accordance with accepted academic practice. No use, distribution or reproduction is permitted which does not comply with these terms.
*Correspondence: Yuyang Shao, c3l5QGhodS5lZHUuY24=
 Yuyang Shao
 Zhongao Zhang2
 Wei Zhang