- 1Department of Infrastructure Engineering, Faculty of Engineering and Information Technology (FEIT), The University of Melbourne, Melbourne, VIC, Australia
- 2Coastal Engineering Team, Stantec, Melbourne, VIC, Australia
- 3Biodiversity Division, Department of Energy, Environment and Climate Action (DEECA), Melbourne, VIC, Australia
Introduction: This study investigates non-linear surges and extreme wind-wave patterns in Port Phillip Bay (PPB), Victoria, Australia, under both current and projected mean sea level (MSL) scenarios. The research aims to understand the potential impacts of increasing MSL on extreme surges and wind-waves, utilising a combined wave-circulation modelling system (SCHISM-WWMIII).
Methods: This validated coupled model was employed to simulate 32 years of hindcasts (1990-2022) applied to five distinct MSL scenarios: existing, 0.5 m, 0.8 m, 1.1 m, and 1.4 m. Modelled data were extracted from 24 different stations in the bay at a depth of 2 m to analyse the impacts of increasing MSL on extreme surges and wind-waves.
Results: Under the current scenario, the results indicate that both surges and wave patterns are significantly influenced by seasonal wind patterns. In the context of rising MSL, the research reveals that while surges exhibit a degree of resilience to changes in MSL, the wave field is more vulnerable to such variations. The non-linear response of the wave field to increasing MSL further complicates the scenario. For instance, there is an unequal response in the median of the annual maximum significant wave height (Hs) corresponding to the rising MSL from 0 m to 0.5 m and from 0.5 m to 0.8 m, which is expected due to wave breaking triggered by changes in water depth. Specifically, the median annual maximum Hs at 12 locations remains unchanged when MSL increases from 0 m to 0.5 m. However, increasing MSL from 0.5 m to 0.8 m increases the median annual maximum Hs by up to 0.36 m, accounting for 70% of the total increase in the median annual maximum Hs when MSL rises from 0 m to 1.4 m at the same locations.
Discussion: The study found that intensification in the median of annual maximum Hs occurs only in locations where the values exceed 1.0 m. This suggests that areas with higher extreme Hs values are more prone to experiencing significant variations. In contrast, stations with a median annual maximum Hs below the 1.0 m threshold exhibit only minor increases in the annual maximum Hs. These findings highlight the complex and non-linear nature of the wave field's response to rising MSL and emphasise the importance of considering local conditions when assessing the impacts of sea level rise on coastal regions.
1 Introduction
Extreme sea levels and wind waves play a crucial role in the dynamics of coastal areas, significantly impacting both the natural environment and human activities (Wahl et al., 2017; Wright et al., 2020; Bhaskaran et al., 2022). Extreme sea levels, often caused by phenomena such as storm surges, high tides, and sea level rise due to climate change, can increase coastal flooding, erosion, and cause damage to coastal infrastructure. These extreme events can lead to the loss of life, the reduction of water quality, and the displacement of human populations. Extreme wind waves, generated by intense storms, contribute to coastal sea-level changes and can exacerbate the effects of high sea levels by causing additional erosion, property damage, and threatening human lives (Dodet et al., 2019; Lyddon et al., 2019). These are critical factors in the assessment of flood risks, coastal management, and strategies.
In the case of PPB, this is an important water environment and continues to be an essential asset supporting a multitude of recreational activities alongside its commercial functions. The bay supports a dense population, with more than 5.5 million people living in its catchment area, making it the most densely populated catchment in Australia. It is home of an important hub for shipping and navigation, including Port of Melbourne and Port of Geelong. This area is considered as a cornerstone of maritime activity in Australia. Understanding extreme sea levels and wind waves in the changing climate in PPB is important for coastal and disaster risk management, as it informs the design of coastal defences and the planning of coastal developments for this area.
Previously, several studies have focussed on extreme sea levels and wind-waves, including McInnes et al. (2009a, b, 2013), and Tran et al. (2021). McInnes et al. (2009b) studied the effect of climate change on extreme sea levels in PPB. The findings of McInnes et al. (2009b) are part of the broader assessment of the impacts of climate change on the entire Victorian coastline. It studied the influence of astronomical tides and storm events on storm surge levels. In this study, the extreme sea levels are expressed in terms of mean sea levels and found to be larger than the corresponding storm surge heights. While comprehensive, McInnes et al. (2009b) has certain limitations. For example, it employed a coarse computational grid which may not capture the details of complex topography patterns in PPB. Furthermore, McInnes et al. (2009b) neglected the influence of wind-waves on storm surges, This omission could alter the estimated storm tide levels as wave-sea level interaction can significantly impact the results (e.g. Arns et al. (2020)).
Recently, Tran et al. (2021) utilised a coupled unstructured grid ocean-wave modelling system (SCHISM-WWMIII) to quantify the hydrodynamic climate of the Bay focussing on storm tides, wind-wave patterns, and their interaction with currents. This modelling was built upon high-resolution and advanced wave physics (ST6) and the analysis of sea levels was based on long-term hindcast simulations. The differences between Tran et al. (2021) and McInnes et al. (2009b) on PPB primarily revolve around the study approaches. For example, the use of a wave–current coupled system in Tran et al. (2021), which was not present in McInnes et al. (2009b) allowed for a more detailed analysis of the wave-current impacts, leading to potentially more accurate predictions of extreme sea levels and wind-waves in PPB. In Tran et al. (2021), it is important to note that there was a lack of observed wave data in PPB to thoroughly validate the wave fields inside the bay at the time of conducting that study. Thus, there is room for further research, especially when the observational data are available to validate the numerical wave model inside the bay. Furthermore, as sea levels continue to rise, the latest Resilient Coast Adapting for 2100+ in Victoria, Australia1 has recently adopted the best-practice adaptation approaches which require to include multiple scenarios that include a range of hazard event likelihoods as well as sensitivity scenarios for 2100 sea level rise projections including 1.1 m and 1.4 m mean sea level rise (MSLR) projections. Therefore, it is important to revisit both extreme sea levels and wind waves in PPB for consistency and alignment with the updated guidelines based on the best-practice adaptation approaches.
The study aims to expand Tran et al. (2021) to include a range of sea level rise projections. An important aspect of this endeavour is the validation of new wave buoy systems in PPB, which is essential to ensure the reliability of data used in sea level predictions. Furthermore, the study extends the hindcast dataset to a 32-year period, providing a more comprehensive historical perspective for analysis. The inclusion of five distinct sea level scenarios will allow for a multifaceted examination of potential future outcomes. Additionally, this multi-scenario approach is crucial for developing robust, adaptable strategies for coastal management and infrastructure planning in the face of climate change-induced sea level variations in this coastal region.
2 Materials and method
2.1 Numerical modelling framework
The Semi-implicit Cross-scale Hydroscience Integrated System model (SCHISM) developed by Zhang and Baptista (2008); Zhang et al. (2016) was selected for the present study. It is a robust hydrodynamic modelling framework that is beneficial in complex coastal environments. With the use of a semi-implicit approach for solving the transport equations, SCHISM is very stable and less sensitive to time steps, making it more efficient than a fully explicit numerical scheme. With the aid of unstructured grid algorithms, SCHISM allows for capturing complex coastal shoreline and bathymetry in its computational domain with flexible grid resolutions. It also means that the model can be fine-tuned to represent the nuances of natural waterways and man-made channels alike. Moreover, computational efficiency is a major advantage of SCHISM when dealing with multiple scenarios in a reasonable time period. The governing equations in SCHISM are as follows:
where dM/dt is the time derivative of horizontal velocity M with respect to time t; the free surface η presents in the horizontal x,y Cartesian coordinate system using the vertical coordinate z direction (upward) with corresponding vertical velocity w; H is the water depth; e1 and e2 represents the vertical eddy and diffusivity respectively; g is the gravitational acceleration; the S term in the momentum equation represents other forces such as tidal, atmospheric forcing. The c term in the transport equation is the concentration of tracers such as temperature, salinity, and sediment transport. These equations are closed using the generic length-scale model proposed by Umlauf and Burchard (2003). In the first step, SCHISM solves the momentum and transport equations using the semi-implicit finite element method. The implicit scheme is applied for solving the elevation gradient, vertical viscosity, and boundary layer, and the divergence terms. Using this numerical scheme, stability constraints (e.g. large time step) can be obtained. The vertical velocity is computed using a finite-volume method along each prism after solving the horizontal velocity and elevations. SCHISM can directly be coupled with WWMIII developed by (Roland, 2008; Roland et al., 2012) which is a third-generation phase-averaged unstructured grid wave model that allows the user to compute the wave spectra over realistic coastal and ocean areas. From spectral data, common wave parameters such as significant wave height (Hs) and wave direction can be derived. WWMIII solves the wave action balance equation which takes into account various physical processes, including wind energy and dissipation due to white-capping and bottom friction. The governing equation is:
where D is the action density as a function of intrinsic radian frequency ω and wave number k written as
In the linear theory, the temporal and spatial scales of waves follow the dispersion relationship as:
where g is the gravitational acceleration; H is water depth; and cg is wave group velocity. In the presence of a current, the current speed U can modify the wave propagation. ∇ operators represent the geographical divergence (horizontal) and spectral space (with subscript k). The S term on the right of Equation 4 accounts for the energy of various source/sink terms such as wind forcing, white-capping and bottom dissipation.
In WWMIII, the geographical space is solved with a Residual Distribution Scheme which takes advantage of both Finite Elements and the Finite Volume Methods (e.g. Roland et al., 2012). The spectral space is integrated using the UQ method which is a similar method to that employed in WW3 (Tolman, 1992). The source terms are solved in three different fractional steps using the TVD Runge-Kutta method which is a third-order scheme applied for dissipation terms (e.g. bottom friction, breaking), dynamic scheme for nonlinear interaction (e.g. triads) and semi-implicit scheme for deep water source terms. The coupling system can run in parallel modes using MPI (Message Passing Interface) with identical sub-domains decomposed from the same unstructured grid with the user-defined time steps. This means that the SCHISM-WWM can provide high accuracy without requiring grid interpolation, while the computational efficiency can be achieved by using different time steps and integration schemes. These key features make the coupling SCHISM-WWMII system very robust for simulating waves and currents in PPB.
2.2 Field observations
There are several types of field measurements available within PPB. These data include waves, currents, water levels, and winds. These datasets were used to validate numerical models using a similar approach to Tran et al. (2021) except for measured wind-wave data inside PPB. This observational wind-wave dataset has just become available as a result of recent efforts by the Victorian Government through the Victorian Coastal Monitoring Program (VCMP). The observed wave buoys inside PPB consist of 6 deployed Spotter buoys to measure the wave motions at sites along the perimeter and the centre of PPB, as shown in Figure 1. The buoys record the rise and fall of the water surface approximately every half a second, use GPS for positioning, and transmit the data via satellite. The locations/labels of the buoys are: Werribee, Sandringham, Indented Head, Rosebud, Mt. Eliza, and Central PPB. These wave buoys provide various common wave output parameters, such as Hs, mean direction, peak period, and mean period. These recorded variables were used to calibrate and validate the coupled modelling system prior to simulating the long-term hindcasts.
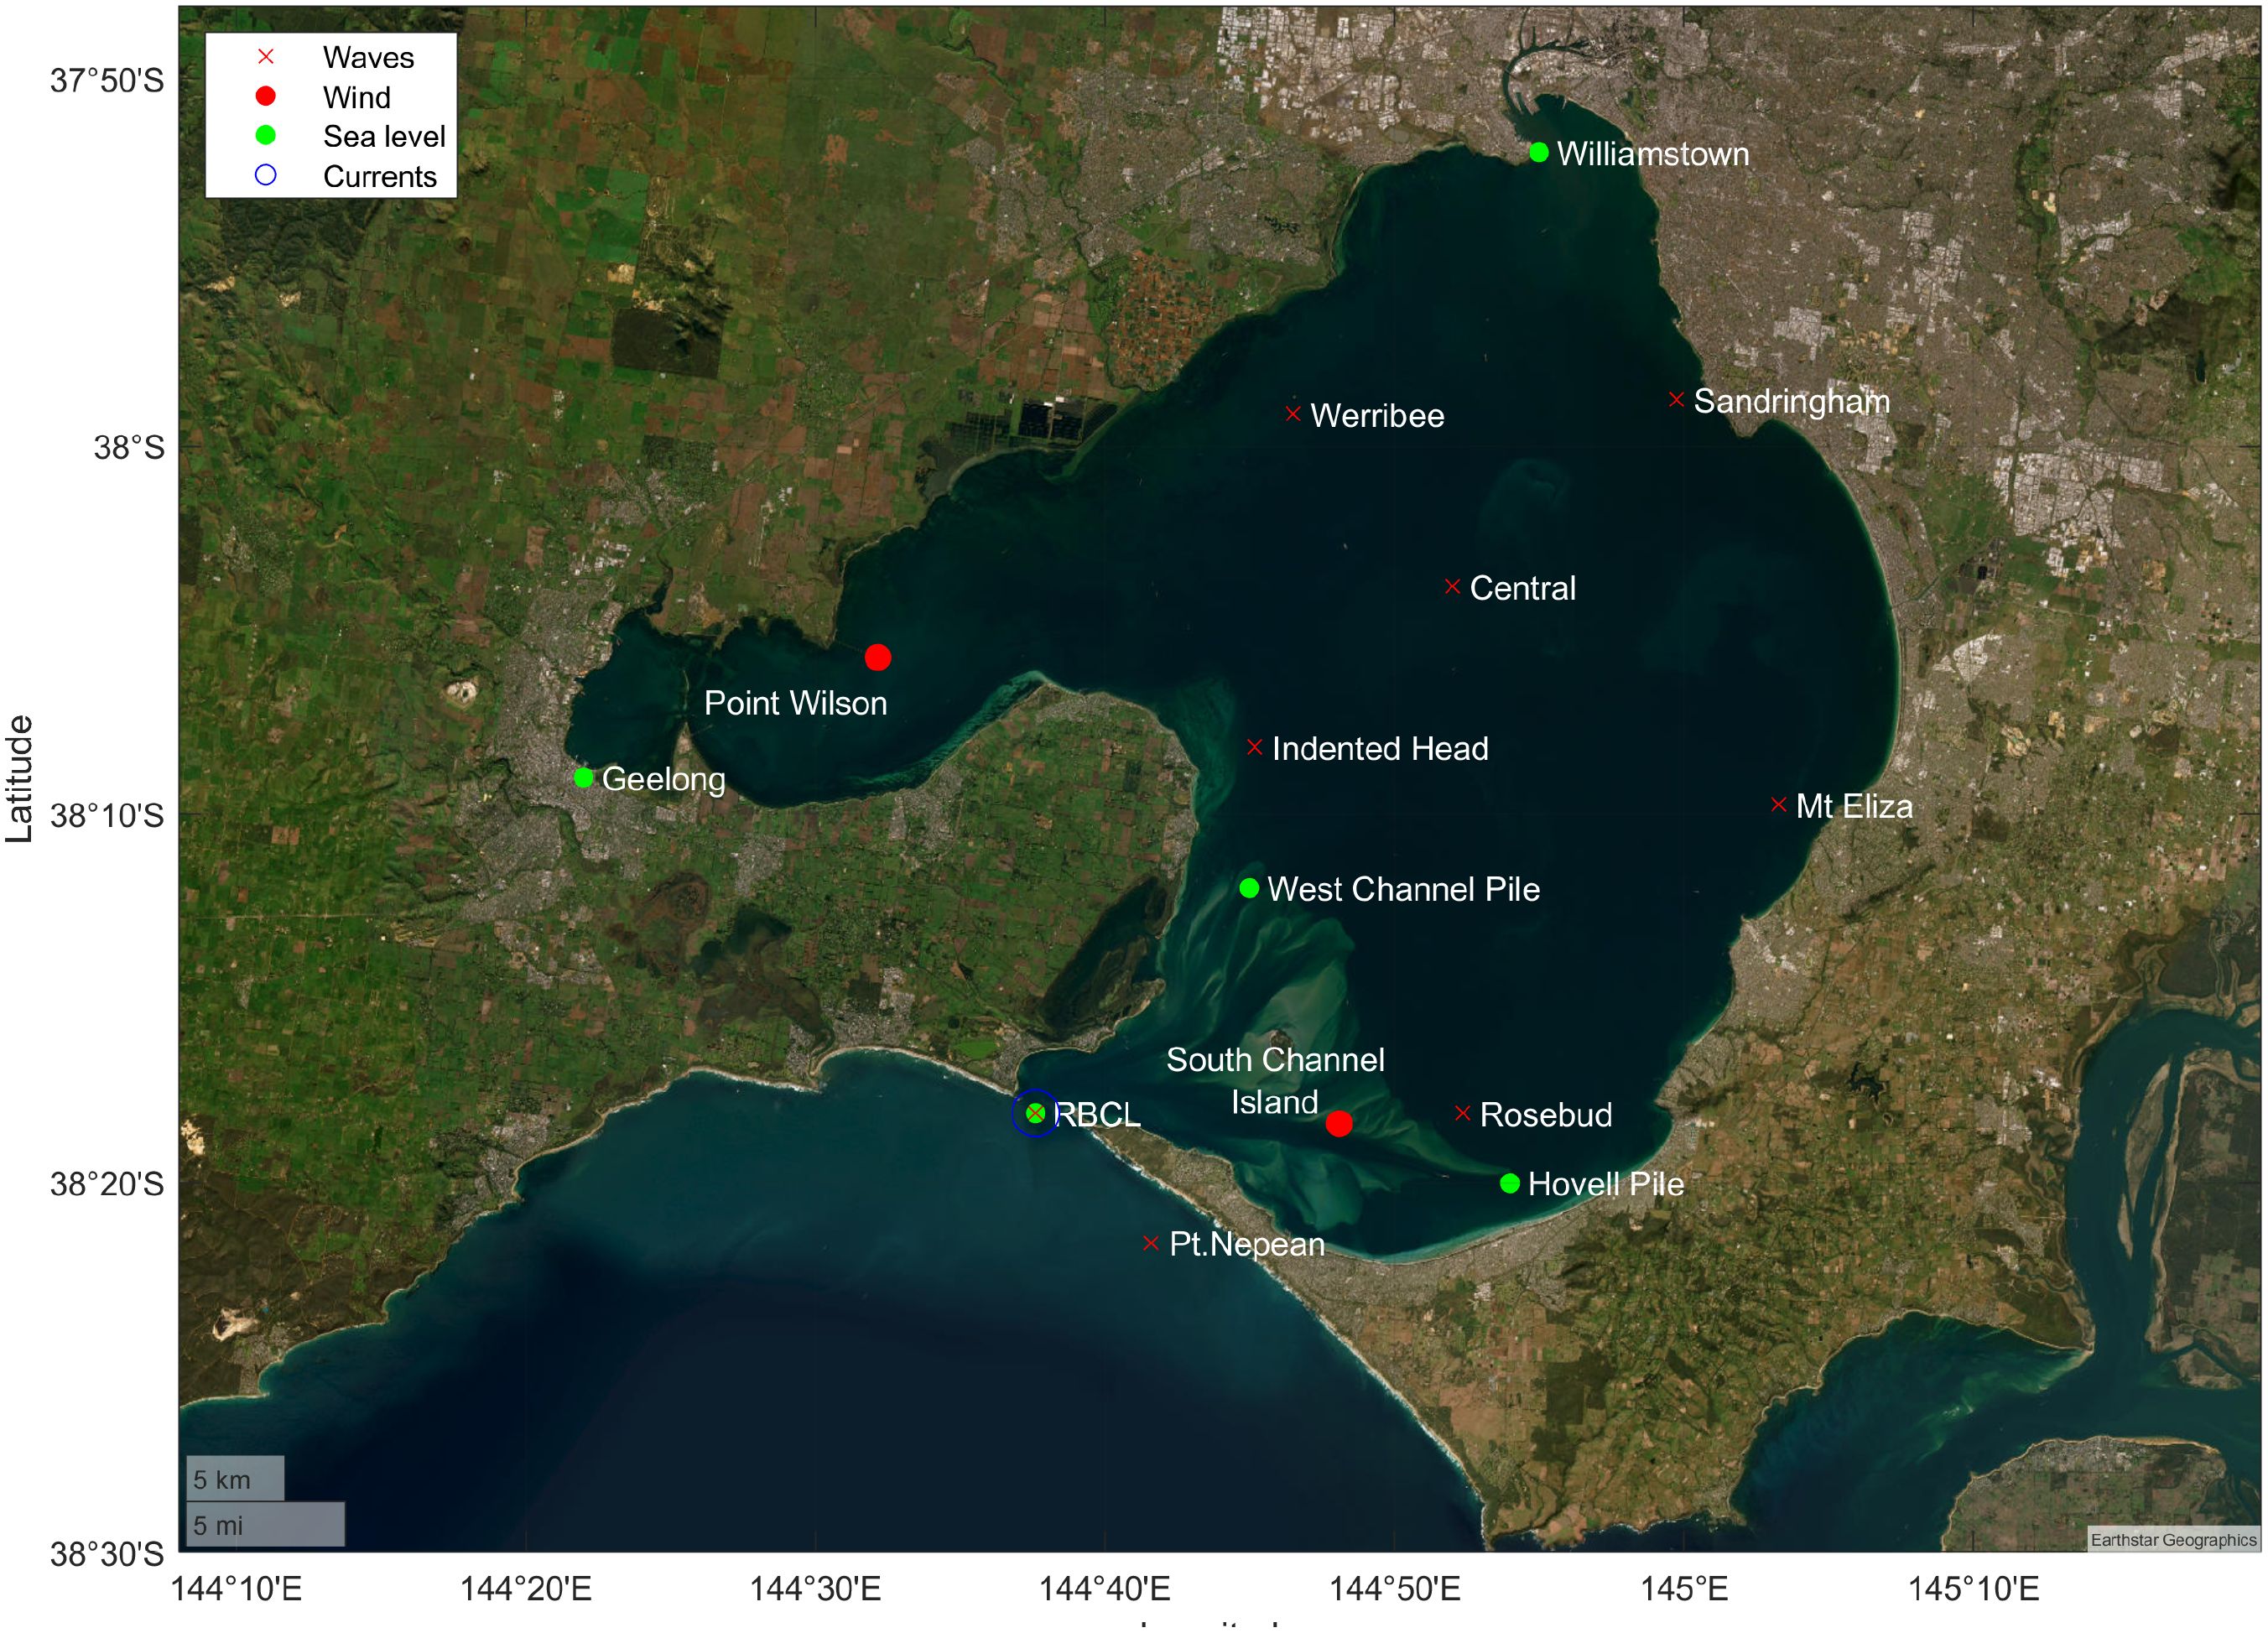
Figure 1. A map showing the locations of various observational datasets used to validate numerical models in the present study, including the wave buoy network inside PPB. The observed wave buoy data is publicly available on https://vicwaves.com.au/.
2.3 Model setup
2.3.1 Computational mesh
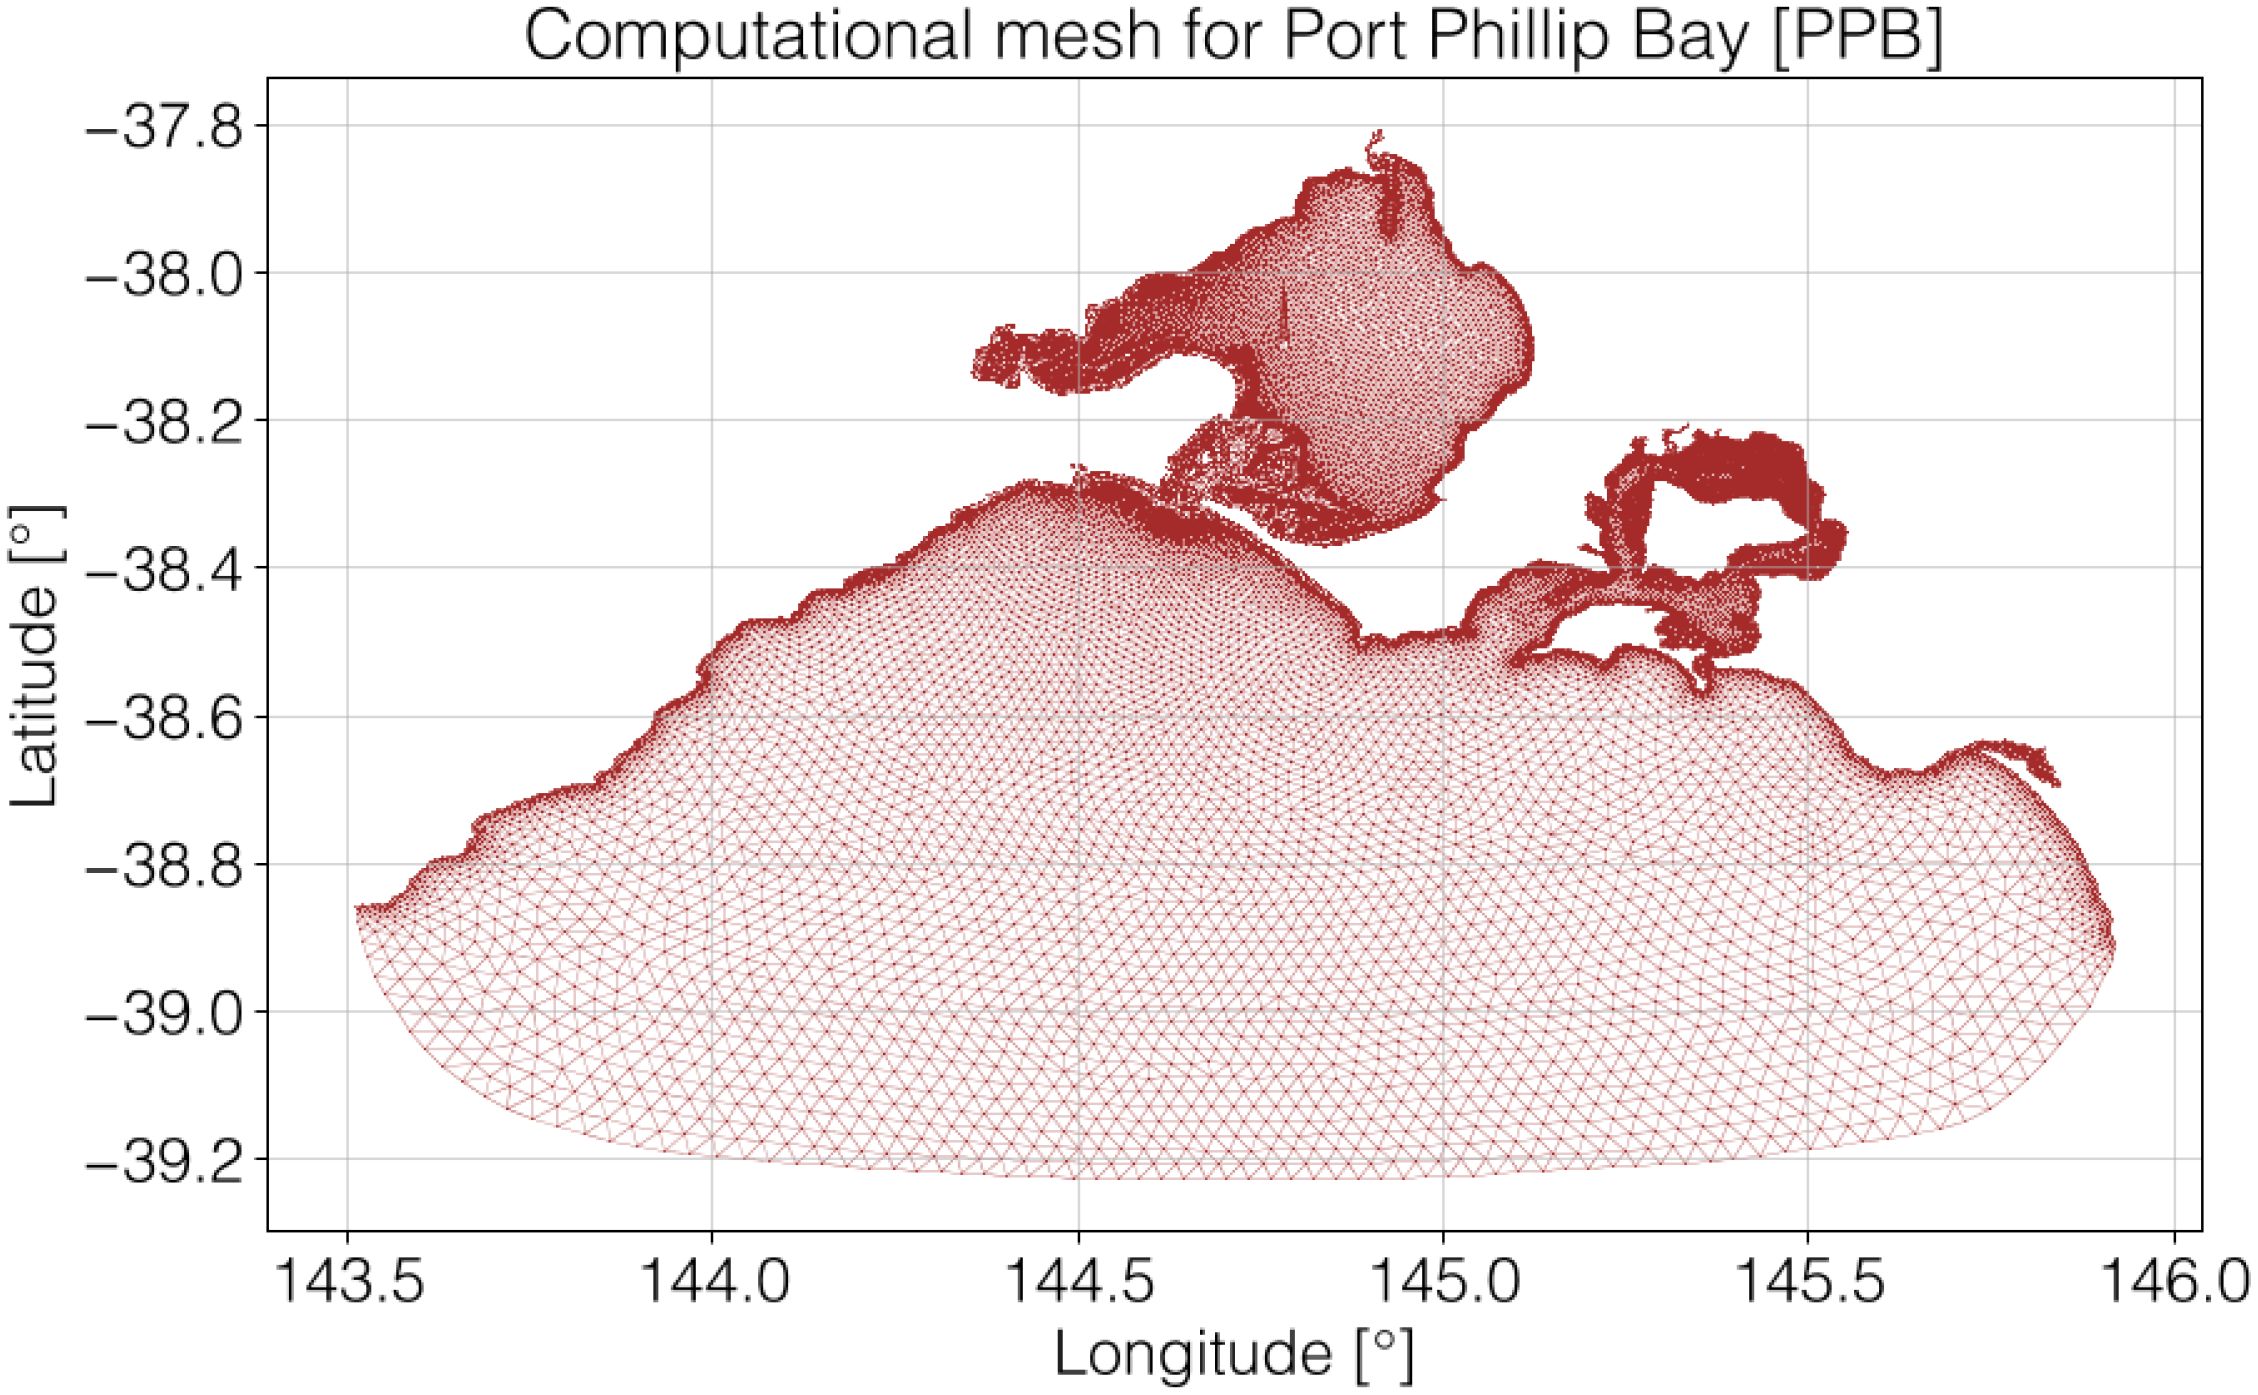
The computational domain covers the entire area of PPB with the open boundary extended up to 200 km from the entrance of the bay into deep waters (approximately 100 m deep). This extension allows for capturing ocean tides and waves from deep waters. The water depth information used in the computational mesh was interpolated from the 30-m resolution Bass Strait Digital Elevation Model (DEM) from Geoscience Australia2. It was compiled from all available bathymetry data for the area of seabed between the coastlines of Victoria and northern Tasmania, extending approximately 460 km from west of King Island to east of Flinders Island.
The computational mesh comprises 80252 nodes with 153335 elements, with a resolution ranging from about 20 m to 3 km offshore (see Figure 2). The finest mesh was devised for the region of interest at the entrance of PPB, where the bathymetry is fairly complex.
2.3.2 Model forcing
To specify water elevations at the open boundary, this study used the latest development of the global finite element solution tide model (FES 2014) introduced by AVISO (Carrere et al., 2016), which includes improved grid resolutions, especially in coastal regions and the continental shelf with new global bathymetry. This database was assimilated with long-term altimeter data from Envisat, Topex/Poseidon, Jason-1, Jason-2, TPN-J1N, ERS-1, ERS-2, and field measurements at various tidal gauges. The distributed FES 2014 database provides a high resolution of 1/16°, which is 50% finer than the FES 2012 model. The SCHISM circulation model was configured in barotropic modes averaged in depth (2DH) using eight tidal components (Q1, O1, P1, K1, N2, M2, S2, K2) based on the FES 2014 database. These data were produced by Noveltis, Legos and CLS and distributed by AVISO+, with support from CNES (https://www.aviso.altimetry.fr/).
In this study, the atmospheric forcing inputs for SCHISM/WWM were derived from the reanalysis ERA5 products (Hersbach et al., 2019). It is the fifth generation ECMWF atmospheric reanalysis of the global climate, covering the period from January 1940 to the present. ERA5 is produced by the Copernicus Climate Change Service (C3S) at ECMWF. ERA5 provides hourly estimates of various atmospheric, land, and oceanic climate variables. The data cover the Earth on a 30 km grid and resolve the atmosphere using 137 levels from the surface up to a height of 80 km. The ERA5 wind forcing in the model was processed with local adjustments using a linear relationship between the original ERA5 wind and the observed wind data at two stations in the Bay. Figure 3 compares the ERA5 before and after adjustments against the observed wind data at South Channel Island and Point Wilson.
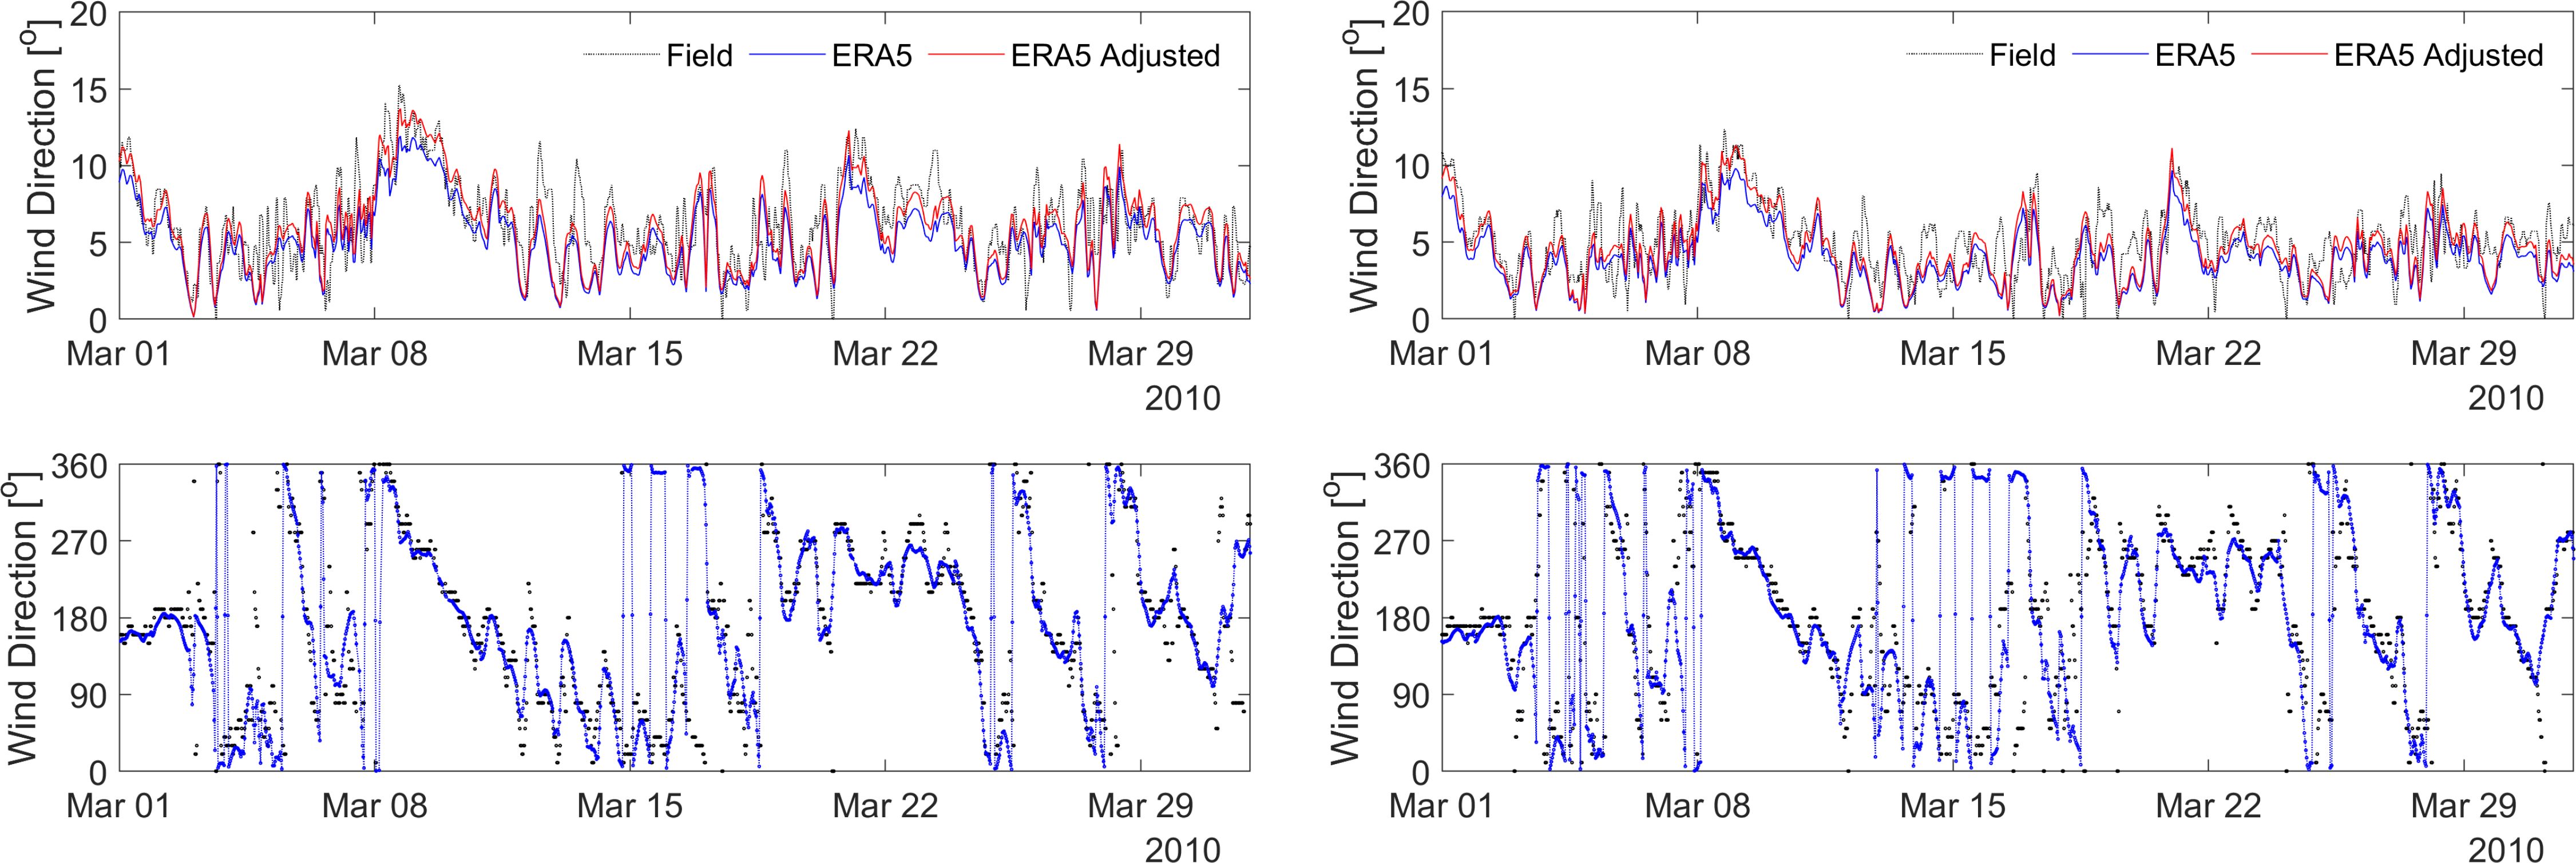
Figure 3. Comparison between observed and ERA5 wind (speed and direction) at South Channel (left) and Point Wilson (right).
For wave information at the open boundary, this study uses the WW3 hindcast data provided by the wave hindcast conducted at the University of Melbourne (Liu et al., 2021). However, it is noted that wave forcing data is only important for the area near the entrance of PPB as waves inside PPB are generated by local wind.
2.4 Model calibration and validation
In a previous study, Tran et al. (2021) have extensively calibrated and validated against various observed data in PPB. However, since the atmospheric forcing inputs in this study were derived from the ERA5 reanalysis dataset, which differs from the CFSR dataset used in Tran et al. (2021), a model re-calibration is required for this study to ensure the model continues to provide reliable results. A detailed model calibration and validation is provided in the following sections.
2.4.1 Model calibration and validation of waves inside PPB
One of the primary tasks in the present study is the calibration and validation of the wave model using observed data from a new wave buoy system in PPB. This recent development provides a robust dataset that enables a more comprehensive validation of the wave model within PPB, which was not feasible in Tran et al. (2021) due to the lack of comprehensive wave data at that time. In the present study, a one-month period in October 2021 was selected for calibration, and a six-month period from January to June 2021 was chosen for validation. The purpose of model calibration is to adjust the model configurations to reasonably capture the wave peaks during extreme events. Consequently, various sensitivity tests were conducted during the calibration process. To analyse the model performance, the model outputs at the computational grid points closest to the 6 wave buoy locations were extracted for comparison against the measurements. Once the model demonstrates reasonable agreement with the observed data, particularly for Hs, no further adjustments to the model configuration are required, and it should be maintained for subsequent validation.
To provide an example, Figure 4 compares time series of modelled Hs, peak period (Tp), and mean wave direction at Mount Eliza against the field data between January to June 2021. It shows that the modelled results reasonably capture the observed wave patterns at this location. For instance, during one of the most extreme events in May 2021, the modelled Hs well captured the observed data. However, it can be seen that the observed data exhibits greater variability and scatter compared to the modelled data, which appear smoother. This discrepancy may be due to the observed data including locally generated wind-waves associated with strong sea-breeze activity [e.g., Pattiaratchi et al. (1997)], which are usually not present in the global atmospheric forcing model like ERA5. To quantify the wave model performance in PPB, model skill assessments together with scatter plots are provided in Figure 5 which shows the relationships between the modelled and observed Hs at six wave buoys, along with several statistical parameters including bias (BIAS), correlation (CORR), coefficient of determination (R2) and root mean squared error (RMSE), following the approach presented in Tran et al. (2021). At Sandringham, the model achieves the best performance with CORR = 0.9, R2 = 0.81, RMSE = 0.02, and BIAS = 0.02. However, it can be seen that the model tends to overpredict the Hs at several locations, such as at Rosebud, with a BIAS of 0.1 m. This overprediction could be attributed to the simplification in the wave model used in the present study, which does not account for wave damping by vegetation. Vegetation could play an important role in the wave dynamics in PPB, potentially reducing the tendency of the model to overpredict wave height in particular locations like Werribee, Rosebud, and Indented Head, where the presence of seagrass and seaweed is significant. However, the implementation and inclusion of wave damping due to vegetation is beyond the scope of this paper.
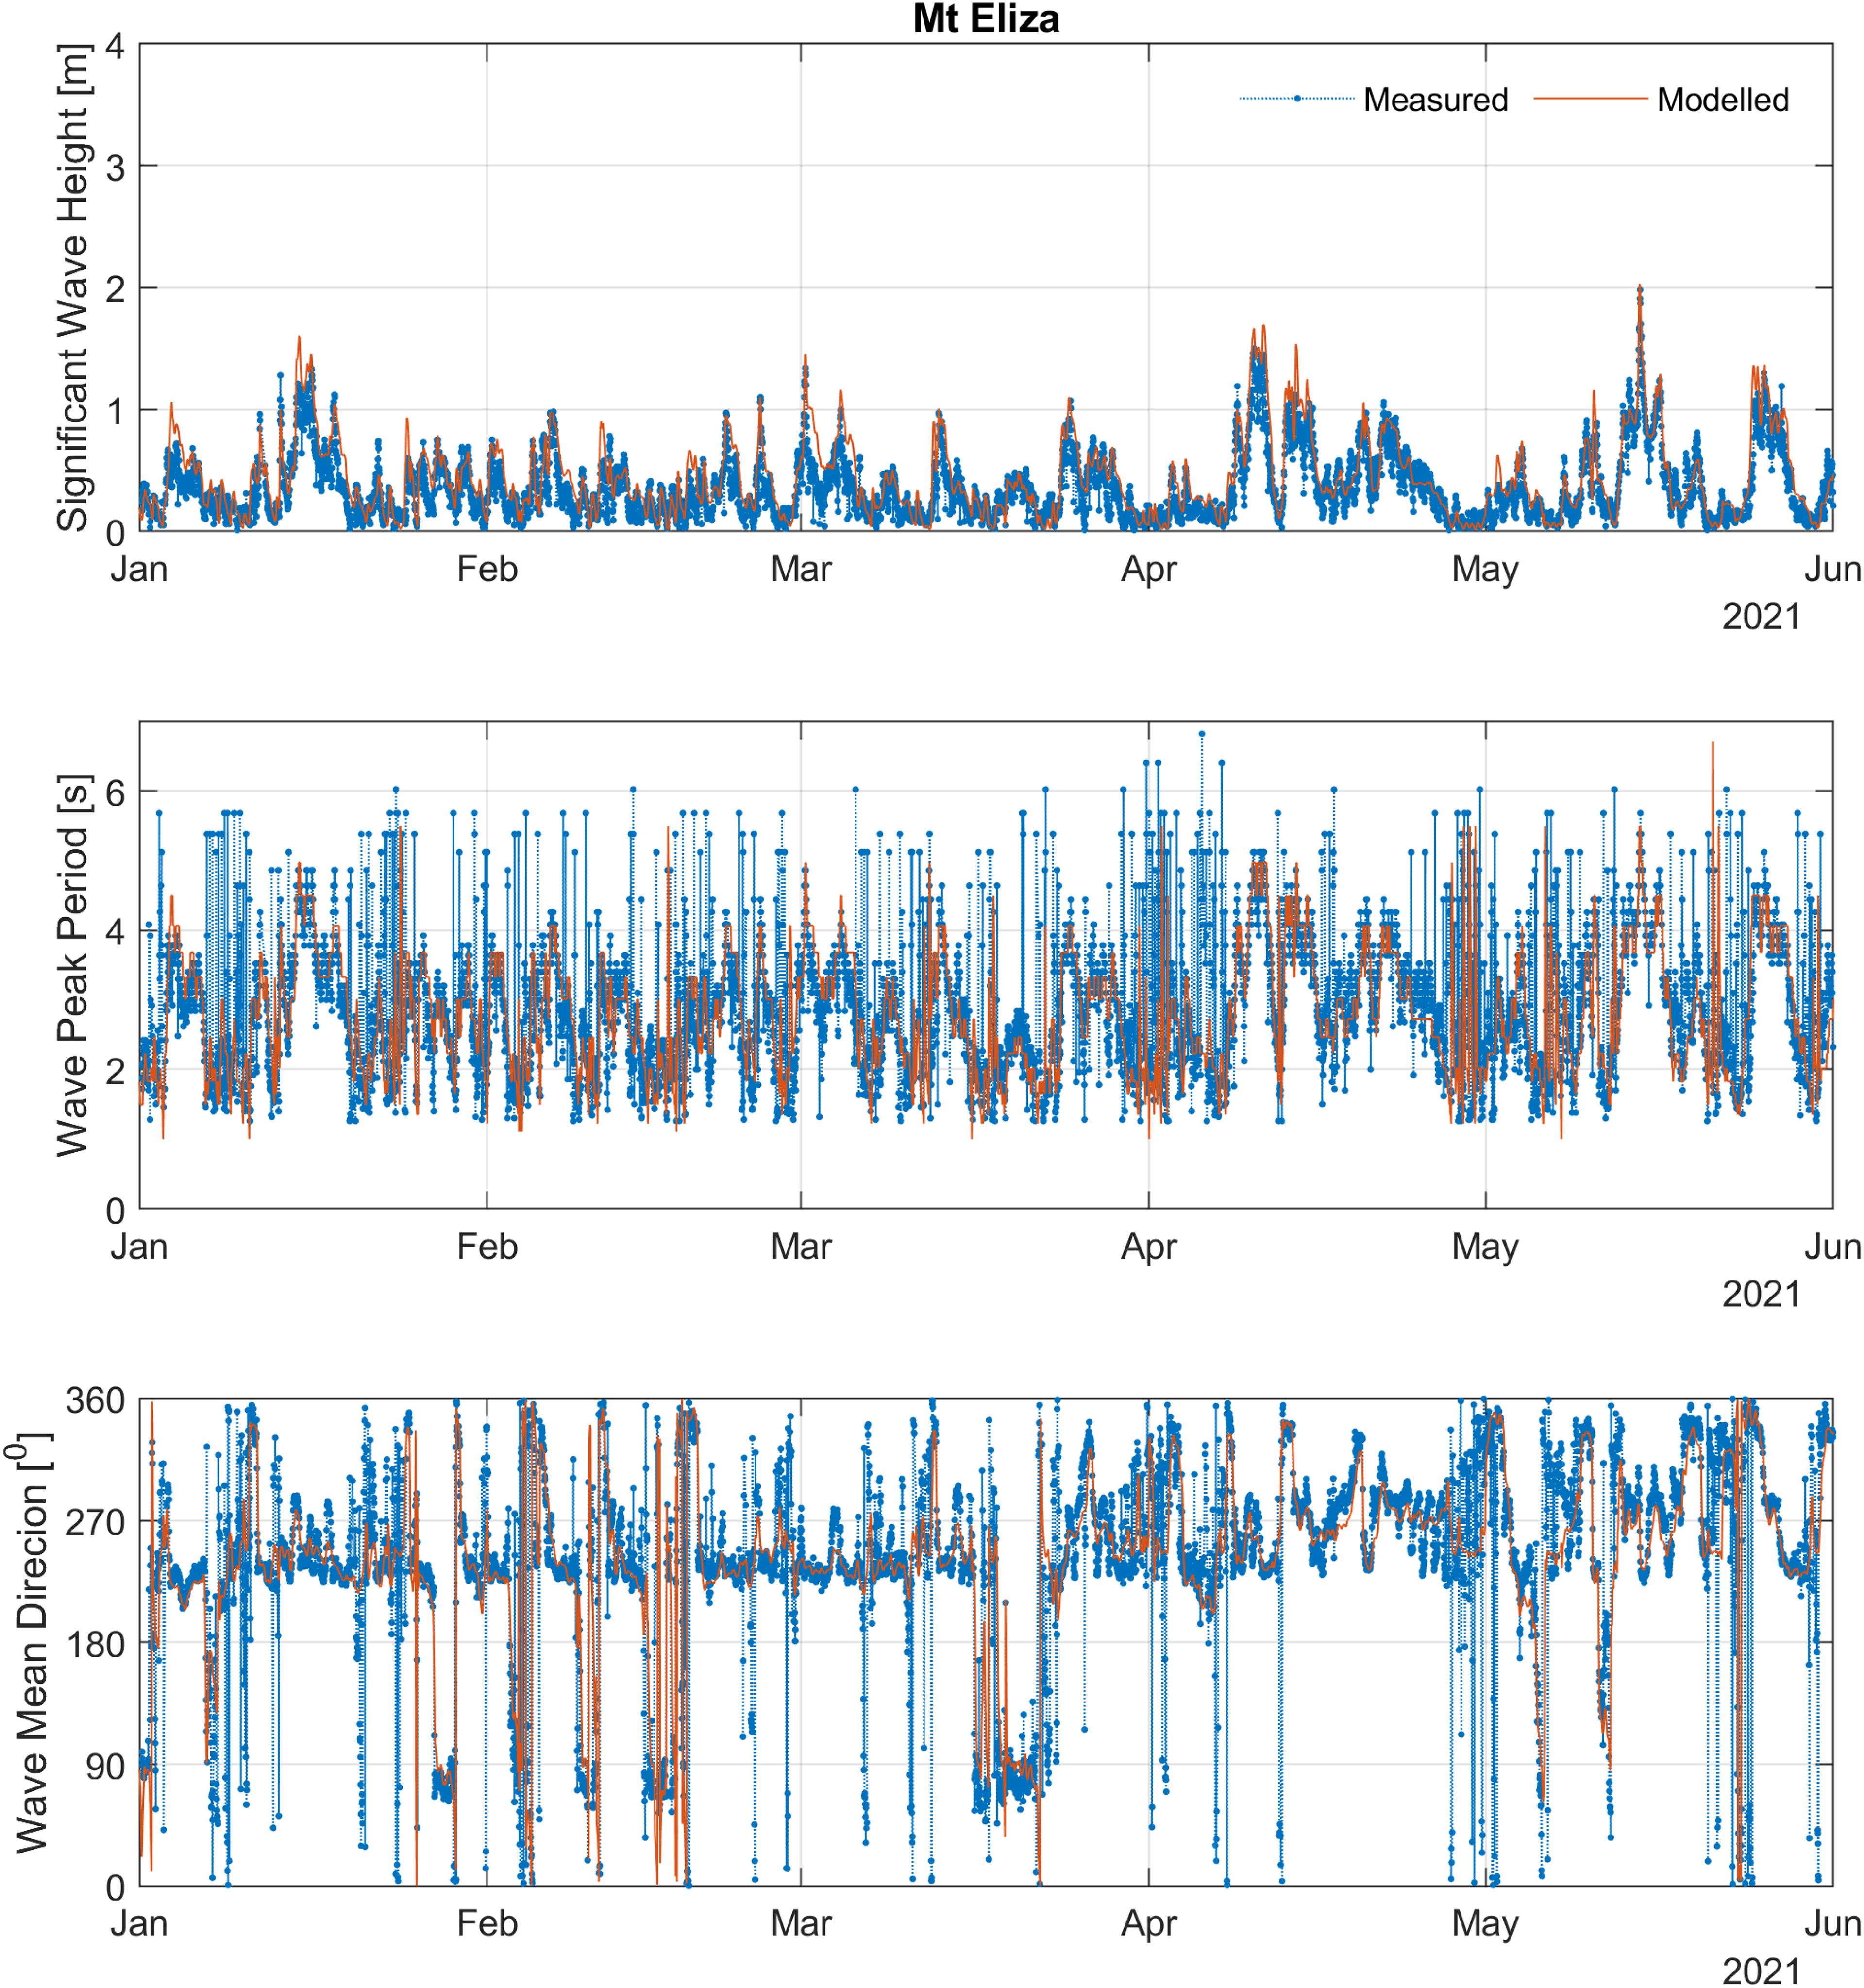
Figure 4. Comparison of modelled Hs, wave peak period, and mean wave direction with observed data at Mt. Eliza.
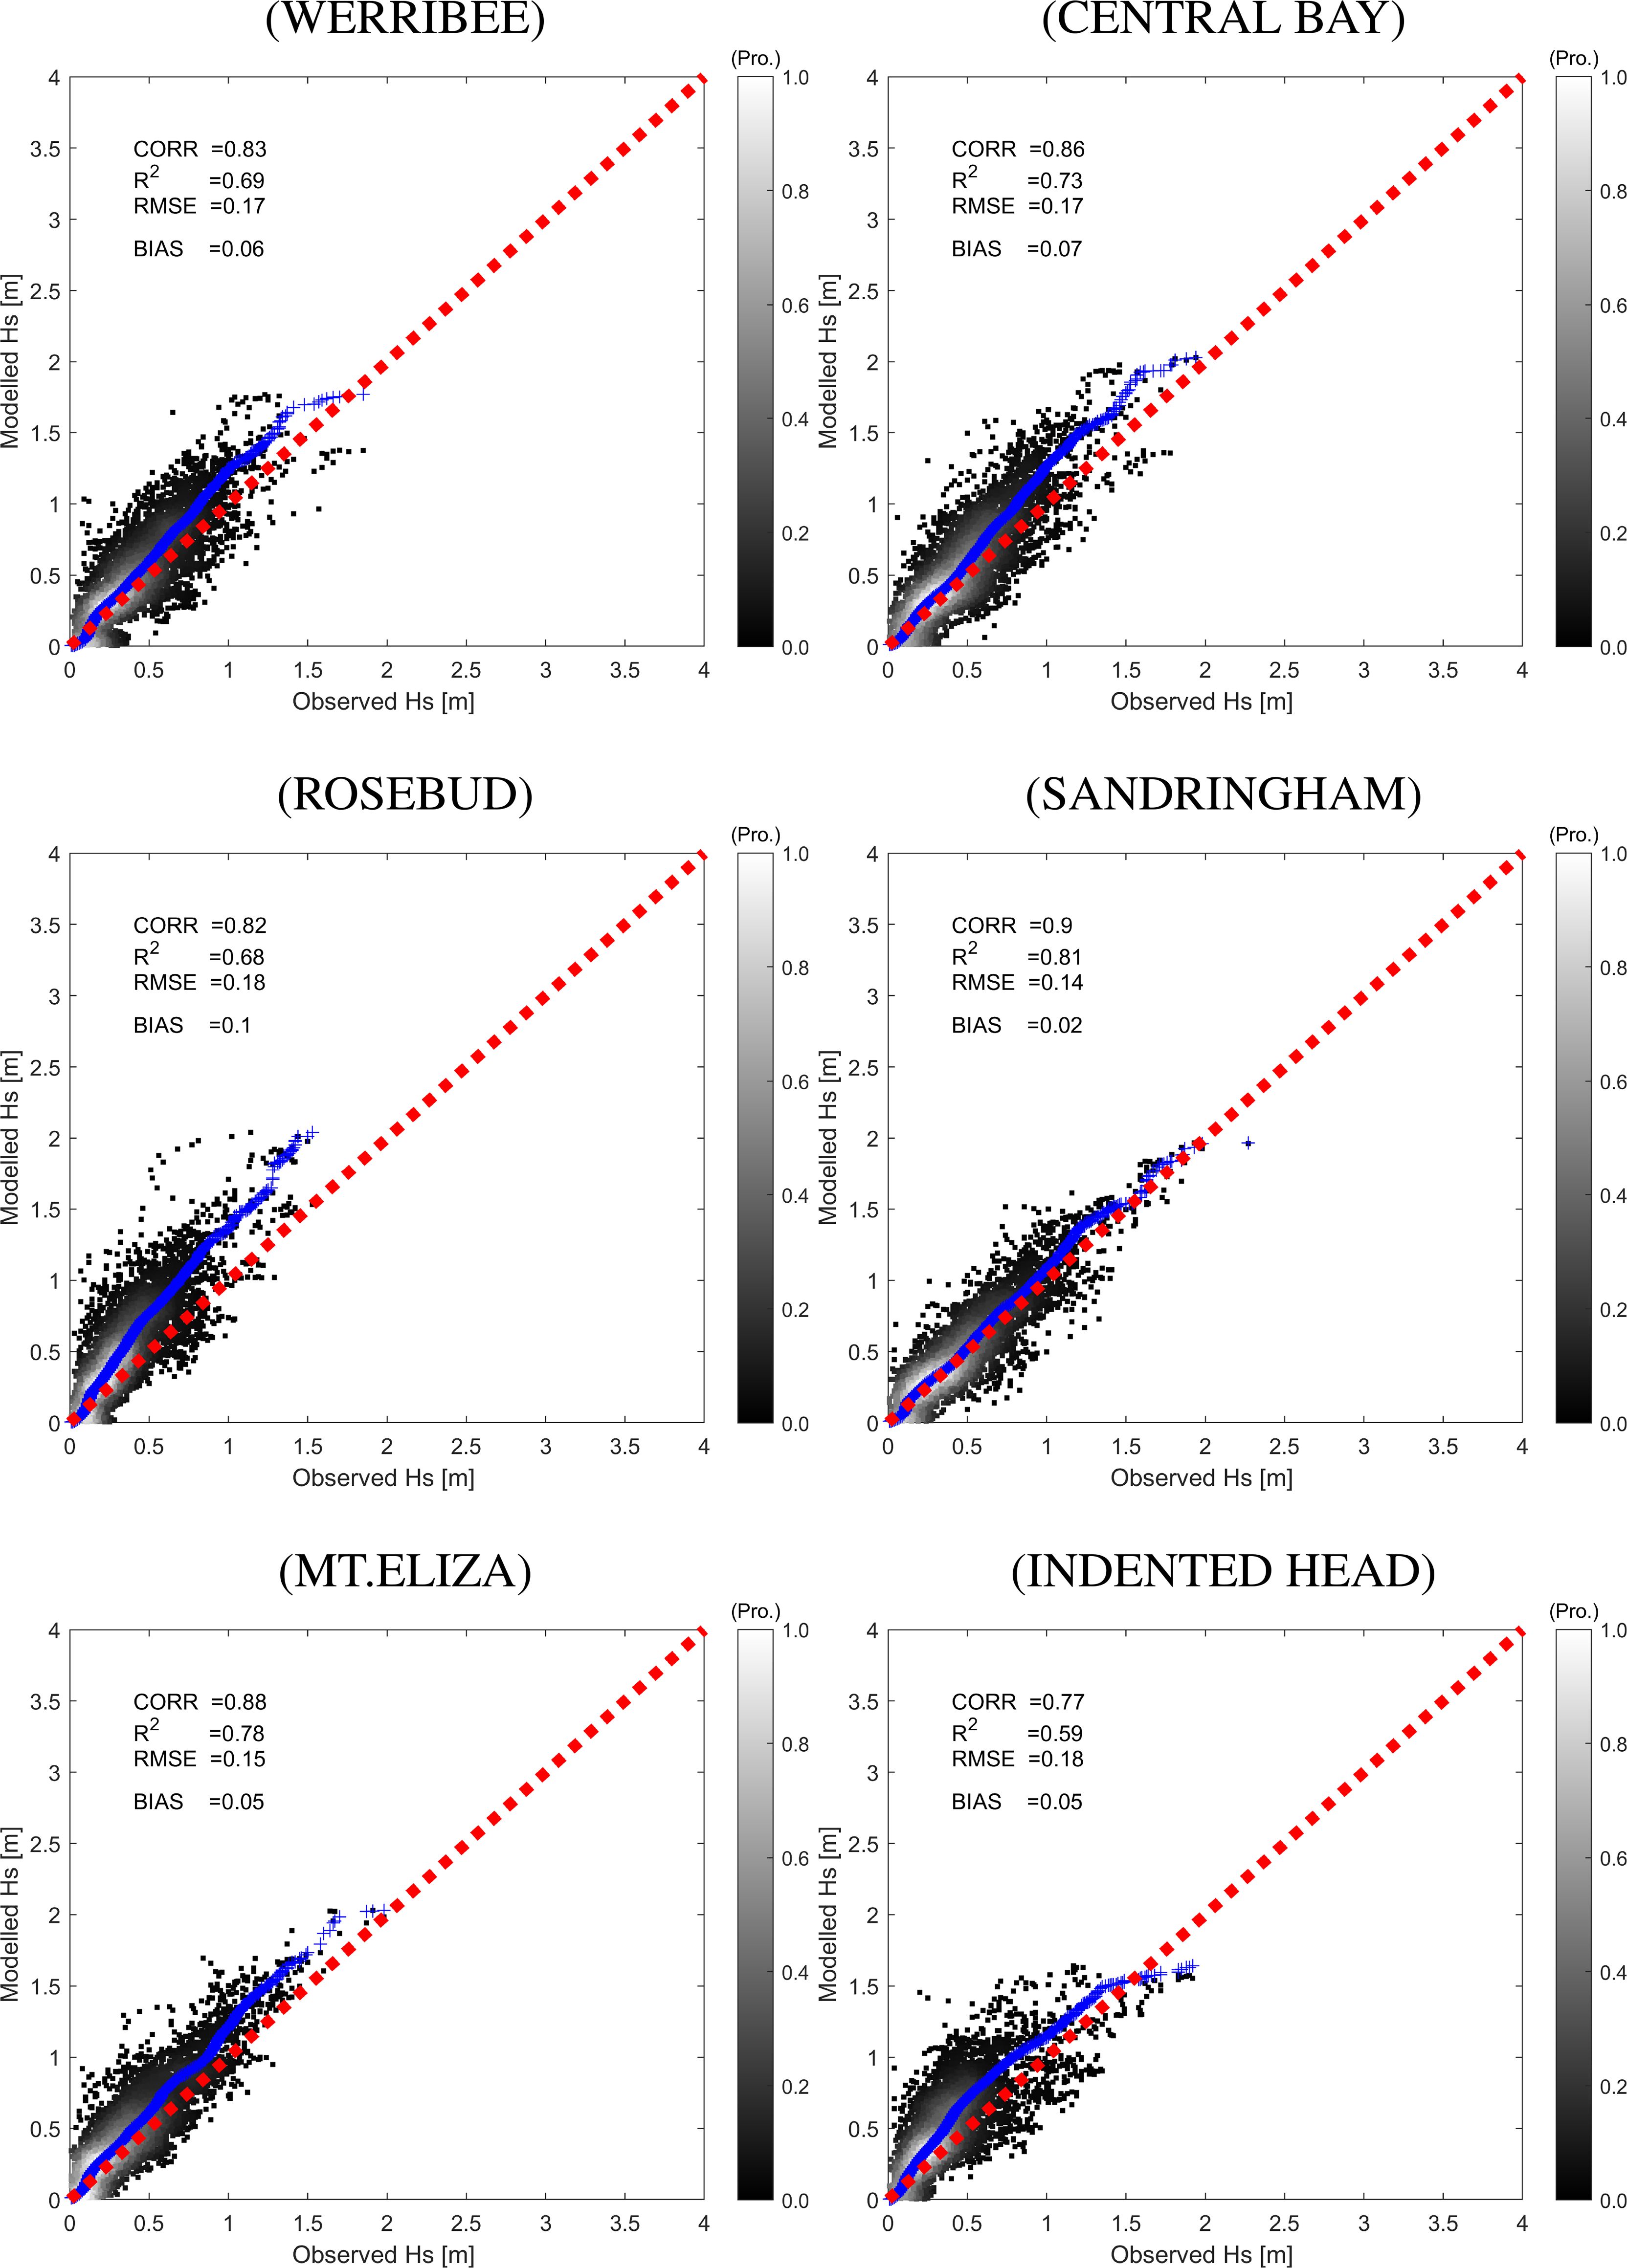
Figure 5. Scatter plots showing the relationship between the modelled and observed Hs at six wave buoy locations inside PPB (see Figure 1 for locations) based on six months of data from January to June 2021. Data points are shown as black scatters, while quantile-quantile (q-q) plots are represented by blue scatter lines.
Table 1 provides a statistical summary for different skill metrics obtained during the model calibration and validation of Hs inside PPB. Overall, it shows that the wave model used in the present study can reproduce the Hs in PPB with high correlations up to 0.9 and low biases (e.g. not more than 0.1 m over period of 6 months of data).
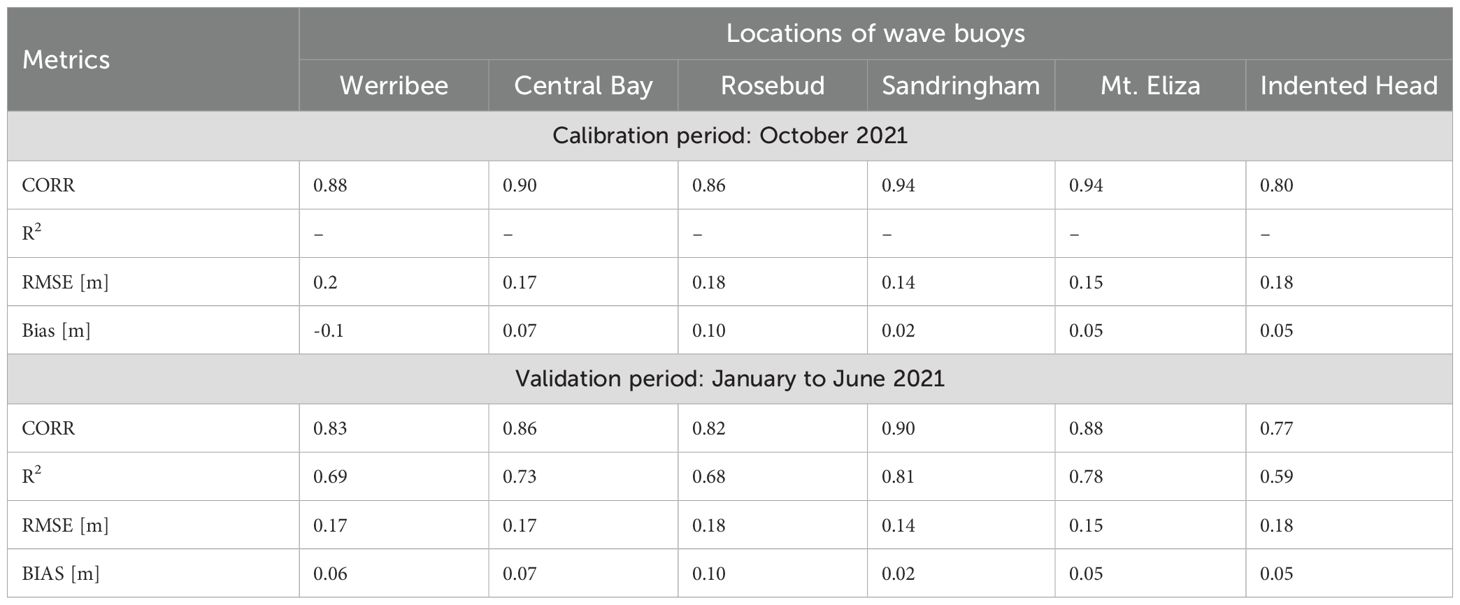
Table 1. Statistical summary for CORR, R2, RMSE, and BIAS at 6 wave buoy locations inside PPB: one-month data for calibration (October 2021) and six-month data for validation (January to June 2021).
2.4.2 Model validation of water levels inside PPB
The model validation of water levels was carried out based on a three-month simulation period from May to August 2014, which covered an extreme event that occurred in July 2014. In this study, the model calibration of water levels was not conducted as it used the same bottom friction formulation and coefficients as proposed by Tran et al. (2021).
Figure 6 compares modelled time series of total water levels with the observed data at Geelong, Williamstown, West Channel Pile, and Hovel Pile. The modelled total water elevations were extracted from the model outputs at points near the observational sea level stations. The model performance was assessed in terms of CORR, R², RMSE, and BIAS, as shown in Table 2. Overall, a good agreement between the modelled and observed data was obtained at all locations, with a CORR above 0.9 and the highest CORR of 0.93 at Geelong. The biases at all stations for this validation period are generally small, ranging from 2 cm to 5 cm.

Table 2. Statistical summary for CORR, R2, RMSE, and BIAS based on the validation period between May and August 2014.
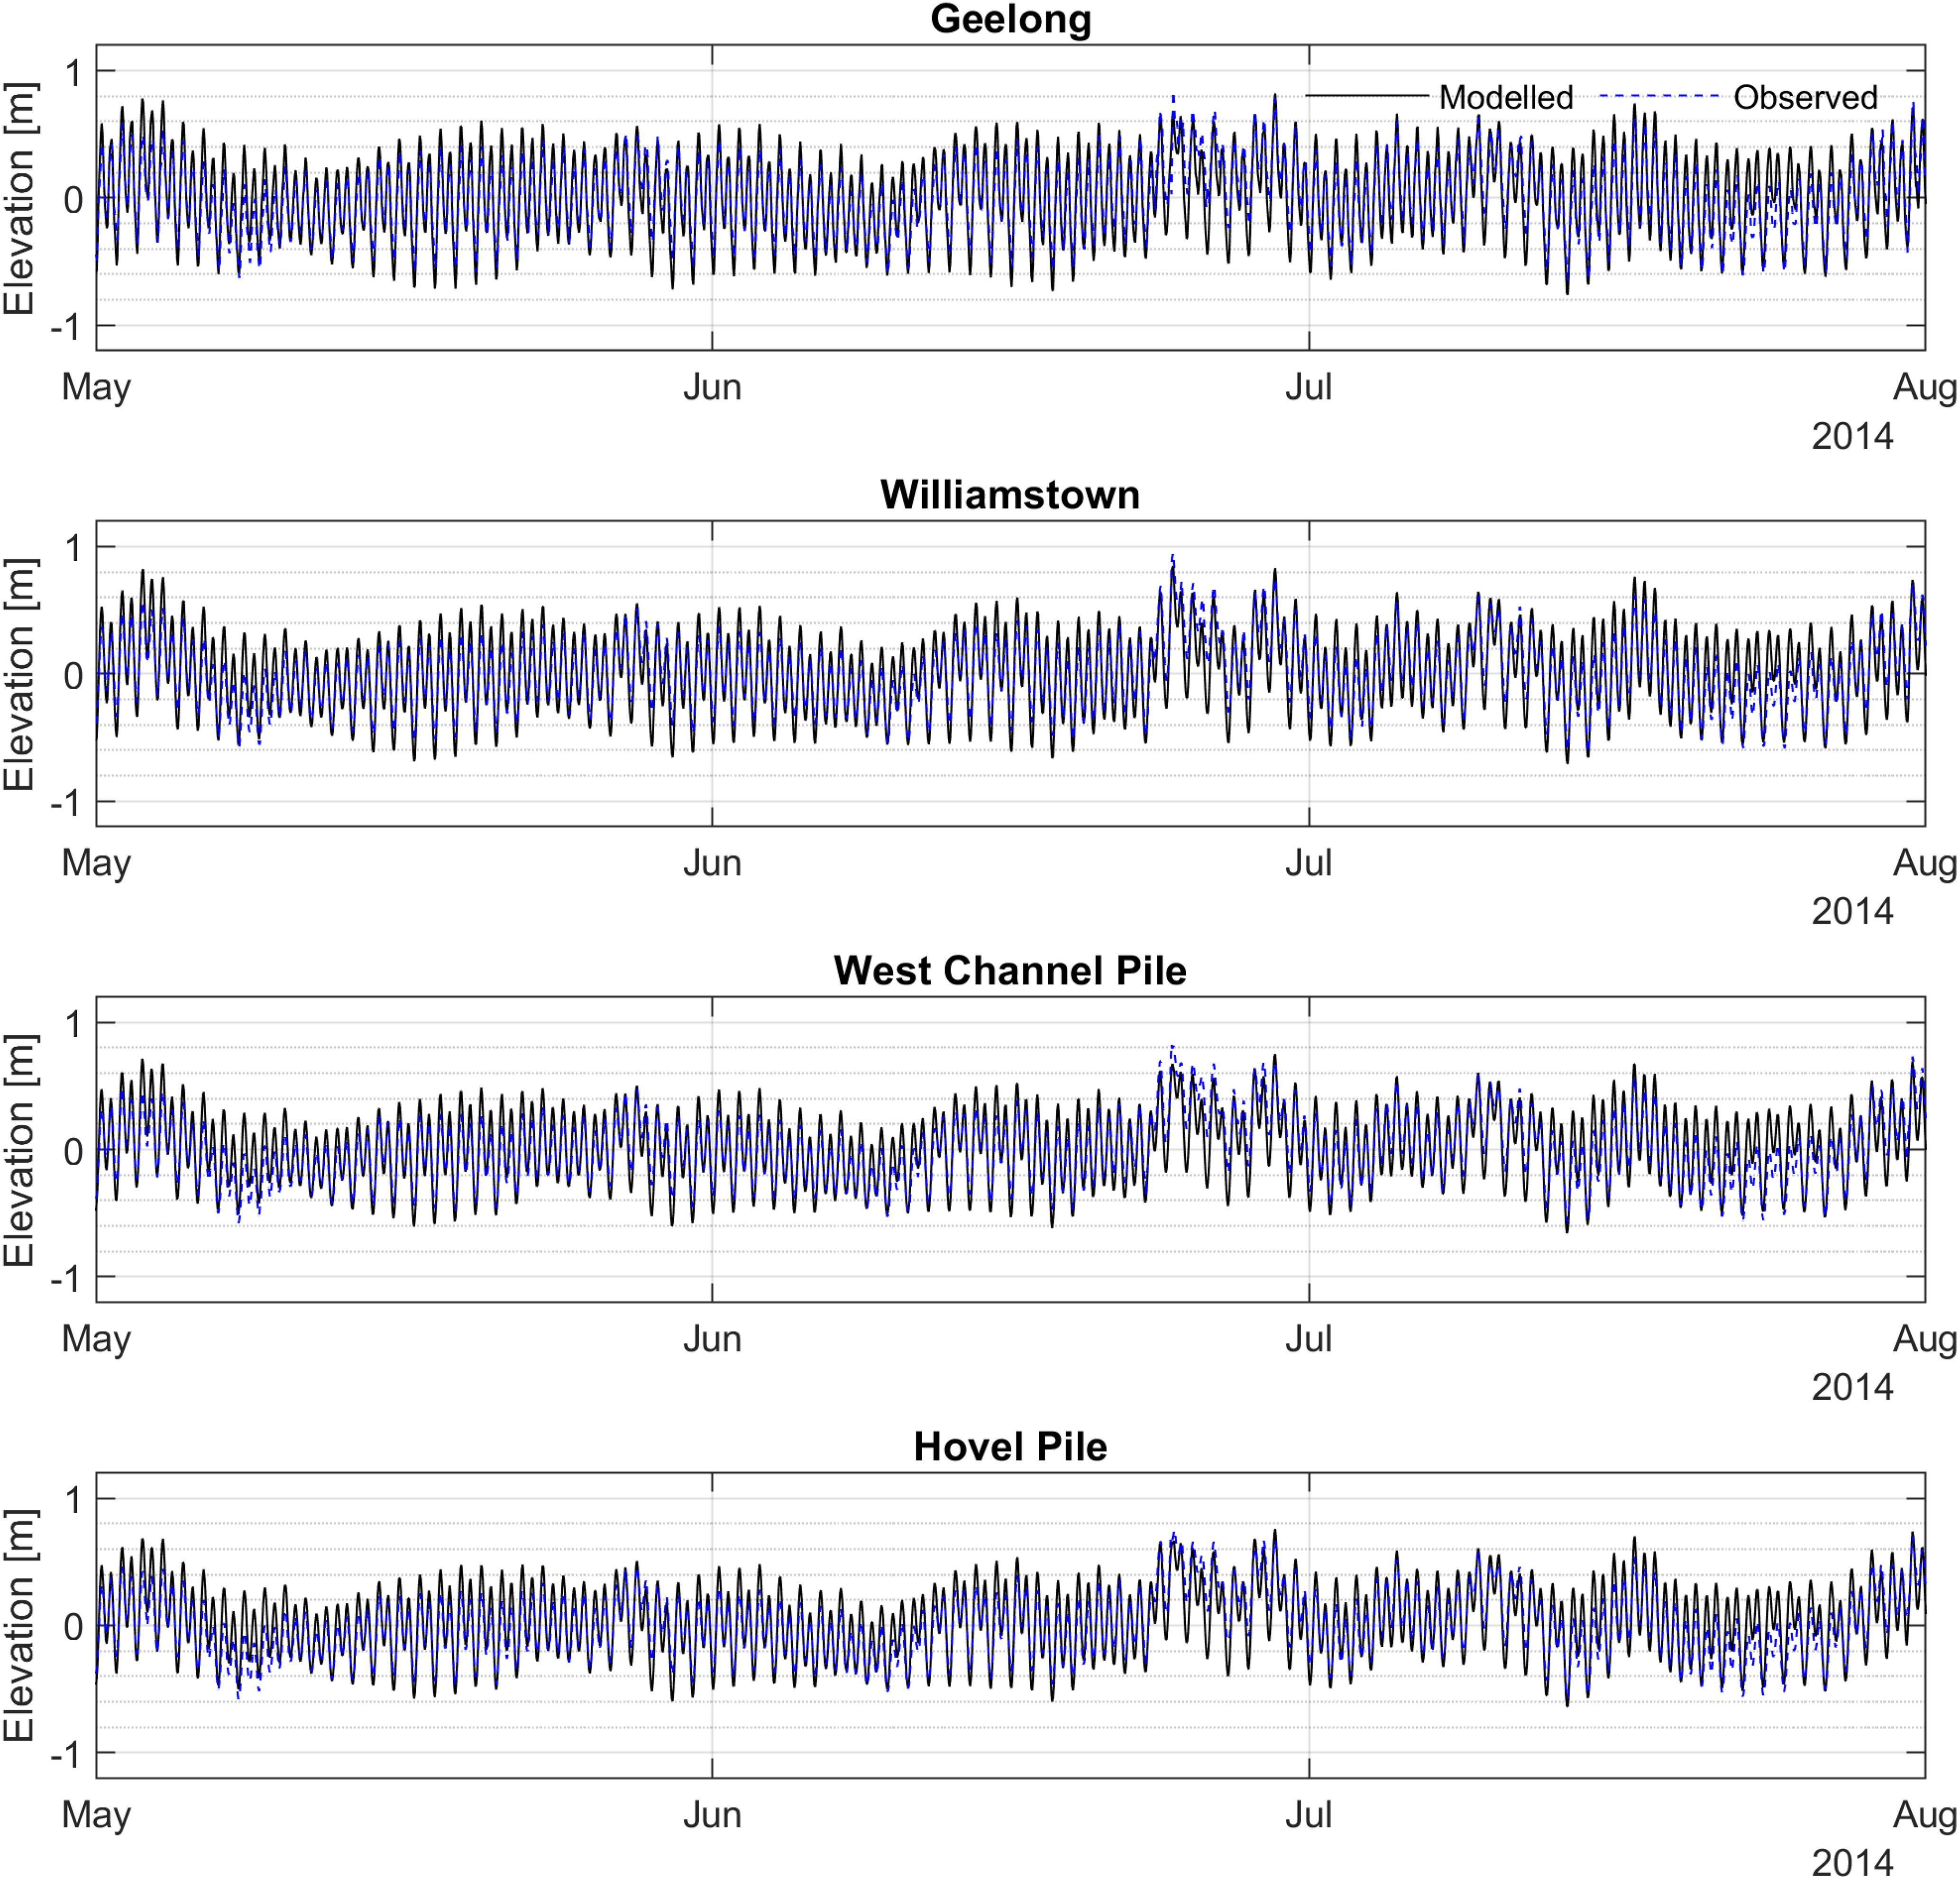
Figure 6. Timeseries plots comparing modelled water levels against observed data at Geelong, Williamstown, West Channel Pile, Hovel Pile for a period of three months (from May to August 2014).
2.4.3 Model validation of waves, currents and water levels in Port Phillip Head (PPH)
To ensure that the coupled wave-ocean model used in this study can reproduce the hydrodynamic patterns in PPH, a simulation was conducted for approximately two months (June and July 2007) for model validation purposes. The same model configurations used during the calibration and validation of the wave field within PPB were applied.
Figure 7 presents a comparison of the modelled water levels, currents, and Hs at RBCL in PPB (refer to Figure 1 for the location) against observed data. The results indicate that while the modelled Hs at RBCL tends to overestimate the observed values (e.g. with a positive BIAS up to 13 cm as shown in Table 3), the modelled water levels and currents (both speed and direction) closely align with the observations.
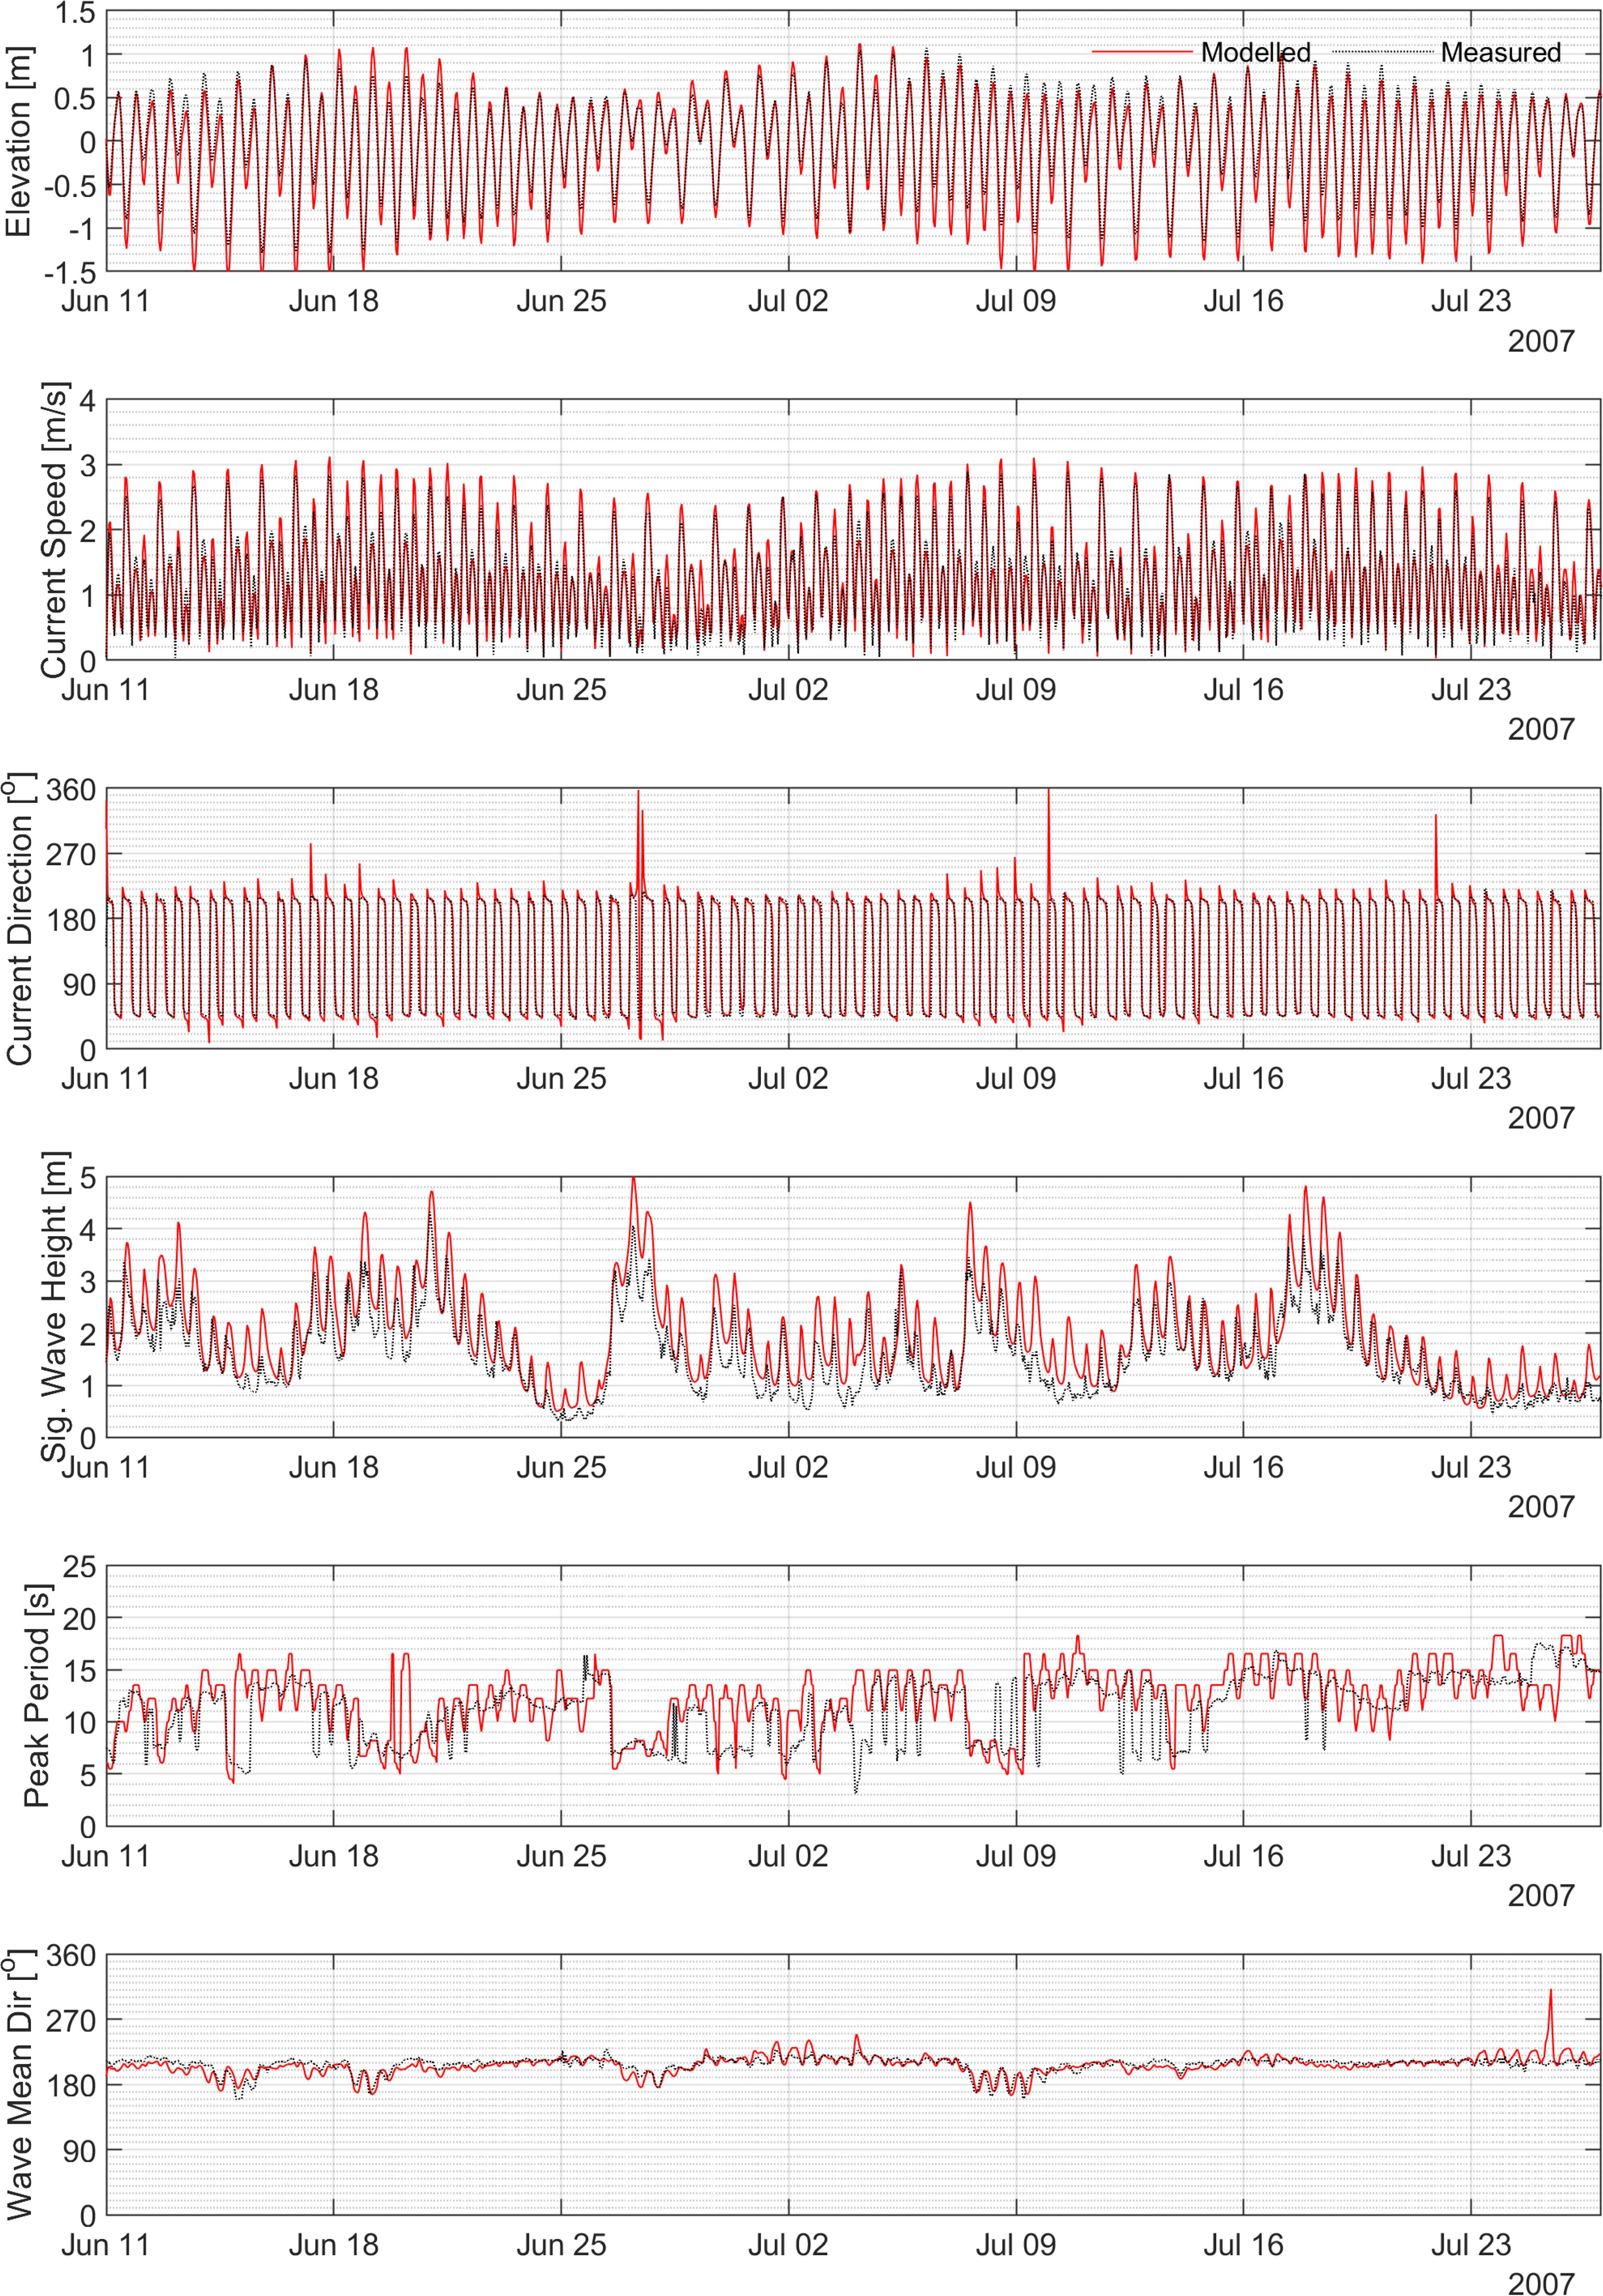
Figure 7. Time series plots comparing modelled and measured water levels, currents (speed and direction), and waves (Hs, peak period, and mean direction) at Port Phillip Head (RBCL) for June and July 2007.
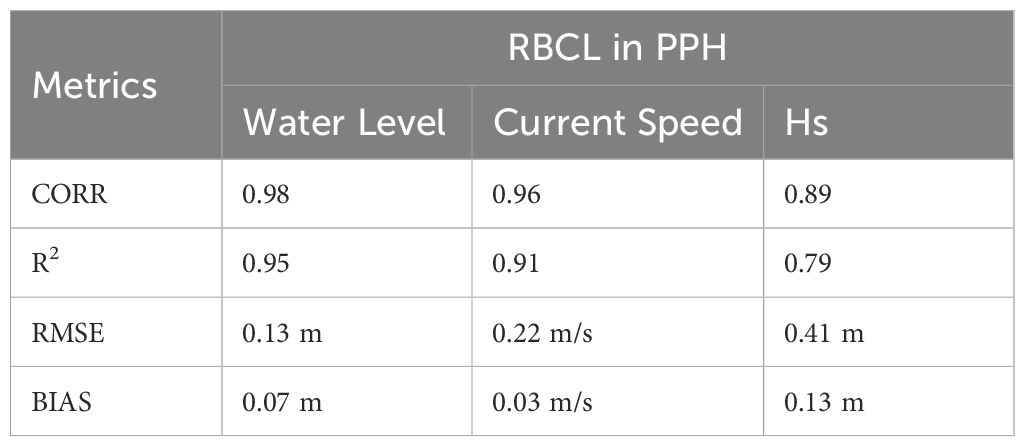
Table 3. Statistical summary for CORR, R2, RMSE, and BIAS at RBCL in PPH for the validation period from June to July 2007.
The overestimation of Hs can be attributed to wave-current interactions and the presence of both swell and wind-sea, which pose challenges in wave modelling. In this region, swells originating from the Southern Ocean frequently interact with strong adverse currents during ebb tides (e.g., when currents from PPB flow out of the bay). The dominance of swells is evident in the mean wave direction varying between 180 and 220 degrees shown in the lowest panel of Figure 7.
2.4.4 Model validation of waves at offshore buoy location
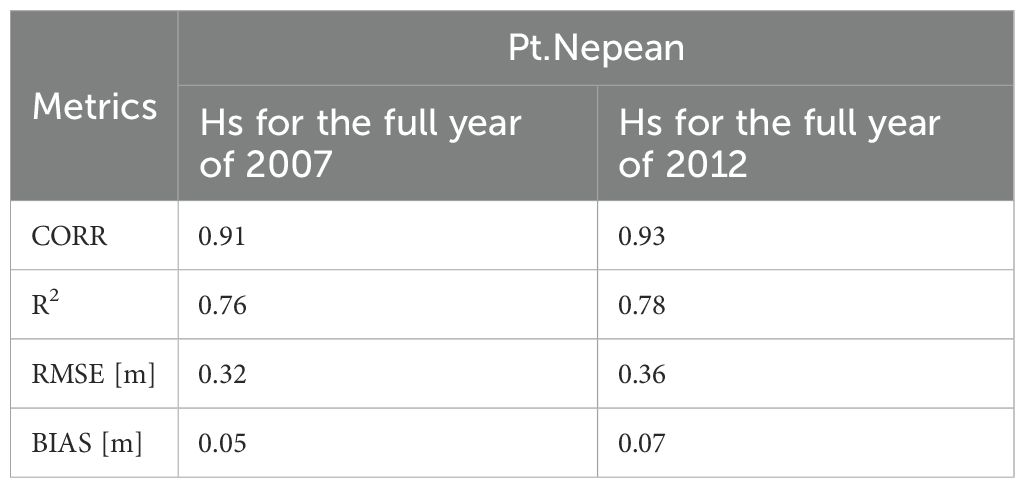
In addition to validating the wave field inside PPB and in PPH, the model validation was also carried out for the offshore wave buoy location at Point Nepean (see Figure 1 for location). Given the abundance of field data at this offshore location, data from two different years (2007 and 2012) were compared with the modelled results.
Figure 8 presents a comparison of the modelled Hs, mean wave direction, and peak period for the entire year of 2007. The results indicate that, while the modelled Hs reasonably follows the observed data, the model tends to overpredict the observed Hs during extreme events. This overestimation can be attributed to the wind adjustment, which applied the same factor over the bay and across the computational grid.
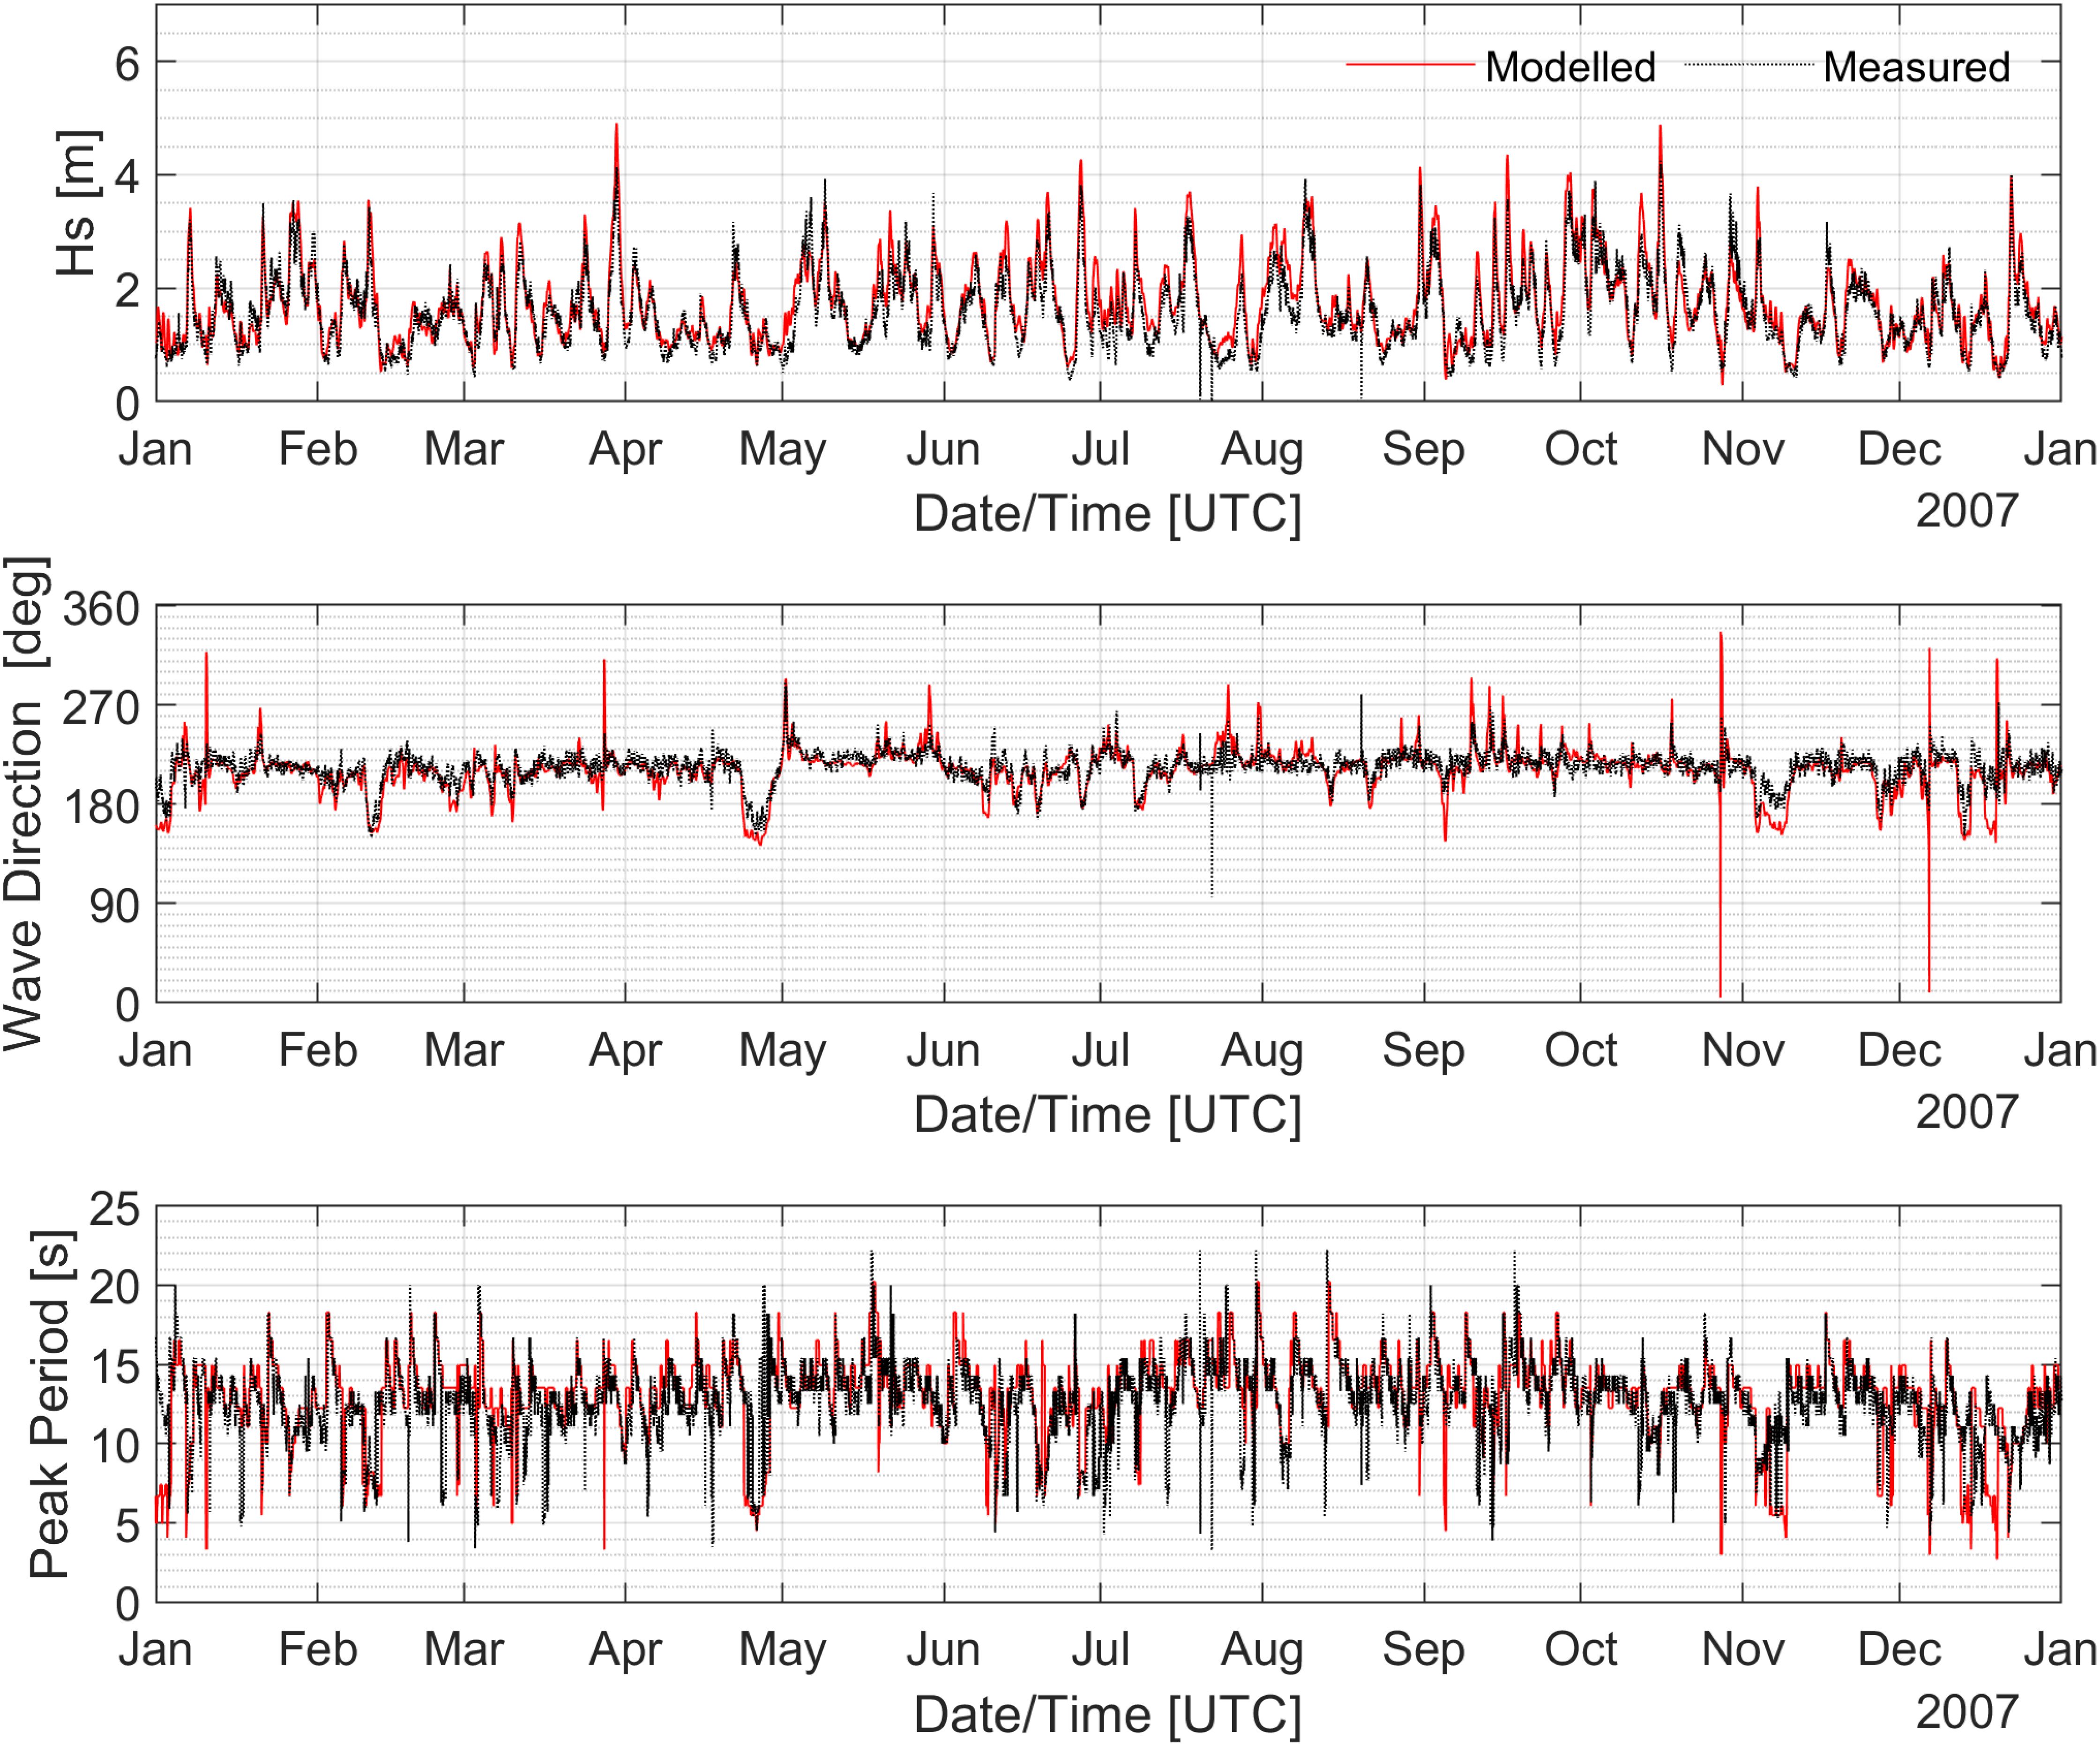
Figure 8. Time series plots comparing modelled and measured Hs, peak period, and mean direction at offshore wave buoy (Pt. Nepean) for a full year of 2007.
However, it can be seen from Table 4 a good agreement between the modelled and measured Hs of above 0.9 was obtained in both years with a bias of 5 cm for 2007 period and 7 cm for 2012 period.
In conclusion, a range of observed datasets was utilised to evaluate the performance of the numerical modelling system employed in this study. The primary objective during the model calibration and validation process was to calibrate and validate the wave model against observed wave buoy data within PPB. This step was crucial before applying the validated models to long-term hindcast simulations.
3 Results
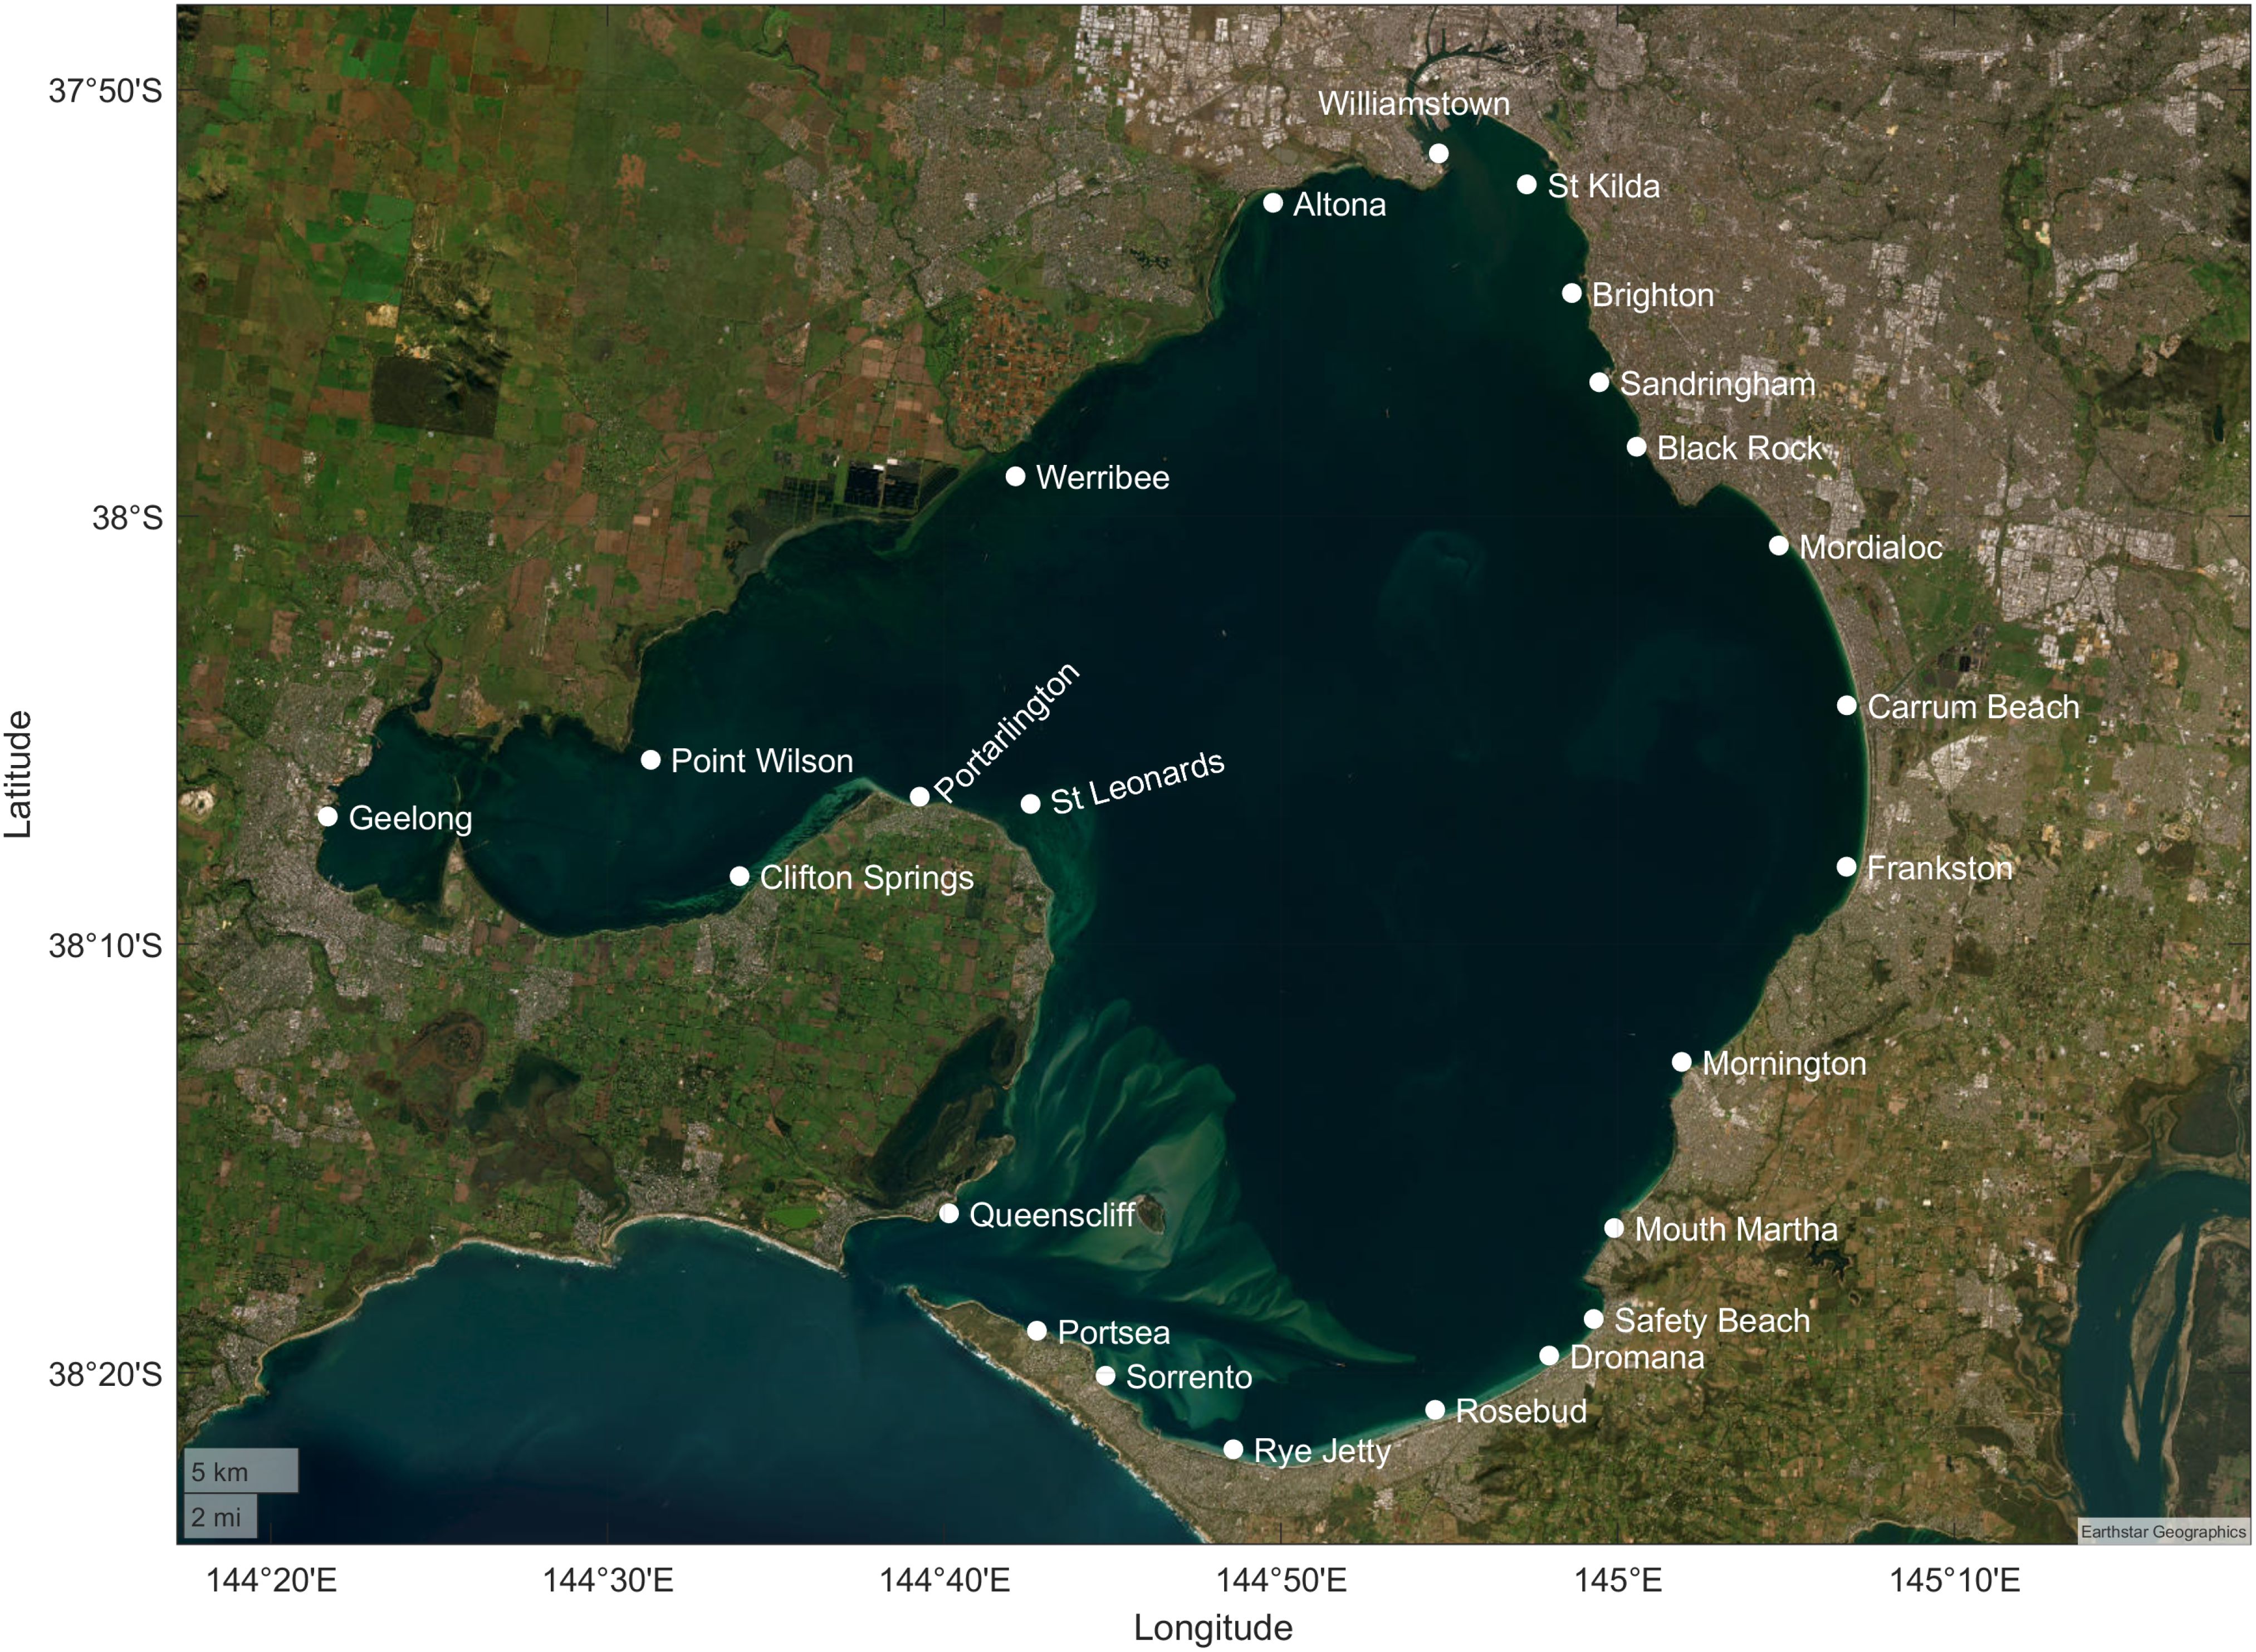
To examine the effects of rising mean sea levels on extreme surges and wind-waves, hourly modelled time-series data at a depth of about 2 m at 24 different locations around PPB were extracted from 32 years of hindcasts (1990-2022) based on five distinct MSL scenarios (existing, 0.5 m, 0.8 m, 1.1 m, and 1.4 m). To account for changes in MSL, the water depth in the computational grid was adjusted by incrementally increasing the depth according to each MSL scenario. These 24 locations correspond to popular beaches around PPB, as illustrated in Figure 9.
3.1 Existing extreme surges and wind-waves patterns
Before investigating changes in extreme surges and wind-waves induced by rising mean sea levels, it is essential to understand the patterns of surge and wind waves under the current sea level scenario. This understanding provides a crucial reference point for estimating changes due to rising mean sea levels (RMSLs). To achieve this, both surge elevations and Hs from the 32-year hindcasts, modelled with the existing mean sea level scenario, were extracted at 24 specific locations for analysis. This targeted approach aims to elucidate regional differences influenced by various factors, including wind patterns and geographical features. It is important to note that surge levels were derived from the total modelled water levels by removing all astronomical tidal elevations. Consequently, changes in astronomical tidal elevations are not considered in the present study.
3.1.1 Extreme surges
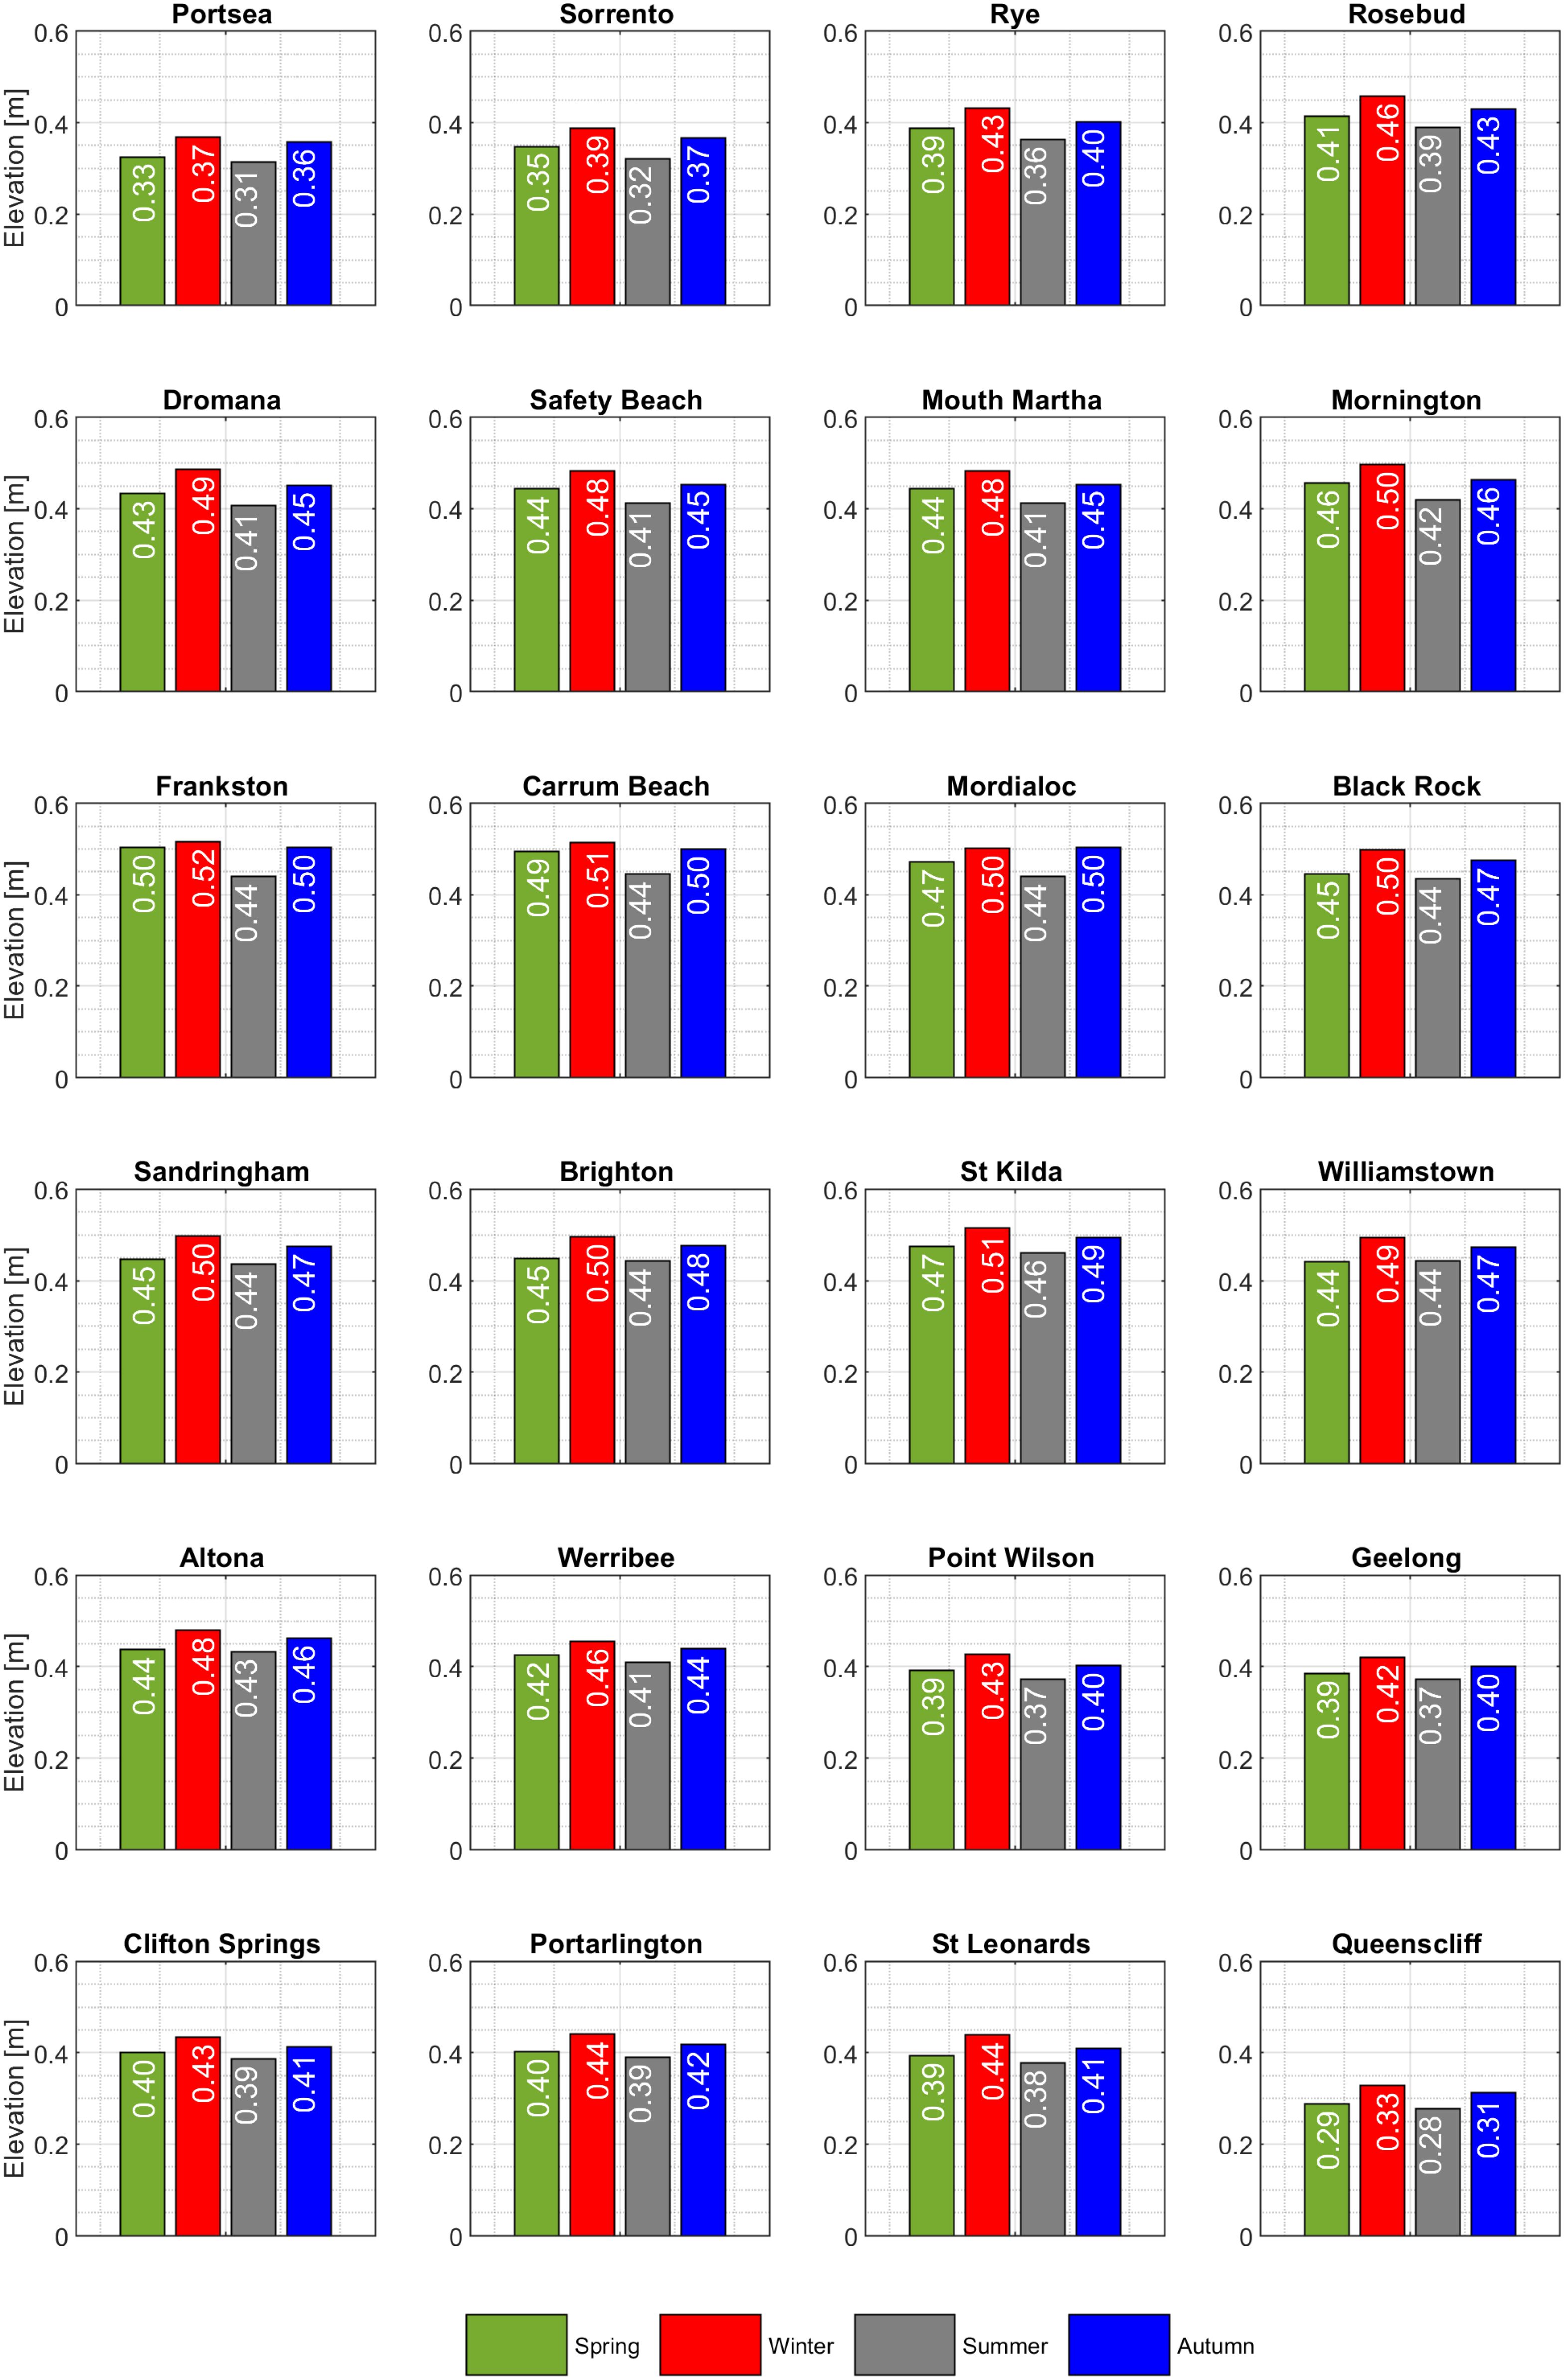
Figure 10 shows estimated extreme surge levels in four different seasons (spring, winter, summer, autumn) at selected locations based on the median of annual maximum values. These median values present the central tendency for extreme surges over a 32-year hindcast dataset across different locations, and thus these measures provide a practical way to understand typical maximum values without being overly influenced by extremely high or low surge values over the period.
Of all seasons, winter experiences the highest extreme surge levels, while summer experiences the lowest. This can be explained by the fact that storms in PPB during the winter months often come with strong winds induced by weather systems such as the cold fronts (McInnes and Hubbert, 2003). This seasonal variation in surge levels is an important aspect of coastal dynamics in PPB where the interplay between meteorological conditions and geographical orientation can lead to significant differences. In winter, large surges are often caused by the prevalent cold fronts, a characteristic weather pattern in Victoria. These cold fronts are typically accompanied by westerly or south-westerly winds, which, when sweeping across the bay, exert a pushing force on the water, driving it towards the eastern and north-eastern shores. As a result, the north-eastern and eastern areas of PPB are thus more susceptible to these high surge levels. In winter, the largest median of annual maximum surge of 0.52 m is at Frankston which is 0.1 m higher than those levels found at Carrum Beach and St Kilda. In the context of St. Kilda, the surge levels in summer are found to be the highest. This would be expected due to cold fronts with the south-westerly winds, which have a long-fetch over the bay which means they travel over a large expanse of water. This fetch allows the winds to gain momentum and energy, resulting in larger surges, particularly in the north-east region of the bay. These surges can be further amplified by the local topography and bathymetry, which can channel and intensify the wind and wave action, leading to higher surge levels at St. Kilda during the summer months.
The difference between the surge level in winter and summer also varies across the bay from 10% at Clifton Springs to 22% at Sorrento, illustrating the variability within the bay itself. This variation reflects a complex interaction between the wind pattern and coastal topographic features across different areas within the bay. For example, the coastal dynamics at Clifton Springs and Sorrento are shaped by the unique geographical characteristics and seasonal wind patterns of each location. At Clifton Springs, the minimal variation in surge levels between winter and summer can be attributed to the area’s topography, which provides natural barriers to the wind fetch causing the local wind field to have only minor seasonal changes, likely due to the sheltering effect of surrounding landforms. In contrast, Sorrento’s maximum seasonal disparity in surge levels underscores the area’s exposure to the seasonal wind patterns. For example, the northerly winds in winter contribute to the longest wind fetch compared to other directions throughout the year. This results in higher median annual maximum surge levels during the colder months. Conversely, the westerly and south-westerly winds, typically associated with cold fronts, are less influential due to their shorter fetch caused by the area’s orientation. These winds fail to generate substantial surges at Sorrento. Of all seasons, the surge levels at Queenscliff are found to be lower than at other locations in both winter and summer. This can be attributed to the prevailing wind directions—northerly and south-westerly—which have a relatively short fetch in this region.
Figure 11 shows the seasonal distribution of extreme surge events based on the top 32 surge events which were sorted from the 32-year hindcast data across 24 distinct locations. The results reveal a pronounced winter dominance, with 17 locations recording winter contributions ranging from 28% to 44%. This pattern underscores the significant impact of the winter wind field, which is characteristically more robust during this season, contributing to the frequency and intensity of surge events.
The dominance of winter in the occurrence of the top 32 largest surge events across various locations (17 out of 24 stations) highlighting the influence of the wind field, is a notable pattern. This wind field is typically stronger during the winter months compared to other seasons, particularly in regions situated between Sorrento and Dromana. These areas are prone to experiencing larger surges more frequently than other areas within PPB. The expectation of these regions receiving northerly winds that travel over the bay’s surface from a considerable distance to the north contributes to the generation of large surges during the winter season.
In contrast, the summer and spring seasons exhibit a markedly lower incidence of extreme surges, with their contributions being the smallest across 12 locations, fluctuating between 6% and 22%. Notably, Safety Beach, Mount Martha, Werribee, and Queenscliff share an equal distribution of 22% for both summer and spring surge events. This parity is particularly interesting at Safety Beach and Mount Martha, where autumn also mirrors the 22% contribution, indicating a more uniform distribution of surge events across these seasons. In general, the results depicted in 11 indicate that extreme storm surge events are uniformly distributed across different seasons. This uniformity extends from the eastern side of the bay at Safety Beach to the western side at Werribee, suggesting a consistent impact of surge-related phenomena across these areas throughout the year. This contrasts with the variability found in the south-western areas of PPB from Point Wilson to Clifton Springs.
In summary, the analysis of seasonal surge event distributions offers insightful revelations into the atmospheric forces at play in PPB. For example, the winter season’s predominance in extreme surge events highlights the integral role of seasonal wind patterns in shaping the bay’s hydrodynamic environment.
3.1.2 Extreme wind-waves
In the context of extreme wind waves, the median of annual maximum Hs and the seasonal distributions of Hs based on the top 32 largest values over a 32-year hindcast data period at 24 selected locations were also analysed. The median of annual maximum Hs provides a valuable metric for assessing the average extreme conditions at a given location, while analysing the top 32 largest values over a 32-year hindcast period helps identify patterns that may not be evident in the median extreme conditions.
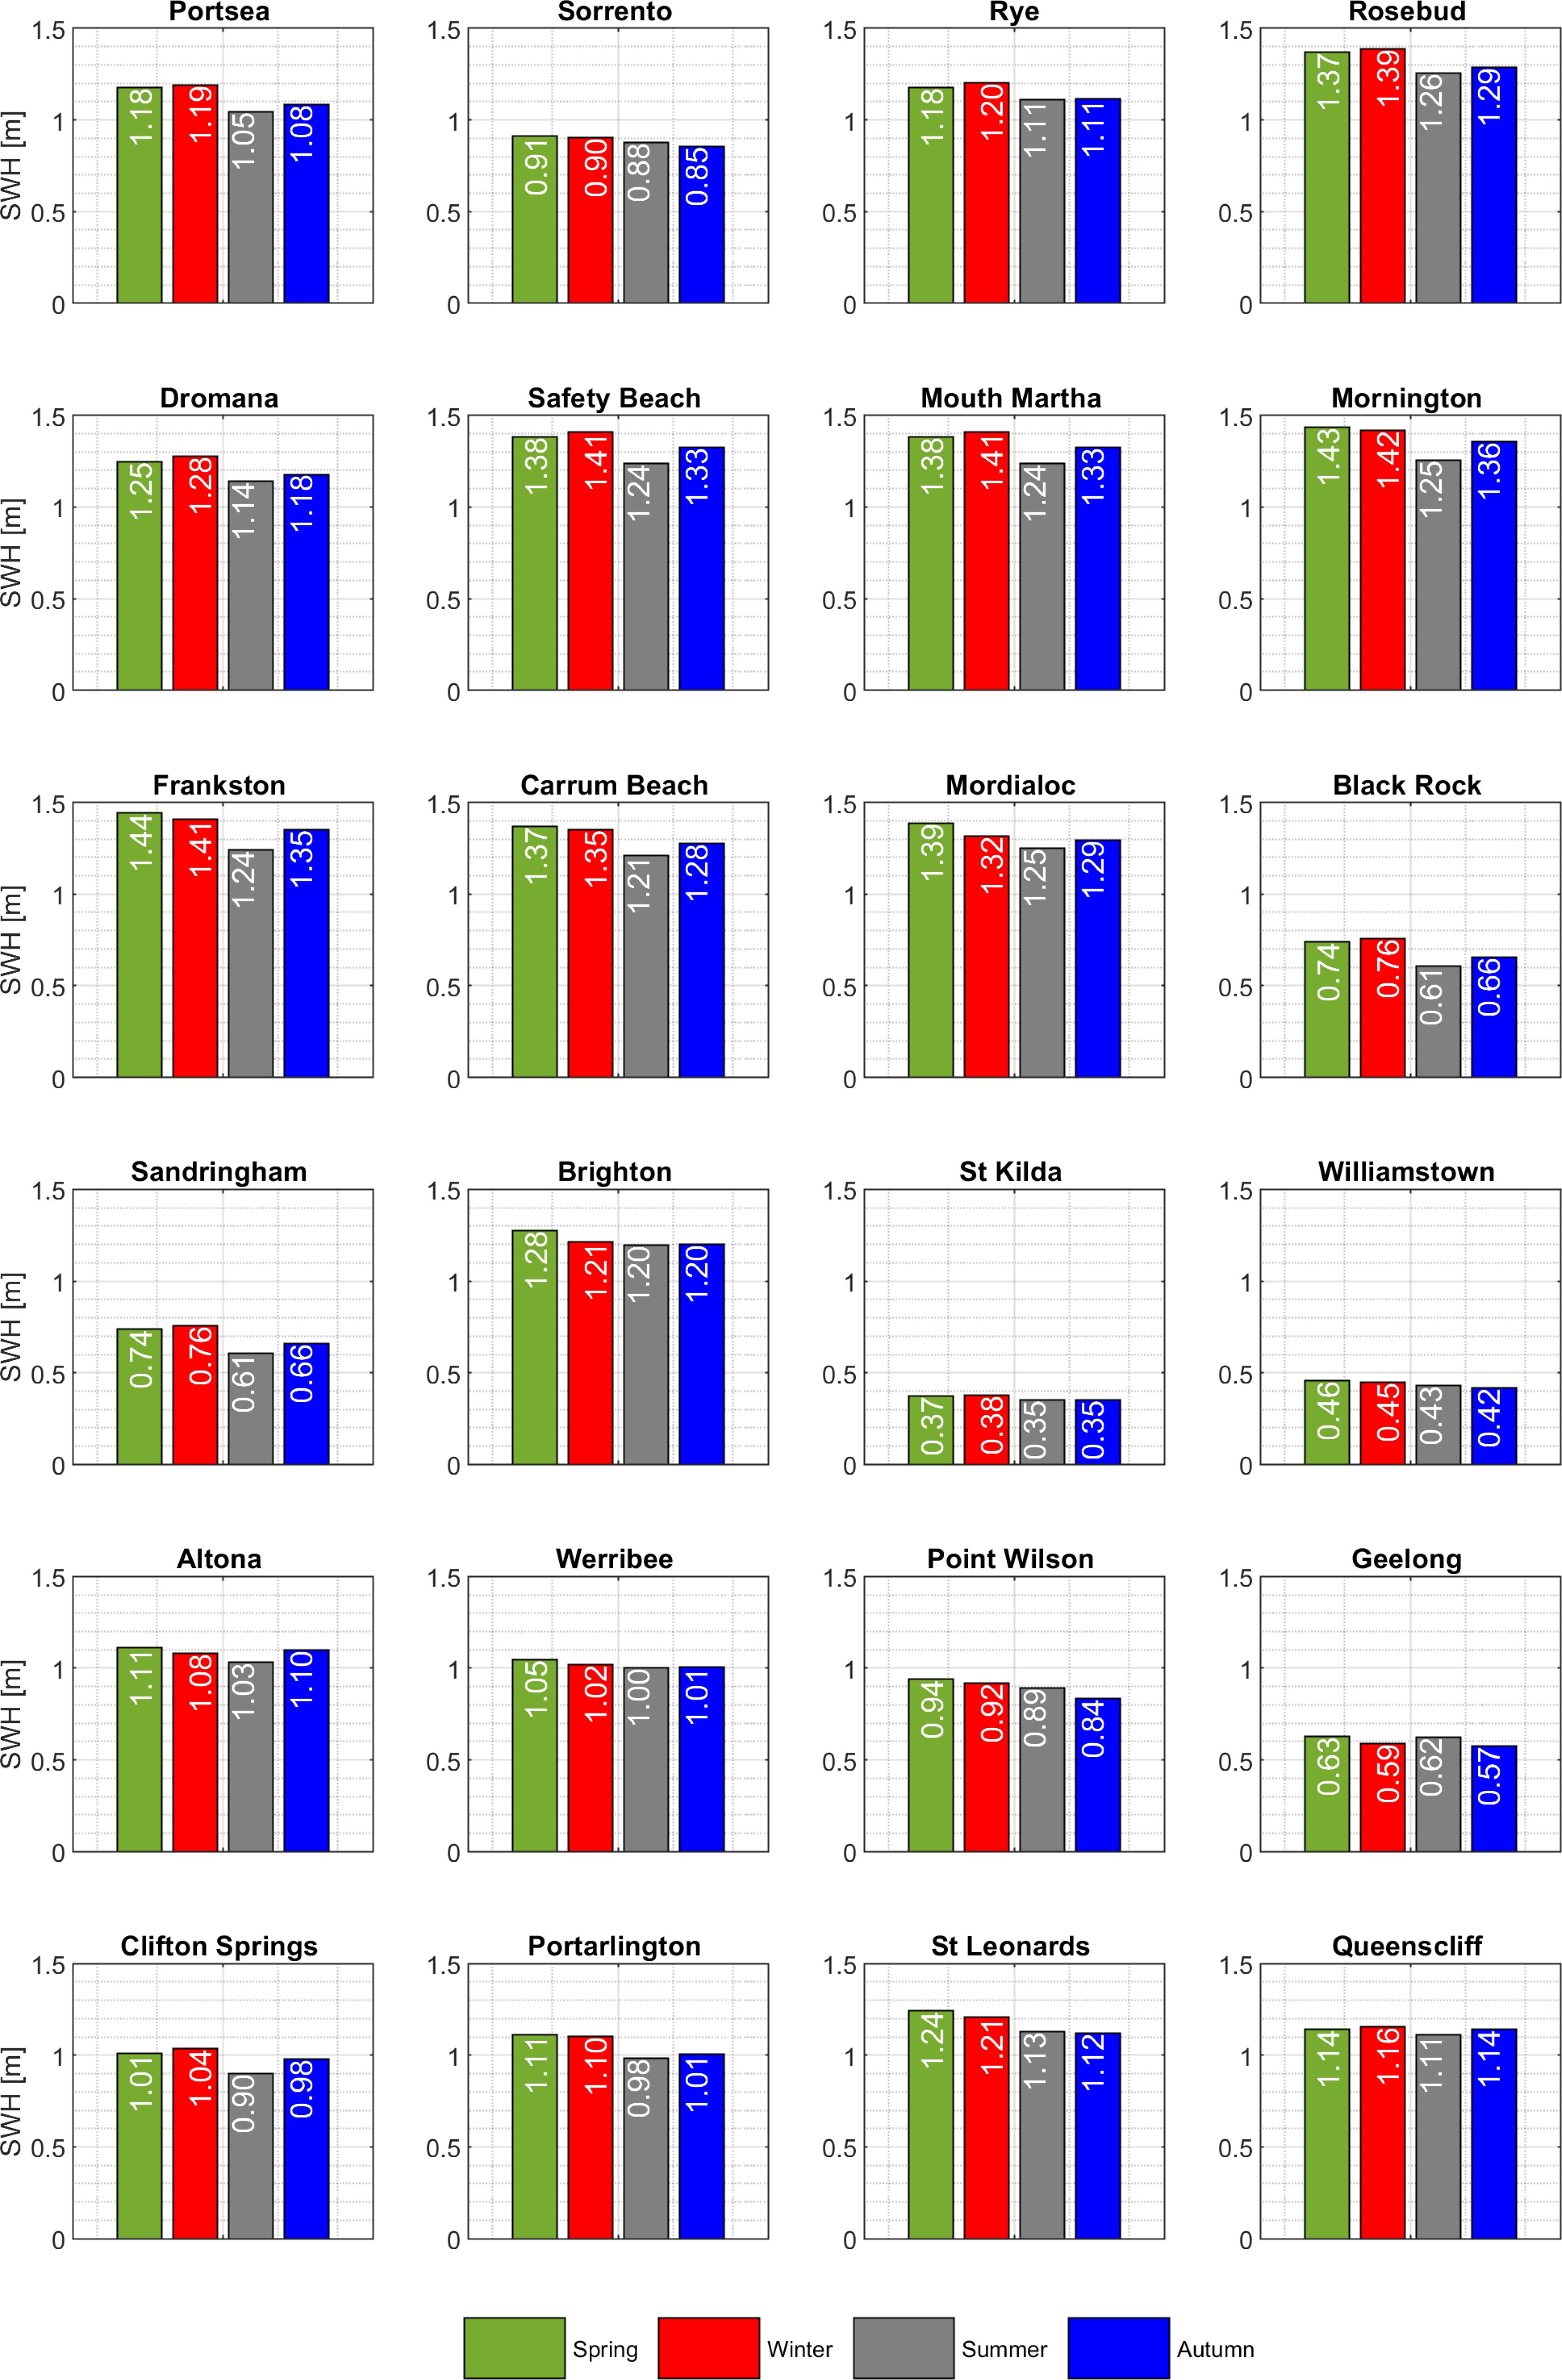
Figure 12 presents the median of annual maximum Hs at 24 locations around PPB. For consistency, each bar chart in the figure consists of four seasons and is kept in the same order and scale.
An important feature is that the median of annual maximum Hs on the eastern side of the Bay, particularly from Safety Beach to Mordialloc, is found to be higher than in other regions within the bay. On the eastern side, Frankston is identified as the location with the highest median of maximum Hs during spring, reaching up to 1.4 m, which is 3 cm higher than the median observed in winter. It is also revealed that the median of annual maximum Hs at Frankston is the same as those in Mount Martha and Safety Beach and comparable to that in Mornington. The more pronounced wave extremes on the eastern side compared to other regions within PPB could be attributed to various geographical and meteorological factors. For instance, the orientation of the coastline, and prevailing wind patterns from cold fronts caused by strong westerly or south-westerly winds can all influence the magnitude of Hs.
On the north-eastern side, St Kilda exhibits the smallest median of annual maximum wave heights (Hs) throughout the year. This is particularly noteworthy when contrasted with the surge patterns in the same location, which are comparable to those on the eastern side of Port Phillip Bay (PPB). The disparity between the wave and surge patterns at St Kilda could indicate complex interactions between tidal forces and local topography. While similar non-linear interactions might be expected elsewhere on the north-eastern side of the bay, St Kilda’s unique local bathymetry and coastal features could play a significant role in this phenomenon. The specific shape and depth of the seabed at St Kilda may amplify or dampen wave energy differently compared to other areas. The phenomenon of tide-wave interaction is a well-documented factor that can significantly influence wave behaviour. For example, during periods of low tide, the reduced water depth can limit waves from reaching their maximum potential height, especially during large surge events. This effect is further compounded by the local bathymetry, which can dampen wave energy.
Seasonal variations in Hs are also noteworthy, as they provide insights into the temporal changes in wave energy. At many stations, the median of annual maximum Hs during winter is comparable to those in spring. This indicates that the wave-generating weather systems are active during both seasons, leading to similar wave conditions. Similarly, the median of annual maximum Hs in summer at many locations across the bay is comparable to those in autumn. It is noted that while winter and spring, as well as summer and autumn are shown to share certain similarities in terms of median annual maximum Hs, their surge patterns as shown previously do not.
For example, the median of annual maximum surges is generally smaller than that in winter, while the median of annual maximum Hs is comparable to winter values. This presents an intriguing aspect of coastal dynamics, suggesting that while surges may not always reach their peak during winter at the same time as the peak wave energy, the energy transferred to waves can result in Hs that rival winter conditions. This could be attributed to various factors, including meteorological conditions, tide-wave interaction and local bathymetry effects which would require further investigations.
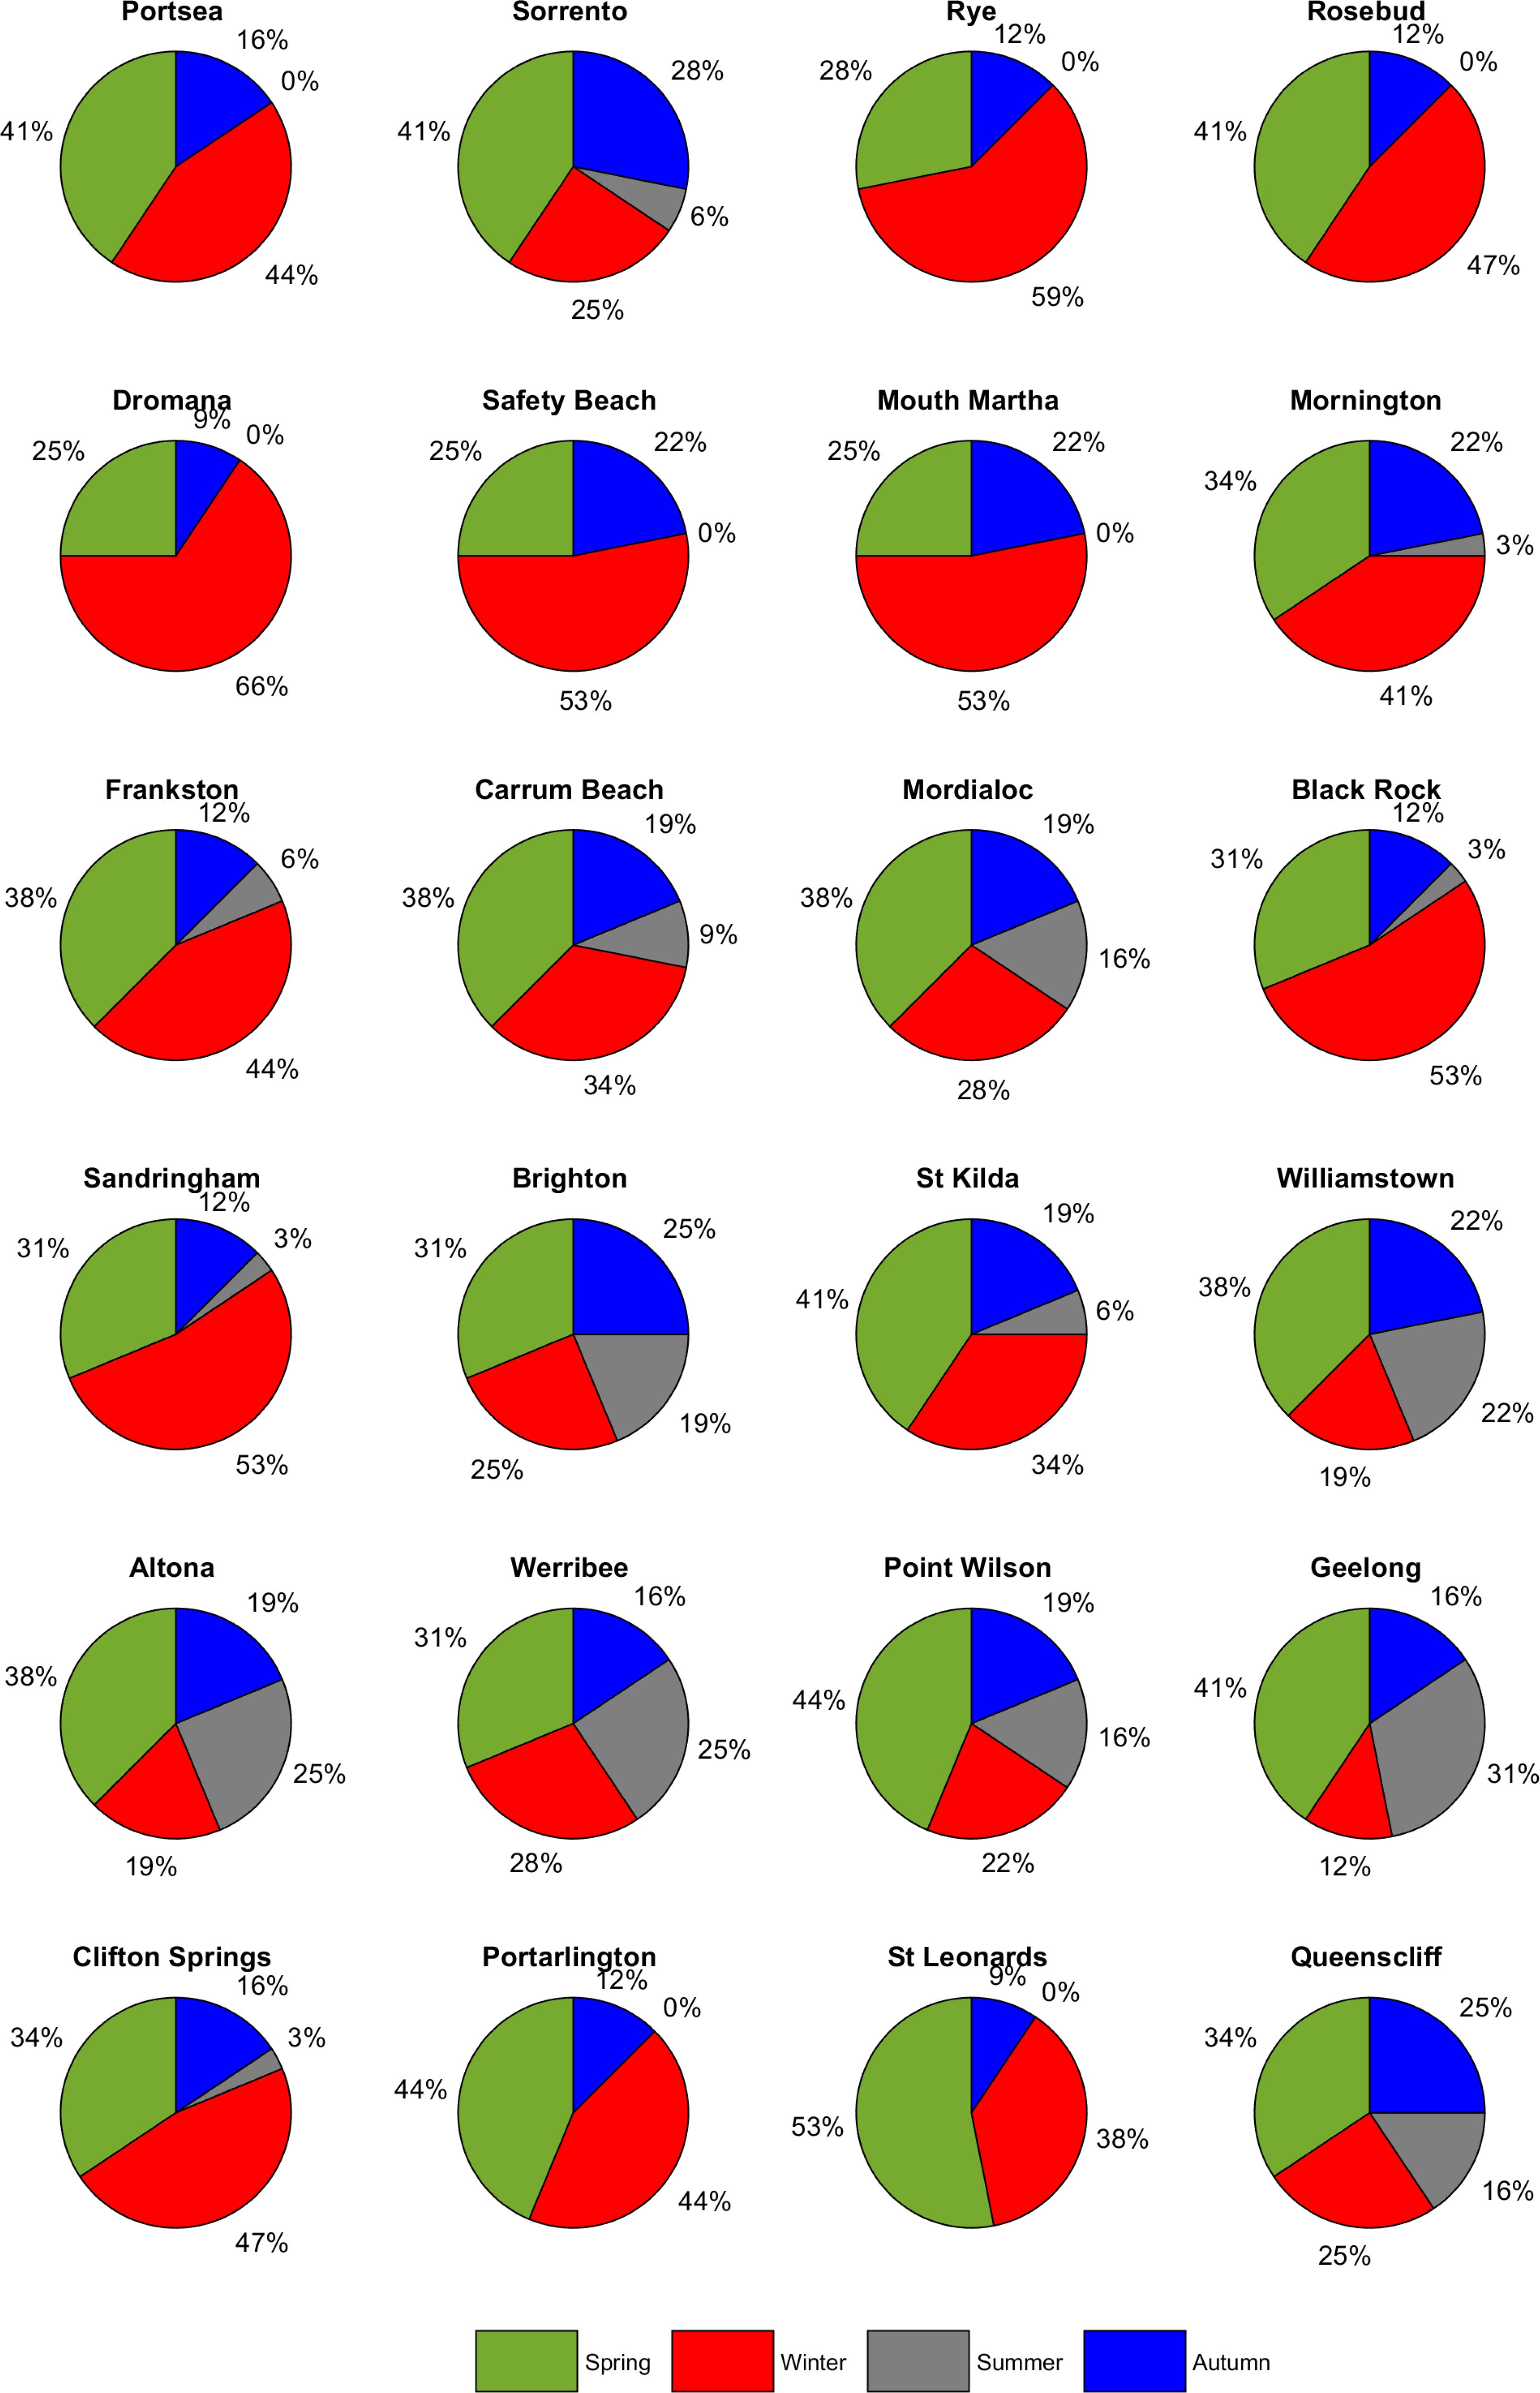
Further details of seasonal variations of the wave field were also examined in terms of the top 32 wave extreme events. Figure 13 shows seasonal distribution charts of extreme wind-waves based on the top 32 largest values at 24 stations across the bay. It is clear that the colder seasons of winter and spring present a stark contrast, with each season vying for dominance in the number of extreme wind-wave events. At 12 stations, these seasons alternate in contributing the largest portion of extreme values. This seasonal rivalry could be attributed to various atmospheric and oceanographic factors, such as increased storm activity and shifting wind patterns, which are known to influence wave generation.
Conversely, summer contributes minimally to the extreme values. Specifically, no summer event ranks among the top 32 extreme values at 10 stations from the eastern side to the south-western side of the bay. The disappearance of summer values from these stations suggests that the top 32 events are consistently higher than the central tendency. For instance, if the median of annual maximum Hs at Safety Beach is 1.24 m (as shown previously in Figure 12) during summer and no event in summer contributes to the top 32 events, all top 32 values should be higher than 1.24m.
3.2 Potential changes in surges and Hs
Potential effects of rising sea levels were investigated based on data extracted from 32-year hindcasts applied to five different mean sea level scenarios including 0 m SLR, 0.5 m SLR, 0.8 m SLR, 1.1 m SLR and 1.4 m SLR. The scenarios ranging from no sea level rise (0 m SLR) to a significant rise (1.4 m SLR) encompass a broad spectrum of possibilities, providing a comprehensive view of the potential effects. Focussing on surge levels and Hs rather than total storm tide levels, which are expected to increase with mean sea level rise, provides a more nuanced understanding of the specific changes that could occur. This approach allows for a clear understanding of how surge levels themselves might change under different SLR scenarios. The potential changes in surge levels and Hs were investigated and presented in this study in terms of the median annual maximum values.
3.2.1 Changes in surge levels
Changes in surge levels were investigated based on five selected mean sea level rise scenarios at 24 selected stations in the PPB. By analysing data from 24 selected stations across PPB, the study ensures a geographically diverse representation, which is crucial for capturing the regional variations in sea level rise and its effects on surge levels.
Figure 14 presents the estimated median of annual maximum surge levels at 24 selected stations. The median annual maximum values in each scenario were calculated from the 32 year-hindcast without separating seasons as one would expect that seasonal variations are less significant than the overall trend of increasing mean sea levels, which is a reasonable assumption given that sea level rise is a long-term phenomenon.
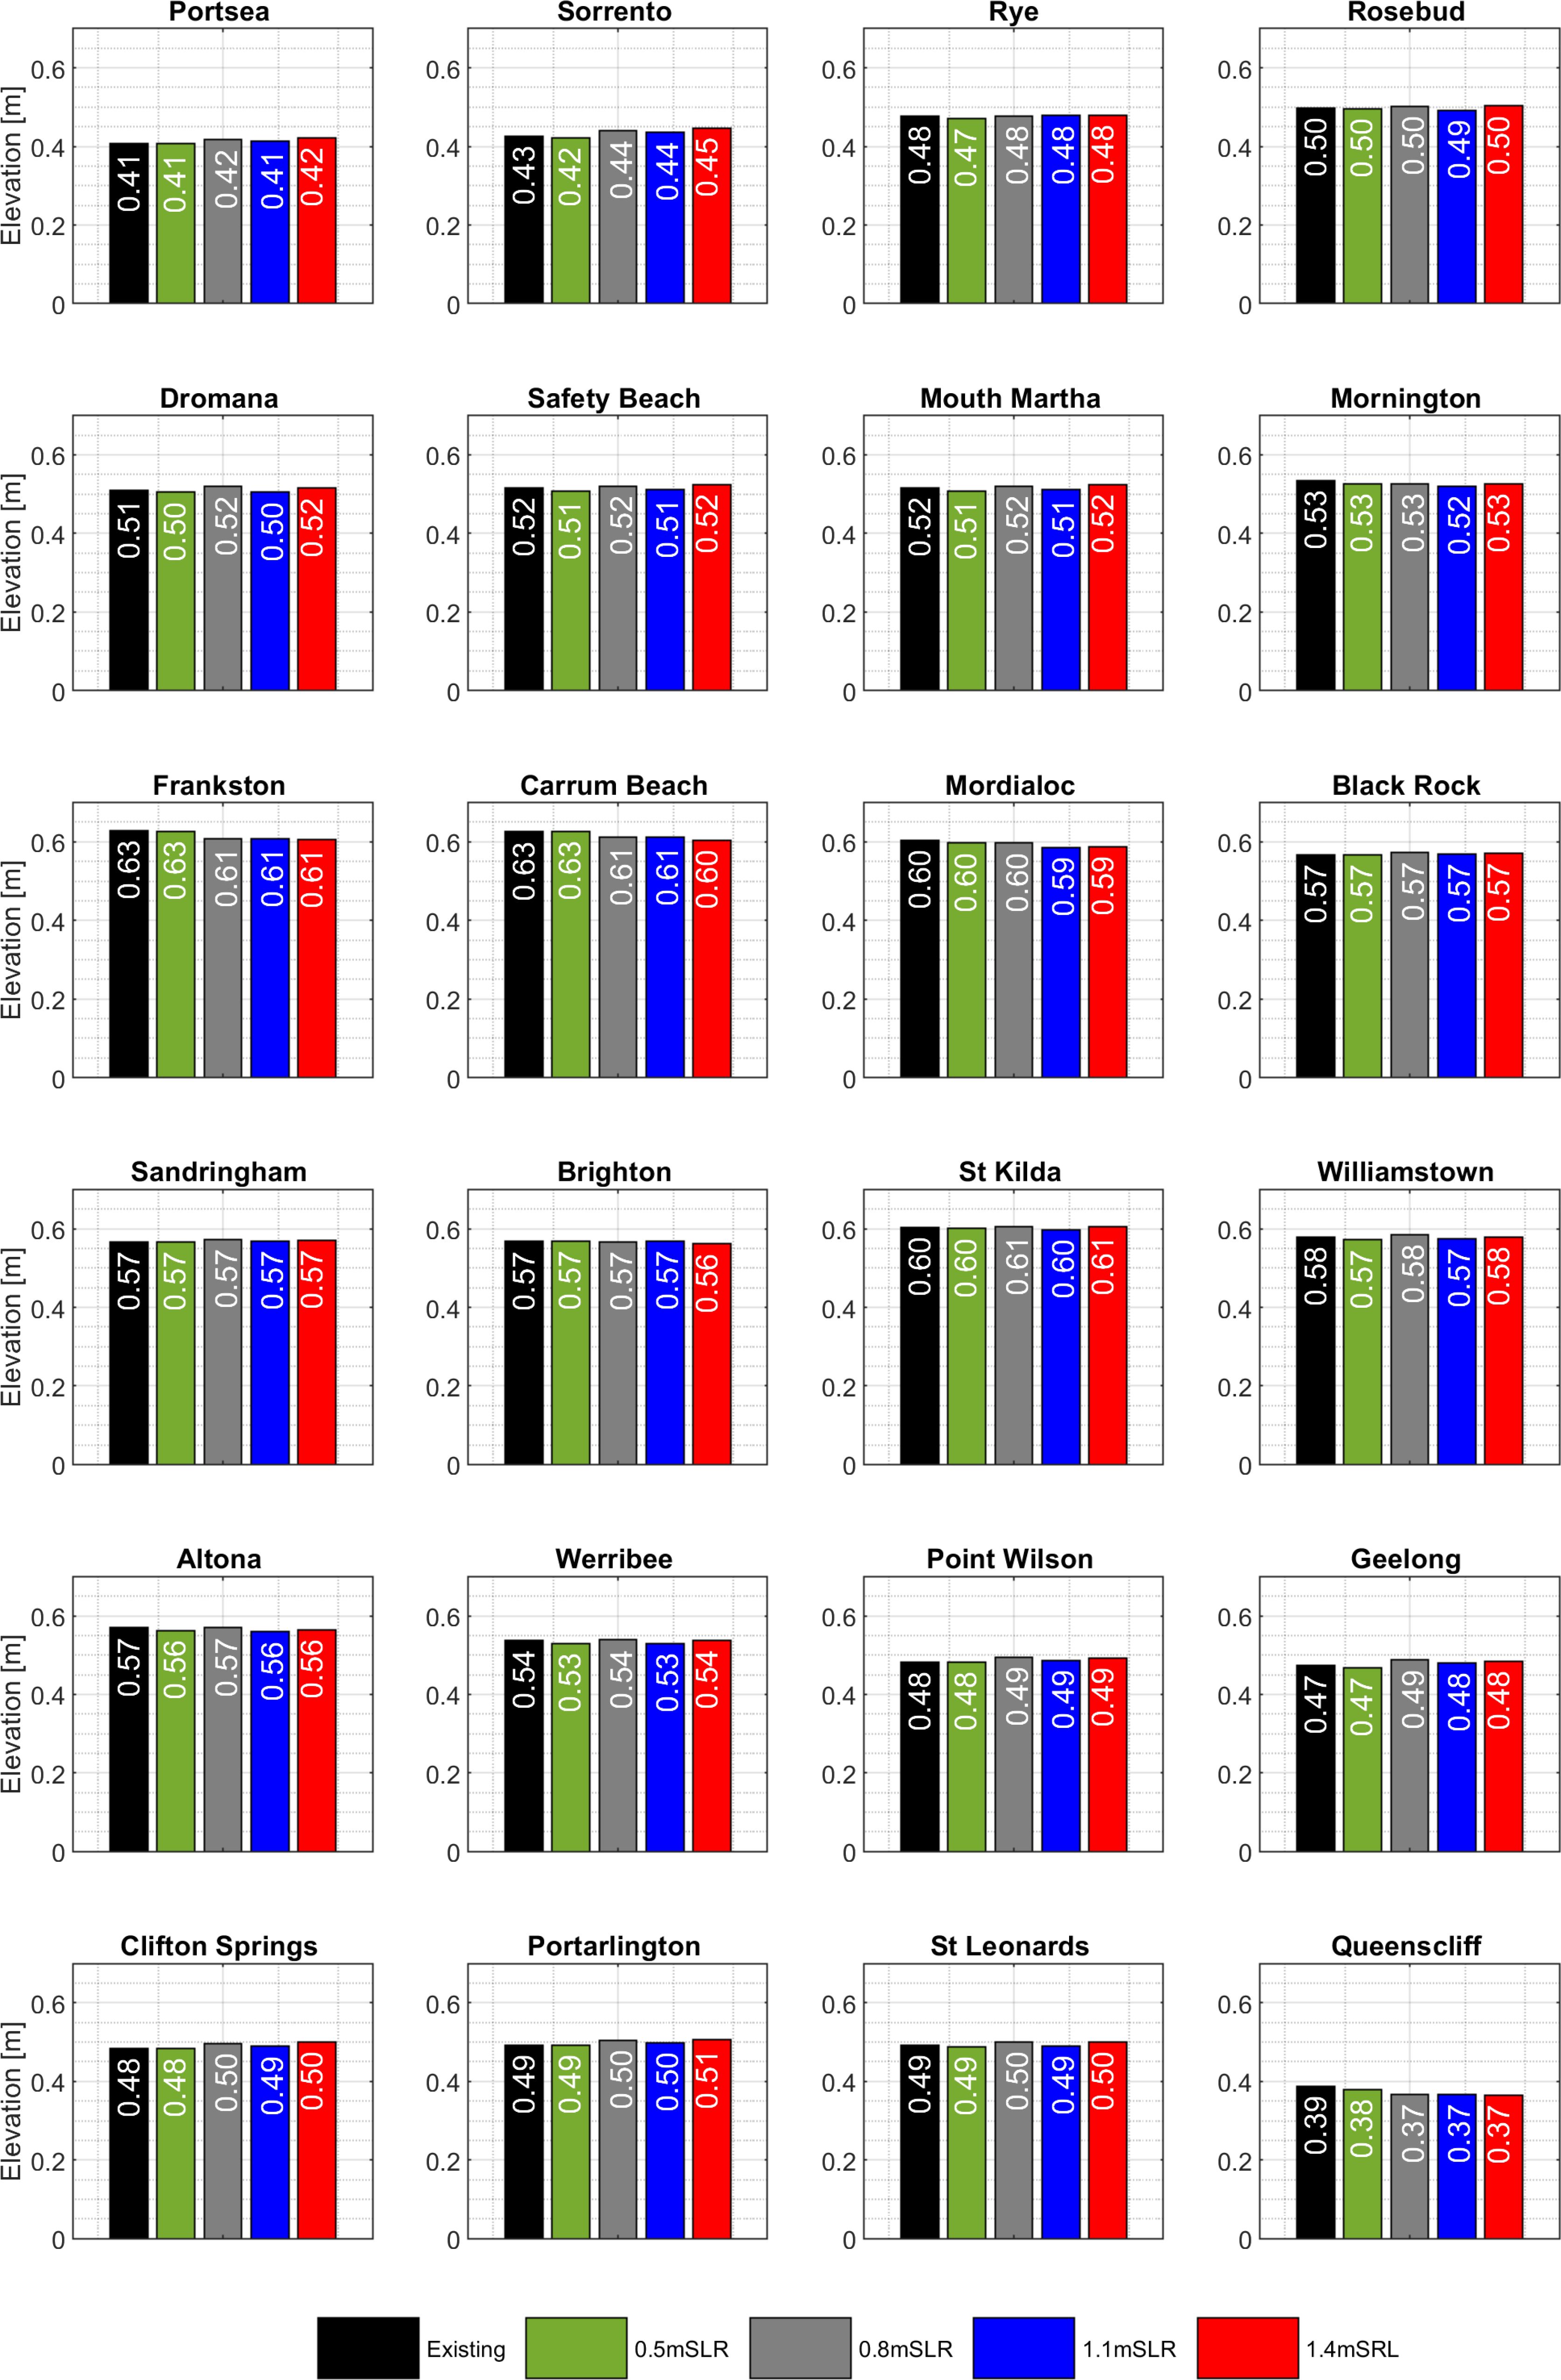
Figure 14. Estimated changes in surge levels due to rising mean sea levels at different locations around PPB.
A general observation across a majority of locations is that there is no consistent evidence that increasing mean sea levels invariably lead to higher surge levels. In other words, there is no direct correlation between increasing mean sea levels and higher surges across all locations. This suggests that surge levels may not be uniformly sensitive to changes in mean sea level, a finding that aligns with similar studies such as Zhao et al. (2014). However, it is important to note that the results are not uniform across all stations. For instance, several stations on the eastern side of PPB exhibited a slight decreasing trend in surge levels concurrent with rising mean sea levels, which is consistent with findings from other studies. For example, Shen et al. (2019) examined the effects of sea level rise on storm surge and waves in the Yangtze River Estuary in China and found that a rise in water depth by 1 m could lead to a reduction in the peak storm surge by 0.15 m. These variations indicate that the relationship between mean sea level rise and surge levels is complex and influenced by local factors. Therefore, while a general pattern may be observed, it is crucial to consider the specific conditions at each location when interpreting the results.
3.2.2 Extreme wind-waves
Figure 15 shows the median of annual maximum Hs across 24 locations based on five MSL scenarios. Generally speaking, there is a clear evidence that increasing MSL correlates with an intensified wave field in many stations. This suggests that wave dynamics are more sensitive to changes in MSL. In particular, the comparison between the mean sea level at 1.4 m and the existing scenario reveals a substantial difference on the eastern side and near the entrance of the bay. For example, Mornington experiences an increase of up to 0.52 m, which translates to a 32% change while Queenscliff sees an increase of up to 0.45 m. Queenscliff, in particular, is highlighted as the location where the most significant percentage difference is up to 38%.
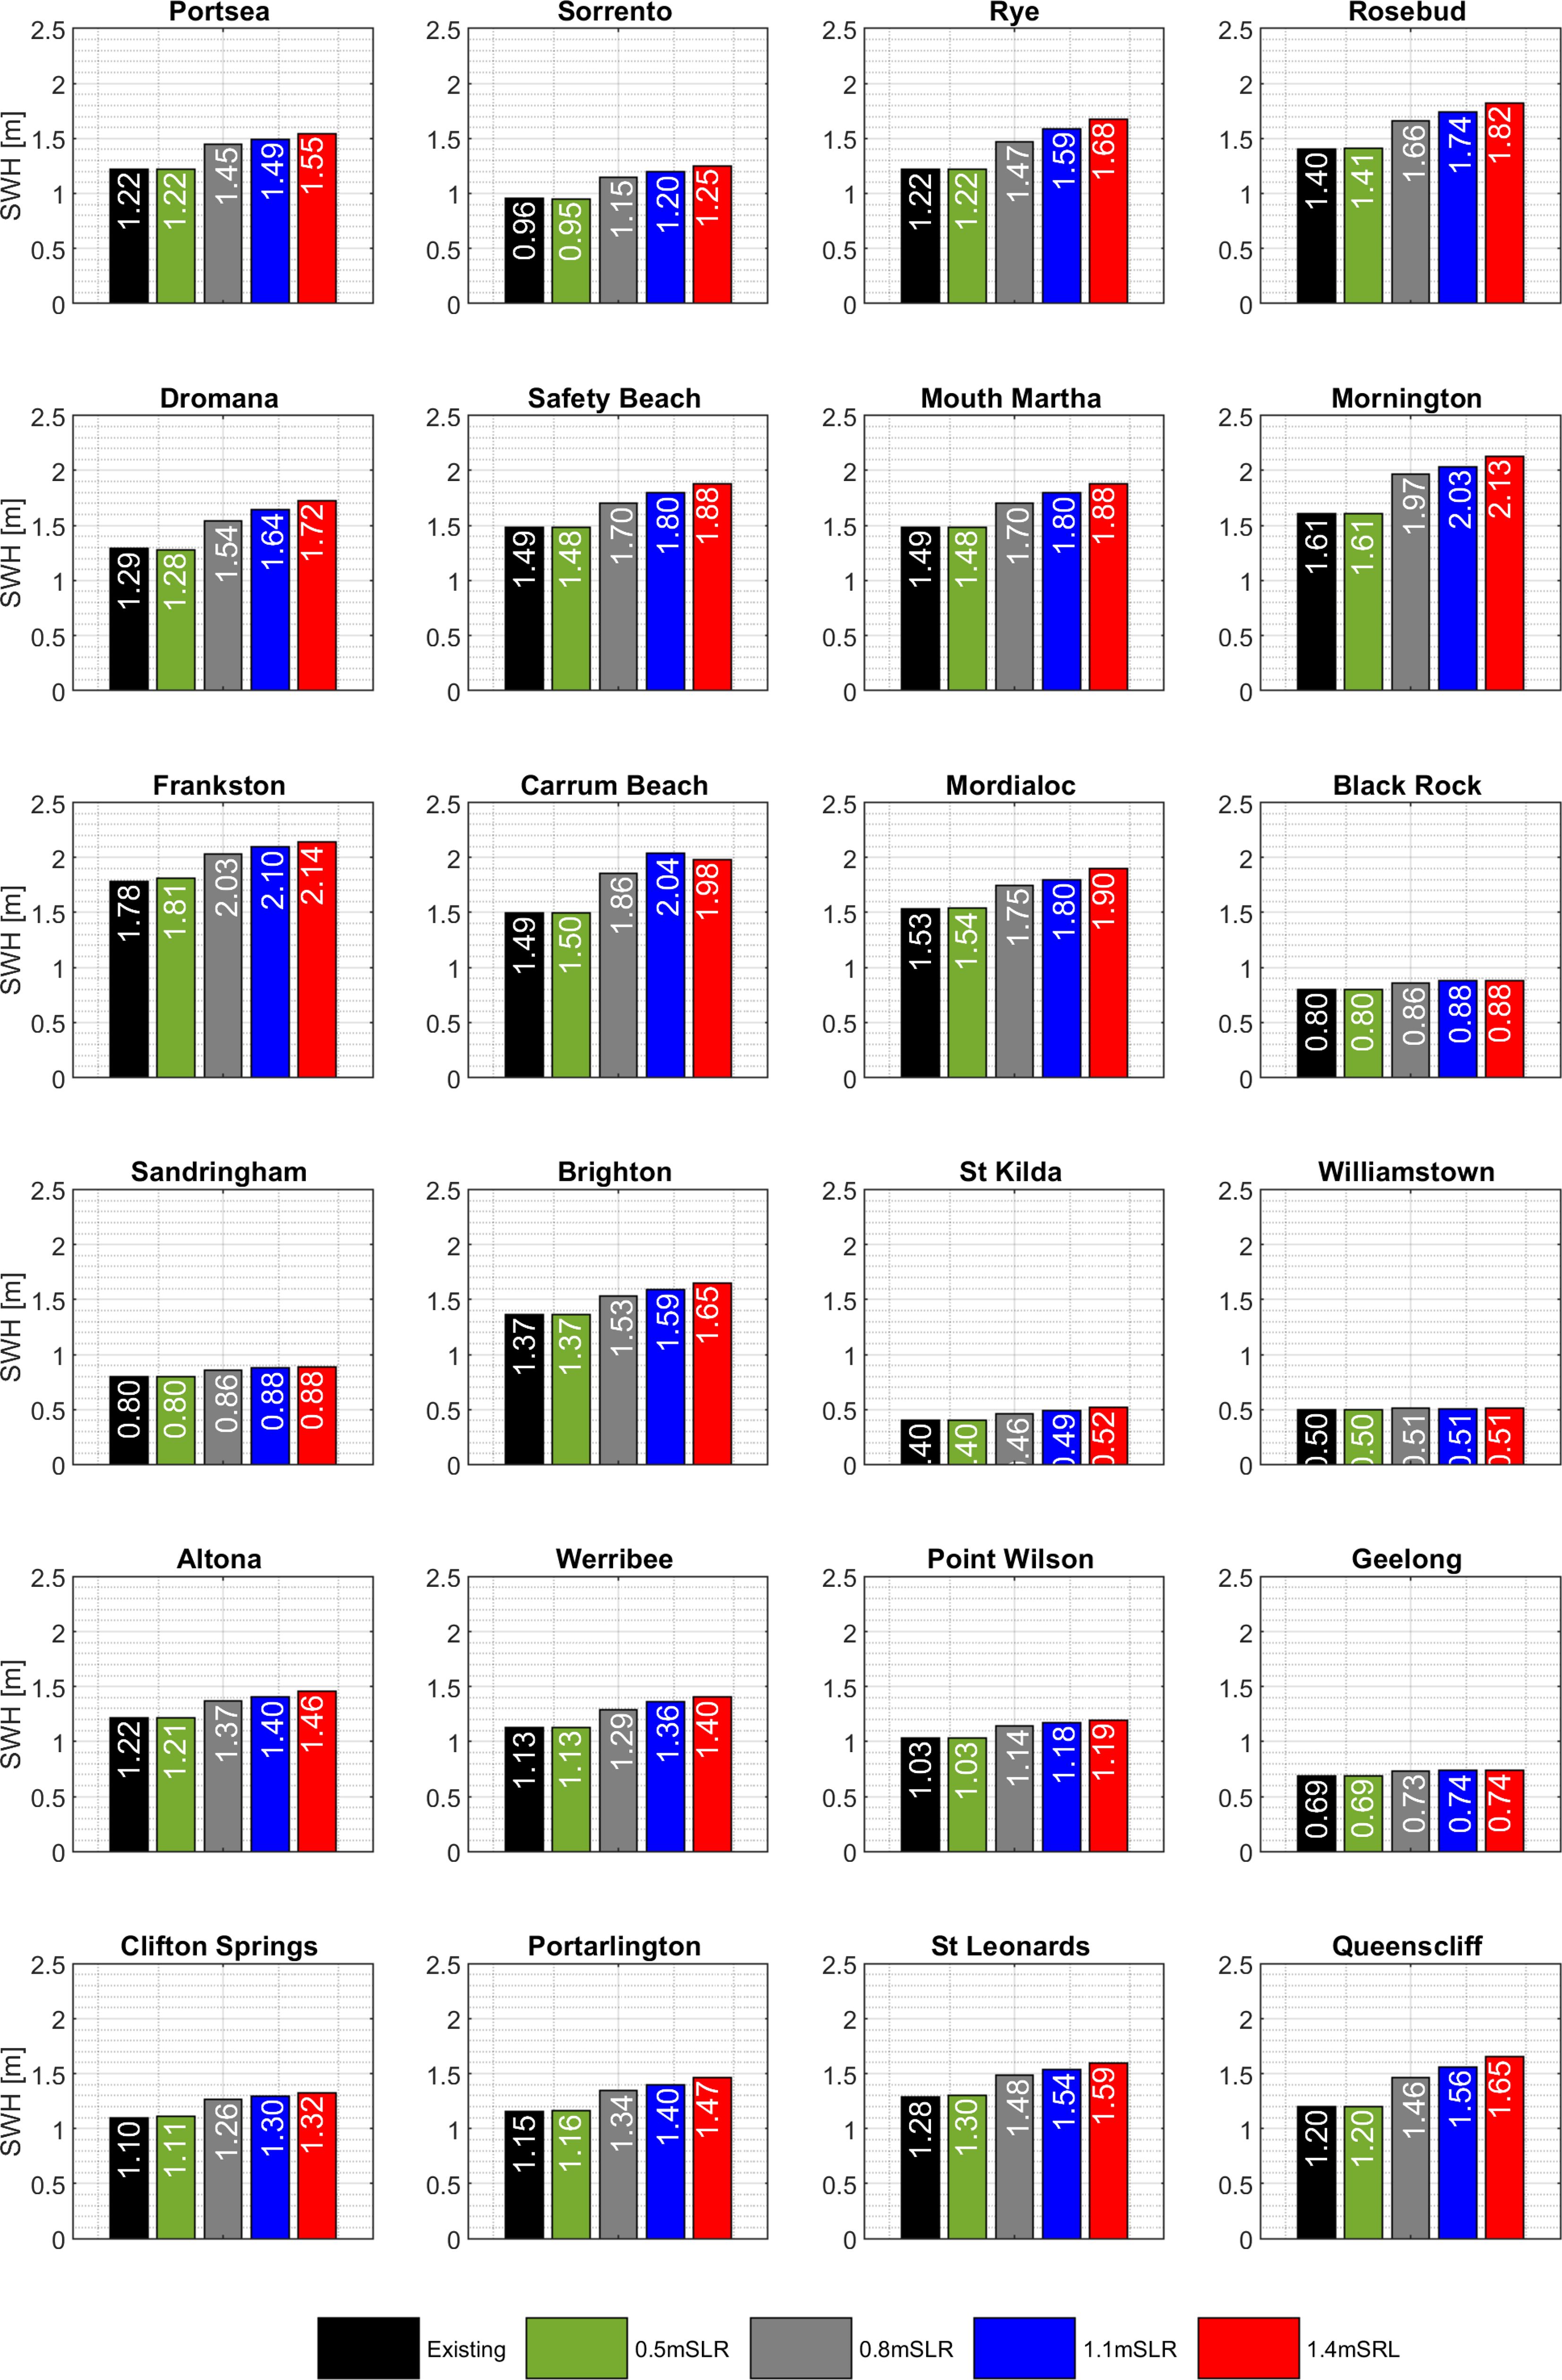
Figure 15. Estimated changes in extreme wind-waves due to rising mean sea levels at different extracted locations around PPB.
However, it can also be seen that the median annual maximum Hs does not increase at the same rate as the increase in the mean sea level. For example, the median annual maximum Hs at twelve locations remains unchanged when increasing MSL from 0m to 0.5m. These locations are Portsea (1.22 m), Rye (1.22 m), Mornington (1.61 m), Black Rock (0.8 m), Sandringham (0.8 m), Brighton (1.37 m), St.Kilda (0.4 m), Williamstown (0.5 m), Werribee (1.13 m), Point Wilson (1.03 m), Geelong (0.69 m), and Queenscliff (1.2 m). Similarly, there is only a slight decrease of 1 cm in the median annual maximum Hs found at Safety Beach, Mount Martha, and Altona with an increase in MSL from 0 m to 0.5 m. This could be attributed to specific geographical features. In contrast, rising MSL from 0.5 m to 0.8 m results in a large increase in the median of annual maximum Hs at many locations across the bay. In addition to MSL, the largest change is up to 0.36 m at Mornington (from 1.61 m to 1.97 m) and Carrum Beach (from 1.5 m to 1.86 m). The rise of 0.36 m when MSL increases from 0.5 m to 0.8 m accounts for 70% of the total increase in the median of annual maximum Hs when MSL rises from 0 m to 1.4 m at the same locations.
The unequal response in the median of the annual maximum Hs corresponding to the rising MSL from 0m to 0.5 m and from 0.5 m to 0.8 m is anticipated due to wave breaking that is triggered by alterations in the water depth. In the context of rising MSL from 0 m to 0.5 m, the ratio of Hs to water depth, being around 0.75, aligns closely with the wave breaking threshold given the data extracted at a depth of approximately 2 m. When MSL rises from 0.5 m to 0.8 m, the ratio of Hs to the water depth is above 0.75 and waves no longer break as the increased water depth by 0.3 m alters the wave dynamics and waves maintain their form without breaking. In this case, the additional water depth provides a buffer against the wave’s energy, allowing it to travel further without breaking. This would result in wave breaking occurring closer to shore, which could lead to more destructive impacts on coastal landforms and infrastructure (Dean and Dalrymple, 2002).
Across 24 locations, substantial changes primarily occur at locations where the median annual maximum Hs exceeds 1.0 m. This suggests that areas with higher median Hs values are more susceptible to experiencing significant variations. Conversely, stations with a median annual maximum Hs below the 1.0 m threshold, such as Black Rock, Sandringham, St.Kilda, Williamstown, and Geelong, exhibit only minor increases in the annual maximum Hs.
4 Conclusion and future work
This study investigates non-linear surges and extreme wind-wave patterns in Port Phillip Bay, Victoria, Australia, under both current and projected mean sea level scenarios, utilising a combined wave-circulation modelling system (SCHISM-WWMIII). The model was meticulously calibrated and validated prior to its application in simulating 32 years of hindcasts (1990-2022) for five distinct mean sea level scenarios (current, 0.5 m, 0.8 m, 1.1 m, and 1.4 m). The primary focus was on extreme non-linear surges and significant wave heights, analysed as the median of annual maximum values at 24 locations around the bay. This targeted approach enables the examination of both the immediate impact of existing extreme surge and wave patterns and the potential effects of rising mean sea levels on these critical hydrodynamic aspects.
In the context of the current climate, both non-linear surges and waves are influenced by variability in the wind field, although their extreme intensities do not coincide temporally. This indicates that the relationship between sea levels and waves is complex, influenced by factors such as local wind field, bathymetry, and the timing of peak surges. Under rising mean sea levels, this study demonstrates that while surges exhibit a degree of resilience to changes in mean sea level, the wave field is more susceptible. Specifically, changes in the wave field do not follow a linear pattern, as this study identified an unequal response in the median of the annual maximum Hs corresponding to rising MSL from 0 m to 0.5 m and from 0.5 m to 0.8 m. This is anticipated due to wave breaking triggered by alterations in water depth. Specifically, in the context of rising MSL from 0 m to 0.5 m, the median of annual maximum Hs at 12 locations remains unchanged. However, rising MSL from 0.5 m to 0.8 m increases the median of annual maximum Hs by 0.36 m, accounting for 70% of the total increase in the median of annual maximum Hs when MSL rises from 0 m to 1.4 m at the same locations. This study found that significant changes in the median of annual maximum Hs only occur in locations where the values exceed 1.0 m. This suggests that areas with higher median Hs values are more prone to substantial variations. Conversely, stations with a median annual maximum Hs below the 1.0 m threshold exhibit only minor increases in the annual maximum Hs.
In conclusion, this study focussed on non-linear surges and extreme wind waves under various mean sea level scenarios. However, it is important to acknowledge its limitations when interpreting the results. For instance, changes in astronomical tides and skew surge patterns were not examined at this stage. Additionally, changes in the wind field and alterations in bottom friction due to sea level rise could influence the hydrodynamic patterns in Port Phillip Bay. Furthermore, the results from this study are based on a static morphology model, which does not account for morphological changes, shoreline movements, and coastal erosion. Future research should incorporate dynamic morphological changes to better understand the interactions between sea-level rise, coastal morphology, and hydrodynamic patterns.
Data availability statement
The original contributions presented in the study are included in the article/supplementary material. Further inquiries can be directed to the corresponding author. Requests to access the datasets should be directed to amFrLm1jY2Fycm9sbEBkZWx3cC52aWMuZ292LmF1.
Author contributions
HT: Conceptualization, Data curation, Formal analysis, Funding acquisition, Investigation, Methodology, Project administration, Resources, Software, Supervision, Validation, Visualization, Writing – original draft, Writing – review & editing. FA: Data curation, Methodology, Visualization, Writing – original draft, Writing – review & editing. JM: Conceptualization, Funding acquisition, Project administration, Writing – original draft, Writing – review & editing. AB: Conceptualization, Funding acquisition, Investigation, Supervision, Writing – review & editing, Writing – original draft.
Funding
The author(s) declare financial support was received for the research, authorship, and/or publication of this article. This project was supported by the grant of Department of Energy, Environment and Climate Action (DEECA) of the Government of Victoria. This research was undertaken with the assistance of resources and services from the National Computational Infrastructure (NCI), which is supported by the Australian Government. This research was also supported by the University of Melbourne Research Computing Services.
Acknowledgments
We are grateful to Cardno (now Stantec), VicPorts, the Bureau of Meteorology, and Deakin University for the use of field data. We acknowledge the use of generative AI technology in the preparation of this article. Specifically, this manuscript was written with the aid of Overleaf (LaTeX) editor with AI-powered language assistance. We used the free version of Microsoft Copilot to support the brainstorming and improvement of this manuscript.
Conflict of interest
The authors declare that the research was conducted in the absence of any commercial or financial relationships that could be construed as a potential conflict of interest.
Publisher’s note
All claims expressed in this article are solely those of the authors and do not necessarily represent those of their affiliated organizations, or those of the publisher, the editors and the reviewers. Any product that may be evaluated in this article, or claim that may be made by its manufacturer, is not guaranteed or endorsed by the publisher.
Footnotes
- ^ https://www.marineandcoasts.vic.gov.au/marine-coastal-management/victorias-resilient-coast-adapting-for-2100
- ^ https://dx.doi.org/10.26186/147043
References
Arns A., Wahl T., Wolff C., Vafeidis A., Haigh I., Woodworth P., et al. (2020). Non-linear interaction modulates global extreme sea levels, coastal flood exposure, and impacts. Nat. Commun. 11, 1–9. doi: 10.1038/s41467-020-15752-5
Bhaskaran P. K., Neelamani S., Al-Salem K., Krishnan A., Albert J., Sreelakshmi S. (2022). Extreme Wind-Wave Characteristics in the North INDIAn Ocean in a Changing Climate (Singapore: Springer Nature Singapore), 223–280. doi: 10.1007/978-981-19-2511-59
Carrere L., Lyard F., Cancet M., Guillot A., Picot N., et al. (2016) “FES 2014, a new tidal model—Validation results and perspectives for improvements,” in Proceedings of the ESA Living Planet Symposium (European Space Agency Prague, Czech), 9–13. Available at: https://scholar.google.com/scholar?hl=en&as_sdt=0%2C5&q=FES+2014,+a+New+Tidal+Model%C3%A2%C2%80%C2%94Validation+Results+and+Perspectives+for+Improvements&btnG=.
Dean R. G., Dalrymple R. A. (2001). Coastal processes with engineering applications. Cambridge: Cambridge University Press.
Dodet G., Melet A., Ardhuin F., Bertin X., Idier D., Almar R. (2019). The contribution of wind-generated waves to coastal sea-level changes. Surveys In Geophys. 40, 1563–1601. doi: 10.1007/s10712-019-09557-5
Hersbach H., Bell B., Berrisford P., Horányi A., Sabater J. M., Nicolas J., et al. (2019). Global reanalysis: goodbye era-interim, hello era5. ECMWF Newslett. 159, 17–24. doi: 10.21957/vf291hehd7
Liu Q., Babanin A. V., Rogers W. E., Zieger S., Young I. R., Bidlot J.-R., et al. (2021). Global wave hindcasts using the observation-based source terms: Description and validation. J. Adv. Model. Earth Syst. 13, 1–38. doi: 10.1029/2021MS002493
Lyddon C. E., Brown J. M., Leonardi N., Plater A. J. (2019). Increased coastal wave hazard generated by differential wind and wave direction in hyper-tidal estuaries. Estuarine Coast. Shelf Sci. 220, 131–141. doi: 10.1016/j.ecss.2019.02.042
McInnes K., Hubbert G. (2003). A numerical modelling study of storm surges in bass strait. Aust. meteorol. magazine 52, 143–156.
McInnes K., Macadam I., Hubbert G., O’Grady J. (2009a). A modelling approach for estimating the frequency of sea level extremes and the impact of climate change in southeast Australia. Natural Hazards 51, 115–137. doi: 10.1007/s11069-009-9383-2
McInnes K., Macadam I., Hubbert G., O’Grady J. (2013). An assessment of current and future vulnerability to coastal inundation due to sea-level extremes in Victoria, southeast Australia. Int. J. Climatol. 33, 33–47. doi: 10.1002/joc.3405
McInnes K. L., O’Grady J., Macadam I. (2009b). The effect of climate change on extreme sea levels in Port Phillip Bay. CSIRO Mar. Atmos. Res. 1–58.
Pattiaratchi C., Hegge B., Gould J., Eliot I. (1997). Impact of sea-breeze activity on nearshore and foreshore processes in southwestern Australia. Continent. Shelf Res. 17, 1539–1560. doi: 10.1016/S0278-4343(97)00016-2
Roland A. (2008). Development of WWMII: Spectral wave modelling on unstructured meshes. Technical University of Darmstadt, Darmstadt, Germany
Roland A., Zhang Y. J., Wang H. V., Meng Y., Teng Y.-C., Maderich V., et al. (2012). A fully coupled 3d wave-current interaction model on unstructured grids. J. Geophys. Res.: Oceans 117, 1–19. doi: 10.1029/2012JC007952
Shen Y., Deng G., Xu Z., Tang J. (2019). Effects of sea level rise on storm surge and waves within the Yangtze river estuary. Front. Earth Sci. 13. doi: 10.1007/s11707-018-0746-4
Tolman H. L. (1992). Effects of numerics on the physics in a third-generation wind-wave model. J. Phys. Oceanogr. 22, 1095–1111. doi: 10.1175/1520-0485(1992)022<1095:EONOTP>2.0.CO;2
Tran H. Q., Provis D., Babanin A. V. (2021). Hydrodynamic climate of port phillip bay. J. Mar. Sci. Eng. 9, 1–30. doi: 10.3390/jmse9080898
Umlauf L., Burchard H. (2003). A generic length-scale equation for geophysical turbulence models. J. Mar. Res. 61, 235–265. doi: 10.1357/002224003322005087
Wahl T., Haigh I. D., Nicholls R. J., Arns A., Dangendorf S., Hinkel J., Slangen A. B. A. (2017). Understanding extreme sea levels for broad-scale coastal impact and adaptation analysis. Nat. Commun. 8, 16075. doi: 10.1038/ncomms16075
Wright L. D., Caruson K., D’Elia C., Draayer J., Nichols R., Weiss R., et al. (2020). “Assessing and planning for the impacts of storms, flooding and sea level rise on vulnerable gulf of Mexico coastal communities: A white paper,” in Global Oceans 2020: Singapore–US Gulf Coast (IEEE), 1–6.
Zhang Y., Baptista A. M. (2008). Selfe: A semi-implicit eulerian-lagrangian finite-element model for cross-scale ocean circulation. Ocean Model. 21, 71–96. doi: 10.1016/j.ocemod.2007.11.005
Zhang Y., Ye F., Stanev E. V., Grashorn S. (2016). Seamless cross-scale modeling with schism. Ocean Model. 102, 64–81. doi: 10.1016/j.ocemod.2016.05.002
Keywords: sea level rise, storm surges, extreme wind-waves, Port Phillip Bay, hydrodynamics, schism, WWMIII
Citation: Tran HQ, Ayala Cruz F, McCarroll J and Babanin A (2024) Non-linear surges and extreme wind-waves in Port Phillip Bay under existing and future mean sea levels. Front. Mar. Sci. 11:1480054. doi: 10.3389/fmars.2024.1480054
Received: 13 August 2024; Accepted: 11 November 2024;
Published: 05 December 2024.
Edited by:
Ivica Janekovic, University of Western Australia, AustraliaReviewed by:
Aifeng Tao, Hohai University, ChinaKathleen Lynne McInnes, Oceans and Atmosphere (CSIRO), Australia
Copyright © 2024 Tran, Ayala Cruz, McCarroll and Babanin. This is an open-access article distributed under the terms of the Creative Commons Attribution License (CC BY). The use, distribution or reproduction in other forums is permitted, provided the original author(s) and the copyright owner(s) are credited and that the original publication in this journal is cited, in accordance with accepted academic practice. No use, distribution or reproduction is permitted which does not comply with these terms.
*Correspondence: Huy Quang Tran, aHV5MjAxM3VxQGdtYWlsLmNvbQ==
 Huy Quang Tran
 Franklin Ayala Cruz
 Jak McCarroll
 Alexander Babanin