 Xianwu Shi1,2,3
 Yuhan Yan
- 1Key Laboratory of Environmental Change and Natural Disasters of Chinese Ministry of Education, Beijing Normal University, Beijing, China
- 2Key Laboratory of Marine Space Resource Management Technology, Ministry of Natural Resources, Hangzhou, China
- 3Faculty of Geographical Science, Beijing Normal University, Beijing, China
- 4Institute of Smart Marine and Engineering, Fujian University of Technology, Fuzhou, China
- 5Beihai Marine Environmental Monitoring Center Station, State Oceanic Administration of China, Beihai, China
- 6Zhejiang Institute of Hydraulics and Estuary, Hangzhou, China
- 7Finance and Economics College, Jimei University, Xiamen, China
Tsunamis, generated by submarine earthquakes, landslides, or volcanic eruptions, are a significant hazard to coastal areas owing to their sudden onset and rapid propagation speed. Thus, tsunami disaster risk assessment is crucial to determine potential losses and severity of future tsunami impacts, providing essential support for disaster prevention and mitigation efforts. This study presents a case study of Xiamen City in Fujian province for developing a high-precision tsunami model. Utilizing nearshore water depth and digital elevation model data, we established a high-resolution tsunami numerical simulation model for Xiamen City that accounts for the impact of water overrunning levees and overshoals. Historical tsunami disaster records were used to validate the numerical model. By determining multiple tsunami source scenarios that could potentially affect the counties of Xiamen City, we simulated the inundation range and water depth distribution required for the potential maximum tsunami event. The simulation results facilitated a tsunami hazard assessment. Considering land use and important tsunami-affected exposures including industrial and chemical enterprises and ports, we evaluated the vulnerability of Xiamen City to tsunami disasters. Based on the determination of hazard and vulnerability levels, we investigated the risk distribution of tsunami disasters in Xiamen City. The results of this study lay the groundwork for developing methodologies to improve tsunami disaster risk assessment in coastal areas.
1 Introduction
Tsunamis are among the most devastating natural disasters in coastal regions, primarily triggered by submarine earthquakes, landslides, or volcanic eruptions. Their sudden onset and rapid propagation pose a significant threat to these areas (Tufekci-Enginar et al., 2021). Historically, seismic activity accounts for 90% of recorded tsunami events, during which a substantial section of the seabed either drops or rises abruptly owing to tectonic movements, disturbing marine waters and initiating tsunamis (Li et al., 2019). A magnitude 9.0 earthquake off the Northeast coast of Japan generated a tsunami that reached the Japanese coast within 15 min of the earthquake on March 11, 2011. Within one hour, it had impacted most coastal cities on Honshu, the largest and primary island of Japan, resulting in extensive casualties and property damage (Ren et al., 2013; Masuda et al., 2022). Located along the northwest Pacific coast, China ranks among the nations that are most susceptible to tsunami disasters (Hou et al., 2022). With numerous critical projects and densely populated areas in its coastal areas, the threat of tsunami disasters cannot be ignored. Therefore, conducting tsunami disaster risk assessments is crucial for enhancing marine disaster prevention and mitigation capabilities in these areas (Ren et al., 2022a).
Both deterministic and probabilistic assessment techniques, incorporating numerical simulation, are utilized worldwide to assess the risk of tsunami disaster in specific regions. One such model, the COMCOT model, developed by the Department of Civil Engineering at Cornell University, is specifically designed to simulate the propagation of seawater after being disturbed. This model is suitable for modeling long wave motion and is commonly used for assessing coastal disasters and engineering impacts caused by tsunami waves (Wu, 2012; Sepúlveda et al., 2020; Moon et al., 2022; Hou et al., 2023b). Additionally, deterministic analysis, which assesses disaster impact under the most adverse scenarios, assumes the occurrence of a large-scale earthquake in a potential seismic source area. It then estimates the tsunami wave height or the inundation height in the study area, typically leading to an overestimation of potential tsunami risks (Grezio et al., 2017; Turchi et al., 2022). In contrast, probabilistic tsunami hazard analysis (PTHA) calculates the risk of tsunami or the annual occurrence probability of tsunamis with varying amplitudes across different recurrence intervals. PTHA involves segmenting potential focal areas, determining seismic activity parameters, and establishing ground motion attenuation relationships. The key advantage of PTHA lies in providing probabilities and recurrence periods for tsunami events, which are critical for engineering design, risk mitigation, land-use planning, and the insurance industry (Smit et al., 2017; Zamora and Babeyko, 2020; Salah et al., 2021). Owing to the scarcity of historical tsunami source data in local areas, traditional statistical analysis methods cannot accurately assess tsunami disaster risks. Researchers have suggested employing the Monte Carlo method to generate stochastic sets of seismic random events for analyzing the risk of earthquake-induced tsunami disasters (Yuan et al., 2021; Mahmood et al., 2023). This method involves randomly generating calculation samples within potential earthquake source regions or applying random processes to certain seismic parameters. Subsequently, hydrodynamic calculations and statistical analyses have been performed using a vast array of stochastic samples (Geist and Parsons, 2006; Li et al., 2016; Ren et al., 2017). A significant advantage of the Monte Carlo method is its ability to compensate for the lack of local tsunami event data, resulting in more accurate calculations of extreme tsunami risks.
Assessing tsunami disaster risk in a specific region necessitates a thorough evaluation of regional tsunami hazards and an analysis of the vulnerability exposure within the region (Li et al., 2022). The lack of historical tsunami records poses a challenge in generating a quantitative vulnerability curve for regions affected by tsunamis based on historical disaster data. Consequently, studies have assessed the level of vulnerability to tsunami disasters by considering regional land use, economic factors, and population distributions (Yavuz et al., 2020). Such assessments can then be integrated with quantitative hazard assessment results to determine the overall tsunami disaster risk level (Hou et al., 2023a). Furthermore, researchers have constructed an indicator system related to the entities exposed to tsunami effects. This approach allows for the evaluation of the vulnerability level distribution and the regional tsunami disaster risk level, considering the tsunami hazards (Hui et al., 2022). The findings from tsunami risk assessments are invaluable for urban planning and industrial layouts in coastal zones. Moreover, quantitative risk assessment for typical disaster exposures provides direct guidelines for setting insurance rates (Alhamid et al., 2024). Therefore, the importance of tsunami disaster risk assessment has become increasingly recognized in both academic and practical fields.
To improve natural disaster prevention and control capabilities and map the national distribution of natural disaster risks, in 2019, China launched a national natural disaster risk survey project and identified tsunamis as a “critical” marine disaster category. The aim of the project was to perform tsunami disaster risk assessment at different scales, namely at national, provincial, and city levels. Xiamen City in Fujian Province, which is one of the most developed regions in China, facing the Pacific Ocean and adjacent to the Taiwan Strait connecting the East China Sea and the South China Sea, was selected as a pilot area for city-level tsunami disaster risk assessment and zoning in the national natural disaster risk survey project. Xiamen is influenced by tsunami waves from the Pacific Ocean and the South China Sea (Ye, 1995; Liu et al., 2007; Hui et al., 2022). In addition, tsunami waves in the waters of Xiamen may exhibit resonance, as even weak earthquakes in the South China Sea (Mw 8.0 and 8.5) could generate significant tsunami energy in Xiamen, comparable to the tsunami energy caused by some Mw 9.3 earthquakes (Ren et al., 2022b). Although Chen et al. (2023) studied the hazard assessment of tsunamis caused by earthquakes in the Taiwan Strait on Xiamen (Chen et al., 2023), there is a lack of evaluation and analysis on tsunamis originating from the deep ocean. This study focuses on a case study with Xiamen City as the research area, adopting a different approach from previous studies that concentrated on the entire city. Instead, this study had incorporated a more refined village-level unit to assess tsunami disaster risk levels, enabling a more precise evaluation of tsunami wave effects on coastal communities. This approach not only improves the accuracy of our research but also provides a novel perspective and tool for assessing tsunami disaster risk. The findings of this study serve as a reference for advancing methodologies to better assess the risk of tsunami disasters in coastal areas.
2 Study area and data
Xiamen, located on the southeast coast of China (Figure 1), ranks among the most economically prosperous and densely populated coastal regions, making it highly vulnerable to marine disasters. It was selected as a representative case study area to validate the method proposed in this paper. Data from the region were meticulously collected to enable precise simulation and risk assessment of tsunami disasters. The collected multisource data, shown in Table 1, form the basis for our analysis. The nearshore digital elevation map (DEM), offshore water depth distribution and ETOPO1 were collected to construct the tsunami numerical model. The buoys of observational tsunami wave data during the Japan “3.11” tsunami event was used to validate the numerical model. The potential tsunami source including near-field, local field and far-field was used to drive the tsunami numerical model and simulate the inundation caused by tsunami. The land-use distribution data and tsunami-affected exposures in coastal areas of Xiamen City were collected to evaluate the vulnerability level. Especially, the distribution area of tsunami-affected exposures including industrial and chemical enterprises and ports, etc., is the area where local coastal government needs to pay much more attention in tsunami disaster responding and mitigation (Shown in Figure 2). While the land-use distribution data in Table 1 is from 2015, it primarily served to test the tsunami hazard analysis framework. The emphasis is on methodology rather than specific data points, as the comprehensive nature and quality of the 2015 data provide a reliable foundation (Table 1). We believe that the study’s conclusions are robust and not significantly affected by the data’s timeliness. Future studies can apply this framework to more recent datasets to further verify its applicability over time.
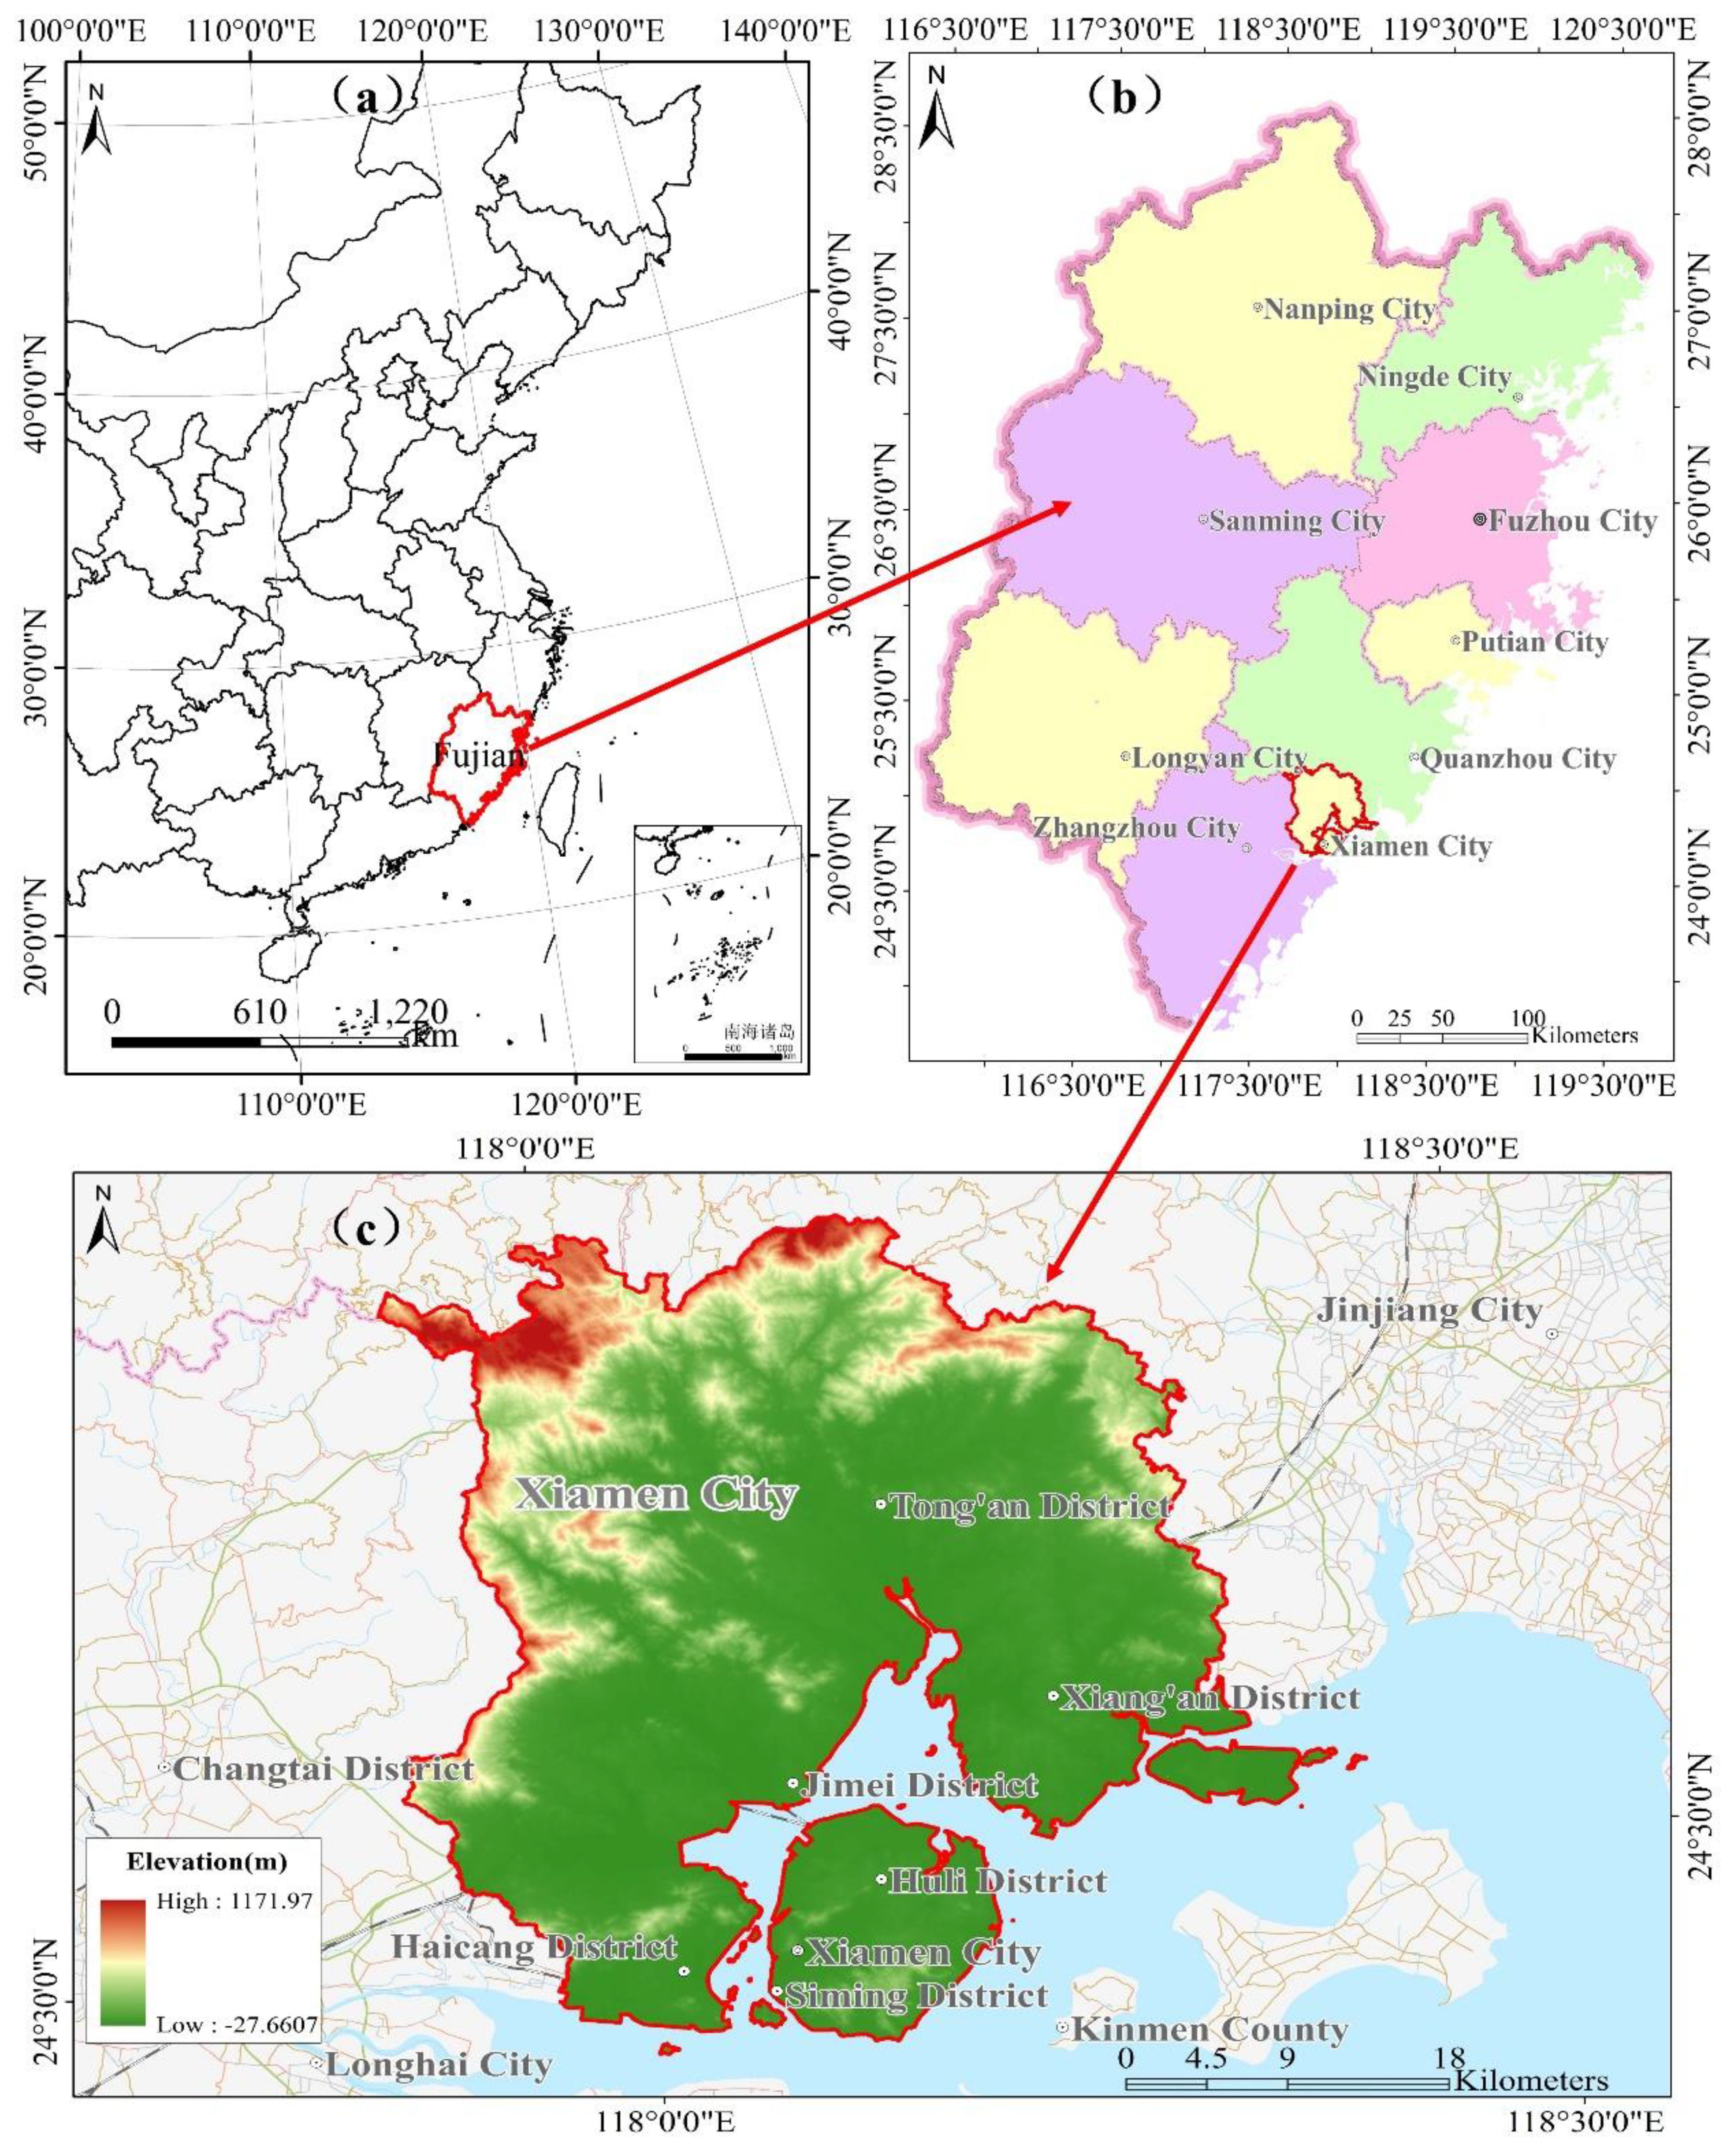
Figure 1. Location of the case study area: (A) Fujian Province, China, (B) Xiamen City within Fujian Province, and (C) terrain distribution and village/community boundary in Xiamen City.
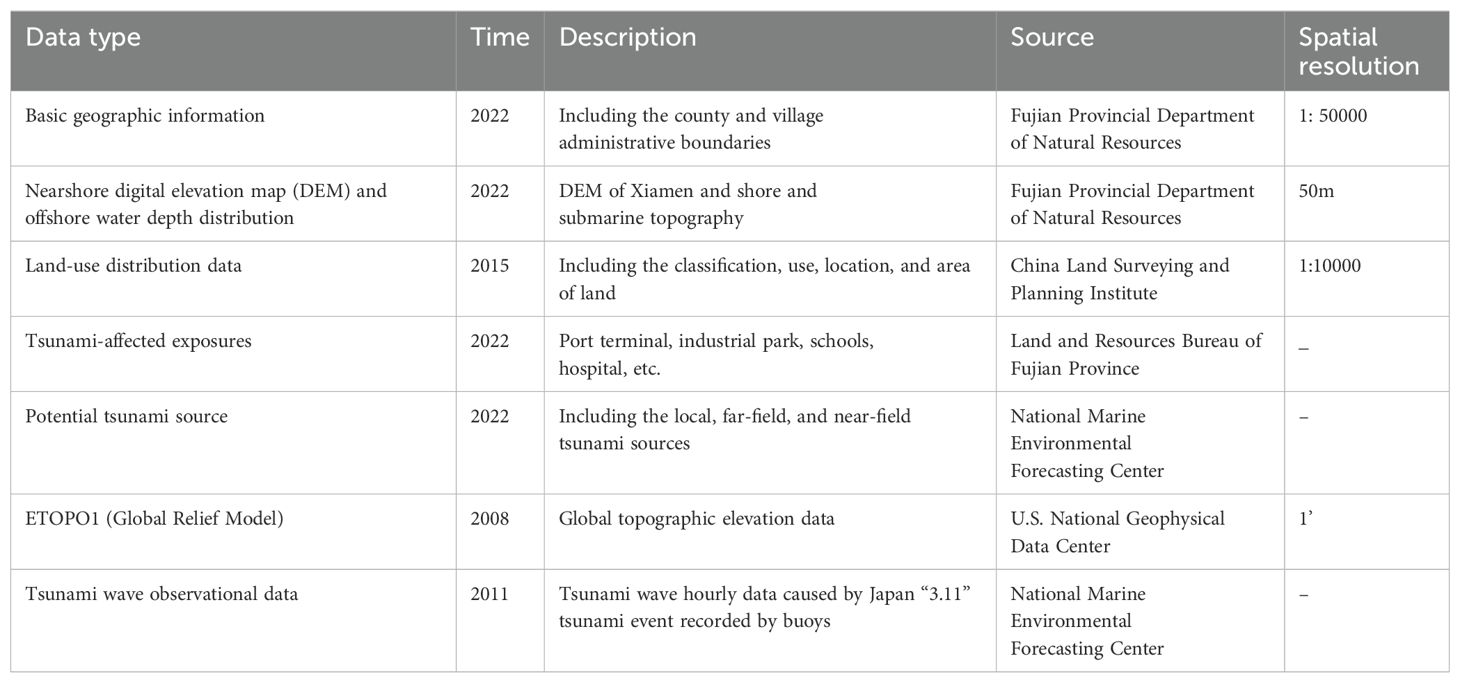
Table 1. Data source for tsunami numerical simulations in Xiamen.
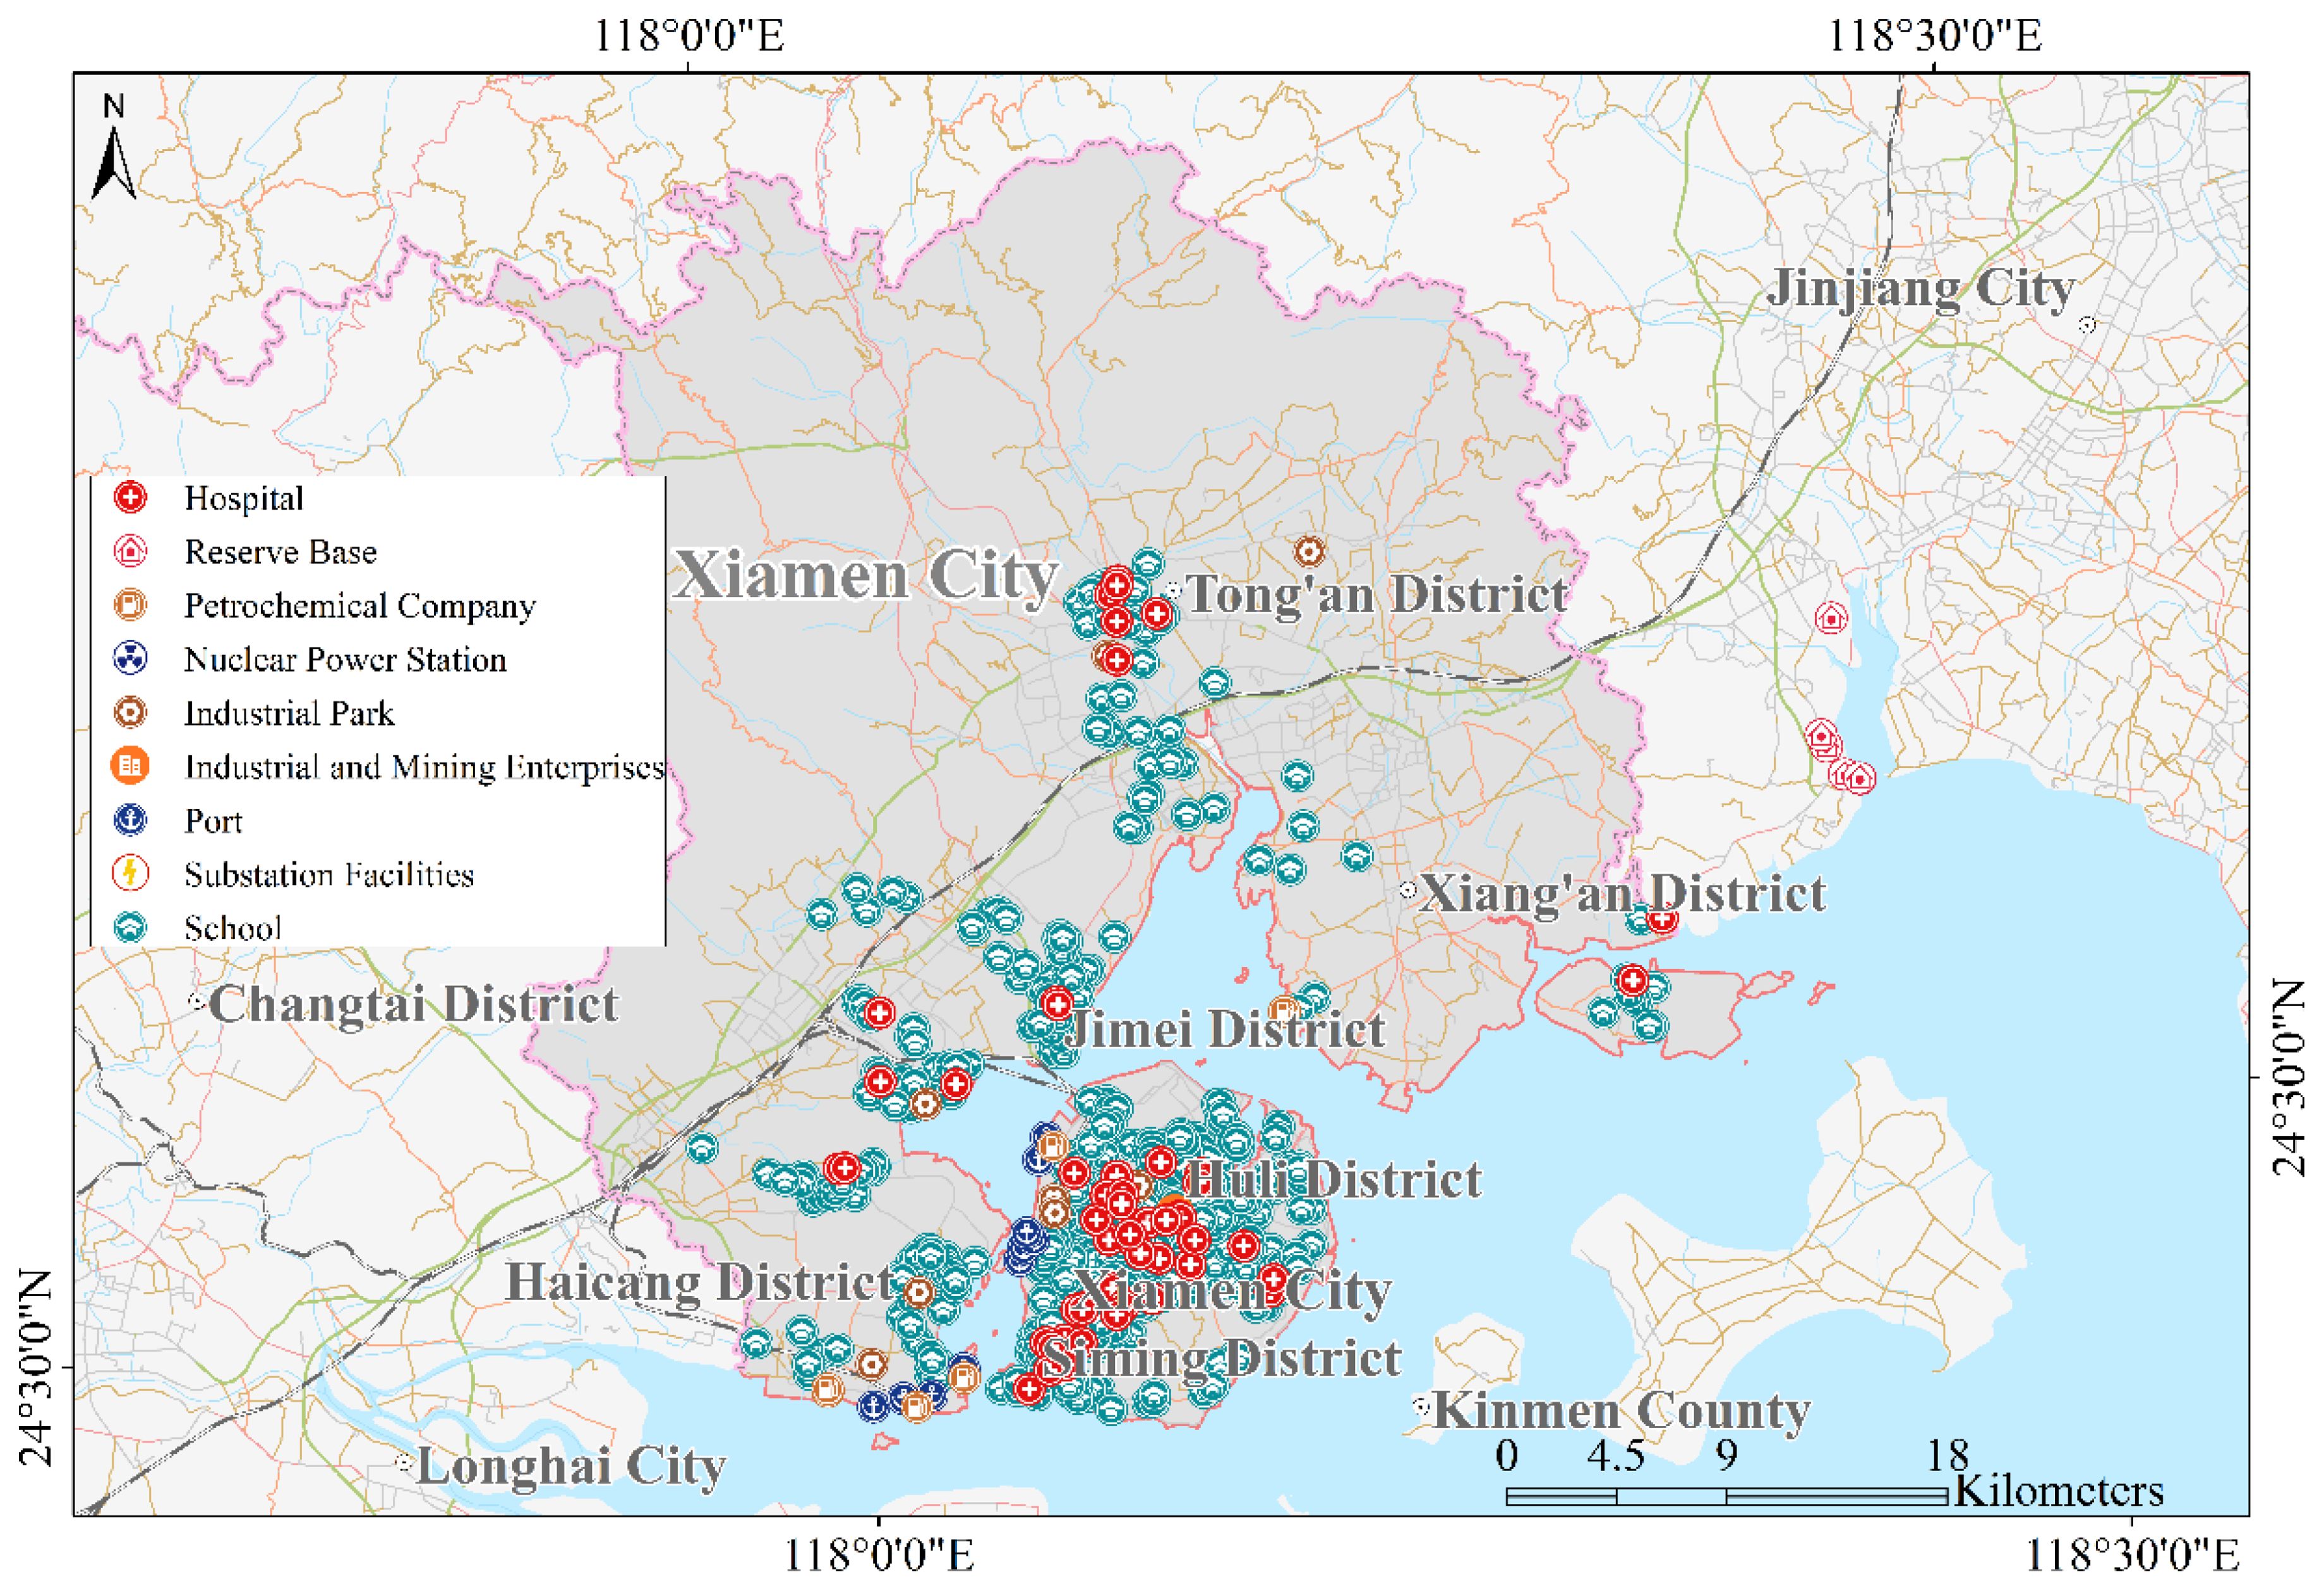
Figure 2. The distribution of tsunami-affected exposures in Xiamen City.
3 Methods
A comprehensive framework for calculating the tsunami disaster risk in coastal cities is proposed herein, as illustrated in Figure 3. To ensure the framework’s efficacy, a detailed case study involving Xiamen City was conducted, allowing us to ground our theoretical model in real-world conditions and outcomes. The framework comprises four components: model configuration and validation, inundation simulation, vulnerability analysis, and risk assessment. Utilizing digital elevation model (DEM) and submarine topography data from Xiamen City, a comprehensive tsunami numerical model was developed. Historical tsunami records were used to validate this model. Considering the potential tsunami sources impacting Xiamen City, simulations of inundation from various tsunami scenarios were conducted to determine hazard levels within the city. Land-use and tsunami-affected exposure data were used to assess the vulnerability level of Xiamen City. By analyzing both hazard and vulnerability levels, the tsunami disaster risk in the study area was evaluated. Hazard and vulnerability levels were categorized into four categories, ranging from high (I) to low (IV); risk levels were distributed across five categories, from high (I) to low (V). The correlation among risk, hazard, and vulnerability levels for tsunami disasters is shown in Table 2A, following the operational guidelines for tsunami risk assessment in China (Ministry of Natural Resources, 2021). Once the hazard level and vulnerability level were given, the risk level could be obtained through Table 2A. For example, when the vulnerability level is II, together with the hazard level ofII, it could be found that the corresponding risk level located in row 4 and column 4 with medium risk Level III. The practical application of this framework is evident in its capacity to cater to the unique geological features and urban layout of Xiamen, which demonstrates the model’s adaptability to diverse coastal environments.
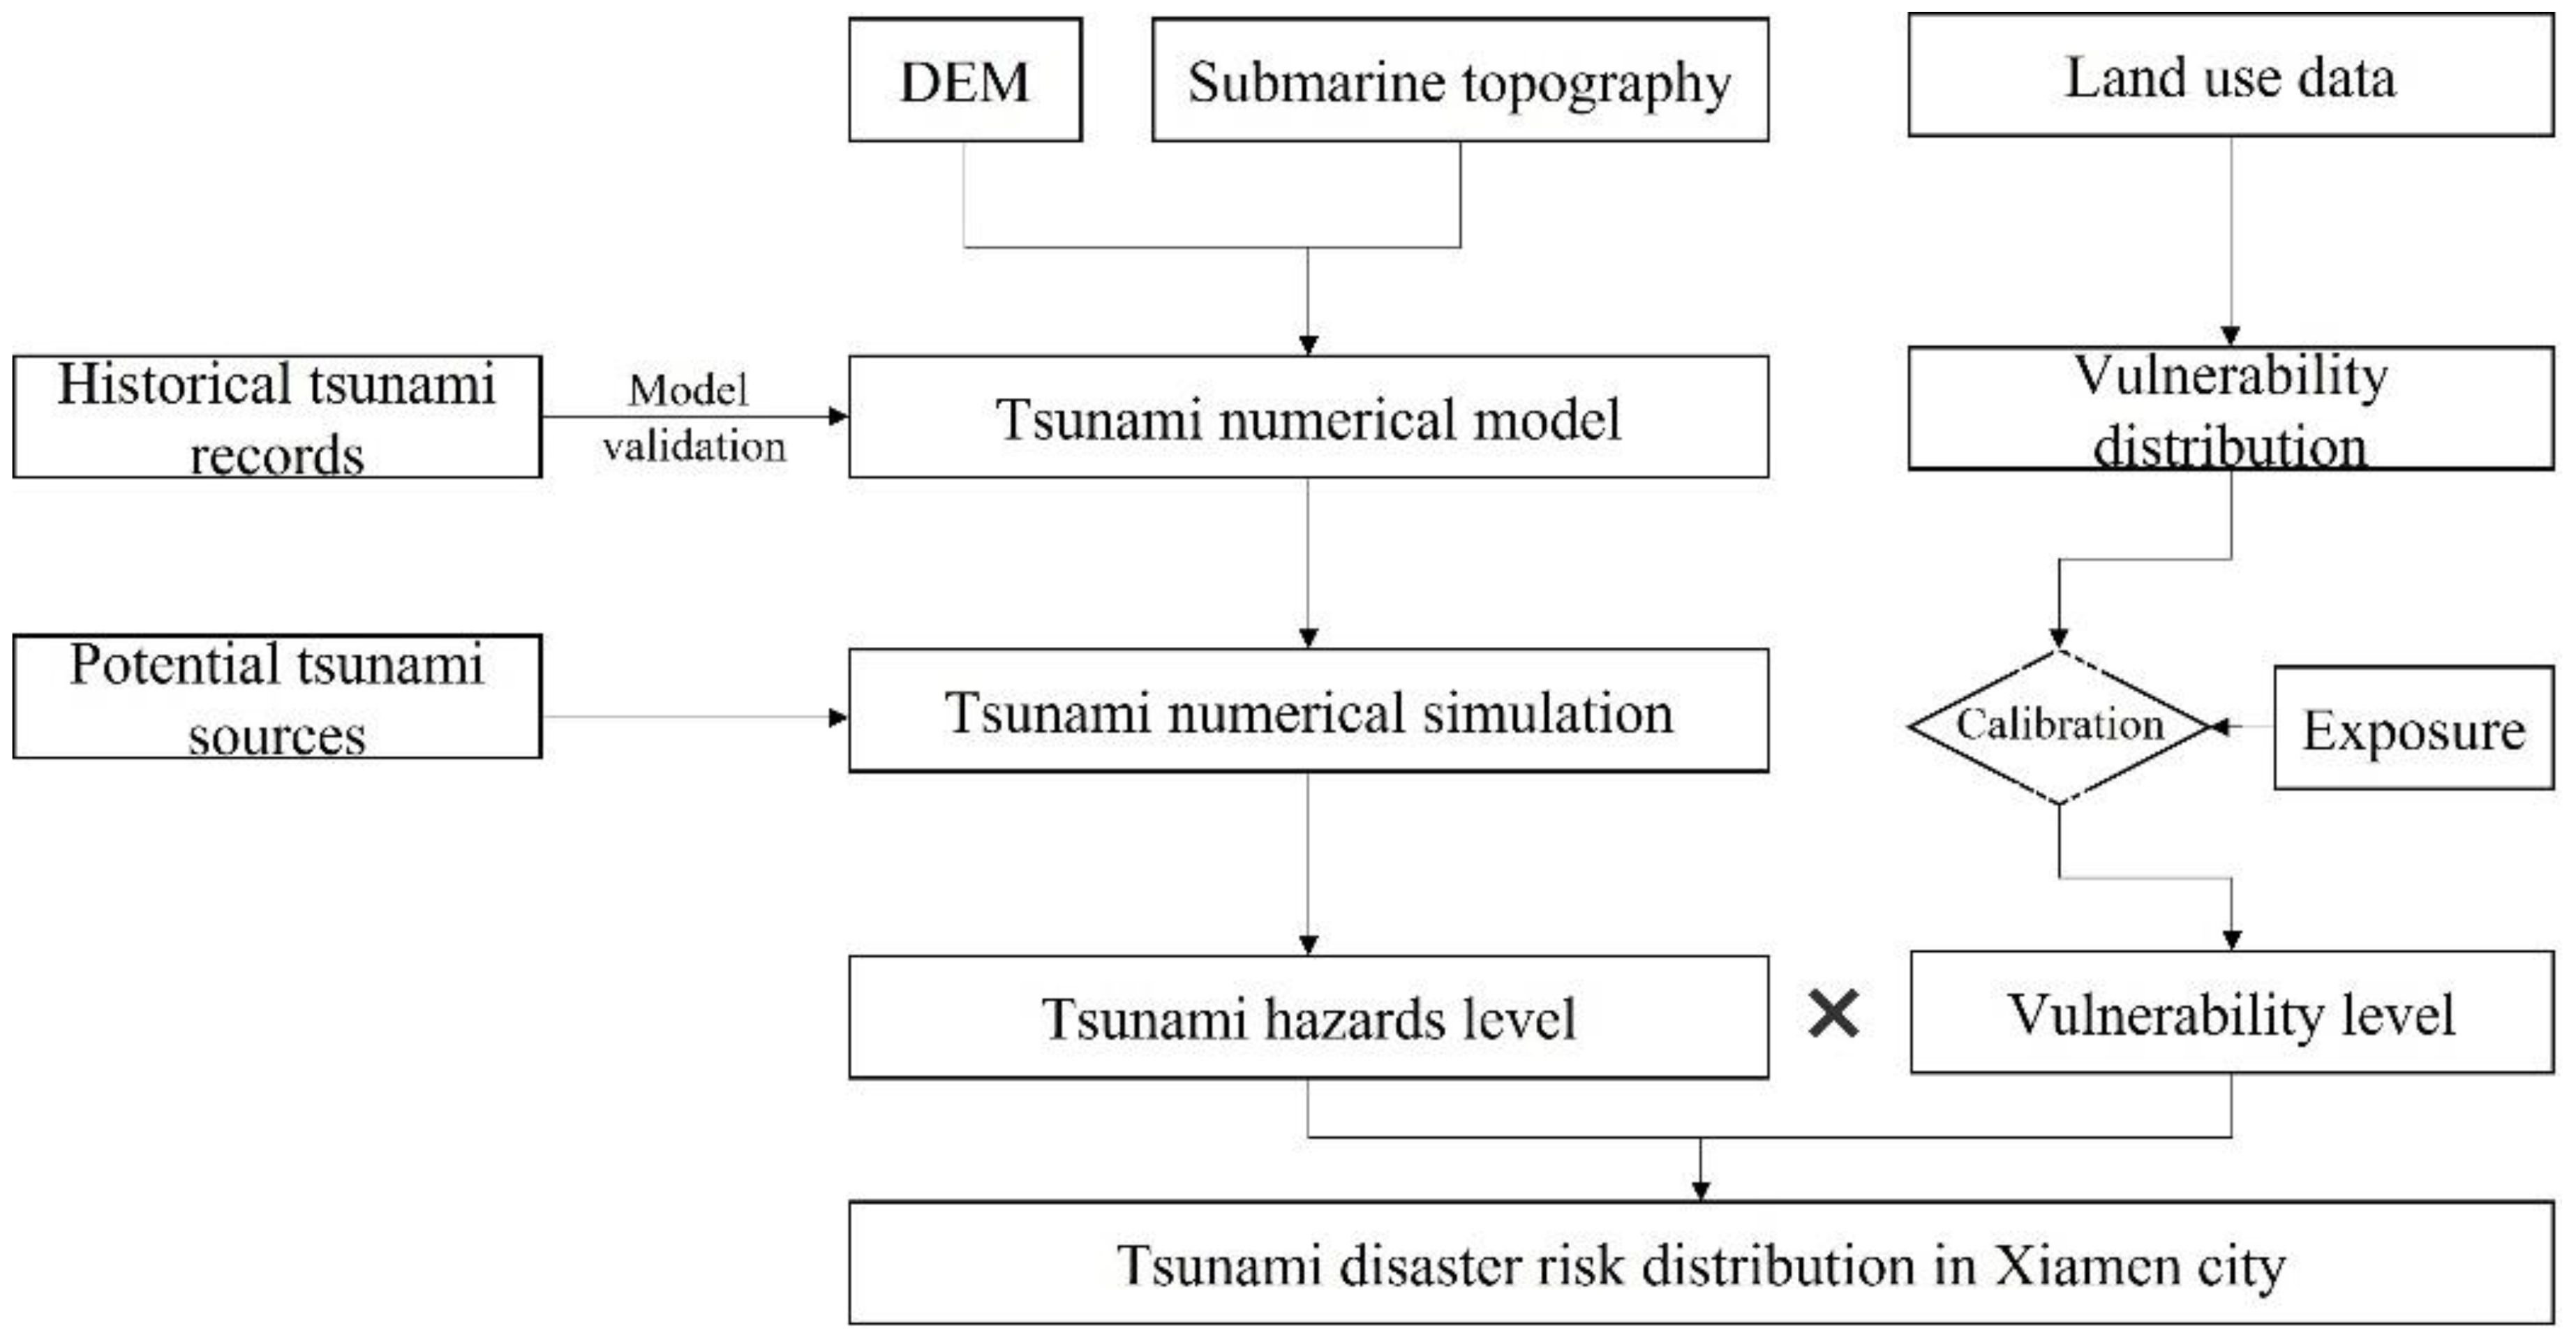
Figure 3. Tsunami disaster risk assessment framework for Xiamen City.
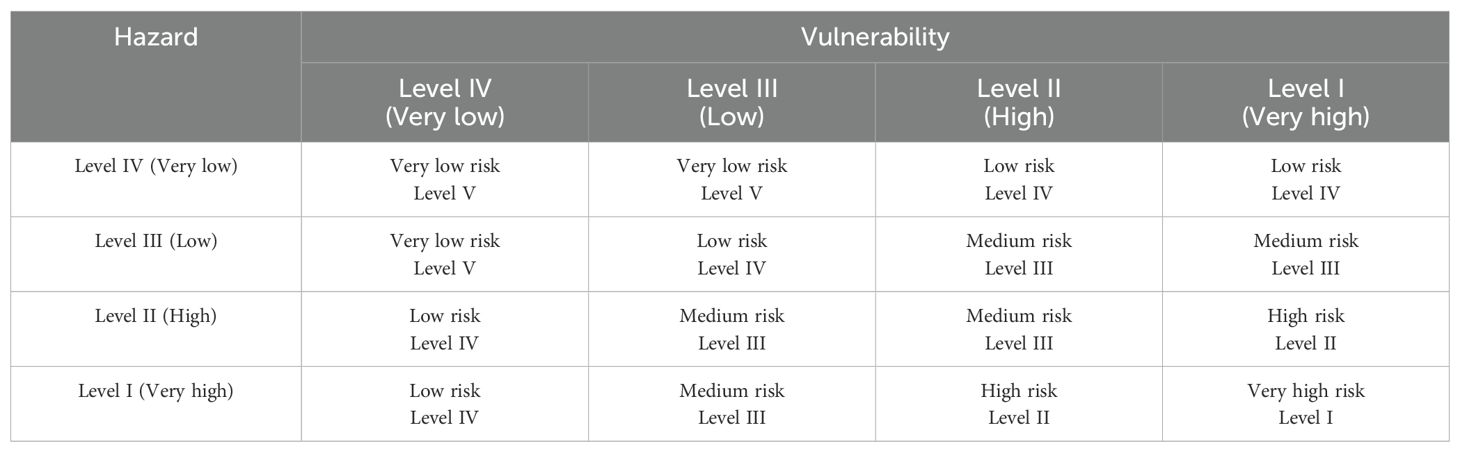
Table 2A. Tsunami disaster risk assessment based on vulnerability and hazard levels.
3.1 Numerical model
In this research, a hierarchical approach involving four nested grids was adopted to refine the tsunami simulation process. The first three layers employ rectangular orthogonal grids with gradually finer resolutions. The broadest layer spans from 1°N to 50°N and 110°E to 175°E, covering significant parts of the East and South China Sea, Japan, and sections of the western Pacific Ocean. This layer has a horizontal spatial resolution of 4 arcmin. The second layer narrows down to the area between 21.55°N to 41.48°N and 115°E to 140°E, focusing specifically on the coastal zones and continental shelf of the East China Sea, with a resolution of 2 arcmin. The third layer further narrows down the focus to 23°N to 27.98°N and 116.6°E to 121.6°E, covering the entire offshore area of southeastern China, with a spatial resolution up to 1 arcmin. The tsunami modeling employed in this study utilizes the COMCOT model (Wang, 2009), based on the following two-dimensional nonlinear shallow water equations:
where t denotes time; h (x, y, t) denotes total water depth; b (x, y) represents the bottom elevation function; u (x, y, t) and v (x, y, t) signify the depth-averaged velocities in x and y directions, respectively; and g denotes the gravity acceleration. The following equations represent the bottom friction terms:
where the parameter n denotes the Manning coefficient and depends on roughness. It has a value of 0.016 in the tsunami model. The Meghraoui model is employed to calculate the seabed displacement resulting from earthquake tsunamis and to estimate the initial water surface elevation induced by seismic activities (Okada, 1985). The Meghraoui model requires several input parameters, including the epicenter’s longitude and latitude, as well as the focal depth, fault length, fault width, slip amount, and the strike, dip, and rake angles. Additionally, Wang and Liu (2005) indicated that the Meghraoui model performed better in predicting tsunami wave heights compared to the Harvard CMT solution with fault dimensions and slip displacement derived by Borrero (2003).
For inundation modeling, this study utilized the MIKE-21 model (from the company, DHI) (Warren and Bach, 1992; Kaergaard and Fredsoe, 2013), a sophisticated two-dimensional unstructured grid primitive equation model. Its governing equations are consistent with those of COMCOT (Equations 1–5), with a Manning coefficient of 0.016 in the ocean. However, Manning coefficients vary on terrestrial surfaces depending on land use objectives (Table 2B), with the residential and industrial areas featuring relatively larger coefficients, primarily concentrated in the coastal areas of Siming and Huli districts, as well as in the southern part of Tong’an district. The computational time step is set between 0.01 and 30 seconds to ensure that the CFL number remains less than 1, thus guaranteeing convergence of the computation; the horizontal eddy viscosity coefficient is chosen as 0.28; wetting and drying techniques are employed at the land-ocean boundary to avoid computational instability, with dry depth set at 0.005 m, inundation depth at 0.05 m, and wet depth at 0.1 m.
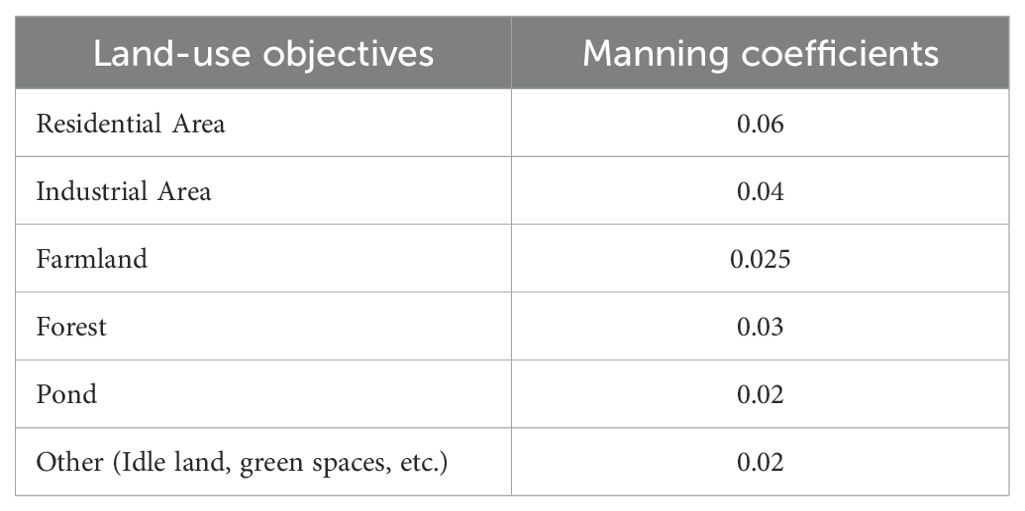
Table 2B. Manning coefficients on terrestrial surfaces (Ministry of Natural Resources, 2021).
The unstructured grid, which encompasses all potentially inundated areas of Xiamen City and its adjacent offshore regions, is designated as the fourth layer grid (Figure 3). The layout of this grid spans from 23.10°N to 25.27°N and from 117.60°E to 119.95°E. The bathymetry data, derived from ETOPO1 (Global Relief Model) along with the DEM and submarine topography (Table 1), are combined for the fourth layer. Both the DEM and ETOPO1 datasets are verified to be consistent and aligned at the same elevation level, ensuring the reliability of the integrated model. Because seawalls are crucial in tsunami hazard calculations that determine inundation area and depth, the grid nodes were aligned along the seawalls during the grid generation process, and the water depths corresponding to these nodes were adjusted to reflect the crest height of the seawalls. To accurately represent coastal inundation under different tsunami conditions in Xiamen, the time series of tsunami waves calculated using the COMCOT model is interpolated at 1-min intervals onto the open boundaries of the unstructured triangular grid of the fourth layer (Figure 4), as processed by MIKE-21. This step is necessary because the rectangular grid of the COMCOT numerical model does not adequately conform to the coastline’s contours. The grid resolution within the land areas reaches a minimum of approximately 50 m. Additionally, the time frame for calculating the maximum tsunami amplitude and inundation risk extends from the occurrence of the tsunami to 72 hours post-event (Ren et al., 2022).
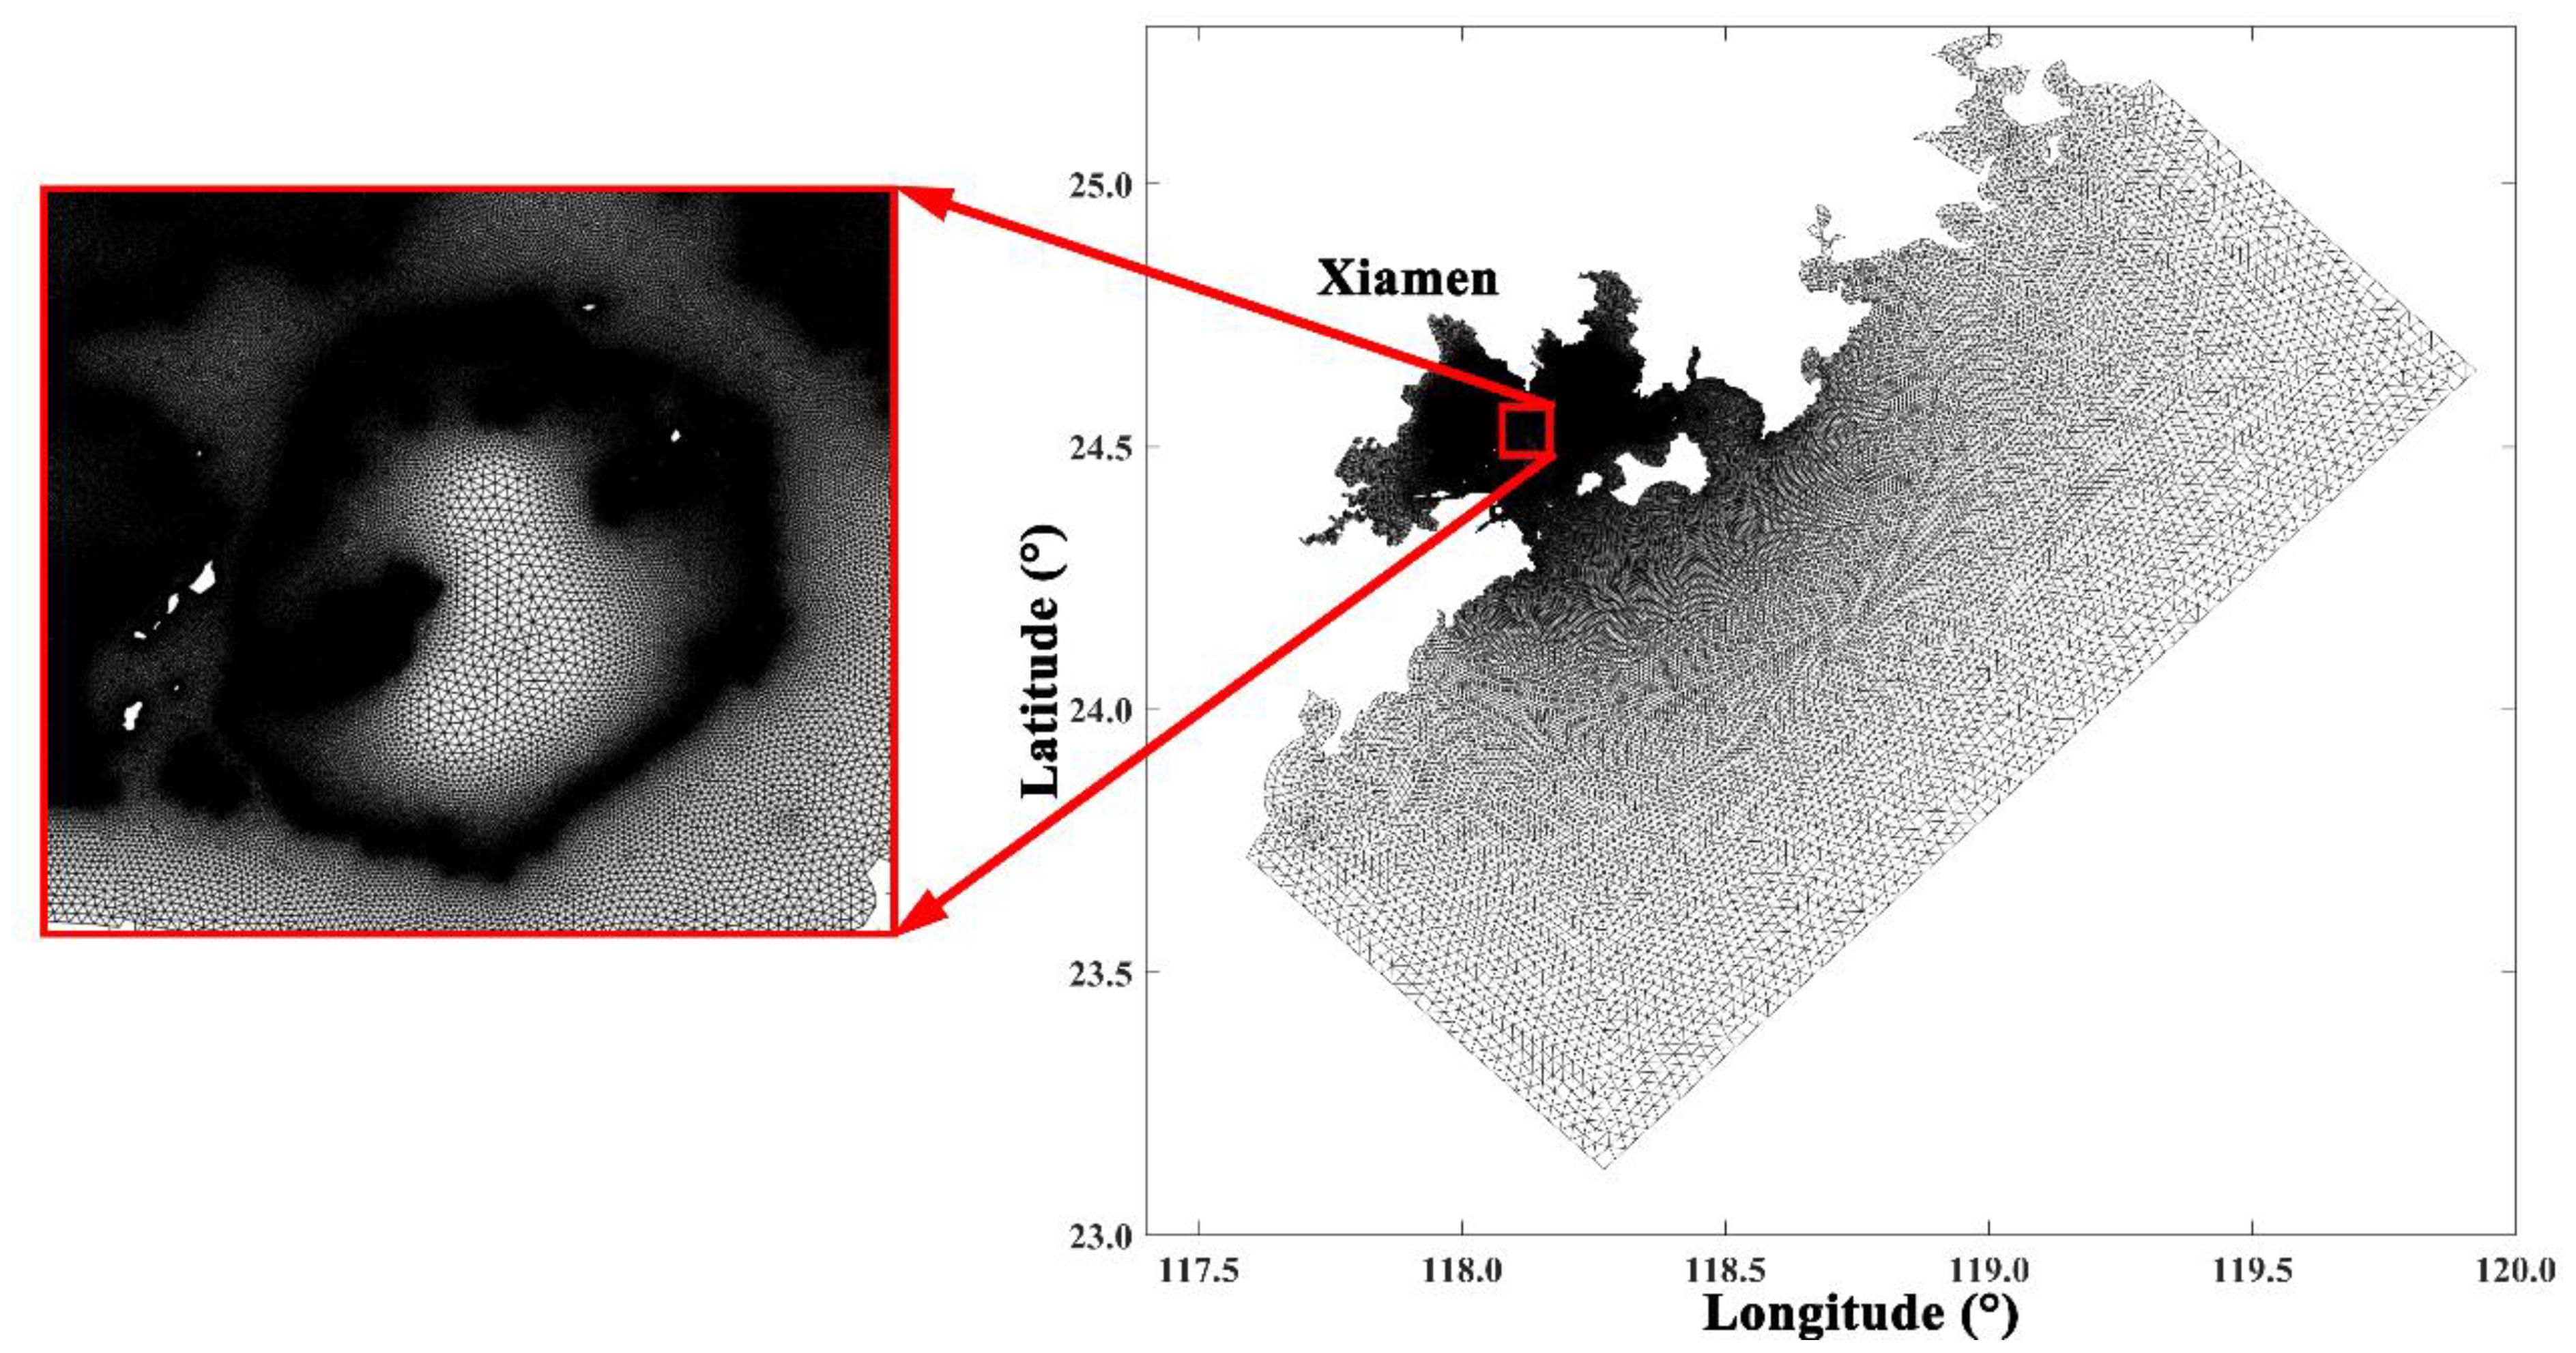
Figure 4. Model mesh grid for inundation numerical model.
3.2 Model validation
On March 11, 2011, at 13:46 (UTC+8), a magnitude 9.0 mega-earthquake struck the eastern offshore region of Honshu, Japan (38.3°N, 142.4°E), at a focal depth of 20 km. The epicenter was situated approximately 130 km east of Sendai, Japan, unleashing a massive tsunami that rapidly affected the northeastern coastal regions of Japan, resulting in catastrophic destruction. In the aftermath of the M9.0 earthquake, a tsunami wave spread rapidly across the western Pacific Ocean, and the tsunami wave affected the coastal area of Xiamen. The simulation of this event was conducted using the COMCOT model. We collected the buoys of #21401 and #21413 (Figure 5) observational data during the “3.11” tsunami event to validate the numerical model. Figure 6 illustrates the alignment between the model’s calculated results and data from two deep-ocean assessment and reporting of tsunami buoys positioned near the epicenter. The comparison indicates that the model’s simulation of the initial wave height and arrival time of the tsunami wave closely matches the observed data. The simulated maximum tsunami wave heights at each station were found to have an average relative error of less than 4% when compared with the buoy measurements, indicating that the model efficiently captured both the initial wave variations and subsequent tsunami waves. This 4% error is partly attributed to inherent limitations of the MIKE-21 model, such as the simplifications and assumptions made within the model framework.
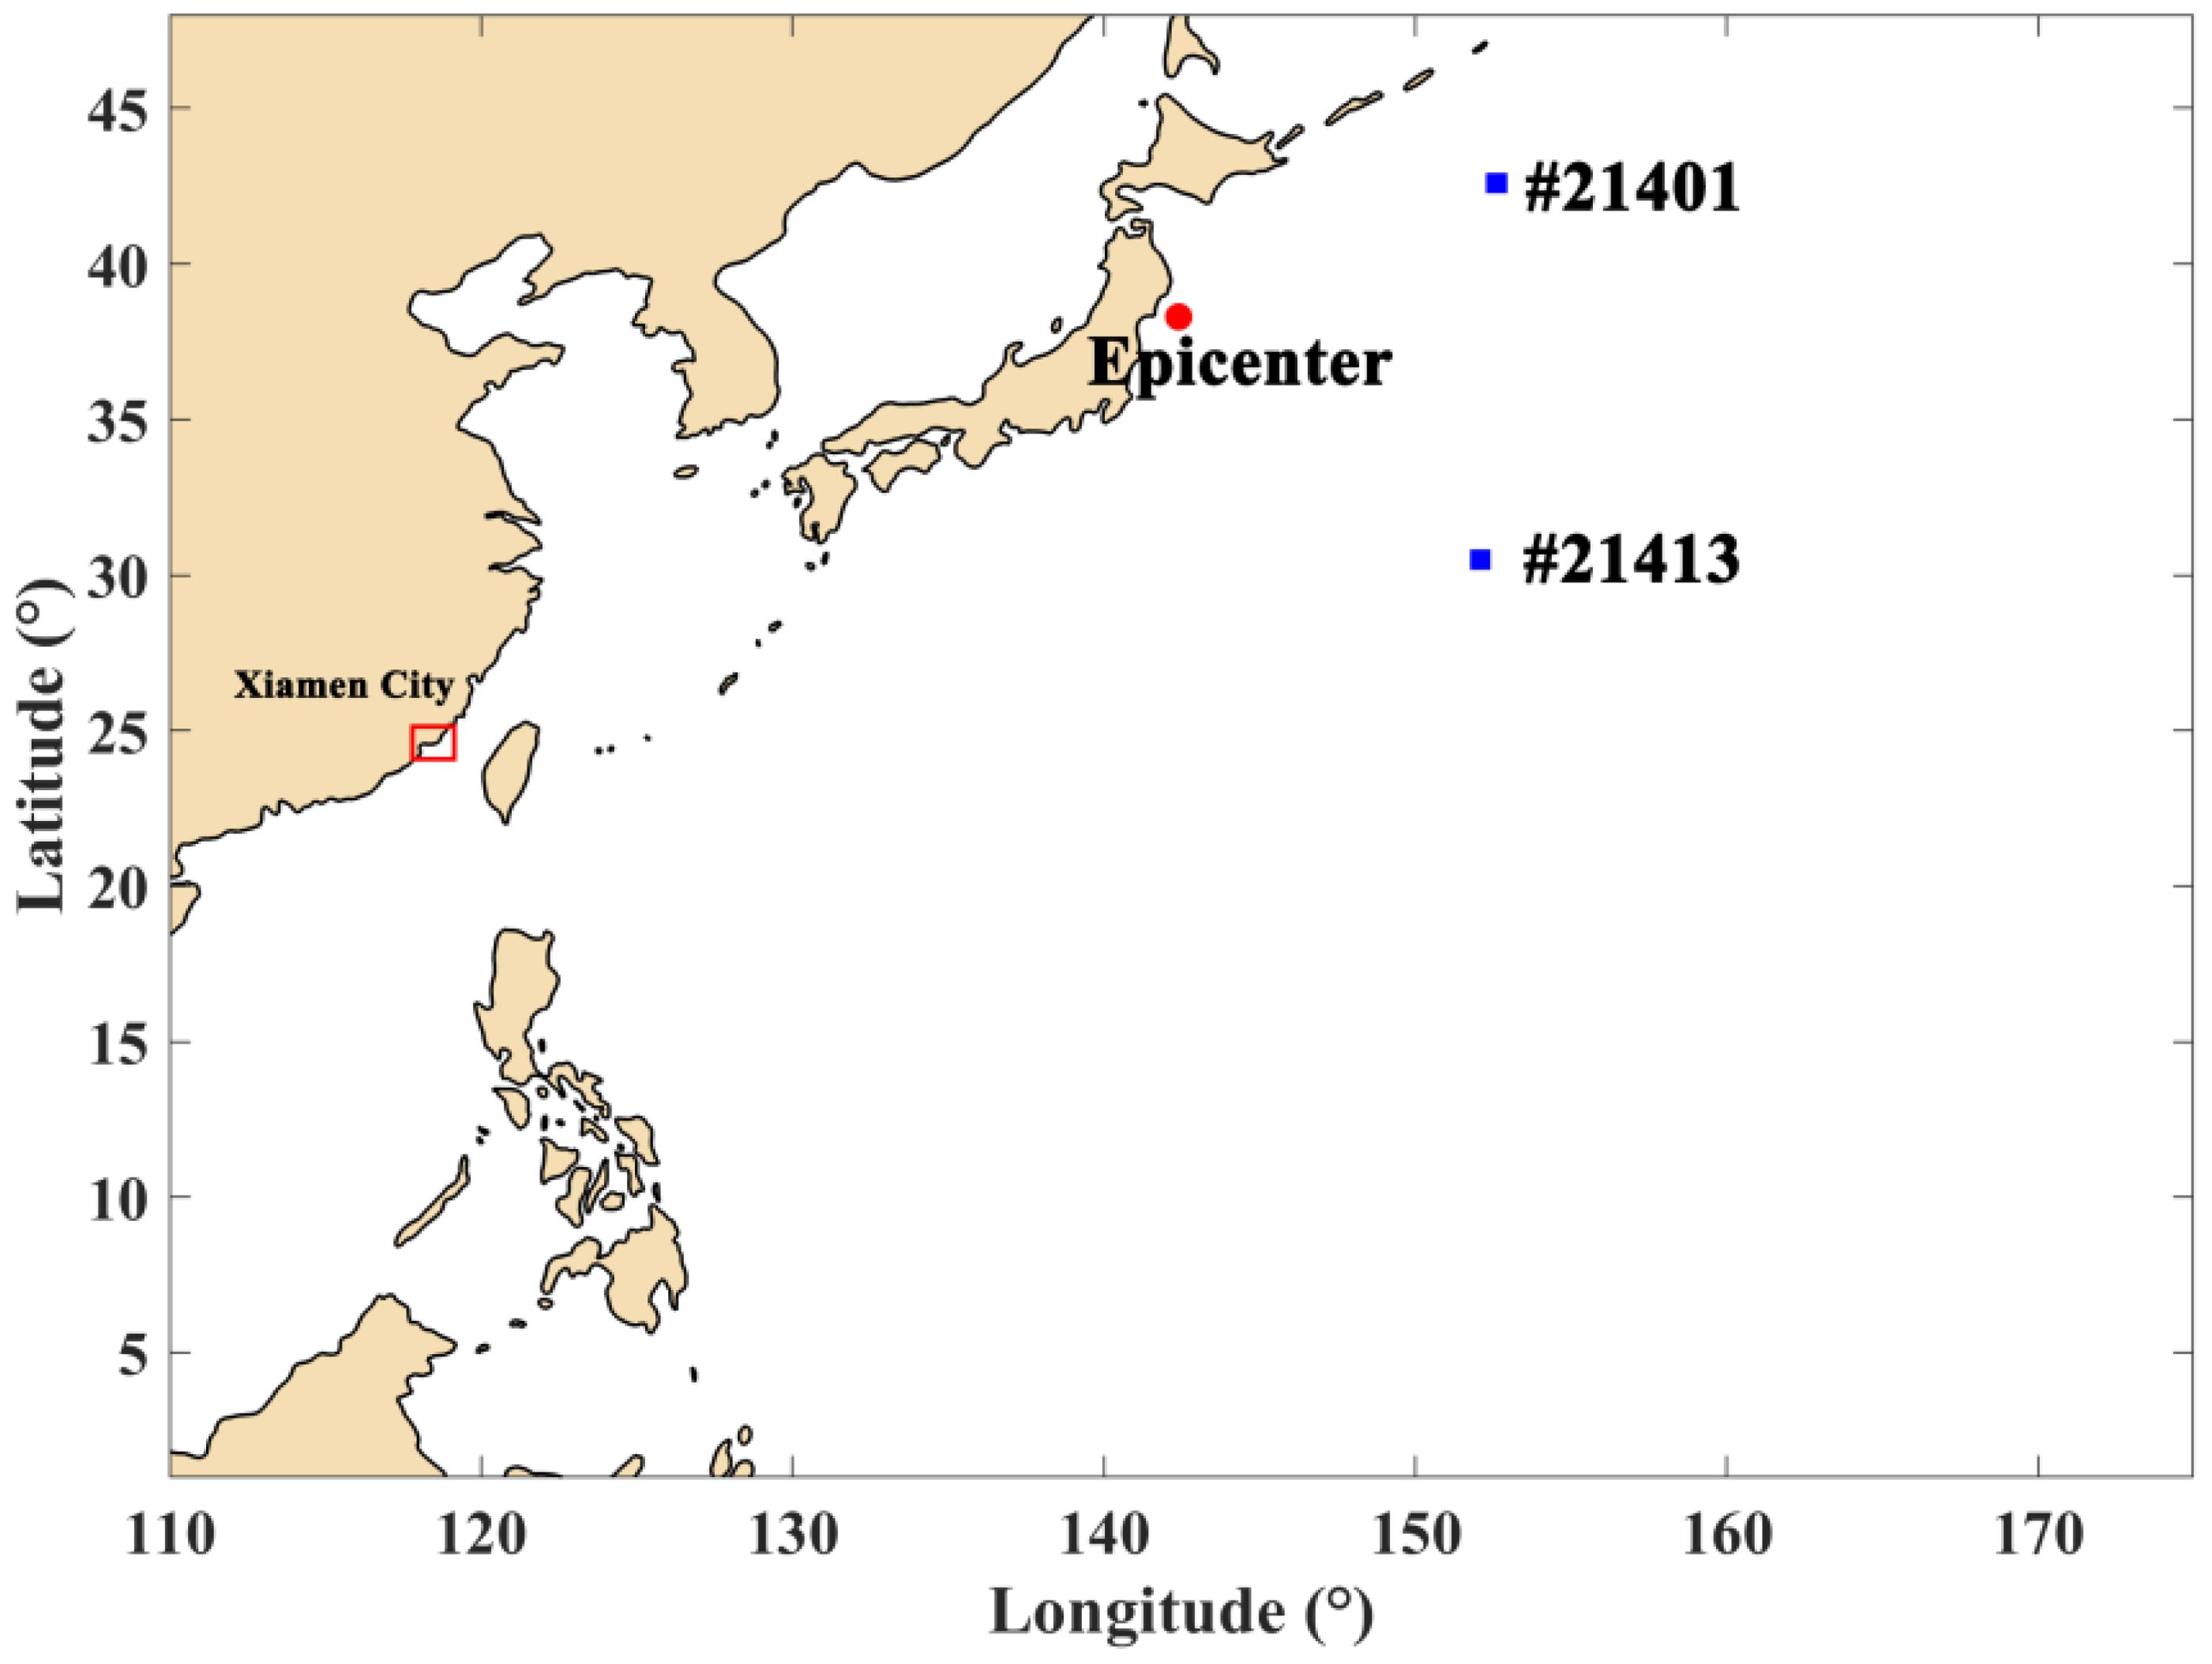
Figure 5. Tsunami model simulation domain and validation buoy locations.
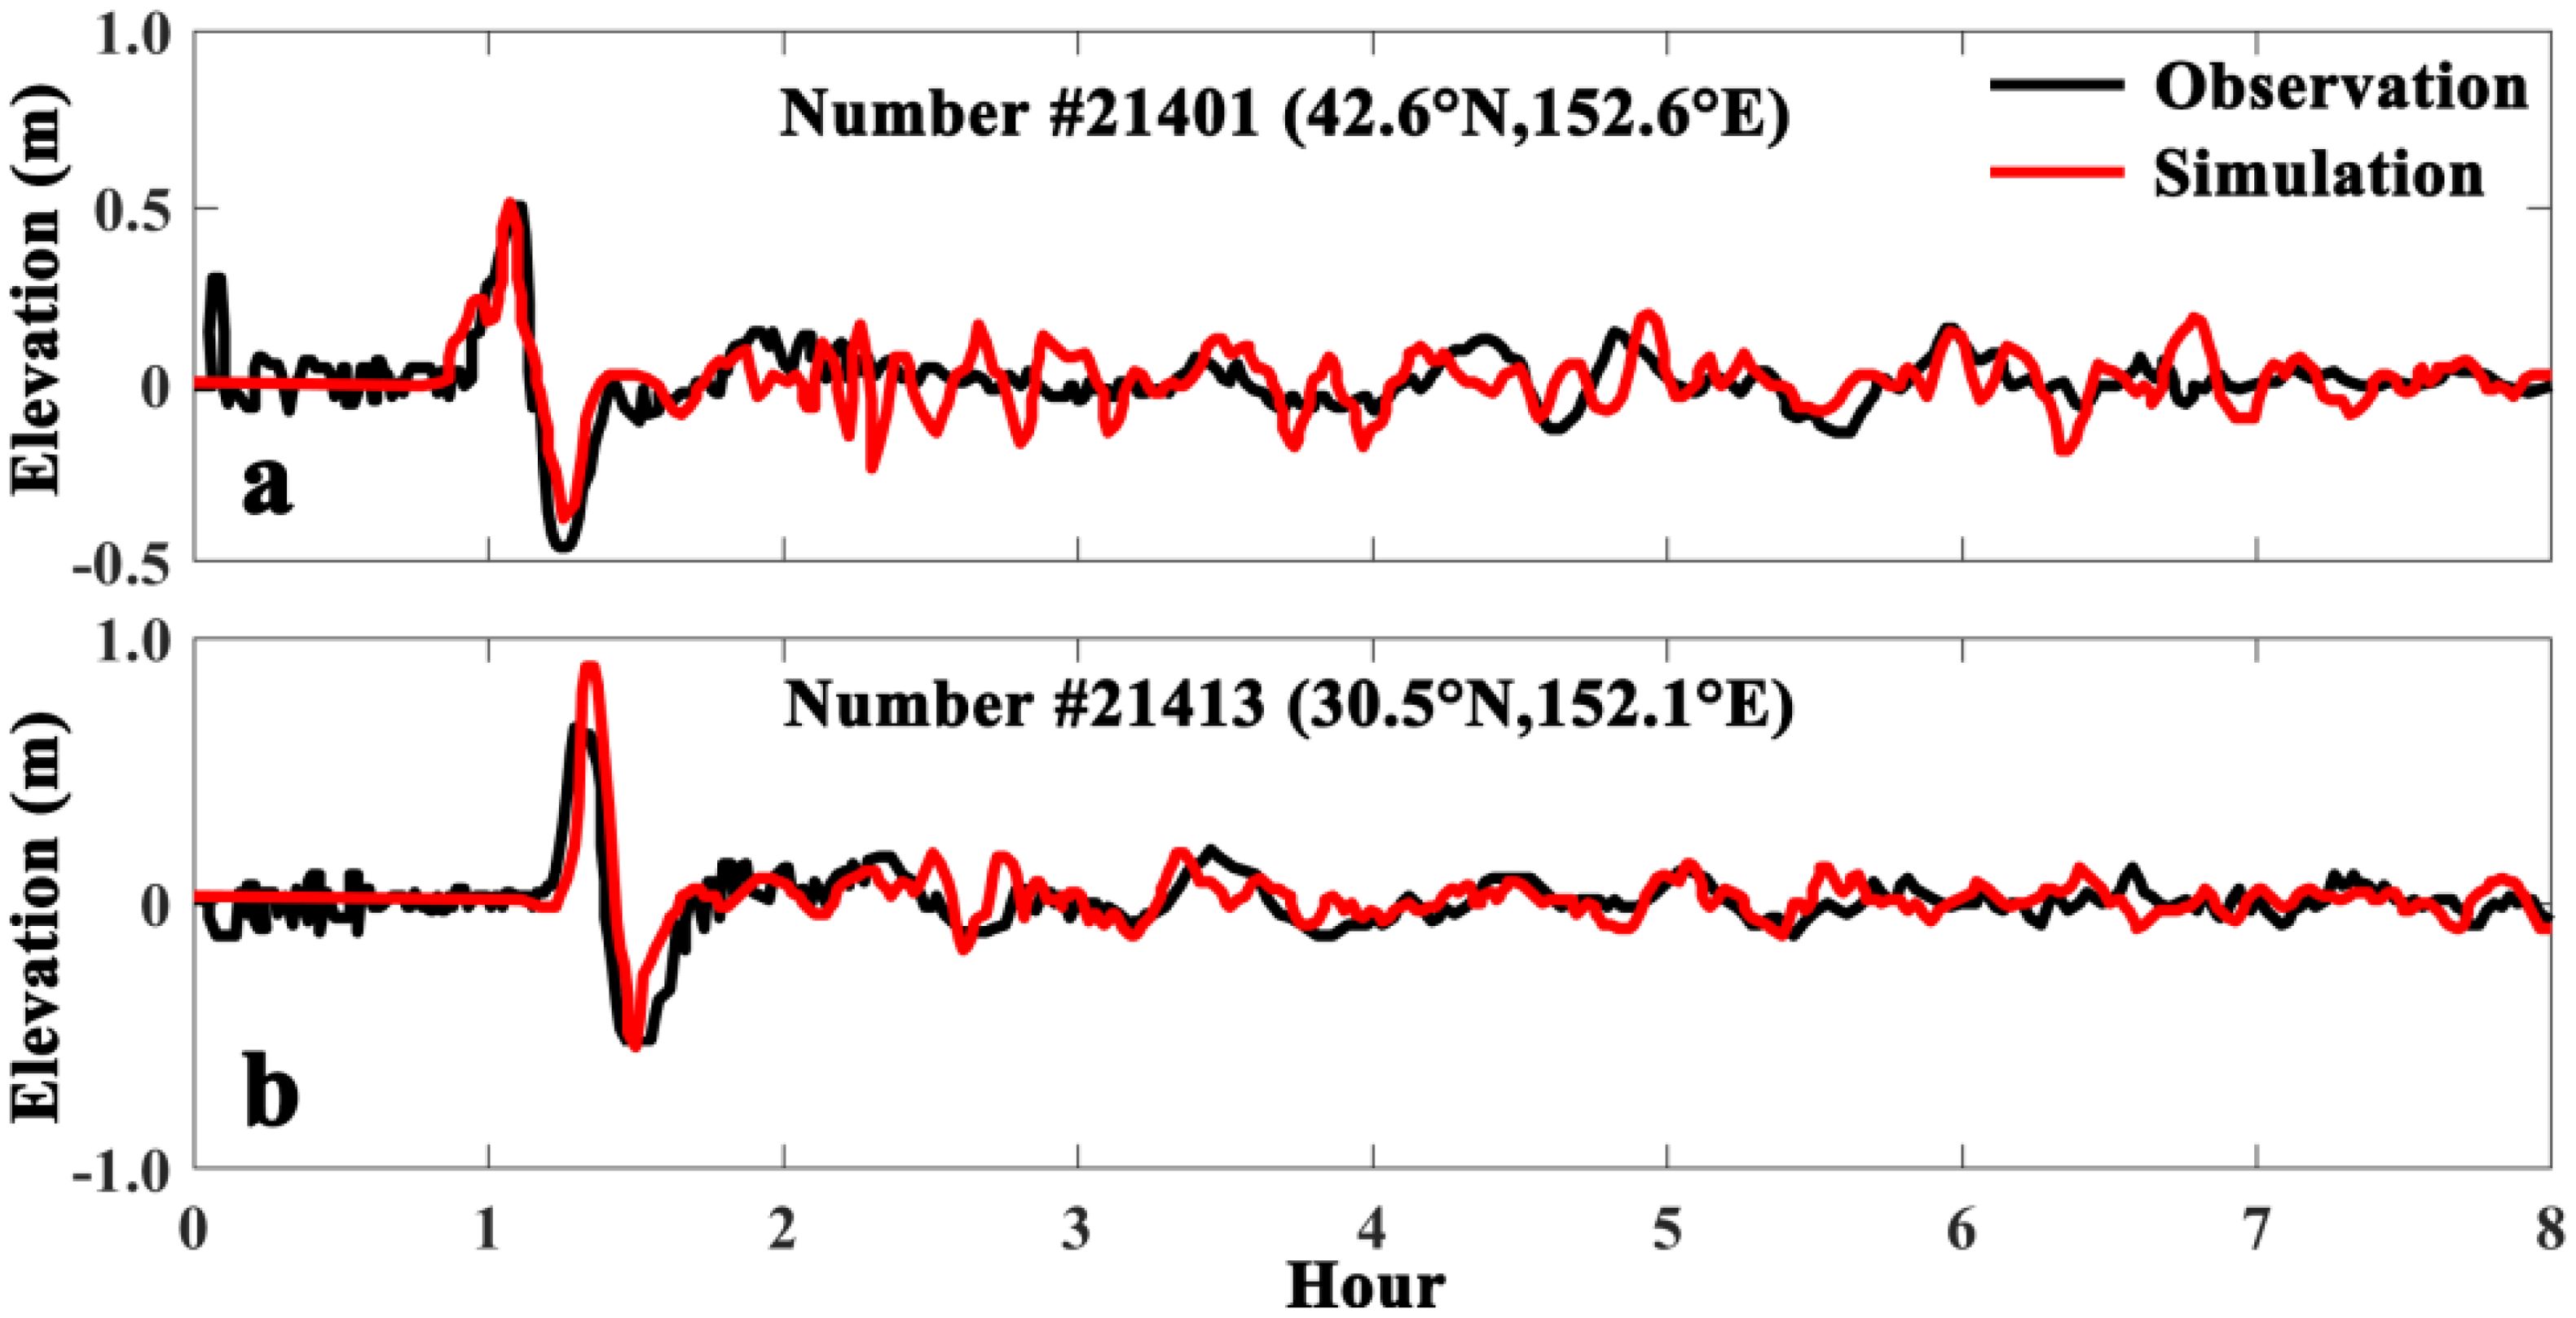
Figure 6. Comparison of simulated and observed values at buoy locations, with (A, B) corresponding to the two stations detailed in Figure 5.
3.3 Potential seismic sources
Located in the western Pacific region, China is susceptible to tsunamis generated in the Pacific Ocean. Ren et al. (2022) explored the impact of historical earthquakes that induced tsunamis (those with magnitudes larger than Mw 8.0 and focal depths less than 100 km) in the southeastern coast of China, highlighting the notable influence of the tsunamis originating from major fault zones in the Pacific Rim (Ren et al., 2022a). Therefore, the potential tsunami sources we selected include the Okinawa-Ryukyu region off the East China Sea continental shelf, te Nankai Trough in southwestern Japan, the Ogasawara Islands, Guam, the Manila Trench at the edge of the South China Sea, the eastern Philippines, the Tonga Islands, Chile, as well as the Okinawa Trough and the offshore area of Quanzhou, Fujian. Supplementary Table S1 in the Supplementary Material shows the tsunami parameters in various scenarios investigated in this study, encompassing all potential tsunami scenarios including far-field and near-field tsunami sources affecting Xiamen. Notably, the distribution of the maximum tsunami amplitude for the scenarios with a significant effect on Xiamen can be found in Figure 7. Figures 7B–D show the cumulative maximum amplitude from multiple sources: Figure 7B illustrates the amplitude resulting from Ryukyu Trough234, a combined source of Ryukyu Trough2, Ryukyu Trough3, and Ryukyu Trough4. Similarly, the tsunami generated by the Manila Trench23, amalgamating sources from Manila Trench2 and Manila Trench3, is shown in Figure 5C, and the tsunami from Manila Trench456, merging sources from Manila Trench4, Manila Trench5, and Manila Trench6, is shown in Figure 5D (Table 1). These source parameters are based on Slab1.0 (Hayes et al., 2012), a model that depicts the complex, three-dimensional geometry of global subduction zones during significant earthquakes. Additionally, to account for the worst-case scenario, this study factored in a monthly mean high-water level of 3.2 m, based on the average of the highest monthly tidal levels projected over the next 19 years from the Xiamen tidal station, into the numerical model.
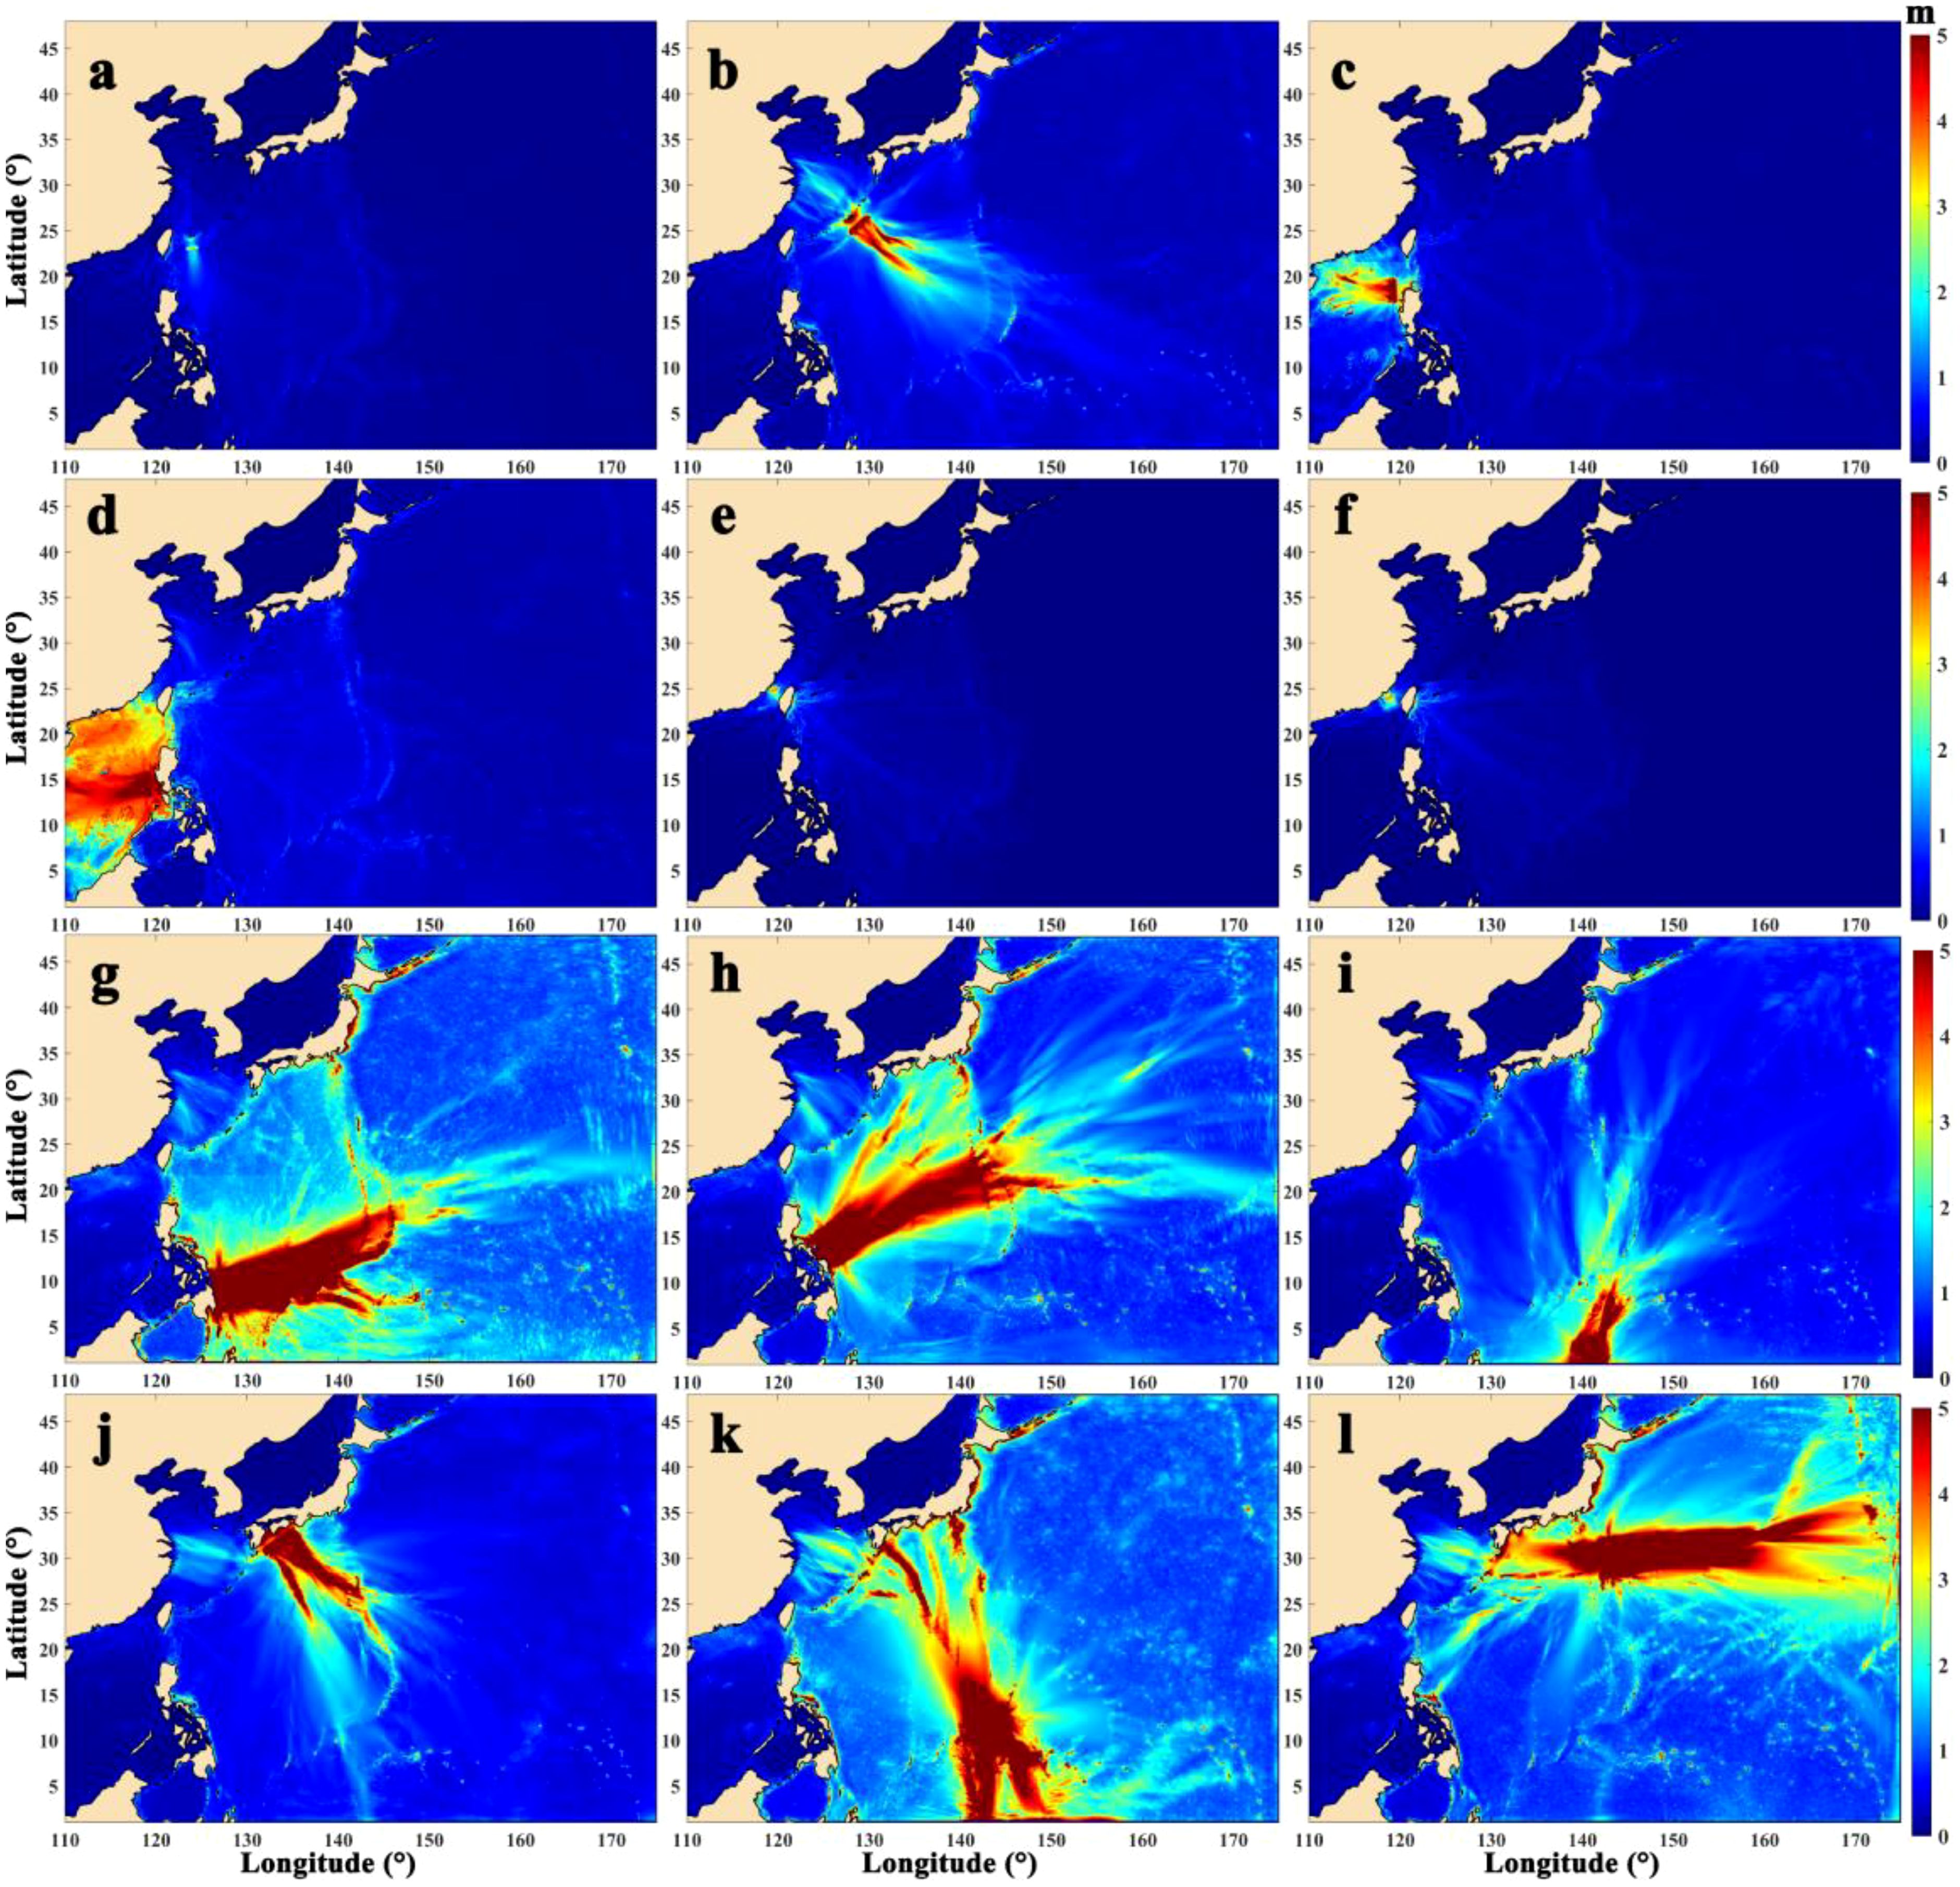
Figure 7. Pacific Ocean tsunami-induced maximum water levels for different epicenters including Ryukyu Trough6 (A), Ryukyu Trough234 (B), Manila Trench456 (C, D), Quanzhou Offshore Fault Zone (E), Xiamen Offshore Fault Zone (F), Philippine Subduction Zone1 (G), Philippine Subduction Zone2 (H), New Guinea (I), Nankaido Trough (J), Guam (K), and Ogasawara Islands (L). See Supplementary Table S1 for more details.
3.4 vulnerability assessment
Vulnerability assessment was conducted using communities as the evaluation unit, while employing land-use and significant tsunami-affected exposure distribution data. This assessment employed vulnerability coefficients specific to each type of land-use classification, and the vulnerability coefficients (shown in Supplementary Table S2) adopt values from the operation guidance for tsunami risk assessment in China, along with a calculation method based on weight for different land-use types in each community. For any given community, and the vulnerability coefficients can be calculated as follows:
where A denotes the vulnerability value of a community, ai is the weight assigned to the land-use classification i, Videnotes the vulnerability value for land-use classification i, and n represents the total number of land-use types considered. Vulnerability is categorized into four different levels: I (highest vulnerability), II, III, and IV (lowest vulnerability). Additionally, the vulnerability value of critical exposures, such as industrial parks, hazardous chemical enterprises, and port terminals, were determined based on their scale or classification, and the critical tsunami-affected exposures were assigned vulnerability coefficient according to Table 3. For a land use plate element, the vulnerability coefficient was evaluated based on land use distribution according to Supplementary Table S2. The vulnerability coefficient value will be changed to a more serious value if critical tsunami-affected exposures located at this area. In terms of the assessment units with some critical tsunami-affected exposures, the vulnerability coefficients of the communities need to be revised by considering the vulnerability coefficients of critical tsunami-affected exposures and their corresponding weights, and the vulnerability coefficient range corresponding to the vulnerability level is as shown in Table 4.
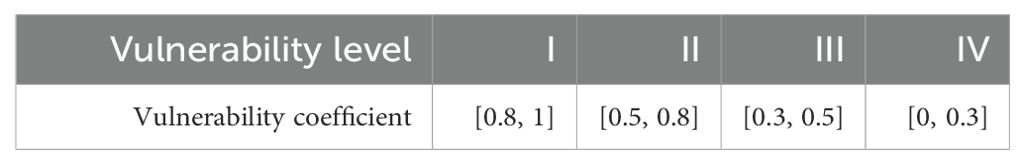
Table 3. Corresponding relationship between tsunami-affected exposures and vulnerability coefficient.
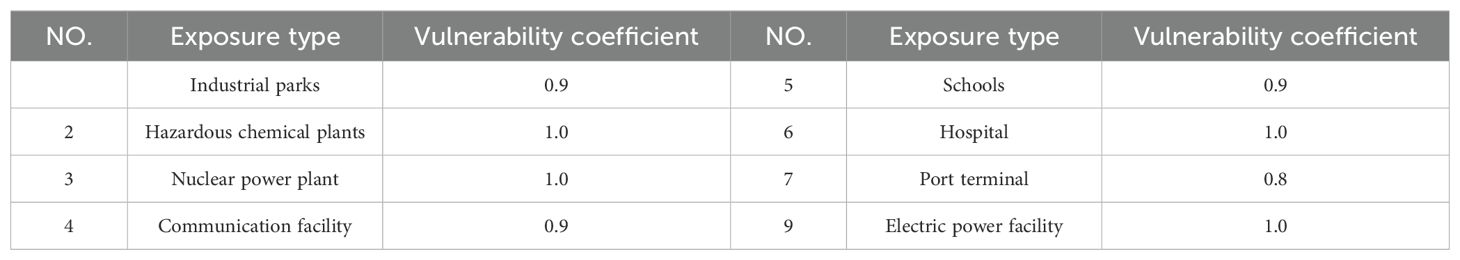
Table 4. The vulnerability coefficient range corresponding to the vulnerability level.
4 Results
4.1 Tsunami hazard assessment
The tsunami hazard assessment for Xiamen City utilized an envelope diagram depicting inundation ranges and submerged depths resulting from various potential tsunami sources, as illustrated in Figure 8. This analysis revealed varying degrees of inundation along Xiamen City’s coastline. Based on the inundation calculations, the following tsunami sources were identified as being responsible for the significant inundation areas in Xiamen: the Manila Trench RM (2 + 3) fault with an 8.8 magnitude earthquake tsunami, Manila Trench RM (4 + 5 + 6) fault with an 8.8 magnitude earthquake tsunami, Quanzhou Overseas Fault with an 8.0 magnitude earthquake tsunami, Xiamen Overseas Fault with an 8.0 magnitude earthquake tsunami, East Philippines 1 Fault with a 9.2 magnitude earthquake tsunami, and East Philippines 2 Fault with a 9.2 magnitude earthquake tsunami. The inundated areas caused by the tsunami are mainly located in the east and west coast of Xiang’an District, the south coast along Tong’an District., and the coast of both sides of Maluan Bay. The inundation of Xiamen Island including Huli District and Siming District was not particularly severe. Specifically, in Tong’an District, the most severe inundation scenarios are caused by the RM (2 + 3) fault of the Manila Trench and the East Philippines 1 earthquake tsunami, with inundation depths reaching up to 2.8 m. In Xiang’an District, the inundation from the East Philippines 1 earthquake tsunami scenario is the most critical, with depths reaching up to 3.0 m.
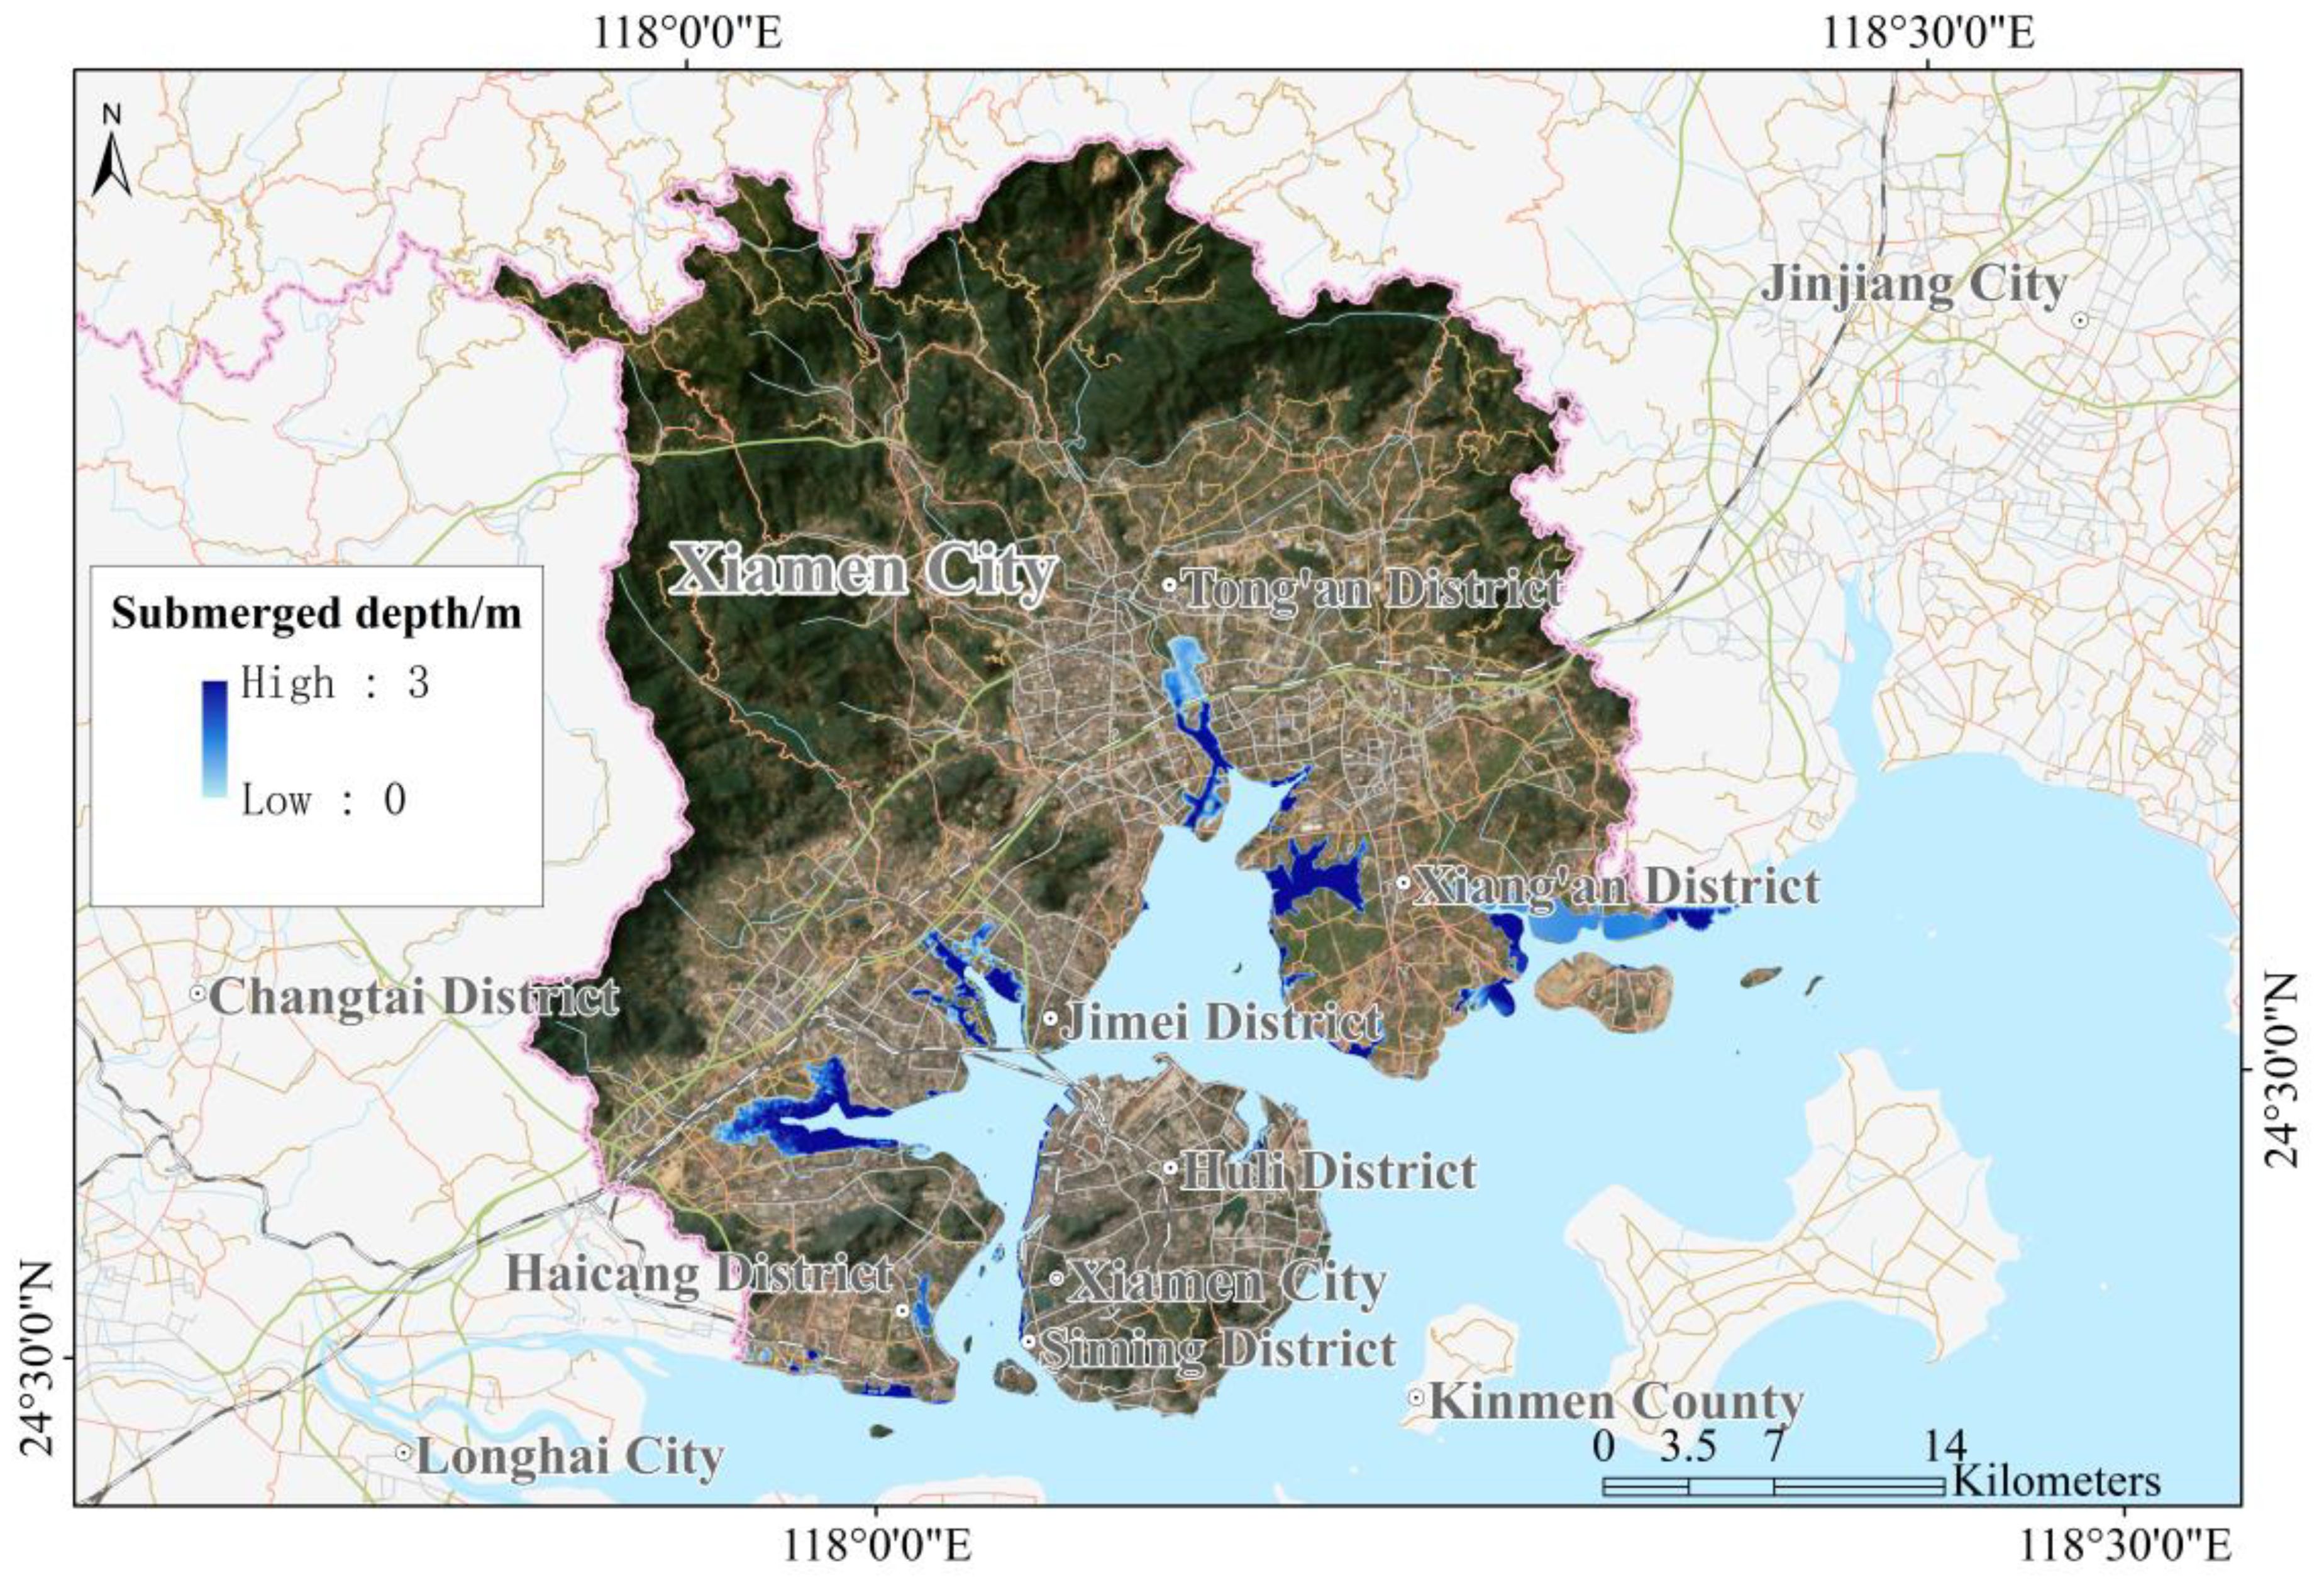
Figure 8. Probable maximum tsunamis inundation distribution in Xiamen City.
4.2 Tsunami vulnerability assessment
The distribution area of tsunami-affected exposures including industrial and chemical enterprises and ports, etc., is the area where local coastal government needs to pay much more attention in tsunami disaster responding and mitigation. Considering land-use distribution data and critical tsunami-affected exposure data, the vulnerability levels within Xiamen City were determined. The spatial distribution of vulnerability levels in Xiamen was calculated by applying the aforementioned principles and leveraging the GIS analysis method. As shown in Figure 9, the land use block unit was adopted to evaluate the vulnerability level in Xiamen city. It could be found that the areas of less vulnerable places are mainly concentrated the inland of the Tong’an and Jimei District beyond the coast, and communities exhibiting high vulnerability (level I) were predominantly located in Huli, Haicang and Siming districts. Especially, the vulnerability distribution in Xiamen City from inland to the coastal showed a low to high distribution pattern. These coastal areas with high vulnerability are characterized by developed economy and populated aggregation, extensive areas designated for urban housing and institutions, and a high density of entities vulnerable to disasters, such as schools and hospitals. Additionally, these districts host critical infrastructure and facilities vulnerable to tsunamis, including airports, petrochemical bases, fishing ports and industrial and mining enterprises. Therefore, these areas were identified as having high levels of tsunami vulnerability.
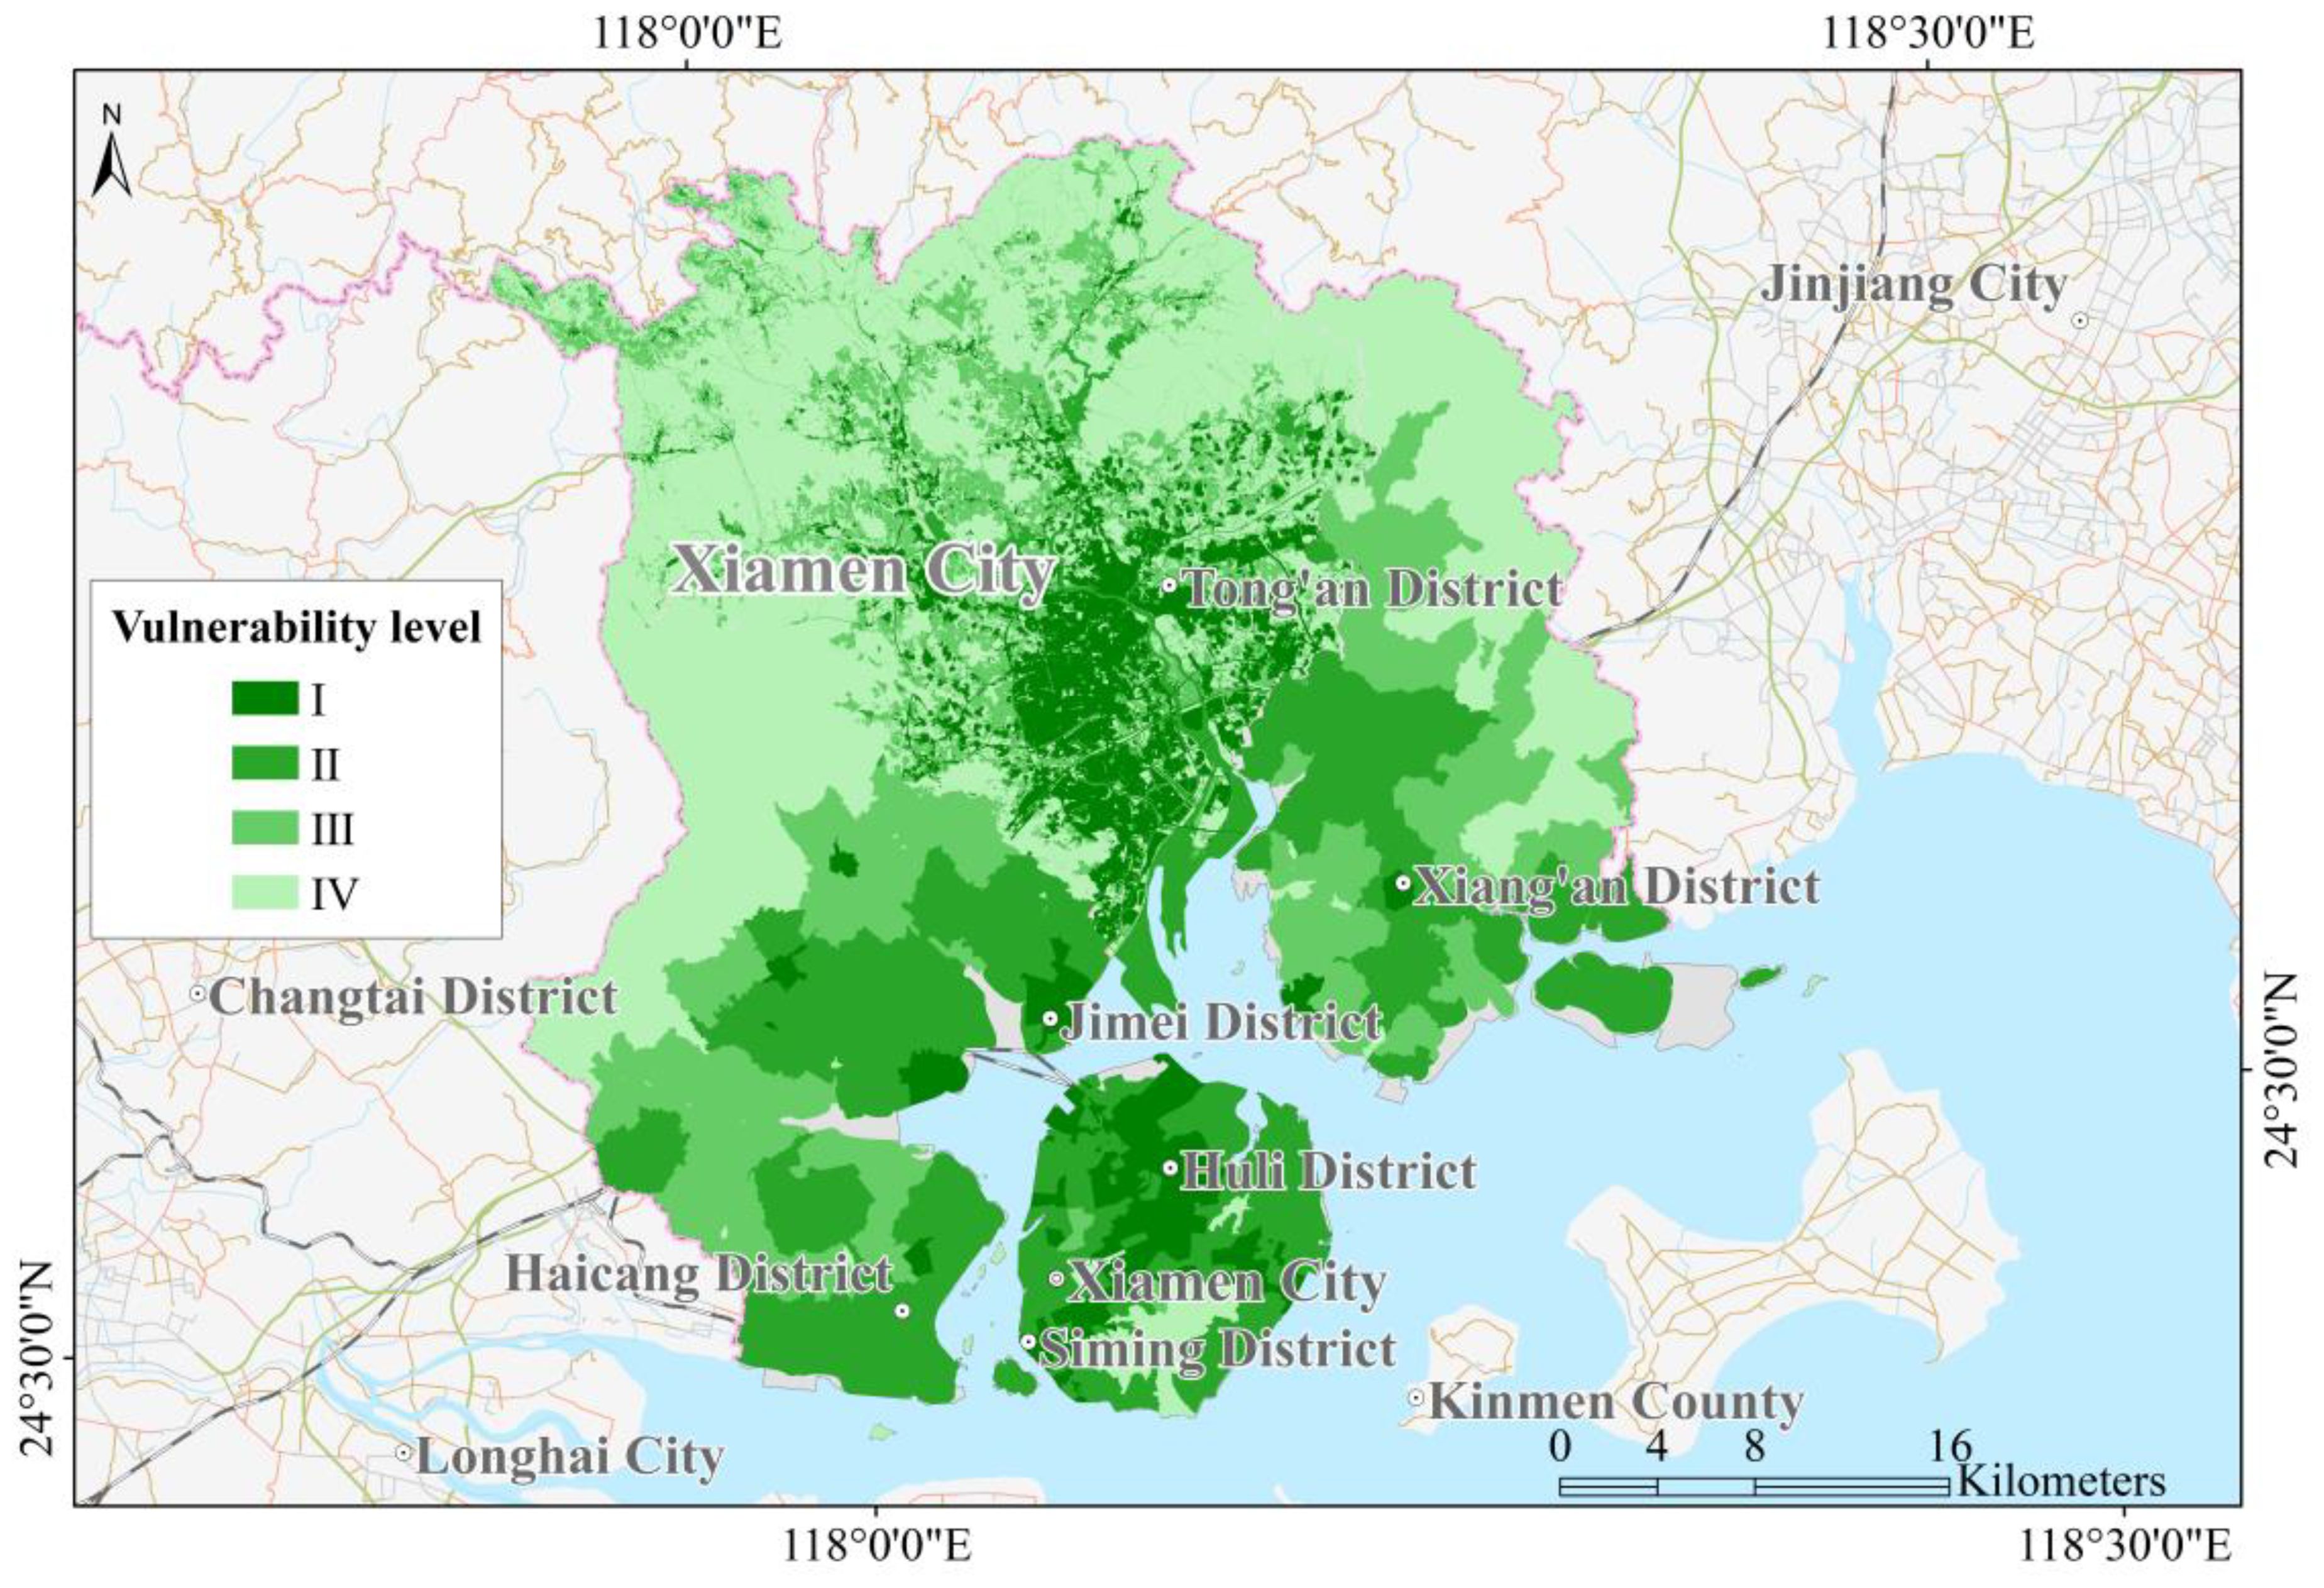
Figure 9. Vulnerability level distribution in Xiamen City.
4.3 Tsunami risk assessment
Considering the distribution of tsunami hazard and vulnerability levels, this study assessed the tsunami risk level in Xiamen City (Figure 10), while focusing on coastal communities as the primary unit of analysis. Tsunami disaster risk levels were divided into five levels: high (I), medium-high (II), medium (III), medium-low (IV), and low (V). According to the evaluation results, the areas classified as high risk (I) and medium-high risk (II) in Xiamen cover 0.38 km2 and 15.77 km2, respectively. The medium risk (III) area spans 14.90 km2, the medium-low-risk (IV) area covers 57.78 km2, and the low-risk (V) area encompasses 24.61 km2. Tsunami disaster risk in Xiamen is primarily concentrated in Xiang’an, Haicang, and Jimei districts. These findings indicate varying degrees of tsunami disaster risk in the southwest of Xiang’an District, south of Haicang District, and south of Jimei District. Specifically, communities along Haicang Street (Haicang District), in Xike Town (Tongan District), and along various streets in Jimei and Siming districts, including Xinglin, Xingbin, Qiaoying, Lujiang, Xiagang, Lianqian, and Gulangyu streets, as well as on Dasheng Street and in Ma Xiang Town and Xindian Town of Xiang’an District, were identified as having level I risk of tsunami disaster. Huli District, featuring multiple communities along Dianqian, Heshan, Jinshan, and Huli streets, faces the highest tsunami hazard risk at level II. These areas warrant heightened attention for tsunami disaster prevention and mitigation efforts in Xiamen. In particular, according to our simulated results in the map of the probable maximum tsunamis inundation distribution in Xiamen City, the areas along the coastline of Huli District and Siming District in Xiamen Island was inundated, although the submerged area is very small. The hazards level was evaluated using village/community units, and the village/community along Xiamen Island behaved high hazards level. Combined with the economically prosperous and densely populated coastal regions in Xiamen Island resulting high vulnerability level, the risk level in Xiamen Island along the coastal village/community is still quite high.
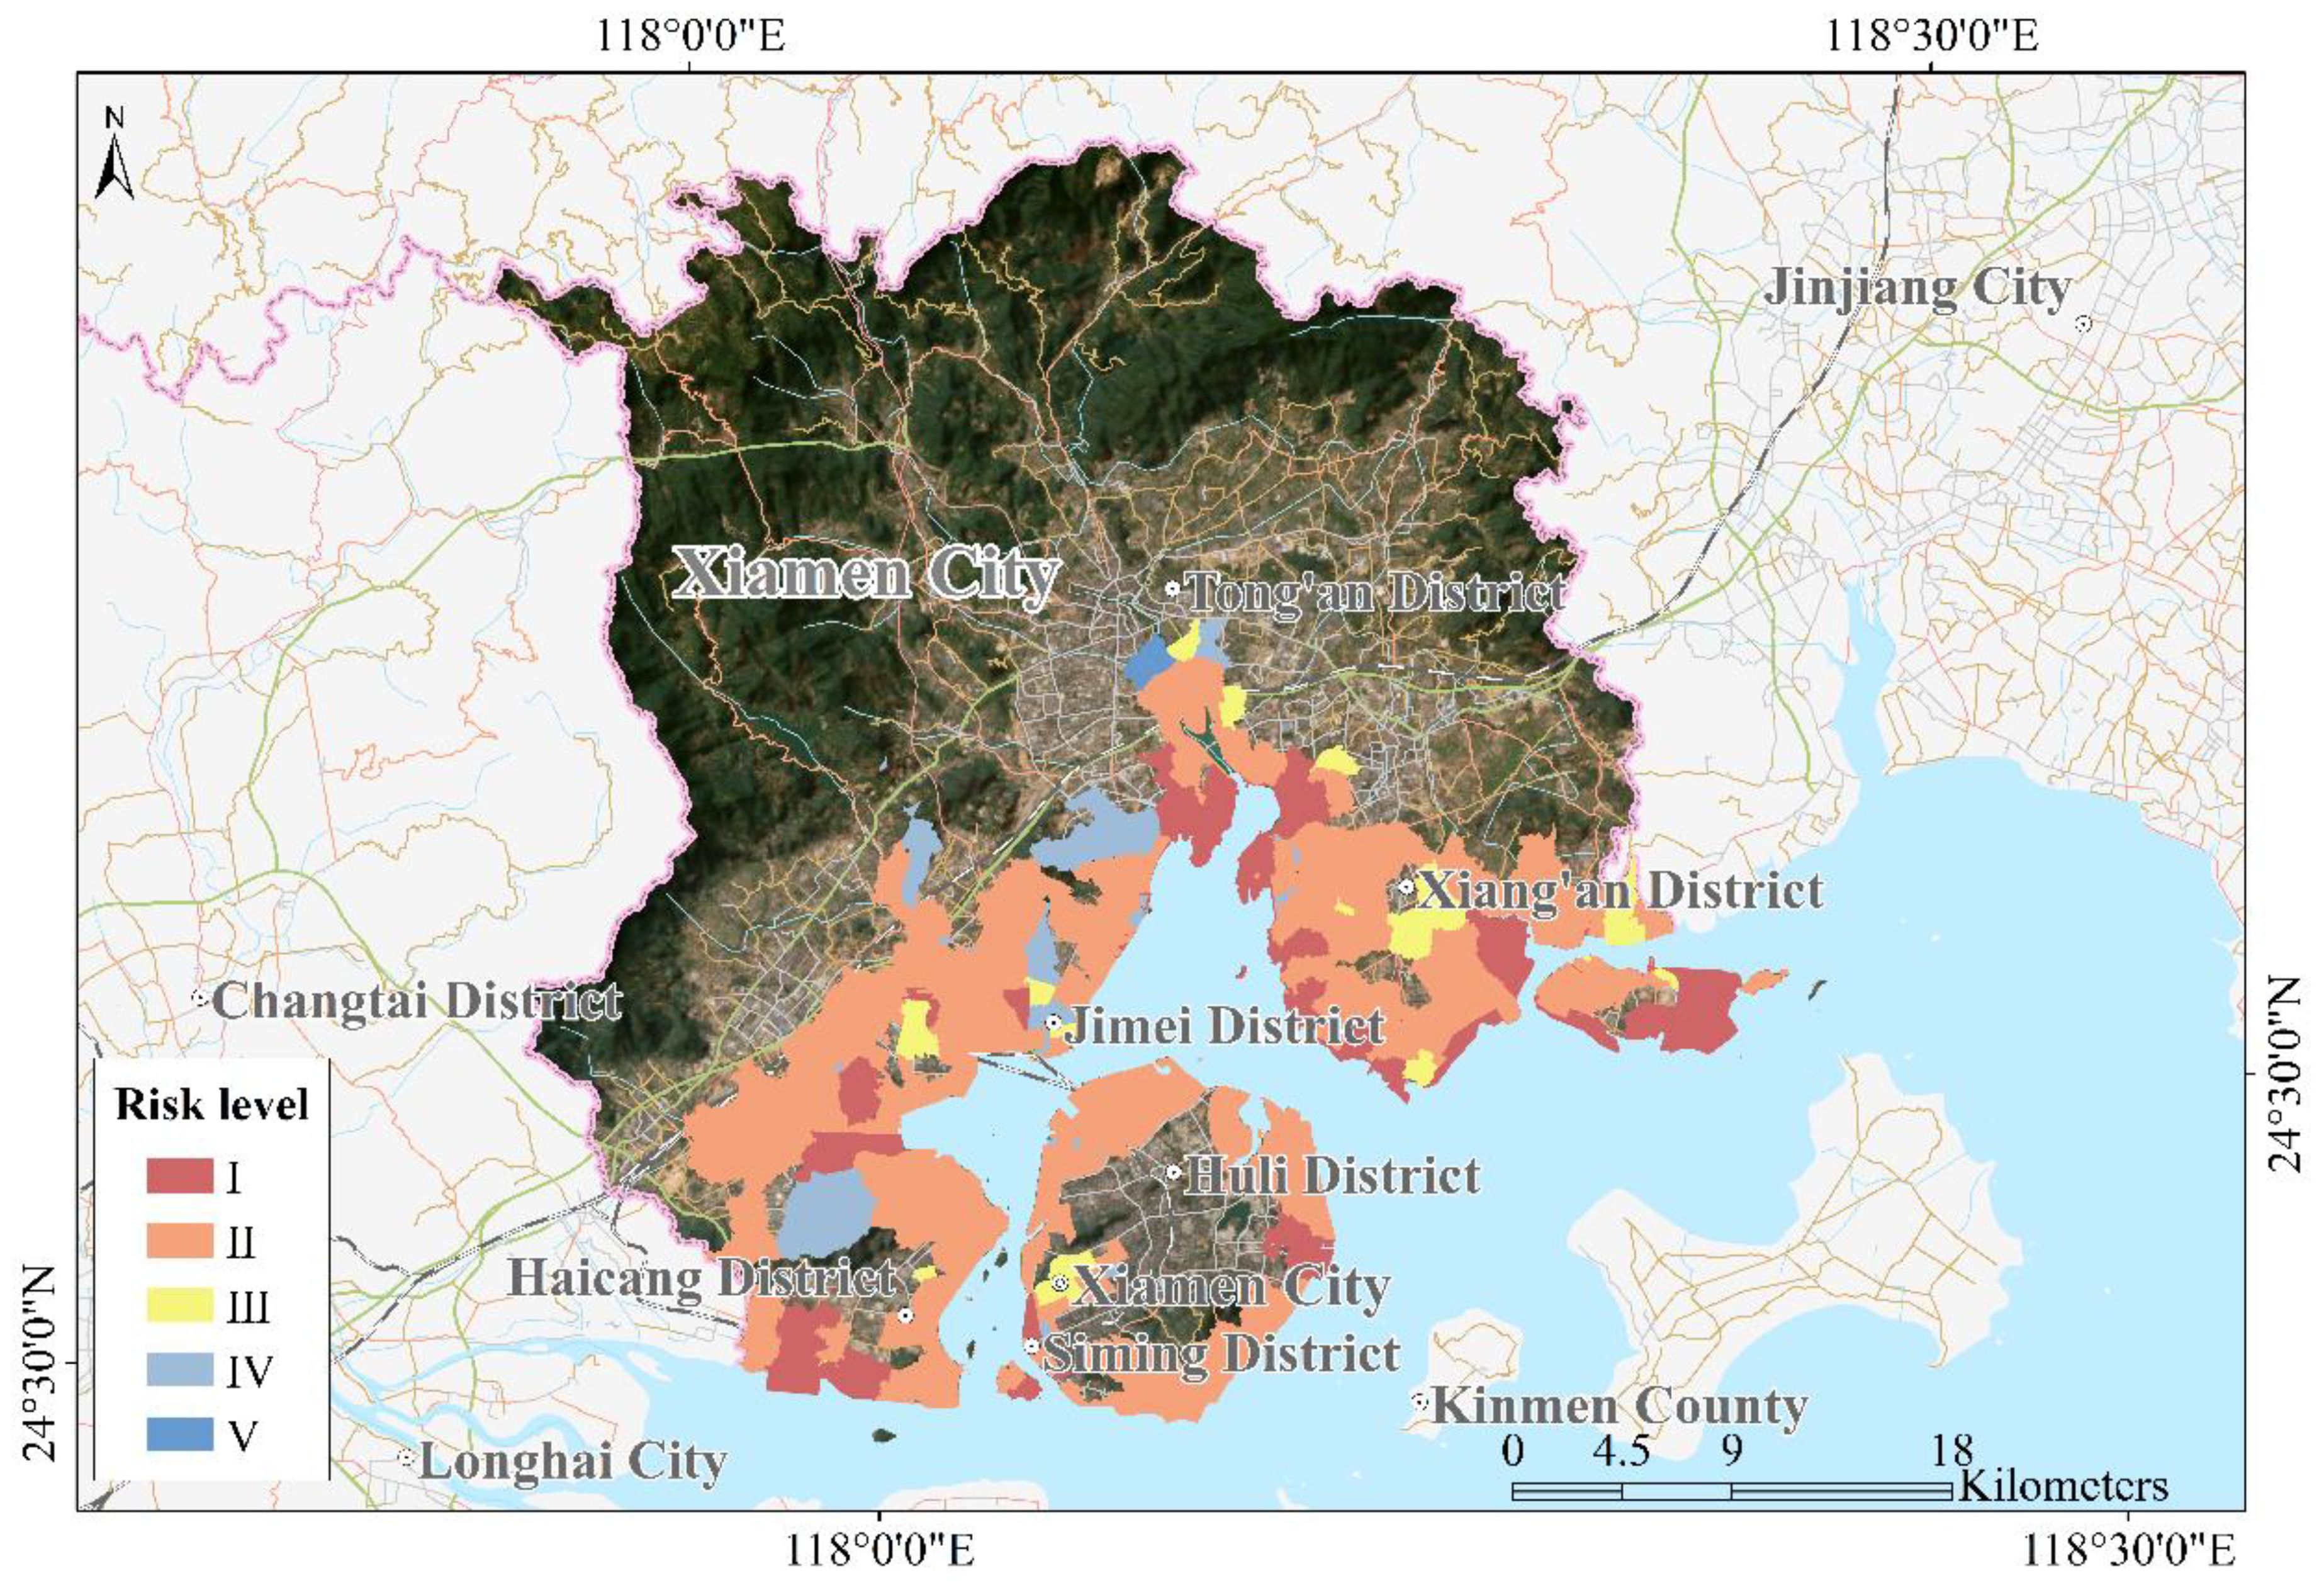
Figure 10. Tsunami disaster risk distribution in Xiamen City.
5 Discussion
Tsunami disaster risk assessments are crucial for disaster prevention and mitigation efforts undertaken by coastal local governments. The numerical calculations of tsunamis from various potential sources enable the creation of tsunami emergency plans, including the drafting of evacuation routes and the selection of emergency shelters. Additionally, the results of tsunami risk zoning are invaluable for local land-use management, urban development planning, and optimization of investments. In this study, a grade-based tsunami risk assessment was conducted considering land-use types. A more refined tsunami disaster risk assessment should rely on the precise distribution of entities vulnerable to disaster. Future research therefore aims to conduct refined grid-scale tsunami disaster risk assessments in coastal areas, relying on obtaining more detailed data on the distribution of disaster exposures.
Owing to the lack of historical records on tsunami losses, this study was limited to using land-use distribution data and tsunami-affected exposure data for the vulnerability assessment of tsunami disasters in Xiamen City. The qualitative grade vulnerability level assessment rather than quantitative vulnerability curve construction was performed in this study. For precise quantitative vulnerability assessment and disaster risk evaluation, it is essential that vulnerability curves accurately reflect the quantitative relationships between the intensity of causative factors and the vulnerability of susceptible entities. A quantitative vulnerability curve for typical exposures to tsunami disasters is yet to be established. Future studies should aim to build upon the extensive body of existing research that has already addressed quantitative vulnerability analyses for entities affected by tsunamis through various approaches, including qualitative, quantitative, and multivariate methods (e.g., Reese et al., 2011; Di Bacco et al., 2023). Utilizing physical model experiments and statistical analysis methods, future research can further refine and expand these analyses. By establishing a vulnerability curve that correlates the loss ratio of typical exposures with the hazards caused by tsunamis in coastal areas, a quantitative risk assessment of tsunami disasters can be realized. Therefore, the risks to typical exposures from tsunami disasters can be quantitatively evaluated, enabling precise and targeted decision-making in response to tsunamis in coastal regions.
However, it is important to acknowledge certain limitations in our study. Firstly, while the numerical model used in this research has been validated against historical data, the accuracy of the simulations is contingent upon the quality and completeness of the input data, which may not fully capture all potential tsunami sources or the complexities of local coastal dynamics. This could potentially affect the precision of tsunami inundation distribution, but it does not undermine the applicability of the framework in other coastal contexts. Secondly, the vulnerability assessment was based on land-use and exposure data, which may not comprehensively represent the socio-economic factors that influence the resilience of communities to tsunami events. Additionally, the study focused on a single coastal city, and while the methodology is intended to be transferable, the specific conditions and characteristics of other coastal areas may require adjustments to the model and assessment framework. Future research should address these limitations by incorporating more diverse and detailed data sources, refining the model to account for local variations, and validating the methodology across a broader range of coastal settings. Despite the limitations noted, the methodology developed in this study has demonstrated its potential to be adaptable and scalable, suggesting that it can be readily employed for various coastal cities.
6 Conclusion
This research contributed the methodology for assessing tsunami disaster risk level for a coastal city in the absence of historical loss records, and the proposed method could easily be easily adopted for various coastal cities. Taking Xiamen as a typical case study, a high-resolution tsunami numerical model was established to reveal the tsunami risk hotspots in the study areas. The impact of local-field and far-field tsunami sources on Xiamen was evaluated. The grid resolution of the nearshore DEM for tsunami inundation simulation reached 50 m, and the seawall was adopted in the numerical modelling. Villages and communities, as the most basic administrative units, were used to assess tsunami disaster risk levels and were found to play a pivotal role in managing and coordinating disaster prevention and mitigation efforts in coastal areas of China. The results at the village/community scale are designed to provide decision-making support for coastal local government departments in tsunami preparedness and mitigation at the grass-root level.
Initially, a high-resolution numerical model for simulating tsunamis was developed and verified using historical observational data. By inputting potential tsunami sources, the study estimated the probable maximum inundation in Xiamen City that could be caused by a tsunami. Considering land-use distribution data and tsunami-affected exposure data, the vulnerability levels within Xiamen City were determined. By integrating the hazard and vulnerability levels associated with tsunami disasters in Xiamen City, the risk level of tsunami disasters in the study area was evaluated. The findings lay the groundwork for developing a methodology for tsunami disaster risk assessment in coastal regions, and could provide an effective tool for decision-making in tsunami disaster risk mitigation efforts. We recommend that governments and policymakers allocate additional resources to improve disaster relief and prevention infrastructure. By investing in these areas, it is possible to significantly mitigate potential impacts and enhance the resilience of communities and infrastructure against future risks.
Importantly, while this paper provides a detailed example of tsunami risk assessment applied to a specific area, it offers valuable insights and approaches that could improve tsunami disaster risk assessment in coastal areas globally. However, this study also has some limitations. Firstly, although the high-resolution numerical model used has been validated with historical data, there may still be certain uncertainties when simulating extreme tsunami events. Secondly, while the method demonstrated good results in the case of Xiamen, its applicability in other coastal areas with different geographical conditions and socio-economic structures requires further validation. In addition to our findings, there are opportunities for future research that could further enrich this field. Future studies might explore the long-term impacts of interventions in high-risk areas or investigate the effectiveness of different disaster prevention strategies across various regions.
Data availability statement
The raw data supporting the conclusions of this article will be made available by the authors, without undue reservation.
Author contributions
XS: Conceptualization, Writing – original draft, Writing – review & editing. DD: Data curation, Funding acquisition, Writing – review & editing. ZY: Data curation, Writing – review & editing. JH: Data curation, Writing – review & editing. CY: Data curation, Writing – review & editing. XL: Data curation, Validation, Writing – review & editing. YY: Investigation, Methodology, Validation, Writing – review & editing. YD: Funding acquisition, Investigation, Methodology, Writing – review & editing.
Funding
The author(s) declare financial support was received for the research, authorship, and/or publication of this article. This work was funded by the Fundamental Research Funds for the Central Universities (grant number 2233100025), Open funds of Key Laboratory of Ocean Space Resource Management Technology (KF-2024-110), and Presidential Science Foundation of the Zhejiang Institute of Hydraulics and Estuary, China (grant No. ZIHE22Q012).
Conflict of interest
The authors declare that the research was conducted in the absence of any commercial or financial relationships that could be construed as a potential conflict of interest.
Publisher’s note
All claims expressed in this article are solely those of the authors and do not necessarily represent those of their affiliated organizations, or those of the publisher, the editors and the reviewers. Any product that may be evaluated in this article, or claim that may be made by its manufacturer, is not guaranteed or endorsed by the publisher.
Supplementary material
The Supplementary Material for this article can be found online at: https://www.frontiersin.org/articles/10.3389/fmars.2024.1478149/full#supplementary-material
References
Alhamid A. K., Akiyama M., Koshimura S., Frangopol D. M., So H. (2024). Tsunami insurance portfolio optimization for coastal residential buildings under non-stationary sea level rise effects based on sample average approximation. Stoch Environ. Res. Risk Assess 38, 817–841. doi: 10.1007/s00477-023-02602-1
Borrero J. C. (2003). Preliminary simulations of the Algerian tsunami of 21 May, 2003 in the Balearic Islands. University of Southern California, Los Angeles, CA, USA.
Chen Z., Qi W., Xu C. (2023). Scenario-based hazard assessment of local tsunami for coastal areas: A case study of Xiamen City, Fujian Province, China. J. Mar. Sci. Eng. 11, 1501. doi: 10.3390/jmse11081501
Di Bacco M., Rotello P., Suppasri A., Scorzini A. R. (2023). Leveraging data driven approaches for enhanced tsunami damage modelling: Insights from the 2011 Great East Japan event. Environ. Model. Software 160, 105604. doi: 10.1016/j.envsoft.2022.105604
Geist E. L., Parsons T. (2006). Probabilistic analysis of tsunami hazards. Nat. Hazards 37, 277–314. doi: 10.1007/s11069-005-4646-z
Grezio A., Babeyko A., Baptista M. A., Behrens J., Costa A., Davies G., et al. (2017). Probabilistic tsunami hazard analysis: Multiple sources and global applications. Rev. Geophys. 55, 1158–1198. doi: 10.1002/2017RG000579
Hayes G. P., Wald D. J., Johnson R. L. (2012). Slab1. 0: A three-dimensional model of global subduction zone geometries. J. Geophys. Res-Sol. Ea 117, B01302. doi: 10.1029/2011JB008524
Hou J., Gao Y., Fan T., Wang P., Wang Y., Wang J., et al. (2023a). Tsunami risk change analysis for Qidong County of China based on land use classification. J. Mar. Sci. Eng. 11, 379. doi: 10.3390/jmse11020379
Hou J. M., Lu W., Fan T. T., Wang P. T. (2022). Tsunami hazard and mitigation analysis for bathing beaches in China based on numerical simulations. Acta Oceanol. Sin. 41, 27–37. doi: 10.1007/s13131-022-2027-z
Hou J., Wang J., Wang P., Ren Z. (2023b). How to identify tsunami prevention zones: a case study of Putuoshan Island in China. Nat. Hazards 116, 133–150. doi: 10.1007/s11069-022-05667-3
Hui C., Ning L., Cheng C. (2022). Risk assessment of tsunamis along the Chinese coast due to earthquakes. Int. J. Disaster Risk Sci. 13, 275–290. doi: 10.1007/s13753-022-00407-4
Kaergaard K., Fredsoe J. (2013). A numerical shoreline model for shorelines with large curvature. Coast. Eng. 74, 19–32. doi: 10.1016/j.coastaleng.2012.11.011
Li L., Qiu Q., Li Z., Zhang P. (2022). Tsunami hazard assessment in the South China Sea: A review of recent progress and research gaps. Sci. China Earth Sci. 65, 783–809. doi: 10.1007/s11430-021-9893-8
Li L., Switzer A. D., Chan C. H., Wang Y., Weiss R., Qiu Q. (2016). How heterogeneous coseismic slip affects regional probabilistic tsunami hazard assessment: A case study in the South China Sea. J. Geophys. Res-Sol. Ea 121, 6250–6272. doi: 10.1002/2016JB013111
Li H. W., Wang Z. C., Yuan Y., Xu Z., Wang P., Shi J. (2019). Probabilistic tsunami hazard assessment in the Bohai Sea. Acta Oceanol. Sin. 41, 51–57. doi: 10.3969/j.issn.0253-4193.2019.01.006
Liu Y., Santos A., Wang S. M., Shi Y., Liu H., Yuen D. A. (2007). Tsunami hazards along Chinese coast from potential earthquakes in South China Sea. Phys. Earth Planetary Interiors 163, 233–244. doi: 10.1016/j.pepi.2007.02.012
Mahmood R., Akbarpour J., Ehsan R., Katsuichiro G. (2023). Improvement to stochastic tsunami hazard analysis of megathrust earthquakes for western Makran subduction zone. Appl. Ocean Res. 141, 103784. doi: 10.1016/j.apor.2023.103784
Masuda H., Sugawara D., Abe T., Goto K. (2022). To what extent tsunami source information can be extracted from tsunami deposits? Implications from the 2011 Tohoku-oki tsunami deposits and sediment transport simulations. Prog. Earth Planet Sci. 9, 65–84. doi: 10.1186/s40645-022-00527-x
Ministry of Natural Resources (2021). Technical Directives for Risk Assessment and Zoning of Marine Disaster—Part 1: Tsunami. HY/T 0273.3-2021 (Beijing).
Moon W. C., Sidek L. M., Lau T. L., Puay H. T., Majid T. A., Wahab A. K. A., et al. (2022). A shared vision on the 2004 Indian ocean tsunami in Malaysia: hazard assessments, post-disaster measures and research. J. Mar. Sci. Eng. 10, 1088. doi: 10.3390/jmse10081088
Okada Y. (1985). Surface deformation due to shear and tensile faults in a half-space. B. Seismol. Soc Am. 75, 1135–1154. doi: 10.1785/BSSA0750041135
Reese S., Bradley B. A., Bind J., Smart G., Power W., Sturman J. (2011). Empirical building fragilities from observed damage in the 2009 South Pacific tsunami. Earth-Sci. Rev. 107, 156–173. doi: 10.1016/j.earscirev.2011.01.009
Ren Z., Gao Y., Ji X., Hou J. (2022a). Deterministic tsunami hazard assessment and zoning approach using far-field and near-field sources: Study of Cixi County of Zhejiang Province, China. Ocean Eng. 247, 110487. doi: 10.1016/j.oceaneng.2021.110487
Ren Z., Liu H., Jimenez C., Wang Y. (2022b). Tsunami resonance and standing waves in the South China Sea. Ocean Eng. 262, 112323. doi: 10.1016/j.oceaneng.2022.112323
Ren Z., Wang B., Fan T., Liu H. (2013). Numerical analysis of impacts of 2011 Japan Tohoku tsunami on China coast. J. Hydrodyn. 25, 580–590. doi: 10.1016/S1001-6058(11)60399-6
Ren Y., Wen R., Zhang P., Yang Z., Pan R., Li X. (2017). Implications of local sources to probabilistic tsunami hazard analysis in south Chinese coastal area. J. Earthq. Tsunami 11, 1740001. doi: 10.1142/S1793431117400012
Salah P., Sasaki J., Soltanpour M. (2021). Comprehensive probabilistic tsunami hazard assessment in the Makran subduction zone. Pure Appl. Geophys. 178, 5085–5107. doi: 10.1007/s00024-021-02725-y
Sepúlveda I., Haase J. S., Carvajal M., Xu X., Liu P. L. (2020). Modeling the sources of the 2018 Palu, Indonesia, tsunami using videos from social media. J. Geophysical Research: Solid Earth 125, e2019JB018675. doi: 10.1029/2019JB018675
Smit A., Kijko A., Stein A. (2017). Probabilistic tsunami hazard assessment from incomplete and uncertain historical catalogues with application to Tsunamigenic regions in the Pacific Ocean. Pure Appl. Geophys. 174, 3065–3081. doi: 10.1007/s00024-017-1564-4
Tufekci-Enginar D., Suzen M. L., Yalciner A. C. (2021). The evaluation of public awareness and community preparedness parameter in GIS-based spatial tsunami human vulnerability assessment (MeTHuVA). Nat. Hazards 105, 2639–2658. doi: 10.1007/s11069-020-04416-8
Turchi A., Traglia D. F., Gentile R., Fornaciai A., Zetti I., Fanti R. (2022). Relative seismic and tsunami risk assessment for Stromboli Island (Italy). Int. J. Disast. Risk Re. 76, 103002. doi: 10.1016/j.ijdrr.2022.103002
Wang X., Liu P. L. (2005). A numerical investigation of Boumerdes-Zemmouri (Algeria) earthquake and tsunami. Comput. Modeling Eng. Sci. 10, 171. doi: 10.1016/j.chaos.2005.02.019
Warren I. R., Bach H. (1992). MIKE 21: A modelling system for estuaries, coastal waters and seas. Environ. Soft. 7, 229–240. doi: 10.1016/0266-9838(92)90006-P
Wu T. R. (2012). Deterministic study on the potential large tsunami hazard in Taiwan. J. Earthquake Tsunami 6, 1250034. doi: 10.1142/S1793431112500340
Yavuz C., Kentel E., Aral M. M. (2020). Tsunami risk assessment: Economic, environmental and social dimensions. Nat. Hazards 104, 1413–1442. doi: 10.1007/s11069-020-04226-y
Ye Q. (1995). The impact of the 7.3 magnitude earthquake in the Taiwan Strait on Xiamen. Int. Earthquake Dynamics 02), 26–30.
Yuan Y., Li H., Wei Y., Shi F., Wang Z., Hou J., et al. (2021). Probabilistic tsunami hazard assessment (PTHA) for southeast coast of Chinese mainland and Taiwan Island. J. Geophys. Res-Sol. Ea 126, e2020JB020344. doi: 10.1029/2020JB020344
Keywords: tsunami, high-resolution numerical simulation, risk assessment, Xiamen City, vulnerability assessment
Citation: Shi X, Dong D, Ye Z, Huang J, Ying C, Li X, Yan Y and Ding Y (2024) High-resolution numerical modelling reveals tsunami risk hotspots in Xiamen City, China. Front. Mar. Sci. 11:1478149. doi: 10.3389/fmars.2024.1478149
Received: 09 August 2024; Accepted: 23 September 2024;
Published: 10 October 2024.
Edited by:
Xingru Feng, Chinese Academy of Sciences (CAS), ChinaReviewed by:
Jingming Hou, National Marine Environmental Forecasting Center, ChinaJie Yin, East China Normal University, China
Copyright © 2024 Shi, Dong, Ye, Huang, Ying, Li, Yan and Ding. This is an open-access article distributed under the terms of the Creative Commons Attribution License (CC BY). The use, distribution or reproduction in other forums is permitted, provided the original author(s) and the copyright owner(s) are credited and that the original publication in this journal is cited, in accordance with accepted academic practice. No use, distribution or reproduction is permitted which does not comply with these terms.
*Correspondence: Zuchao Ye, eWVfenVjaGFvQDEyNi5jb20=; Yuhan Yan, eWFueXVoYW45Mzk2QDE2My5jb20=; Yiting Ding, ZGluZ3l0QGptdS5lZHUuY24=