 Ricardo Arruda
 Dariia Atamanchuk
 Claire Boteler2
 Douglas W. R. Wallace
- 1Department of Oceanography, Dalhousie University, Halifax, NS, Canada
- 2Department of Mathematics and Statistics, Dalhousie University, Halifax, NS, Canada
The Labrador Sea in the subpolar North Atlantic is known for its large air-to-sea CO2 fluxes, which can be around 40% higher than in other regions of intense ocean uptake like the Eastern Pacific and within the Northwest Atlantic. This region is also a hot-spot for storage of anthropogenic CO2. Deep water is formed here, so that dissolved gas uptake by the surface ocean directly connects to deeper waters, helping to determine how much atmospheric CO2 may be sequestered (or released) by the deep ocean. Currently, the Central Labrador Sea acts as a year-round sink of atmospheric CO2, with intensification of uptake driven by biological production in spring and lasting through summer and fall. Observational estimates of air-sea CO2 fluxes in the region rely upon very limited, scattered data with a distinct lack of wintertime observations. Here, we compile surface ocean observations of pCO2 from moorings and underway measurements, including previously unreported data, between 2000 and 2020, to create a baseline seasonal climatology for the Central Labrador Sea. This is used as a reference to compare against other observational-based and statistical estimates of regional surface pCO2 and air-sea fluxes from a collection of global products. The comparison reveals systematic differences in the representation of the seasonal cycle of pCO2 and uncertainties in the magnitude of air-sea CO2 fluxes. The analysis reveals the paramount importance of long-term, seasonally-resolved data coverage in this region in order to accurately quantify the size of the present ocean sink for atmospheric CO2 and its sensitivity to climate perturbations.
1 Introduction and objectives
The ocean is the main reservoir that regulates atmospheric CO2 concentrations at short to long time scales, (10 - 1000 years), due to the exchange of CO2 at the air-sea interface over the large area of the global ocean, and the enormous capacity for carbon storage in the water column (DeVries, 2022). Globally, it has been estimated that the oceans have absorbed between 30% to 50% of the CO2 emitted due to human activity since the onset of the industrial revolution (Sabine et al., 2004; Gruber et al., 2019), thus damping the effects of rising atmospheric CO2 concentrations on climate (Friedlingstein et al., 2022). However, ocean CO2 uptake estimates and seasonal variability of fluxes and carbon-state variables (pCO2, DIC and Total Alkalinity) differ from global biogeochemical models and observation-based data products, particularly at high latitudes (Hauck et al., 2023; Rodgers et al., 2023; Pérez et al., 2024).
The Labrador Sea is an important area of the ocean with one of the world’s highest rates of influx of atmospheric CO2, along with other high-latitude regions such as areas of the Arctic Ocean (e.g. Baffin Bay, Davis Strait, Chukchi Sea) (Bates and Mathis, 2009; Ahmed et al., 2019; Duke et al., 2023a) and Greenland Sea (Nakaoka et al., 2006; Olsen et al., 2008). Moreover, other regions exhibiting moderate to intense influx of atmospheric CO2 are present in highly dynamic coastal areas on continental shelves within middle to high latitudes (Laruelle et al., 2014; Landschützer et al., 2020).
Within the Central Labrador Sea, deep-reaching and highly variable mixing of the water column occurs annually through deep convection (Marshall and Schott, 1999; Curry and McCartney, 2001), with the mixed layer depth (MLD) extending as deep as 2000 meters during winter (Kieke and Yashayaev, 2015; Yashayaev and Loder, 2017). This convection contributes to the formation of a major water mass, the North Atlantic Deep Water (NADW), which enters into the Atlantic Meridional Overturning Circulation (Fu et al., 2020) and exports them, eventually, to other oceanic basins (Körtzinger et al., 2004; Zantopp et al., 2017; Koelling et al., 2022). The deep mixed layer in the Central Labrador Sea connects the atmosphere to intermediate and deep waters through a “trap-door” that opens briefly during the fall/winter deep convection events and is closed during the stratified spring/summer seasons (Atamanchuk et al., 2020). Overall, this region presents a year-round sink of atmospheric CO2, with intensification during summer and fall, and limited net exchange in winter (Körtzinger et al., 2008a; Atamanchuk et al., 2020).
The Central Labrador Sea has been shown to have a very high column inventory of anthropogenic carbon (Sabine et al., 2004; Khatiwala et al., 2013; DeVries, 2014; Gruber et al., 2019) and a storage rate that outpaces the global average and is variable in time (Terenzi et al., 2007), with an average rate of increase of around 1.8 mol m-2 year-1 for the last three decades (Raimondi et al., 2021; Steinfeldt et al., 2024). Therefore, this region may also expect rapid ocean acidification impacts on marine life in the deep ocean (Azetsu-Scott et al., 2010). On the other hand, the large fluxes combined with the sensitivity of deep mixing to high-latitude oceanic changes (shallowing of mixed layer depths/weakening of overturning circulation) may put at risk the ocean’s future ability to mitigate climate change by storing anthropogenic CO2.
Historically, when compared to adjacent more observed regions, the coverage of partial pressure of CO2 (pCO2) observations within the Central Labrador Sea has been insufficient to constrain the air-sea CO2 fluxes, given the region’s high variability (e.g. Friedrich and Oschlies, 2009a). The AR07W GO-SHIP repeat hydrography line has been a key source of data with discrete observations of carbon-system parameters, including pCO2, together with physical, chemical and biological variables, which have been collected annually since 1992 (Hall et al., 2013; Raimondi et al., 2019). However, there is a strong seasonal bias in the sampling along AR07W, with most of the data collected in spring/summer (mostly in May and June), and no data collected during winter months. There is also limited spatial resolution inherent in the ship-based discrete sampling along a single section.
Complementing the AR07W data, a few sporadic transits by research vessels equipped with underway pCO2 measurement systems have taken place between 2000 and 2020. However, these measurements were also taken almost exclusively in summer and fall. Some are included in the SOCAT database from 2021 (SOCATv2021, Bakker et al., 2016).
The seasonal variability of pCO2 in this region has, however, also been observed from four mooring deployments: in 2000/2001 (DeGrandpre et al., 2006), in 2004 (Martz et al., 2009), in 2004/2005 (Körtzinger et al., 2008a) and most recently with the SeaCycler deployment in 2016/2017 (Atamanchuk et al., 2020). The mooring data provide much needed, high-resolution temporal coverage encompassing multiple seasons but are not included in the SOCAT database (except the mooring from 2004 - Martz et al., 2009). Previously, it had been suggested, based on model analysis, that the addition of even a single long-term mooring could decrease the error of estimates of air-sea fluxes by about 20% for the region (Friedrich and Oschlies, 2009a), but the hypothesis has not been tested against actual measurements.
The combination of ocean surface pCO2 observations using underway measurements from Ships of Opportunity (SOOP), research vessels, autonomous surface vehicles (e.g. Waveglider, Saildrone, Sailbuoy) and from moorings will be key for further investigation of the spatio-temporal pCO2 variability and reducing uncertainties of the estimates of air-sea CO2 fluxes (Hauck et al., 2023). Mooring and buoy deployments are important for improving the temporal coverage (winter gap in observations), and underway measurements are crucial for improving spatial coverage. The combination of these different types of observations is particularly important in high-latitude regions such as the Central Labrador Sea, which is a highly dynamic region with poor data coverage.
A variety of statistical and mapping techniques have been developed for interpolation and extrapolation of pCO2 observations and air-sea CO2 fluxes estimates, including into regions that have limited or no data. These include statistical interpolation (Takahashi et al., 2002, 2009), multiple linear regression (MLR) with more extensively-measured variables (Schuster et al., 2013; Iida et al., 2015) and neural network approaches (Chen et al., 2019). The neural network reconstructions have been applied at regional (Xu et al., 2019; Wrobel-Niedzwiecka et al., 2022; Duke et al., 2024), basin (Friedrich and Oschlies, 2009a, b; Telszewski et al., 2009; Landschützer et al., 2013), and global scales (Zeng et al., 2014; Landschützer et al., 2016; Laruelle et al., 2017; Denvil-Sommer et al., 2019; Roobaert et al., 2024).
Even though a wide range of gap-filling techniques have been applied, these remain observation-based approaches and therefore, ultimately, the accuracy and uncertainties of all these techniques rely on data coverage (Rödenbeck et al., 2015; Gloege et al., 2021). Results from some of these approaches will be used here as a comparison with our new observation-based climatology. Although there are shortcomings when comparing studies with different resolutions and different time-spans, such comparisons can be useful to identify systematic errors and specific locations in global and basin-scale estimates that could benefit from additional targeted observations.
These comparison studies can also help guide future development of long-term observation strategies (such as initiatives for new mooring deployments or Ship of Opportunity (SOOP) lines). Also, for data-poor regions such as the Central Labrador Sea, a relatively small addition of observations has potential to improve or validate the estimates from gap-filling methods considerably, both regionally and even possibly for basin-scale estimate of fluxes (Friedrich and Oschlies, 2009a).
Here we have compiled pCO2 observations, including previously unavailable data sets, from the Central Labrador Sea. Given that data availability in any particular year was low, we combined and adjusted all available pCO2 data collected over two decades to the single year 2020, which was the most recent year with available data (see Methods). The combined observations are used to create a climatology of pCO2 and air-sea CO2 fluxes, which is then used as a reference for regional comparisons and validations against several global products that used gap-filling techniques and extrapolation. Taking into account the discrepancies arising from these comparisons and the data coverage problems in this important region for CO2 uptake and storage, we make recommendations for future monitoring and research.
2 Methods
We define the seasonality of surface pCO2 in the Central Labrador Sea, making use of the unusually rich mooring-based data set from this region in combination with underway observations available from the SOCATv2021 database (Bakker et al., 2016). We also highlight and include some observations not available in SOCATv2021 (named here as “non-SOCAT”). These include four crossings of the Central Labrador Sea between the years 2000-2020 by the research vessels CCGS Amundsen (General Oceanics pCO2 system) and CCGS Hudson (Pro-Oceanus Systems’ - membrane-based). From the SOCATv2021 database only two crossings are available over this 21 year time-period, and the newer versions of SOCAT (v2022 and v2023) did not add any new observations in the Central Labrador Sea for the time span of this study. This reiterates the general lack of data availability for this region. Of the four mooring deployments, data from only one is currently included in SOCATv2021 (from Martz et al., 2009).
The data coverage around the Central Labrador Sea is also illustrated here (Figure 1), showing the addition of the “non-SOCAT” observations (between 2017 and 2020; CCGS Amundsen and CCGS Hudson cruises and observations within the Atlantic continental shelves). We have quality-controlled all of these additional observations and some are submitted to the SOCAT database. By adding these preliminary “non-SOCAT” data we can anticipate how the data coverage will improve in the next versions of SOCAT, and more importantly, highlighting where and when observations are needed within the Labrador Sea.
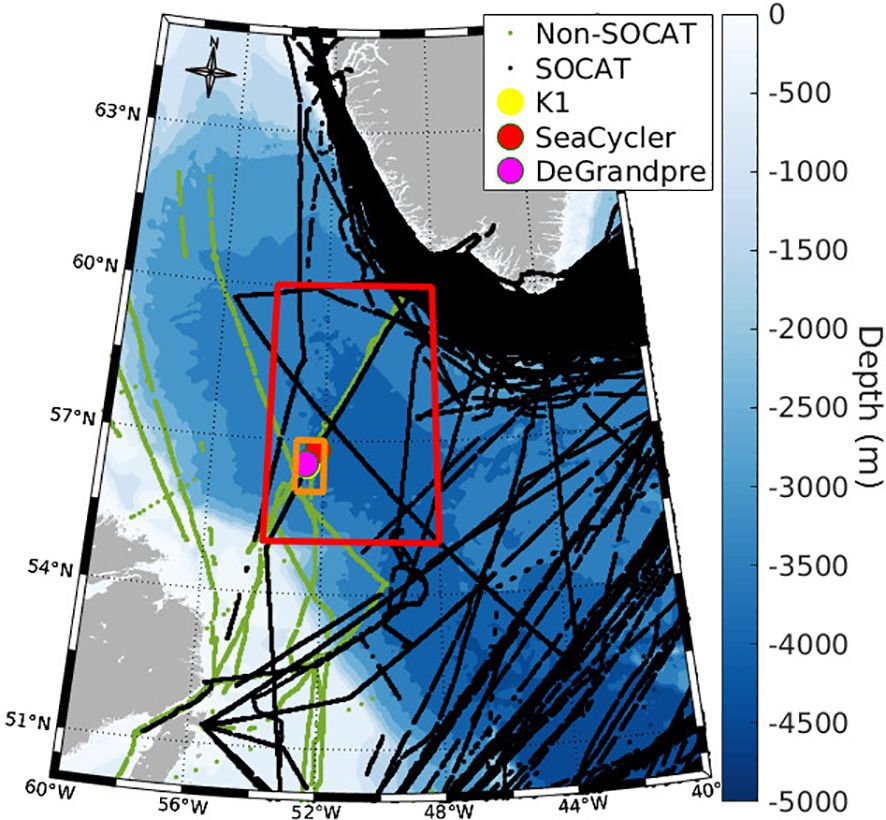
Figure 1. Location of area of interest in the Central Labrador Sea (orange box), showing the mooring locations (circles) and the underway data from SOCATv2021 (black) and the “non-SOCAT” (green) available for the region between 2000 and 2020. The red box shows the 4°x5° grid cell of the Takahashi climatologies.
2.1 Study area
Our study focuses on a limited region of the Central Labrador Sea, spanning from 55.5°N to 57.5°N and from 51.5°W to 53.5°W (orange box, Figure 1). The specific area selected was based on mapping of past deep convection events (Marshall and Schott, 1999), which has led to deployments of several moorings in this location, and is believed to be representative of a significant area of the deeper mixing within the Central Labrador Sea. However, the deep convection activity in the Central Labrador is also known to be dynamic, and there is inter-annual variability of the area of deep water formation (Rühs et al., 2021). The red box in Figure 1 shows, for comparison, the resolution of early global-based pCO2 products produced by Takahashi et al., 2002 and Takahashi et al., 2009 (4°x5° grid). In contrast, a smaller grid cell (2°x2°) was chosen for analysis in this study to exclude data-points collected over the continental shelves and slopes that surround the Central Labrador Sea.
The “non-SOCAT” underway measurements presented and utilized here (see Figure 1) are from the Atlantic Zone Off-Shore Monitoring Program (AZOMP) and Atlantic Zone Monitoring Program (AZMP) of Canada’s Department of Fisheries and Oceans (DFO), with both programs taking place on-board CCGS Hudson, between 2016 and 2019 (CCGS Hudson data submitted to SOCAT versions 2023 and 2024). Further, underway measurements collected from the CCGS Amundsen are also included in this study, with data from 2017 to 2020 (pending submission to SOCAT). Finally, observations over the Atlantic continental shelves (data: Cyr et al., 2022; Gibb et al., 2023) are also included in Figure 1 (Labrador Shelf area) to show possible opportunities for future expansion of the Canadian pCO2 observation network. All of these “non-SOCAT” data were quality controlled and are either submitted or pending submission to newer versions of the SOCAT database (Supplementary Table 4 in Supplementary Materials). In the meantime they can be requested from the authors listed in the data availability section of this manuscript.
Within the grid cell chosen in this study (approximately 50,000 km2, orange box, Figure 1), the “non-SOCAT” underway data includes three crossings (13 days of observations), from the years 2015, 2016 and 2018. In comparison, the SOCATv2021 dataset includes only two crossings of the area (four days of observations), from 2008 and 2016.
It is important to point out the importance of the mooring datasets presented here (details in Table 1) that made this study possible due to the temporal/seasonal coverage that they provide in comparison to ship-based studies. When ship-based underway-observations are so sporadic and limited, observations from mooring deployments become essential. The discussion in the remainder of this paper focuses on the data collected within the 2°x2° orange box in the Central Labrador Sea (Figure 1).
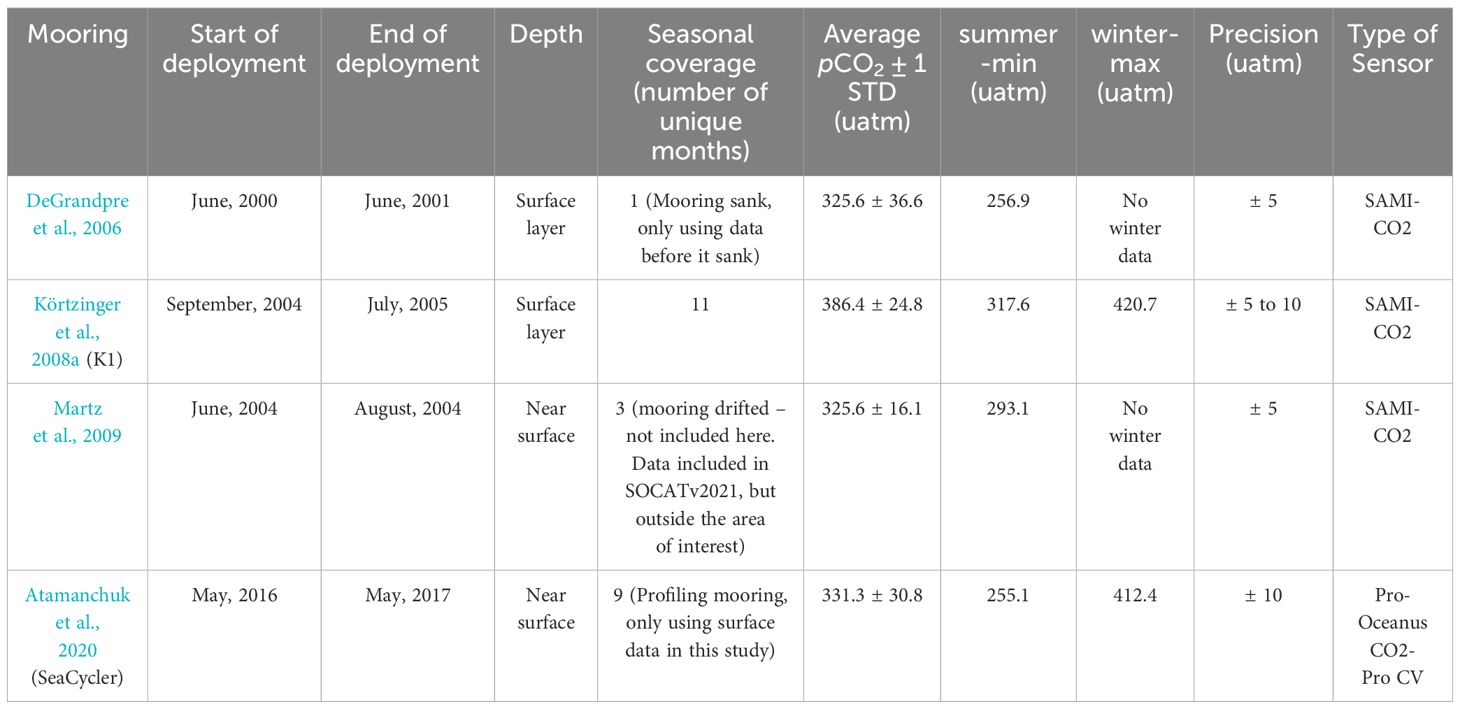
Table 1. Details of mooring deployments in the Central Labrador Sea.
2.2 pCO2 data sources and flux calculations
The global pCO2 products compared here are the climatologies of Takahashi et al. (2002); Takahashi et al. (2009) and Fay et al. (2023) (discussed in Fay et al., 2024); these climatologies are referred to here as T2002, T2009 and T2023, respectively. The T2023 climatology is provided as ΔfCO2, we therefore recalculated fCO2 by adding the atmospheric fCO2 (for reference year 2010 as in Fay et al., 2024), and converted to pCO2 using surface temperature (Weiss, 1974) for the reference year 2010 (Multi Observation Global Ocean ARMOR3D L4 – Copernicus - Guinehut et al., 2012).
We also compare six other observation-based products from the harmonization of pCO2 products provided by Gregor and Fay (2021) and discussed in Fay et al. (2021), which includes multiple linear regression models (MLR), machine learning ensemble (ML6), mixed layer scheme (MLS) and three neural network-based models (references and details of each product are given in Table 2). All these products used SOCAT observations for reconstruction of pCO2 on a model grid.
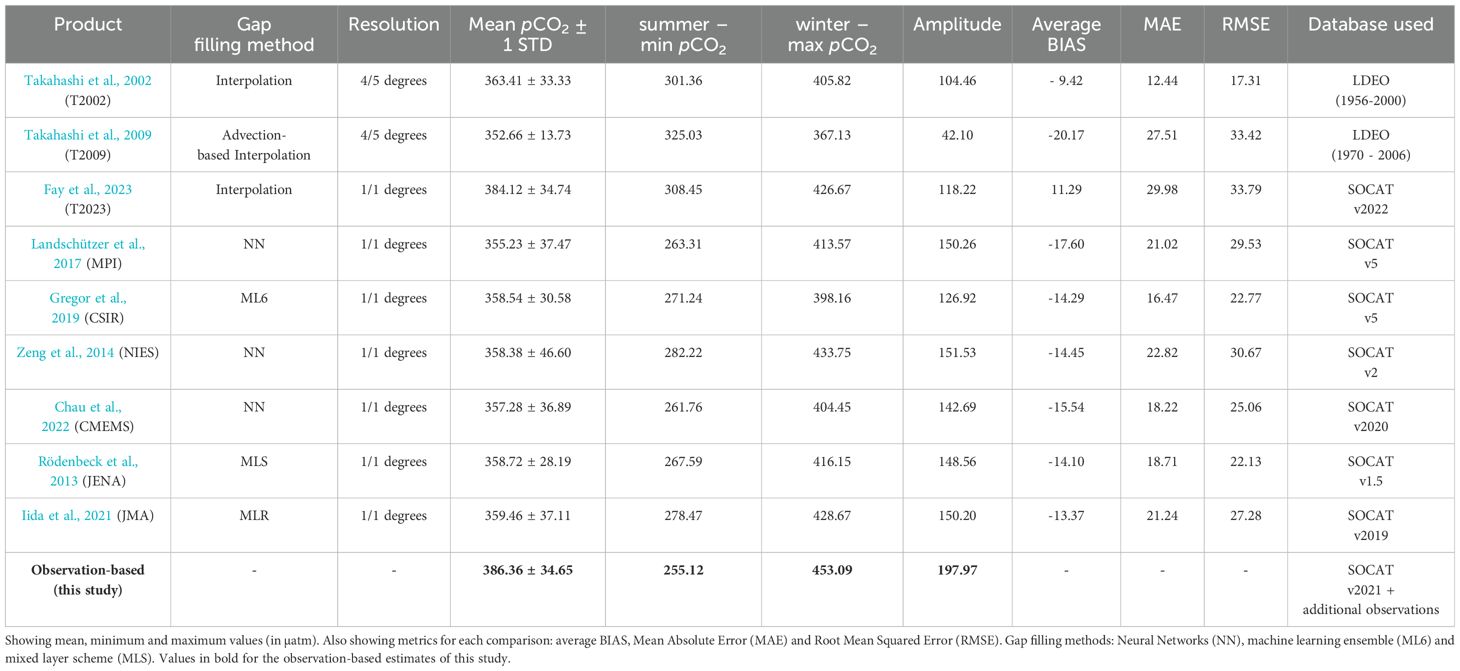
Table 2. Details of the products used to compare the seasonality of pCO2 in the Central Labrador Sea.
We calculated a regional pCO2 climatology directly from pCO2 observations and compared it with the climatologies calculated from the pCO2 global products. We also used the pCO2 observations and pCO2 from each of the global products to calculate air-sea CO2 fluxes, and consequently the climatologies of the fluxes.
The air-sea CO2 fluxes (FCO2(air-sea)) were calculated using the following equation (Equation 1):
where kCO2 is the transfer velocity according to Wanninkhof (1992), K0 is the solubility constant following Weiss (1974), with pCO2(air) and pCO2(sea) as the atmospheric and ocean surface pCO2. From here on we will use ΔpCO2 = pCO2(air) – pCO2(sea). The air-sea flux is dependent on the transfer velocity (kCO2), which is strongly dependent on wind speed. Since we are dealing with a data-poor region, we fixed the choice of wind product and wind parameterization in order to focus on the effect of pCO2 data-coverage. Specifically, we used wind speed estimates from the reanalysis product ERA5 (Hersbach et al., 2020), which has been widely used in global products, including those compared here, due to its high spatio-temporal resolution for the flux calculation (see also Atamanchuk et al., 2020).
We calculated the monthly uncertainty of air-sea CO2 fluxes (∂FCO2) by propagating the monthly errors of wind (∂U) and ΔpCO2 (∂ΔpCO2), which we believe to be the largest sources of uncertainties for this climatological approach, using the following equation (Equation 2):
2.3 Monthly climatology
The monthly climatology, i.e. the seasonality of sea-surface pCO2, was calculated as a monthly average and monthly standard deviation to create our climatological reference for the Central Labrador Sea using pCO2 observations from 2000 to 2020. The climatology was calculated with the pCO2 and fluxes data compiled for this study and for each of the global products of monthly time series. We then analyze how well the global products compare with the directly observed seasonal variability of pCO2 and air-sea CO2 fluxes in the Central Labrador Sea.
To compile pCO2 observations collected over 21 years for a climatological monthly averaging approach, it is necessary to correct for the increase in atmospheric (and surface ocean) pCO2 over time. For that, we used the Icelandic atmospheric time series between 1992 and 2020 (Dlugokencky et al., 2021), as well as observations from Sable Island between 1993 and 2019 (Worthy, 2023). For the Iceland station, an increase of 2.16 µatm/year was found, and for the Sable Island station there was an increase of 2.08 µatm/year. Both time series showed a similar rate of increase, with the slopes of the two linear least squares regression being statistically indistinguishable (p-value>0.05). This rate of atmospheric increase used here is consistent with the 2.2 µatm/year rate reported in Raimondi et al., 2021, for the period 1996-2016 in the same region. Therefore, for simplicity, we used 2.1 µatm/year for adjusting surface water pCO2 to the common reference year of 2020.
3 Results and discussion
3.1 Seasonality of observed pCO2
Figure 1 shows that there are large data gaps throughout most of the Labrador Sea domain, especially in the Central, Northern, and Labrador Shelf regions. We decided to show all observations in and around the study area (even though they are not all used in our analysis) to emphasize the major observational gap that exists in this region, despite the region’s potential significance for exchange of gases and carbon between the atmosphere and the deep ocean. Even with the addition of the “non-SOCAT” data presented here, we are still far from having anything close to representative observational coverage for the Northwestern Atlantic Ocean, including the Labrador Sea (Central and Northern) and Canadian shelves (see Duke et al., 2023b).
The pCO2 data from the Central Labrador Sea moorings (Figure 1; Table 1) show a strong seasonal cycle (Figure 2), with relatively high, near-equilibrium pCO2 in winter (JFM) weakening the uptake of atmospheric CO2, and low pCO2 values in spring (AMJ) and summer (JAS), increasing the difference with the atmospheric pCO2 and thus driving a strong CO2 sink. The timing of the decline in pCO2 in mid-spring (referred to here as the “spring-decline”) varies from year to year, and a second less pronounced drop in pCO2 may occur in the fall (OND) as well. This overall seasonality is driven partly by biological activity, including a strong decrease of pCO2 coinciding with the start of the spring bloom, and partly by abiotic controls (i.e. changes in temperature and vertical mixing) as pCO2 increases steadily after summer until the end of winter. As the wintertime cooling sets in, increased solubility would drive CO2 fluxes into the ocean, however, the deepening of the mixed layer carrying a high pCO2 signal from respiration are mixed into the surface layer, thus driving CO2 fluxes out of the ocean (outgassing) (Körtzinger et al., 2008a; Martz et al., 2009). This will lead to a maximum winter-time pCO2 as observed in other high latitude regions (Iida et al., 2015).
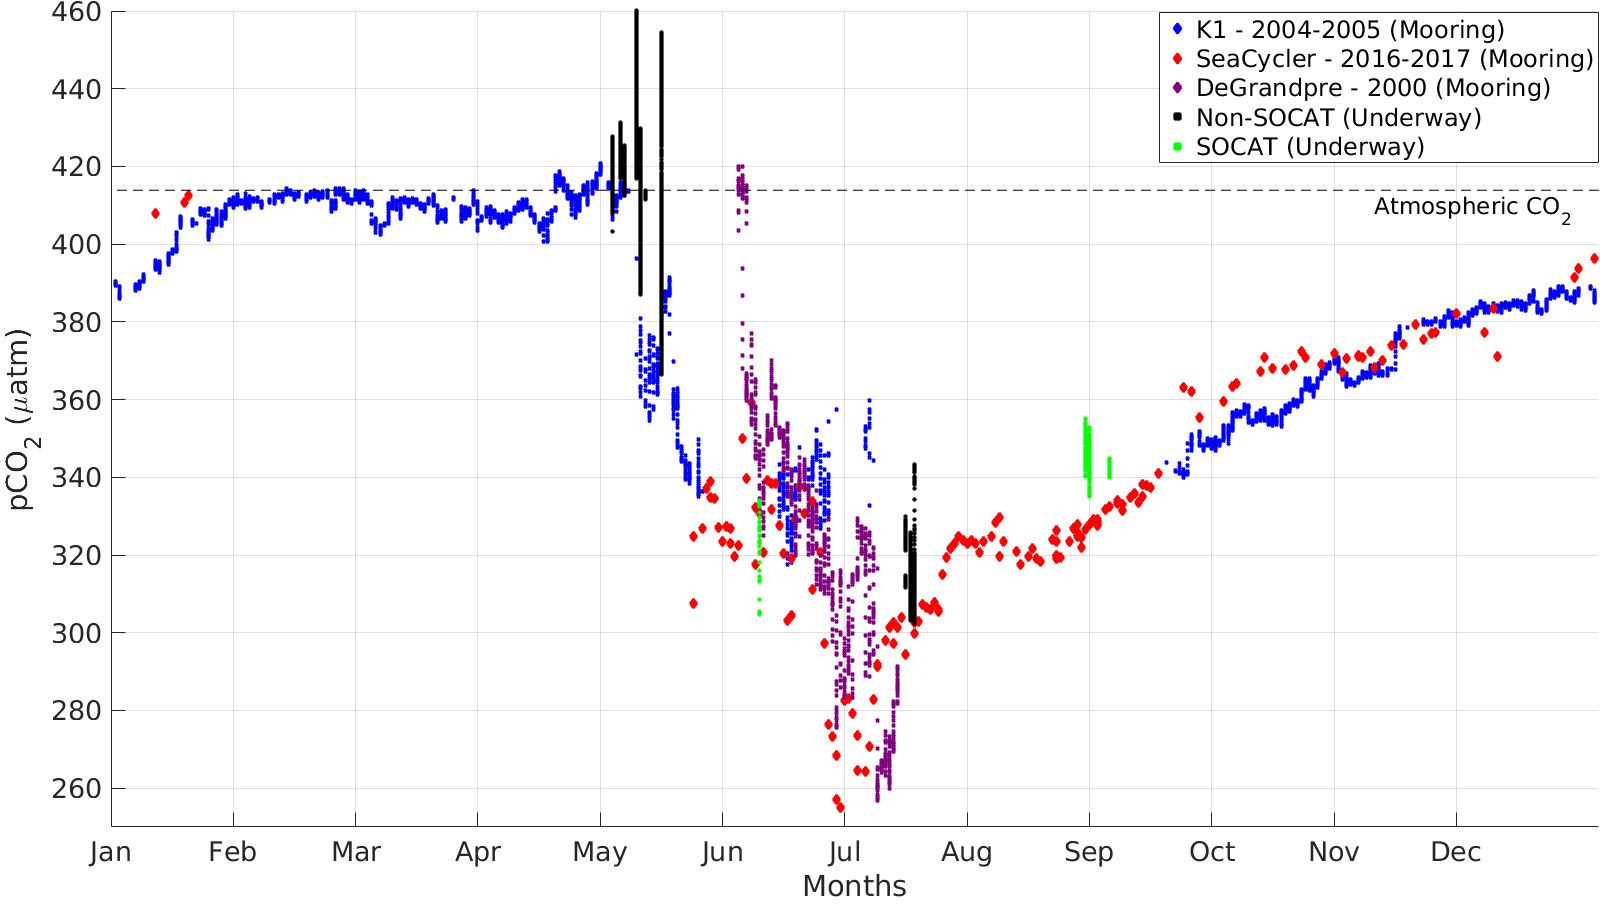
Figure 2. Daily averages of all pCO2 observations from the 3 moorings, and from underway measurements (both SOCAT and “Non-SOCAT”). All values are corrected to the year 2020 (adjusted for an atmospheric increase of 2.1 µatm/year). Located within the orange box in Figure 1. Horizontal dotted line showing average atmospheric pCO2 for 2020 (Copernicus Atmosphere Monitoring Service – CAMS).
The variability of our pCO2 climatology increases after including the underway observations with the mooring data in the analysis, however the overall seasonality remains consistent and well represented (Figure 2), with the expected high pCO2 in winter (409 ± 7 µatm), followed by a steep decline through spring until mid-summer, when it reaches the minimum in July (down to 250 µatm). After averaging all available data, both from moorings and underway systems, we can confirm that over the entire seasonal cycle the region acts as a year-around sink for atmospheric pCO2 (i.e. pCO2(sea) < pCO2(air)). There are only a few days when ocean surface pCO2 may exceed atmospheric pCO2, and this may happen right before the “spring-decline”, when observations show increased variability (during May and June).
As seen in Figure 2, even after the inclusion of the underway observations, the majority of the observations discussed here come from the three mooring deployments, showing their major importance for this otherwise under-sampled region. Using the monthly average of the pCO2 observations shown in Figure 2, we produced an estimate for the seasonal climatology for the Central Labrador Sea, which is used as the reference “observation-based” climatology.
3.2 Comparison of pCO2 observations against global products
When comparing pCO2 seasonal climatologies from the different global products (Figures 3, 4), they also characterize the Central Labrador Sea as a region of atmospheric CO2 uptake (sink). Most products follow the overall pattern seen in the observations (Figure 2). However, the timing and amplitude of the seasonal cycle of pCO2 is not consistent between the products and the observational data. For example, most products indicate an earlier “spring-decline” of pCO2 compared to the observation-based estimate (March/April vs May, Figure 2). There is also a shift of timing of the summer minimum (earlier summer minimum, except in Takahashi et al. (2009), that shows a minimum in August). Most of the products underestimate pCO2 in winter, spring and summer when compared to the observation-based estimate (black line), with a bias (product - observations) over time ranging from -80 to +40 µatm (Figure 4). To a lesser degree, there is also an overestimation of pCO2 by most products in late-summer and fall. The products MPI, JENA, NIES and JMA showed the highest seasonal amplitudes (winter maximum – summer minimum) of around 150 µatm, the observation-based estimate however showed an even higher amplitude of almost 200 µatm.

Figure 3. Comparison of climatologies of Takahashi 2002 (T2002), Takahashi 2009 (T2009), Fay et al., 2023 (T2023) and 6 observational-based global products discussed in Fay et al. (2021), with original references presented in Table 2. Comparison for the Central Labrador Sea - located within the orange box in Figure 1 (except for T2002 and T2009 – within red box). Solid lines are the monthly climatologies, shaded areas showing ± 1 standard deviation. Black line shows the observation-based product (this study). All data have been corrected to the year 2020. The horizontal dotted line shows the average atmospheric pCO2 for 2020 (Copernicus Atmosphere Monitoring Service - CAMS).
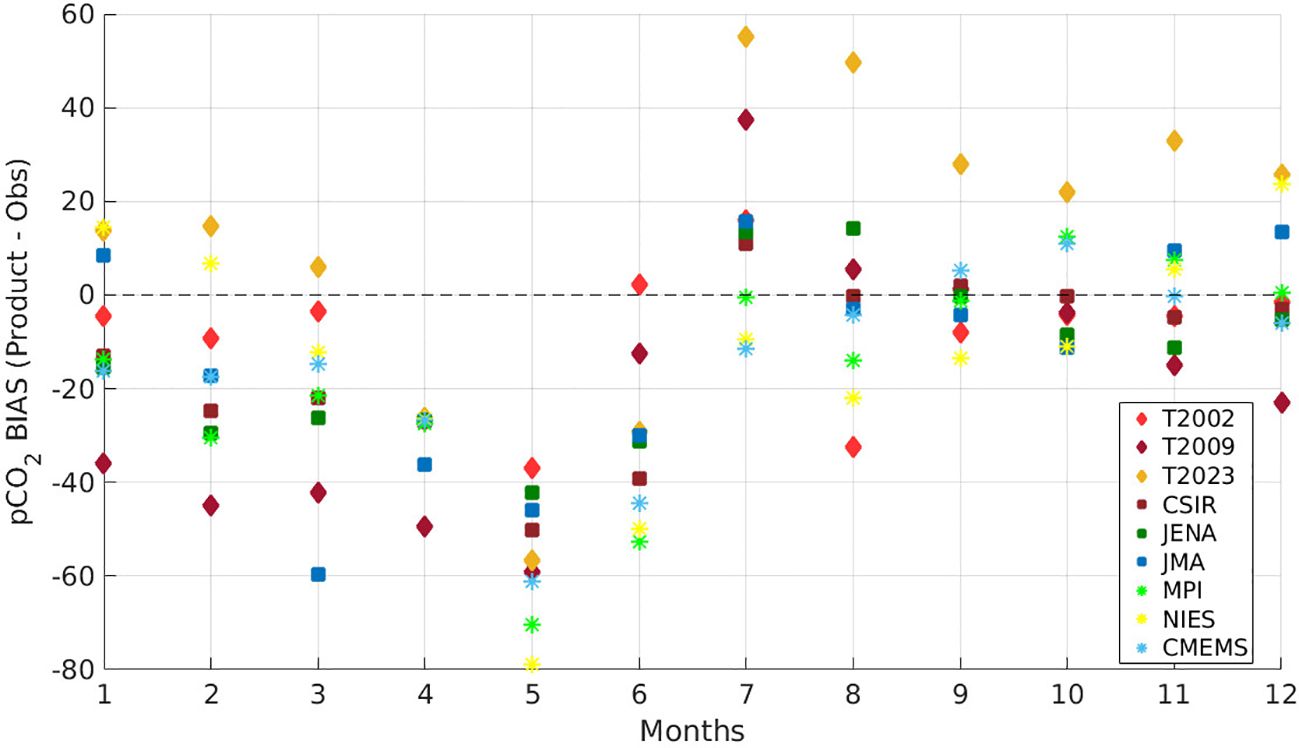
Figure 4. Bias over time of pCO2 (Product – Observation) for the 9 global products and the observation-based climatology compared in this study (in µatm). Diamonds are the climatologies from Takahashi, squares are products that used multiple linear regressions, and ✳ are neural network-based products.
We note an especially strong difference between the two early Takahashi climatologies (Takahashi et al., 2002, 2009), with the seasonality from Takahashi et al. (2009) being the least consistent with observations and with the other global products. These differences may be due to the different extrapolation techniques combined with the fast increase in observations of pCO2, with the new observations being mostly on the border of the 4°x5° grid (see Figure 1, red box) around the Greenland shelf and slope by the Nuka Arctica underway system (Olsen et al., 2008), therefore potentially skewing the expected seasonality of the Central Labrador Sea for this climatology.
We keep these earlier Takahashi climatologies in the discussion since they have been used as benchmarks for comparisons in earlier studies (e.g. Lüger et al., 2004; Körtzinger et al., 2008b; Landschützer et al., 2014; Lauderdale et al., 2016). The new Takahashi climatology (T2023 - Fay et al., 2023) shows a better seasonal cycle (based on SOCATv2022 with more observations available), agreeing with the other products, although showing an early increase in pCO2 in the summer, and an overestimation of pCO2 from summer through fall. Other more recent gap-filling methods discussed in the study may, however, be more appropriate for this regional scale analysis due to their finer resolution, although they also have their strengths and weaknesses based on statistical metrics.
Of the pCO2 products with a 1°x1° degree resolution, the CSIR product (Gregor et al., 2019) has the lowest mean absolute error (MAE) and root mean square error (RMSE) related to the observation-based climatology of this study (MAE=16.5 µatm; RMSE=30.7 µatm). This is influenced by its summer-fall values being almost equal to our observation-based product (MAE=3.56 µatm). The CSIR winter-spring values are underestimated compared to the observations, however their bias is on the low-end compared to the other products. The annual average bias was slightly more negative for CSIR (-14.3 µatm) than JMA (-13.4 µatm) (Iida et al., 2021), however further examination of the monthly bias (Figure 4) shows multiple months with positive bias in the fall that will cancel out some of the negative bias in the winter. The higher spread of bias values for the JMA product is reflected in its higher MAE and RMSE (MAE=21.2 µatm; RMSE=27.3 µatm). Recent products with finer resolution (0.25°x0.25°,e.g. Chau et al., 2024; Gregor et al., 2024) could lead to improvements in the results for this region.
Although the data products discussed here are all intended as global-scale products, these should be tested to assess their skill in different basins or even at regional levels, such as in this study. Rödenbeck et al. (2015), for example, recommended checks on the consistency between such products and the use of multiple products in such comparisons.
3.3 Air-sea CO2 flux comparison
Figure 5 shows the seasonal variability of the calculated air-sea CO2 fluxes and the comparison of these observation-based estimates with the same global products discussed above. Similar to pCO2, the majority of estimates of air-sea CO2 fluxes from the global products indicate a pattern of overestimation from winter to spring and underestimation from summer to fall when compared to the observation-based estimate in this study. The monthly average bias (product - observations) for each global product is shown in Figure 6, ranging from -0.42 to +0.5 molC m-2month-1, with most products showing stronger fluxes than the observations in the first half of the year (winter: -0.42 to +0.38 molC m-2month-1; spring: -0.35 to +0.16 molC m-2month-1), and weaker fluxes in the second half of the year (summer: +0.12 to +0.28 molC m-2month-1; fall: -0.09 to +0.52 molC m-2month-1).
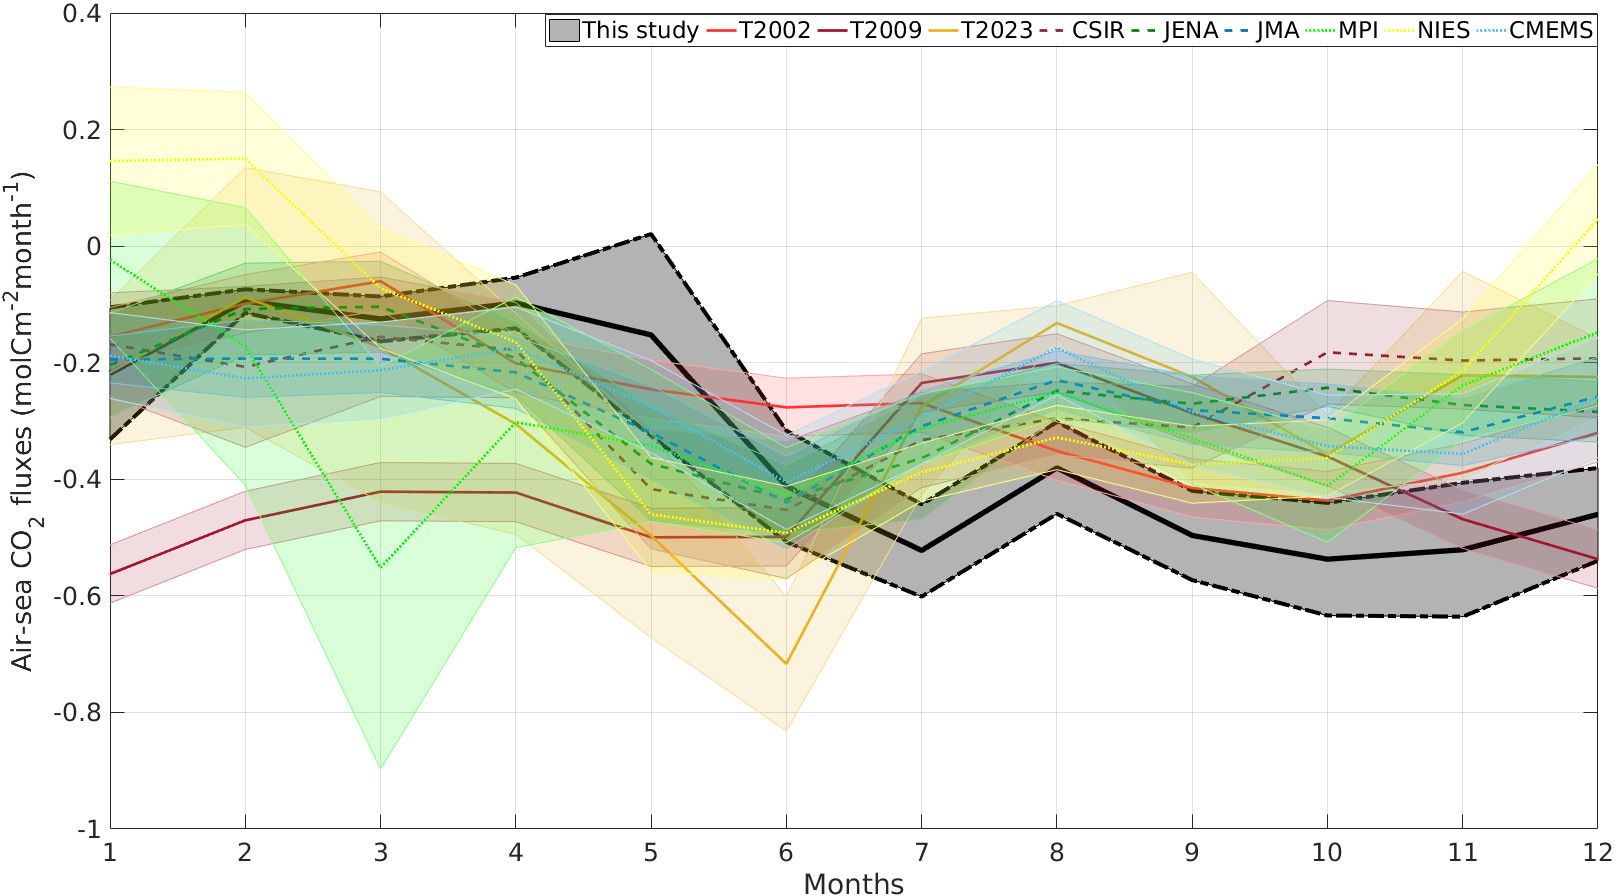
Figure 5. Comparison of climatologies of air-sea CO2 fluxes. Solid lines are the monthly climatologies, shaded areas showing ± 1 standard deviation. Dashed black-lines are showing upper and lower limits of fluxes calculated by uncertainty propagation of pCO2 and wind.
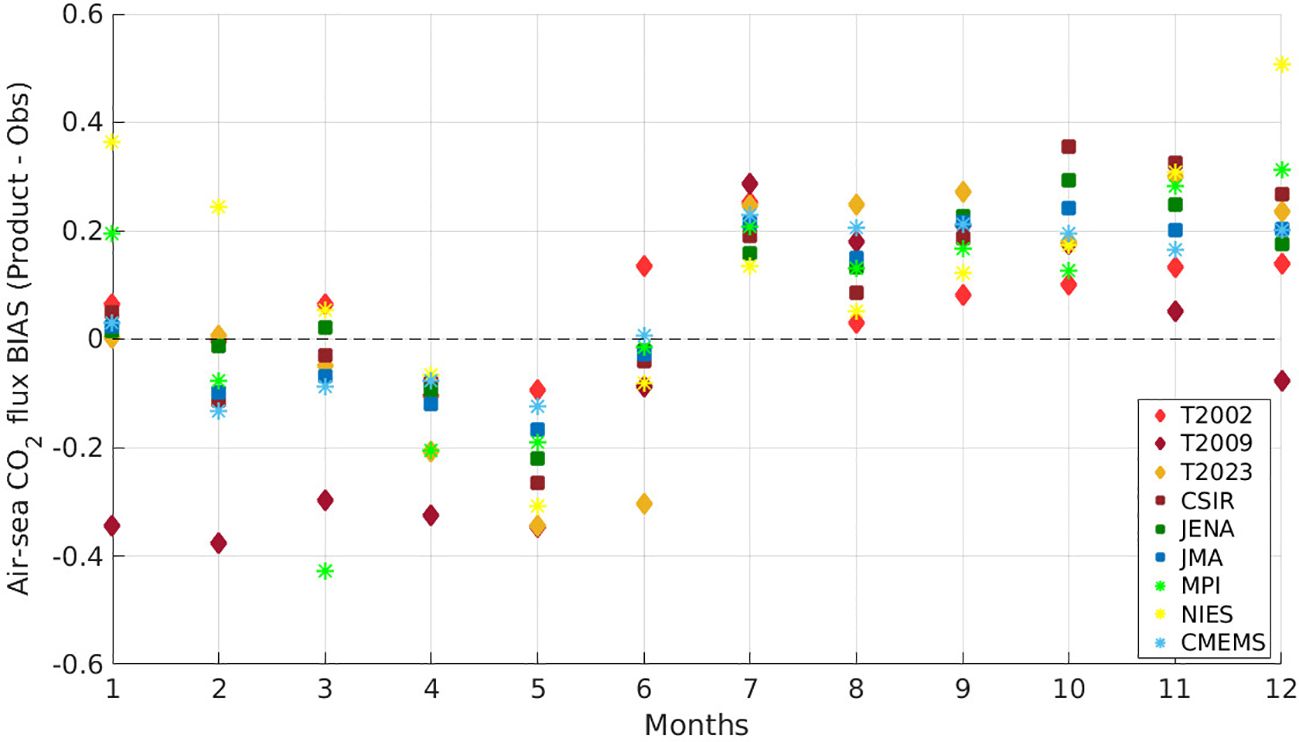
Figure 6. Bias over time of air-sea CO2 fluxes (Product – Observation) for the 9 global products and the observation-based climatology compared in this study (in molC m-2month-1). Diamonds are the climatologies from Takahashi, squares are products that used multiple linear regressions, and ✳ are neural network-based.
Bias values are negative (stronger fluxes than observation-based estimate) for winter-spring and positive (weaker fluxes than observation-based estimate) for summer-fall. The seasonal positive and negative biases tend to cancel out, thus leading many products to have an annual average bias that is low. Hence the mean absolute error (MAE) and RMSE metrics (see Table 3) are more appropriate for discussion here. Of the 1°x1° degree products, CMEMS, JENA and JMA show the lowest MAE and RMSE. The climatology from Takahashi et al., 2002 also shows good metrics when compared to the observations, which does not hold for the newer version of Takahashi et al., 2009 (T2009), as shown in Figures 6, 7. Notably, T2009 stands out from the other products in showing a strong overestimation of fluxes during winter. The climatology from Fay et al., 2023 (T2023) shows a slight improvement in the metrics when compared to T2009 (T2023 includes additional observations from SOCATv2022). Overall, the JMA product has the lowest bias, however the MAE and RSME metrics in both pCO2 and flux suggest the CMEMS, JENA and JMA as the best options when compared to the reference observation-based climatology.
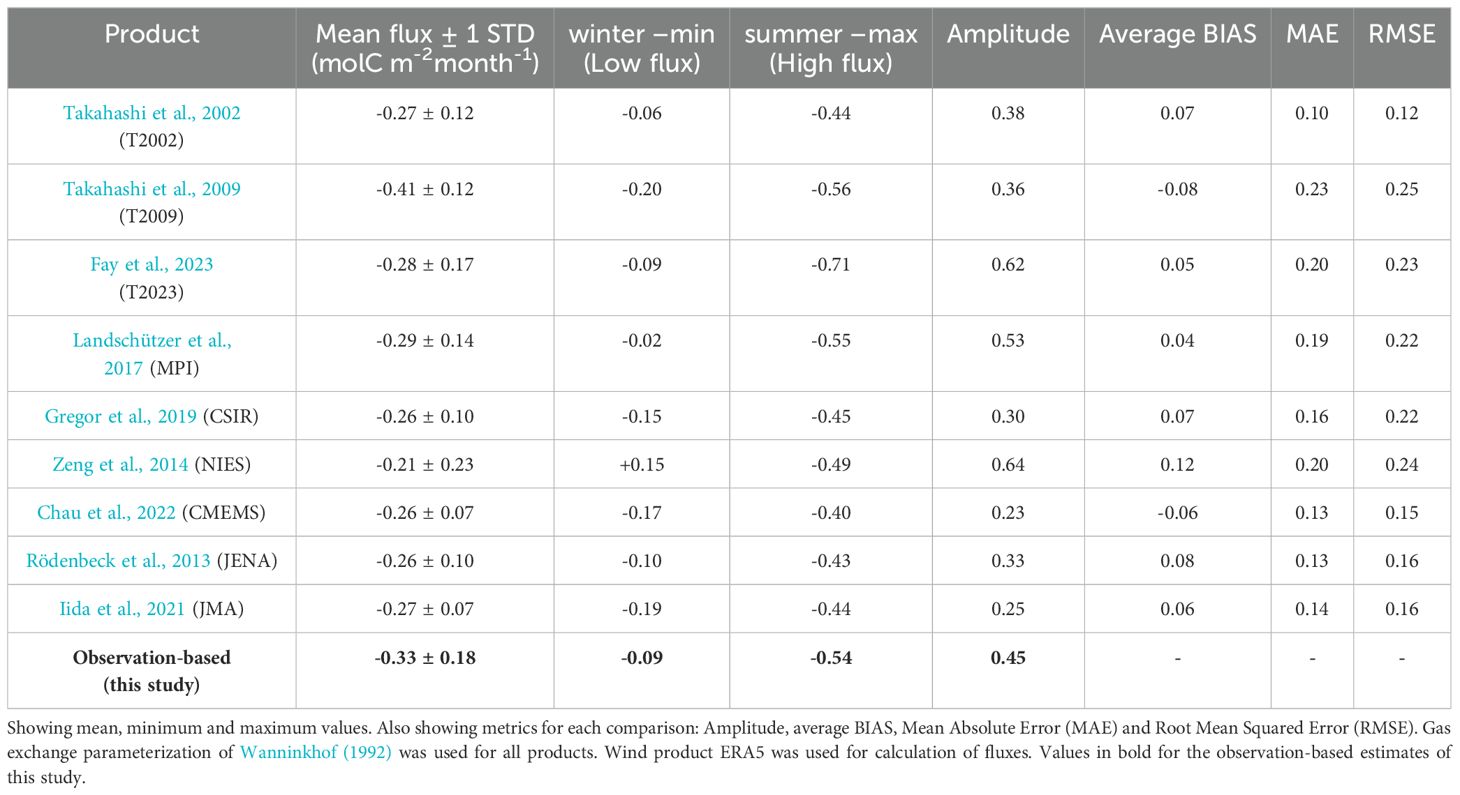
Table 3. Comparison of air-sea CO2 fluxes in the Central Labrador Sea.
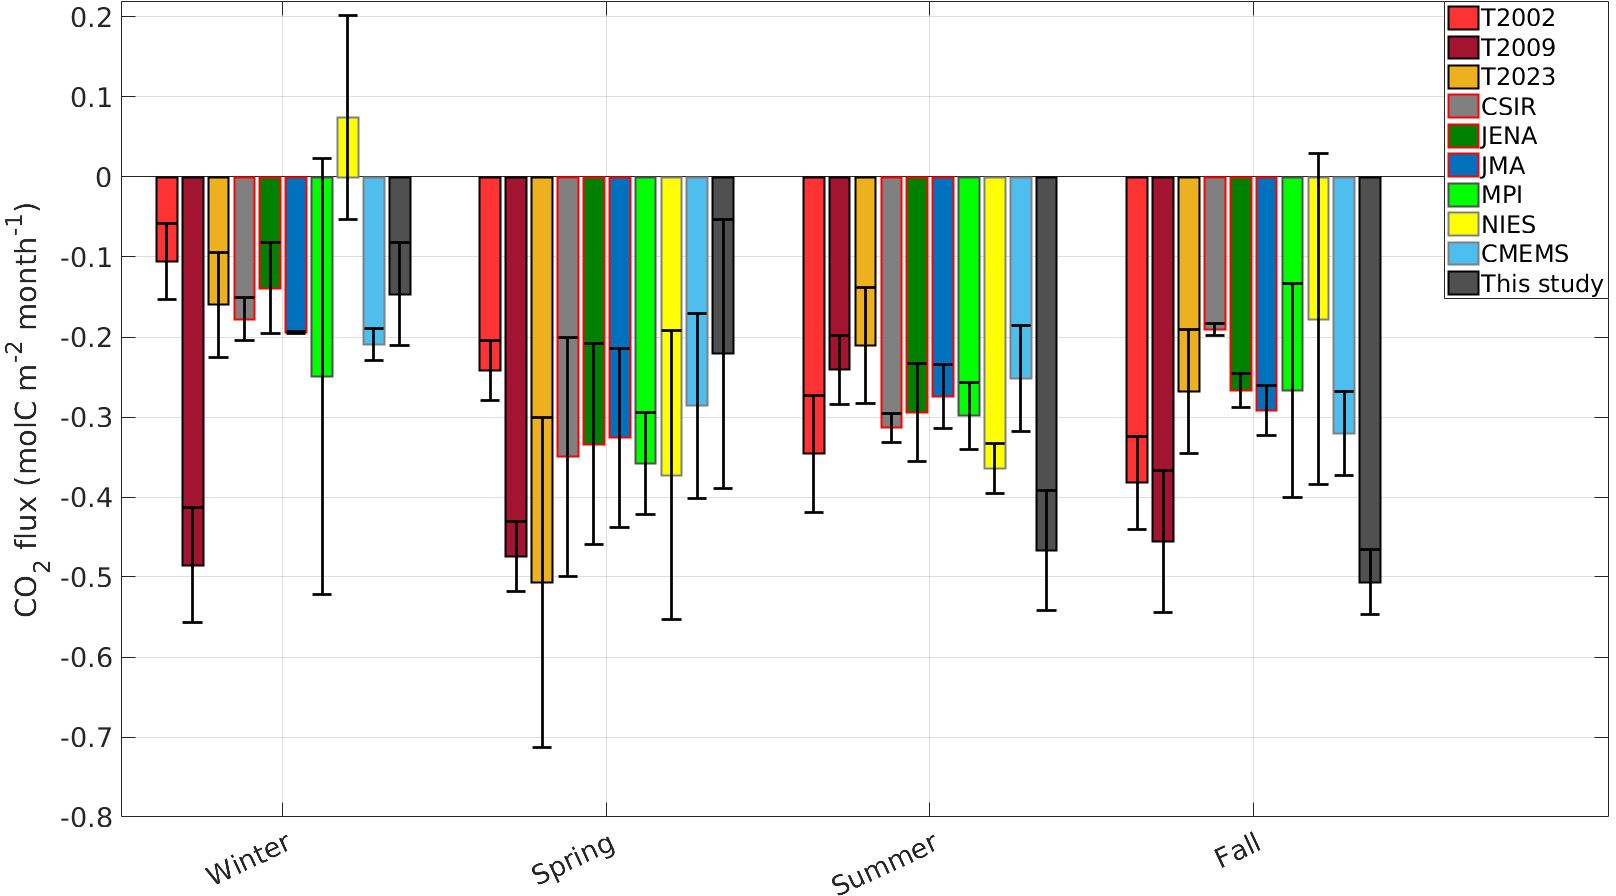
Figure 7. Seasonal average of air-sea CO2 fluxes (error bars showing ± 1 standard deviation) for the 9 global products and the observation-based estimate from this study.
When averaged seasonally, summer and fall are the seasons with the highest fluxes based on observations, and are also the seasons with larger inconsistencies between the global products and observation-based estimate (Figure 7; Table 3). In the fall, only the T2009 product corresponds closely to the observations (with overlapping error-bars) and in summer, only T2002 and NIES. The NIES product is the only product that classifies the Central Labrador Sea as a source of CO2 to the atmosphere during winter and shows small positive values (close to equilibrium or a weak source) within the seasonal variability during the fall. The MPI product overall classifies the winter as a sink, but its large uncertainty does not preclude that some winters may have out-gassing periods. T2023 and NIES are the products with higher amplitudes of 0.62 and 0.64 molC m-2month-1, respectively. Annually, all products show consistent representation of an ocean sink, with the observation-based estimate being -4.0 ± 2.2 molC m-2year-1, and most products showing a slight underestimation of the flux when compared to our observation-based estimate (Figure 8).
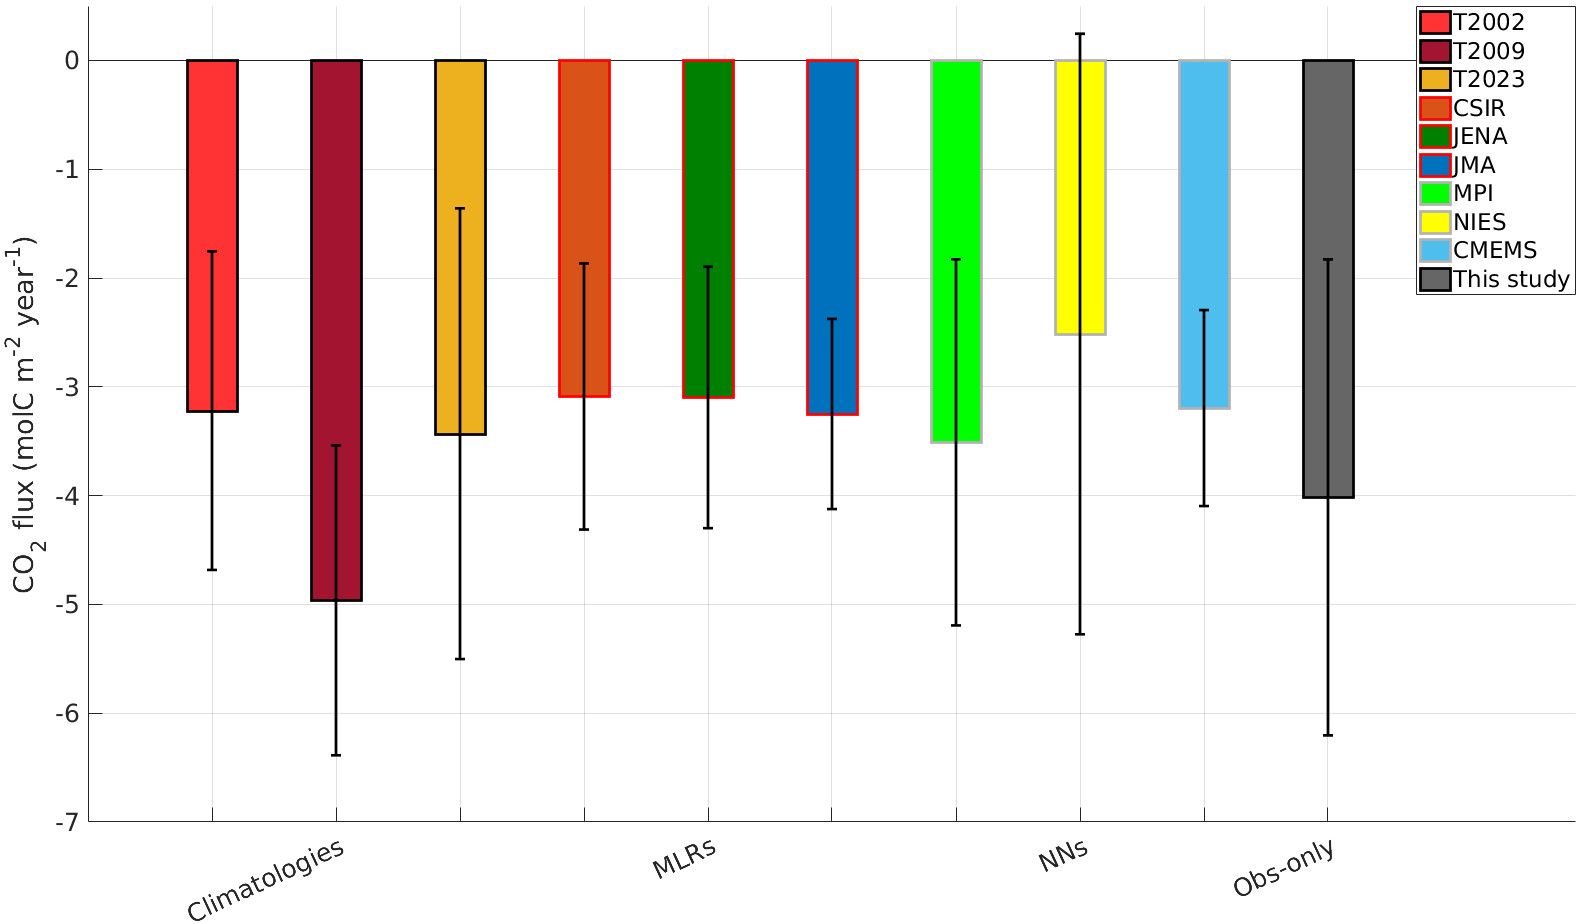
Figure 8. Annual average of air-sea CO2 fluxes (error bars showing ± 1 standard deviation) for the 9 global products and the observation-based estimate from this study.
3.4 Uncertainties of CO2 fluxes in high latitudes
High latitude regions such as the Labrador Sea are amongst the poorest in terms of pCO2 data coverage, even while their significance for global air-sea fluxes and net carbon storage is high. Therefore, high latitude regions usually fall within the regions with highest uncertainty and errors in both regional and global gap-filling estimates (Gloege et al., 2021). For example, there remains controversy whether the Southern Ocean acts as a strong or weak sink (Sutton et al., 2021). However, the seasonality at the regional scales and the strength of the inter-annual variability is poorly characterized, due to large winter-gaps in observations increasing the uncertainty in the Southern Ocean (Mackay et al., 2022; Wu and Qi, 2022). Similarly, in the North Atlantic Ocean, the Labrador Sea is one of the regions with the fewest observations, also leading to high uncertainties.
Here we identify some key sources of uncertainties for the air-sea flux estimates. Firstly, the choice of wind products and wind parametrization for the bulk-formula calculation of CO2 fluxes are among the most important sources of errors. Different parameterization choices for the gas transfer coefficient can alter the intensity of the CO2 fluxes estimates in the region by an average of ± 20% or approximately 0.08 molC m-2month-1 (Atamanchuk et al., 2020). In this study, the parameterization of Wanninkhof (1992) was used for our observation-based reference climatology and for the global products compared in this study.
When using different wind products (e.g. NCEP and CCMP products) with the same parameterization, the observation-based estimates can vary by as much as -0.17 molC m-2month-1, notably during the period of strong summer uptake. This can lead to an almost 50% decrease of the intensity of the summertime carbon sink in the Central Labrador Sea, by switching from ERA5 to NCEP. Differences between CCMP and ERA5 are less pronounced, with a maximum difference around -0.05 molC m-2month-1 during the summer. Overall, differences between fluxes calculated using these three wind products are largest in summer and fall, and less pronounced in winter and spring, being consistent with the flux formulation and ΔpCO2, that is, when air-sea pCO2 gradient are larger, differences of using different wind products are also more pronounced. In this study, ERA5 was used to calculate CO2 fluxes, for the estimate presented in this study and for the global products.
The uncertainties of wind products and wind parametrization have been discussed previously (e.g. Moore et al., 2008; Koelling et al., 2017; Woolf et al., 2019; Atamanchuk et al., 2020), and clearly represent a major problem for global estimates of air-sea CO2 fluxes. Another source of uncertainty is the measurement of the surface temperature, which in most cases occurs at the depth of a ship’s intake of water, which is located typically well below the air-sea interface (e.g. at 5–10 m). This implies a need for an adjustment of the temperature (and pCO2) to reflect actual surface conditions (Watson et al., 2020). Finally, the cool and salty skin-temperature effect offers potential for major bias, with these two factors together having the potential to increase the global oceanic uptake by as much as factor of two (Watson et al., 2020). Other important sources of uncertainties include: (1) uncertainty related to the pCO2 measurements (Bender et al., 2002; Wanninkhof et al., 2019; Dong et al., 2024); (2) gap-filling model uncertainties (e.g. data-coverage uncertainty; Duke et al., 2023a); and (3) uncertainty from the wind measurements that feed global wind-products (Roobaert et al., 2018; Chiodi et al., 2019; Wright et al., 2021; Fang and An, 2022).
Figure 9 shows the seasonal relationship of air-sea CO2 fluxes, pCO2 (or ΔpCO2), surface temperature and wind. The fluxes are more intense and more variable starting in spring, through summer and fall. The contribution of each variable towards predicting the variability of CO2 fluxes was explored using multiple linear least squares regression. We found ΔpCO2 alone was able to describe 62% of the calculated flux variability (R2 = 0.62 and p-value = 0.0023). Based on a regression of CO2 fluxes with both ΔpCO2 and wind, given the amplitude of variability, these two variables were able to describe 84% of the flux variability (R2 = 0.84 and p-value = 0.0002), thus, the variable wind (U) improves the regression together with ΔpCO2. However, we found that wind alone cannot explain the variability of fluxes (large p-value). Temperature alone also cannot explain the variability of fluxes in the Central Labrador Sea (large p-value), due to the opposite expected effect of the temperature changes in ΔpCO2 and thus in the fluxes as well. Therefore, measurements of surface ocean pCO2 remains the most important variable for constraining and improving the estimates of air-sea CO2 fluxes in this region (consistent with this, Dong et al., 2024 found larger standard deviations in reconstructions due to a recent decline in SOCAT observations), followed by resolving/improving the wind (U) data products and parametrization. It is important to point out that these relationships are particular to our region of interest and also dependent on the type of gas exchange parameterization (in this case, using Wanninkhof (1992)).
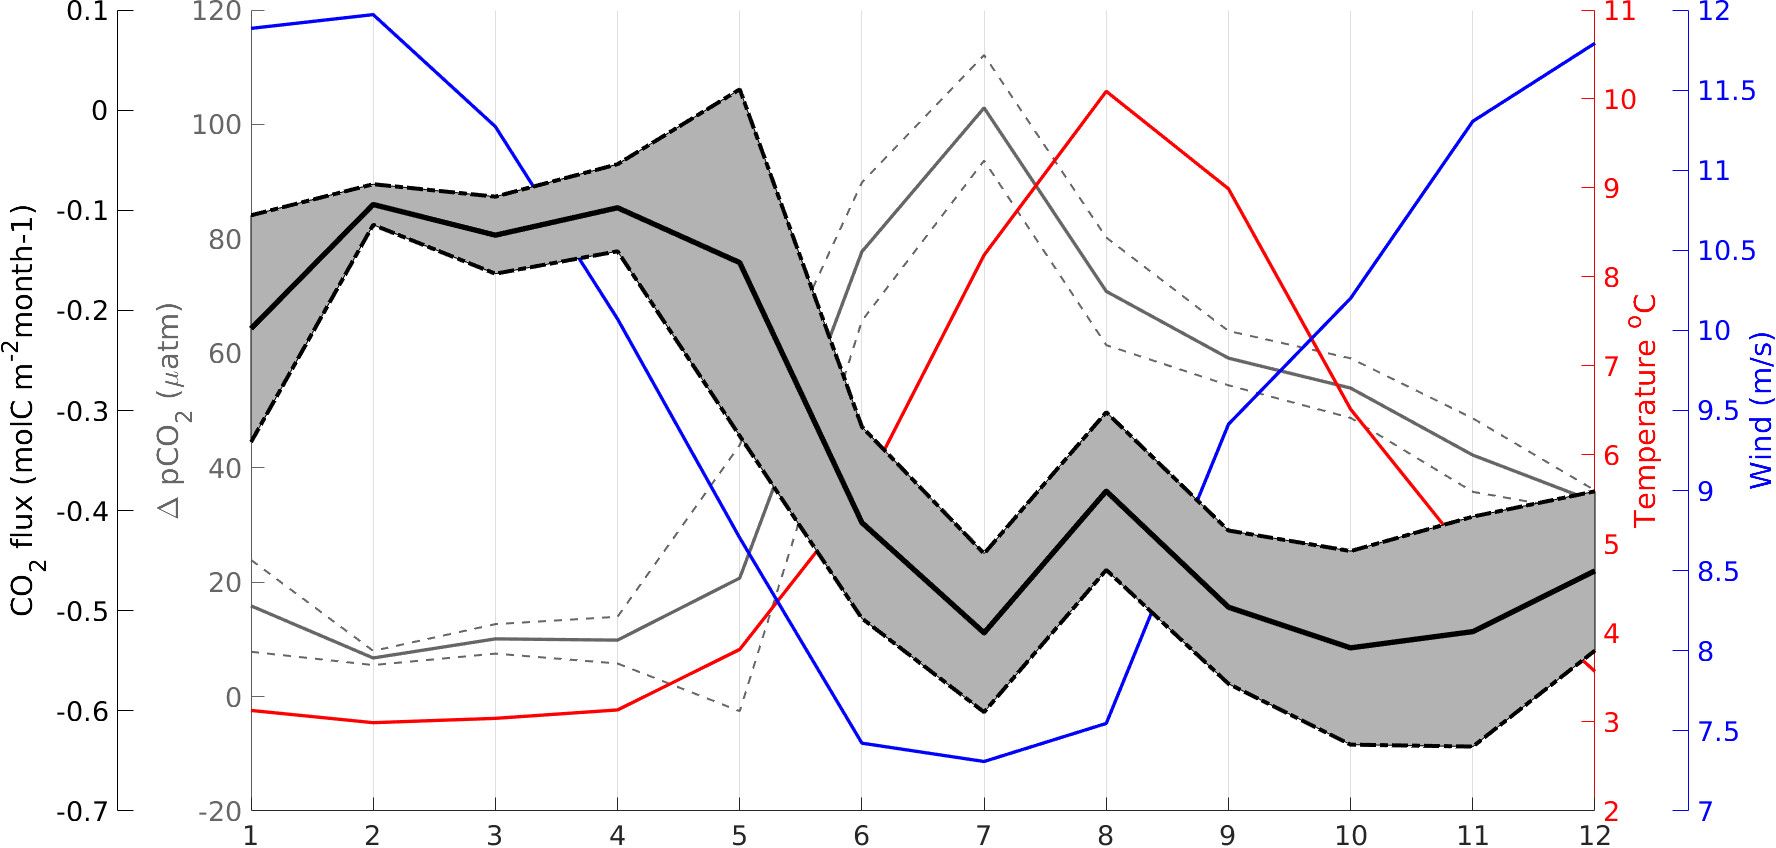
Figure 9. Seasonality of observed ΔpCO2 and air-sea CO2 fluxes (observation-based estimate from this study), together with monthly averaged SST and wind. Dotted lines and shaded areas showing ± 1 standard deviation.
4 Conclusions and recommendations
This study compiled all available pCO2 observations from various platforms and different measuring systems, to define the seasonal cycle of pCO2 and air-sea CO2 fluxes in the Central Labrador Sea. The compilation of observational data creates an observation-based climatology product (referenced to the year 2020), that can be used as a reference for assessing future variability and changes. Furthermore, this reference climatology can be used to skill-test biogeochemical models or gap-filling techniques for their applicability to the Central Labrador Sea.
Since the Central Labrador Sea has very limited data coverage, and a strong seasonal cycle for pCO2 and air-sea CO2 fluxes, the data collected from near-surface moorings equipped with pCO2 sensors, has been key in defining the seasonal cycle.
The comparisons with global pCO2 data products reveal similarities and some large discrepancies between the products with our observation-based seasonal climatology, both in magnitude (differences ranging up to +40 to -80 µatm) and in the seasonal cycle, especially with respect to the timing of the spring-decline and the spring/summer pCO2 minimum. This is the period when pCO2 shows the highest variability and the CO2 fluxes are most intense.
The pCO2 amplitude is well captured by most products in late summer and fall, whereas there is strong underestimation of pCO2 in the winter by most products when compared to observations (lower values than expected), except for the T2023 and NIES climatologies that show overestimation of pCO2 in winter. The spring/summer minimum also showed an underestimation of pCO2 when compared to our observation-based climatology. Overall, all products underestimate the seasonal amplitude of pCO2 variations when comparing to the observation-based estimate presented here (see Table 2).
Air-sea CO2 flux estimates diverge significantly, even when estimated using a common wind-product (ERA5). On the one hand, the annual averaged fluxes are all consistent with the observation-based estimate (between -0.09 and -0.54 molC m-2month-1), however they can deviate strongly over the year due to the region’s strong seasonality. When averaging the fluxes seasonally, we see a clear problem in winter, with high divergence between the products and the estimates from this study. During summer and fall, most products underestimated the CO2 sink and, to a lesser degree, most products showed an overestimation of the CO2 sink in spring.
The sources of uncertainties when estimating seasonal air-sea fluxes are: observational uncertainty on pCO2 measurements; wind related uncertainty (different wind products and parameterizations); uncertainty in the gridding/binning of observations; and uncertainty from the statistical or gap-filling method used (i.e. due to poor coverage in space and time).
Our study suggests that it is important to obtain a minimum amount of data (with both seasonal and spatial coverage) in such regions for constraining and validating estimates from gap-filling methods. Data gaps may not only result in the underestimation of variability, but could also lead to the emergence of errors due to sampling biases (Rödenbeck et al., 2015). The observation-based climatology presented here is a step towards increasing the data-coverage in the Central Labrador Sea deep-water formation region. The differences between our observation-based climatological reference and the global products presented here are mainly due to an overall lack of pCO2 observations in the Central Labrador Sea. Improved target-data (pCO2) coverage will have positive impacts for variable selection (predictors) in statistical and observation-based methods like neural networks.
Notably, inter-annual variability is not addressed in this study, as the sparse temporal coverage of observations in the Central Labrador Sea makes such as analysis almost impossible, so that we would have to rely on gap-filling methods to do so. Inter-annual variability has been found to only be constrained in the more densely observed regions of the ocean (Rödenbeck et al., 2015) which are, however, not necessarily the regions where such variability is largest. Ultimately, improvement of the accuracy of reconstructions of the ocean carbon sink using gap-filling methods, will require expansion of the scope of both underway and mooring-based observations programs to encompass areas (and seasons) where data is scarce (Denvil-Sommer et al., 2019; Gloege et al., 2021).
This study also shows that pCO2 data coverage can be expanded slightly in the near-future if the “non-SOCAT” data, such as those presented here, are made available. However, we recommend addition of new SOOP lines in the Labrador Sea and its continental shelves, including installation of dedicated underway systems in Canadian Research and Coast Guard vessels or commercial vessels that transit the region, as well as deployment of autonomous surface vehicles capable of collecting data on fine time and space-scales. These possibilities for increasing data-coverage in the future, although not necessarily in winter.
We also emphasize the importance of providing data to global databases such as SOCAT, but we note that some of these data in data-poor regions may be derived from new/alternative pCO2 sensors and unconventional platforms (e.g. moorings) which may be subject to over-critical examination and hence may be, inadvertently, discouraged. Databases and their QA/QC requirements may be biased towards conventional existing measuring systems in their flagging system, but such systems may not necessarily be suited for data collection in remote regions (see also Arruda et al., 2020). Critical examination of the currently accepted standards for pCO2 data collection and reporting (and their impact), will be required in order to maximize the utility and availability of observations, which will in turn improve the skill of gap-filling techniques. Furthermore, making water column observations of other carbon-state variables such as DIC and total alkalinity available through submission to other databases (e.g. GLODAP) is also important, especially in a region with deep water formation such as the Central Labrador Sea.
We highlight the specific value of long-term mooring deployments equipped with pCO2 sensors and recommend ongoing efforts to increase deployments of such platforms for improving the winter-gap in data coverage. Also, further investigation/comparison studies of sensor-based pCO2 observation will be important for increasing data coverage, and we therefore recommend acceptance and expanded discussions of these types of observations by databases such as SOCAT. Finally, we recommend rapid delivery of new observations to SOCAT, regardless of the quality-flag. The additional observations can prove to be extremely helpful in improving or validating the skill of some of the gap-filling techniques compared here.
The broad pCO2 community involved in both measuring but also analyzing and estimating CO2 fluxes should work together to place emphasis on data collection in regions with high fluxes, high pCO2 variability and high flux variability. These highly dynamic regions are usually the same regions where we lack consistent observations (e.g. Arctic, Southern Ocean, South Atlantic tropical and subtropical, and upwelling systems – Canary/Humboldt). Additional observations in these locations may lead to overall improvements in air-sea CO2 fluxes estimates, possibly reducing the uncertainties in the order of 10-20% (Hauck et al., 2023; Behncke et al., 2024). On another front, we recommend urgent validation of wind-speed products in regions with high CO2 fluxes, which could reduce the uncertainties from the gas-exchange calculation, and also possibly reduce the differences encountered when estimating air-sea CO2 fluxes with different wind products.
For the Central Labrador Sea, a unique region that connects the atmosphere with the deep ocean with intense CO2 fluxes, creating a reference for seasonality is key for future comparisons within a new ocean state. Overall, the type of compilation provided here can also be useful for pinpointing other regions that would benefit the most from additional pCO2 observations in the Northwestern Atlantic Ocean.
Data availability statement
The raw data supporting the conclusions of this article will be made available by the authors, without undue reservation.
Author contributions
RA: Conceptualization, Data curation, Formal analysis, Investigation, Methodology, Validation, Visualization, Writing – original draft, Writing – review & editing. DA: Conceptualization, Investigation, Methodology, Resources, Supervision, Writing – review & editing. CB: Formal analysis, Investigation, Methodology, Writing – review & editing. DW: Conceptualization, Funding acquisition, Investigation, Methodology, Project administration, Resources, Supervision, Writing – original draft, Writing – review & editing.
Funding
The author(s) declare financial support was received for the research, authorship, and/or publication of this article. This research was supported by the Ocean Frontier Institute (OFI), through an award from the Canada First Research Excellence Fund, Canada Excellence Research Chair in Ocean Science and Technology (CERC.Ocean) Program and the Natural Sciences and Engineering Research Council of Canada (NSERC) through the Advancing Climate Change Science in Canada program (grant no. ACCPJ 536173-18).
Acknowledgments
We acknowledge the Bedford Institute of Oceanography (BIO-DFO) team led by Kumiko Azetsu-Scott, Darlene Childs and Stephen Punshon for running and operating the pCO2 underway systems in the AZMP and AZOMP cruises. We acknowledge the support of Arne Körtzinger, Mike DeGrandpre, Brent Else, Frederic Cyr and Todd Martz for providing pCO2 data. The Surface Ocean CO2 Atlas (SOCAT) is an international effort, endorsed by the International Ocean Carbon Coordination Project (IOCCP), the Surface Ocean Lower Atmosphere Study (SOLAS) and the Integrated Marine Biosphere Research (IMBeR) program, to deliver a uniformly quality-controlled surface ocean CO2 database. The many researchers and funding agencies responsible for the collection of data and quality control are thanked for their contributions to SOCAT.
Conflict of interest
The authors declare that the research was conducted in the absence of any commercial or financial relationships that could be construed as a potential conflict of interest.
Publisher’s note
All claims expressed in this article are solely those of the authors and do not necessarily represent those of their affiliated organizations, or those of the publisher, the editors and the reviewers. Any product that may be evaluated in this article, or claim that may be made by its manufacturer, is not guaranteed or endorsed by the publisher.
Supplementary material
The Supplementary Material for this article can be found online at: https://www.frontiersin.org/articles/10.3389/fmars.2024.1472697/full#supplementary-material
Supplementary Table 4 | Details of the non-SOCAT datasets used in this study.
References
Ahmed M., Else B. G. T., Burgers T. M., Papakyriakou T. (2019). Variability of surface water pCO2 in the Canadian Arctic Archipelago from 2010 to 2016. J. Geophysical Research: Oceans 124, 1876–1896. doi: 10.1029/2018jc014639
Arruda R., Atamanchuk D., Cronin M., Steinhoff T., Wallace D. W. (2020). At-sea intercomparison of three underway pCO2 systems. Limnology Oceanography: Methods 18, 63–76. doi: 10.1002/lom3.10346
Atamanchuk D., Koelling J., Send U., Wallace D. W. R. (2020). Rapid transfer of oxygen to the deep ocean mediated by bubbles. Nat. Geosci. 13, 232–237. doi: 10.1038/s41561-020-0532-2
Azetsu-Scott K., Clarke A., Falkner K., Hamilton J., Jones E. P., Lee C., et al. (2010). Calcium carbonate saturation states in the waters of the Canadian Arctic Archipelago and the Labrador Sea. J. Geophysical Research: Oceans 115, p. C11021. doi: 10.1029/2009jc005917
Bakker D. C., Pfeil B., Landa C. S., Metzl N., O'brien K. M., Olsen A., et al. (2016). A multi- decade record of high-quality fCO2 data in version 3 of the Surface Ocean CO2 Atlas (SOCAT). Earth System Sci. Data 8, 383–413. doi: 10.5194/essd-8-383-2016
Bates N. R., Mathis J. T. (2009). The Arctic Ocean marine carbon cycle: evaluation of air-sea CO2 exchanges, ocean acidification impacts and potential feedbacks. Biogeosciences 6, 2433–2459. doi: 10.5194/bg-6-2433-2009
Behncke J., Landschützer P., Tanhua T. (2024). A detectable change in the air-sea CO2 flux estimate from sailboat measurements. Sci. Rep. 14, 3345. doi: 10.1038/s41598-024-53159-0
Bender M., Doney S., Feely R. A., Fung I. Y., Gruber N., Harrison D. E., et al. (2002). A large-scale carbon observing plan: in situ oceans and atmosphere (LSCOP). Nat. Tech. Info. Services Springfield. p 201.
Chau T. T. T., Gehlen M., Chevallier F. (2022). A seamless ensemble-based reconstruction of surface ocean pCO2 and air–sea CO2 fluxes over the global coastal and open oceans. Biogeosciences 19, 1087–1109. doi: 10.5194/bg-19-1087-2022
Chau T. T. T., Gehlen M., Metzl N., Chevallier F. (2024). CMEMS-LSCE: a global, 0.25∘, monthly reconstruction of the surface ocean carbonate system. Earth System Sci. Data 16, 121–160. doi: 10.5194/essd-16-121-2024
Chen S., Hu C., Barnes B. B., Wanninkhof R., Cai W. J., Barbero L., et al. (2019). A machine learning approach to estimate surface ocean pCO2 from satellite measurements. Remote Sens. Environ. 228, 203–226. doi: 10.1016/j.rse.2019.04.019
Chiodi A. M., Dunne J. P., Harrison D. E. (2019). Estimating air-sea carbon flux uncertainty over the tropical Pacific: Importance of winds and wind analysis uncertainty. Global Biogeochemical Cycles 33, 370–390. doi: 10.1029/2018gb006047
Curry R. G., McCartney M. S. (2001). Ocean gyre circulation changes associated with the North Atlantic Oscillation. J. Phys. Oceanography 31, 3374–3400. doi: 10.1175/1520-0485(2001)031<3374:ogccaw>2.0.co;2
Cyr F., Gibb O., Azetsu-Scott K., Chassé J., Galbraith P., Maillet G., et al. (2022). Ocean carbonate parameters on the Canadian Atlantic Continental Shelf. Federated Res. Data Repository. doi: 10.20383/102.0673
DeGrandpre M. D., Körtzinger A., Send U., Wallace D. W., Bellerby R. G. J. (2006). Uptake and sequestration of atmospheric CO2 in the Labrador Sea deep convection region. Geophysical Res. Lett. 33, L21S03. doi: 10.1029/2006gl026881
Denvil-Sommer A., Gehlen M., Vrac M., Mejia C. (2019). LSCE-FFNN-v1: A two-step neural network model for the reconstruction of surface ocean pCO2 over the global ocean. Geoscientific Model. Dev. 12, 2091–2105. doi: 10.5194/gmd-12-2091-2019
DeVries T. (2014). The oceanic anthropogenic CO2 sink: Storage, air-sea fluxes, and transports over the industrial era. Global Biogeochemical Cycles 28, 631–647. doi: 10.1002/2013gb004739
DeVries T. (2022). The ocean carbon cycle. Annu. Rev. Environ. Resour. 47, 317–341. doi: 10.1146/annurev-environ-120920-111307
Dlugokencky E. J., Mund J. W., Crotwell A. M., Crotwell M. J., Thoning K. W. (2021). Atmospheric carbon dioxide dry air mole fractions from the NOAA GML carbon cycle cooperative global air sampling network 1968-2019, version: 2021-02. doi: 10.15138/wkgj-f215
Dong Y., Bakker D. C., Landschützer P. (2024). Accuracy of ocean CO2 uptake estimates at a risk by a reduction in the data collection. Geophysical Res. Lett. 51, e2024GL108502. doi: 10.1029/2024gl108502
Duke P. J., Hamme R. C., Ianson D., Landschützer P., Ahmed M. M., Swart N. C., et al. (2023a). Estimating marine carbon uptake in the northeast Pacific using a neural network approach. Biogeosciences. 20, 3919–3941. doi: 10.5194/bg-20-3919-2023
Duke P. J., Hamme R. C., Ianson D., Landschützer P., Swart N. C., Covert P. A. (2024). High-resolution neural network demonstrates strong CO2 source-sink juxtaposition in the coastal zone. J. of Geophysical Research: Oceans. 129, e2024JC021134. doi: 10.1029/2024JC021134
Duke P. J., Richaud B., Arruda R., Länger J., Schuler K., Gooya P., et al. (2023b). Canada's marine carbon sink: an early career perspective on the state of research and existing knowledge gaps. Facets 8, 1–21. doi: 10.1139/facets-2022-0214
Fang X., An D. (2022). Evaluation on sea surface wind speed product of Fengyun-3D satellite microwave radiation imager using ERA-5 dataset. Int. J. Remote Sens. 43, 3671–3691. doi: 10.1080/01431161.2022.2099770
Fay A. R., Gregor L., Landschützer P., McKinley G. A., Gruber N., Gehlen M., et al. (2021). SeaFlux: harmonization of air–sea CO2 fluxes from surface pCO2 data products using a standardized approach. Earth System Sci. Data. 13, 4693–4710. doi: 10.5194/essd-13-4693-2021
Fay A. R., Munro D. R., McKinley G. A., Pierrot D., Sutherland S. C., Sweeney C., et al. (2023).Climatological distributions of sea-air ΔfCO2 and CO2 flux densities in the Global Surface Ocean (NCEI Accession 0282251). doi: 10.25921/295g-sn13 (Accessed 01/07/2024).
Fay A. R., Munro D. R., McKinley G. A., Pierrot D., Sutherland S. C., Sweeney C., et al. (2024). Updated climatological mean ΔfCO2 and net sea–air CO2 flux over the global open ocean regions. Earth System Sci. Data 16, 2123–2139. doi: 10.5194/essd-16-2123-2024
Friedlingstein P., O'sullivan M., Jones M. W., Andrew R. M., Gregor L., Hauck J., et al. (2022). Global carbon budget 2022. Earth System Sci. Data 14, 4811–4900. doi: 10.5194/essd-14-4811-2022
Friedrich T., Oschlies a. (2009a). Neural network-based estimates of North Atlantic surface pCO2 from satellite data: A methodological study. J. Geophysical Research: Oceans 114, 1–12. doi: 10.1029/2007JC004646
Friedrich T., Oschlies A. (2009b). Basin-scale pCO2 maps estimated from ARGO float data: A model study. J. Geophys. Res. 114, C10012. doi: 10.1029/2009JC005322
Fu Y., Li F., Karstensen J., Wang C. (2020). A stable Atlantic Meridional Overturning Circulation in a changing North Atlantic Ocean since the 1990s. Sci. Adv. 6, eabc7836. doi: 10.1126/sciadv.abc7836
Gibb O., Cyr F., Azetsu-Scott K., Chassé J., Galbraith P. S., Maillet G., et al. (2023). Spatiotemporal variability of pH and carbonate parameters on the Canadian Atlantic Continental Shelf between 2014 and 2020. Earth System Sci. Data Discussions 2023, 1–50. doi: 10.5194/essd-15-4127-2023
Gloege L., McKinley G. A., Landschützer P., Fay A. R., Frölicher T. L., Fyfe J. C., et al. (2021). Quantifying errors in observationally based estimates of ocean carbon sink variability. Global Biogeochemical Cycles 35, e2020GB006788. doi: 10.1029/2020gb006788
Gregor L., Fay A. (2021). SeaFlux: harmonised sea-air CO2 fluxes from surface pCO2 data products using a standardised approach, (2021.04.03). Zenodo. doi: 10.5281/zenodo.5482547
Gregor L., Lebehot A. D., Kok S., Scheel Monteiro P. M. (2019). A comparative assessment of the uncertainties of global surface ocean CO2 estimates using a machine-learning ensemble (CSIR-ML6 version 2019a)–have we hit the wall? Geoscientific Model. Dev. 12, 5113–5136. doi: 10.5194/gmd-12-5113-2019
Gregor L., Shutler J., Gruber N. (2024). High-resolution variability of the ocean carbon sink. Global Biogeochemical Cycles 38, e2024GB008127. doi: 10.1029/2024gb008127
Gruber N., Clement D., Carter B. R., Feely R. A., Van Heuven S., Hoppema M., et al. (2019). The oceanic sink for anthropogenic CO2 from 1994 to 2007. Science 363, 1193–1199. doi: 10.1126/science.aau5153
Guinehut S., Dhomps A. L., Larnicol G., Le Traon P. Y. (2012). High resolution 3-D temperature and salinity fields derived from in situ and satellite observations. Ocean Sci. 8, 845–857. doi: 10.5194/os-8-845-2012
Hall M. M., Torres D. J., Yashayaev I. (2013). Absolute velocity along the AR7W section in the Labrador Sea. Deep Sea Res. Part I: Oceanographic Res. Papers 72, 72–87. doi: 10.1016/j.dsr.2012.11.005
Hauck J., Nissen C., Landschützer P., Rödenbeck C., Bushinsky S., Olsen A. (2023). Sparse observations induce large biases in estimates of the global ocean CO2 sink: an ocean model subsampling experiment. Philos. Trans. R. Soc. A 381, 20220063. doi: 10.1098/rsta.2022.0063
Hersbach H., Bell B., Berrisford P., Hirahara S., Horányi A., Muñoz-Sabater J., et al. (2020). The ERA5 global reanalysis. Q. J. R. Meteorological Soc. 146, 1999–2049. doi: 10.1002/qj.3803
Iida Y., Kojima A., Takatani Y., Nakano T., Sugimoto H., Midorikawa T., et al. (2015). Trends in pCO2 and sea–air CO2 flux over the global open oceans for the last two decades. J. oceanography 71, 637–661. doi: 10.1007/s10872-015-0306-4
Iida Y., Takatani Y., Kojima A., Ishii M. (2021). Global trends of ocean CO2 sink and ocean acidification: an observation-based reconstruction of surface ocean inorganic carbon variables. J. Oceanography 77, 323–358. doi: 10.1007/s10872-020-00571-5
Khatiwala S., Tanhua T., Mikaloff Fletcher S., Gerber M., Doney S. C., Graven H. D., et al. (2013). Global ocean storage of anthropogenic carbon. Biogeosciences 10, 2169–2191. doi: 10.5194/bg-10-2169-2013
Kieke D., Yashayaev I. (2015). Studies of Labrador Sea Water formation and variability in the subpolar North Atlantic in the light of international partnership and collaboration. Prog. Oceanography 132, 220–232. doi: 10.1016/j.pocean.2014.12.010
Koelling J., Atamanchuk D., Karstensen J., Handmann P., Wallace D. W. (2022). Oxygen export to the deep ocean following Labrador Sea Water formation. Biogeosciences 19, 437–454. doi: 10.5194/bg-19-437-2022
Koelling J., Wallace D. W., Send U., Karstensen J. (2017). Intense oceanic uptake of oxygen during 2014–2015 winter convection in the Labrador Sea. Geophysical Res. Lett. 44, 7855–7864. doi: 10.1002/2017gl073933
Körtzinger A., Schimanski J., Send U., Wallace D. (2004). The ocean takes a deep breath. Science 306, 1337–1337. doi: 10.1126/science.1102557
Körtzinger A., Send U., Lampitt R. S., Hartman S., Wallace D. W., Karstensen J., et al. (2008b). The seasonal pCO2 cycle at 49 N/16.5 W in the northeastern Atlantic Ocean and what it tells us about biological productivity. J. Geophysical Research: Oceans 113, C04020. doi: 10.1029/2007jc004347
Körtzinger A., Send U., Wallace D. W., Karstensen J., DeGrandpre M. (2008a). Seasonal cycle of O2 and pCO2 in the central Labrador Sea: Atmospheric, biological, and physical implications. Global Biogeochemical Cycles 22. doi: 10.1029/2007gb003029
Landschützer P., Gruber N., Bakker D. C. E. (2016). Decadal variations and trends of the global ocean carbon sink. Global Biogeochemical Cycles 30, 1396–1417. doi: 10.1002/2015GB005359
Landschützer P., Gruber N., Bakker D. C.E. (2017). An observation-based global monthly gridded sea surface pCO2 product from 1982 onward and its monthly climatology (NCEI Accession 0160558). Version 4.4 (NOAA National Centers for Environmental Information). doi: 10.7289/V5Z899N6 (Accessed 2019-03-27).
Landschützer P., Gruber N., Bakker D. C., Schuster U. (2014). Recent variability of the global ocean carbon sink. Global Biogeochemical Cycles 28, 927–949. doi: 10.1002/2014gb004853
Landschützer P., Gruber N., Bakker D. C. E., Schuster U., Nakaoka S., Payne M. R., et al. (2013). A neural network-based estimate of the seasonal to inter-annual variability of the Atlantic Ocean carbon sink. Biogeosciences 10, 7793–7815. doi: 10.5194/bg-10-7793-2013
Landschützer P., Laruelle G. G., Roobaert A., Regnier P. (2020). A uniform pCO2 climatology combining open and coastal oceans. Earth System Sci. Data 12, 2537–2553. doi: 10.5194/essd-12-2537-2020
Laruelle G. G., Landschützer P., Gruber N., Ti J. L., Delille B., Regnier P. (2017). Global high-resolution monthly pCO2 climatology for the coastal ocean derived from neural network interpolation. Biogeosciences 14, 4545–4561. doi: 10.5194/bg-14-4545-2017
Laruelle G. G., Lauerwald R., Pfeil B., Regnier P. (2014). Regionalized global budget of the CO2 exchange at the air-water interface in continental shelf seas. Global biogeochemical cycles 28, 1199–1214. doi: 10.1002/2014gb004832
Lauderdale J. M., Dutkiewicz S., Williams R. G., Follows M. J. (2016). Quantifying the drivers of ocean-atmosphere CO2 fluxes. Global Biogeochemical Cycles 30, 983–999. doi: 10.1002/2016gb005400
Lüger H., Wallace D. W., Körtzinger A., Nojiri Y. (2004). The pCO2 variability in the midlatitude North Atlantic Ocean during a full annual cycle. Global Biogeochemical Cycles 18, GB3023. doi: 10.1029/2003gb002200
Mackay N., Watson A. J., Suntharalingam P., Chen Z., Landschützer P. (2022). Improved winter data coverage of the Southern Ocean CO2 sink from extrapolation of summertime observations. Commun. Earth Environ. 3, 265. doi: 10.1038/s43247-022-00592-6
Marshall J., Schott F. (1999). Open-ocean convection: Observations, theory, and models. Rev. geophysics 37, 1–64. doi: 10.1029/98rg02739
Martz T. R., DeGrandpre M. D., Strutton P. G., McGillis W. R., Drennan W. M. (2009). Sea surface pCO2 and carbon export during the Labrador Sea spring-summer bloom: An in situ mass balance approach. J. Geophysical Research: Oceans 114, C09008. doi: 10.1029/2008jc005060
Moore G. W. K., Pickart R. S., Renfrew I. A. (2008). Buoy observations from the windiest location in the world ocean, Cape Farewell, Greenland. Geophysical Res. Lett. 35, L18802. doi: 10.1029/2008gl034845
Nakaoka S. I., Aoki S., Nakazawa T., Hashida G., Morimoto S., Yamanouchi T., et al. (2006). Temporal and spatial variations of oceanic pCO2 and air–sea CO2 flux in the Greenland Sea and the Barents Sea. Tellus B: Chem. Phys. Meteorology 58, 148–161. doi: 10.1111/j.1600-0889.2006.00178.x
Olsen A., Brown K. R., Chierici M., Johannessen T., Neill C. (2008). Sea-surface CO2 fugacity in the subpolar North Atlantic. Biogeosciences 5, 535–547. doi: 10.5194/bg-5-535-2008
Pérez F. F., Becker M., Goris N., Gehlen M., López-Mozos M., Tjiputra J., et al. (2024). An assessment of CO2 storage and sea-air fluxes for the Atlantic Ocean and Mediterranean Sea between 1985 and 2018. Global Biogeochemical Cycles 38, e2023GB007862. doi: 10.1029/2023GB007862
Raimondi L., Matthews J. B. R., Atamanchuk D., Azetsu-Scott K., Wallace D. W. (2019). The internal consistency of the marine carbon dioxide system for high latitude shipboard and in situ monitoring. Mar. Chem. 213, 49–70. doi: 10.1016/j.marchem.2019.03.001
Raimondi L., Tanhua T., Azetsu-Scott K., Yashayaev I., Wallace D. W. (2021). A 30-year time series of transient tracer-based estimates of anthropogenic carbon in the central Labrador Sea. J. Geophysical Research: Oceans 126, e2020JC017092. doi: 10.1029/2020jc017092
Rödenbeck C., Bakker D. C., Gruber N., Iida Y., Jacobson A. R., Jones S., et al. (2015). Data-based estimates of the ocean carbon sink variability–first results of the Surface Ocean pCO2 Mapping intercomparison (SOCOM). Biogeosciences 12, 7251–7278. doi: 10.5194/bg-12-7251-2015
Rödenbeck C., Keeling R. F., Bakker D. C., Metzl N., Olsen A., Sabine C., et al (2013). Global surface-ocean pCO2 and sea–air CO2 flux variability from an observation-driven ocean mixed-layer scheme. Ocean Science. 9, 193–216. doi: 10.5194/os-9-193-2013
Rodgers K. B., Schwinger J., Fassbender A. J., Landschützer P., Yamaguchi R., Frenzel H., et al. (2023). Seasonal variability of the surface ocean carbon cycle: A synthesis. Global Biogeochemical Cycles 37, e2023GB007798. doi: 10.1029/2023GB007798
Roobaert A., Laruelle G. G., Landschützer P., Regnier P. (2018). Uncertainty in the global oceanic CO2 uptake induced by wind forcing: quantification and spatial analysis. Biogeosciences 15, 1701–1720. doi: 10.5194/bg-15-1701-2018
Roobaert A., Regnier P., Landschützer P., Laruelle G. G. (2024). A novel sea surface pCO2 -product for the global coastal ocean resolving trends over 1982–2020. Earth System Sci. Data 16, 421–441. doi: 10.5194/essd-16-421-2024
Rühs S., Oliver E. C., Biastoch A., Böning C. W., Dowd M., Getzlaff K., et al. (2021). Changing spatial patterns of deep convection in the subpolar North Atlantic. J. Geophysical Research: Oceans 126, e2021JC017245. doi: 10.1029/2021jc017245
Sabine C. L., Feely R. A., Gruber N., Key R. M., Lee K., Bullister J. L., et al. (2004). The oceanic sink for anthropogenic CO2. science 305, 367–371. doi: 10.1126/science.1097403
Schuster U., McKinley G. A., Bates N., Chevallier F., Doney S. C., Fay A. R., et al. (2013). An assessment of the Atlantic and Arctic sea–air CO2 fluxes 1990–2009. Biogeosciences 10, 607–627. doi: 10.5194/bg-10-607-2013
Steinfeldt R., Rhein M., Kieke D. (2024). Anthropogenic carbon storage and its decadal changes in the Atlantic between 1990–2020. Biogeosciences 21, 3839–3867. doi: 10.5194/bg-21-3839-2024
Sutton A. J., Williams N. L., Tilbrook B. (2021). Constraining Southern Ocean CO2 flux uncertainty using uncrewed surface vehicle observations. Geophysical Res. Lett. 48, e2020GL091748. doi: 10.1029/2020gl091748
Takahashi T., Sutherland S. C., Sweeney C., Poisson A., Metzl N., Tilbrook B., et al. (2002). Global sea–air CO2 flux based on climatological surface ocean pCO2, and seasonal biological and temperature effects. Deep Sea Res. Part II: Topical Stud. Oceanography 49, 1601–1622. doi: 10.1016/s0967-0645(02)00003-6
Takahashi T., Sutherland S. C., Wanninkhof R., Sweeney C., Feely R., Chipman D. W., et al. (2009). Climatological mean and decadal change in surface ocean pCO2, and net sea–air CO2 flux over the global oceans. Deep Sea Res. Part II: Topical Stud. Oceanography 56, 554–577. doi: 10.1016/j.dsr2.2008.12.009
Telszewski M., Chazottes A., Schuster U., Watson A. J., Moulin C., Bakker D. C. E., et al. (2009). Estimating the monthly pCO2 distribution in the North Atlantic using a self-organizing neural network. Biogeosciences. 6, 1405–1421. doi: 10.5194/bg-6-1405-2009
Terenzi F., Hall T. M., Khatiwala S., Rodehacke C. B., LeBel D. A. (2007). Uptake of natural and anthropogenic carbon by the Labrador Sea. Geophysical Res. Lett. 34, L06608. doi: 10.1029/2006gl028543
Wanninkhof R. (1992). Relationship between wind speed and gas exchange over the ocean. J. Geophysical Research: Oceans 97, 7373–7382. doi: 10.1029/92jc00188
Wanninkhof R., Pickers P. A., Omar A. M., Sutton A., Murata A., Olsen A., et al. (2019). A surface ocean CO2 reference network, SOCONET and associated marine boundary layer CO2 measurements. Front. Mar. Sci. 6, 400. doi: 10.3389/fmars.2019.00400
Watson A. J., Schuster U., Shutler J. D., Holding T., Ashton I. G., Landschützer P., et al. (2020). Revised estimates of ocean-atmosphere CO2 flux are consistent with ocean carbon inventory. Nat. Commun. 11, 4422. doi: 10.1038/s41467-020-18203-3
Weiss R. (1974). Carbon dioxide in water and seawater: the solubility of a non-ideal gas. Mar. Chem. 2, 203–215. doi: 10.1016/0304-4203(74)90015-2
Woolf D. K., Shutler J. D., Goddijn-Murphy L., Watson A. J., Chapron B., Nightingale P. D., et al. (2019). Key uncertainties in the recent air-sea flux of CO2. Global Biogeochemical Cycles 33, 1548–1563. doi: 10.1029/2018GB006041
Worthy D. (ECCC), Atmospheric CO2 at Sable Island by Environment and Climate Change Canada, dataset published as CO2_WSA_ surface-insitu_ECCC_data1 at WDCGG, ver. 2023-08-31-0904 (Reference date*: 2023/06/20).
Wright E. E., Bourassa M. A., Stoffelen A., Bidlot J. R. (2021). Characterizing buoy wind speed error in high winds and varying sea state with ASCAT and ERA5. Remote Sens. 13, 4558. doi: 10.3390/rs13224558
Wrobel-Niedzwiecka I., Kitowska M., Makuch P., Markuszewski P. (2022). The Distribution of pCO2W and Air-Sea CO2 Fluxes Using FFNN at the Continental Shelf Areas of the Arctic Ocean. Remote Sens. 14, 312. doi: 10.3390/rs14020312
Wu Y., Qi D. (2022). Inconsistency between ship-and Argo float-based pCO2 at the intense upwelling region of the Drake Passage, Southern Ocean. Front. Mar. Sci. 9. doi: 10.3389/fmars.2022.1002398
Xu S., Park K., Wang Y., Chen L., Qi D., Li B. (2019). Variations in the summer oceanic pCO2 and carbon sink in Prydz Bay using the self-organizing map analysis approach. Biogeosciences 16, 797–810. doi: 10.5194/bg-16-797-2019
Yashayaev I., Loder J. W. (2017). Further intensification of deep convection in the Labrador Sea in 2016. Geophysical Res. Lett. 44, 1429–1438. doi: 10.1002/2016gl071668
Zantopp R., Fischer J., Visbeck M., Karstensen J. (2017). From interannual to decadal: 17 years of boundary current transports at the exit of the Labrador Sea. J. Geophysical Research: Oceans 122, 1724–1748. doi: 10.1002/2016jc012271
Keywords: pCO2, air-sea CO2 fluxes, observation, seasonality, Labrador Sea
Citation: Arruda R, Atamanchuk D, Boteler C and Wallace DWR (2024) Seasonality of pCO2 and air-sea CO2 fluxes in the Central Labrador Sea. Front. Mar. Sci. 11:1472697. doi: 10.3389/fmars.2024.1472697
Received: 29 July 2024; Accepted: 08 October 2024;
Published: 25 October 2024.
Edited by:
Laurent Coppola, UMR7093 Laboratoire d’océanographie de Villefranche (LOV), FranceReviewed by:
Leticia Cotrim Da Cunha, Rio de Janeiro State University, BrazilNicolas Metzl, Centre National de la Recherche Scientifique (CNRS), France
Copyright © 2024 Arruda, Atamanchuk, Boteler and Wallace. This is an open-access article distributed under the terms of the Creative Commons Attribution License (CC BY). The use, distribution or reproduction in other forums is permitted, provided the original author(s) and the copyright owner(s) are credited and that the original publication in this journal is cited, in accordance with accepted academic practice. No use, distribution or reproduction is permitted which does not comply with these terms.
*Correspondence: Ricardo Arruda, Y2Fkb2FycnVkYUBnbWFpbC5jb20=