- The School of Physics and Optoelectronic Engineering, Ocean University of China, Qingdao, China
The generation characteristics of internal solitary waves (ISWs) in the northern Andaman Sea are studied using remote sensing data and numerical simulations. The dataset comprises 230 images taken by the Moderate Resolution Imaging Spectroradiometer (MODIS) from 2020 to 2023, which reveal two distinct propagation directions of ISWs: southeastward (type-SE) and southwestward (type-SW). Generation hotspots are identified at the southern sill of the Preparis South Channel for type-SE ISWs and over the eastern shelf break for type-SW ISWs. Here, ISWs are intermittently generated, resulting in wave-free spatial gaps. The observed gaps motivate the hypothesis that ISWs are phase-locked with semidiurnal tides, resulting in specific generation time windows around slack tides. This study also reveals that the generation of ISWs is closely related to tidal ranges, with larger tidal ranges leading to more frequent ISWs. Specifically, type-SE and type-SW ISWs are detected only when the tidal range exceeds 1.3 m and 1.4 m, respectively. Numerical simulations with the MIT general circulation model further show that both types of ISWs are generated by nonlinear steepening of internal tides. The influence of background currents on ISW generation is also examined, which supports the proposed generation time window hypothesis. These findings highlight spatial gaps are attributable to the synergistic effects of MODIS observation times and intermittent generation of ISWs.
1 Introduction
Internal solitary waves (ISWs) are common nonlinear features in the stratified ocean, known for their ability to travel long distances with minimal energy loss. These waves generate strongly sheared currents and turbulence, thus enhancing ocean mixing (Arthur and Fringer, 2014; Guo and Chen, 2014) and regulating the marine ecosystem (Wyatt et al., 2020). The four primary approaches to investigating ISWs are remote sensing, numerical simulations, in-situ measurements, and laboratory experiments (Guo et al., 2011; Sutherland et al., 2014).
ISWs modulate ocean surface roughness, which can be identified by their distinctive striped patterns in Synthetic Aperture Radar (SAR) and sunglint optical images (Alpers, 1985; Melsheimer and Kwoh, 2001). The spatiotemporal distributions, generation sites, and key properties of ISWs (e.g., propagation speed, propagation direction, amplitude, wavelength, and crest length) can be determined from these surface signatures in satellite images (Liu and Sa, 2019; Zhang et al., 2022, 2023; Koohestani et al., 2023). Previous studies of the spatiotemporal distribution of ISWs have revealed the prevalence of these waves in the Andaman Sea (Jackson, 2007; Zhou et al., 2016; Sun et al., 2019; Meng et al., 2022; Yang et al., 2023). For instance, hotspots of mode-1 long-lived ISWs are identified by remote sensing in the Andaman Sea (Sun et al., 2019; Raju et al., 2019, 2021). These hotspots include the continental shelf break and the North Andaman Island in the northern region, the Nicobar Islands channels in the central region, and the Northern Sumatra in the southern region. Multiple Images Comparison (MIC) and Tidal Time Period (TTP) methods are commonly employed to estimate the phase speed of ISWs. Tensubam et al. (2021) found that the wave phase speed in the Andaman Sea ranges from 0.83 m/s to 3.02 m/s and decreases as the waves propagate from deep to shallow waters. Similarly, Sun et al. (2021) observed the phase speed to range between 0.54 and 3.27 m/s, noting that ISWs propagating westward exhibit higher speeds compared to those propagating eastward at the same water depth in the northern Andaman Sea. Moreover, both studies, alongside that of Mandal et al. (2024), concluded that water depth and monthly stratification are the two critical factors influencing the phase speed of ISWs in the Andaman Sea. In recent years, machine learning techniques have been applied in conjunction with remote sensing. Specifically, it has been used for wave amplitude inversion (Zhang et al., 2022) and propagation forecasting (Zhang et al., 2021; Lu et al., 2021) in the Andaman Sea. Moreover, mode-2 ISWs in the central Andaman Sea, along the Ten Degree Channel and near the Nicobar Islands, have been identified by high-resolution SAR images (Raju et al., 2021; da Silva and Magalhaes, 2016; Magalhaes and da Silva, 2018; Magalhaes et al., 2020; Cui et al., 2024).
The generation of ISWs is a complex process and has been an active research theme. Tide-topography interaction mechanisms are most common in the global ocean, particularly in regions such as the Andaman Sea (Osborne and Burch, 1980), the Luzon Strait in the South China Sea (Li and Farmer, 2011), the Strait of Gibraltar (Brandt et al., 1996), and the Sulu Sea (Jing et al., 2012) [28]. The tide-topography interaction mechanisms can be further divided into four types: the formation of lee waves (Maxworthy, 1979), the internal tide release mechanism (Buijsman et al., 2010; Vlasenko et al., 2013) (also termed as upstream influence), the internal wave beam mechanism (Gerkema, 2001; Akylas et al., 2007) (also termed as local generation), and the nonlinear steepening of internal tides (Lee and Beardsley, 1974; Farmer et al., 2009). Many observations and numerical simulations have demonstrated that, unlike other generation mechanisms, such as river plumes (Nash and Moum, 2005), atmospheric forcing perturbations (Koohestani et al., 2023), and eddy-topography interactions (Johannessen et al., 2019), internal waves generated by tidal-topography interactions are often phase-locked with the barotropic tides. In the central Andaman Sea, observations from remote sensing and in-situ measurement reveal that mode-1 eastward propagating ISWs are generated between the Car Nicobar and the Teresa Island near the moment of maximized westward tidal current, supporting the lee wave mechanism (Cui et al., 2024; Sun et al., 2024). In parallel, mode-2 eastward propagating ISWs are generated at the Ten Degree Channel near the moment of maximum eastward tidal current, which indicate nonlinear steepening of internal tides mechanism (Cui et al., 2024). In the southern Andaman, eastward-propagating ISWs evolve from lee waves generated at the peak of westward currents, whereas westward-propagating ISWs evolve from lee waves generated at the peak of eastward currents (Cai et al., 2021). Conversely, the northern Andaman Sea has been rarely investigated, and the dynamics of ISWs in this region remain poorly understood.
This work documents uneven spatial distributions of ISW packs derived from MODIS images in the northern Andaman Sea, with large spatial gaps separating ISWs that have rarely been analyzed in the global ocean. We interpret these spatial gaps by analyzing the generation characteristics of ISWs. In Section 2, we introduce the datasets and methodology. In Section 3, we use remote sensing techniques to infer the generation sources and time of ISWs in the northern Andaman Sea, exploring their association with tidal phases. In Section 4, we combine remote sensing records with numerical simulations to verify the generation mechanisms. The reported generation sources and time based on remote sensing in this paper can provide a basis for predicting ISWs in the northern Andaman Sea.
2 Dataset and methods
2.1 MODIS observation data
MODIS (Moderate Resolution Imaging Spectroradiometer) is a key instrument aboard two NASA Earth Observing System (EOS) satellites, Terra and Aqua. The remote sensing dataset used in this work comprises Level-1B Calibrated Radiances MODIS images with a 250 m spatial resolution and a 2330 km swath width. ISW signatures in the northern Andaman Sea are identified from 230 scenes between 2020 and 2023, with 116 scenes from Aqua and 114 scenes from Terra.
The distribution map of leading ISW crests extracted from the satellite images is shown in Figure 1. It displays two distinct propagation directions of ISWs: the light pink curves represent ISWs propagating southeastward (type-SE ISWs hereafter), identified from 96 scenes, and the light blue curves represent ISWs propagating southwestward (type-SW ISWs hereafter), identified from 213 scenes. In addition, Sun et al. (2019) found some small-scale ISWs with a crest length of approximately 400 m propagating northeastward onto the continental shelf in the northern Andaman Sea, which have a different origin from the two types of ISWs identified here, and thus not the primary focus of this paper.
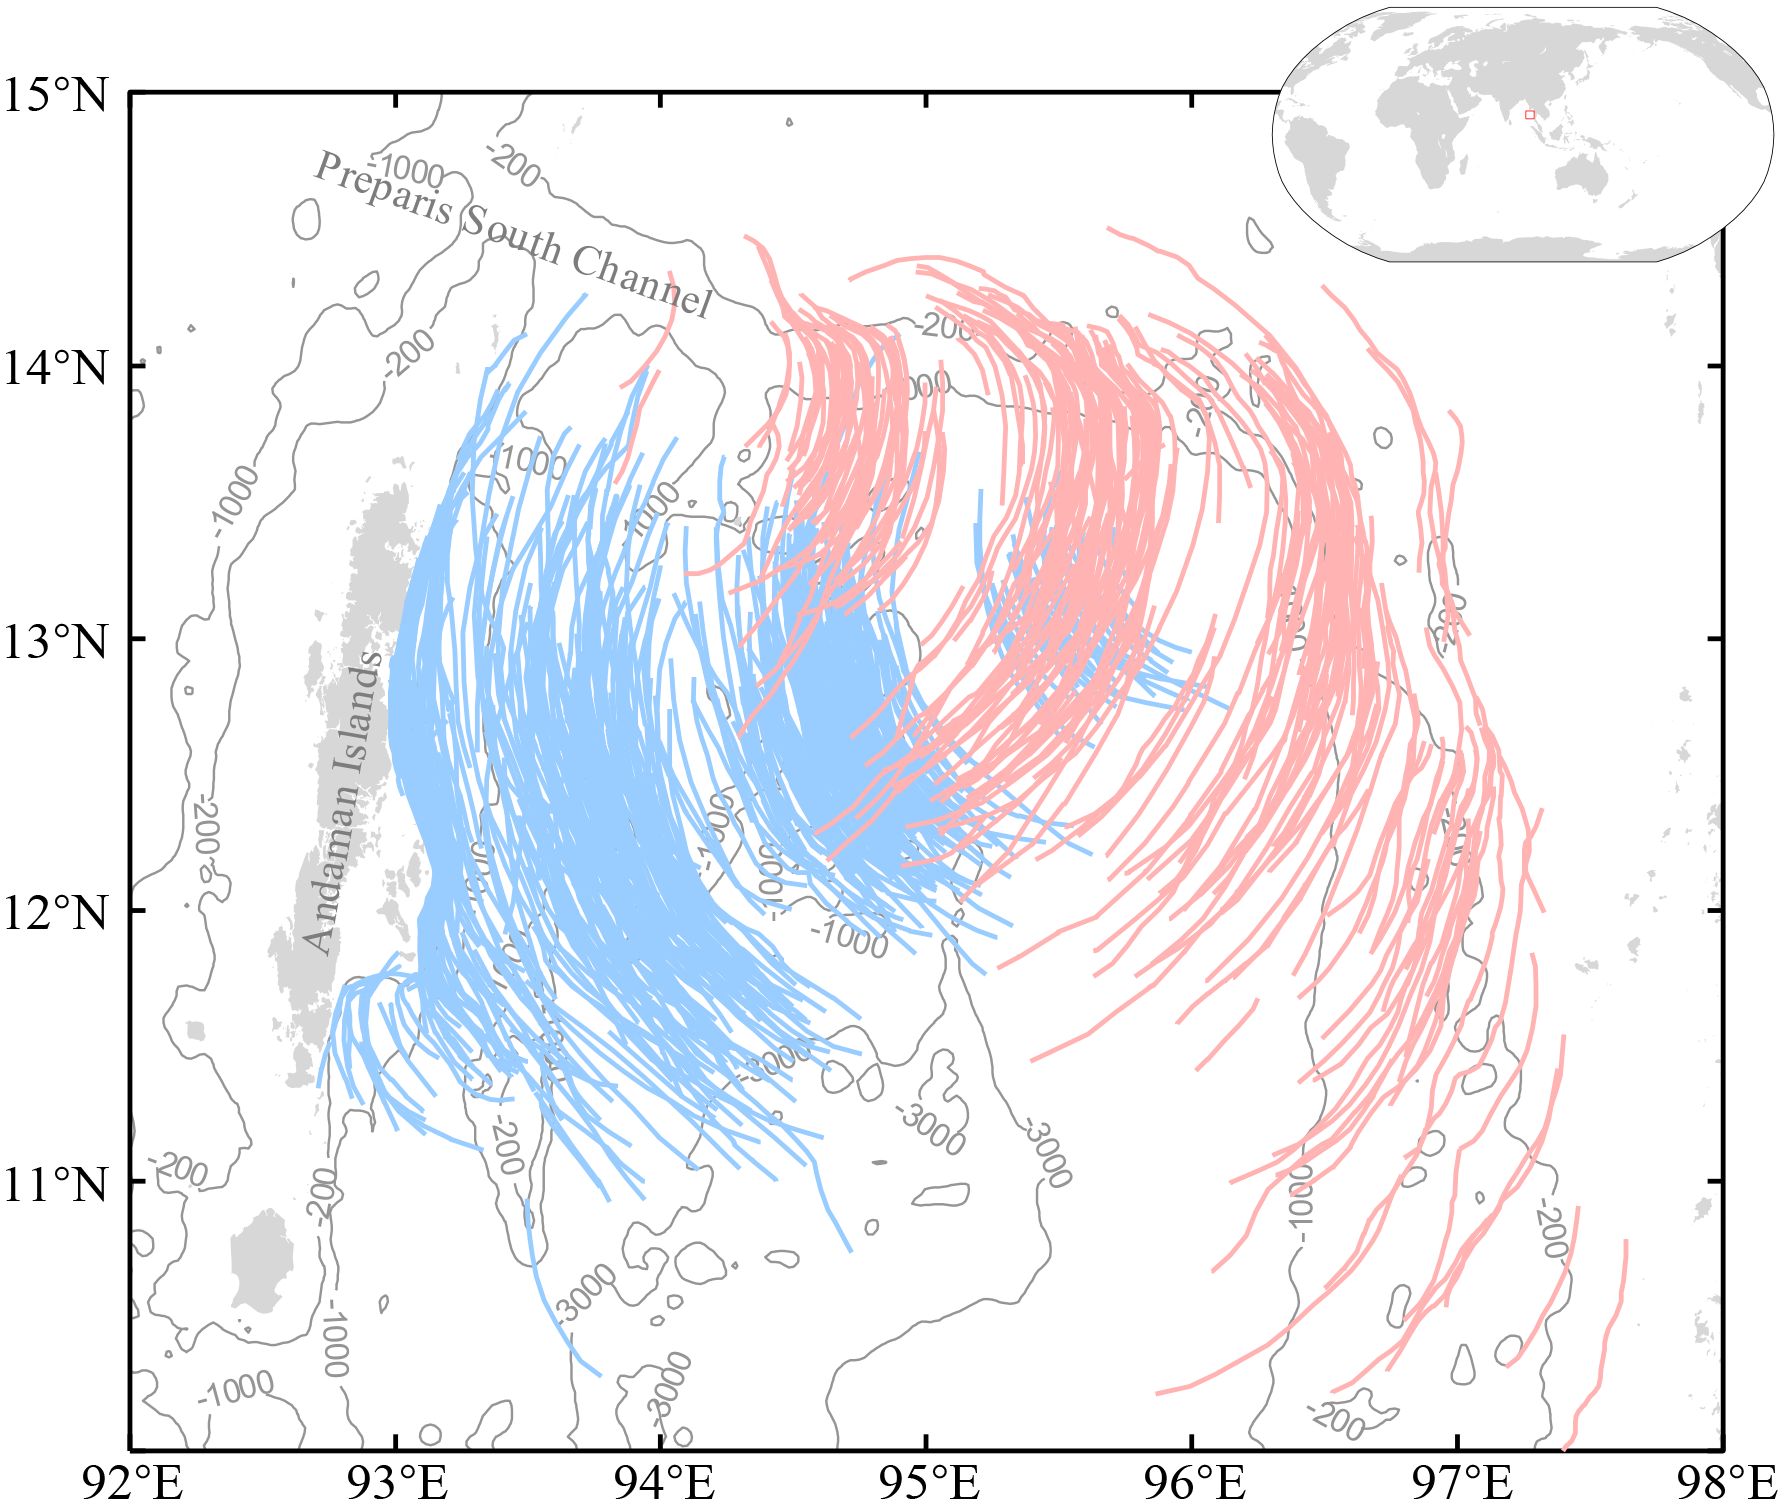
Figure 1. Distribution map of leading ISW crests in the north Andaman Sea identified in MODIS images from January 2020 to December 2023. Type-SE and Type-SW ISWs are shown in light pink and blue curves, respectively superposed on bathymetric contours of -200 m, -1000 m, and -3000 m.
2.2 Tidal data
In the northern Andaman Sea, semidiurnal tides are prevalent and ISWs are generated with a semidiurnal period, with the M2 and S2 being the two predominant tidal constituents. The tidal constituents used in our numerical simulations and remote sensing analyses are adopted from the OUS TPXO9 Tide Models. Figures 2A, B show that most of the tidal major axes are nearly perpendicular to the isobaths in the northern Andaman Sea. We select two transects, denoted SE and SW, along the propagation directions of the two types of ISWs observed from the remote sensing images for numerical investigation of the full-depth wave characteristics. The directions of the M2 and S2 major axes at the key ISW generation areas are parallel to the selected transects. There, the tidal ellipses are large, and currents flow mainly in the transect directions, which indicates elevated conversion rates from the barotropic tide into baroclinic energy.
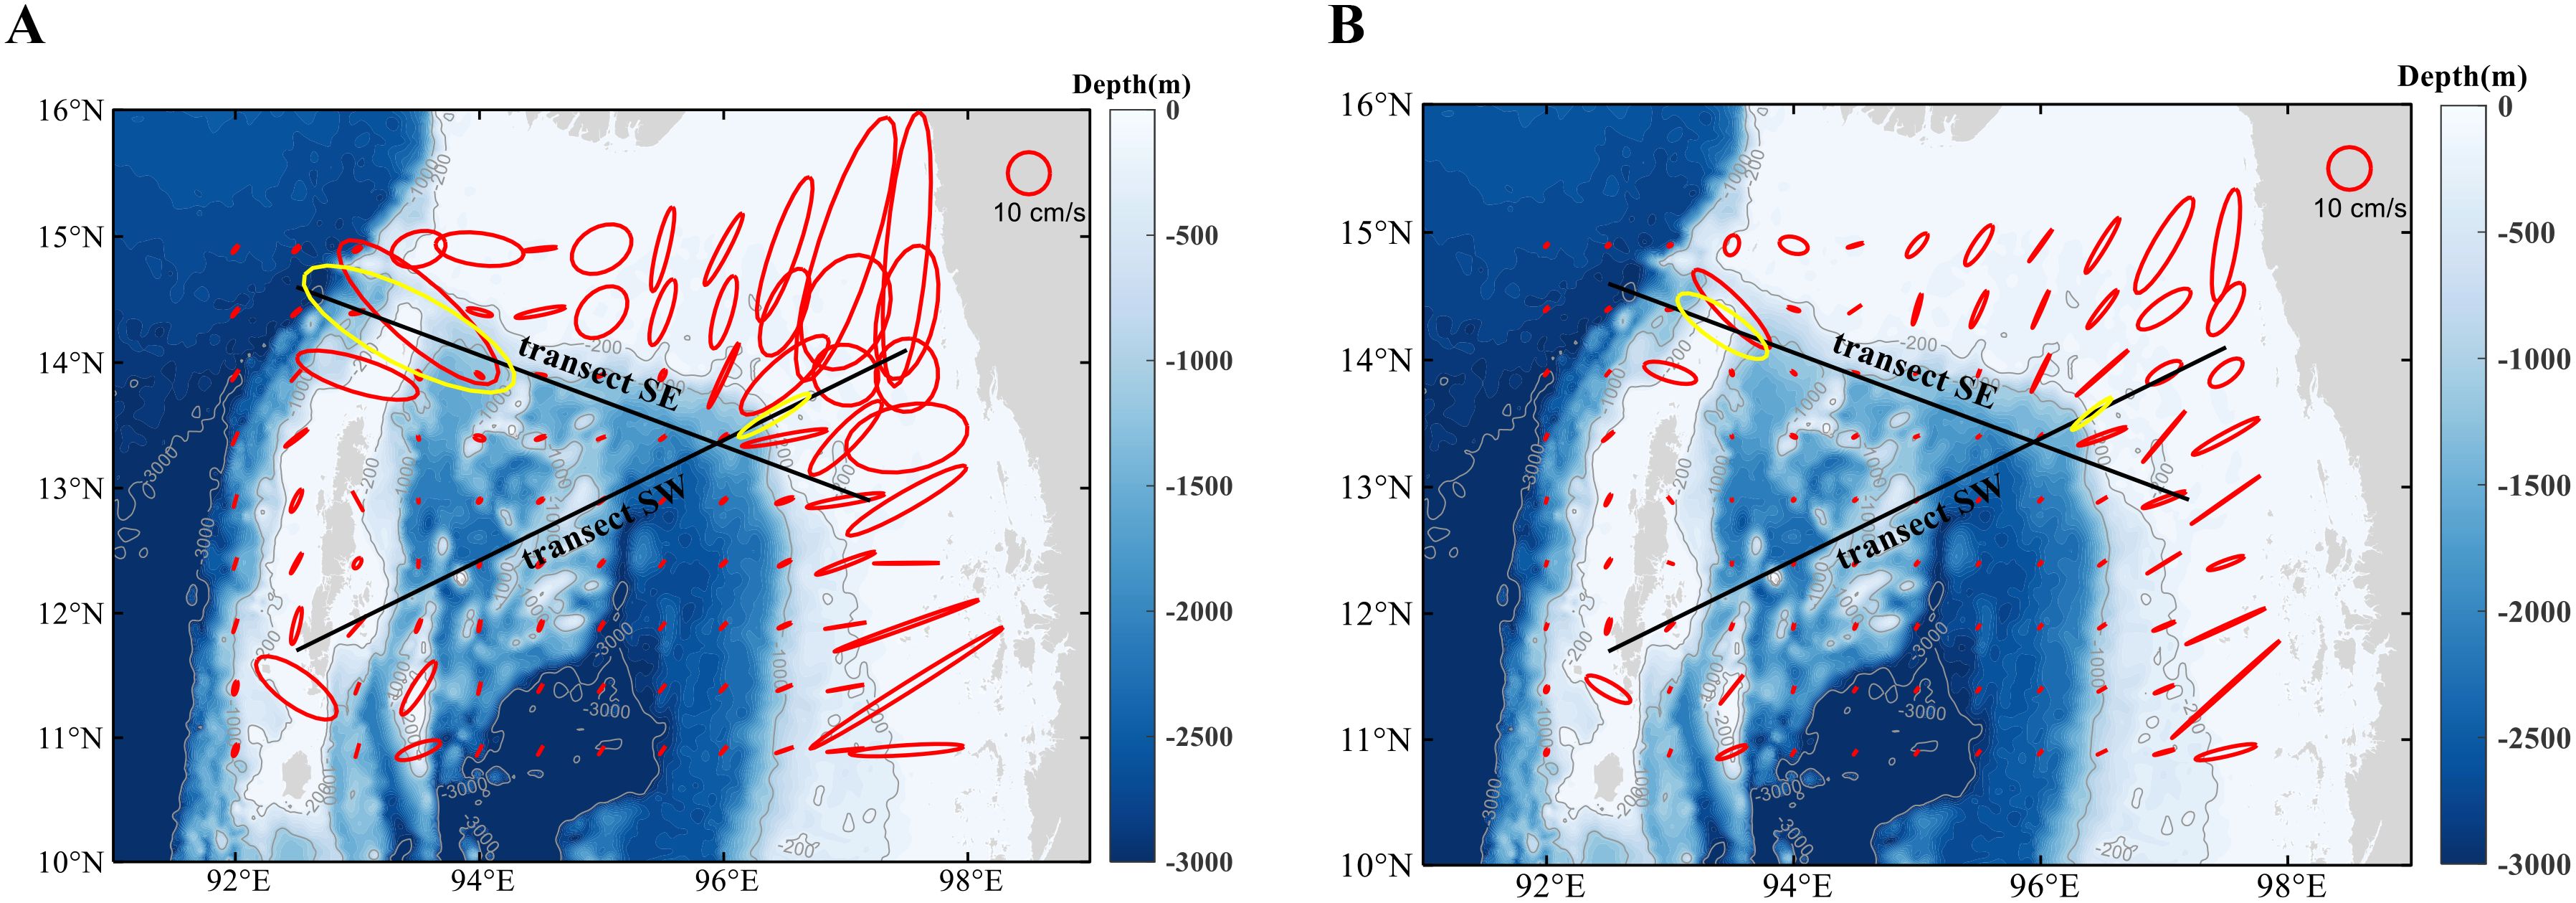
Figure 2. Tidal ellipse maps in the northern Andaman Sea for the (A) M2 tidal component and (B) S2 tidal component. The M2 and S2 tidal ellipses at the sill (in transect SE) and the shelf break (in transect SW) are highlighted in yellow. The reference ellipses with both axes representing a speed of 10 cm/s are shown on the top-right corners. The SE and SW transects in our numerical model are indicated by the black solid lines.
2.3 Model setup and validation
In this work, we employ a fully nonlinear, non-hydrostatic primitive equation ocean solver [Massachusetts Institute of Technology general circulation model, MITgcm (Marshall et al., 1997)] with realistic bathymetry of the northern Andaman Sea to reproduce the generation and propagation process of the ISWs. The model simulations are performed in two-dimensional splices (X-Z coordinate), where the positive direction of the X-axis orients onshore and the Z-axis points vertically upward.
The horizontal grid spacing (Δx) is 100 m in the main model domain, gradually coarsening to a maximum of 900 m at the model lateral boundaries. To reduce internal wave reflections, we set up sponge layers of 50 km widths at the horizontal boundaries. Vertically, the maximum water depths of case SE and case SW are set as -1500 m and -2000 m, respectively, discretized using 170 geopotential levels (the upper 40 levels have a 5-m resolution, and the bottom 130 levels have a 10-m resolution) in the case of SE and 180 levels (the upper 40 levels have a 5-m resolution, the lower 130 levels has a 10-m resolution, and the bottom 10 levels have a 50-m resolution) in the case of SW. Time step is set as 5 s to satisfy the Courant-Friedrichs-Lewy (CFL) stability condition. Horizontal and vertical eddy viscosity and diffusivity coefficients are prescribed as constants: , , , and to prevent model instabilities, referencing Legg and Huijts (2006).
The model is driven by the TPX9-atlas tidal data mapped on a 1/30°-resolution grid (Egbert and Erofeeva, 2002), incorporating tidal constituents M2, S2, N2, K2, K1, O1, P1, and Q1 at the boundaries. As the 2D transects in our model are not strictly zonal (see Figure 2), we extract the amplitude and phase for each tidal constituent along the transects from the TPXO9-atlas dataset using the method described by Gong et al. (2023) (see their Equations 1A and A2). The model was run from 00:00 UTC on May 1, 2023, to 00:00 UTC on May 10, 2023. The boundary tidal flows are shown in Figures 3F, G. The initial temperature, salinity and buoyancy frequency of the model are averaged along the transects using the monthly average data from HYCOM (see Figures 3A–C). The bathymetry data are derived from ETOPO2022 with a 15 arc-second resolution (see Figures 3D, E).
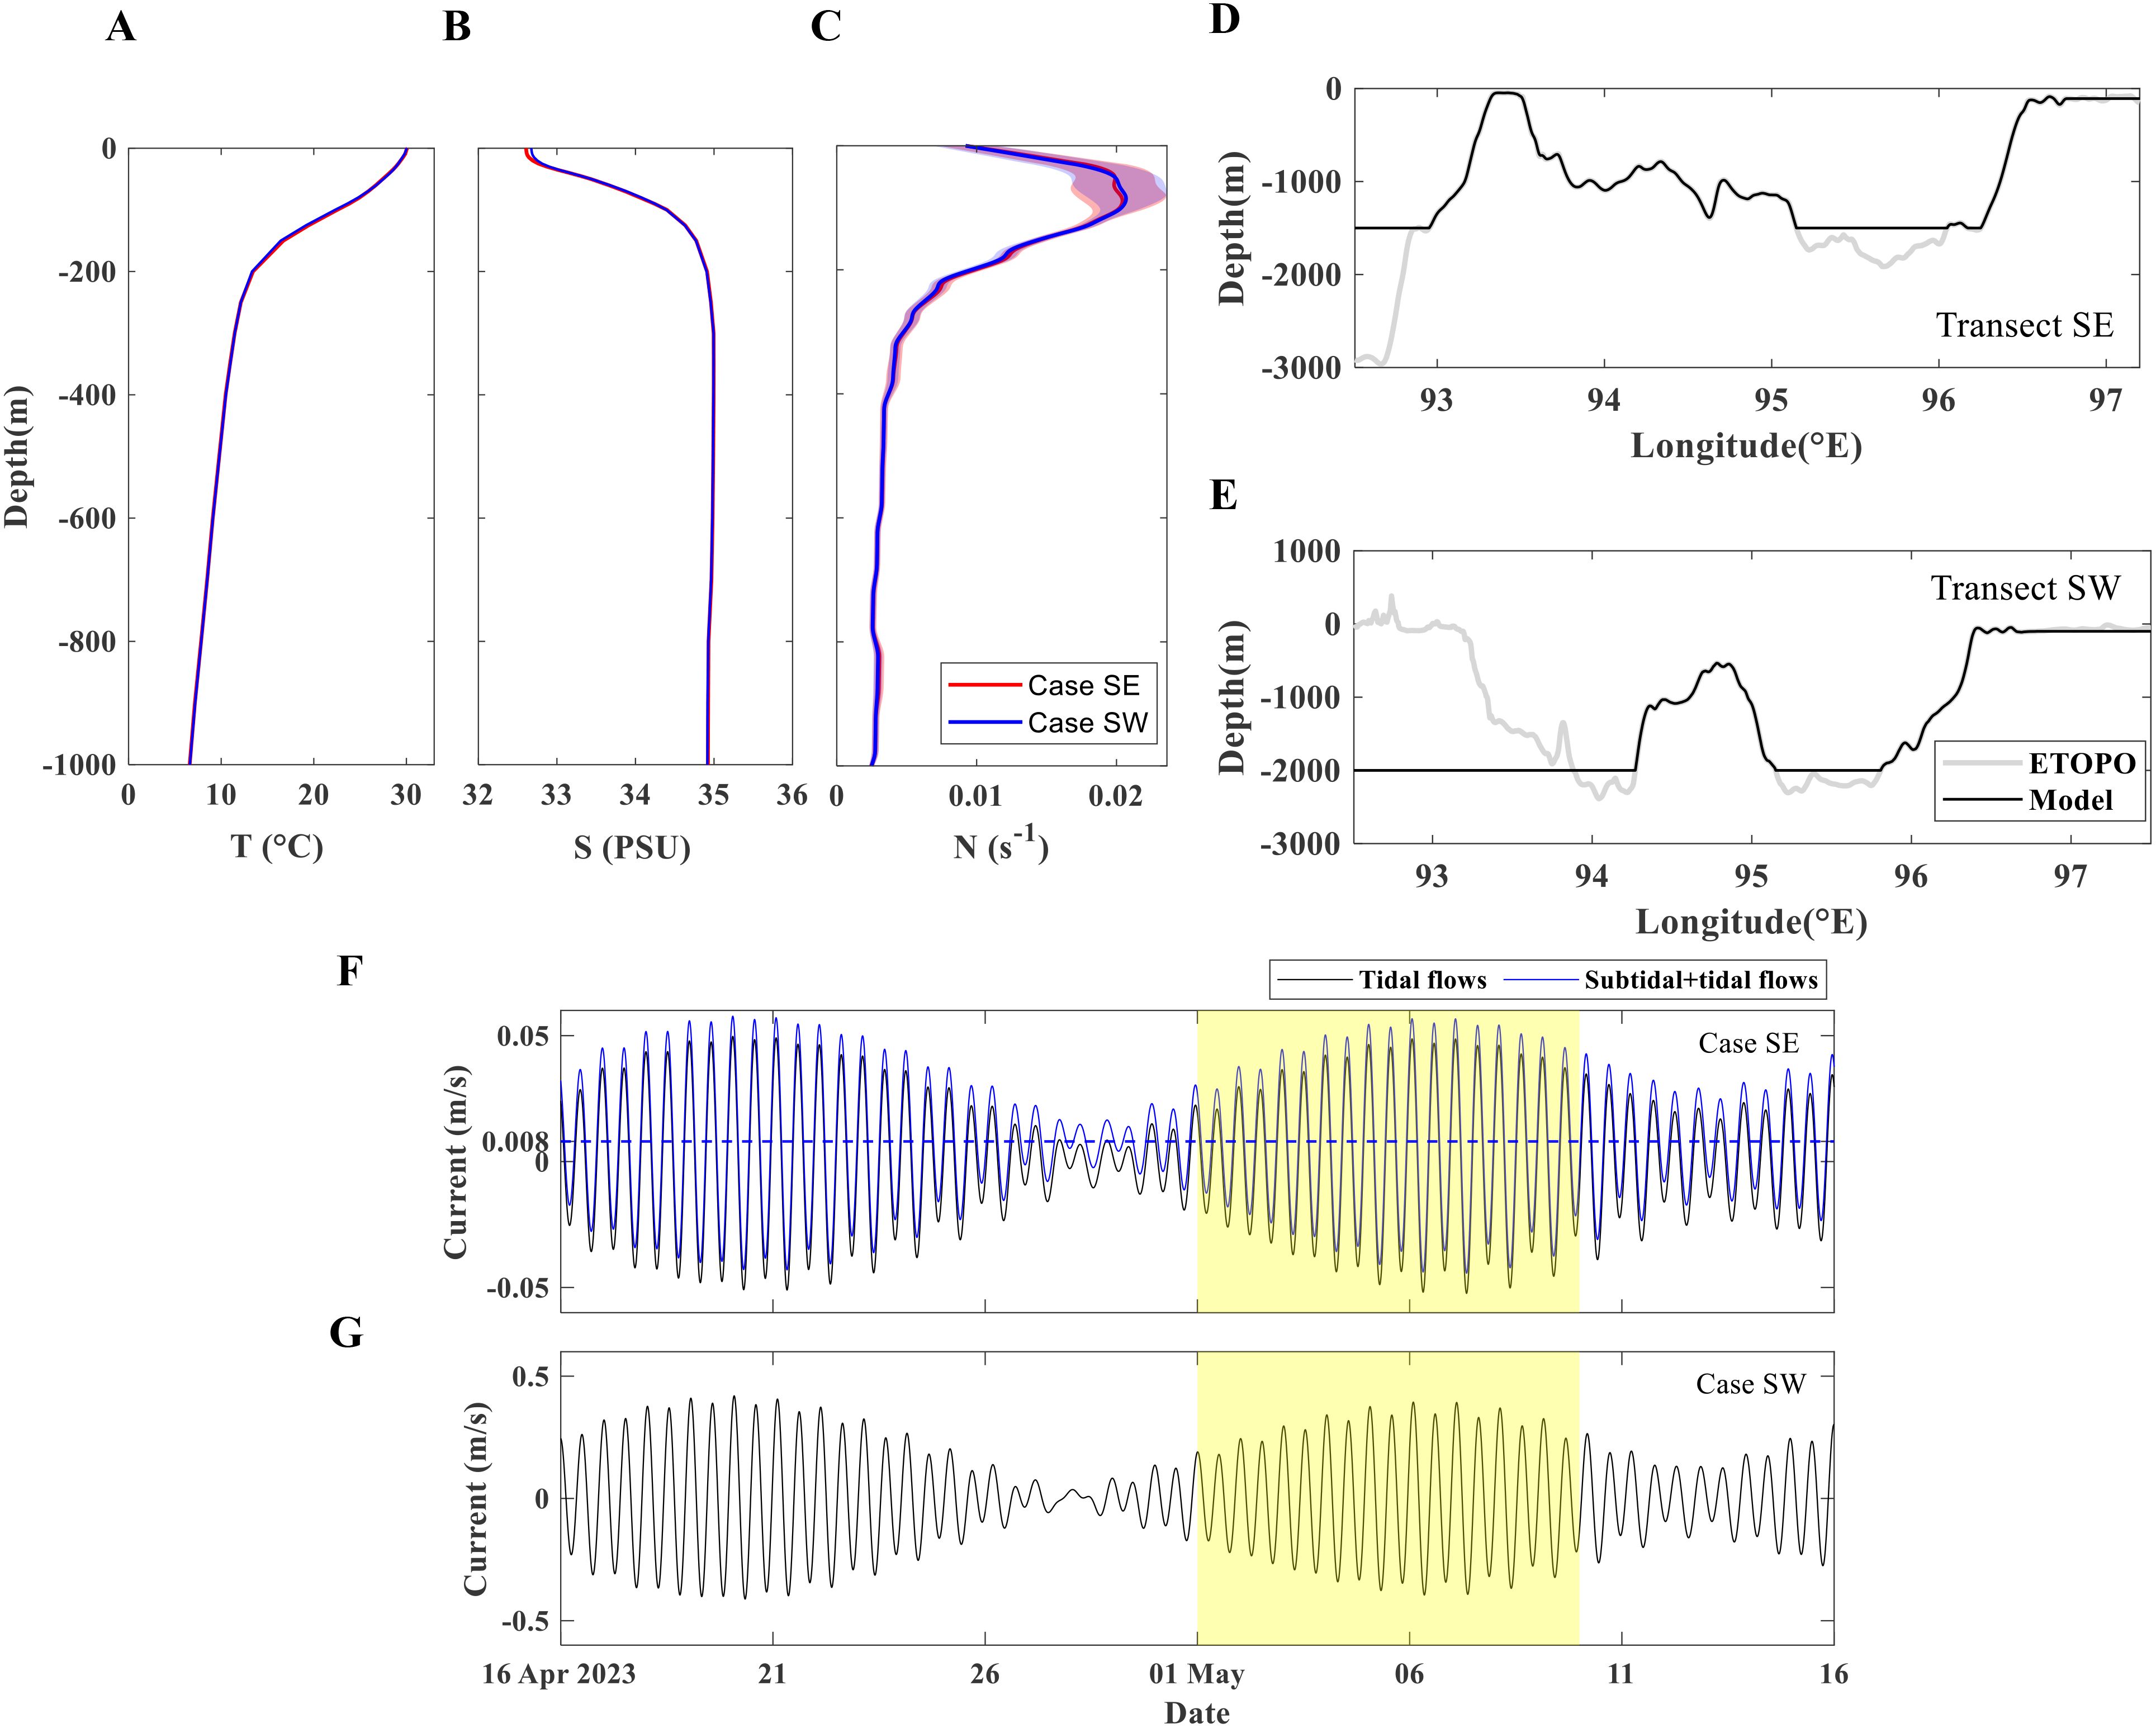
Figure 3. Input parameters for model cases of SE and SW. Initial temperature (A), salinity (B) and buoyancy frequency (C) profiles of the model domain in May. The bands represent the standard deviation along the transects. Bathymetry for transects (D) SE and (E) SW. (F) Tidal flow (black curve) and combined tidal and subtidal flow (blue curve) at the western boundary in case SE. (G) Tidal flow at the eastern boundary in case SW. The yellow shaded areas indicate modal time span.
During ISW propagation, sea surface roughness varies, inducing surface convergence and divergence. This then leads to discernible dark and bright stripes in MODIS images. The dark and bright inflection points caused by the leading waves of ISW packets in MODIS images were identified along the transects SE and SW, and marked as model validation points highlighted in Figures 4A, D). These validation points were also marked in model cases SE and SW (see Figures 4B, C, E, F). Slight temporal lags exist in the ISWs in the two model cases compared to the MODIS observations. The mean absolute error (MAE) for the case SE is -5.2 km, and -11.2 km for the case SW.
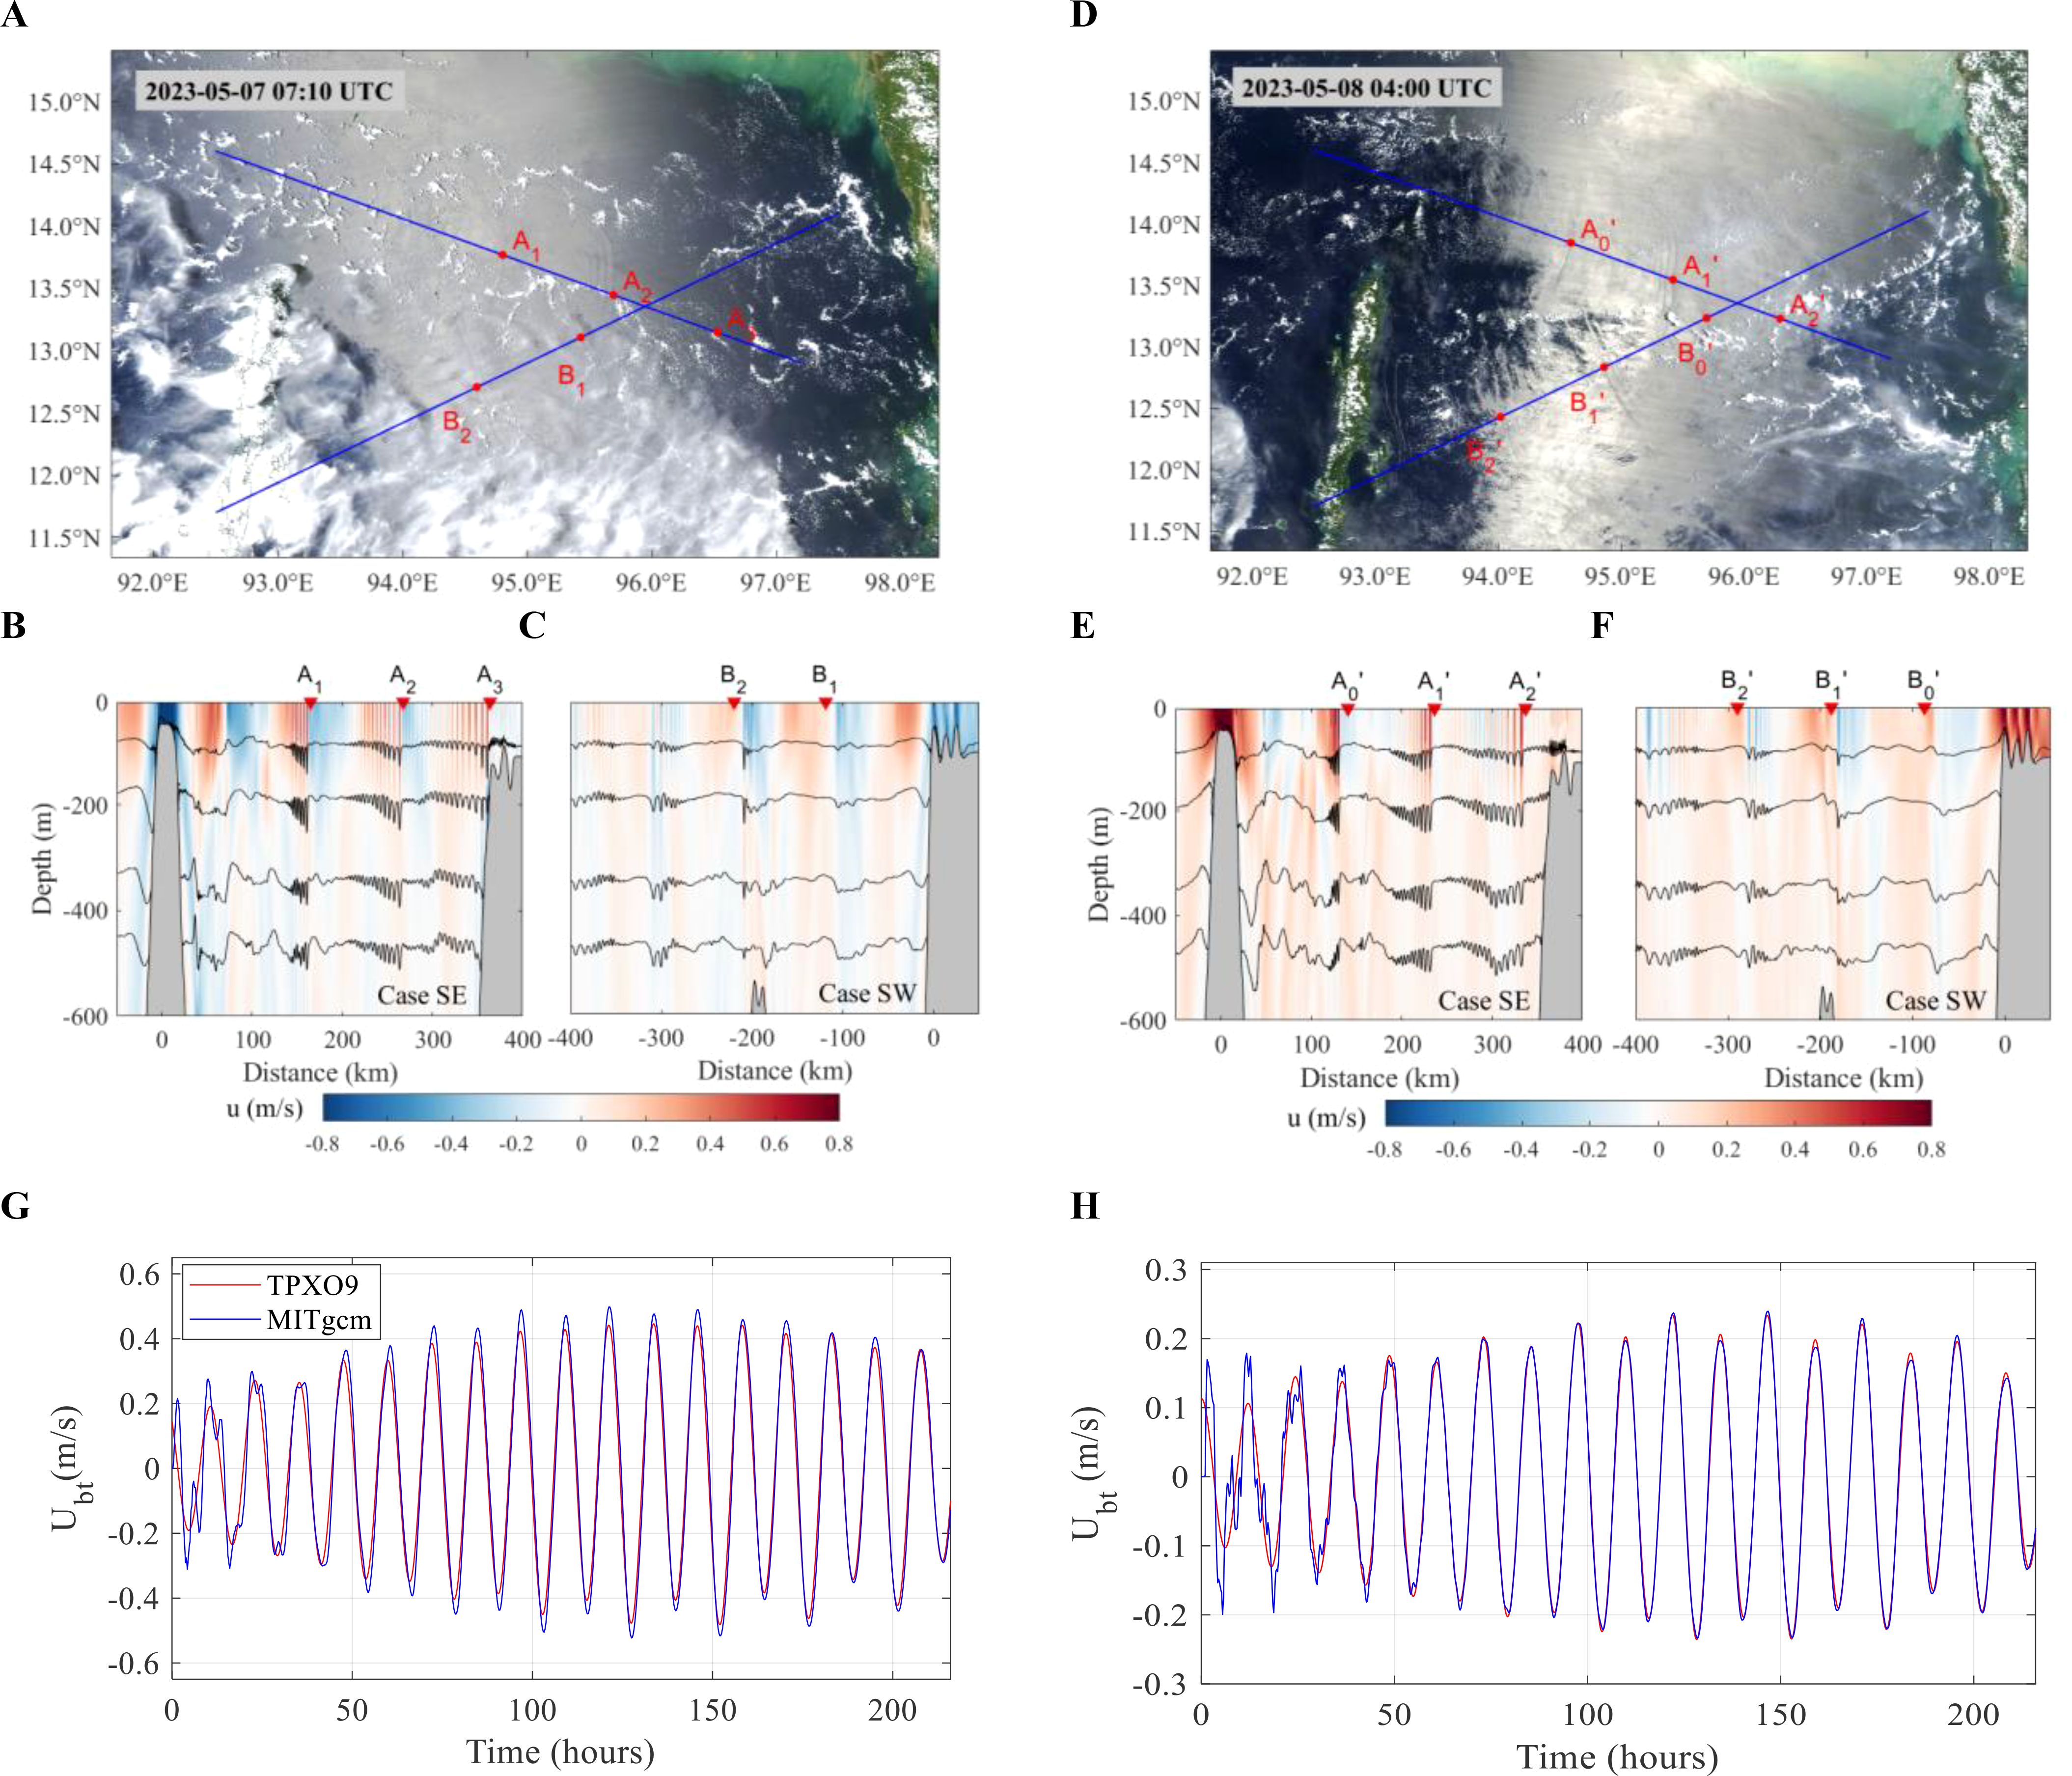
Figure 4. Model validation with MODIS images and TPXO. (A) Aqua-MODIS image taken on 7 May 2023 07:10 UTC. (B, C) show horizontal velocities (shades) and isotherms (contours) from model cases SE and SW, respectively, at the same time as in (A). (D) Terra-MODIS image taken on 8 May 2023 04:00 UTC. (E, F) show horizontal velocities (shades) and isotherms (contours) from model cases SE and case SW, respectively, at the same time as in (D). Points for model validations are marked on the MODIS image, and on top of numerical simulation velocity maps. Points for model validations are marked on the MODIS images and on top of the numerical simulation velocity maps. (G) shows the barotropic tide along the transect SE on the eastern side of the sill in case SE. (H) shows the barotropic tide along the transect SW on the continental slope in case SW. The red and blue curves indicate the TPXO and MITgcm outputs, respectively.
Previous studies have shown that stationary currents can significantly affect the evolution of internal waves in numerical models (Bai et al., 2021; da Silva et al., 2015; Jia et al., 2021). The local currents, driven by monsoon, air-sea heat fluxes, and tides, primarily enters the Andaman Sea through the Preparis Channel at the northwest and exits through the Great Channel at the southwest (Wyrtki, 1961; Rizal et al., 2012). Additionally, a strong background flow was observed in the Preparis Channel (Figure 5) during the same time as in Figure 4. Therefore, the influence of the background flow on type-SE ISWs will be assessed in detail in Section 4.
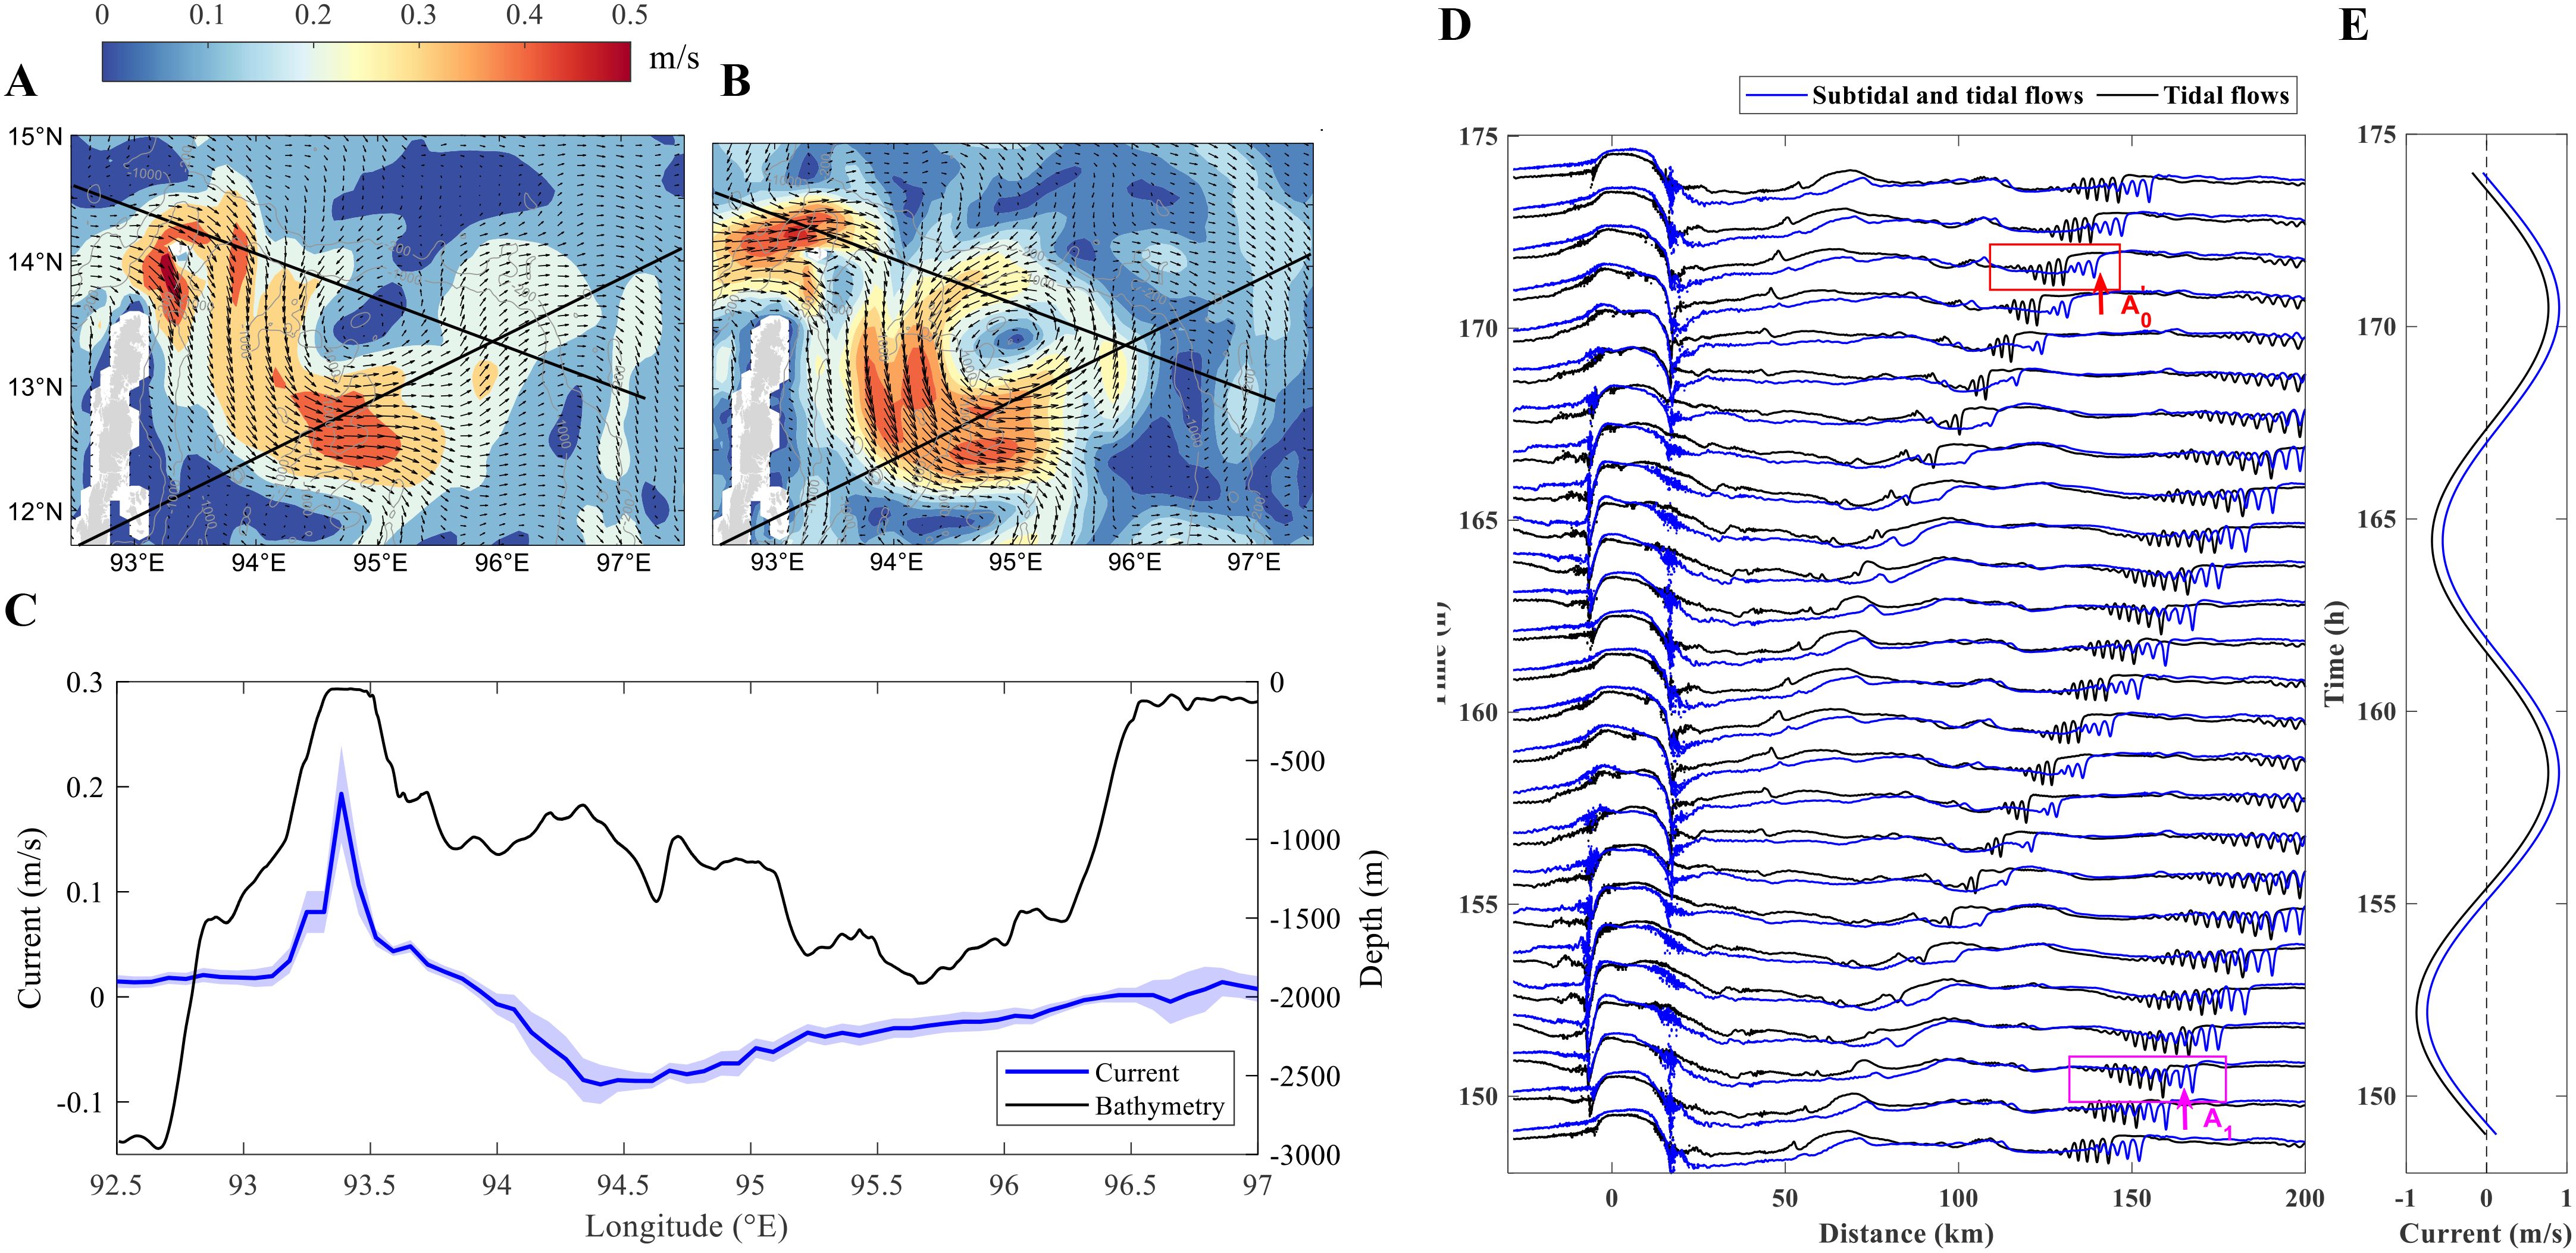
Figure 5. Subtidal current from the HYCOM 3-hourly dataset, and model case SE with and without subtidal flow. Sea surface current on (A) 7 May 2023 06:00 UTC and (B) 8 May 2023 03:00 UTC. (C) The 8-day averaged and vertical uniform current (blue line) and bathymetry (black line) along the transect SE. Positive values of current indicate a direction along the propagation of the type-SE ISWs. The band indicates the standard deviation over these 8 days. (D) Variations of the 23.9°C isotherms (at -90 m depth) in model case SE, driven by tidal flow (black curve) and by the combined tidal and subtidal flow (blue curve), respectively. The isotherms are displayed at 1-hour intervals. The magenta and red arrows indicate the locations of A1 and A0’ shown in Figures 4A, D, respectively. And the magenta and red boxes correspond to the capturing times of the MODIS images. (E) The time series of the tidal flow and the combined tidal and subtidal flow at generation site.
In tide-induced ISWs simulations, the barotropic tidal currents output from the model are typically compared with TPXO or observation data for validation (Huang et al., 2024; Jia et al., 2023). The barotropic tidal current in the model can be defined as the vertical integrated-average current in each layer,
Where is the local depth, and is the current velocity calculated by the model. Figures 4G, H show comparisons between the barotropic tides output from the TPXO9 and model in case SE and case SW, respectively. The results indicate that the model reaches a quasi-steady state after four semi-diurnal tidal periods. Overall, the tidal phase and amplitude in the model closely match the TPXO9 data, which indicates the reliability of the model.
3 Results
Spatial gaps separating unevenly distributed ISW crests are conspicuous from MODIS images (Figure 1), which indicates intermittent generations of ISWs. Such gaps or intermittent wave generations have rarely been reported in the world’s ocean. In this section, we interpret these gaps by analyzing the generation sources and time intervals of internal waves as detected from remote sensing.
3.1 Generation sites and spatial gaps identified by remote sensing
Previous studies identified major bathymetric features, such as underwater sills, island chains, continental shelf, and straits, as potential source sites for ISWs (Bai et al., 2023; Wang et al., 2022). In our analyses, the distribution map of leading ISW crests, observed from Terra-MODIS (Figures 6A, C) and Aqua-MODIS (Figures 6B, D), provides insight into generation sites.
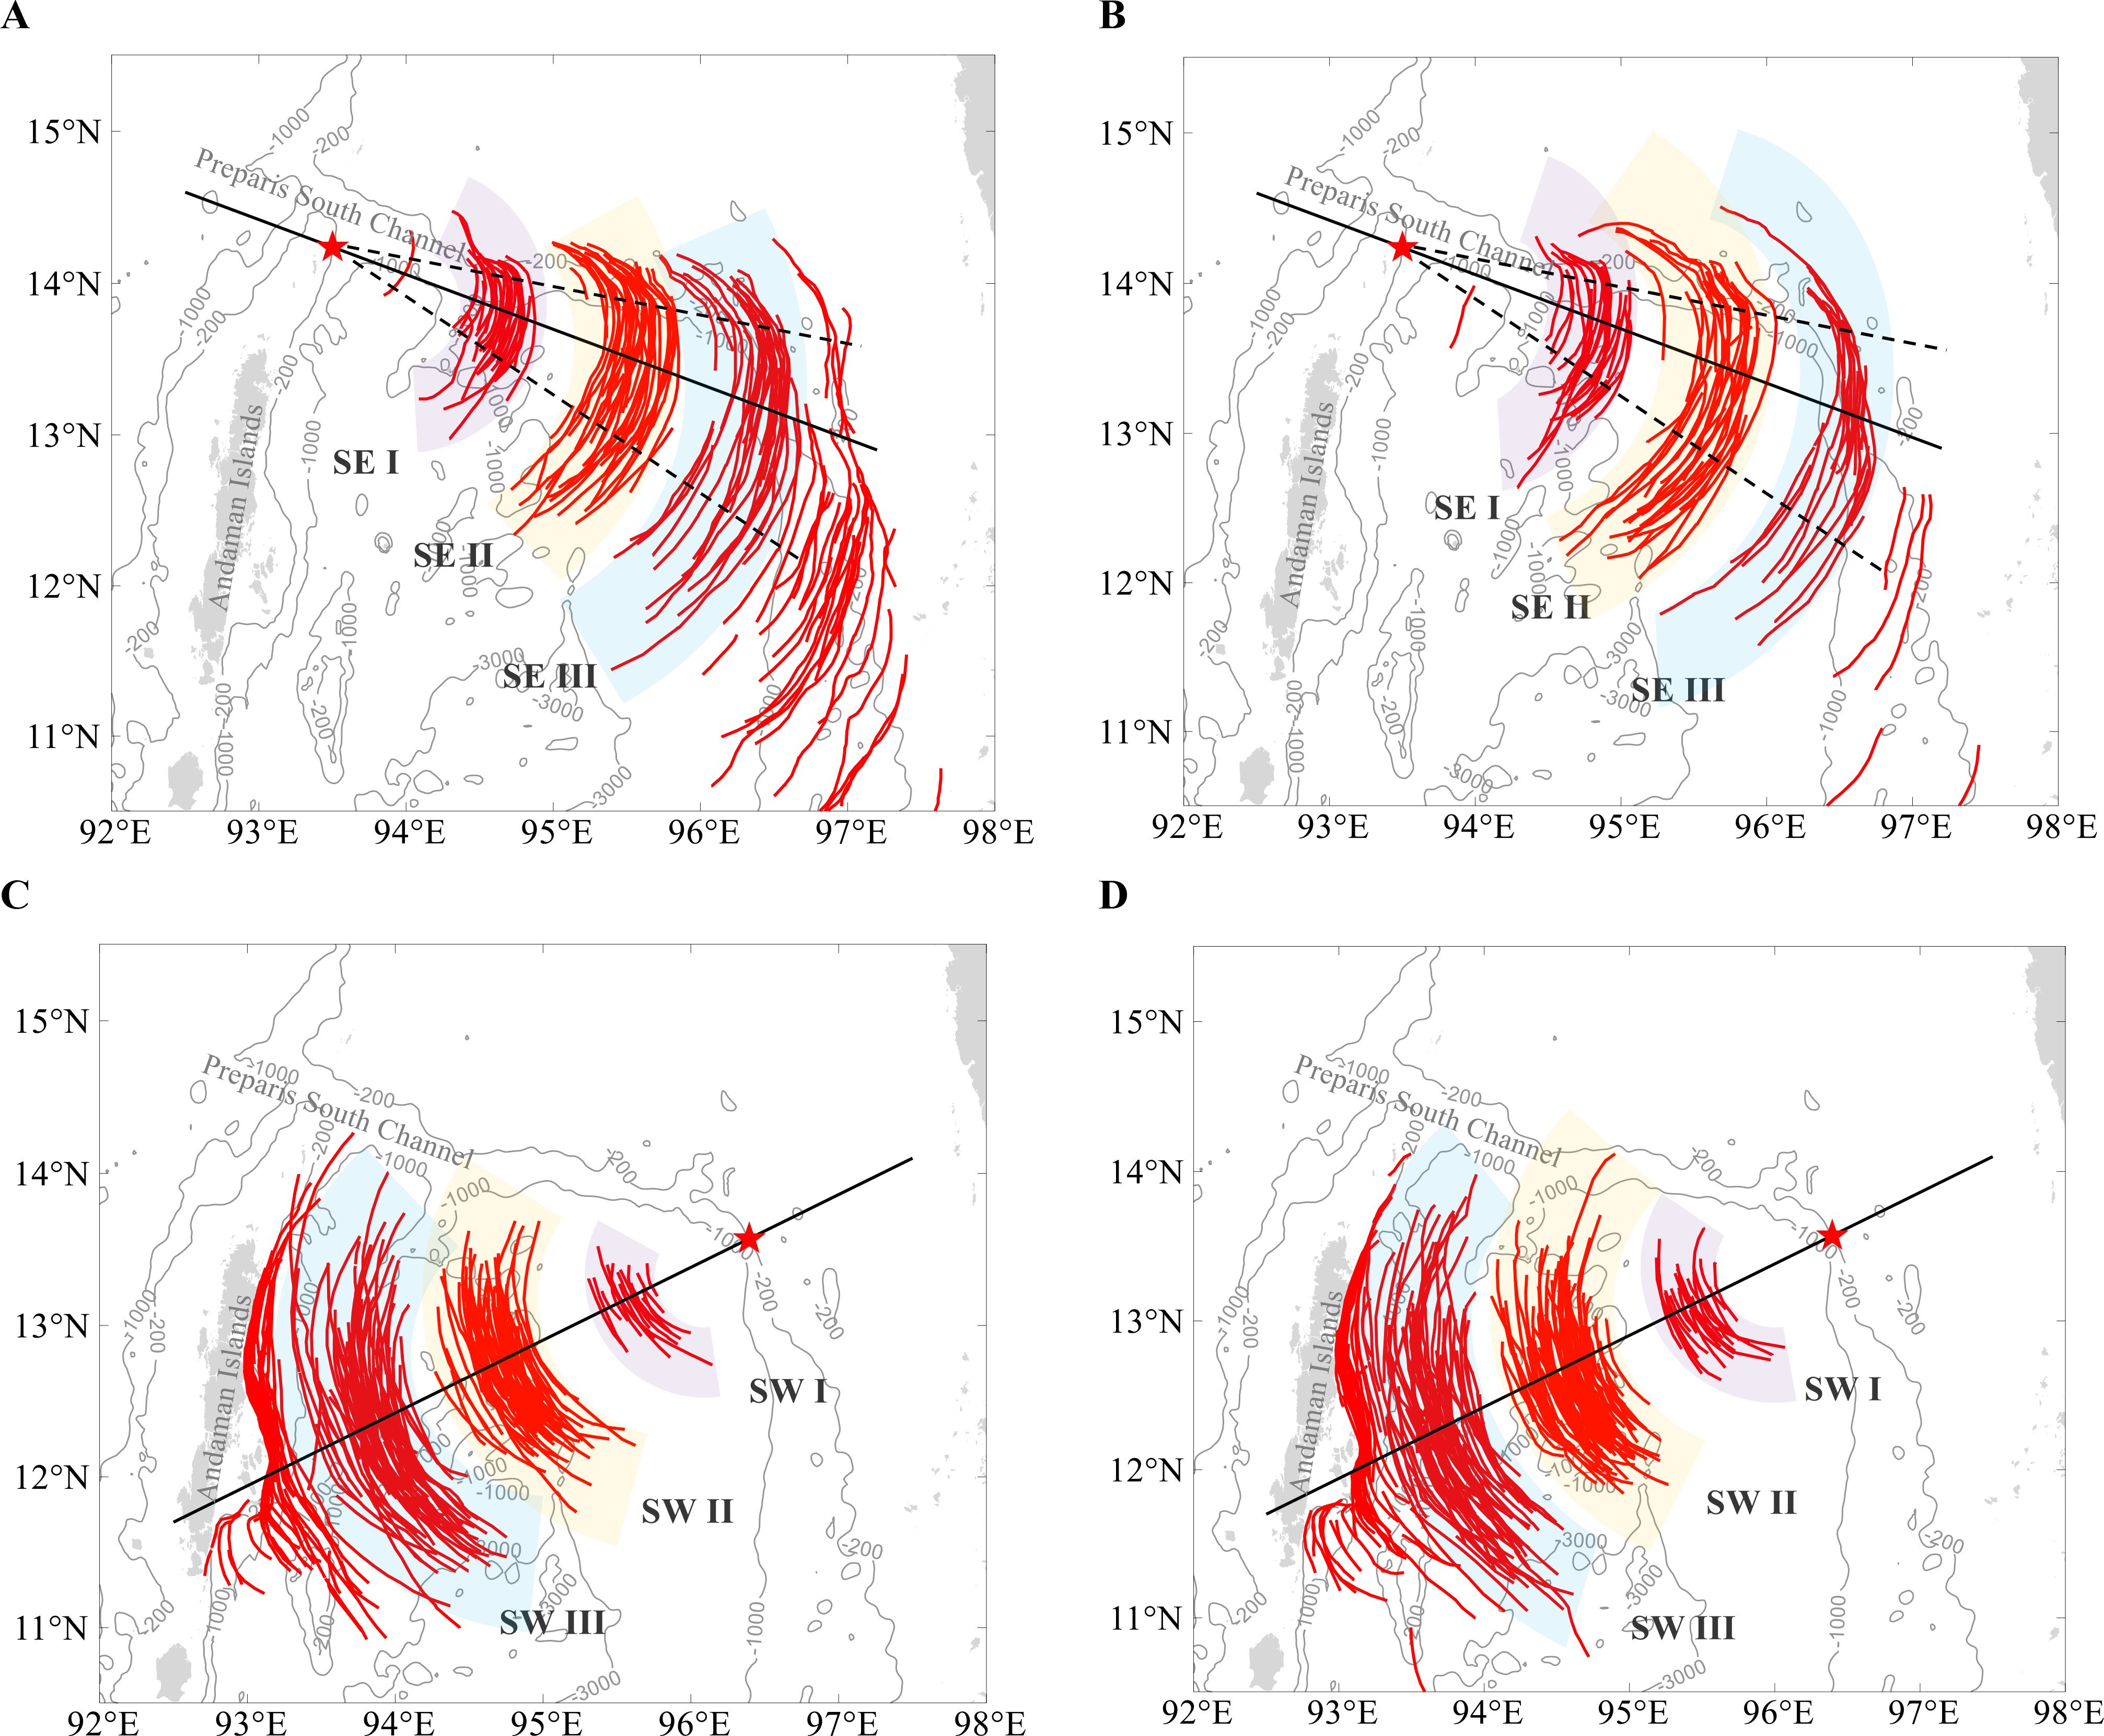
Figure 6. Distribution map of leading ISW crests observed from MODIS data. (A, C) show observations from Terra, and (B, D) show observations from Aqua. Each figure categorizes ISWs into three spatially isolated groups, marked with different shaded areas. These groups are labeled SE I, II, III, and SW I, II, III. The black solid lines represent the transects SE and SW, and the black dashed lines indicate the propagation direction ranges of ISWs, aiding in locating the wave generation sites.
Internal waves propagate outward from their source regions and disintegrate into packets. Influenced by various environmental factors, including topography, background currents, the Earth’s rotation, and ocean stratification, their propagation directions vary, and the wave crests may exhibit irregular arc shapes. In Figure 6, the black solid lines represent the transects SE and SW, and black dashed lines are drawn to approximately delineate the propagation direction ranges of ISWs. The intersection points of these lines indicate potential generation sites, marked by red stars. Figure 6 then suggests that the generation hotspots for Type-SE ISWs are located at the sill south of the Preparis South Channel; for Type-SW ISWs, the hotspots are located at the eastern shelf break.
In Figure 6, we again observe the non-inform spatial distributions of ISWs. The wave crests in each subplot are categorized into three groups (labeled SE I, II, III, or SW I, II, III, with shaded areas), with notable spatial gaps separating these groups. Nearshore ISWs are excluded from our classification and analyses due to wave breaking and altered propagation directions influenced by the eastern shelf and the Andaman Islands. Moreover, a nearly six-year ISWs spatial distribution map of the Andaman Sea from Sun et al. (2019) (see their Figure 4) and a two-year map from Yang et al. (2023) (see their Figure 1) also shown these gaps, although the authors did not specifically focus on these phenomena.
Baines (1982) formulated the generating body force of internal waves commonly employed to identify the sources of the ISWs. Regions with large body forces are typically sites where strong tidal currents slosh over steep, shallow bathymetry, considered as potential generation regions of internal wave. The depth-integrated body force, or Baines force F, is defined as:
Where h is the water depth, is the horizontal gradient operator, is the M2 tidal angular frequency, is the barotropic tidal transport with u and v being the zonal and meridional components of the barotropic tidal velocity, respectively.
We investigate the potential generation sites of ISWs in the northern Anaman Sea by computing the body force F. In fact, while the body force exhibits a semidiurnal oscillation over time, the phase of the forcing is generally not concerned in previous studies (Magalhaes and da Silva, 2012; Raju et al., 2019; Jia et al., 2021). The absolute maximum of the depth-integrated body force for 15 days covering a complete spring and neap tidal cycle, is shown in Figure 7. Red circles in the figure indicate areas with significant body forces, which are important for the generations of internal tides and ISWs in the region. Notably, the -200 and -1000 m depth contours are very close in the shelf break generation site, indicating a steep shelf break. Previous studies have shown that internal tides and packets of ISWs are often generated at those bathymetric hotspots where (Lozovatsky et al., 2012). The potential generation sites of ISWs highlighted in Figure 7 are nearly co-located with those based on remote sensing data shown in Figure 6.
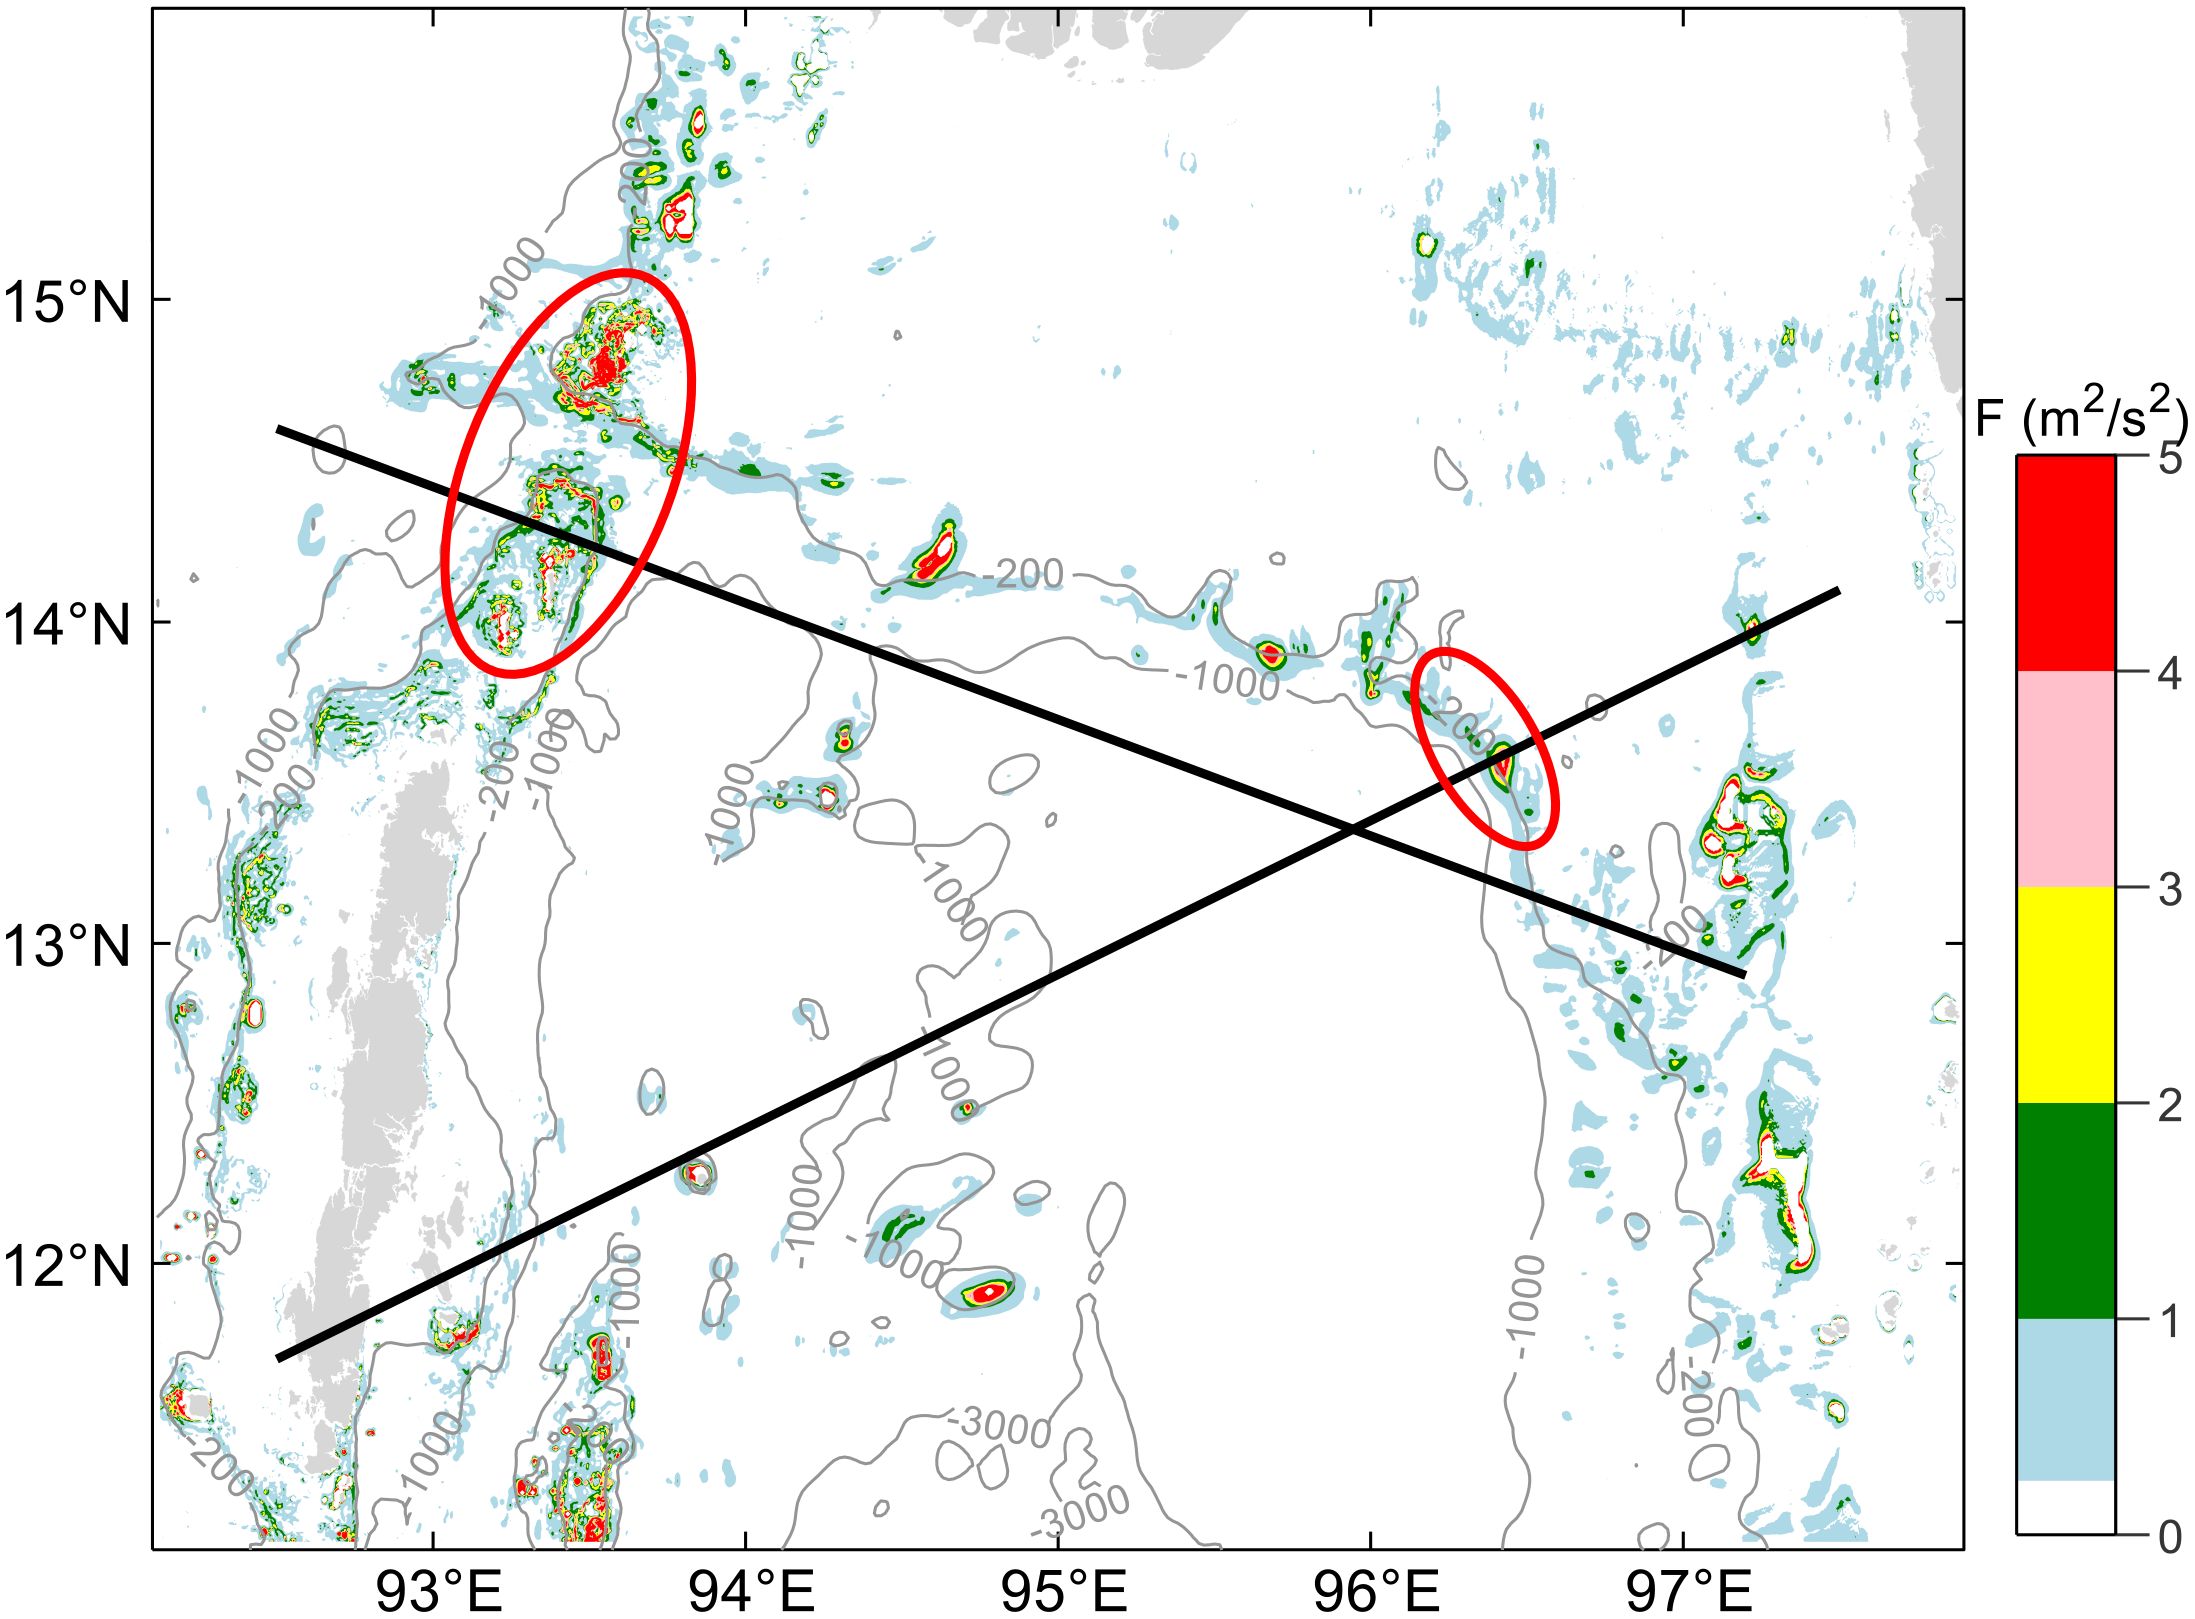
Figure 7. Maximum of the depth-integrated body force over a complete tidal cycle with M2 tidal constituents. The potential generation sites are highlighted in red circles.
3.2 Generation time windows and phase-locking mechanisms
In the previous section, we discussed the spatial gaps separating ISW crests captured by MODIS. In this section, we interpret this phenomenon by tracing the generation time intervals of the ISWs. It is known that the Terra and Aqua satellites have relatively fixed daily crossing times over the Andaman Sea. More precisely, the Terra satellite passes over the northern Andaman Sea at approximately 4:00 UTC, whereas the Aqua satellite crosses around 7:00 UTC. In view of this, we propose a hypothesis about the generation of ISWs: each classified wave group originates from the same generation site at relatively fixed time intervals. This hypothesis implicitly treats topography and ocean stratification as two dominant factors shaping ISW propagation speeds, whereas other environmental factors (e.g., background currents) play a secondary role. If our hypothesis is valid, ISWs would consistently appear in specific regions in MODIS images, leading to the observed spatial gaps.
To verify out hypothesis, we proceed to estimate the generation times of the internal waves. In the remote sensing images, the locations where the leading ISW crests intersect the transect SE or SW provide the propagation distance from the source. Combining this distance with the theoretical nonlinear phase speed of the ISWs, we can estimate the waves’ travel time. Lastly, based on the image capturing times, we can deduce the generation times of the ISWs.
The linear long wave phase speed is calculated from the Sturm–Liouville eigenvalue problem under the Boussinesq approximation, given by (Gill, 1982; Pedlosky, 2003),
Where H is the ocean depth, denotes the buoyancy frequency, which is inferred from HYCOM and averaged along the transects SE and SW, represents the modal structure function of linear waves bounded by unity.
The nonlinear phase speed can then be calculated as,
Following Tensubam et al. (2021), we assume the amplitude of ISW to be 60 m in the deep waters () and 20 m in the shallow waters () to calculate the nonlinear phase speed . The nonlinear coefficient in Equation (4) is given by (Jackson, 2009),
Four typical MODIS images are selected to show the travel time and generation time of ISWs near their generation sites (see Figure 8). Newly generated ISWs, compared to those that have traveled further, are less influenced by external factors, allowing for a more accurate estimation of their generation times. The insets show the tidal current velocities at the generation sites along the transects, with positive values toward the eastern shelf. The insets show that both types of internal waves originate around the time of slack tide. However, type-SE internal waves initiate during the tide reversal from ebb to flood tide, whereas type-SW internal waves initiate during the tide reversal from flood to ebb tide. This indicates that both types of ISWs in the northern Andaman Sea are phase-locked with semidiurnal tides. These phase-locking patterns are consistent with the numerical simulation results detailed in Section 4.
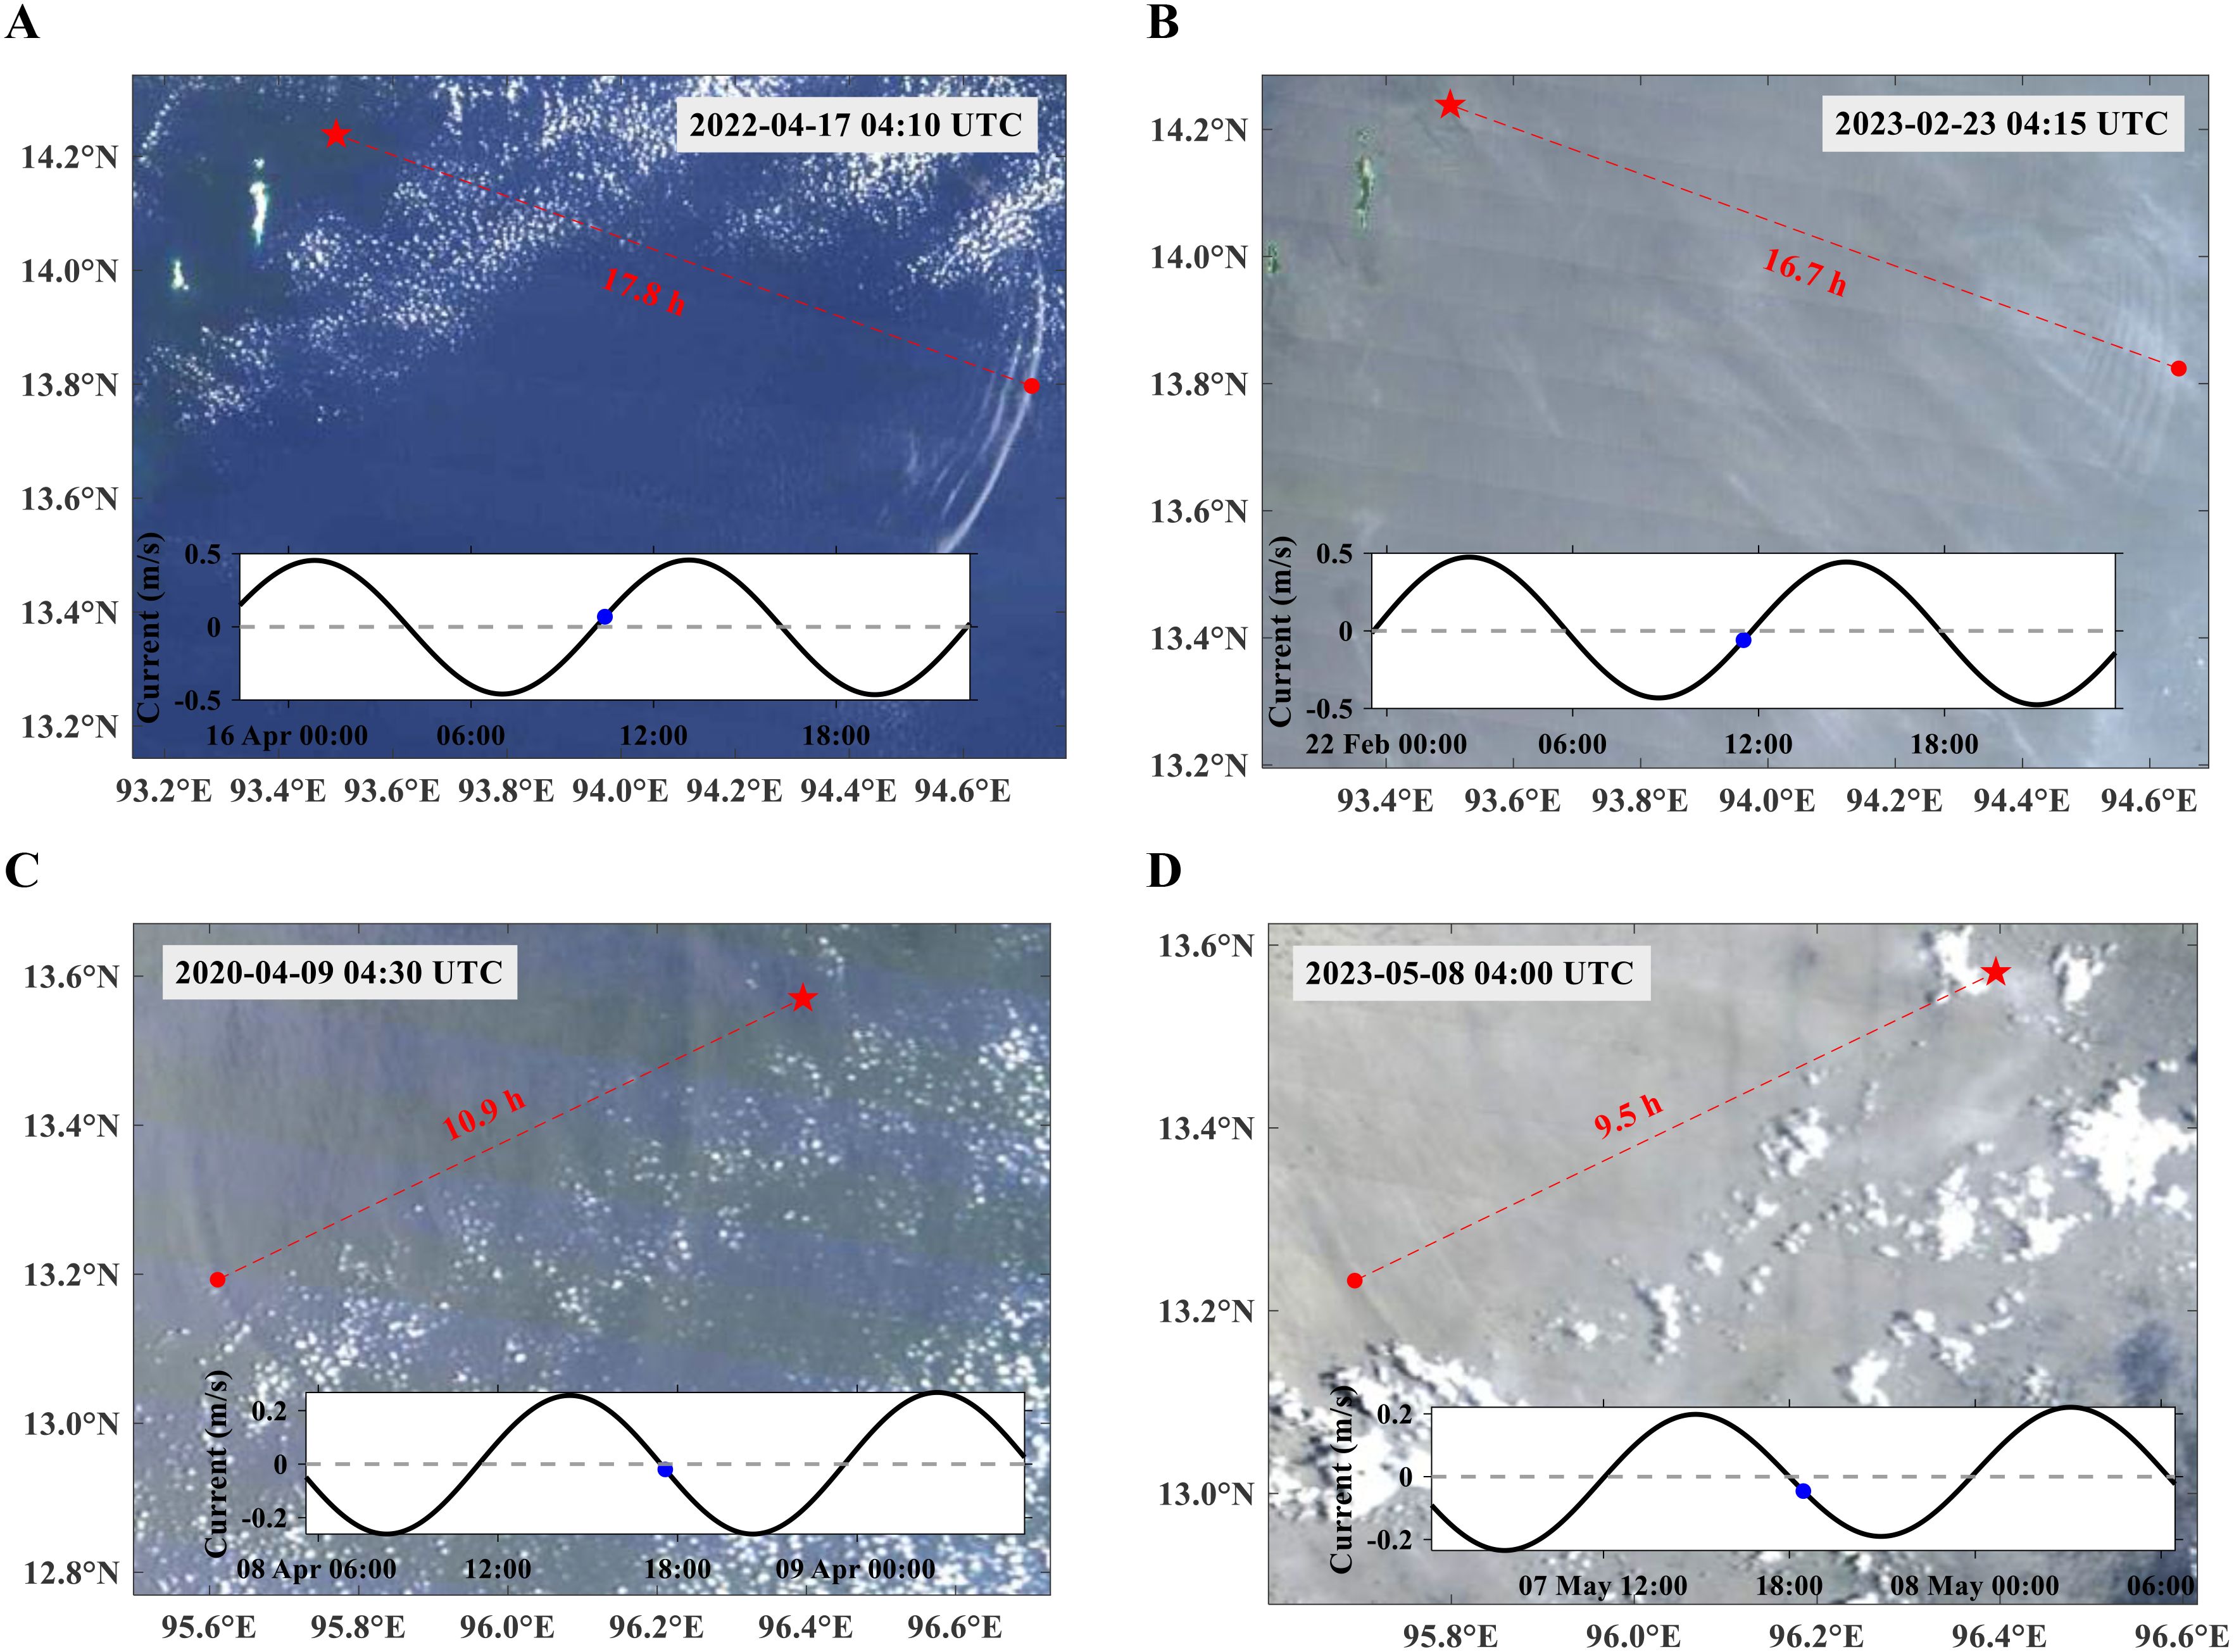
Figure 8. MODIS images of ISWs near their generation sites. (A, B) show type-SE ISWs, and (C, D) show type-SW ISWs. The capturing times are indicated on top of each image. Red stars mark the generation sites, and the predicted travel times are shown within the images. The inset panels show time series of tidal current velocities, with blue dots indicating the predicted generation times of ISW.
We then extend the above analyses to the four years of MODIS data. Detected ISWs were categorized within dashed boxes according to Figure 6, and shown in Figure 9. Figures 9A, B show that adjacent ISW groups are separated by approximately one semidiurnal tidal cycle. Since the Terra satellite crosses three hours earlier than the Aqua satellite each day, ISWs within a group appear at earlier times and positions in Terra images. The lifecycle of type-SE ISWs exceeds 40 hours from the sill to the continental shelf, while type-SW ISWs have a lifecycle of around 40 hours from the shelf break to the Andaman Islands.
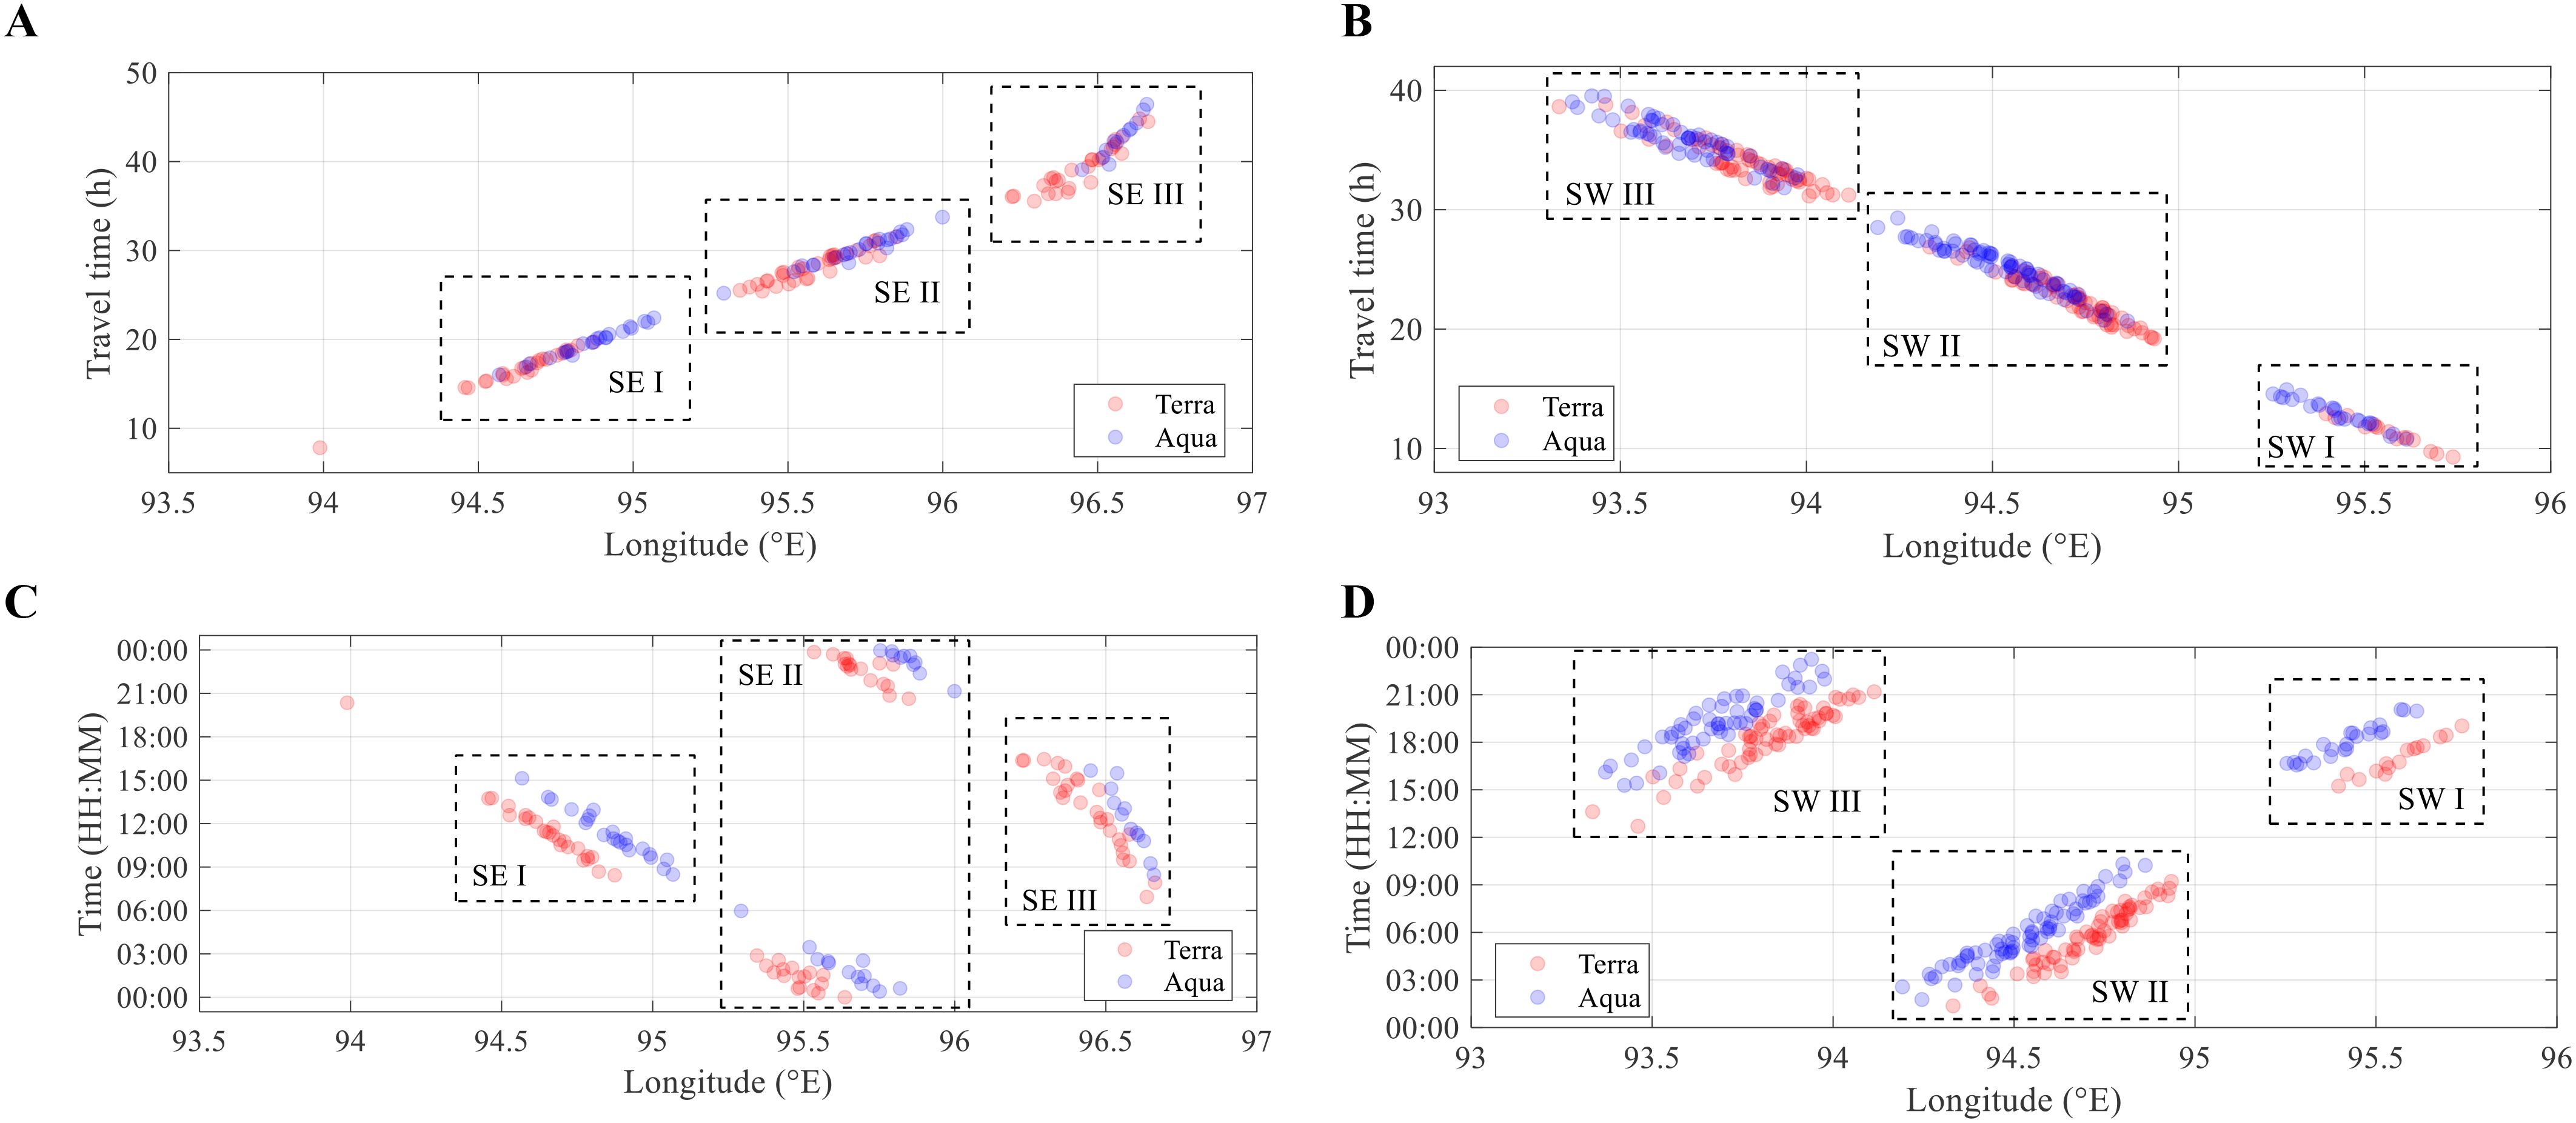
Figure 9. Calculated travel times [(A, B), unit: hours] and generation times [(C, D), UTC] of ISWs in MODIS images, 2020-2023. The left panels show type-SE ISWs, while the right panels show type-SW ISWs.
The generation times of ISWs are determined by their travel times and capturing times (see Figures 9C, D). Intriguingly, both Terra and Aqua data show that the generations are confined to specific time windows: Type-SE I (8:00 to 16:00), SE II (20:00 to 6:00 the next day), SE III (6:00 to 17:00); Type-SW I (15:00 to 21:00), SW II (1:00 to 11:00), SW III (12:00 to 0:00). These results validate our previously proposed generation time hypothesis, leading to spatial gaps of ISW groups in MODIS observations.
Hyder et al. (2005) conducted a three-month in-situ measurement in the northeast of the Andaman Islands. They revealed that internal solitons only occurred during spring tides when the local tidal range exceeded 1.5 m, and their probability of occurrence increased with the tidal range. Motivated by their study, we also analyze the correlation between the occurrence of ISWs and tidal range using remote sensing observations (see Figures 10). Unlike in previous study, the focus here is on the tidal range at the generation site and generation time of ISWs rather than the local tidal range. Similarly, ISWs only occur during spring tides: type-SE ISWs occur only when the tidal range exceeds 1.3 m, while type-SW ISWs occur only when the tidal range exceeds 1.4 m. The probability of ISWs occurrence in a tidal range interval is calculated by dividing the number of ISWs occurrence by the number of slack tides occurrence over four years. Figures 10 also show that the probability of ISWs occurrence increases with the tidal range. However, there is a dip in the 2.3-2.4 m interval, which may be due to the limited amount of data.
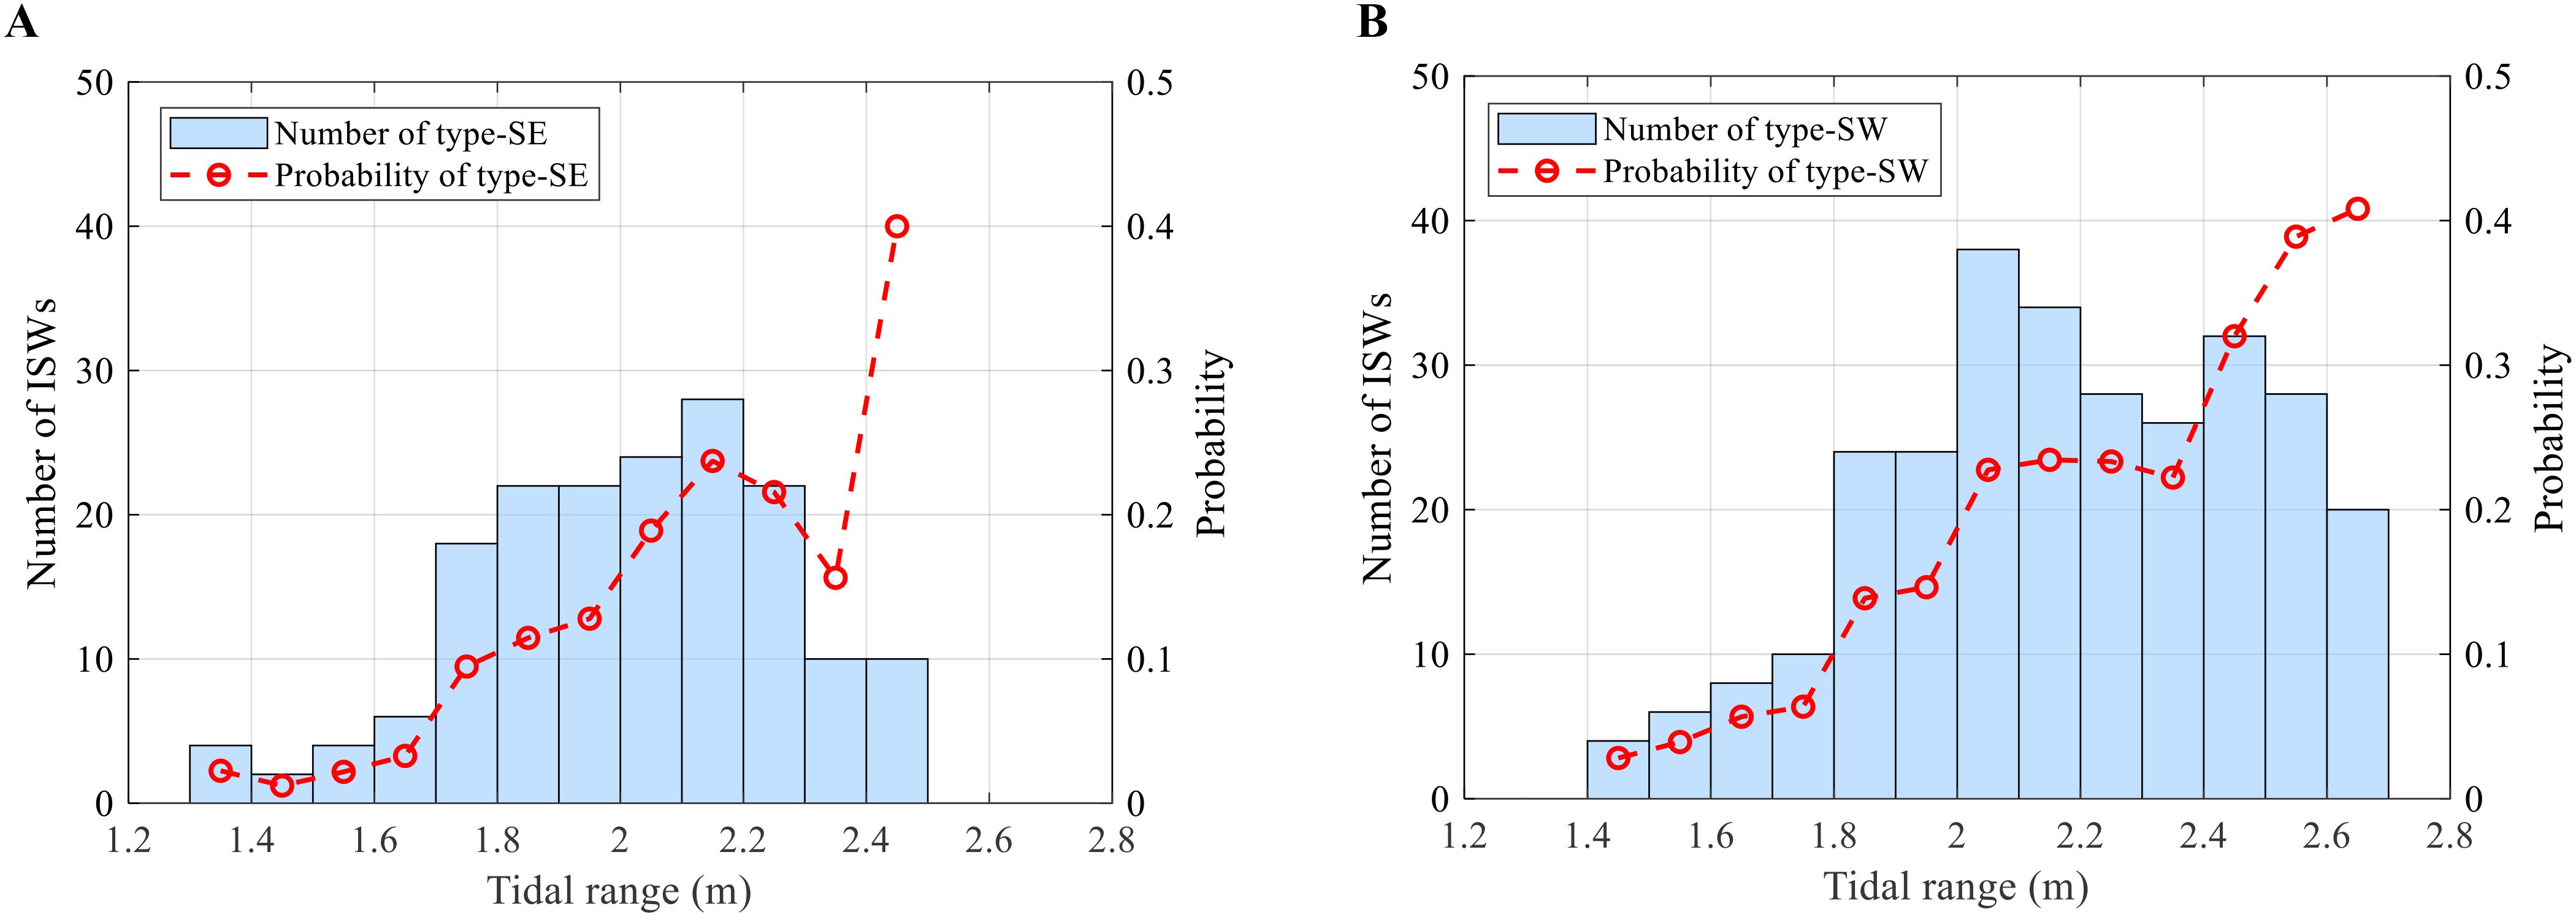
Figure 10. The distribution of (A) type-SE ISWs and (B) type-SW ISWs with tidal range. The blue bars indicate the number of ISWs (left y-axis), while the red circles and dashed lines indicate their probability of occurrence (right y-axis).
Figure 8 shows that ISWs are phase-locked with semidiurnal tides, generated around the time of slack tide in the northern Andaman Sea. Figures 9C, D show that the generations of ISWs are confined to specific time windows. Therefore, it is likely that these specific time windows are related to the times of slack tides. Figure 11A shows the time distribution of slack tide at the generation source of Type-SE ISWs. During spring tides, when the tidal range exceeds 1.3 m (the threshold for ISWs to be observed in MODIS images), the fitted Gaussian distribution shows that the probability of slack tide occurrence peaks twice, at 11:00 and 23:00. Specifically, the SE I and III groups align with the 11:00 peak, whereas the SE II group aligns with the 23:00 peak. Figure 11B shows the time distribution of Type-SW ISW sources. The fitted Gaussian distribution also shows two peaks: one at 5:30, to which the SW II group corresponds, and the other at 17:30, to which the SW I and III groups correspond. Overall, the generation time windows of ISWs are closely related to the time distribution of slack tide. This further confirms that the generation time windows and the gaps in MODIS observations are caused by ISWs phase-locking with semidiurnal tides.
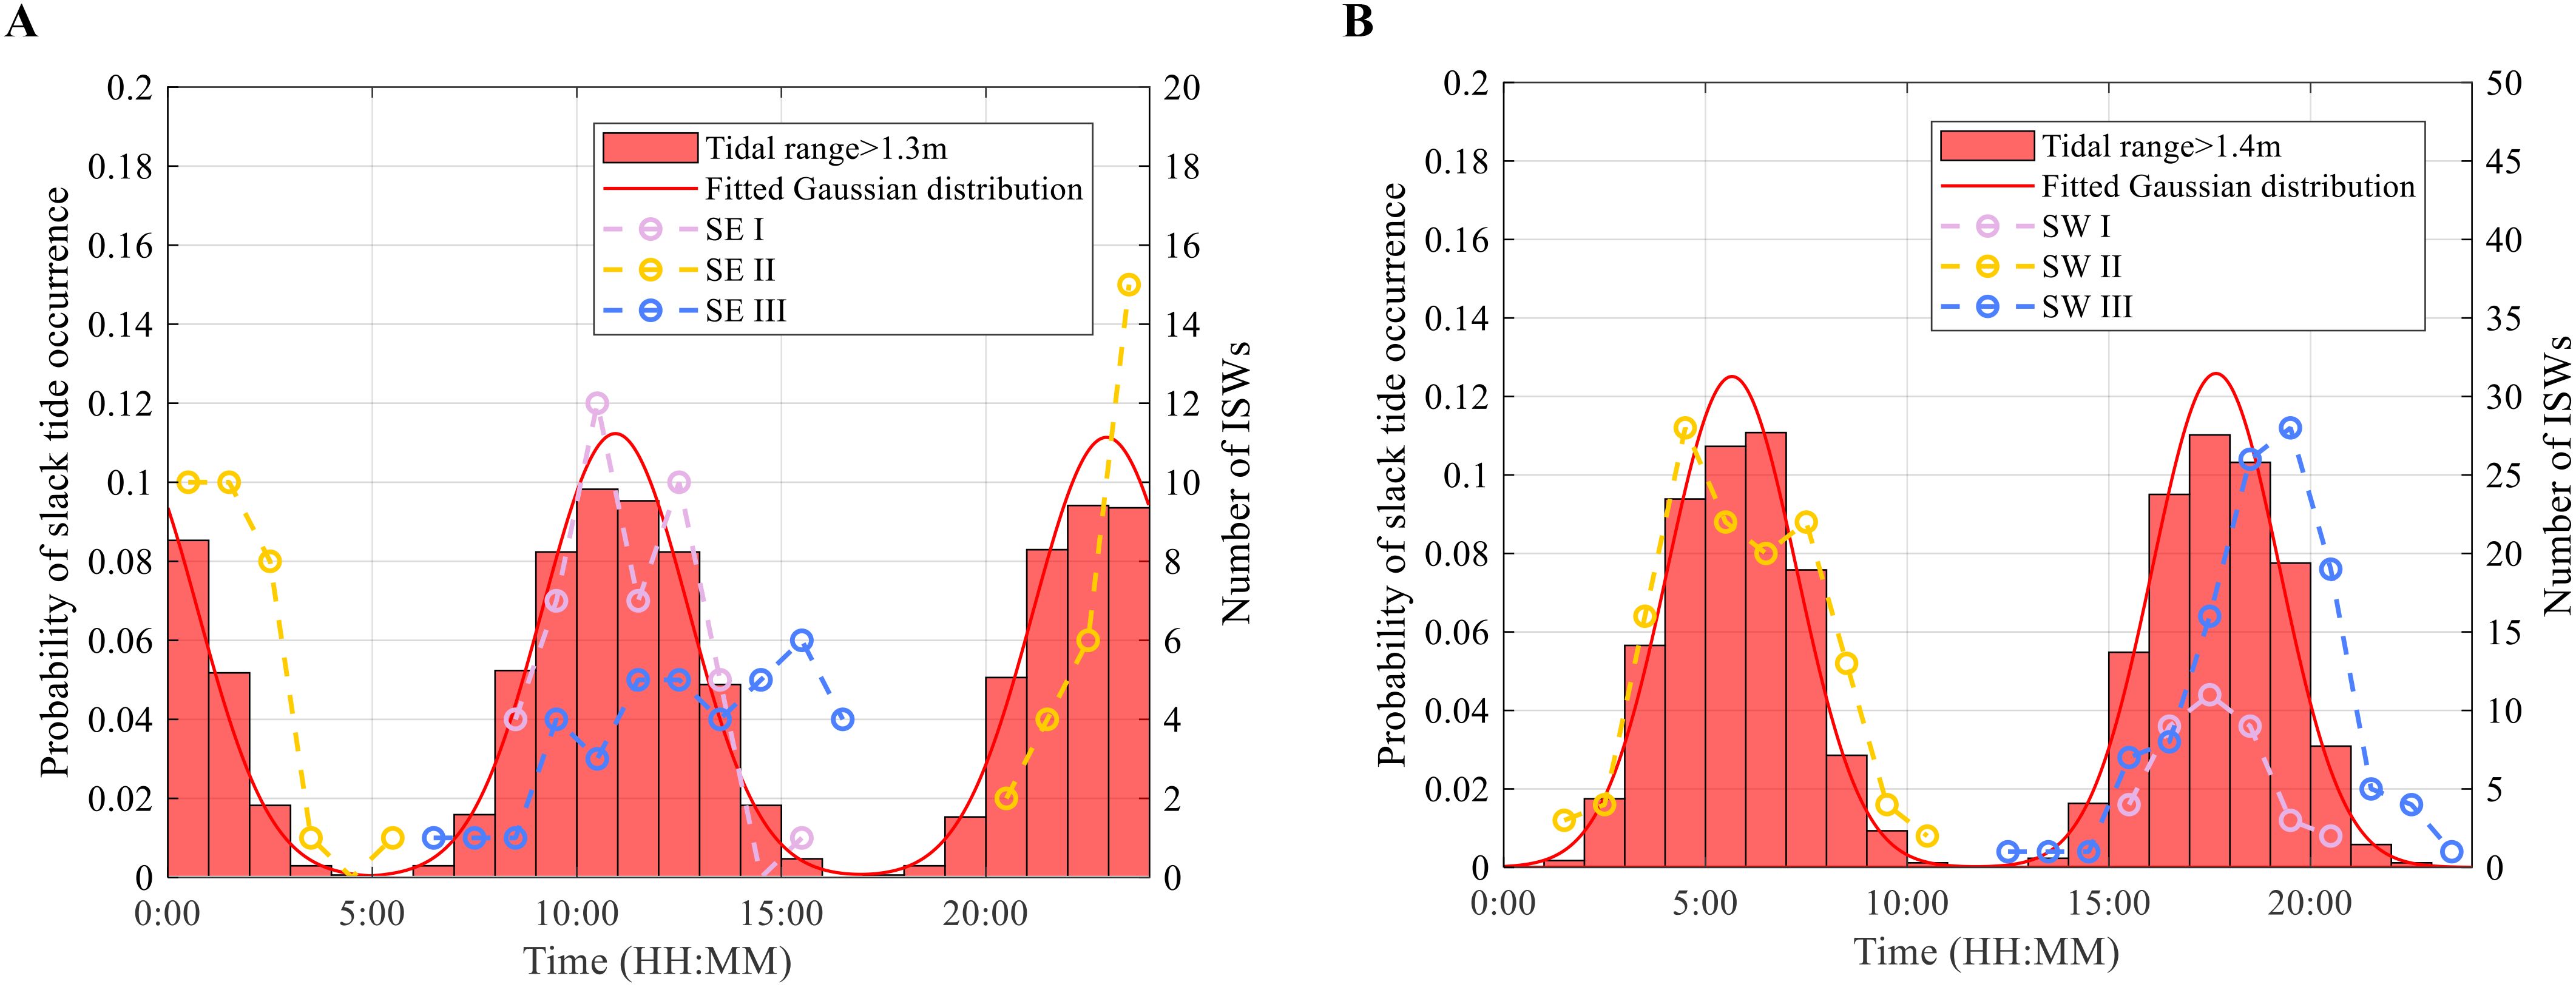
Figure 11. Time distribution of slack tide and ISWs generation. (A) shows time distribution of slack tide (reversal from ebb to flood tide) at the sill and the generation of type-SE ISWs, while (B) shows time distribution of slack tide (reversal from flood to ebb tide) at the shelf break and the generation of type-SW ISWs. The red bars indicate the probability of slack tide occurrence for tidal ranges greater than (A) 1.3 m or (B) 1.4 m (left y-axis), with a fitted Gaussian distribution shown by the red solid curve. The circles and dashed curves indicate the number of ISWs occurrences (right y-axis).
4 Discussion
To further elucidate the generation process of ISWs, this section documents the numerical model solutions of ISWs in the northern Andaman Sea and the generation mechanisms.
4.1 Generation process of the type-SE ISWs
The Hovmöller diagram of temperature at a depth of -90 m in model case SE, as shown in Figure 12, illustrate the spatio-temporal evolution of internal tides propagating away from the sill. The diagonal patterns of temperature indicate that the internal waves initiate around the slack tide (reversal from ebb to flood tide) near the sill, which is consistent with the generation time derived from remote sensing. The mode-1 internal wave phase speeds, inferred from slopes of diagram (via the slope of red dashed lines in Figure 12A), are approximately 1.9 m/s, which are close to the theoretical values. The mode-1 internal wave then splits into a packet of ISWs at approximately km.
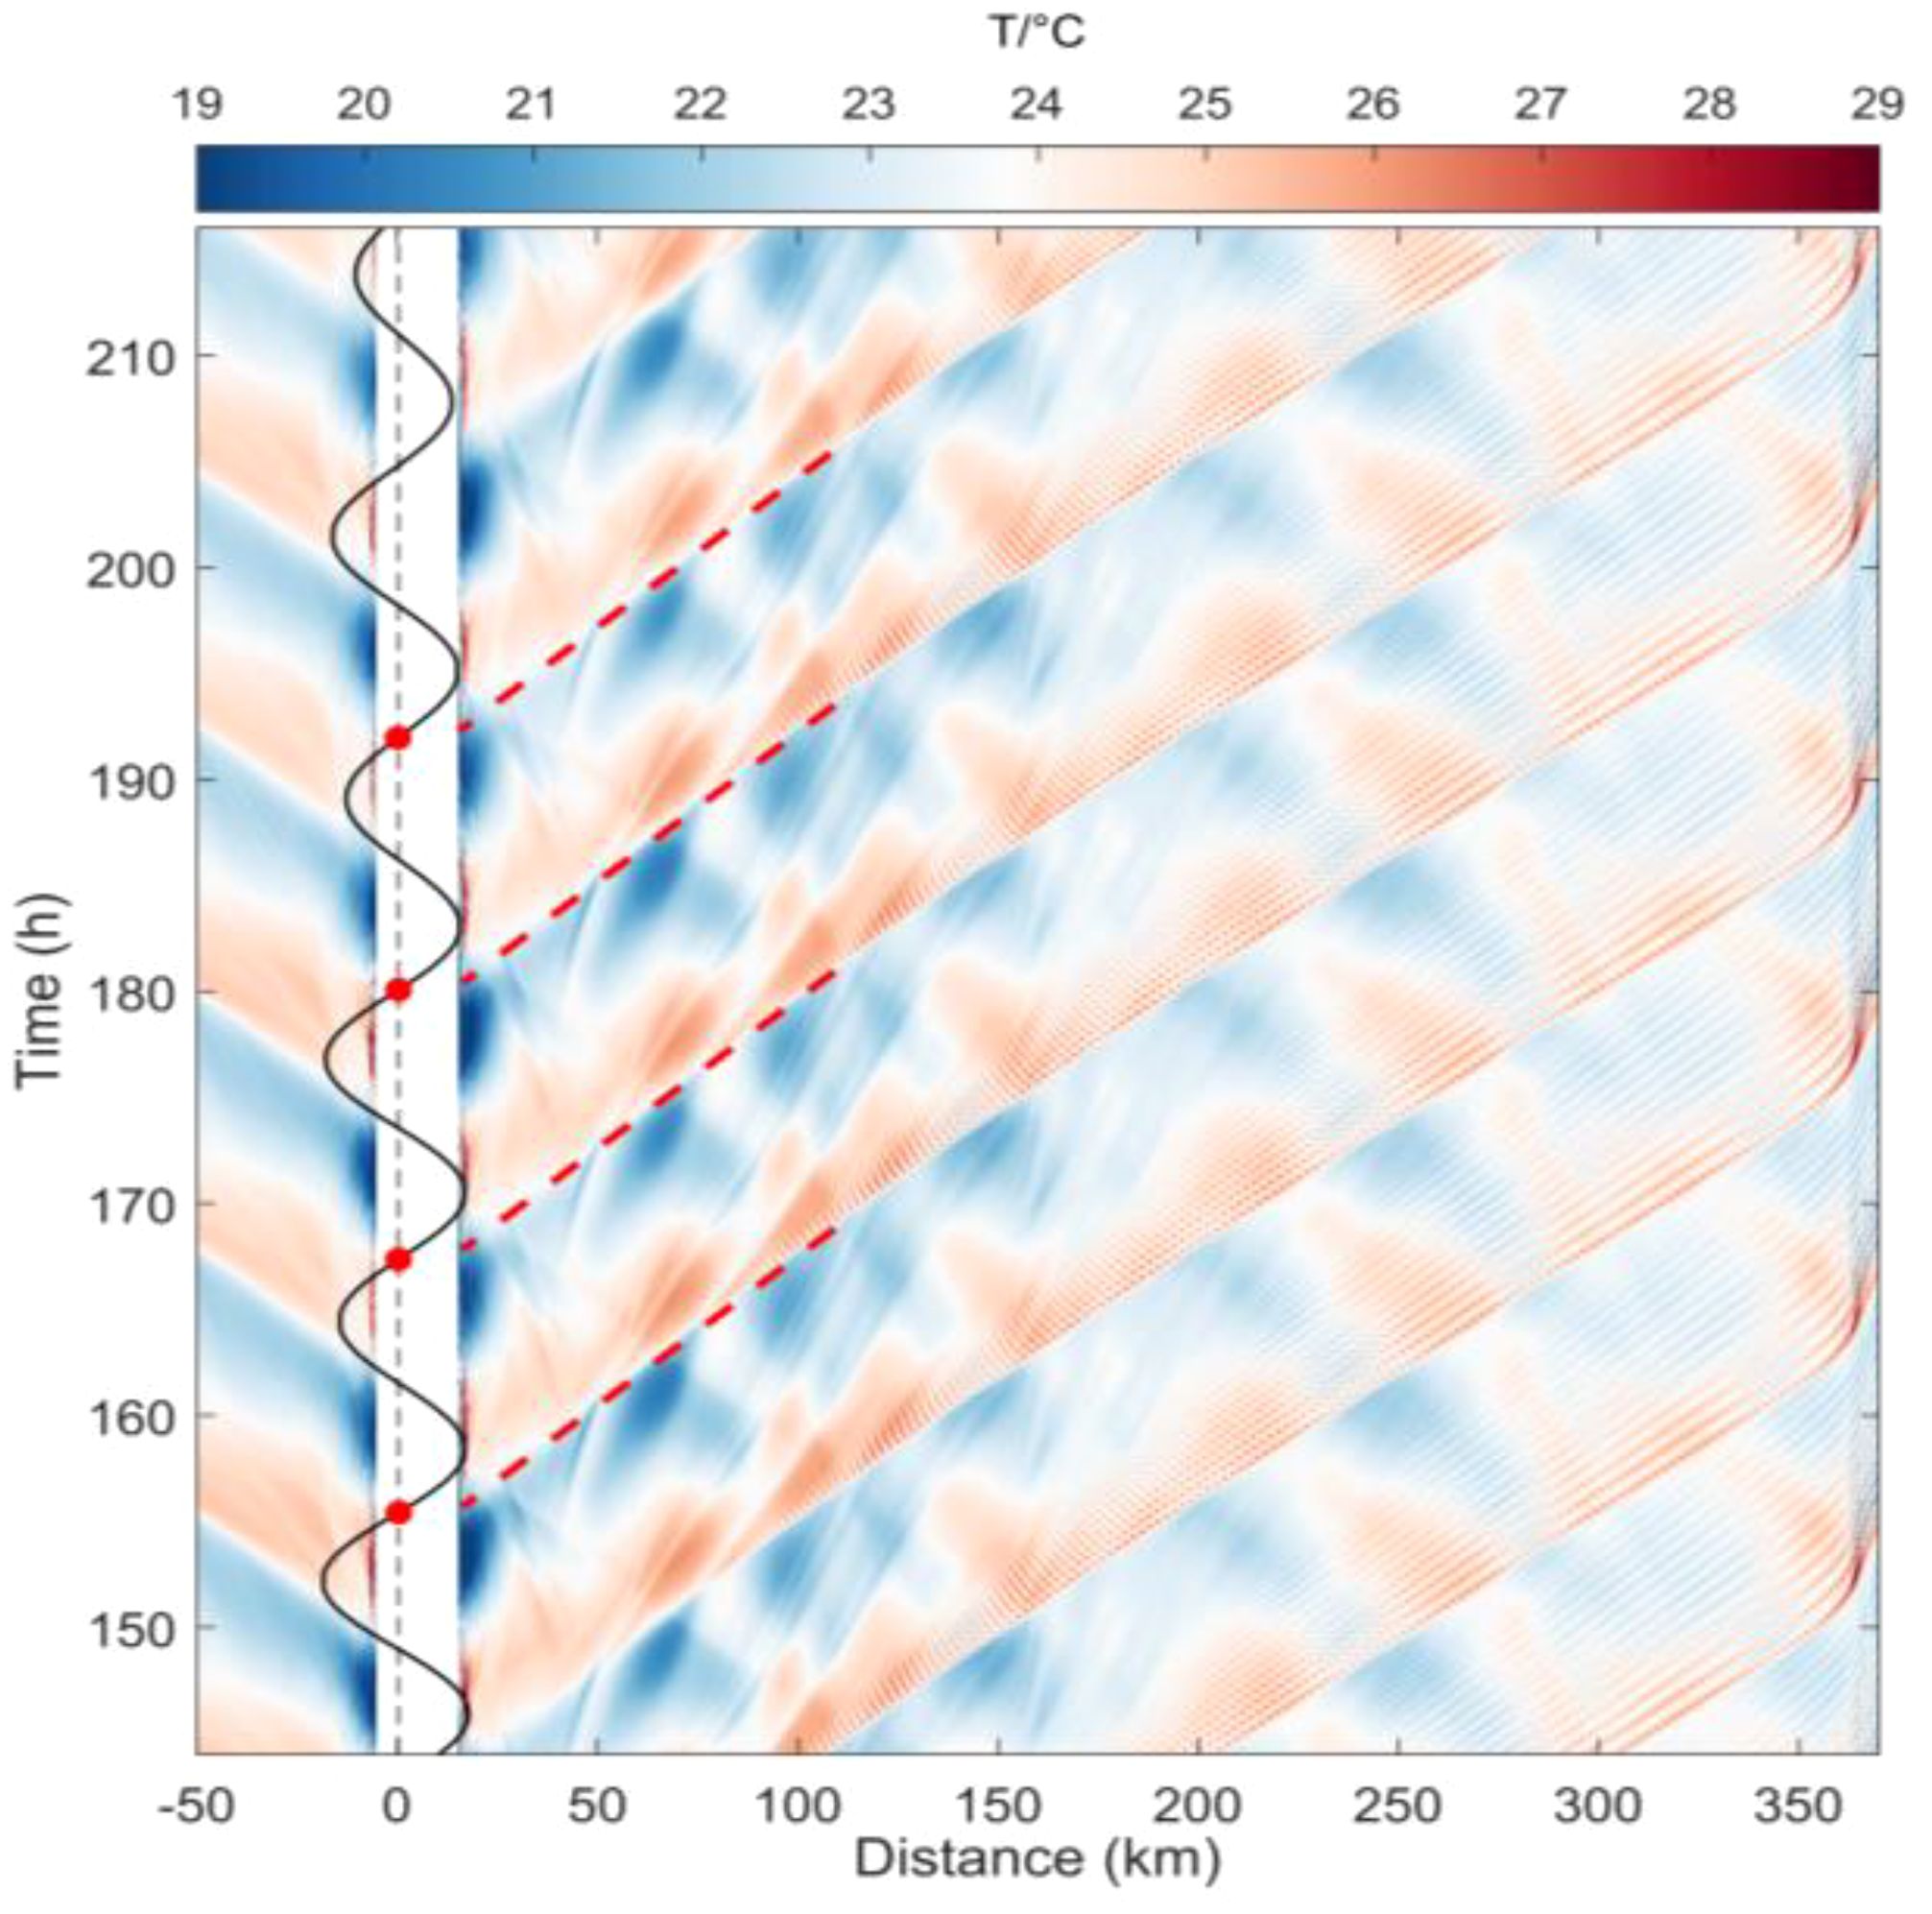
Figure 12. Hovmöller diagram of temperature at a depth of -90 m for the case SE. The broad white stripe indicates the locations of the sill. The red dashed lines indicate the propagation of the type‐SE ISWs, which can be traced back to the generation time, as suggested by the red solid circles on the time series of tidal flow above the sill.
Internal tide ray trajectories which are overlaid on the model transect (see Figures 13, 14), are computed from its slope s to the horizontal, given by (Cole et al., 2009; Pingree and New, 1991),
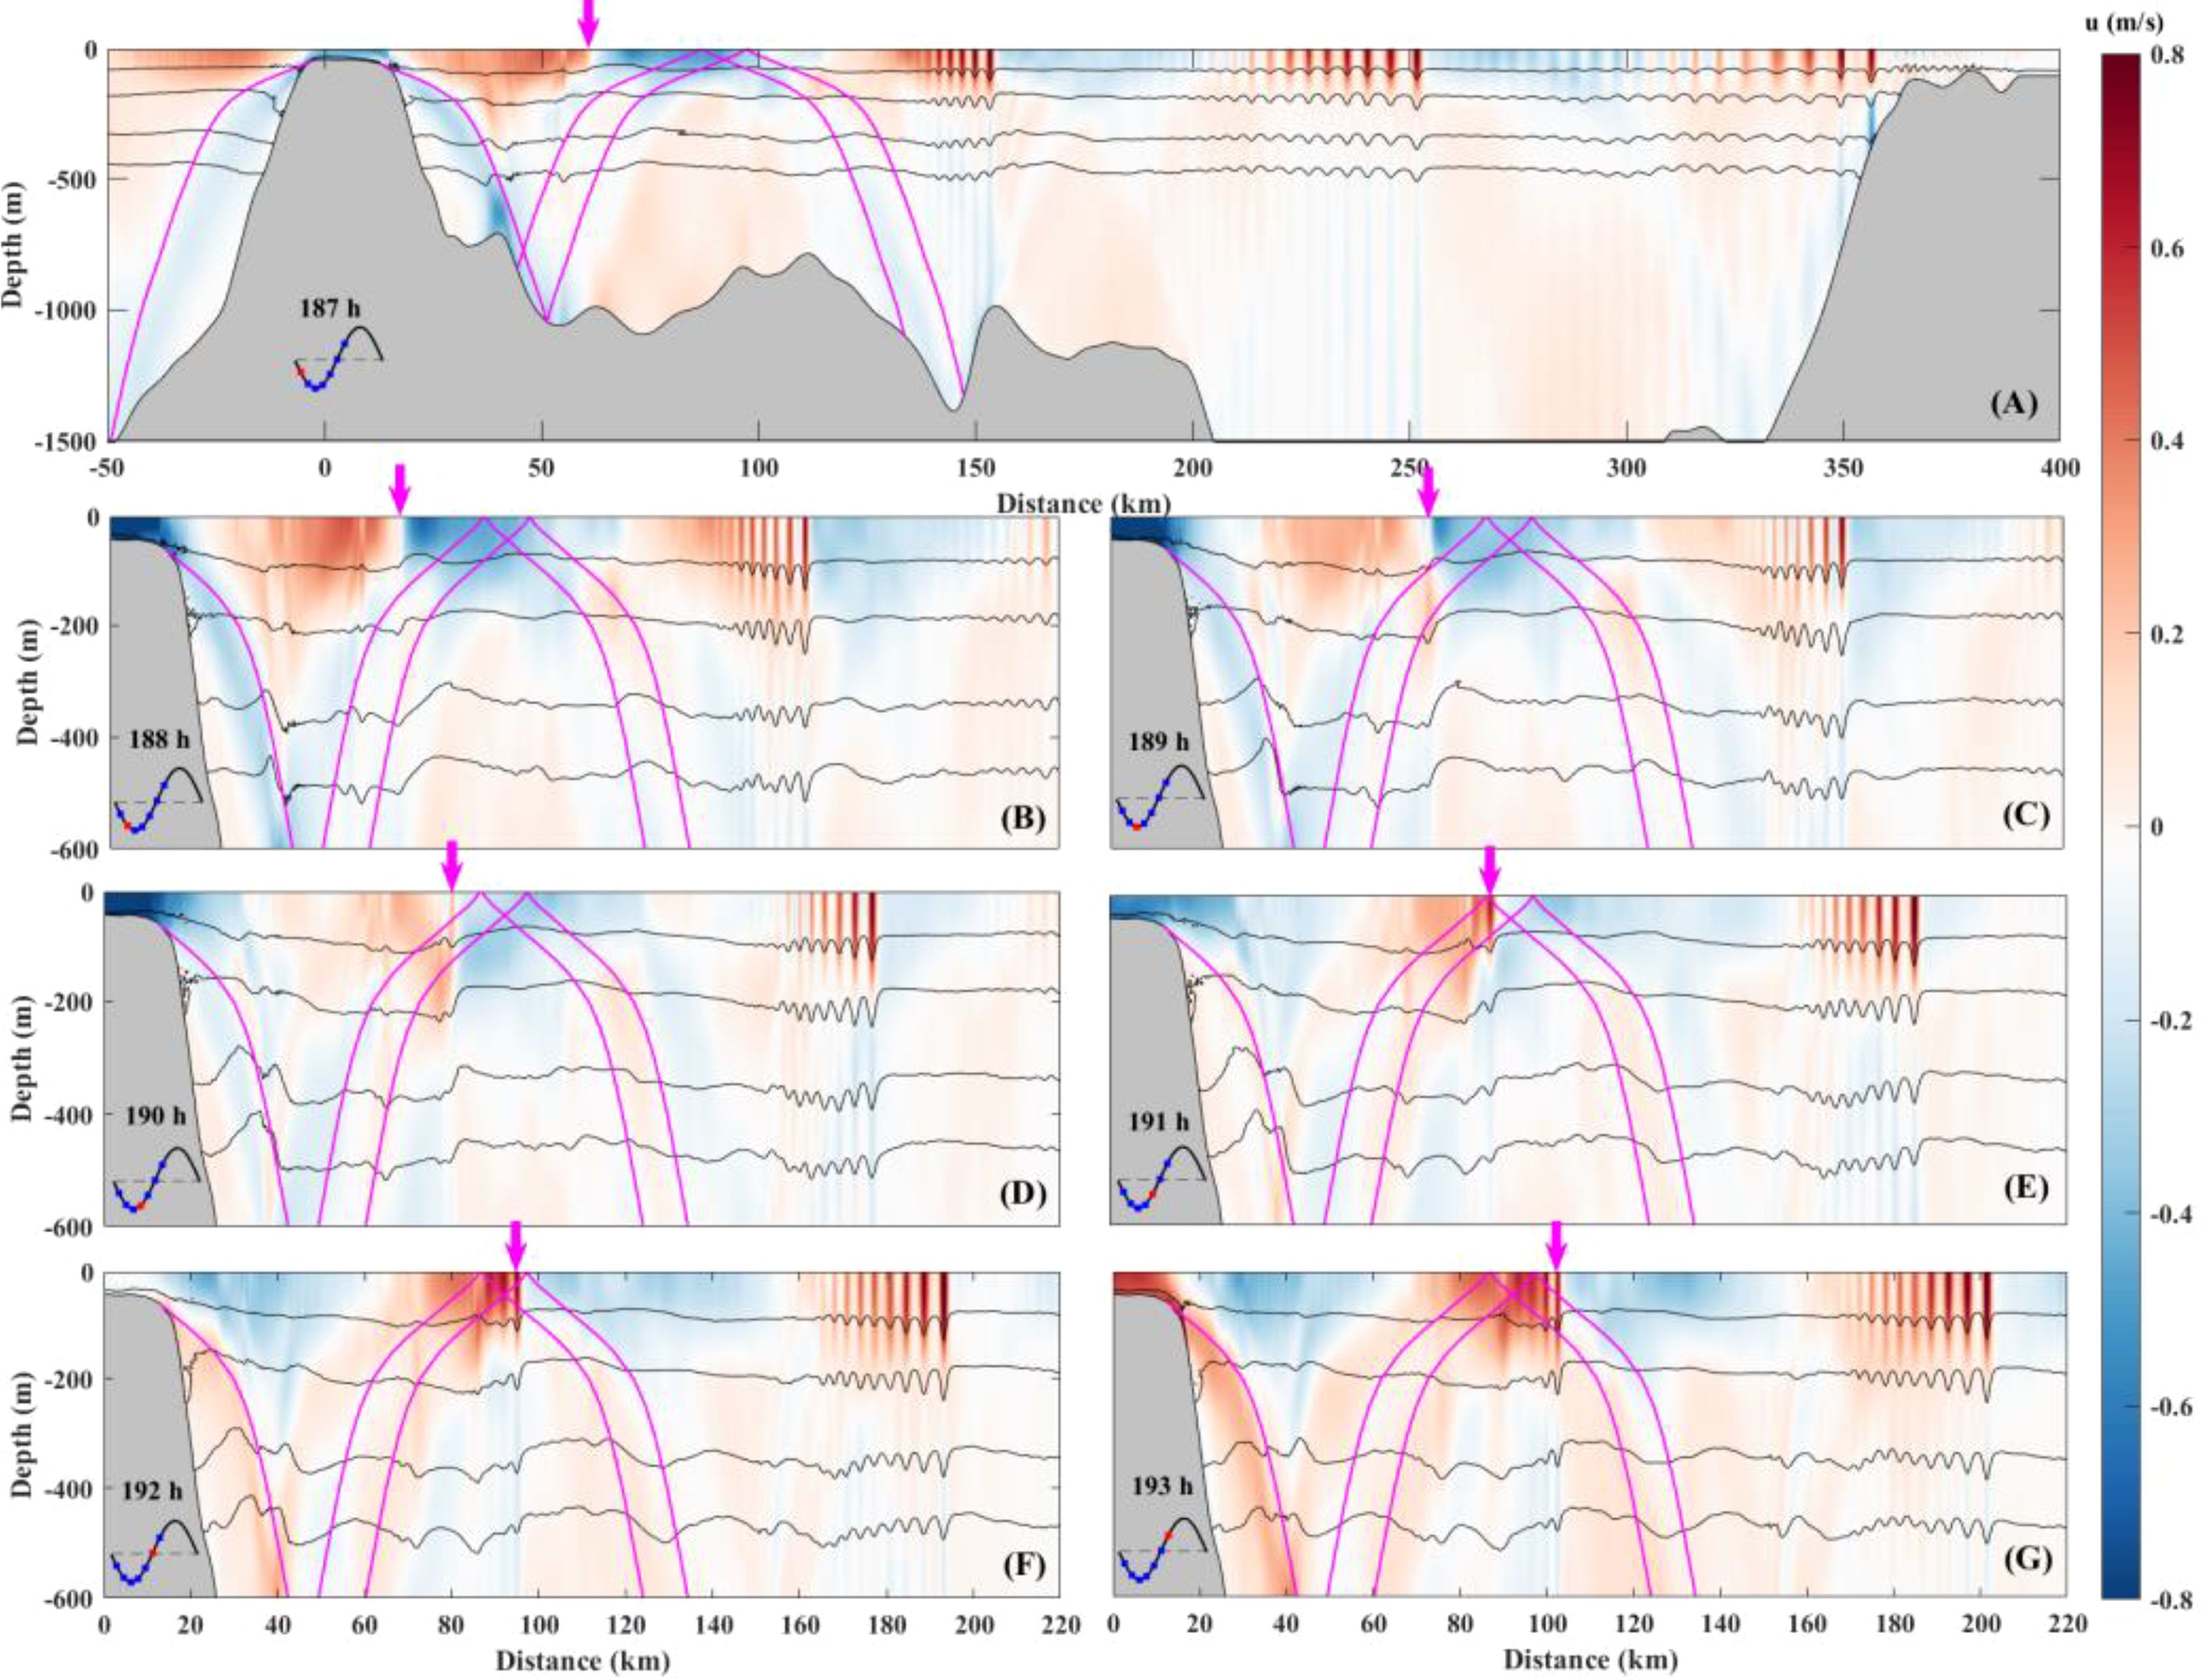
Figure 13. Time evolution of horizontal velocities (shades) and temperature isotherms (contours) in model case SE over a time sequence of 6 h. (A–G) represent the results of the model running for 187 to 193 hours, respectively. The magenta line denotes the M2 internal tidal raypath. The magenta arrows follow the density front disintegrating into a packet of ISWs. Barotropic tidal currents and corresponding times for each panel are indicated in the insets, with the red dots denoting the phase of the tidal cycle for each subplot.
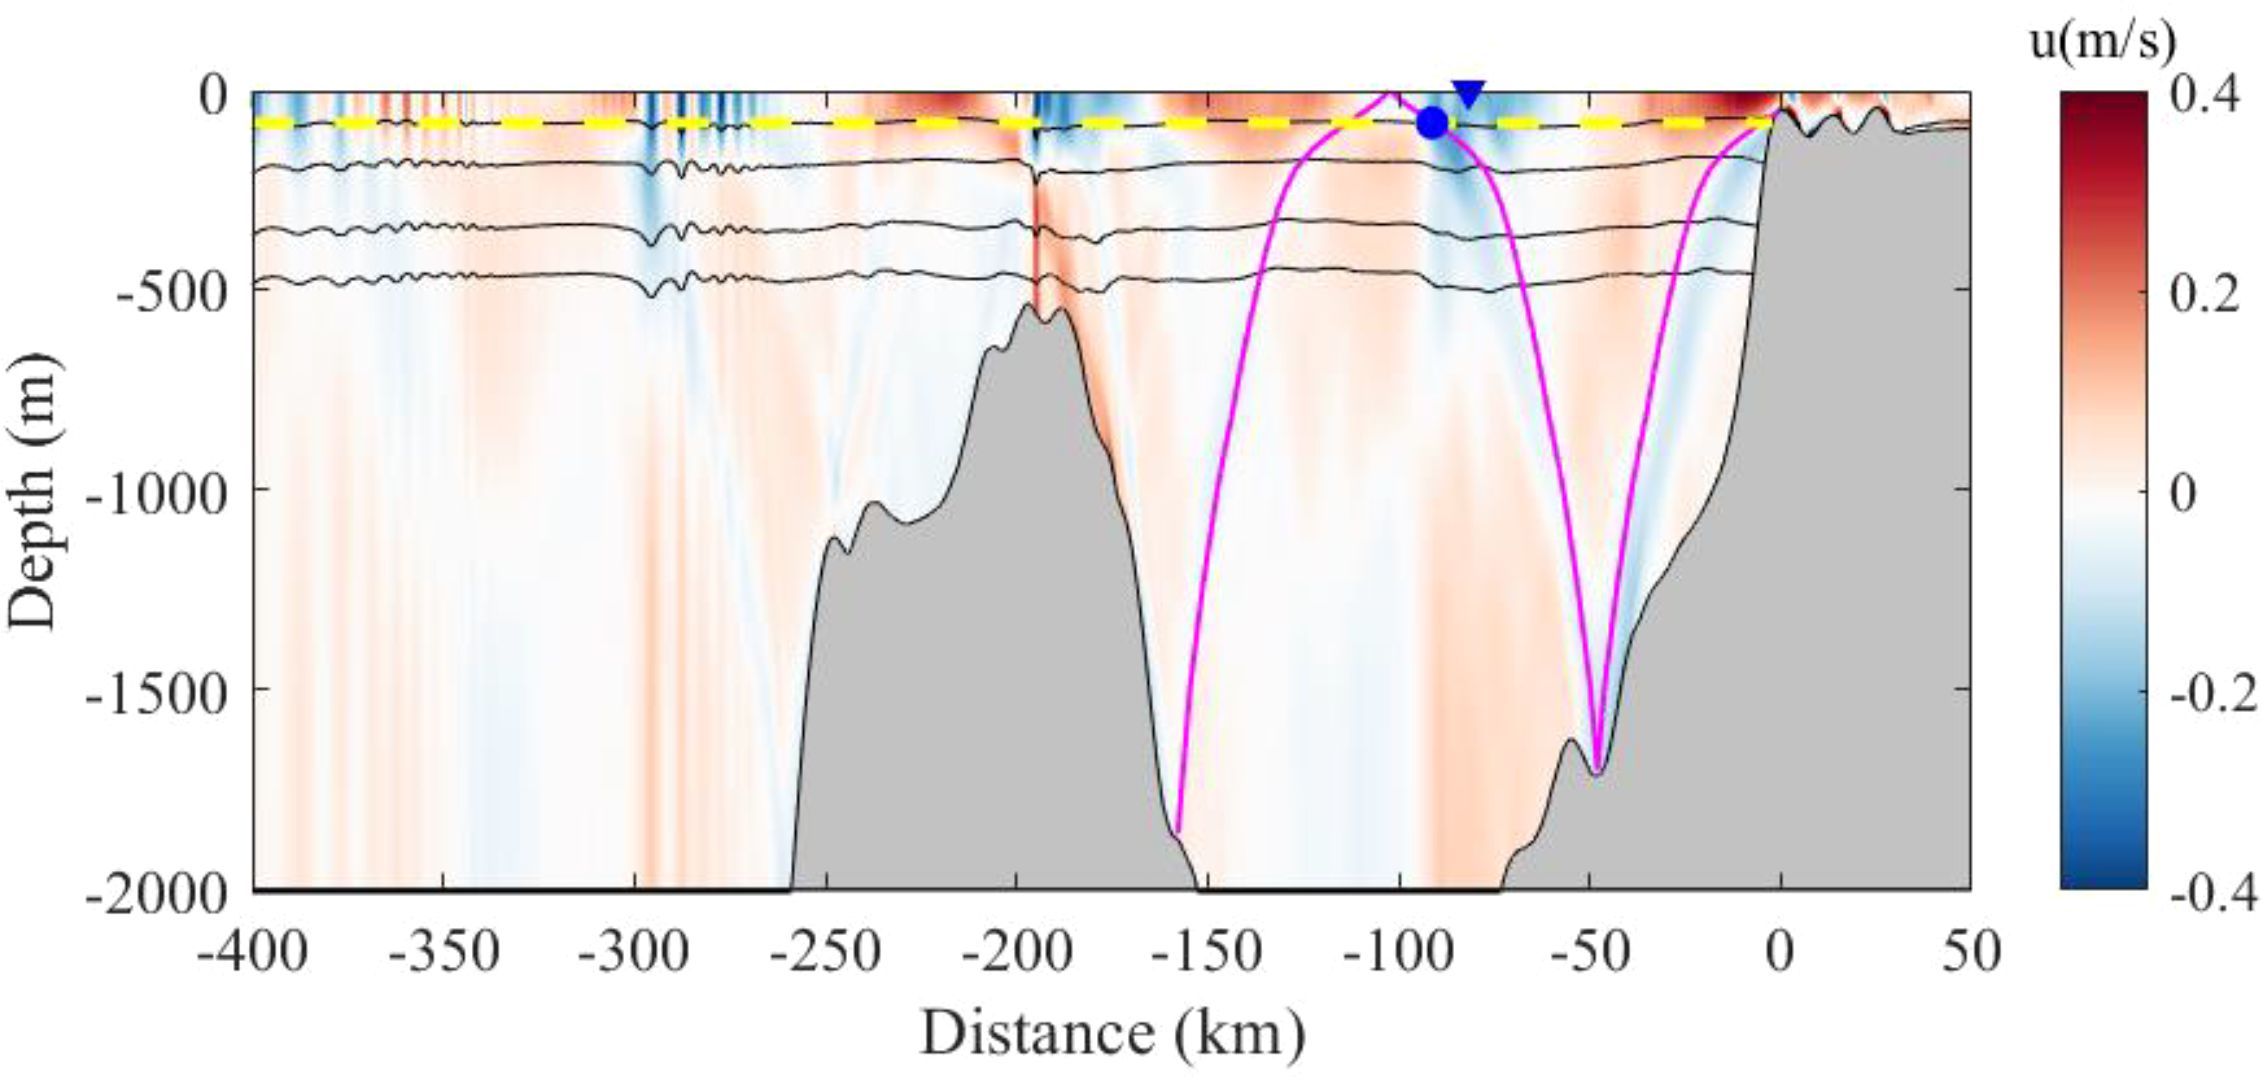
Figure 14. Diagram of the M2 internal tidal raypath (magenta line) in transect SW. Horizontal velocities (shading) and temperature isotherms (contours) in model case SW are shown. The yellow dashed line denotes the pycnocline. The blue point denotes the interaction point of the internal tidal beam with the pycnocline, and the blue triangle denotes the earliest location of Type-SW ISWs in MODIS observations.
where ω is the semidiurnal frequency, e.g., for the M2 tidal frequency. The Coriolis parameter is given by , with Ω being the Earth’s angular speed and φ being the latitude.
The main features of the internal waves generated over topography by barotropic tidal currents can be described with two nondimensional parameters (Garrett and Kunze, 2007): the slope parameter γ, and the tidal excursion length δ.
The slope parameter is defined by the ratio between the topographic slope and the wave slope,
where is the topographic height, and x is the horizontal coordinate. Along the transect SE, the slope of the sill is supercritical (). The ray origin corresponds to critical slopes () on the eastern flank of the sill, where the seafloor slope matches the local value of s.
In parallel, the tidal excursion length is defined by (Bell, 1975; Buijsman et al., 2010),
where is the characteristic barotropic flow velocity, and L is a horizontal topographic length scale. The generation mechanism of ISWs in tide-topography interactions can be clarified by δ. When , waves of tidal frequency dominate, and the generation is governed by the baroclinic tide regime; when , higher harmonics make important contributions, and the generation is termed lee wave mechanism (Maxworthy, 1979); when , internal waves at both the forcing and harmonic frequencies are excited, and the generation is termed a mixed lee wave mechanism.
Following Buijsman et al. (2010), the horizontal topographic length scale L in case SE is determined by fitting a Gaussian function to the bathymetry. At the sill, L is found to be . The maximum tidal amplitude in the far field is , with ω corresponds to the M2 tidal angular frequency. δ is calculated to be 0.017 using Equation (8), which is significantly less than 1.
The generation and evolution process of type-SE ISWs is shown in Figures 13A–G. In Figure 13A, the magenta arrow indicates a density front beginning to steepen. After 2 hours, the front forms a soliton (Figure 13C), which subsequently splits into wave packets during propagation (Figure 13E). In this case, the tidal excursion length indicates that the tidal-frequency internal wave dominates. This excludes the lee wave mechanism and upstream influence mechanism, suggesting that the ISWs likely source from the internal tidal regime. Furthermore, internal waves propagating in the direction of the flood tide, generated by the quasi-steady lee wave or upstream propagating lee wave, are typically associated with ebb tide rather than slack tide. Hyder et al. (2005) found that solitons were apparently superimposed upon the troughs of a background internal tide using in-situ measurements, further supporting the internal tidal regime. Additionally, Figure 13 shows that the steepening process of the internal wave occurs before the internal tide beams interact with the pycnocline, which can exclude the internal tidal beam mechanism. Therefore, we conclude that the type-SE ISWs are generated through a steepening mechanism of the internal tide.
4.2 Generation process of the type-SW ISWs
To verify the relationship between the tidal phase and the generation of type-SW internal waves, the Hovmöller diagram of temperature at the -85m depth is studied based on our numerical solutions (see Figure 15). It is clear that all type-SW ISWs can be traced back to the shelf break, and their generation is associated with the slack tide (the reversal from flood to ebb tide), which is consistent with remote sensing observations. The diagonal patterns of temperature indicate that the phase speeds of the internal waves originating from the shelf break are approximately 2.3 m/s, in agreement with the theoretical first-mode phase speed. The results of both model cases SE (Figure 12) and SW indicate that the ISW packets are generated with a semi-diurnal period in the northern Andaman Sea. As the internal waves pass over the underwater sill located at approximately x=–200 km (Figure 14), the Hovmöller diagram clearly shows the ISWs splitting into wave packets over the sill, which intensifies their nonlinearity.
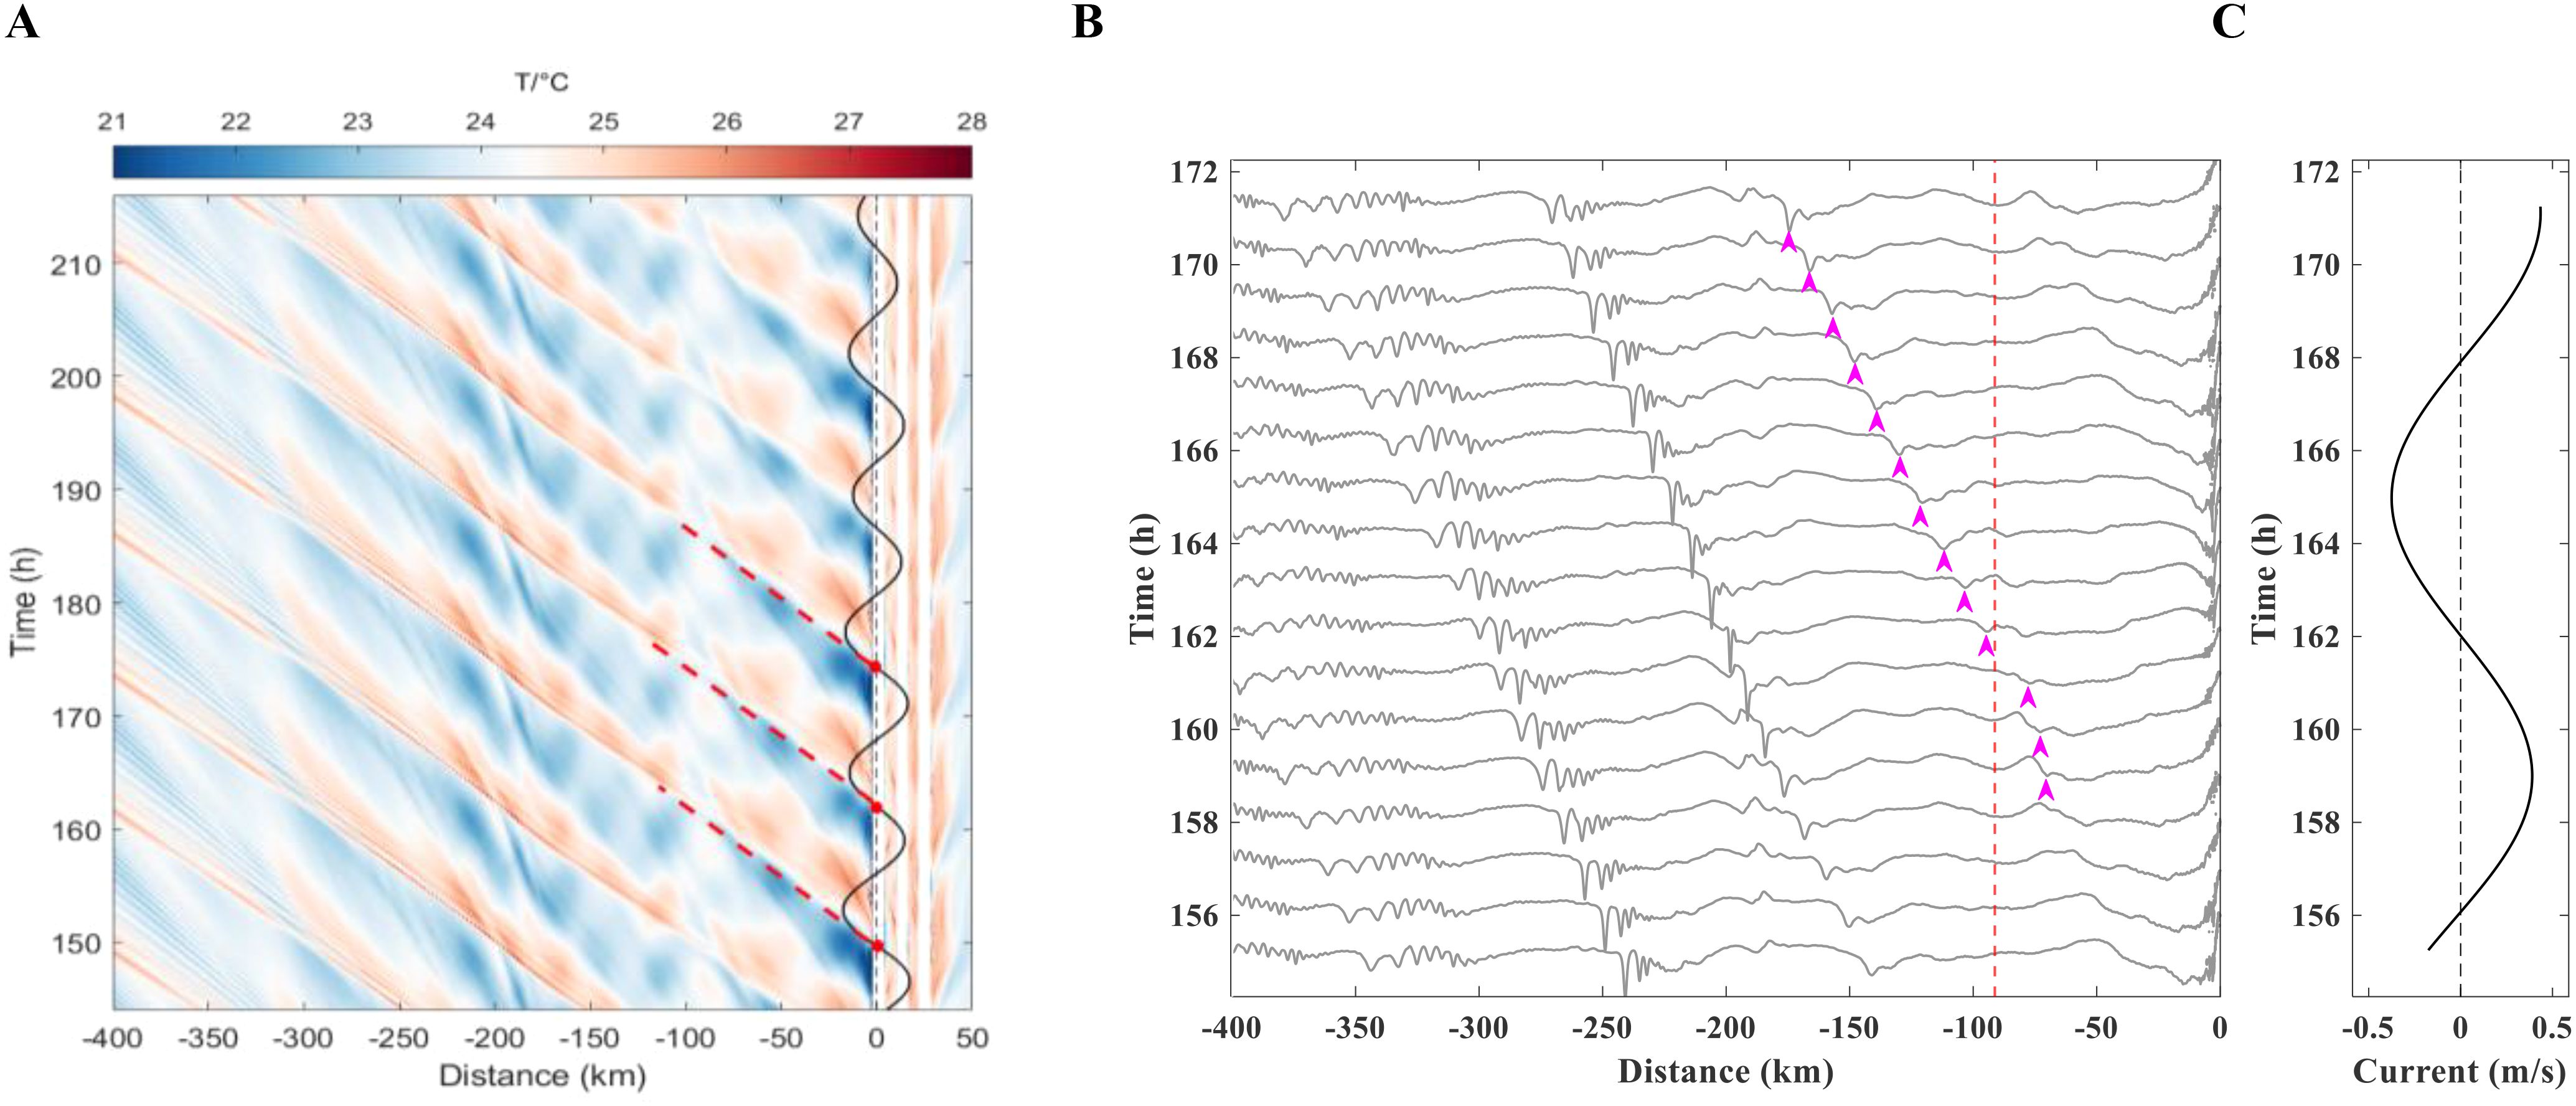
Figure 15. Evolution of temperature in model case SW. (A) Hovmöller diagram of temperature at -85 m depth for the case SW. The white broad stripe indicates the locations of the bulges on the continental shelf. The red dashed lines indicate the propagation of the type‐SW ISWs, which can be traced back to the generation time, as suggested by the red solid circles on the time series of tidal flow above the shelf break. (B) Variations of 24.2°C isotherms (at -85 m depth) in model case SW, with a 1-hour interval between isotherms. The red dashed line denotes the interaction point of the internal tidal beam with the pycnocline (see Figure 14). The magenta arrows follow the generation of solitons. (C) The time series of tidal flow at generation site.
The Hovmöller diagram demonstrates that type-SW internal waves are phase-locked with the slack tide instead of the flood tide (see Figure 15). Furthermore, no significant lee waves propagating outward from the shelf break are observed in Figure 5D, eliminating the possibility of lee waves and upstream influences. For the continental slope topography, L can be used as the distance between shelf break and the bottom of the slope (Legg, 2004). In case SW, L is measured as 73.3 km. U0 is found to be 0.394 m/s in the far field. The parameter δ, calculated using Equation (8), is found to be 0.038. Similar to the case SE, suggests an internal tidal regime in case SW. Figure 14 illustrates that the interaction between the internal tidal beam and the pycnocline occurs later than the first piece of evidence in remote sensing images. Oscillations induced by the wave beam cannot immediately form ISWs upon impact. Instead, they need to travel several tens of kilometers before evolving into ISWs (Akylas et al., 2007). Figure 15A also demonstrates that the steepening of the isotherms occurs before the interaction site. Consequently, the internal tidal beam mechanism is excluded. The combined analysis of numerical simulations and remote sensing observations indicates that the generation of type-SW ISWs is also attributed to the nonlinear steepening of internal tides.
4.3 Effect of subtidal flows
The generation time hypothesis, which neglects the effects of background currents, was introduced in Section 3. In this section, we investigate the effects of background currents on the generation of internal waves to verify the robustness of our hypothesis using numerical models.
Figures 5A, B show the surface currents corresponding to the two MODIS images in Figure 4. During this period, a strong cyclonic eddy was observed in the northern Andaman Sea. The 8-day averaged (1-9 May 2023, 00:00) and vertically uniform background current along transect SE is shown in Figure 5C. Jia et al. (2021) suggested that adding offshore background current did not significantly change the generation mechanism of ISWs, but it increased the nonlinearity of the internal waves and reduced the occurrence time of SAR-observed ISWs by 4 hours. Following their study, a vertically uniform onshore background current of 0.008 m/s at a depth of -1,500 meters was added to model case SE. This value closely matches the background current near the sill and the region where the internal waves steepen, thereby explaining its impact on the generation time of ISWs Figures 5D, E illustrates the generation process of type-SE ISWs forced respectively by tidal flows and combined tidal and subtidal flows, with other model setups remaining the same. In the case with the subtidal flow, the nonlinear steepening occurs farther from the sill, suggesting that a background flow in the propagation direction of internal waves reduces their nonlinearity. Concerning generation time, we assume that internal waves propagate at an average linear speed of 1.9 m/s as observed in Figure 12. The difference in generation time between cases with and without the subtidal flow at the validation points A1 and A0’ is consistently 1.3 hours, with the former case preceding the generation time of ISWs. Given the semi-diurnal tidal period of 12.42 hours, this time difference is relatively insignificant, which supports the robustness of our generation time hypothesis.
5 Conclusion
This study systematically investigates the generation characteristics of southeastward (type-SE) and southwestward (type-SW) ISWs in the northern Andaman Sea using MODIS remote sensing data and MITgcm simulations. The generation sites, generation time, and generation mechanisms of ISWs in the northern Andaman Sea are identified.
ISW signatures were identified in 230 MODIS scenes from 2020 to 2023. Type-SE ISWs originate from the sill south of the Preparis South Channel, whereas type-SW ISWs originate from the eastern shelf break, based on spatial distribution and body force calculations. ISWs are concentrated in specific regions of the spatial distribution, which we classified into six groups: SE I, SE II, SE III for type-SE ISWs, and SW I, SW II, SW III for type-SW ISWs. Among these groups, spatial gaps where no waves are observed, which motivate us to propose a generation time hypothesis of ISWs.
This hypothesis posits that if each classified wave group originates from the same generation region at relatively fixed time intervals and the effects of only topography and stratification are dominant, ISWs would consistently appear in specific regions in MODIS images, thereby explaining the observed gaps. The nonlinear phase speeds are calculated to estimate the generation time of ISWs in MODIS images. These calculations reveal that ISWs are phase-locked with semidiurnal tides, creating specific generation time windows, which support the hypothesis. Type-SE ISWs are generated during the tidal reversal from ebb to flood, whereas type-SW ISWs are generated during the tidal reversal from flood to ebb. Specific generation time windows are identified for type-SE ISWs: SE I (8:00 to 16:00), SE II (20:00 to 6:00 the next day), SE III (6:00 to 17:00); and type-SW ISWs: SW I (15:00 to 21:00), SW II (1:00 to 11:00), SW III (12:00 to 0:00).
The occurrence of ISWs is significantly influenced by tidal ranges. Over a four-year period of remote sensing data, Type-SE ISWs occurred only when the tidal range exceeded 1.3 m, while Type-SW ISWs occurred only when the tidal range exceeded 1.4 m. Larger tidal ranges led to more frequent ISW occurrences, although a dip is observed in the 2.3 to 2.4 m interval, likely caused by limited observational data.
Numerical simulations based on MITgcm revealed that both types of ISWs are generated through the nonlinear steepening of internal tides. The model solutions also showed that ISWs are phase-locked with tidal phases, consistent with remote sensing observations. The study further explored the influence of background currents on ISW generation in the model case SE, revealing that vertically uniform background currents along the internal wave propagation could cause internal waves to form 1.3 hours earlier. Thus, background currents can only slightly modify the nonlinearity and the generation times of internal waves.
Data availability statement
The original contributions presented in the study are included in the article/supplementary material. Further inquiries can be directed to the corresponding author.
Author contributions
SH: Conceptualization, Data curation, Methodology, Software, Writing – original draft, Writing – review & editing, Formal analysis, Investigation. JW: Writing – review & editing. ZL: Writing – original draft. ZY: Writing – original draft. YL: Writing – original draft.
Funding
The author(s) declare financial support was received for the research, authorship, and/or publication of this article. This work was supported by the Natural Science Foundation of China under Grant 5911922010.
Acknowledgments
The authors greatly appreciate reviewers for their helpful comments and suggestions. The authors also sincerely appreciate Raju et al. (2019) for their assistance with the body force code. We would like to acknowledge the assistance of OpenAI's ChatGPT-4o model in the translation of this manuscript.
Conflict of interest
The authors declare that the research was conducted in the absence of any commercial or financial relationships that could be construed as a potential conflict of interest.
Publisher’s note
All claims expressed in this article are solely those of the authors and do not necessarily represent those of their affiliated organizations, or those of the publisher, the editors and the reviewers. Any product that may be evaluated in this article, or claim that may be made by its manufacturer, is not guaranteed or endorsed by the publisher.
References
Akylas T. R., Grimshaw R. H. J., Clarke S. R., Tabaei A. (2007). Reflection tidal wave beams and local generation of solitary waves in the ocean thermocline. J. Fluid Mech. 593, 297–313. doi: 10.1017/S0022112007008786
Alpers W. (1985). Theory of radar imaging of internal waves. Nature 314, 245–247. doi: 10.1038/314245a0
Arthur R. S., Fringer O. B. (2014). The dynamics of breaking internal solitary waves on slopes. Fluid Mech. 761, 360–398. doi: 10.1017/jfm.2014.641
Bai X., Lamb K. G., da Silva J. C. B. (2021). Small-scale topographic effects on the generation of along-shelf propagating internal solitary waves on the Amazon Shelf. J. Geophys. Res. Oceans 126, e2021JC017252. doi: 10.1029/2021JC017252
Bai X., Lamb K. G., Liu Z., Hu J. (2023). Intermittent generation of internal solitary-like waves on the northern shelf of the South China Sea. Geophys. Res. Lett. 50. doi: 10.1029/2022GL102502
Baines P. G. (1982). On internal tide generation models. Deep-Sea Res. Pt. I 29, 307–338. doi: 10.1016/0198-0149(82)90098-X
Bell T. H. (1975). Lee waves in stratified flows with simple harmonic time dependence. J. Fluid Mech. 67, 705–772. doi: 10.1017/S0022112075000560
Brandt P., Alpers W., Backhaus J. O. (1996). Study of the generation and propagation of internal waves in the Strait of Gibraltar using a numerical model and synthetic aperture radar images of the European ERS 1 satellite. J. Geophys. Res. Oceans 101, 14237–14252. doi: 10.1029/96JC00540
Buijsman M. C., Kanarska Y., McWilliams J. C. (2010). On the generation and evolution of nonlinear internal waves in the South China Sea. J. Geophys. Res. Oceans. 115, C02012. doi: 10.1029/2009JC005275
Cai S., Wu Y., Xu J., Chen Z., Xie J., He Y. (2021). On the generation and propagation of internal solitary waves in the southern Andaman Sea: A numerical study. Sci. China Earth Sci. 64, 1674–1686. doi: 10.1007/s11430-020-9802-8
Cole S. T., Rudnick D. L., Hodges B. A., Martin J. P. (2009). Observations of tidal internal wave beams at Kauai Channel, Hawaii. J. Phys. Oceanogr. 39, 421–436. doi: 10.1175/2008JPO3937.1
Cui Z., Jin W., Ding T., Liang C., Lin F., Zhou B., et al. (2024). Observations of anomalously strong mode-2 internal solitary waves in the central Andaman Sea by a mooring system. Deep-Sea Res. Pt. I 208. doi: 10.1016/j.dsr.2024.104300
da Silva J. C. B., Buijsman M. C., Magalhaes J. M. (2015). Internal waves on the upstream side of a large sill of the Mascarene Ridge: a comprehensive view of their generation mechanisms and evolution. Deep-Sea Res. Pt. I 99, 87–104. doi: 10.1016/j.dsr.2015.01.002
da Silva J. C. B., Magalhaes J. M. (2016). Internal solitons in the Andaman Sea: a new look at an old problem. Proc. SPIE Int. Soc Opt. Eng. Edinburgh UK. doi: 10.1117/12.2241198
Egbert G. D., Erofeeva S. Y. (2002). Efficient inverse modeling of barotropic ocean tides. J. Atmos. Ocean. Tech. 19, 183–204. doi: 10.1175/1520-0426(2002)019<0183:EIMOBO>2.0.CO;2
Farmer D., Li Q., Park J. H. (2009). Internal wave observations in the South China Sea: the role of rotation and non-linearity. Atmos. Ocean 47, 267–280. doi: 10.3137/OC313.2009
Garrett C., Kunze E. (2007). Internal tide generation in the deep ocean. Annu. Rev. Fluid Mech. 39, 57–87. doi: 10.1146/annurev.fluid.39.050905.110227
Gerkema T. (2001). Internal and interfacial tides: Beam scattering and local generation of solitary waves. J. Mar. Res. 59, 227–255. doi: 10.1357/002224001762882646
Gill A. E. (1982). “International geophysics,” in Atmosphere—Ocean Dynamics (Elsevier, Amsterdam, The Netherlands).
Gong Y., Chen X., Xu J., Xie J., Chen Z., He Y., et al. (2023). An internal solitary wave forecasting model in the northern South China Sea (ISWFM-NSCS). Geosci. Model. Dev. 16, 2851–2871. doi: 10.5194/gmd-16-2851-2023
Guo C., Chen X. (2014). A review of internal solitary wave dynamics in the northern South China Sea. Prog. Oceanogr. 121, 7–23. doi: 10.1016/j.pocean.2013.04.002
Guo C., Chen X., Vlasenko V., Stashchuk N. (2011). Numerical investigation of internal solitary waves from the Luzon Strait: Generation process, mechanism and three-dimensional effects. Ocean Model. 38, 203–216. doi: 10.1016/j.ocemod.2011.03.002
Huang L., Yang J., Ma Z., Liu B., Ren L., Liu A. K., et al. (2024). Generation of diurnal internal solitary waves (ISW-D) in the Sulu Sea: From geostationary orbit satellites and numerical simulations. Prog. Oceanography 225. doi: 10.1016/j.pocean.2024.103279
Hyder P., Jeans D. R. J., Cauquil E., Nerzic R. (2005). Observations and predictability of internal solitons in the northern Andaman Sea. Appl. Ocean Res. 27, 1–11. doi: 10.1016/j.apor.2005.07.001
Jackson C. (2007). Internal wave detection using the moderate resolution imaging spectroradiometer (MODIS). J. Geophys. Res. Oceans 112. doi: 10.1029/2007JC004220
Jackson C. R. (2009). An empirical model for estimating the geographic location of nonlinear internal solitary waves. J. Atmos. Ocean. Tech. 26, 2243–2255. doi: 10.1175/2009JTECHO638.1
Jia T., Liang J., Li X.-M., Li Q. (2023). Generation of nonlinear internal waves on the northern continental shelf south of Hainan Island. Continental Shelf Res. 266. doi: 10.1016/j.csr.2023.105083
Jia T., Liang J., Li Q., Sha J., Li X. M. (2021). Generation of shoreward nonlinear internal waves south of the Hainan Island: Synthetic aperture radar observations and numerical simulations. J. Geophys. Res. Oceans 126, e2021JC017334. doi: 10.1029/2021JC017334
Jing Z., Qi Y., Du Y. (2012). Persistent upwelling and front over the Sulu Ridge and their variations. J. Geophys. Res. Oceans 117. doi: 10.1029/2012JC008355
Johannessen O. M., Sandven S., Chunchuzov I. P., Shuchman R. A. (2019). Observations of internal waves generated by an anticyclonic eddy: a case study in the ice edge region of the Greenland Sea. Tellus A. 71, 1–12. doi: 10.1080/16000870.2019.1652881
Koohestani K., Stepanyants Y., Allahdadi M. N. (2023). Analysis of internal solitary waves in the gulf of Oman and sources responsible for their generation. Water 15, 746. doi: 10.3390/w15040746
Lee C. Y., Beardsley R. C. (1974). The generation of long nonlinear internal waves in a weakly stratified shear flow. J. Geophys. Res. Oceans 79, 453–462. doi: 10.1029/JC079i003p00453
Legg S. (2004). Internal tides generated on a corrugated continental slope. Part I: cross-slope barotropic forcing. J. Phys. Oceanogr. 34, 156–173. doi: 10.1175/1520-0485(2004)034<0156:ITGOAC>2.0.CO;2
Legg S., Huijts K. M. H. (2006). Preliminary simulations of internal waves and mixing generated by finite amplitude tidal flow over isolated topography. Deep-Sea Res. Pt. II 53, 140–156. doi: 10.1016/j.dsr2.2005.09.014
Li Q., Farmer D. M. (2011). The generation and evolution of nonlinear internal waves in the deep basin of the south China sea. J. Phys. Oceanogr. 41, 1345–1363. doi: 10.1175/2011JPO4587.1
Liu E. J., Sa D’ (2019). Oceanic internal waves in the Sulu–Celebes Sea under sunglint and moonglint. IEEE Trans. Geosci. Remote Sens 57, 6119–6129. doi: 10.1109/TGRS.36
Lozovatsky I., Liu Z., Fernando H., Armengol J., Roget E. (2012). Shallow water tidal currents in close proximity to the seafloor and boundary-induced turbulence. Ocean Dynam 62, 177–191. doi: 10.1007/s10236-011-0495-3
Lu K., Wang J., Zhang M. (2021). Study on prediction of internal solitary waves propagation in the southern Andaman Sea. J. Oceanogr. 77, 607–613. doi: 10.1007/s10872-021-00594-6
Magalhaes J. M., B da Silva J. C., Buijsman M. C. (2020). Long lived second mode internal solitary waves in the Andaman Sea. Sci. Rep. 10. doi: 10.1038/s41598-020-66335-9
Magalhaes J. M., da Silva J. C. B. (2012). SAR observations of internal solitary waves generated at the Estremadura Promontory off the west Iberian coast. Deep-Sea Res. Pt. I 69, 12–24. doi: 10.1016/j.dsr.2012.06.002
Magalhaes J. M., da Silva J. C. B. (2018). Internal solitary waves in the Andaman Sea: New insights from SAR imagery. Remote Sens 10, 861–877. doi: 10.3390/rs10060861
Mandal A. K., Seemanth M., Ratheesh R. (2024). Characterization of internal solitary waves in the Andaman Sea and Arabian Sea using EOS-04 and sentinel observations. Int. J. Remote Sens. 45, 1201–1219. doi: 10.1080/01431161.2024.2307322
Marshall J., Hill C., Perelman L., Adcroft A. (1997). Hydrostatic, quasi-hydrostatic, and nonhydrostatic ocean modeling. J. Geophys. Res. Oceans 102, 5733–5752. doi: 10.1029/96JC02776
Maxworthy T. (1979). A note on the internal solitary waves produced by tidal flow over a three-dimensional ridge. J. Geophys. Res. Oceans. 84, 338–346. doi: 10.1029/JC084iC01p00338
Melsheimer C., Kwoh L. K. (2001). “Sun glitter in SPOT images and the visibility of oceanic phenomena,” in 22nd Asian Conf. Remote Sens, Singapore. 1–6.
Meng J., Sun L., Zhang H., Hu B., Hou F., Bao S. (2022). Remote sensing survey and research on internal solitary waves in the South China Sea-Western Pacific-East Indian Ocean (SCS-WPAC-EIND). Acta Oceanol. Sin. 41, 154–170. doi: 10.1007/s13131-022-2018-0
Nash J. D., Moum J. N. (2005). River plumes as a source of large-amplitude internal waves in the coastal ocean. Nature 437, 400–403. doi: 10.1038/nature03936
Osborne A. R., Burch T. L. (1980). Internal solitons in the andaman sea. Science 208, 451–460. doi: 10.1126/science.208.4443.451
Pedlosky J. (2003). Waves in the Ocean and Atmosphere: Introduction to Wave Dynamics (Berlin, Germany: Springer), 264.
Pingree R. D., New A. L. (1991). Abyssal penetration and bottom reflection of internal tidal energy in the Bay of Biscay. J. Phys. Oceanogr. 21, 28–39. doi: 10.1175/1520-0485(1991)021<0028:APABRO>2.0.CO;2
Raju N. J., Dash M. K., Bhaskaran P. K., Pandey P. C. (2021). Numerical investigation of bidirectional mode-1 and mode-2 internal solitary wave generation from north and south of Batti Malv Island, Nicobar Islands, India. J. Phys. Oceanogr. 51, 47–62. doi: 10.1175/JPO-D-19-0182.1
Raju N. J., Dash M. K., Dey S. P., Bhaskaran P. K. (2019). Potential generation sites of internal solitary waves and their propagation characteristics in the Andaman Sea—a study based on MODIS true-colour and SAR observations. Environ. Monit. Assess. 191. doi: 10.1007/s10661-019-7705-8
Rizal S., Damm P., Wahid M. A., Sündermann J., Ilhamsyah Y., Iskandar T., et al. (2012). General circulation in the Malacca strait and Andaman Sea: a numerical model study. Amer. J. Environ. Sci. 8, 479–488. doi: 10.3844/ajessp.2012.479.488
Sun L., Liu Y., Meng J., Fang Y., Su Q., Li C., et al. (2024). Internal solitary waves in the central andaman sea observed by combining mooring data and satellite remote sensing. Cont. Shelf Res. 277, 105249. doi: 10.1016/j.csr.2024.105249
Sun L., Zhang J., Meng J. (2019). A study of the spatial-temporal distribution and propagation characteristics of internal waves in the Andaman Sea using MODIS. Acta Oceanol. Sin. 38, 121–128. doi: 10.1007/s13131-019-1449-8
Sun L., Zhang J., Meng J. (2021). Study on the propagation velocity of internal solitary waves in the Andaman Sea using Terra/Aqua-MODIS remote sensing images. J. Oceanol. Limnol. 39, 2195–2208. doi: 10.1007/s00343-020-0280-6
Sutherland B., Dauxois T., Peacock T. (2014). “Internal waves in laboratory experiments,” in Modeling Atmospheric and Oceanic Flows: Insights from Laboratory Experiments and Numerical Simulations (USA, Washington: American Geophysical Union), 193–212.
Tensubam C. M., Raju N. J., Dash M. K., Barskar H. (2021). Estimation of internal solitary wave propagation speed in the Andaman Sea using multi–satellite images. Remote Sens. Environ. 252. doi: 10.1016/j.rse.2020.112123
Vlasenko V., Stashchuk N., Palmer M. R., Inall M. E. (2013). Generation of baroclinic tides over an isolated underwater bank. J. Geophys. Res. Oceans 118, 4395–4408. doi: 10.1002/jgrc.v118.9
Wang T., Huang X., Zhao W., Zheng S., Yang Y., Tian J. (2022). Internal solitary wave activities near the Indonesian submarine wreck site inferred from satellite images. J. Mar. Sci. Eng. 10, 197. doi: 10.3390/jmse10020197
Wyatt A. S. J., Leichter J. J., Toth L. T., Miyajima T., Aronson R. B., Nagata T. (2020). Heat accumulation on coral reefs mitigated by internal waves. Nat. Geosci 13, 28–34. doi: 10.1038/s41561-019-0486-4
Wyrtki K. (1961). Physical Oceanography of the Southeast Asian Waters (California, USA: NAGA Rep., Vol. 2, Scripps Institute of Oceanography), 195.
Yang Y., Huang X., Zhao W., Zhou C., Zhang Z., Guan S., et al. (2023). Kelvin waves from the equatorial Indian Ocean modulate the nonlinear internal waves in the Andaman Sea. Environ. Res. Lett. 10. doi: 10.1088/1748-9326/acf05d
Zhang X., Wang H., Wang S., Liu Y., Yu W., Wang J., et al. (2022). Oceanic internal wave amplitude retrieval from satellite images based on a data-driven transfer learning model. Remote Sens. Environ. 272, 1–16. doi: 10.1016/j.rse.2022.112940
Zhang S., Li X., Zhang X. (2023). Internal wave signature extraction from SAR and optical satellite imagery based on deep learning. IEEE Trans. Geosci. Remote Sens. 61, 1–16. doi: 10.1109/TGRS.2023.3258189
Zhang X., Li X., Zheng Q. (2021). A machine-learning model for forecasting internal wave propagation in the Andaman Sea. IEEE J. Stars 14, 3095–3106. doi: 10.1109/JSTARS.2021.3063529
Keywords: internal solitary waves, Andaman Sea, remote sensing, numerical simulation, MODIS, MITgcm
Citation: Huang S, Wang J, Li Z, Yang Z and Lu Y (2024) Generation characteristics of internal solitary waves in the Northern Andaman sea based on MODIS observations and numerical simulations. Front. Mar. Sci. 11:1472554. doi: 10.3389/fmars.2024.1472554
Received: 29 July 2024; Accepted: 11 September 2024;
Published: 30 September 2024.
Edited by:
Yimian Dai, Nanjing University of Science and Technology, ChinaCopyright © 2024 Huang, Wang, Li, Yang and Lu. This is an open-access article distributed under the terms of the Creative Commons Attribution License (CC BY). The use, distribution or reproduction in other forums is permitted, provided the original author(s) and the copyright owner(s) are credited and that the original publication in this journal is cited, in accordance with accepted academic practice. No use, distribution or reproduction is permitted which does not comply with these terms.
*Correspondence: Jing Wang, d2ppbmdAb3VjLmVkdS5jbg==
 Songsong Huang
 Jing Wang*