 Abed El Rahman Hassoun1*
 Toste Tanhua1
 Emma Heslop2
 Inga Lips3
 Marta Álvarez4
 George Petihakis5
 Maribel I. García-Ibáñez6
 Dimitris Velaoras7
 Michele Giani8
 Hermann W. Bange1
 Christian Lønborg9
 Johannes Karstensen1
- 1GEOMAR Helmholtz Centre for Ocean Research Kiel, Kiel, Germany
- 2Intergovernmental Oceanographic Commission of UNESCO, Paris, France
- 3European Global Ocean Observing System (EuroGOOS) AISBL, Brussels, Belgium
- 4Centro Oceanográfico de A Coruña, Instituto Español de Oceanografía (IEO, CSIC), A Coruña, Spain
- 5Institute of Oceanography, Hellenic Centre for Marine Research, Crete, Greece
- 6Centre Oceanogràfic de les Balears, Instituto Español de Oceanografía (IEO, CSIC), Palma, Spain
- 7Institute of Oceanography, Hellenic Centre for Marine Research, Anavyssos, Greece
- 8National Institute of Oceanography and Applied Geophysics, Trieste, Italy
- 9Section for Marine Diversity and Experimental Ecology, Department of Ecoscience, Aarhus University, Roskilde, Denmark
The European Ocean Observing Community (EOOC) integrates inputs from diverse entities dedicated to comprehensively monitoring and forecasting oceanic phenomena in European Seas. With increasing climate and anthropogenic pressures, the urgency of ensuring the EOOC’s preparedness to observe Essential Ocean Variables (EOVs) is evident. This paper advocates for the adoption of a scoring approach designed to evaluate the readiness of the EOOC in observing and forecasting key ocean phenomena. The proposed scoring methodology can be applied at both European and potentially regional and/or national levels, and emerges as a transformative tool for scrutinizing the EOOC’s capability to predict and monitor key ocean phenomena. Our findings, based on the application of the scoring approach, suggest that while the community demonstrates commendable readiness levels for certain oceanic phenomena, 83% remain in developing stages, oscillating between “Idea” and “Trial” readiness levels. A closer examination exposes critical shortages predominantly in the coordination and observational facets (Process), and data management and information products (Output). The implications of these identified gaps reach far beyond academic realms, profoundly affecting diverse sectors and societal resilience (e.g., energy sector). The suggested scoring approach serves as a clear call for strategic investments and heightened support for the European observing community. By adopting a regular and systematic scoring methodology, we not only measure progress at present but also pave the way for a resilient and future-ready EOOC.
1 Introduction
The European Ocean Observing Community (EOOC; term recently introduced by Hassoun et al. (2024)), represents a collaborative network of observers and modelers from various European institutes, organizations, networks, and data portals. This network is dedicated to comprehensively monitor, analyze, and forecast any observable or measurable event, process, or pattern (ranging from localized events to global patterns) that occurs within the ocean’s physical, chemical, biological, or geological systems, referred to here as ocean phenomena. Therefore, the EOOC covers a wide range of oceanic disciplines, from physical to biological, and operates across both coastal and open-ocean settings, extending beyond European Seas to the global ocean. The EOOC’s initiatives play a crucial role in addressing key challenges such as climate change mitigation, marine resource management (Tanhua et al., 2024), and advancing scientific understanding of ocean dynamics. This is achieved not only by setting requirements for harmonizing the observation of key ocean variables and standardizing measurement practices but also by providing meaningful data and products that guide and inform EU’s directives (e.g., the Maritime Strategy Framework Directive1) and ultimately EU legislation and environmental targets and strategies (e.g., The European Green Deal2, and the 2050 climate neutral strategy3). However, the sustained effectiveness of the EOOC’s initiatives hinges on the identification and rectification of its existing gaps, regularly and systematically, beyond the lifetime of generally short-term projects and observing efforts. The diversity of research topics, priorities, needs, and methodologies within the EOOC arises from disparate national and institutional objectives, leading to disjointed ocean observations, and thus services, across Europe (Hassoun et al., 2024). This variability extends to the types of observations conducted, variables monitored, methodologies employed, practices followed, temporal and geographical coverage, and the diversity of ocean components monitored (European Marine Board, 2019; Martín Míguez et al., 2019). This results in both temporal and spatial observation gaps hampering the readiness level (RL) of the EOOC’s initiatives to meet emergent societal needs and challenges. Considering the substantial investments in ocean observing, the EOOC must work on improving the RLs of its components to observe Essential Ocean Variables (EOVs)4 in real-time and with low uncertainties. EOVs are a set of key variables identified to monitor and assess the state of the ocean and its interactions with the Earth’s climate system, and are defined by the Global Ocean Observing System (GOOS)5. Given the changing oceanic landscape due to anthropogenic pressures, the EOOC initiatives’ preparedness (readiness or fit-for-purpose) is important to forecast short- and long-term patterns and provide timely warnings. Collaborative efforts among stakeholders, researchers, and policymakers are indispensable to ensure that the efforts of the EOOC remain reliable and scientifically relevant, and are able to guide Europe toward a more informed society and a resilient European Seas.
To systematically evaluate the RL of the EOOC’s initiatives in its observing and forecasting ability, we propose here a scoring approach for the technological readiness level (TRL) of monitoring and forecasting key ocean phenomena following the Framework of Ocean Observing (FOO) (Lindstrom et al., 2012). Our scoring approach uses a previously established methodology (Hassoun et al., 2023) and expands it to a broader community of ocean observers through a comprehensive survey. The collected data were aggregated and averaged, and the results presented here demonstrate the validity and applicability of the proposed scoring framework. This scoring approach serves (i) to pinpoint gaps obstructing the comprehensive monitoring and forecasting of ocean phenomena and (ii) to provide straightforward metrics that could help guide stakeholders (funders, supporters, etc.) and users within the EOOC. The proposed scoring approach is suggested to be applied in other parts of the world’s ocean where an evaluation of the observing and forecasting capabilities is needed.
2 Methodology
To develop the proposed scoring approach, we relied on the European Union (EU)-funded action EuroSea deliverable D1.96 elaborated in Hassoun et al. (2024). Briefly, an exhaustive examination of key EU projects and peer-reviewed publications was conducted to identify gaps in observing and forecasting key ocean phenomena and threats at the EU level. These phenomena, such as marine biodiversity and non-indigenous species, food webs, ocean warming, ocean acidification, eutrophication, deoxygenation, and plastic pollution, among others, align with the Good Environmental Status (GES) of the EU Marine Strategy Framework Directive (MSFD)7 and phenomena and threats covered by Copernicus Marine Environment Monitoring Service (CMEMS)8. While the original scoring approach was developed by a smaller team (Hassoun et al., 2023), this paper extends its application by incorporating feedback from a broader community of observers through a survey. This survey aimed to assess the feasibility of the scoring approach and obtain more reliable scores from experts in specific fields, which helped to better highlight the strengths and weaknesses of the proposed scoring approach.
The FOO table, which contains the items used to conduct the scoring, was developed by IOC-UNESCO9 experts, who are mainly oceanographers. As a result, the existing criteria can only be applied to typical ocean dynamics, such as the ocean phenomena identified through the GES of the MSFD and threats by CMEMS. In this paper, we did not further develop new items or criteria to score other aspects of the EOOC initiatives that cannot be evaluated using the existing FOO criteria, such as the interdisciplinarity of observations, the efficiency of observational networks, the accuracy of modeling, policies and legislations, coordination and management, awareness and literacy, etc. Therefore, the scoring was exclusively applied to the following 18 phenomena: Biodiversity and Non-Indigenous Species (NIS), Food Webs, Eutrophication, Ocean Warming, Ocean Acidification, Ocean Carbon Storage, Ocean Deoxygenation, Non-Carbon Greenhouse Gases (GHGs), Contaminants, Plastic Pollution, Sea Level Rise (SLR), Sea Ice, River Inputs, Oil Leakage, Sea Floor Integrity/Bathymetry, Underwater Noise, Geological geohazards, and Human Activities.
2.1 The scoring approach
To evaluate the performance and readiness of the EOOC initiatives in observing and forecasting key ocean phenomena, we relied on the FOO concept, initially developed as TRLs by NASA (National Aeronautics and Space Administration) (Sadin et al., 1989), and later adopted and edited by Lindstrom et al. (2012) to develop the concept of the 9 ocean observing Readiness Levels (RLs). While both TRLs and RLs assess readiness and maturity, TRLs specifically focus on the technological aspect. TRLs are not a measure of the design validity; instead, they indicate the maturity level of specific critical technology elements at the time it is evaluated (DoD, U.S, 2023). In contrast, RLs refer to the readiness of various systems of observing and forecasting, processes, or organizations to accomplish specific tasks or objectives. The RLs can encompass technological readiness but may also include other factors such as organizational readiness, stakeholder readiness, and regulatory readiness. Moreover, RLs are often used to assess the preparedness of an entity to undertake a particular action or initiative.
Therefore, our scoring approach uses the concept of RLs and evaluates three pillars of the ocean observing value chain: “Requirements = inputs”, “Observations = processes”, and “Data and Information = outputs” (Pearlman et al., 2019). This evaluation addresses the requirement setting process on: - Why to observe a specific phenomenon? What should be observed to cover this phenomenon? How should this phenomenon be observed? It also examines the outputs related to data management, products, and services used to understand trends and impacts. The 9 RLs are grouped into three categories based on their advancement: “Concept”, “Pilot,” and “Mature” (Lindstrom et al., 2012).
Although the criteria for these advancement levels are rather general, we applied them to assess the RLs of the EOOC’s past and current initiatives in observing and forecasting various ocean phenomena. Scores were assigned to items/criteria at each level on a level-by-level basis. Full compliance with the criteria yields a score of 100% for a given level, while a score of 80% is defined as a “pass” to the next level. We established this threshold to harmonize our scoring approach with a similar approach recently used by Lange et al. (2023) for “Data Management and Information Products” linked to high-quality biogeochemical EOVs data synthesis products, demonstrating its usefulness in evaluating various components of the ocean observing value chain.
In our scoring approach, the RLs for each of the three FOO pillars were evaluated to identify gaps in the inputs, processes, and outputs (Table 1). It is noteworthy to highlight that the EOOC might meet some requirements at higher levels while not fulfilling the criteria for the 80% threshold at lower levels. For example, “Ocean Warming’’ received an RL of 7 for the Input pillar despite achieving a score of 86% at Level 9, because its score at Level 8 was below 80%, preventing it from exceeding Level 7 (Table 1). Detailed scoring documents are available in Hassoun et al. (2023).
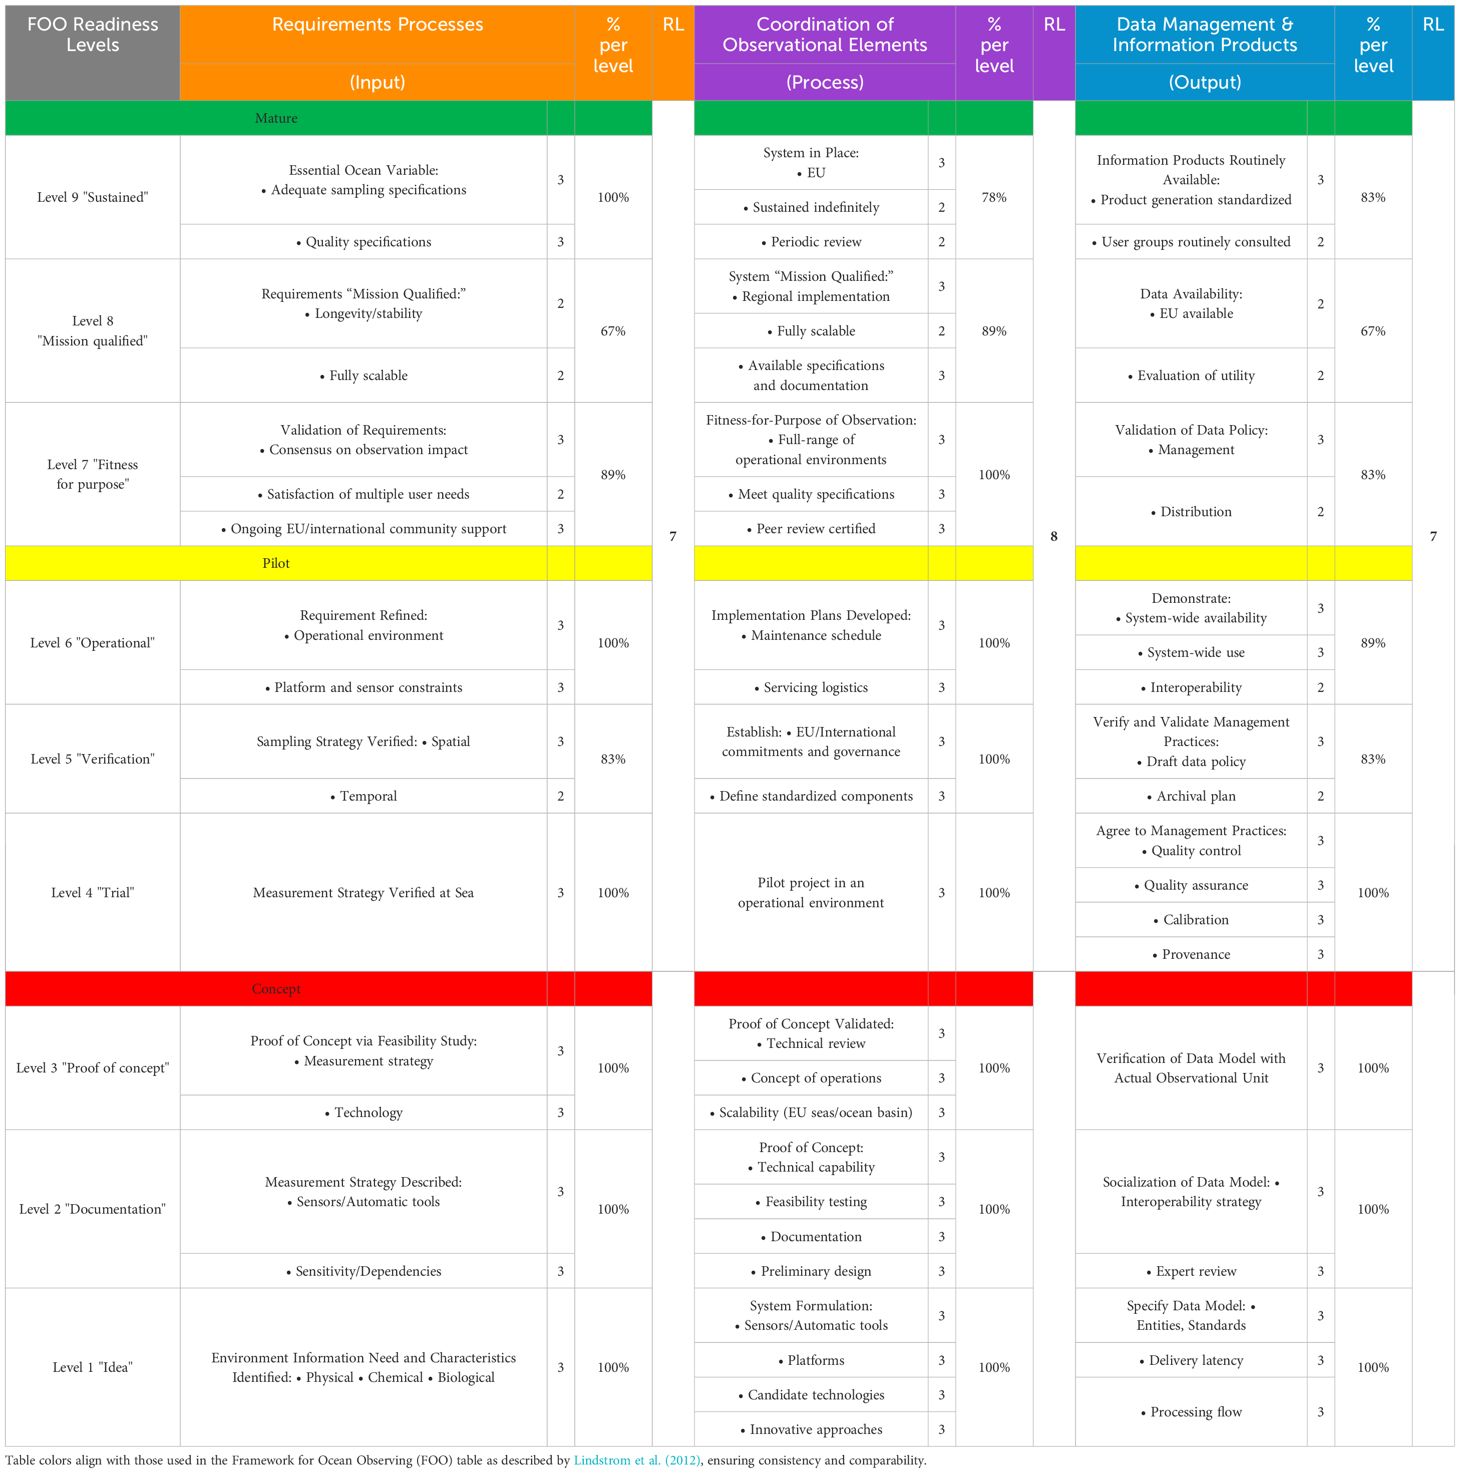
Table 1. An example of a scoring case for “Ocean Warming” based on FOO RLs concept.
2.2 Community feedback
To ensure an inclusive scoring process and gather feedback from experts within the EOOC, we widely circulated the developed scoring approach (Hassoun et al., 2023). Despite distributing the survey through numerous private and institutional mailing lists and social media channels, we received feedback from a limited number (n = 9) of experts on specific ocean phenomena based on their respective expertise. The respondents were affiliated to research institutes across five different EU countries (Table 2). Most of them are involved in ocean observation and monitoring planning, highlighting the importance of their feedback in accurately scoring the RL of the EOOC initiatives.
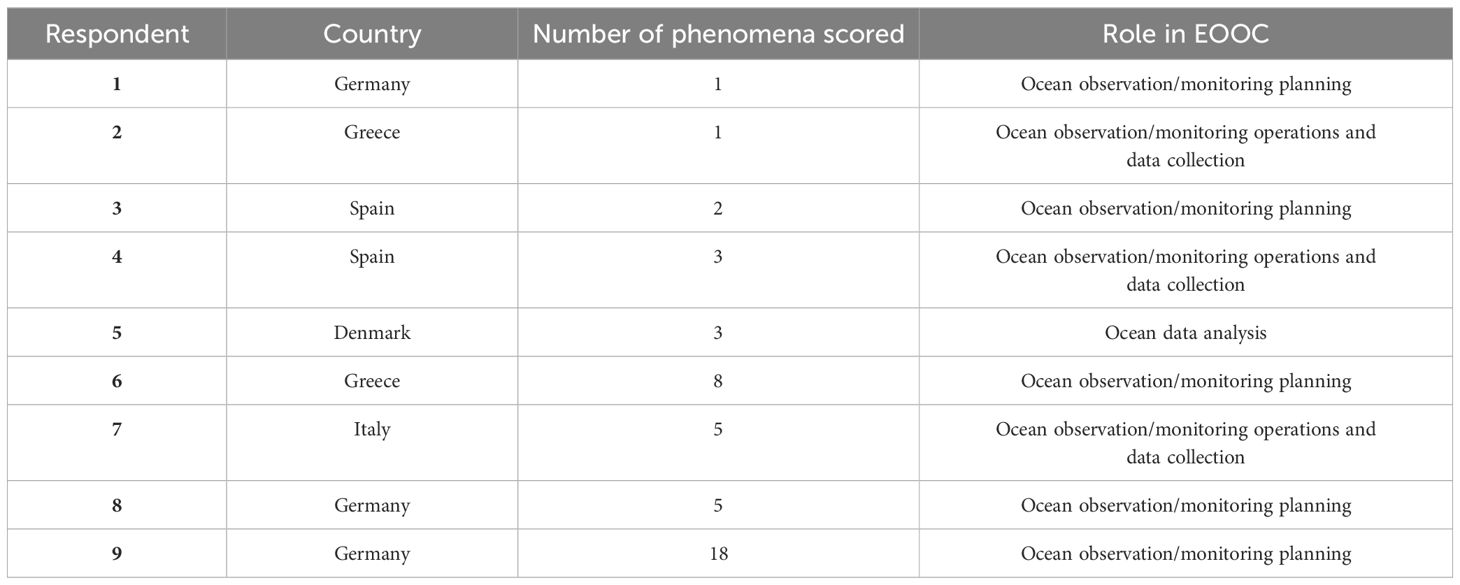
Table 2. Background of the survey respondents.
In this paper, the scores resulting from our own assessment (Hassoun et al., 2023) were averaged together with the ones from the EOOC experts, refined through direct consultations with them to clarify ambiguities in the scoring and discuss recommendations. The final scores (RLs featured in this paper) represent the arithmetic average (mean) of the aggregated scores. The average was chosen because it provides a clear and interpretable measure of central tendency, allowing us to combine diverse expert opinions into a single representative score. While this method assumes that the scoring levels are numerically equidistant (i.e., the difference between any two consecutive scores is consistent), this assumption was deemed acceptable based on the design of the scoring approach, which uses ordinal scales reflecting relative differences in capacity.
3 Results and discussion
In this section, we discuss the gaps in observing and forecasting each of the 18 included phenomena in a consistent manner. The scores provided by each respondent for every pillar are presented in Table 3. More in-depth information related to gaps beyond the observation of key ocean phenomena (e.g., Data FAIRness, marine policies and legislation, coordination and management, and ocean literacy) have been recently published by Hassoun et al. (2024) and Tanhua et al. (2024). We begin each section with a summary of the scores across the three pillars: “Requirements Processes = Inputs”, “Coordination of Observational Elements = Processes”, and “Data Management & Information Products = Outputs”. Following this, we provide detailed explanations of the scores in each pillar, along with clear recommendations for improvement for each phenomenon as shown in Table 4. By presenting the information in this consistent format, we aim to help readers easily compare the different phenomena’s RLs and replicate this exercise to evaluate other regional and/or national observing communities.
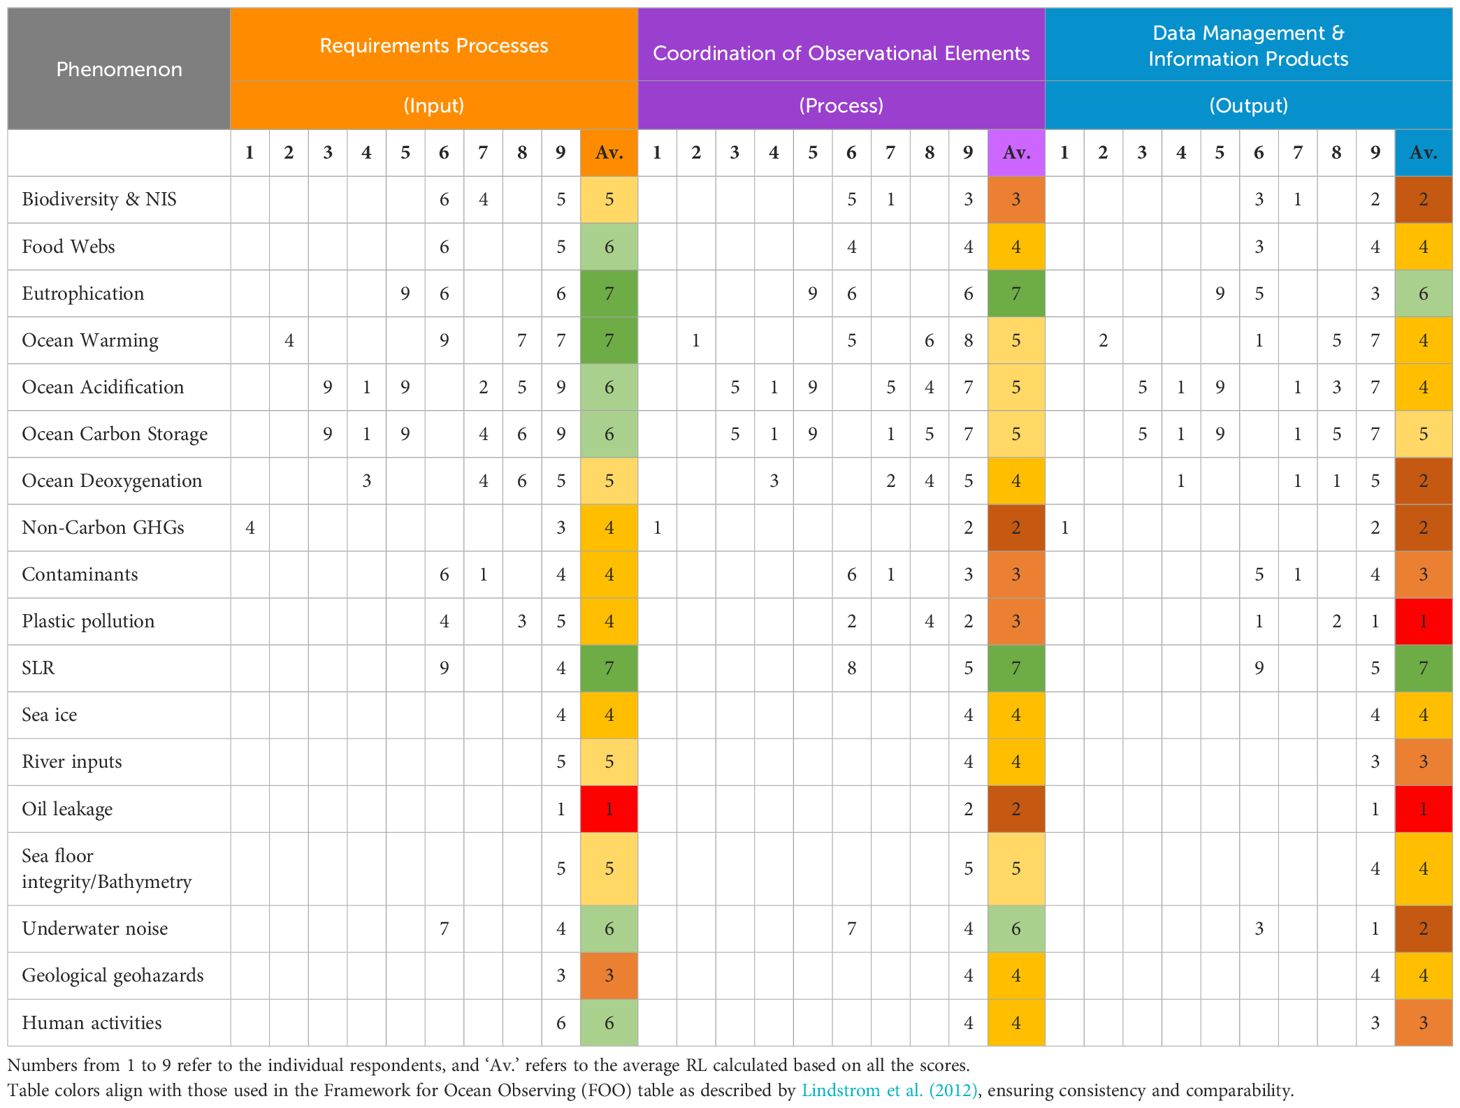
Table 3. Detailed scores provided by the respondents for each ocean phenomenon across each pillar.
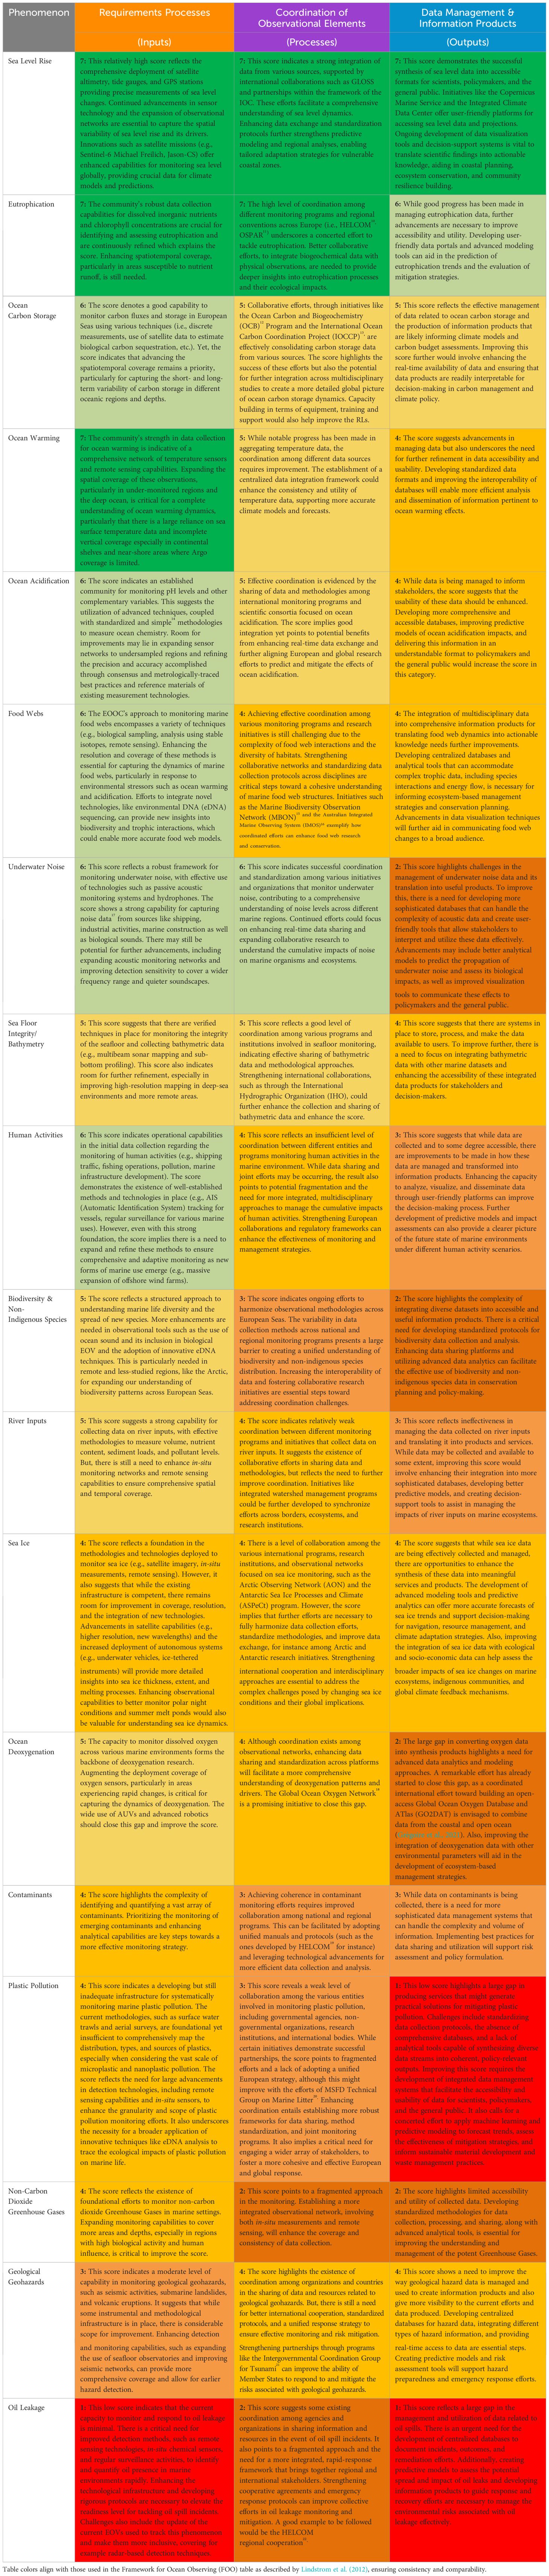
Table 4. Summary of the scores’ interpretation in each pillar for each of the 18 ocean phenomena covered in this assessment.
3.1 General results of the scoring
Several phenomena exhibit varying RLs across the three pillars of “Requirements Processes = Inputs”, “Coordination of Observational Elements = Processes”, and “Data Management & Information Products = Outputs” (Table 3). This variation indicates the degree to which different oceanic phenomena are understood, monitored, and managed within European Seas. For instance, phenomena such as “Sea Level Rise” and “Eutrophication” show a nearly balanced score distribution across the three pillars, suggesting a relatively even focus on Inputs, Processes, and Outputs in these phenomena (Table 3). Conversely, the focus of “Oil Leakage” and “Geological Geohazards” is primarily concentrated in the Inputs and Processes pillars, with minimal attention to the Outputs pillar, which highlights the need for improvement in the development of data management and information products for these phenomena. In contrast, “Plastic Pollution” has a large focus on Inputs, suggesting that more resources or attention are being directed towards requirements and processes rather than observational coordination or output products.
Additionally, the concept of the “Valley of Death” is highly relevant to the scores presented in Table 3, where several ocean phenomena, such as Eutrophication, Ocean Carbon Storage, Ocean Acidification, Ocean Warming, Seafloor Integrity/Bathymetry, Food Webs, and Sea Ice, are rated 4-6 for “Data Management & Information Products = Outputs”. This reflects a critical bottleneck in moving from RLs 4 to 6, often referred to as the “Valley of Death”, where many technologies struggle to transition from prototype to reliable operational systems in real-world environments (Ford et al., 2007; Bauer et al., 2015; Hensen et al., 2015). For these ocean phenomena, the main limiting factors appear to be related to data validation, quality assurance/quality control (QA/QC), and archiving, rather than sensor development. This underscores the urgent need for a greater focus on enhancing data management infrastructure and support services to ensure that ocean monitoring systems can progress beyond this critical development stage and achieve full operational readiness. Given the various ongoing European initiatives, such as the Digital Twin of the Ocean23 projects (e.g., EDITO24, DTO-BIOFLOW25, and DIGI4ECO26), which may enhance these scores—particularly in the third pillar, “Data Management & Information Products = Outputs”, where data harmonization is urgently required—the following results can provide valuable guidance on the most pressing areas for action.
3.2 Scores for each phenomenon
In this section, the approach and its scores are concisely interpreted to showcase their relevance. A summary of the scores’ interpretation can be found in Table 3. A detailed analysis of gaps and recommendations has been published previously (Hassoun et al., 2024).
Sea Level Rise [Scored 7 for Requirements Processes, 7 for Coordination of Observational Elements, 7 for Data Management & Information Products]: The EOOC demonstrates ‘fit-for-purpose’ readiness in all pillars for observing and forecasting sea level rise. This suggests that a robust community is in place for tracking changes, likely due to the critical nature of this phenomenon for coastal management and marine infrastructures, as well as the feasibility of measuring it compared to other, more complex phenomena. The integration of networks like tide gauges and satellite altimetry ensures precise data collection, enhancing early warning systems and informing adaptation strategies. Continuous advancements and maintenance of these high scores are essential to address the escalating impacts of climate change-induced sea level rise. To sustain and further develop these RLs, the EOOC needs to focus on refining data collection methodologies, enhancing the accuracy of predictive models, and strengthening international collaborations, especially in data exchange and technological innovation (Jevrejeva et al., 2014; Bonaduce et al., 2016; Pérez-Gómez et al., 2021; Karstensen et al., 2020).
Eutrophication [Scored 7 for Requirements Processes, 7 for Coordination of Observational Elements, 6 for Data Management & Information Products]: Eutrophication is relatively well-monitored, with strong processes in place for data collection and coordination. However, there is slightly lower capability in transforming data into comprehensive information products. The Outputs RL indicates that while data is being managed effectively, further enhancement in accessibility and integration with other environmental data could be beneficial (EuroStat, 2020). Emphasizing the monitoring of nutrient dynamics and algal blooms will help manage the impacts of coastal eutrophication more effectively.
Ocean Carbon Storage [Scored 6 for Requirements Processes, 5 for Coordination of Observational Elements, 5 for Data Management & Information Products]: The evaluation of ocean carbon storage within the EOOC initiatives reveals a robust community capable of assessing how the ocean captures and stores carbon. High scores across all pillars indicate a well-established approach to observing, with good coordination among different initiatives and effective data management practices. The community is well-suited to provide essential data for carbon budgeting and climate modeling. Yet, as with any complex community, there is room for continuous improvement, especially in enhancing the practical application of data to support climate change mitigation strategies.
Ocean Warming [Scored 7 for Requirements Processes, 5 for Coordination of Observational Elements, 4 for Data Management & Information Products]: The ‘fit-for-purpose’ score in the Inputs pillar indicates strong infrastructure for collecting temperature data across European Seas. However, challenges remain in several areas, such as 1) in the reliance on sea surface temperature data, with the vertical aspect, particularly in continental shelf and nearshore regions, often overlooked due to limited coverage (e.g., of Argo floats) in these areas, 2) in coordinating these diverse data streams into consistent and actionable insights, and 3) in improving data integration and application toward mitigative strategies, as reflected in the lower Processes and Outputs scores. Addressing these gaps requires improving the integration of observations with ecological models and enhancing data quality and accessibility. A specific focus is needed to understand the long-term trends in temperature changes, especially in the high-latitude regions affected by sea ice melting and in the deep ocean (Kwok and Maksym, 2014; Buch et al., 2017).
Ocean Acidification [Scored 6 for Requirements Processes, 5 for Coordination of Observational Elements, 4 for Data Management & Information Products]: Monitoring ocean acidification is progressing, with a ‘fit-for-purpose’ Inputs score and a ‘verification’ score for process readiness. Challenges in data management and availability of information products highlight the need for advanced analytical techniques and improved data sharing (Hassoun et al., 2022; Álvarez et al., 2023). Wider deployment of sensors and autonomous observing platforms for pH and other carbonate system variables, especially in the deep ocean, can further these efforts. Current RLs suggest a strong operational foundation within the EOOC initiatives for monitoring ocean acidification. While the fundamental scientific infrastructure is in place to observe and forecast ocean acidification, translating this into a coordinated European action with accessible information remains an area for development.
Food Webs [Scored 6 for Requirements Processes, 4 for Coordination of Observational Elements, 4 for Data Management & Information Products]: Observing and forecasting the components of food webs is complex compared to physical ocean phenomena (e.g., sea level rise, and ocean warming). Nonetheless, the assessment shows good readiness in Inputs but indicates room for improvement in observational coordination and information product development (Ratnarajah et al., 2022). Enhanced communication and harmonized research practices are essential for managing data on phytoplankton, zooplankton, and fish abundance, which are crucial for ecosystem management and the sustainability of marine resources.
Underwater Noise [Scored 6 for Requirements Processes, 6 for Coordination of Observational Elements, 2 for Data Management & Information Products]: The high scores in the first two pillars reflect a recognition of underwater noise as an important environmental concern, leading to concerted efforts to observe it. However, the low score in the Outputs pillar highlights a gap in translating these data into actionable information and useful products that can inform policy and stakeholders. Strategies to address this gap include developing comprehensive databases, harmonizing noise measurement standards, and incorporating noise management into marine spatial planning (Dekeling et al., 2016). Ongoing initiatives, such as the establishment of databases for underwater biological sounds (Parsons et al., 2022) through projects like GLUBS27 and international efforts such as IQOE28, are actively contributing to the development of the ocean sound EOV. While there is a strong framework for capturing underwater noise, large improvements are needed in managing and utilizing this data (Hawkins et al., 2015). Enhancing data management, increasing the availability of information products, adopting innovative acoustic technologies, and improving databases for noise monitoring will support the mitigation of impacts on marine life (Harris et al., 2018).
Sea Floor Integrity/Bathymetry [Scored 5 for Requirements Processes, 5 for Coordination of Observational Elements, 4 for Data Management & Information Products]: Observing sea floor integrity and bathymetry indicates a moderate RL. Future efforts should prioritize deploying modern mapping technologies, coordinating European data sharing, and integrating these data into maritime safety and environmental protection frameworks (Ardhuin, 2018; EMODnet, 2018a; EMODnet, 2018b; EMODnet, 2018c). The scores indicate that the EOOC has made considerable progress in collecting and coordinating bathymetric data. However, to further enhance the monitoring of sea floor integrity, there is a need for increased deployment of high-resolution multibeam echosounders, the establishment of standardized data collection protocols across Europe, and improved data accessibility. Continuous improvements are essential to address unmapped areas, keep pace with technological advancements, and ensure that the growing volume of data continues to be effectively managed and integrated into decision-making processes for ocean governance and conservation.
Human Activities [Scored 6 for Requirements Processes, 4 for Coordination of Observational Elements, 3 for Data Management & Information Products]: Human activities, such as fisheries, are reasonably well-monitored, reflecting an operational input community. However, there are noticeable gaps in coordination and output that can be addressed by bolstering integration of socioeconomic data into environmental monitoring and enhancing stakeholder engagement (EMODnet, 2017; EMODnet, 2018a; EMODnet, 2018b; EMODnet, 2018c). The monitoring of human activities indicates a solid foundation for data collection, including vessel monitoring, fisheries management, and pollution control. Nevertheless, further efforts are needed to improve the sharing and utilization of data among regulatory bodies and the scientific community. Additionally, better interpretation of these data is crucial for distinguishing between human and natural effects, ultimately leading to a more comprehensive understanding of both direct and indirect human impacts on marine environments.
Biodiversity & Non-Indigenous Species [Scored 5 for Requirements Processes, 3 for Coordination of Observational Elements, 2 for Data Management & Information Products]: Biodiversity and non-indigenous species observing have moderate scores indicating progress in data collection and some level of coordination among European institutes and researchers. However, improvements are necessary to address the identified gaps in data products and services, especially in producing meaningful knowledge from the collected data, analyzing long-term patterns, and integrating these data into marine management frameworks (Tintoré et al., 2019; SWD, 2020). Challenges in observational coordination and data management hinder a holistic understanding and managing biodiversity and non-indigenous species impacts on marine ecosystems. To enhance these efforts, the EOOC needs to organize systematic monitoring programs and adopt innovative tools for efficient observations, focusing on the less-understood European Seas to facilitate the development of biosecurity programs in regions lacking baseline data (Carvalho et al., 2023).
River Inputs [Scored 5 for Requirements Processes, 4 for Coordination of Observational Elements, 3 for Data Management & Information Products]: The EOOC approach to observing river inputs reflects a solid foundation with notable room for growth. The community demonstrates a good capability to capture the quantity and quality of materials from rivers entering marine environments, such as nutrients, sediments, and pollutants. While these efforts are well-coordinated among various stakeholders, the scores suggest that further alignment could streamline the efficiency of these initiatives. The lower score (RL in ‘proof of concept’) in data management highlights the need for enhanced processing and synthesis of data into actionable insights, which is crucial for addressing the impacts of river inputs on coastal ecosystems and for managing the land-sea interface more effectively (EMODnet, 2018a; EMODnet, 2018b; EMODnet, 2018c; Ratnarajah, 2021).
Sea Ice [Scored 4 for Requirements Processes, 4 for Coordination of Observational Elements, 4 for Data Management & Information Products]: The EOOC initiative has demonstrated a balanced approach to sea ice observing, with consistent RLs at the ‘trial’ level across all pillars. This reflects the critical importance of continued investment in observational infrastructure, collaboration, and data management innovation. While strides have been made in observing sea ice, continued investment in remote sensing and in-situ measurements is crucial for improving the understanding and forecasting of sea ice. Enhancing the integration of diverse data sources and standardizing methodologies will support better climate change response strategies in polar regions, for instance. Specific focus is needed to address the challenges of observing sea ice extent, thickness, and overall health in the context of climate change (Kwok and Maksym, 2014; Leppäranta, 2023).
Ocean Deoxygenation [Scored 5 for Requirements Processes, 4 for Coordination of Observational Elements, 2 for Data Management & Information Products]: The EOOC monitoring efforts in this area highlight a well-established data collection system, but there remains considerable scope for improvement in the synthesis and application of these data. Despite advances in sensor technology, persistent gaps in comprehensive dissolved oxygen coverage remain, particularly in offshore regions and deep waters (Grégoire et al., 2021; 2023). Increasing temporal resolution and sampling frequency, as suggested by Pereiro et al. (2022), is critical for capturing the dynamic variability of ocean oxygen levels, especially in areas prone to deoxygenation. Moreover, the current reliance on static monitoring systems in coastal areas and the absence of robust, long-term autonomous platforms in the open ocean hinder the ability to effectively observe large-scale deoxygenation trends. Addressing these gaps requires investment in Automatic Underwater Vehicles (AUVs) and advanced observational platforms, which could greatly enhance our understanding of ocean oxygen dynamics, particularly in Oxygen Minimum Zones (OMZs) and other critical regions where observations remain sparse. Additionally, integrating these improved observational capabilities into global databases and networks would largely improve our ability to manage the ecological impacts of oxygen loss on marine ecosystems and services.
Contaminants [Scored 4 for Requirements Processes, 3 for Coordination of Observational Elements, 3 for Data Management & Information Products]: Observing and monitoring contaminants, such as heavy metals and pesticides, is moderately developed but requires harmonization across EU efforts. Addressing the variety of emerging contaminants, ensuring interoperability of data, and aligning strategies with international organizations are critical for enhancing monitoring, predictability and management. Also, there are various challenges in achieving comprehensive coverage and integrating data into actionable insights (SWD, 2020; EuroStat, 2020).
Plastic Pollution [Scored 4 for Requirements Processes, 3 for Coordination of Observational Elements, 1 for Data Management & Information Products]: Obtained RLs for plastic pollution highlight the developing status of monitoring efforts. A moderate score, categorized as ‘trial’, for requirements processes indicates that foundational methods and tools are being employed to detect and quantify plastic contaminants in marine ecosystems. The score points to established but improvable capabilities, hinting at the need for broader coverage and more refined detection methodologies, particularly for microplastics. The lower scores for coordination of observational elements and data management & information products suggest that, while collaborative efforts exist, large enhancements are necessary (Lebreton et al., 2017; Koelmans et al., 2019; Borrelle et al., 2020; Ajith et al., 2020). The challenges include insufficient spatial and temporal coverage, difficulties in integrating diverse data sources, and a lack of standardization in data collection and analysis, or at least in adopting the newly released best practices and policies. These gaps indicate that the EOOC’s efforts in observing plastic pollution are still in the developmental stages, with substantial room for enhancement in data collection, coordination, and information synthesis.
Non-Carbon Dioxide Greenhouse Gases [Scored 4 for Requirements Processes, 2 for Coordination of Observational Elements, 2 for Data Management & Information Products]: The scores clearly reflect the need for large improvement across all pillars for non-carbon dioxide GHGs monitoring, such as methane (CH4) and nitrous oxide (N2O), in European Seas. The EOOC has made initial efforts to observe these gases; however, challenges remain, particularly in coordination and data management, indicating substantial room for improvement. Expanding spatial and temporal monitoring coverage, strengthening atmospheric monitoring capabilities, and standardizing measurement protocols as well as providing sustainable long-term data archive infrastructure are key to understanding the global dynamics of these gases (Bange et al., 2019; Bange, 2022; Kock and Bange, 2015; Rees et al., 2022).
Geological geohazards [Scored 3 for Requirements Processes, 4 for Coordination of Observational Elements, 4 for Data Management & Information Products]: The scores reflect the early-stage development of observational and data management systems for marine geological geohazards. The low scores across all three pillars highlight key gaps in the capacity to monitor and respond to such events. A major contributing factor to these low scores is the limited integration of real-time seismic data into the ocean observing framework. While global seismic networks provide near real-time alerts for terrestrial events, they have not yet been formally incorporated into EOVs for marine hazard monitoring. For instance, earthquakes with magnitudes greater than 7 at sea, which can trigger tsunami warnings, are detected by terrestrial seismic arrays. However, these data are not fully integrated into marine observation systems, limiting the effectiveness of early-warning mechanisms. The gap in recognizing advancements in real-time ocean-based seismic data, such as those noted by Roset et al. (2018), further underscores the need to update the criteria for this EOV. Moreover, while tsunami early warning systems, such as those developed under the IOC-UNESCO Tsunami Programme29, play a vital role, they are predominantly linked to terrestrial networks rather than ocean-based real-time seismic monitoring. Given the existence of these real-time seismic networks, it is essential to integrate them more effectively into marine geohazard monitoring frameworks to enhance coordination and improve data products. A successful example is ‘WARN’, the Web-enabled Awareness Research Network, part of Ocean Networks Canada’s “Oceans 2.0” data management system, which performs early detection of tsunami and earthquakes in Canada (Heesemann et al., 2014). While some mechanisms for detecting geological events are in place, substantial improvements are still needed to strengthen observational networks and develop specialized data management systems. Ongoing efforts must focus not only on sensor development but also on ensuring robust data management and real-time operational frameworks (Ramirez-Llodra et al., 2011; McQuaid et al., 2020).
Oil Leakage [Scored 1 for Requirements Processes, 2 for Coordination of Observational Elements, 1 for Data Management & Information Products]: Monitoring oil leakage is evidently underdeveloped in most European Seas, although it is relatively advanced in the Baltic Sea30. Enhancing oil spill detection technology, implementing more stringent monitoring protocols, and developing robust data management frameworks are vital for protecting European Seas in the event of oil spill incidents. Our scores highlight an area of concern within the EOOC’s current initiatives that requires immediate and comprehensive improvements (EMODnet, 2016; 2020). One factor contributing to the low scores is the gap in current EOVs. For instance, the Ocean Colour EOV focuses on visible and infrared reflectance, while oil spill detection relies on radar wavelengths. Synthetic Aperture Radar (SAR) data, such as those from Sentinel-1, are commonly used for oil spill detection (Topouzelis, 2008; Misra and Balaji, 2017; Wang et al., 2019), but these data are not currently integrated into any existing EOV. Incorporating a specific EOV related to contaminants, with sub-variables for petroleum hydrocarbons and other pollutants from oil spills, would largely improve monitoring capabilities. This gap underscores the need to update certain EOVs to address threats like oil spills. Developing more advanced monitoring and detection systems, strengthening coordination mechanisms, and establishing efficient data management frameworks are critical steps toward safeguarding marine environments from potentially detrimental impacts of oil spills.
4 Strengths and limitations of the scoring approach
Our assessment is grounded on an extensive literature review of key EU documents that address various ocean phenomena at European level, complemented by direct communication with researchers from the EOOC. The pan-EU scoring approach that we propose here offers a holistic perspective on the status of the EOOC’s capacity to observe and predict various ocean phenomena. The scores presented for each phenomenon are not solely based on our personal assessment but also incorporate input from the EOOC members who tested our proposed scoring approach and provided both scores and suggestions for improvement. This collaborative process ensures that, while the scoring system may carry some degree of subjectivity, it remains inclusive and reflects the perspectives and feedback of the EOOC.
However, it is important to note that European regions and nations have varying capacities and specific needs, which might to some degree affect the scores derived in our assessment, in case the scoring approach will be applied for a specific European sea (e.g., Baltic Sea, Mediterranean Sea, etc.) or at the national level. Implementing our scoring approach at the national scale would help to build a more detailed European picture by relying on a nation by nation independent assessment. In this case, the scoring approach would not only offer a more precise and useful evaluation of national gaps, since observations are mainly nationally-funded, but it would also help identify regional gaps as challenges, services, and products often have a strong regional dimension. This approach could ultimately provide more targeted recommendations that might be addressed nationally and/or regionally. Further, we also acknowledge that the number of feedbacks (n=9) might be considered small, and some few ocean phenomena would benefit from additional experts’ inputs (e.g., Oil spills, etc.). This should be considered in future applications of this scoring approach. Moreover, averaging the scores of respondents may not hold in all cases, and alternative measures, such as the median or a consensus score, could provide different insights. For example, the median is less sensitive to extreme values and could be useful when scores are highly variable. In this study, we chose to use the mean to capture the full range of opinions and allow for more detailed comparisons of capacities across various criteria, particularly given the small number of participants. However, future iterations of this scoring approach should consider other aggregation methods to further refine the assessment approach. This highlights the challenge of generalizing our findings across the broader EOOC. Future efforts could additionally benefit from larger datasets, which would enable the use of more rigorous statistical analysis and thus provide greater confidence in quantifying the RLs of the various ocean phenomena. Additionally, our scoring approach is based on the 10-year-old FOO requirements table, hindering us from applying it to evaluate other aspects of the ocean value chain, such as coordination, management, modeling, policies and legislations, and governance. Therefore, our exercise proves that this table needs to be updated to evaluate the EOOC initiative’s RLs in observing and forecasting not only ocean phenomena but also in fulfilling the objectives of the various ocean value chain components (e.g., coordination and management, data FAIRness, marine policies and legislations, and ocean literacy) in a regular and systematic way. Acknowledging the inherent complexity of responding to the survey is also essential. Consequently, given its efficacy as a useful tool, an improvement could involve providing explicit, user-friendly instructions to assist respondents in future assessments.
5 Conclusions
In this paper, we propose the adoption of a scoring approach within the European Ocean Observing Community (EOOC). By systematically evaluating Requirements Processes, Coordination of Observational Elements, and Data Management & Information Products, this approach not only highlights the strengths and capabilities in crucial ocean topics but it also clearly identifies specific areas where improvements are essential. Scores reflecting moderate to strong capabilities in data collection and coordination underscore the EOOC’s commitment to understanding complex ocean phenomena. Meanwhile, lower scores in data management point to critical opportunities for enhancing the usability of the collected data. By emphasizing the importance of comprehensive observing, collaborative efforts, and strategic data synthesis, the scoring approach might foster a culture of continuous improvement and innovation. It enables relevant stakeholders (e.g., researchers, institute directors, the EU commission, and funders) to remain agile and responsive to the dynamic challenges posed by ocean health and climate change, ultimately leading to more informed policies, sustainable resource management, and oriented calls for projects.
Data availability statement
The original contributions presented in the study are included in the article/supplementary material. Further inquiries can be directed to the corresponding author.
Author contributions
AH: Writing – review & editing, Writing – original draft, Visualization, Validation, Methodology, Investigation, Formal analysis, Data curation, Conceptualization. TT: Writing – review & editing, Validation, Supervision, Project administration, Methodology, Funding acquisition. EH: Writing – review & editing, Validation, Methodology. IL: Writing – review & editing, Project administration, Methodology. MÁ: Writing – review & editing, Methodology. GP: Writing – review & editing, Methodology. MG: Writing – review & editing, Methodology. DV: Writing – review & editing, Methodology. MG: Writing – review & editing, Methodology. HB: Writing – review & editing, Methodology. CL: Writing – review & editing, Methodology. JK: Writing – review & editing, Methodology.
Funding
The author(s) declare financial support was received for the research, authorship, and/or publication of this article. This work has been supported by the European Union, through the EuroSea project, in the context of the Horizon 2020 research and innovation programme under grant agreement No 862626.
Acknowledgments
The authors would like to thank both reviewers for their very constructive comments and suggestions that helped improve this manuscript.
Conflict of interest
The authors declare that the research was conducted in the absence of any commercial or financial relationships that could be construed as a potential conflict of interest.
Publisher’s note
All claims expressed in this article are solely those of the authors and do not necessarily represent those of their affiliated organizations, or those of the publisher, the editors and the reviewers. Any product that may be evaluated in this article, or claim that may be made by its manufacturer, is not guaranteed or endorsed by the publisher.
Footnotes
- ^ EU Marine Strategy Framework Directive - European Commission (europa.eu).
- ^ The European Green Deal - European Commission (europa.eu).
- ^ 2050 long-term strategy - European Commission (europa.eu).
- ^ Essential Ocean Variables – Global Ocean Observing System (goosocean.org).
- ^ Global Ocean Observing System – GOOS is a permanent global system for observations, modeling, and analysis of marine and ocean data (goosocean.org).
- ^ D1.9_Gaps_of_the_European_Ocean_Observing_and_Forecasting_System.pdf (geomar.de).
- ^ Descriptors under the Marine Strategy Framework Directive - European Commission (europa.eu).
- ^ Phenomena & Threats | CMEMS (copernicus.eu).
- ^ Intergovernmental Oceanographic Commission | Intergovernmental Oceanographic Commission (unesco.org).
- ^ HELCOM.
- ^ Convention | OSPAR Commission.
- ^ Ocean Carbon & Biogeochemistry (us-ocb.org).
- ^ HOME (ioccp.org).
- ^ Practical Best Practices for Ocean Acidification Monitoring (pubpub.org).
- ^ MBON – Marine Biodiversity Observation Network (marinebon.org).
- ^ Introducing IMOS (IMOS.org.au).
- ^ Home | International Quiet Ocean Experiment (IQOE).
- ^ global-ocean-oxygen-network (unesco.org).
- ^ Manuals and guidelines – HELCOM.
- ^ MSFD Technical Group on Marine Litter (europa.eu).
- ^ https://tsunami.ioc.unesco.org/en/coordination-and-information
- ^ Aerial surveillance and regional cooperation remain key in detecting oil spills in the Baltic Sea – HELCOM.
- ^ European Digital Twin of the Ocean (European DTO) - European Commission (europa.eu).
- ^ European Digital Twin Ocean - EDITO.
- ^ Biodiversity Data for Digital Twins of the Ocean | DTO-BIOFLOW.
- ^ The Project | Digi4Eco.
- ^ GLUBS | Global library of underwater biological sounds.
- ^ International Quiet Ocean Experiment (IQOE).
- ^ Intergovernmental Coordination Group for the Tsunami Early Warning and Mitigation System in the North-Eastern Atlantic, the Mediterranean and Connected Seas (ICG/NEAMTWS) | Tsunami Programme UNESCO-IOC.
- ^ Aerial surveillance and regional cooperation remain key in detecting oil spills in the Baltic Sea – HELCOM.
References
Ajith N., Arumugam S., Parthasarathy S., Manupoori S., Janakiraman S. (2020). Global distribution of microplastics and its impact on marine environment—a review. Environ. Sci. pollut. Res. 27, 25970–25986. doi: 10.1007/s11356-020-09015-5
Álvarez M., Catalá T. S., Civitarese G., Coppola L., Hassoun A. E., Ibello V., et al. (2023). “Mediterranean Sea general biogeochemistry,” in Oceanography of the Mediterranean Sea (Elsevier), 387–451. Available at: https://www.sciencedirect.com/science/article/abs/pii/B9780128236925000042.
Ardhuin F. (2018). Large-scale forces under surface gravity waves at a wavy bottom: A mechanism for the generation of primary microseisms. Geophysical Res. Lett. 45, 8173–8181. doi: 10.1029/2018GL078855
Bange H. W. (2022). Non-CO2 greenhouse gases (N2O, CH4, CO) and the ocean. One Earth 5, 1316–1318. doi: 10.1016/j.oneear.2022.11.011
Bange H. W., Arévalo-Martínez D. L., de la Paz M., Farías L., Kaiser J., Kock A., et al. (2019). A harmonized nitrous oxide (N2O) ocean observation network for the 21st century. Front. Mar. Sci. 6. doi: 10.3389/fmars.2019.00157
Bauer R. A., Millar P. S., Norton C. D. (2015). “Bridging the technology readiness “Valley of death” Utilizing nanosats,” in Ka and Broadband Communications Conference Bologna, Italy. Available at: https://ntrs.nasa.gov/citations/20150020471.
Bonaduce A., Pinardi N., Oddo P., Spada G., Larnicol G. (2016). Sea-level variability in the Mediterranean Sea from altimetry and tide gauges. Climate Dynamics 47, 2851–2866. doi: 10.1007/s00382-016-3001-2
Borrelle S. B., Ringma J., Law K. L., Monnahan C. C., Lebreton L., McGivern A., et al. (2020). Predicted growth in plastic waste exceeds efforts to mitigate plastic pollution. Science 369, 1515–1518. doi: 10.1126/science.aba3656
Buch E., Palacz A., Karstensen J., Fernandez V., Dickey-Collas M., Borges D., et al. (2017). AtlantOS – 633211, Deliverable number D.1.3. Capacities Gap Anal. Available at: https://atlantos-h2020.eu/download/deliverables/1.3%20Capacities%20and%20Gap%20analysis.pdf.
Carvalho S., Shchepanik H., Aylagas E., Berumen M. L., Costa F. O., Costello M. J., et al. (2023). . Hurdles and opportunities in implementing marine biosecurity systems in data-poor regions. BioScience 73, 494–512. doi: 10.1093/biosci/biad056
Dekeling R., Tasker M., Ainslie M., Andersson M., André M., Borsani F., et al. (2016). The European marine strategy: noise monitoring in European marine waters from 2014. In: Popper A., Hawkins A. (eds) The Effects of Noise on Aquatic Life II. Advances in Experimental Medicine and Biology, vol 875. Springer, New York, NY. doi: 10.1007/978-1-4939-2981-8_24
DoD, U.S (2023). Technology readiness assessment guidebook-office of the executive director for systems engineering and architecture-office of the under secretary of defense for research and engineering. Available online at: https://www.cto.mil/wp-content/uploads/2023/07/TRA-Guide-Jun2023.pdf.
EMODnet (2016). Growth and innovation in the ocean economy: north sea checkpoint. Available online at: https://emodnet.ec.europa.eu/sites/emodnet.ec.europa.eu/files/public/Final%20report_NorthSea.pdf.
EMODnet (2017). Growth and innovation in ocean economy Gaps and priorities in sea basin observation and data D12.5 Version: V3. Available online at: https://emodnet.ec.europa.eu/sites/emodnet.ec.europa.eu/files/public/D11.4-draft18.pdf.
EMODnet (2018a). Atlantic EMODnet sea-basin checkpoints sea basin checkpoint lot 2: atlantic, D 14.2.1, version: 2.0.
EMODnet (2018b). Baltic Checkpoint Final Report/EMODnet Sea-basin checkpoints Lot n° 3 – Baltic, EASME/EMFF/2014/1.3.1.4. Available online at: https://emodnet.ec.europa.eu/sites/emodnet.ec.europa.eu/files/public/BSCP_%20FinalReport_revised.pdf.
EMODnet (2018c). Black sea checkpoint second data adequacy report, D 15.4 version: V7. Available online at: https://emodnet.ec.europa.eu/sites/emodnet.ec.europa.eu/files/public/D15.4_DAR2_v7_FINAL.pdf.
EMODnet (2020). Arctic Ocean EMODnet Sea-basin checkpoints Lot n° 1 Arctic, Final Report. Available online at: https://emodnet.ec.europa.eu/sites/emodnet.ec.europa.eu/files/public/FinalReportArctic%20new%20style.pdf.
European Marine Board (2019). Navigating the future V: marine Science for a Sustainable Future (Ostend, Belgium: Position Paper 24 of the European Marine Board), ISBN: ISBN: 9789492043757. doi: 10.5281/zenodo.2809392
EuroStat (2020). Sustainable development in the European Union. Available online at: https://ec.europa.eu/eurostat/documents/3217494/11011074/KS-02-20-202-EN-N.pdf/334a8cfe-636a-bb8a-294a-73a052882f7f?t=1592994779000.
Ford G., Koutsky T., Spiwak L. (2007). A valley of death in the innovation sequence: an economic investigation. Res. Eval. 18. doi: 10.3152/095820209X481057
Grégoire M., Garçon V., Garcia H., Breitburg D., Isensee K., Oschlies A., et al. (2021). A global ocean oxygen database and atlas for assessing and predicting deoxygenation and ocean health in the open and coastal ocean. Front. Mar. Sci. 8. doi: 10.3389/fmars.2021.724913
Grégoire M., Oschlies A., Canfield D., Castro C., Ciglenečki I., Croot P., et al. (2023). “Ocean Oxygen: the role of the Ocean in the oxygen we breathe and the threat of deoxygenation,” in Future science brief No. 10 of the European Marine Board. Eds. Rodriguez Perez A., Kellett P., Alexander B., Muñiz Piniella Á., Van Elslander J., Heymans J. J. (Ostend, Belgium), ISBN: ISBN: 9789464206180. doi: 10.5281/zenodo.7941157
Harris C. M., Thomas L., Falcone E. A., Hildebrand J. A., Houser D., Kvadsheim P. H., et al. (2018). Marine mammals and sonar: Dose-response studies, the risk-disturbance hypothesis and the role of exposure context. J. Appl. Ecol. 55, 396–404. doi: 10.1111/1365-2664.12955
Hassoun A. E. R., Bantelman A., Canu D., Comeau S., Galdies C., Gattuso J. P., et al. (2022). Ocean acidification research in the Mediterranean Sea: Status, trends and next steps. Front. Mar. Sci. 9. doi: 10.3389/fmars.2022.892670/full
Hassoun A. E. R., Tanhua T., Heslop E., Lips I. (2023). Scoring approach for the European ocean observing & Forecasting system (EOOFS) (Version V1). Zenodo. doi: 10.5281/zenodo.10075908
Hassoun A. E. R., Tanhua T., Lips I., Heslop E., Petihakis G., Karstensen J. (2024). The European Ocean Observing Community: urgent gaps and recommendations to implement during the UN Ocean Decade. Front. Mar. Sci. 11. doi: 10.3389/fmars.2024.1394984
Hawkins A. D., Pembroke A. E., Popper A. N. (2015). Information gaps in understanding the effects of noise on fishes and invertebrates. Rev. Fish Biol. Fisheries 25, 39–64. doi: 10.1007/s11160-014-9369-3
Heesemann M., Insua T. L., Scherwath M., Juniper S. K., Moran K. (2014). Ocean Networks Canada: From geohazards research laboratories to Smart Ocean Systems. Oceanography 27, 151–153. doi: 10.5670/oceanog.2014.50
Hensen J., Loonen R., Archontiki M., Kanellis M. (2015). Using building simulation for moving innovations across the “Valley of Death. REHVA J. 52, 58–62. Available at: https://www.researchgate.net/profile/Roel-Loonen/publication/276205251_Using_building_simulation_for_moving_innovations_across_the_Valley_of_Death/links/5552333108ae6fd2d81d4406/Using-building-simulation-for-moving-innovations-across-the-Valley-of-Death.pdf.
Jevrejeva S., Moore J. C., Grinsted A., Matthews A. P., Spada G. (2014). Trends and acceleration in global and regional sea levels since 1807. Global Planetary Change 113, 11–22. Available at: https://www.sciencedirect.com/science/article/pii/S0921818113002750?casa_token=Z4gBCRfKHaAAAAAA:wxg7KFPXmxSmMVcHrraLQ94CqO_yQg0CYZ2TOFX_RL4JT6fUbuIXItAFL8dPAIKFioGpXxZshn8s0050.
Karstensen J., Petihakis G., Fernandez V. (2020). D3.2. Observing Networks initial Assessment. Available online at: https://eurosea.eu/download/eurosea-d3-2-observing-networks-initial-assessment/?wpdmdl=3570&refresh=63b6f6ea8a6c31672935146.
Kock A., Bange H. W. (2015). Counting the ocean’s greenhouse gas emissions. Eos Earth Space Sci. News 96, 10–13. doi: 10.1029/2015eo023665
Koelmans A. A., Nor N. H. M., Hermsen E., Kooi M., Mintenig S. M., De France J. (2019). Microplastics in freshwaters and drinking water: Critical review and assessment of data quality. Water Res. 155, 410–422. doi: 10.1016/j.watres.2019.02.054
Kwok R., Maksym T. (2014). Snow depth of the Weddell and Bellingshausen sea ice covers from IceBridge surveys in 2010 and 2011: An examination. J. Geophys. Res. Oceans 119, 4141–4167. doi: 10.1002/2014JC009943
Lange N., Tanhua T., Pfeil B., Bange H. W., Lauvset S. K., Grégoire M., et al. (2023). A status assessment of selected data synthesis products for ocean biogeochemistry. Front. Mar. Sci. 10. doi: 10.3389/fmars.2023.1078908
Lebreton L. C., van der Zwet J., Damsteeg J. W., Slat B., Andrady A., Reisser J. (2017). River plastic emissions to the world’s oceans. Nat. Commun. 8, 15611. doi: 10.1038/ncomms15611
Leppäranta M. (2023). History and Future of Snow and Sea Ice in the Baltic Sea (Oxford Research Encyclopedia of Climate Science). doi: 10.1093/acrefore/9780190228620.013.891
Lindstrom E., Gunn J., Fischer A., McCurdy A., Glover L., Alverson K., et al. (2012). “A framework for ocean observing,” in By the task team for an integrated framework for sustained ocean observing (UNESCO, Paris). Available at: https://repository.oceanbestpractices.org/handle/11329/558.
Martín Míguez B., Novellino A., Vinci M., Claus S., Calewaert J.-B., Vallius H., et al. (2019). The European marine observation and data network (EMODnet): visions and roles of the gateway to marine data in Europe. Front. Mar. Sci. 6. doi: 10.3389/fmars.2019.00313
McQuaid K. A., Attrill M. J., Clark M. R., Cobley A., Glover A. G., Smith C. R., et al. (2020). Using habitat classification to assess representativity of a protected area network in a large, data-poor area targeted for deep-sea mining. Front. Mar. Sci. 7. doi: 10.3389/fmars.2020.558860
Misra A., Balaji R. (2017). Simple approaches to oil spill detection using sentinel application platform (SNAP)-ocean application tools and texture analysis: A comparative study. J. Indian Soc. Remote Sens. 45, 1065–1075. doi: 10.1007/s12524-016-0658-2
Parsons M. J. G., Lin T.-H., Mooney T. A., Erbe C., Juanes F., Lammers M., et al. (2022). Sounding the call for a global library of underwater biological sounds. Front. Ecol. Evol. doi: 10.3389/fevo.2022.810156
Pearlman J., Bushnell M., Coppola L., Karstensen J., Buttigieg P. L., Pearlman F., et al. (2019). Evolving and sustaining ocean best practices and standards for the next decade. Front. Mar. Sci. 6. doi: 10.3389/fmars.2019.00277/full
Pereiro D., Cusack C., Dunbar M., Navarro G., Álvarez-Berastegui D., O’Carroll J., et al. (2022). EuroSea, D6.1. Connections between “Extreme marine events” and biological EOVs report. Available online at: https://eurosea.eu/download/eurosea_d6-1_connections_between_extreme-marine-events_and_biological_eovs/?wpdmdl=4928&refresh=63b6f6ec47c231672935148.
Pérez-Gómez B., García-León M., García-Valdecasas J., Clementi E., Mösso Aranda C., Pérez-Rubio S., et al. (2021). Understanding sea level processes during Western Mediterranean storm Gloria. Front. Mar. Sci. 8. doi: 10.3389/fmars.2021.647437/full
Ramirez-Llodra E., Tyler P. A., Baker M. C., Bergstad O. A., Clark M. R., Escobar E., et al. (2011). Man and the last great wilderness: human impact on the deep sea. PloS One 6, e22588. doi: 10.1371/journal.pone.0022588
Ratnarajah L. (2021). Map of BioEco Observing networks/capability. EuroSea D1.2. Available online at: https://eurosea.eu/download/eurosea-d1-2-bioeco-observing-networks/?wpdmdl=3580&refresh=63762dec99ea41668689388.
Ratnarajah L., Heslop E., Lips I., Simpson P., Nordlund L. M., Unsworth R., et al. (2022). D1.4. Report on the European BioEco observing system. Available online at: https://eurosea.eu/download/eurosea_d1-4_report_european_bioeco_observing_system_reformatted/?wpdmdl=4969&refresh=63762decce3981668689388.
Rees A. P., Bange H. W., Arévalo-Martínez D. L., Artioli Y., Ashby D. M., Brown I., et al. (2022). Nitrous oxide and methane in a changing Arctic Ocean. Ambio 51, 398–410. doi: 10.1007/s13280-021-01633-8
Roset X., Trullols E., Artero-Delgado C., Prat J., Del Río J., Massana I., et al. (2018). Real-time seismic data from the bottom sea. Sensors 18, 1132. doi: 10.3390/s18041132
Sadin S. R., Povinelli F. P., Rosen R. (1989). “The NASA technology push towards future space mission systems,” in Space and humanity. (Pergamon), 73–77. doi: 10.1016/B978-0-08-037877-0.50012-0
SWD (2020). Available online at: https://ec.europa.eu/info/sites/default/files/swd202060final.pdf.
Tanhua T., Le Traon P.-Y., Köstner N., Eparkhina D., Navarro G., Dunbar M. B., et al. (2024). Towards a sustained and fit-for-purpose European ocean observing and forecasting system. Front. Mar. Sci. 11. doi: 10.3389/fmars.2024.1394549
Tintoré J., Pinardi N., Álvarez-Fanjul E., Aguiar E., Álvarez-Berastegui D., Bajo M., et al. (2019). Challenges for sustained observing and forecasting systems in the mediterranean sea. Front. Mar. Sci. 6. doi: 10.3389/fmars.2019.00568
Topouzelis K. (2008). Oil spill detection by SAR images: dark formation detection, feature extraction and classification algorithms. Sensors 8, 6642. doi: 10.3390/s8106642
Keywords: ocean observing, ocean forecasting, scoring, readiness level, European Seas
Citation: Hassoun AER, Tanhua T, Heslop E, Lips I, Álvarez M, Petihakis G, García-Ibáñez MI, Velaoras D, Giani M, Bange HW, Lønborg C and Karstensen J (2024) A first scoring approach for evaluating the European Ocean Observing Community. Front. Mar. Sci. 11:1466820. doi: 10.3389/fmars.2024.1466820
Received: 18 July 2024; Accepted: 13 November 2024;
Published: 10 December 2024.
Edited by:
Simone Marini, National Research Council (CNR), ItalyReviewed by:
Damianos Chatzievangelou, Institute of Marine Sciences (ICM), Spanish National Research Council (CSIC), SpainPeter Leslie Croot, University of Galway, Ireland
Copyright © 2024 Hassoun, Tanhua, Heslop, Lips, Álvarez, Petihakis, García-Ibáñez, Velaoras, Giani, Bange, Lønborg and Karstensen. This is an open-access article distributed under the terms of the Creative Commons Attribution License (CC BY). The use, distribution or reproduction in other forums is permitted, provided the original author(s) and the copyright owner(s) are credited and that the original publication in this journal is cited, in accordance with accepted academic practice. No use, distribution or reproduction is permitted which does not comply with these terms.
*Correspondence: Abed El Rahman Hassoun, YWhhc3NvdW5AZ2VvbWFyLmRl