- 1Built Environment Academy, HAN University of Applied Sciences, Arnhem, Netherlands
- 2Hydraulic Engineering, Faculty of Civil Engineering and Geosciences, Delft University of Technology, Delft, Netherlands
- 3Environmental Engineering, Van Oord, Rotterdam, Netherlands
- 4Marine and Coastal Systems, Deltares, Delft, Netherlands
- 5Copernicus Institute of Sustainable Development, Faculty of Geosciences, Utrecht University, Utrecht, Netherlands
- 6Hydrology and Reservoir Engineering, TNO Geological Survey of the Netherlands, Utrecht, Netherlands
Dredged sediments, which are mud suspensions with concentrations exceeding the gelling point, are utilised in reclamation and Building with Nature projects. Beyond the gelling point, flocs occupy space and begin to form a network structure. This study investigates the impact of initial conditions, specifically the concentration above the gelling point and the stress state, on the consolidation of dredged sediment. The sediment from Lake Markermeer in the Netherlands was studied, specifically in the context of the construction of the Marker Wadden wetland. Material parameters were determined using two distinct experimental methods: settling columns and Seepage Induced Consolidation (SIC) tests. The differences observed between the two sets of material parameters suggest that the stress history and plastic deformation during mixing may influence the results. These effects were analysed using a one-dimensional vertical (1DV) consolidation model. The computed profiles were then compared with the profiles measured using an Ultrasonic High Concentration Meter. An initial concentration of 558.1 g/l, achieved by remixing the equilibrium profile of a normally consolidated suspension, resulted in larger final densities and a lower sediment-water interface. Conversely, a concentration of 175.6 g/l, achieved by remixing consolidating dredged sediment, yielded the same equilibrium layer thickness and density profile as virgin consolidation, albeit after a longer consolidation time. These findings are particularly relevant for land reclamation and wetland construction projects, where the initial density may be high and the dredging process’s mixing may alter the stress state.
1 Introduction
A cohesive sediment-water mixture can behave as a dense fluid, when the pore pressure is equal to the total stress, or as a soft soil, when the pore pressure is lower than the total stress and therefore effective stress builds up (Terzaghi, 1923; Terzaghi and Peck, 1967). The density at which effective stress develops is referred as structural density (Sills, 1998) or gelling point (Winterwerp, 1999; Dankers, 2006). At the structural density, flocs are space-filling and a network structure starts to build-up. The mass concentration of solids at this point is referred as gelling concentration (cgel).
Dredged sediment at concentrations above the gelling point are used for reclamation and Building with Nature (BwN) projects. The Marker Wadden project in The Netherlands is an example of a BwN project using dredged sediment, originating from the sediment deposited in Lake Markermeer, to create a new wetland in the lake (Barciela-Rial et al., 2020, 2022, 2023). In order to use the sediment of the lake bed, it has to be diluted with water so that it can be pumped. The dredged sediment is placed in calm areas where they are allowed to settle and consolidate. In this paper the effect of the initial concentration on the final density profile and bed height was studied.
The settling and consolidation behaviour of mud at initial concentrations below this gelling point has been thoroughly studied by various authors (e.g. Gibson et al., 1967; Been and Sills, 1981; Toorman, 1999; Merckelbach, 2000; Dankers, 2006; De Lucas Pardo, 2015). It was shown that the material parameters can be determined from simple settling column experiments (Merckelbach and Kranenburg, 2004a). Such material parameters can be used to calculate the hydraulic conductivity and effective stress from equations based on the volumetric concentration of solids (Merckelbach and Kranenburg, 2004b). However, the consolidation behaviour of mixtures above the gelling point, as it is the case for dredged sediment, has been less studied and determination of the material characteristics requires more sophisticated experimental devices. Imai (1979) proposed a Seepage Induced Consolidation (SIC) test in which a downward seepage is imposed by creating a constant head difference. Herein, pore water pressures are continuously measured and the void ratio is obtained at the end by slicing the sample. This method was later improved by Znidarčić and Liu (1989). In this improved configuration, a constant flow rate is imposed across the sample instead of a constant head. This enables testing under small gradients leading to more reliable results at the low effective stress ranges of soft cohesive soils. The SIC test allows to obtain void ratio- hydraulic conductivity and void ratio-effective stress relations (Huerta et al., 1988; Liu and Znidarčić, 1991).
The initial concentration of solids c0 at which a settling test is performed may influence the settling and consolidation behaviour of the sediment. An hypothetical settling experiment started by remixing the final density (equilibrium) profile over the final bed height h∞ of a virgin consolidated suspension (c0 < cgel) has c0 significantly larger than cgel. In a similar way, when remixing at an earlier phase of consolidation, c0 may still be above cgel. In both mixing situations shown in Figure 1, there is a mismatch between the in-situ stresses and the at-rest virgin consolidation behaviour. We refer as “slurry” to a mixture of dredged sediment with an initial concentration above gelling point, as it is the case for dredged sediment. The top part of such mixed slurry is over-consolidated. This implies that there is not an equilibrium between the vertical stresses, the local strength and the pore water pressure. The upper over-consolidated part has a lower water content w% and hydraulic conductivity than the original suspension equilibrium profile. This upper part has a larger density and is less permeable, thus acts as a “crust” over the -consolidating part. Water in the lower part can therefore not escape in the vertical direction as easy as in the case of a low concentrated suspension.
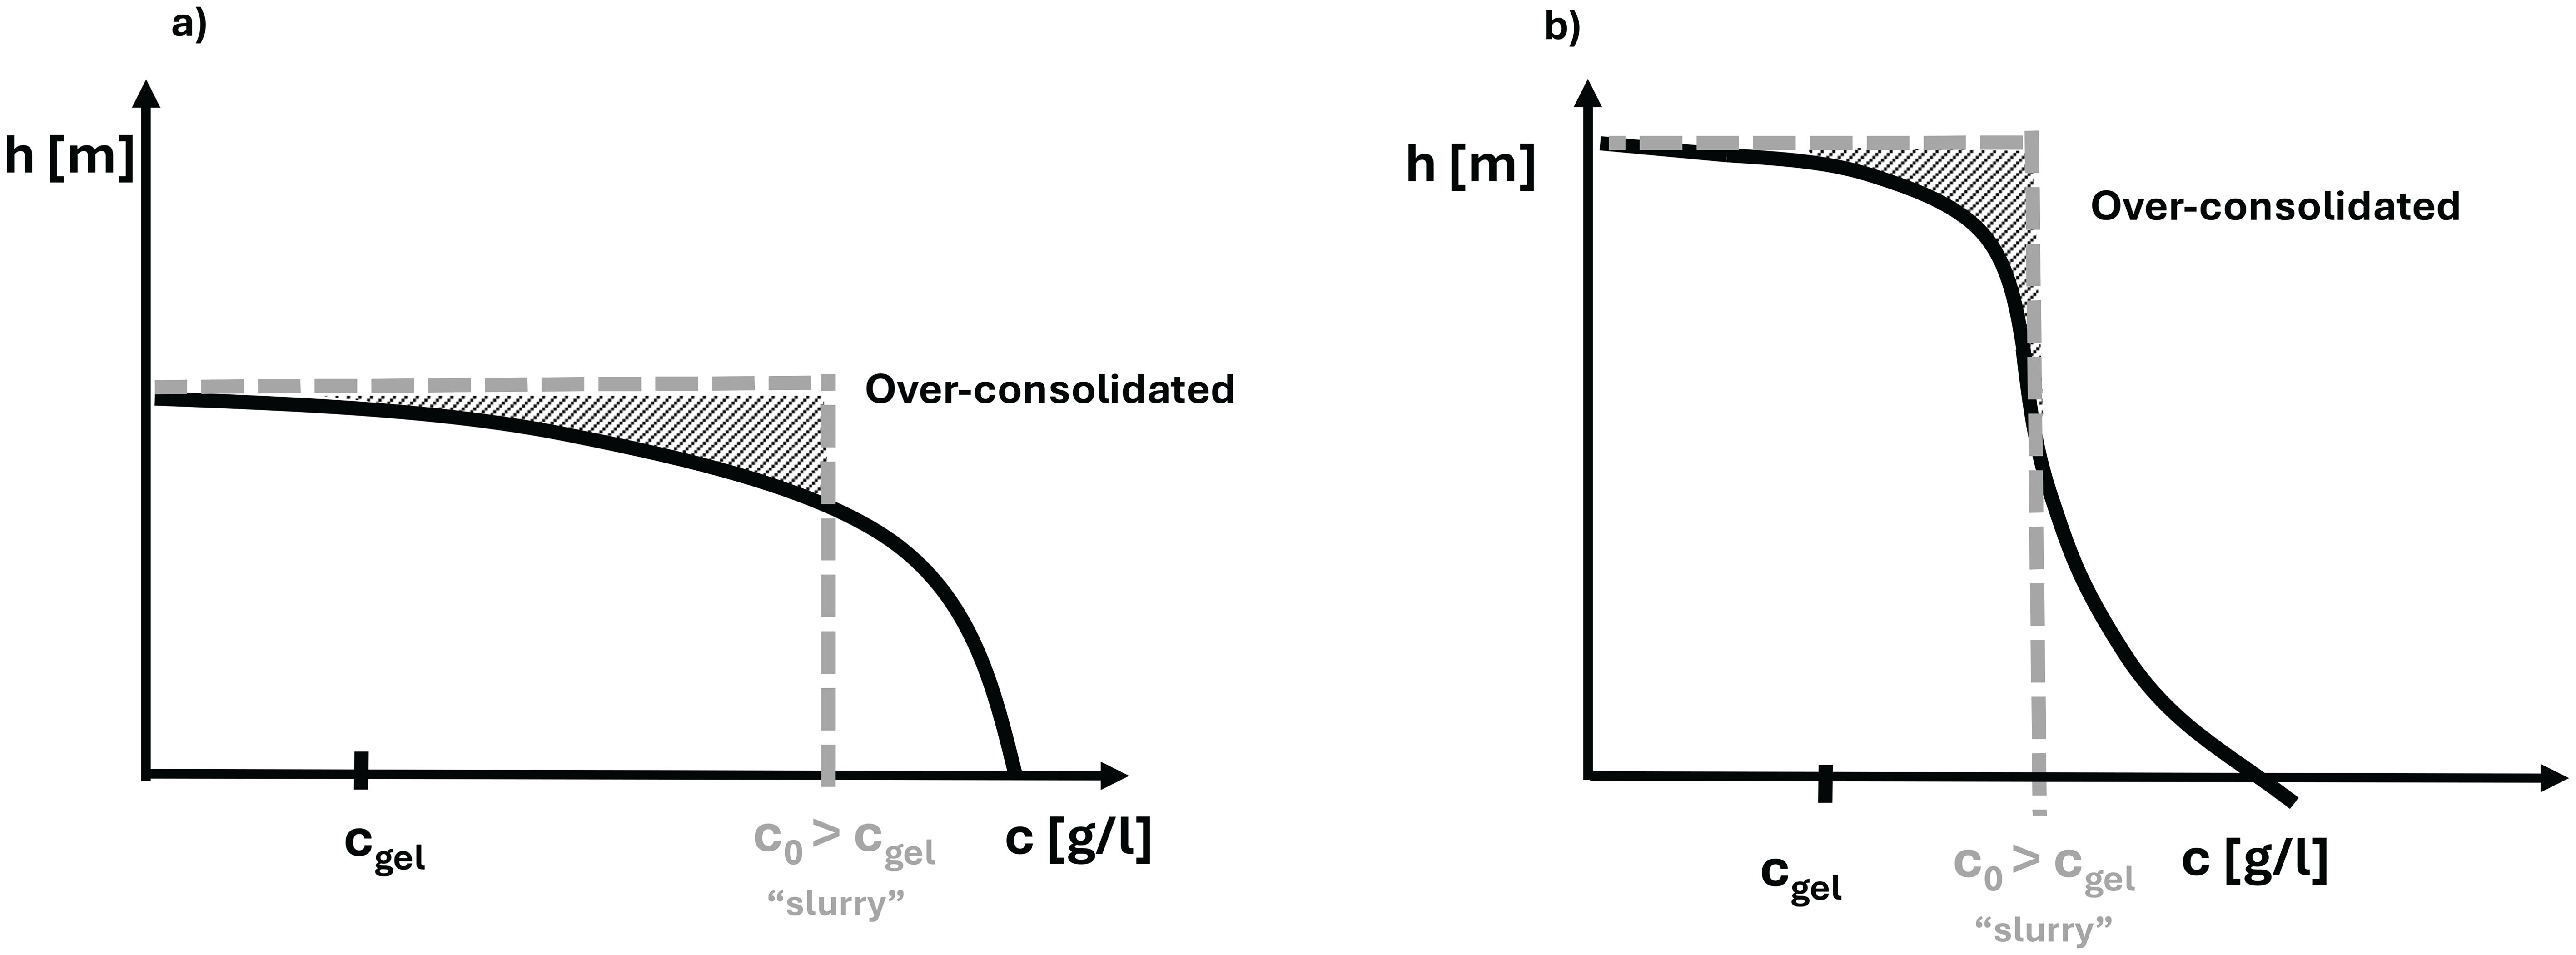
Figure 1. (A) Initial concentration(c0) profile for a slurry after remixing the final equilibrium concentration profile obtained from a suspension by virgin consolidation. (B) Initial concentration profile for a slurry after remixing the concentration profile during the first stages of consolidation. The initial sediment concentration c0 is now smaller than in the previous case. However, c0 > cgel for both cases. X-axis represents the concentration. Y- axis represents the height.
In classical soil mechanics unloading tests, negative pore pressures would result in elastic rebound of the material, often referred to as swelling (e.g. Lambe and Whitman, 1969). During the Constant Rate of Strain tests performed by Barciela-Rial (2019) and Barciela-Rial et al. (2022), this elastic rebound was not induced because negative pore pressures were prevented. Therefore, only the microscopic swelling of clay particles was measured. The coefficients of swelling determined in Barciela-Rial (2019) are thus applicable to the consolidation dredged sediment studied in the present paper.
In the present paper, the effect of the initial concentration c0 on the consolidation behaviour of mud was studied for mud mixtures with an initial concentration above the gelling point. This effect was analysed with a 1DV consolidation model. For that, the material parameters were calculated for c0 > cgel with the Seepage Induced Consolidation test (Liu and Znidarčić, 1991) and compared with the results obtained from settling columns for c0 < cgel.
2 Methods
2.1 Sediment used
The type of Markermeeer sediment used in this paper is referred to as NE1F, which detailed composition is presented in Barciela-Rial (2019). Sample NE1F represents the fine fraction of a natural sample of the upper layer of sediment from the Northeast of Lake Markermeer. NE1F has 0% sand, 4.5% Total Organic Matter and a particle density ρs of 2540kg/m3.
Various authors have determined the gelling concentration for different Markermeer sediment samples. The lowest value was obtained by De Lucas Pardo (2015), who found a cgel of 70 g/l, while Hendriks (2016) obtained the highest value, with 85 g/l.
2.2 Experimental methods
The material parameters of Markermeer mud were obtained with two different experimental methods: settling columns (for c0 < cgel) and Seepage Induced Consolidation (SIC) tests (for c0 > cgel).
The settling column tests were performed at concentrations below cgel (40, 50 and 60 g/l) and above (100, 200, 300 and 400 g/l), and replicate columns were included to assess reproducibility (See Figure 2). At the end of the settling column tests, the density profiles of all columns were measured with an Ultrasonic High Concentration Meter (UHCM). The UHCM measures high concentrations of solid particles in liquids. Figure 2 shows the set-up of the UHCM measuring in the column. The measurement is based on the transmitting and receiving sound between two acoustic transducer. The acoustic principle is based on measuring the transmission of acoustic energy (ultra sound) through the measuring volume between the transmitter and the receiver probes. Details on the calibration and measurement procedure can be found in the Supplementary Materials.
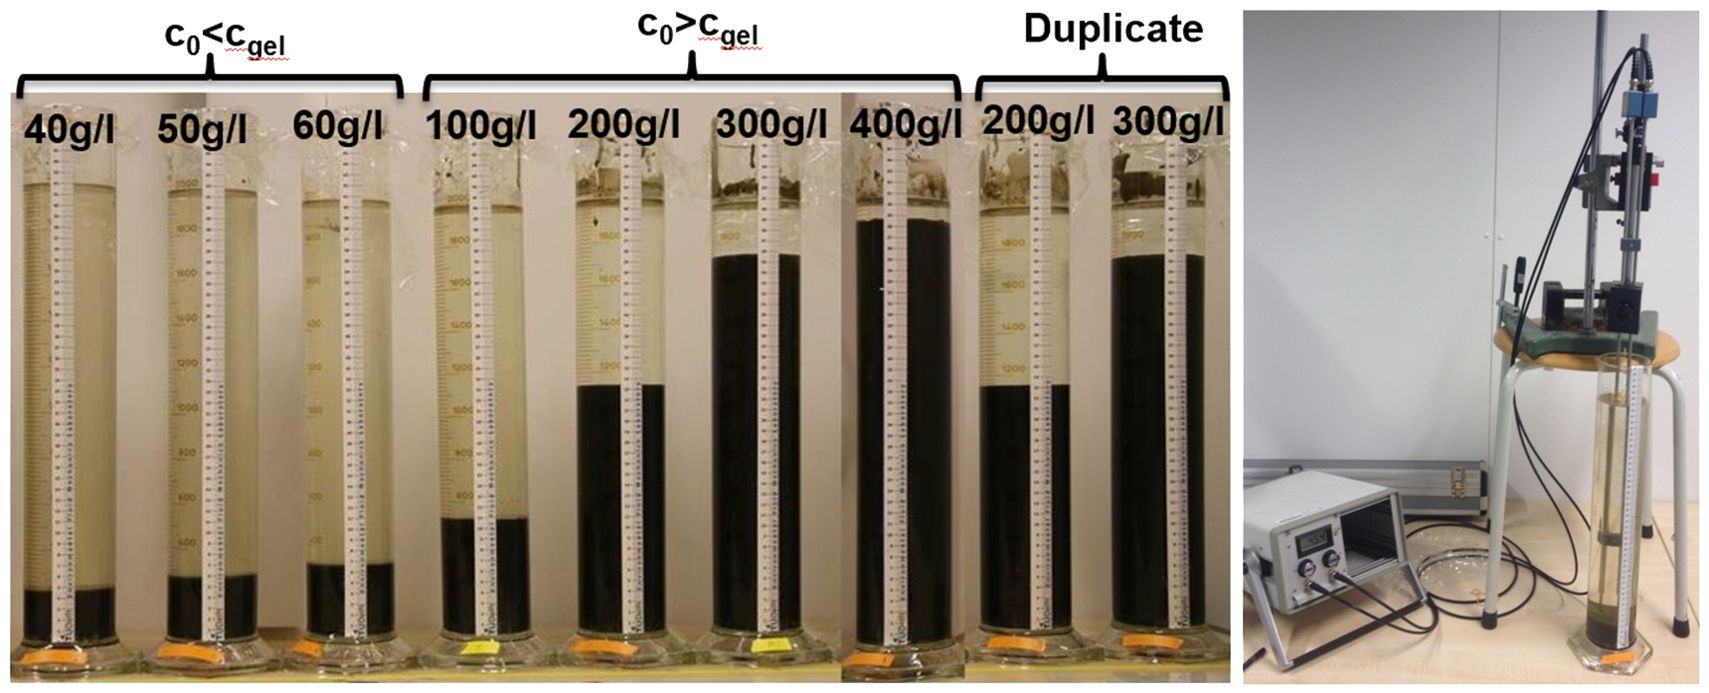
Figure 2. Settling column experiments performed and concentrations (left) and UHCM final density profile measurement (right).
For the columns with 200, 300 and 400 g/l, the material parameters were determined with the SIC test after the settling column tests were finished. This was done by placing the remoulded final settled bed of each column in the SIC ring for testing.
2.2.1 Material parameters for initial concentrations below gelling point
The material parameters for initial concentrations c0 below the expected gelling point (De Lucas Pardo, 2015; Hendriks, 2016) were determined with settling column experiments. This is done in 2 litre columns with a height of 45 cm and an inner diameter of 8 cm (Figure 2). To initiate the experiment, each column is gently stirred vertically using a mixing rod. Each column is mixed with an identical number of strokes for the same duration, following a standardised protocol. This ensures an uniform treatment and reproducible results. This reproducibility was checked by performing two duplicate settling column tests for 200 and 400 g/l. Photographs of the columns are taken continuously to identify the sediment-water interface.
From the settling column experiments, the effective velocity ws of the settling interface can be obtained from the slope of the settling curve. Dankers and Winterwerp (2007) established a relationship between ws and the volumetric concentration of flocs ϕf:
where ws,0 is the settling velocity of one individual particle in still water and ϕs= c/ρs is the volumetric concentration of solids (primary particles), in which c is the mass concentration and ρs the particle density. The volumetric concentration of flocs ϕf is equal to c/cgel because ϕf = ϕs/ϕgel by definition. The empirical parameter m that accounts for non-linearity was set to 2, according to Dankers and Winterwerp (2007). From two settling curves started at two different concentrations, the unknown variables ws,0 and cgel were calculated.
Assuming that the cohesive sediment flocs and bed behave as self-similar fractal structures (Kranenburg, 1994), the material parameters were obtained from the settling column experiments. The calculation was done according to Merckelbach and Kranenburg (2004a). First, the sediment- water interface during the first phase of consolidation, when the effective stresses are still small, was plotted and the following equation was fitted:
where is the density of water, is the Gibson height accounting for sand (particles > 63µm) and is the Gibson height of the fines fraction (particles < 63µm). is equal to , where is the initial volumetric concentration of fines and the initial thickness of the slurry layer. Because the sediment studied did not contain sand, the volumetric concentration of sand =0 and =0. Further, [m] is the height of the mud-water interface, [s] is the time and [m/s] is the permeability material parameter, see Equation 4. The scalar is related to the fractal dimension as . Next, the effective stress parameter was calculated, from equilibrium conditions, with Equation 3:
where h∞ is the final consolidation height and Kσ[Pa] is the effective stress material parameter.
The permeability and effective stress material parameters, Kk and Kσ, are used to calculate the hydraulic conductivity k and effective stress sigma eff of the sediment according to Equation 4 and Equation 5 (Merckelbach and Kranenburg, 2004b):
2.2.2 Material parameters for initial concentrations above gelling point
The material parameters for initial concentrations c0 above the gelling point were determined with the SIC test device available at Deltares, Delft. The device used is based on Znidarčić and Liu (1989) and Abu-Hejleh et al. (1996). The set-up consists of a frame, a triaxial cell, a volume displacement pump, water supply cells, pressure, force and displacement transducers and a data acquisition system. For details on the SIC device we refer to the previous references, Znidarcic (1982) and the Supplementary Materials.
The samples tested in the SIC tests originated from the settling column experiments. After equilibrium was attained in each settling column, the supernatant water was removed and the remaining sediment was transferred to a container in which it was gently mixed to homogenize, avoiding air entrapment. The water content was then determined by drying a subsample in an oven at 105°C to derive the initial void ratio e0. Then, the sediment was put into the sample holder ring of the triaxial cell and allowed to rest for three days. The triaxial cell was filled with water to extrude air and the test was started. Three SIC tests were performed. They are referred as SIC200, SIC300 and SIC400 because the sediment originated from the settling columns with initial concentration 200, 300 and 400 g/l, respectively. There was not enough sediment in the column with c0 = 100 g/l to fill in the SIC sampling ring.
To obtain compressibility and hydraulic conductivity data, each SIC test was run for seven loading steps followed by permeability steps. These loading and permeability steps are listed in Table 1. The loading steps were undrained at the bottom of the sample to allow measurement of the excess pore water pressure in time. After equilibrium was reached and the pressure stabilised (i.e., excess pore water was close to zero), a permeability step was applied by imposing a small downward water flux through the sample. The downward flow of water consolidates the sample, increasing the pressure difference across the sample with time. The same flow rate was maintained until steady state conditions were reached, no further consolidation occurred and the pressure difference across the sample became constant.
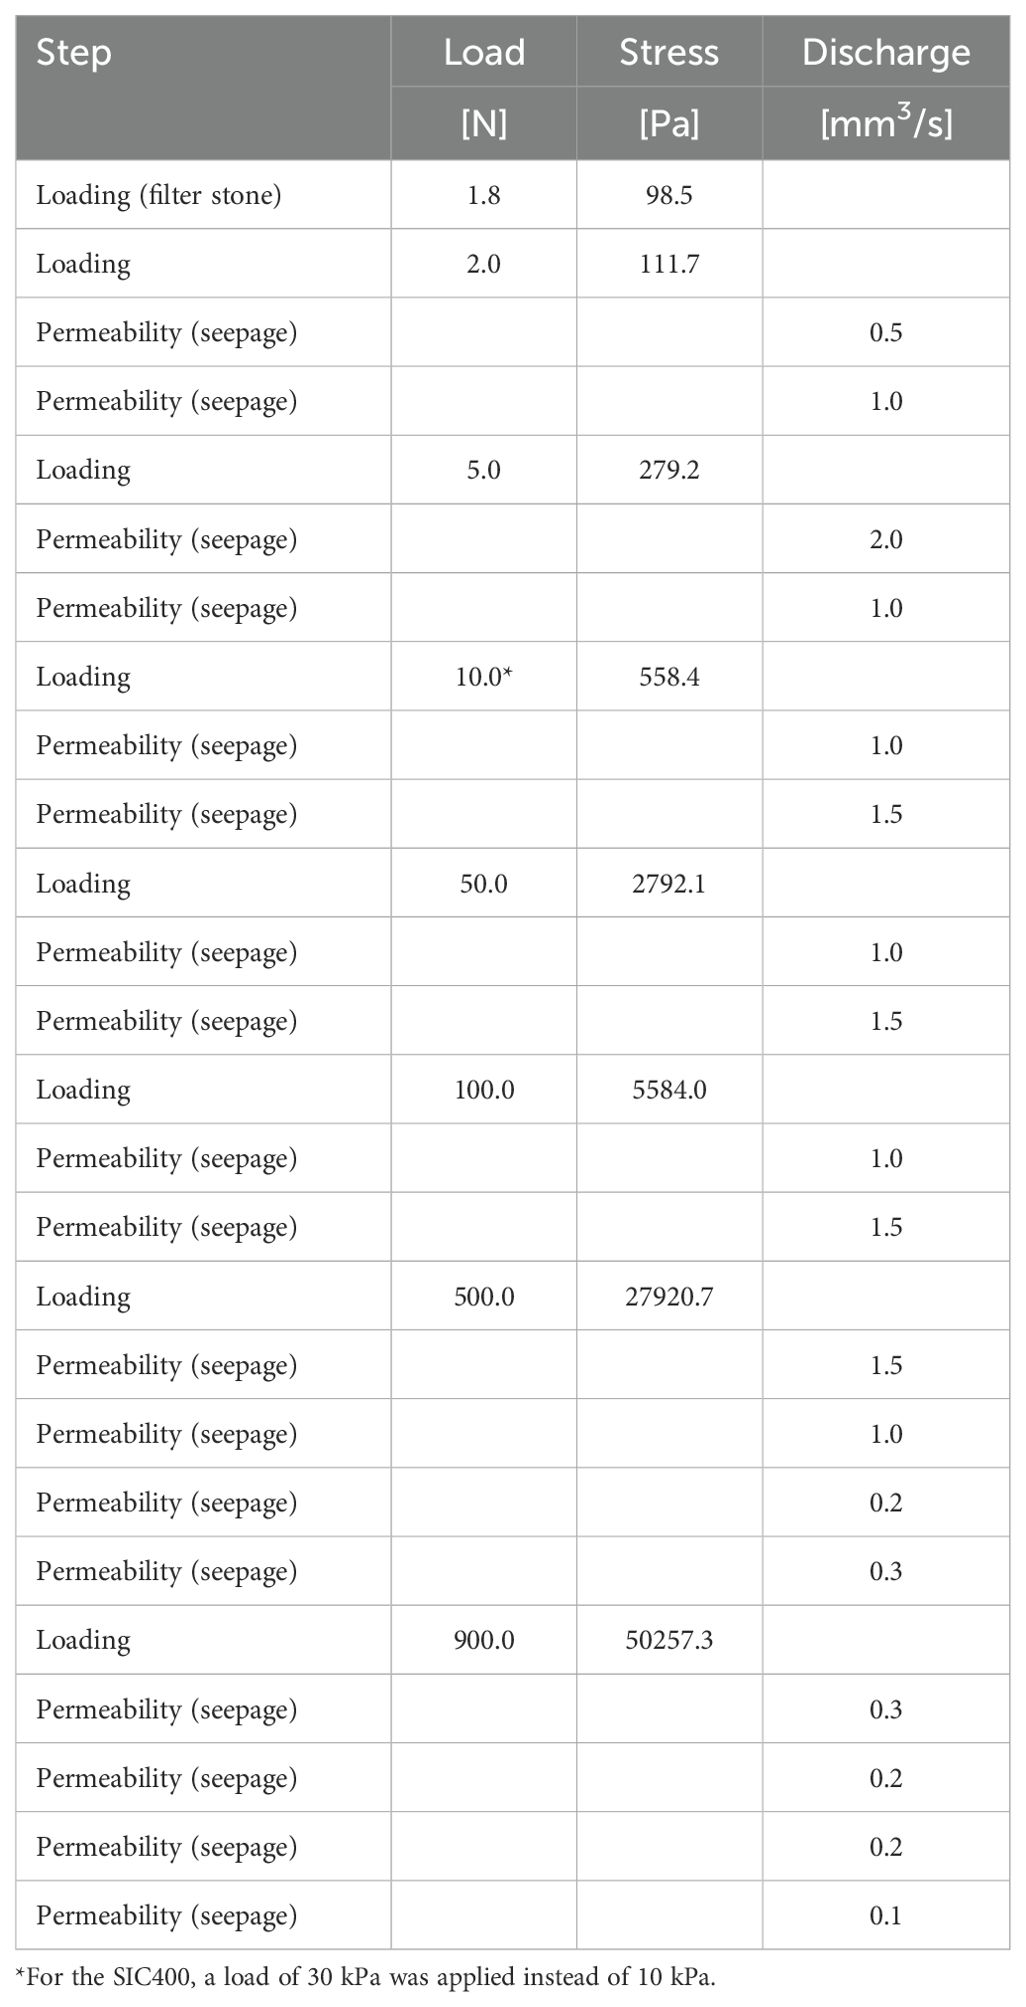
Table 1. Seepage Induced Consolidation test plan including all the loading and permeability steps performed to each sample.
The void ratio was calculated continuously from the sample height during the tests and the initial void ratio e0. At the end of the test, the final void ratio e∞ was determined by oven-drying of a sub-sample at 105°C. The data was fitted to power law functions to obtain the hydraulic conductivity and effective stress. Here, two sets of power law functions were used. The first set was dependent on the volumetric concentration ϕs and consisted of the equation with the fractal descriptions used for the settling columns, i.e., Equation 4 and Equation 5. The second set was a function of the void ratio e and consisted of the following equations (Liu and Znidarčić, 1991):
where Aσ, Bσ, Ck and Dk are empirical parameters obtained from fitting. The void ratio e and the volumetric concentration of sediment ϕs (in this case ) are related as 1+e = 1/ϕs. For convenience, Equation 7 is also presented as:
2.3 The 1DV-slurry model
To compare the behaviour of suspensions (c0 < cgel) with the one of dredged sediments or slurries (c0 > cgel), the two sets of parameters obtained from the settling columns and from the SIC tests were used as input for a the 1DV-slurry model to compute density profiles. This 1DV-slurry model is a version of the 1DV model (Winterwerp, 1999; Winterwerp and van Kesteren, 2004) adapted for highly concentrated mixtures (i.e., dredged sediment).
2.3.1 Theoretical background
Winterwerp and van Kesteren (2004) rewrote the Gibson equation into an advection-diffusion equation, which is resolved on a rigid, vertically staggered grid. This implies that the height of settling/consolidating suspension is fixed to its initial height. Thus, the interface of the water-sediment suspension moves through the computational grid. This then requires an upwind numerical scheme and high resolution of the numerical model accounting for the sharp gradients at the interface. The advantage of this rigid grid approach is that sedimentation on and erosion from that interface can be modelled easily, which is not the case when using Gibson’s material coordinates.
This advection-diffusion consolidation equation reads, after introduction of the fractal approach (Equations 4, 5) and for the case when only fine particles (= ), as follows
where is a consolidation coefficient defined as
In the present work, this model was further adapted to account for the compaction of highly concentrated mixtures such as dredged sediment. We refer to the resulting model as the 1DV-slurry. For the case of highly concentrated mixtures such as dredged sediment, the over-consolidated layer in the upper part of the mixture acts as a crust, reducing the outflow of excess pore water from the lower, consolidating part of the slurry. This reduction is modelled in the 1DV-model by reducing the consolidation coefficient Γc by a factor 100 in the crust. Thus for c0 < cgel: Γc, crust = 0.01Γc. In theory, this reduction can also be realised by reducing the hydraulic conductivity within the crust, maintaining the magnitude of the consolidation coefficient. However, numerical experiments showed that the model then becomes too diffusive, smearing out the sediment concentration over the layer thickness (Winterwerp et al., 2021). The effect of the crust is therefore modelled by adjusting the consolidation coefficient in the crust only. We refer to the swelling coefficient for convenience, appreciating that the 1DV-model cannot predict swelling.
The unloading or swelling behaviour of Markermeer sediment was experimentally quantified in Barciela-Rial (2019), where the swelling coefficient csw was obtained from unloading cycles during Constant Rate of Strain tests. For the material studied in the present paper, a value of csw =0.015 was found. This small value implies that only little (elastic) rebound occurs upon loading.
2.3.2 Modelling approach
The numerical experiment included remixing of suspensions (c0 < cgel) up to the bed-water interface. As a result, the new settling material had a new initial concentration profile (c0 > cgel). The maximum time step in the computations was limited by the settling velocity and the size of the computational layers.
The density profiles computed with the 1DV-slurry model were then compared with the profiles measured with the Ultrasonic High Concentration Meter (UHCM) at the end of all the settling experiments. This allowed to validate the model.
The sensitivity of the model results was evaluated by also using the material properties obtained from the different experimental set-ups (SIC and settling columns).
Prognostic simulations were performed to test the influence of over-consolidation induced by the initial density profile. They consisted of remixing the density profile at equilibrium and at the second phase of consolidation.
3 Results
3.1 Material parameters for initial concentrations below gelling point
Figure 3 shows the settling curves for the tests below the gelling point. The slopes during the hindered settling phase (i.e. first minutes of the test) correspond with an effective velocity ws of 3.95 · 10−6, 2.19 · 10−6 and 1.50 · 10−6 m/s for c0 = 40, 50 and 60 g/l respectively.

Figure 3. Settling curves for the experiments at c0 < cgel (left) and zoom in during the hindered settling phase (right). The black line in the right figure is a linear trend line of all the data points, which is used to calculate the effective settling velocity.
The pairs ws,0 - cgel obtained with Equation 1 are shown in Table 2. From these results, the intermediate gelling concentration value of 92.2 g/l was used for the subsequent calculations. The material parameters obtained with the fractal approach are shown in Table 3.

Table 2. Gelling concentrations and sediment particle velocity of the sediment studied for c0 < cgel settling experiments.

Table 3. Material parameter for the sediment studied as determined from settling experiments at c0 < cgel.
The density profiles measured at the end of the settling column tests with c0< cgel are shown in Figure 4. The overshoots observed on these data are due to inaccuracies of the UHCM device near the interface.
3.2 Material parameters for initial concentrations above gelling point
Figure 5 shows the consolidation curves for the tests with initial concentrations above the gelling point and the density profiles which were measured with the UHCM device at the end of the tests. The consolidation curves for c0 > cgel showed an initial linear phase caused by a higher density than at equilibrium in the upper part of the mud layer (over-consolidated). This excess density caused the upper layer to be heavier and less permeable and therefore act like a crust.
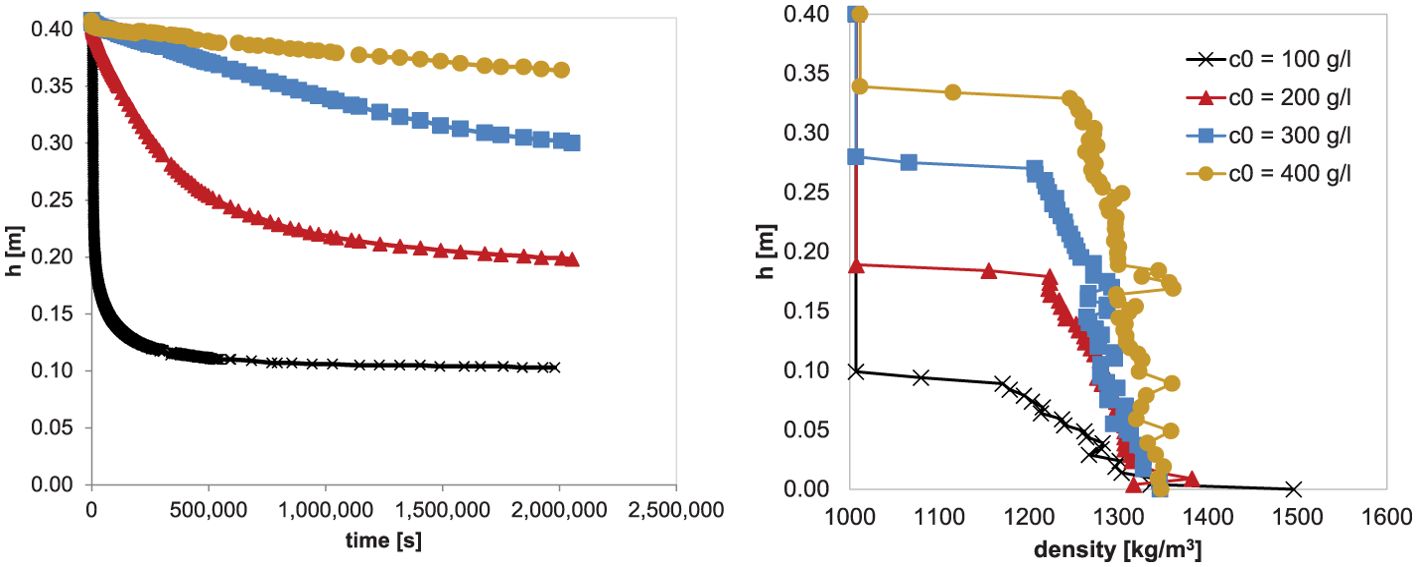
Figure 5. Measured settling curves (left) and density profiles at the end of the test(right) for c0 > cgel.
For the columns with 200, 300 and 400 g/l, the material parameters were determined with the SIC tests after the settling column tests were finished. The results from the SIC tests as a function of ϕs are shown in Figure 6. From fitting the fractal Equations 4, 5, the material parameters presented in Table 4 were obtained. The fact that these material parameters obtained from the SIC test are not identical to the ones determined from the settling column tests suggests an influence of the stress history and plastic deformation upon remixing of the settled bed when preparing the sample for the SIC test. This may induce over-consolidated behaviour during the SIC tests. The different initial concentrations at which settling columns and SIC tests were performed, may also have influenced these results.
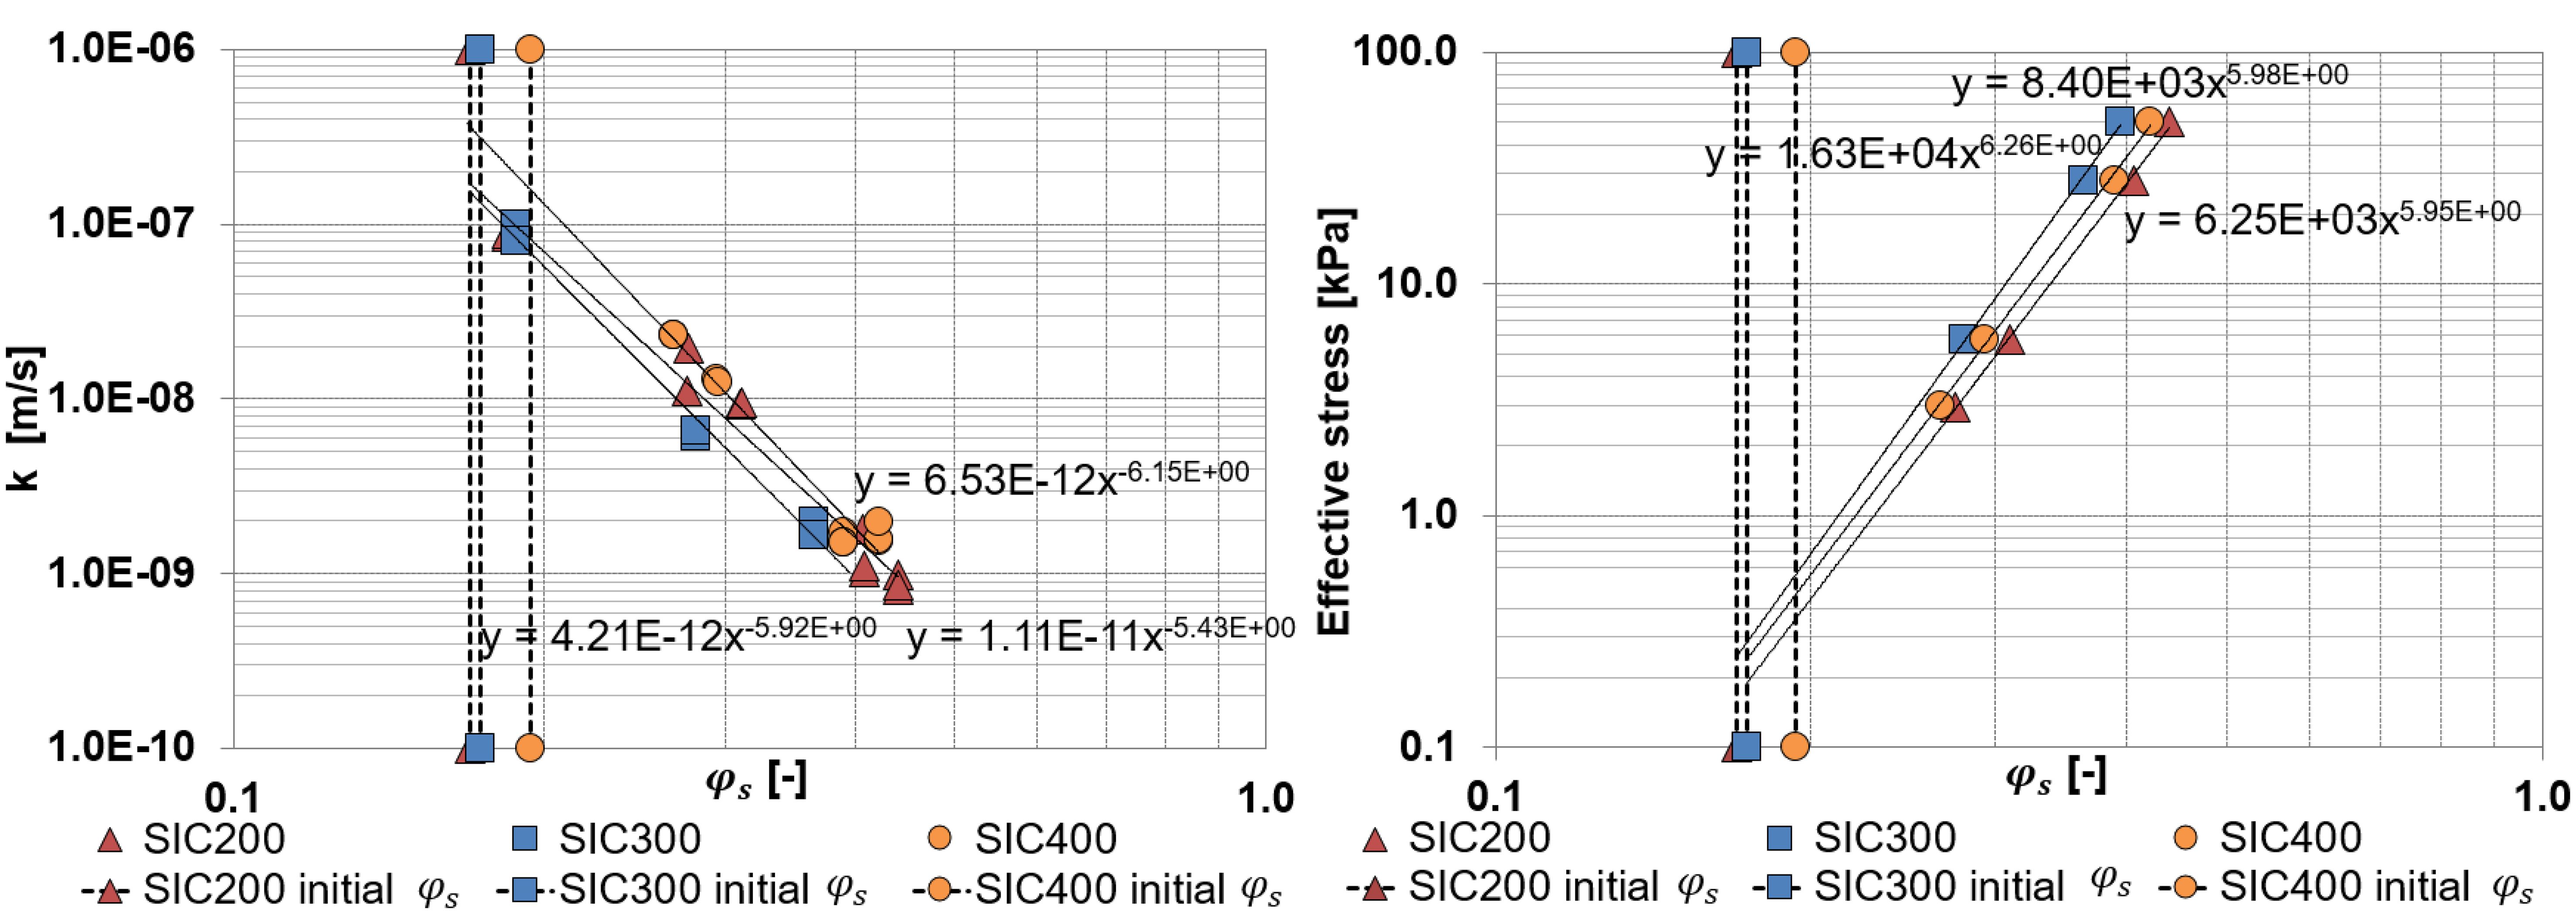
Figure 6. Hydraulic conductivity k and effective stress obtained from the Seepage Induced Consolidation tests. Results plotted as function of ϕs to obtain the fractal parameters.

Table 4. Fractal and Liu and Znidarčić (1991) material parameters as obtained from the Seepage Induced Consolidation tests.
The material parameters calculated according to Liu and Znidarčić (1991) are also shown in Table 4. They were obtained from fitting Equations 6, 8 to the results as a function of the void ratio (see Figure 7). Note that the comparison of the set of Equations 4, 5 with Equations 6, 7 yields to the following approximate equation to calculate Dk:
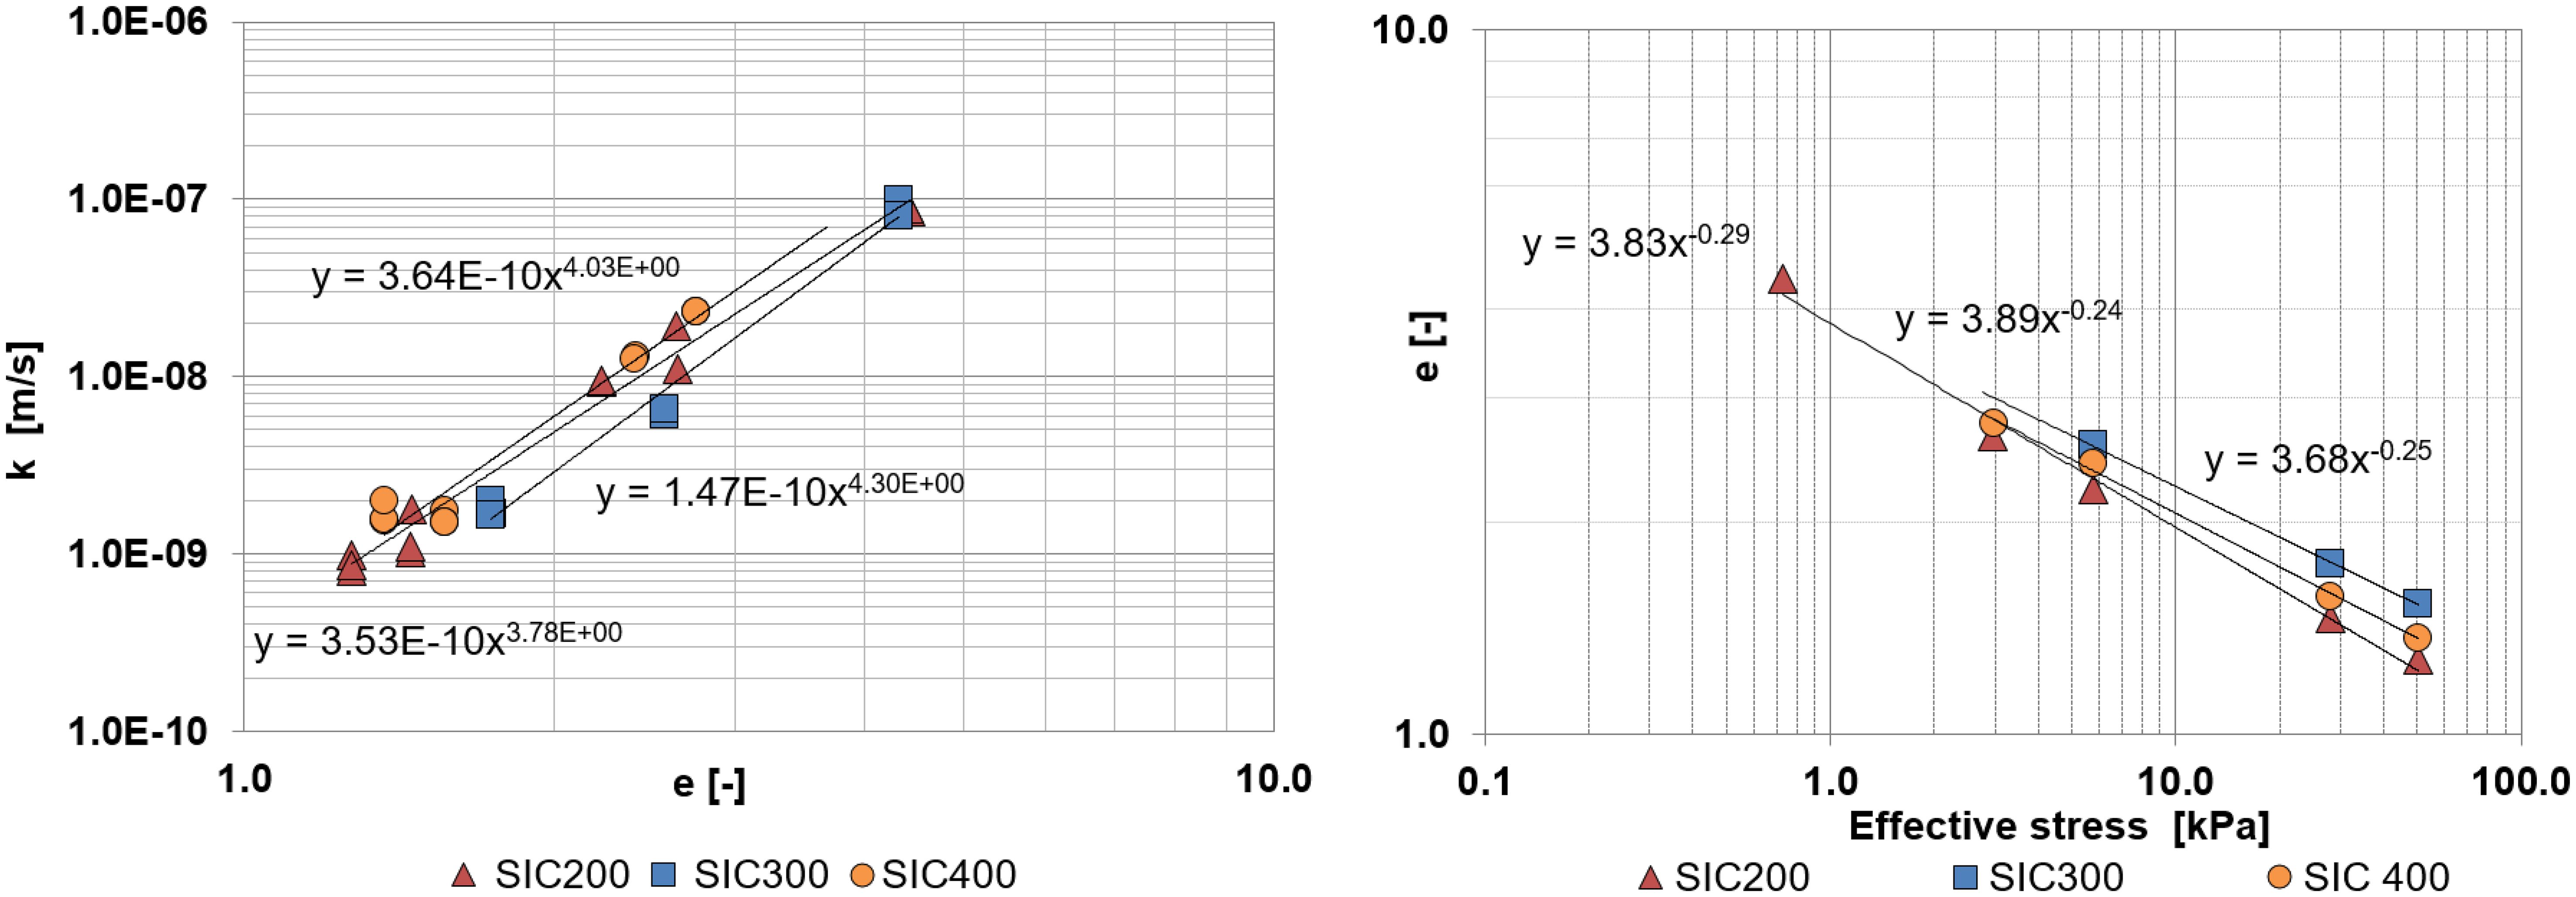
Figure 7. Hydraulic conductivity k (left) and effective stress (right) obtained from the Seepage Induced Consolidation tests. Results plotted as function of void ratio to obtain the material parameters according to Liu and Znidarčić (1991). For convenience, the effective stress is presented on the x- axis (see Equation 8).
which gives values of Dk of the same order of magnitude that presented in Table 4.
3.3 The 1DV-slurry model
3.3.1 Validation of the model
The density profiles computed with the 1DV-slurry model were compared with the profiles measured with the Ultrasonic High Concentration Meter (UHCM) at the end of the settling experiments after 67 days. This was done for initial concentrations of 200 and 300 g/l. Figure 8 shows that there is a good agreement between the measured and computed density profiles where the latter were calculated using the SIC parameters. However, there is some difference near the bottom of the column, where the UMHC measurement profile becomes concave-up. Furthermore, the agreement between the profile computed with the settling column parameters from c0 = 40 g/l showed offset with respect to the measured profile for the case of c0 = 300 g/l. In particular, the computed profile with these parameters did not indicate equilibrium at t = 67 days. This suggests that the offset may be caused by the permeability coefficient Kk from the settling columns, which was one order of magnitude smaller than the corresponding SIC parameter. Thus, even if final bed heights may be predicted correctly when using the different sets of material parameters, the consolidation time may vary considerably due to differences of the Kk values (Barciela-Rial, 2019).
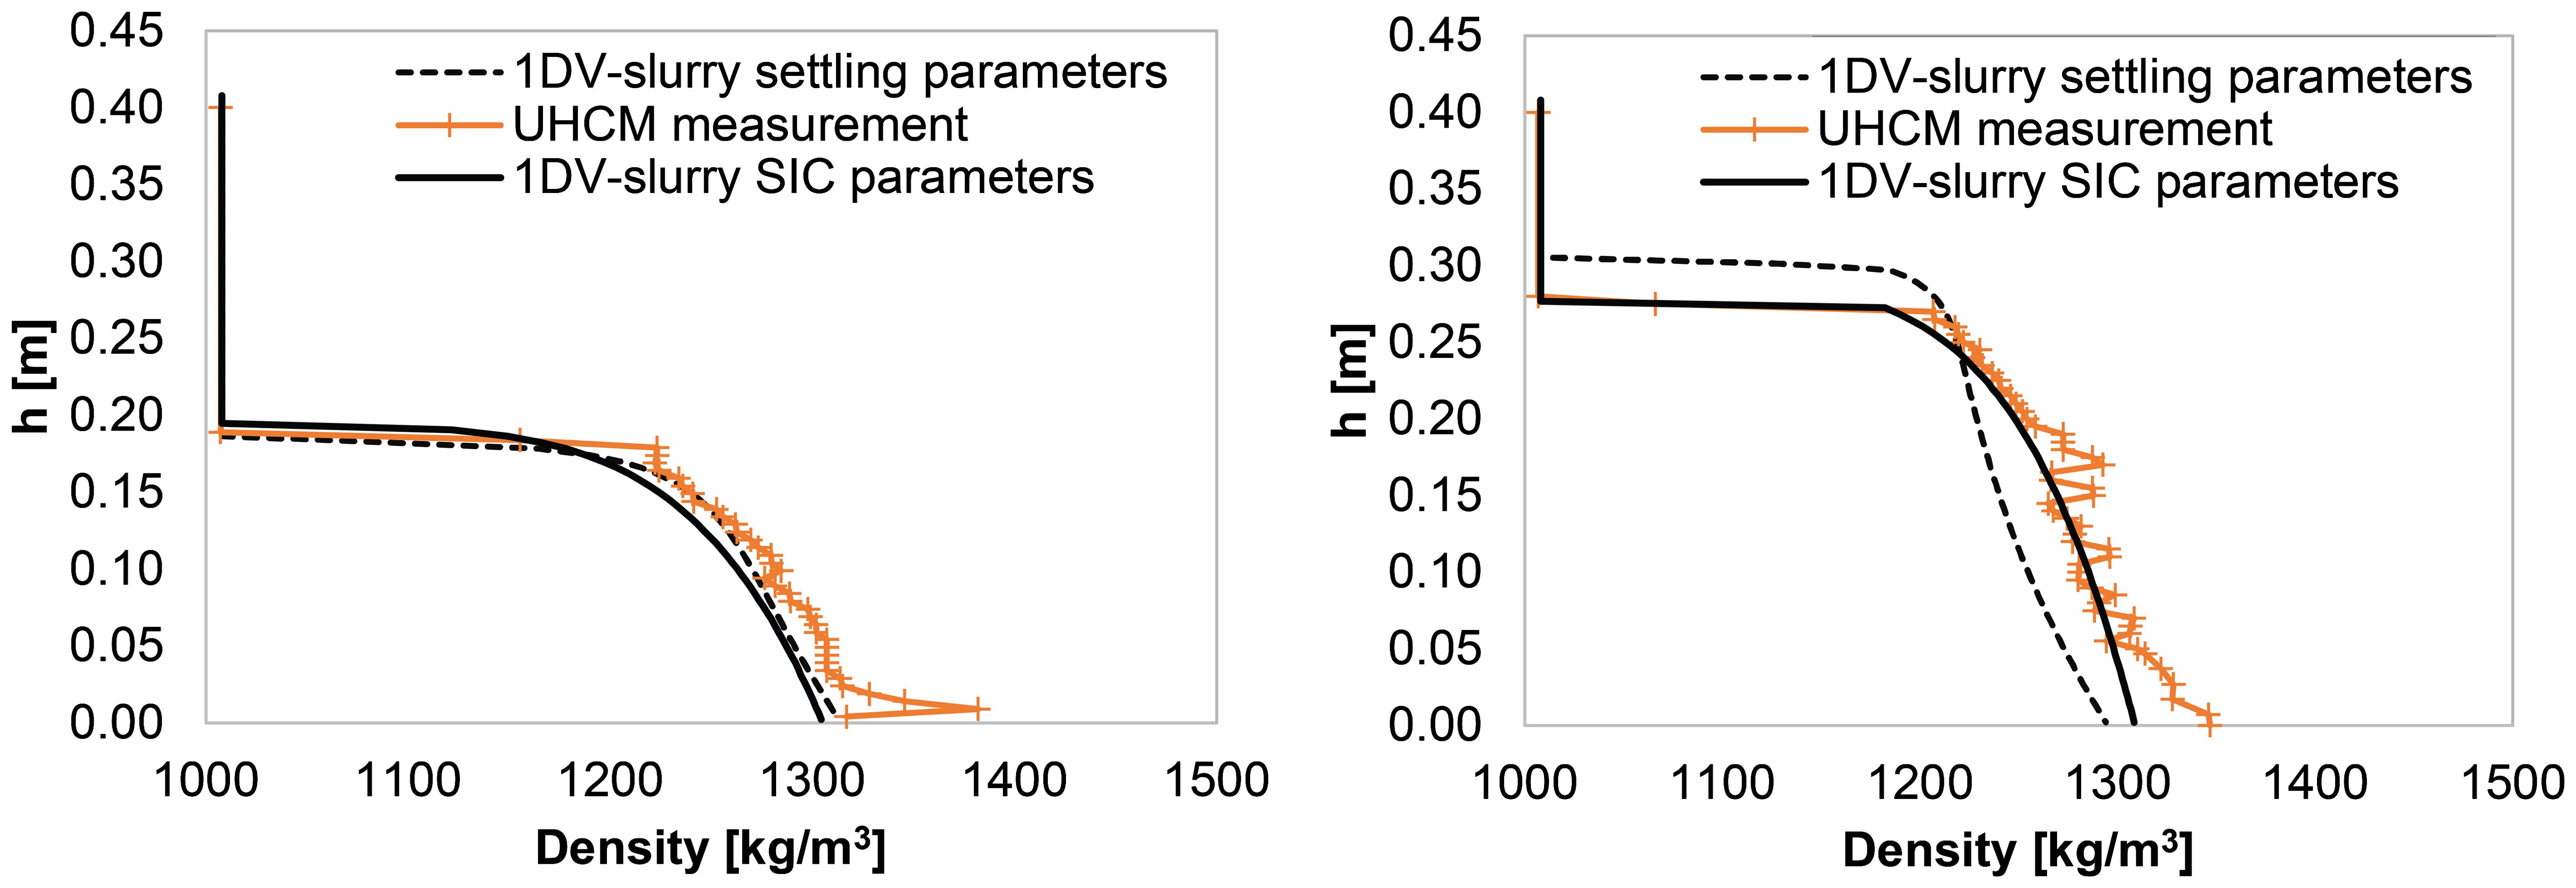
Figure 8. Validation of the 1DV-slurry model used for c0 = 200 g/l (left) and c0 = 300 g/l (right): measured and computed profiles with SIC and settling column material parameters at t=67 days.
The results show that the determination of the material parameters with the SIC tests provide more accurate results of the settling and consolidation of mixtures with c0 > cgel than the determination from settling column tests. Material parameters from settling columns may be used to get a first estimate.
3.3.2 Sensitivity analysis
The sensitivity of the 1DV-slurry model results was evaluated by interchanging the coefficients of the material properties obtained from the different experimental set-ups (SIC and settling). Thus, a computation with c0 = 200 g/l and the SIC 300 parameters and another one with c0 = 300 g/l and the SIC 200 parameters were performed. Figure 9 presents these results which show that the model is robust.
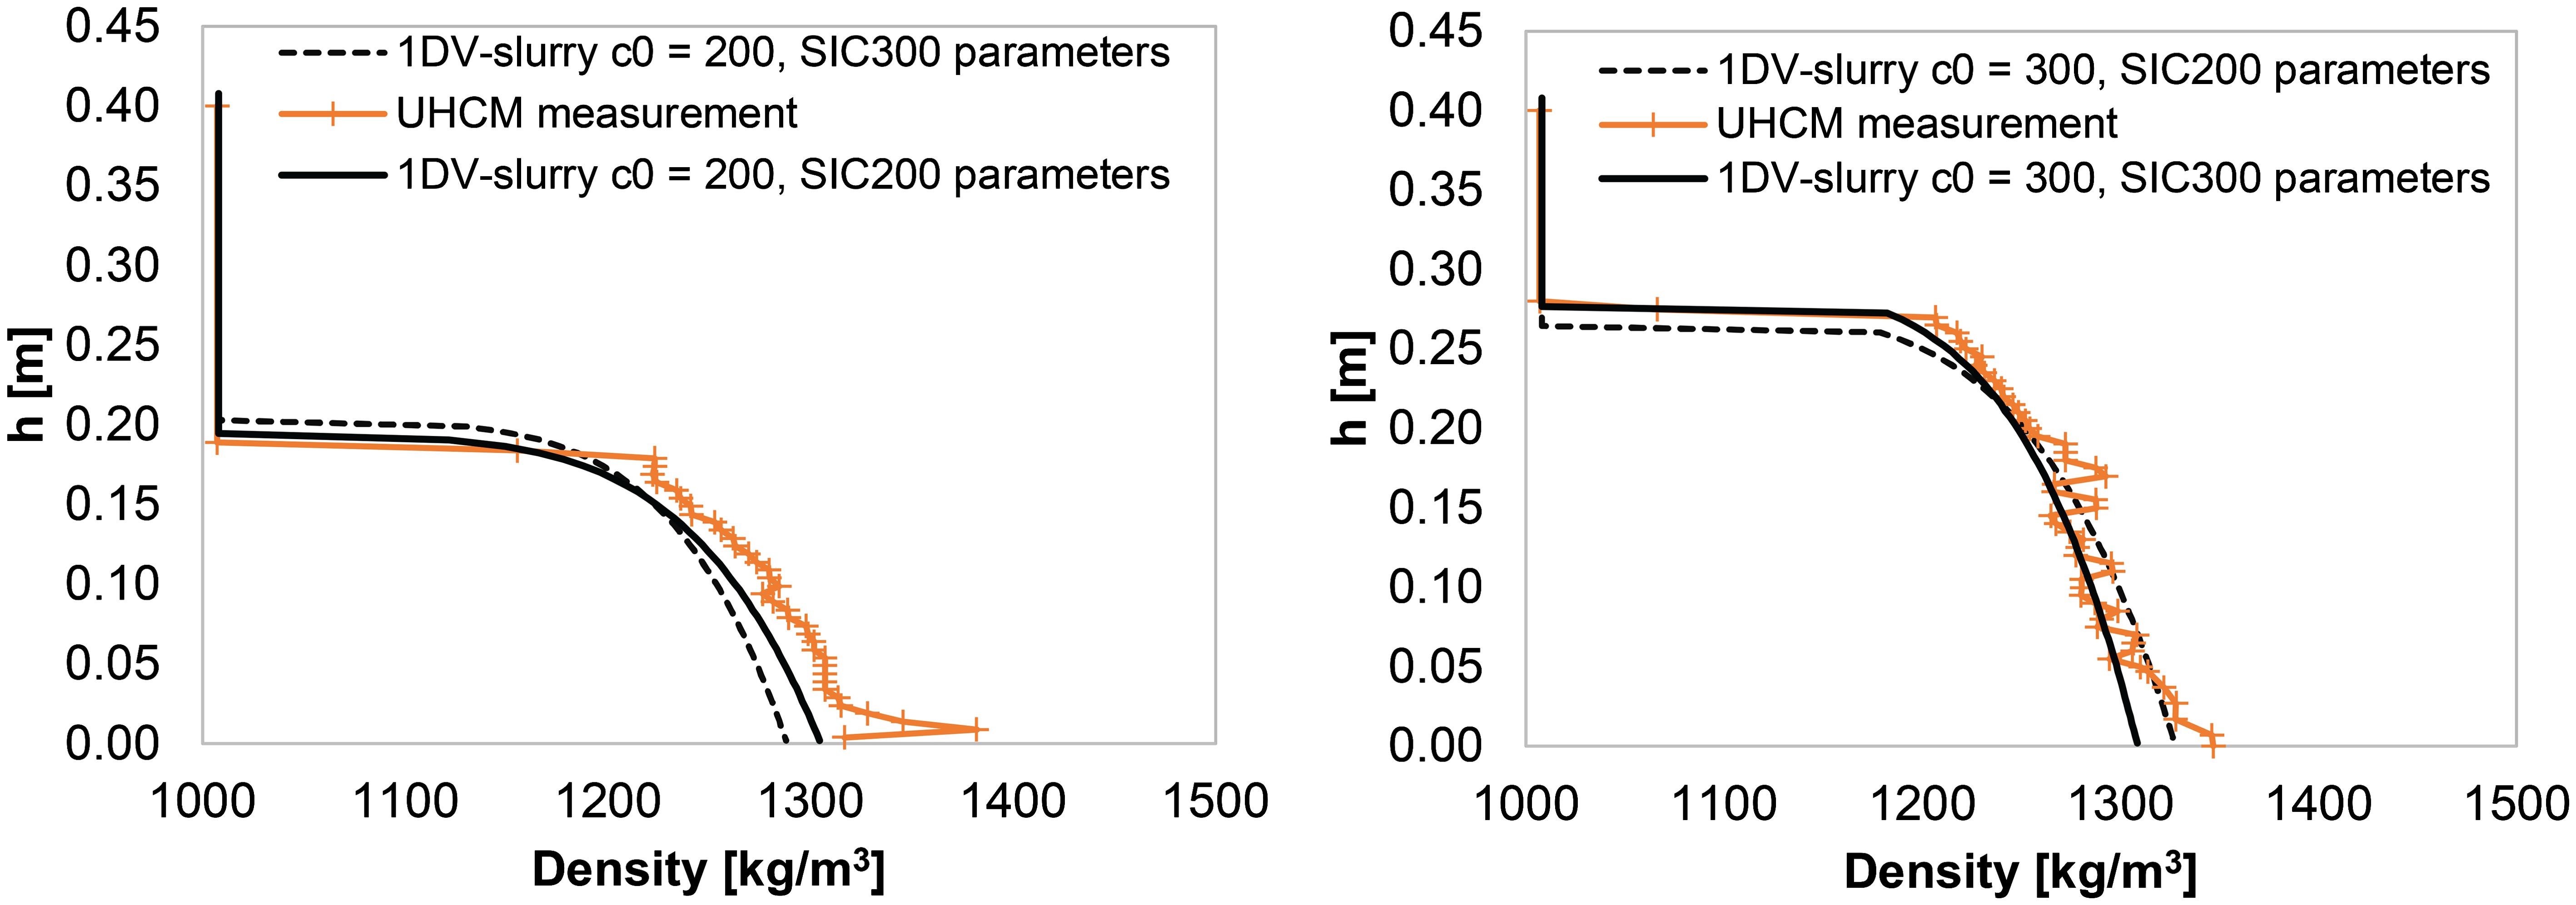
Figure 9. Sensitivity analysis. Comparison between the measured density profile and the computed profiles from SIC200 (left) and SIC300 (right), with the parameters of the corresponding tests and after having interchanged parameters.
3.3.3 Prognostic simulations
The computed evolution of density and effective stress profiles for a 5m high consolidating layer with an initial concentration of 60 g/l are shown in Figure 10. The material parameters are given in Table 3, as determined with the small-scale settling column experiments. Figure 10 shows that the density profile develops from concave- up to concave- down under normal consolidation, and the development of effective stress is also non-linear.
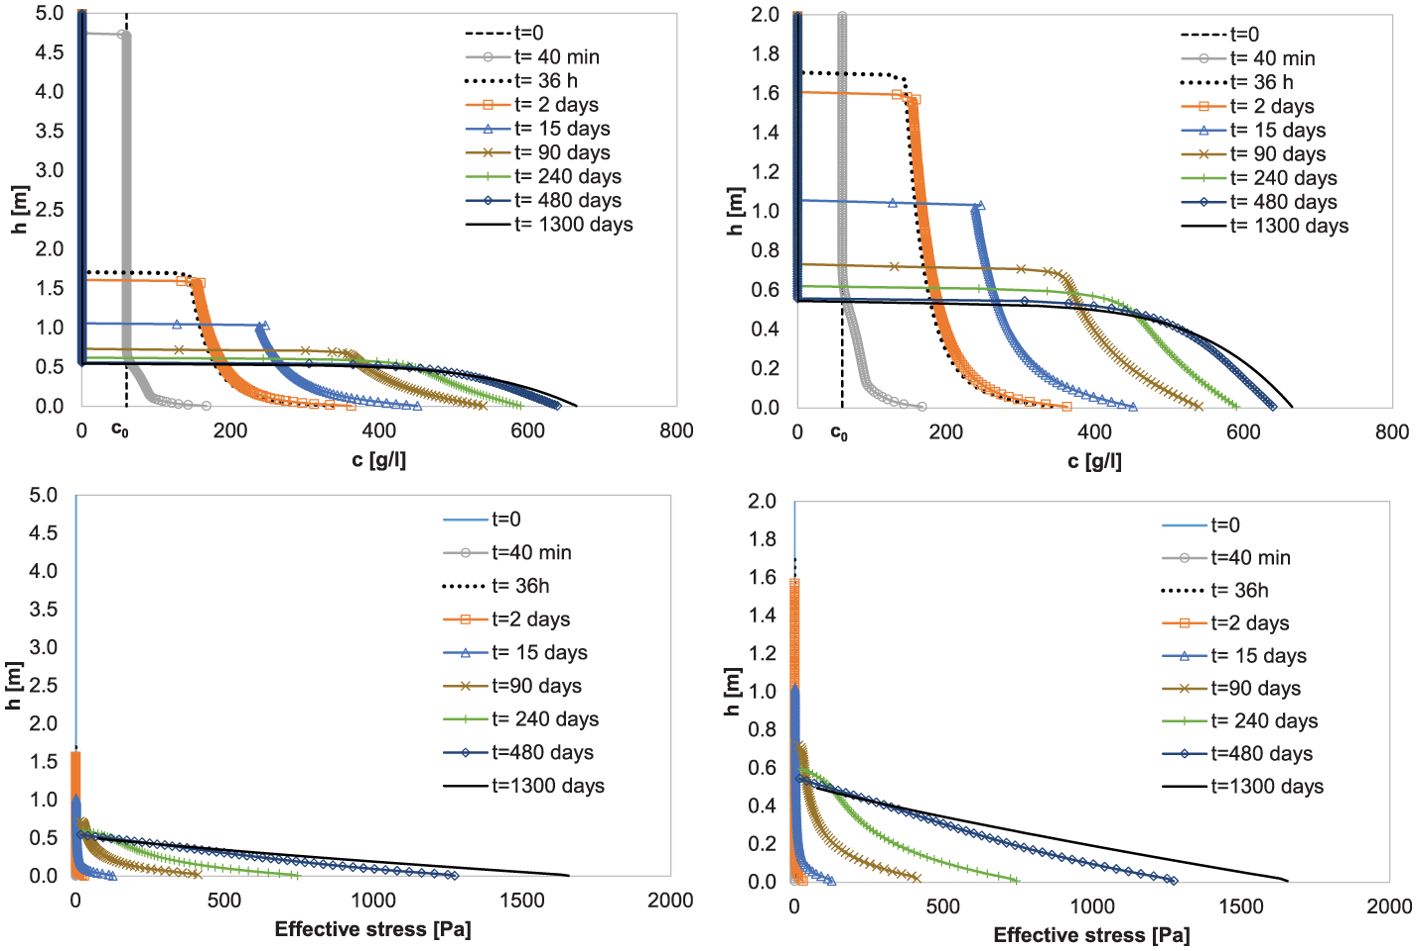
Figure 10. Top left panel: Computed density profiles during virgin consolidation of a 5m height column of a suspension with c0 = 60 g/l. Bottom left panel: effective stress development herein. Right panels are zoom-in.
Figure 11 shows the evolution of density profiles from the prognostic simulations starting at concentrations of 175.6 and 558.1 g/l. They correspond with the concentrations after redistribution of the total consolidating sediment mass across the entire thickness of the layer (remixing) at t = 36 h (first phase of consolidation) and t = 1200 days (equilibrium). This redistribution of mass by mixing not only affects the density profile but also the effective stress distribution. The density profile evolution of Figure 11 indicate that further settling occurred after remixing the equilibrium profile of the virgin consolidated suspension. This can be observed in the lowering of the sediment interface. Furthermore, the results show that after remixing at t = 36 h the same final bed height as for the virgin suspension (Figure 10) was obtained (but after a larger consolidation time).

Figure 11. Density profiles starting with an initial concentration of 175.6 g/l after remixing the density profile during the first phase of consolidation (at t=36 h of Figure 10) of a suspension (left) and a concentration of 558.1 g/l after remixing the equilibrium profile (t= 1300 days of Figure 10) (right).
Figure 12 compares the settling curves and final density profiles for all the prognostic simulations. The results show that the final bed height h∞ for a 5m column suspension with c0 = 60 g/l was 0.519 m. Remixing the 60 g/l suspension at t=36 h, produced a slurry with c0 = 175.6 g/l that reached the same final height (h∞ = 0.506 m).The small difference of these two height values is caused by numerical accuracy (i.e. the interface is detected at one grid cell or at the imminent next one). Finally, remixing the final profile of the virgin consolidated bed formed from the 5m 60 g/l suspension, resulted in a slurry with c0 = 558.1 g/l and h∞ =0.469 m. This represents an extra settling of 9.6%. Thus, contrary to remixing at 36 h, remixing at equilibrium did allow further consolidation (multiple grid cells).

Figure 12. Computed settling curves (left) and final concentration profiles (right) for the prognostic simulations.
4 Discussion
In this section, the differences between the two experimental set-ups and the effect of mixing and initial concentration on the material parameters are discussed. Furthermore, the change on the stress profile after mixing and the impact of the initial conditions on the final bed density and height are also addressed.
4.1 Non-linearity and the need to use two set-ups
Before discussing the various results in detail it is important to appreciate that the entire consolidation process is extremely non-linear by nature. This can be exemplified from the current results. The stress and strain (permeability) parameters scale with ϕ (2/(3−nf), thus ϕ6.7 for nf = 2.7, with ϕ the volume concentration of the sediments and nf the fractal dimension. This implies that small inaccuracies in the sediment density and its distribution over the sample have large effects on the accuracy of the experimental stress-strain relations. It is almost impossible to prepare a really homogeneous sample in the triaxial cell of a homogeneous sediment-water suspension in a settling column. The inhomogeneities affect the experimental results in an unknown way. This is one of the reasons why reason a variety of methods two different methods were used to determine the material parameters of the sediment. A second reason is that, settling column tests and SIC tests cover different parts of the effective stress spectrum. In settling columns effective stress remains low (typically less than 1 kPa or even less than 100 Pa, depending on material height) as no loading is applied. In SIC tests the effective stress range larger than 1 kPa is covered. As extrapolation of settling column tests towards a high effective stress range may induce large errors, a combination of SIC tests and settling tests is required to accurately cover the full range of effective stress and void ratio and to determine k-ϕ and σeff -ϕ relations that are accurate in a wide range of ϕ.
4.2 Sensitivity of material parameters to initial concentrations
Figure 13 shows the fractal material parameters determined as a function of the initial volumetric concentration of solids ϕs,0 for the present research. Herein, the results are also compared to results from Hendriks (2016) and De Lucas Pardo (2015), who both have used similar sediment from lake Markermeer. This figure shows the sensitivity of the Kkparameters to ϕs,0, which varies various order of magnitude for different samples. This is different with respect to the Kσparameter, which values are quite stable. The Liu and Znidarčić (1991) material parameters determined from the SIC test were in the order of magnitude as the ones found previously for Markermeer sediment Van Olphen (2016). They found Aσ=2.55-3.19 [1/PaBσ], Bσ= 0.11-0.15 [-], Ck=1 · 10−10 −1 · 10−11 [m/s] and Dk=6.04-7.00 [-].
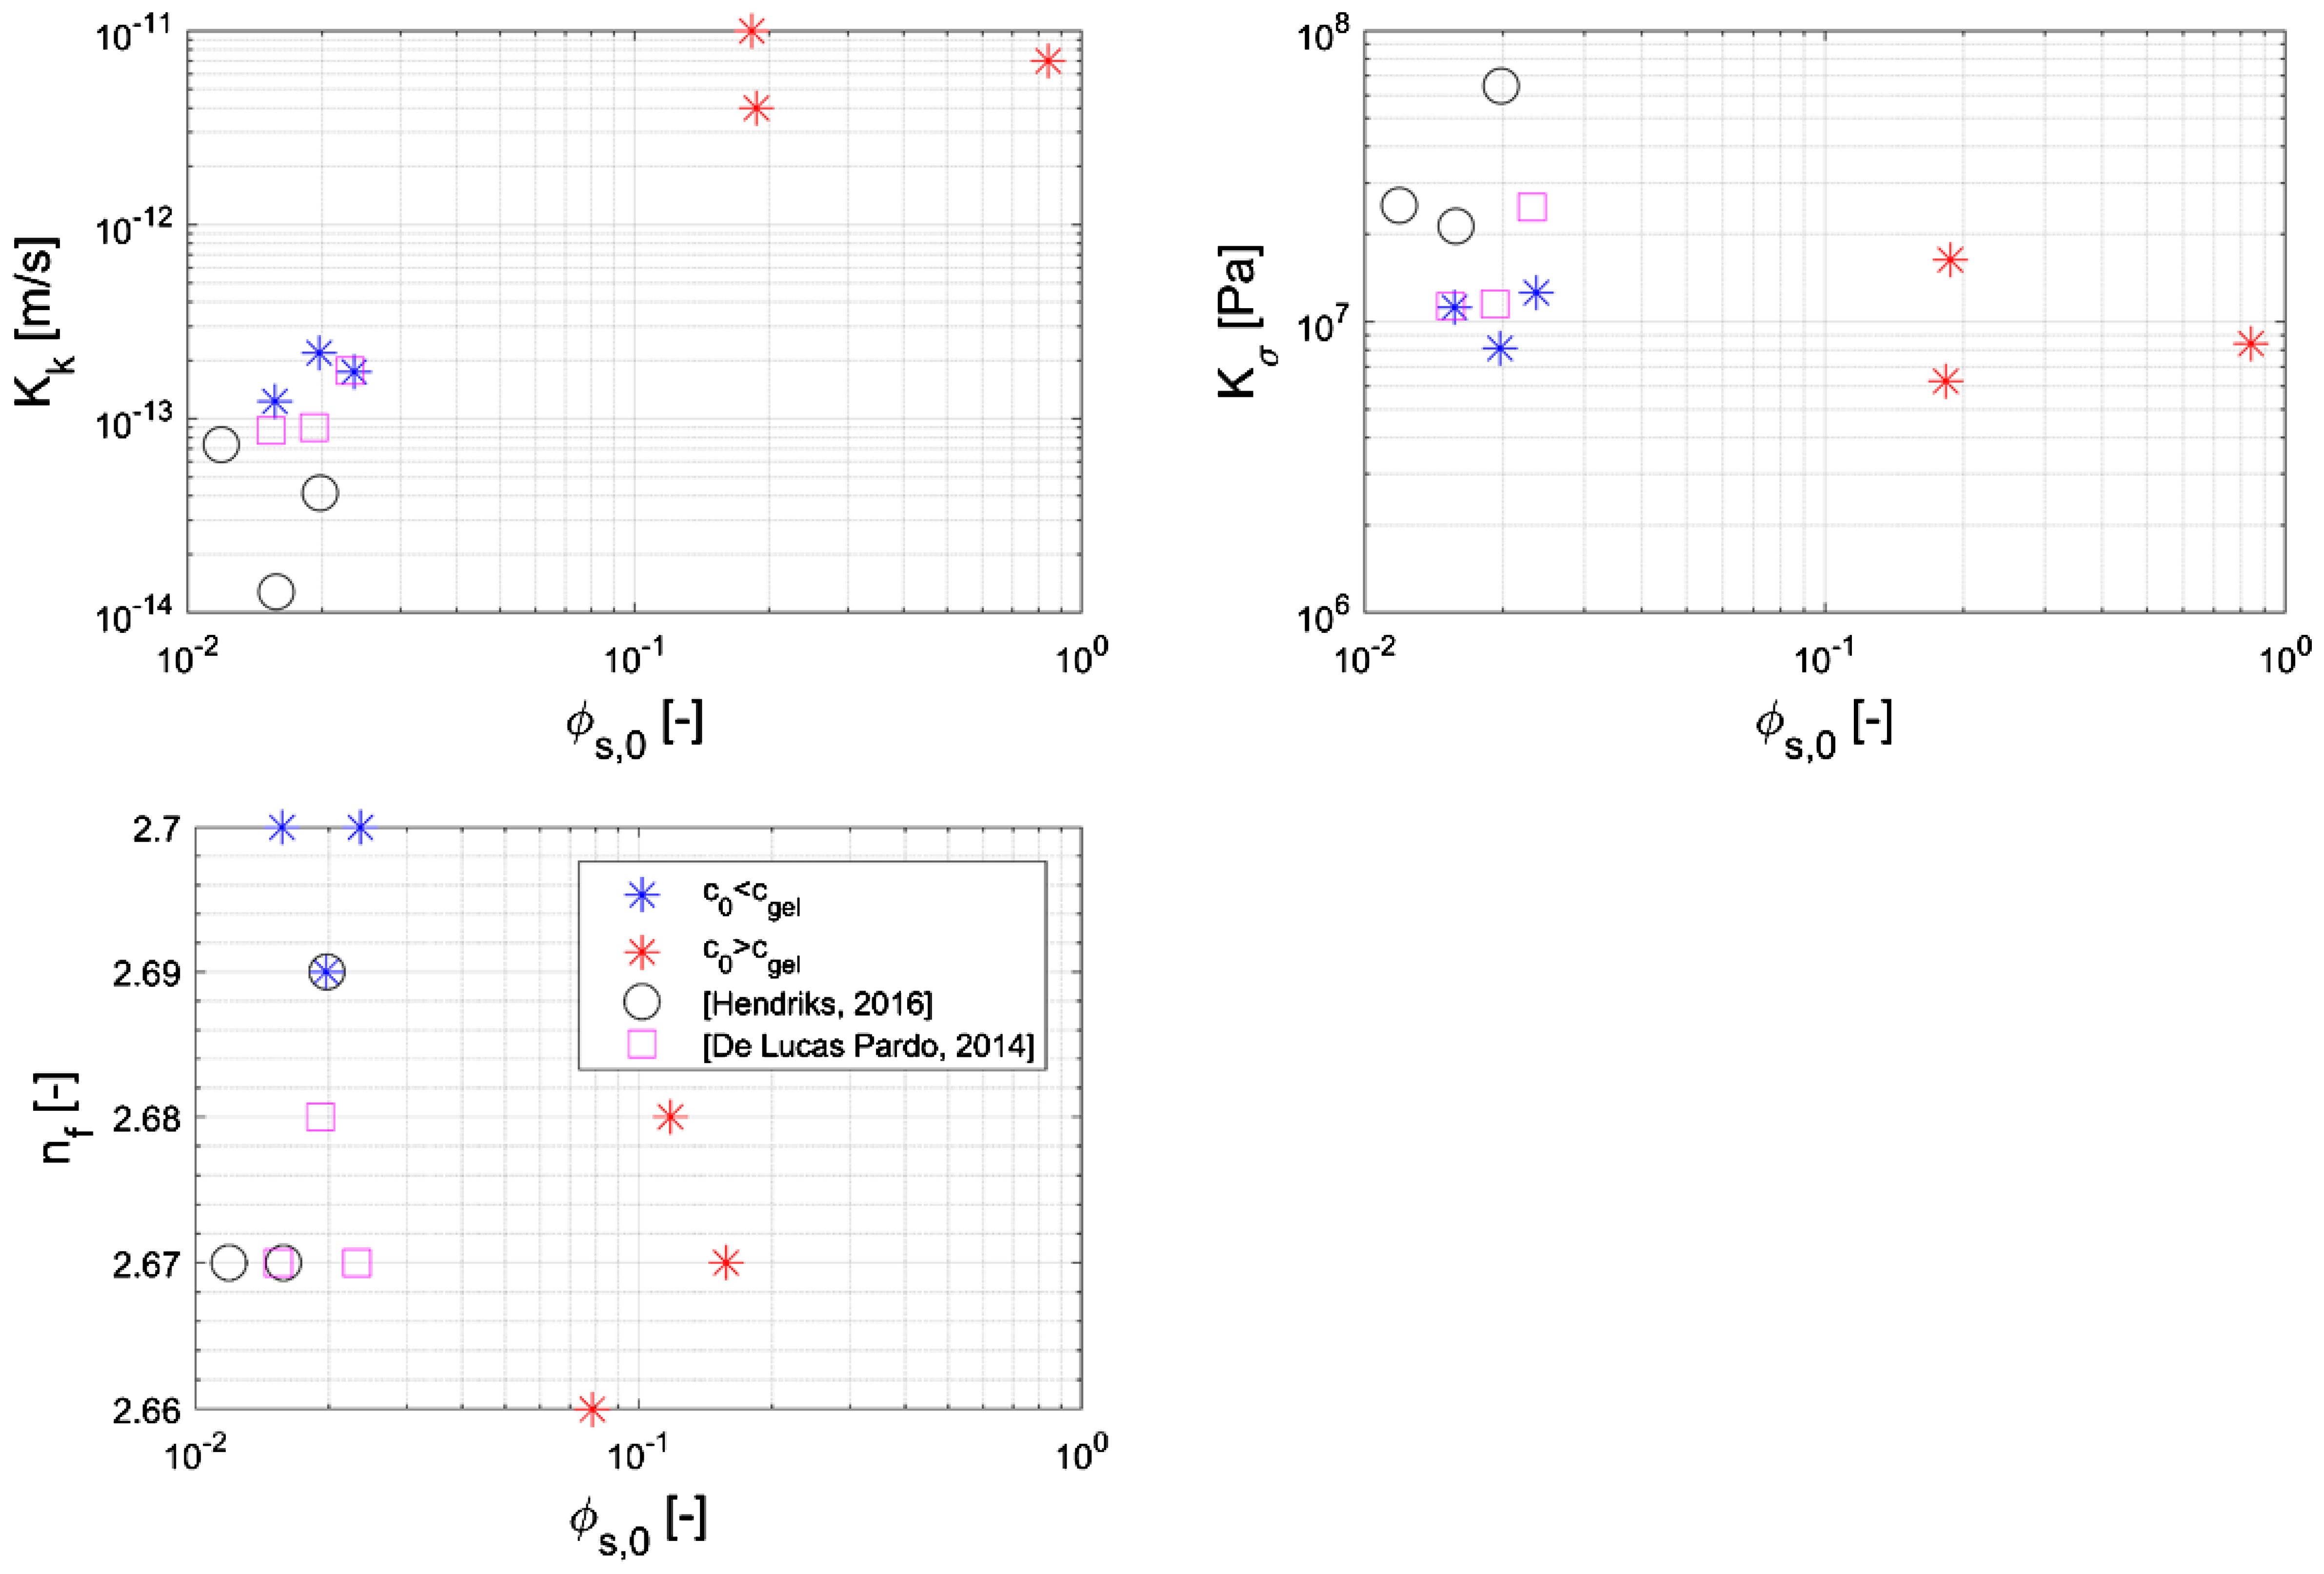
Figure 13. Comparison of the fractal material parameters obtained with respect to the initial volumetric concentration, including the results of De Lucas Pardo (2015) and Hendriks (2016).
The present study demonstrated that the computed profile for an initial concentration of 300 g/L did not achieve the measured equilibrium profile when using parameters obtained from the settling columns (c0 < cgel). However, the equilibrium profile was reached when using the SIC parameters. This discrepancy suggests that the offset may be attributed to the permeability coefficient (Kk) from the settling columns, which was an order of magnitude smaller than the corresponding SIC parameter. Consequently, while final bed heights may be accurately predicted using different sets of material parameters, the consolidation time may vary significantly due to differences in Kk.
4.3 The influence of initial concentration and stress history
In Figure 14, the k and effective stress calculated (Equations 4, 5) with the material parameters obtained from settling tests (Table 3) were extrapolated to ranges of ϕs tested with the SIC. This was done to investigate the influence of the ϕs,0, mixing and stress history at which the material parameters were determined. The results show that, compared to the extrapolated settling data, the SIC hydraulic conductivity was larger while the effective stress was smaller (Figure 14). The SIC tests were performed after mixing the sediment of the settling columns. Thus, the results suggest an effect of the mixing and stress history on the parameters determined. In particular, Equations 4, 5 are applied to a more averaged ϕs for the case of the SIC. Therefore, the results must differ from the outcome of applying these equations to the settling columns data, where the ϕs is not averaged over the vertical. When ϕs is almost uniform (SIC tests) through the whole sample, there is almost no gradient of hydraulic conductivity over the vertical. However, if there is a very non uniform ϕs distribution through the sample (settling column tests), the gradient of the hydraulic conductivity over the vertical is very large because of the power law that the hydraulic conductivity follows (Equation 4). Given the negative power of this equation, the SIC hydraulic conductivity obtained from the averaged ϕs is larger. In the same way, the positive power of Equation 5 explains the smaller effective stress of the SIC test. Thus, the material parameters behave strongly non-linear. Thus: without mixing (i.e. settling column experiment), the denser material plays relatively a larger role than the less dense material (see Figure 15).
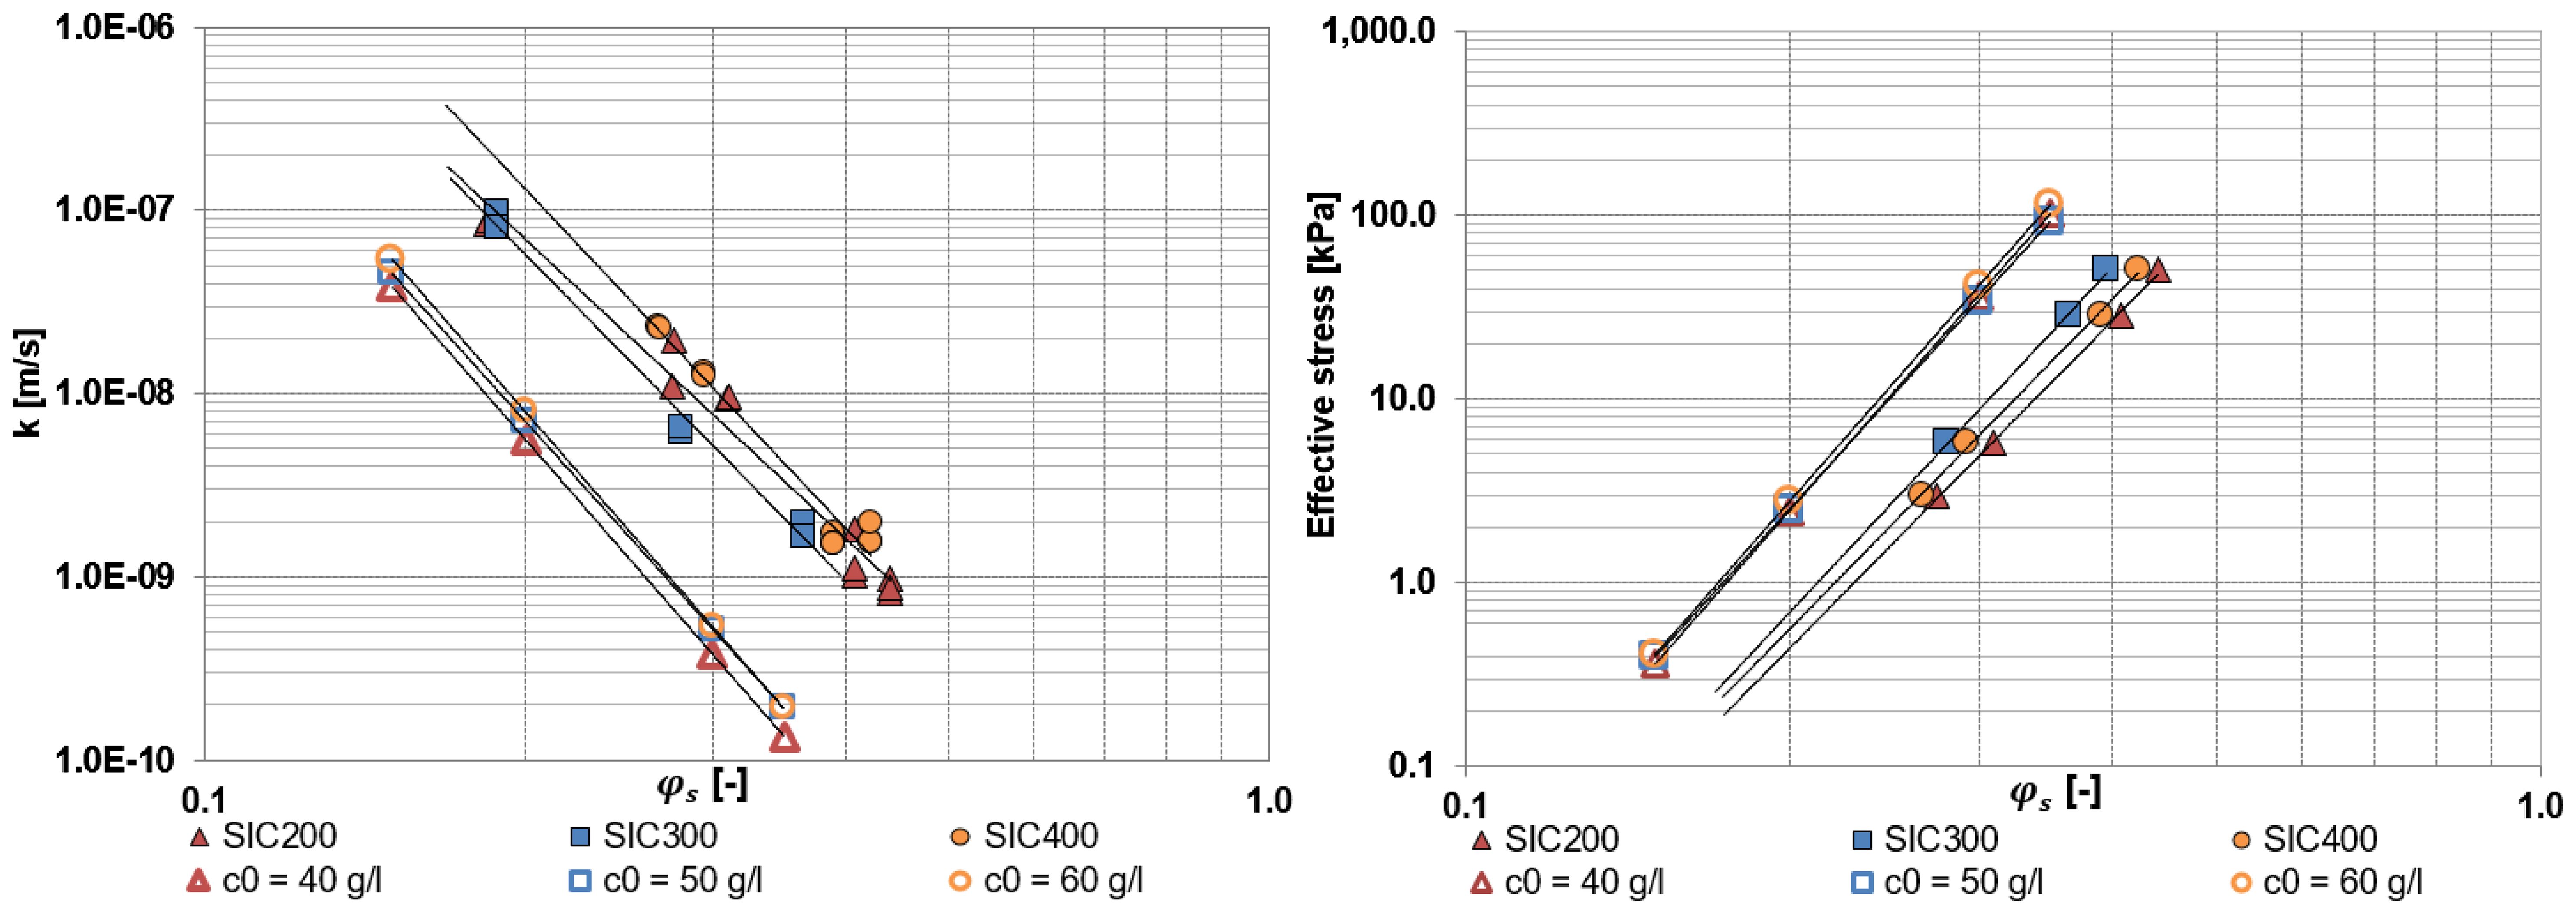
Figure 14. Obtained hydraulic conductivity (left) and effective stress (right) from the settling column and SIC tests. The figure includes extrapolated data (to ranges of ϕs occurring during the SIC tests) of the k and effective stress obtained from settling column tests.

Figure 15. Sketch of the change on the stress profile when mixing the sediment with water when dredging. Left panel shows this effect when mixing a virgin consolidating bed at t=36 h (first phase of consolidation). Right panel shows the effect when remixing a virgin bed at equilibrium. Note the different scale of the x-axis.
4.4 The effect of the dredging process on the stress profile
The model results indicate that, after mixing, an over- consolidated top layer is present. This is a difference with respect to the hypothetical profile, which represents the stress situation before mixing Markermeer sediment during dredging and pumping. Figure 15 shows the computed effective stress profiles before mixing the consolidating layer at t = 36h and at equilibrium. In this figure, the estimated effective stresses immediately after mixing are also sketched. Herein, the mixing process is expected to disturb the network between particles and to average the concentration through the whole layer. Consequently, the effective stresses at are expected to reduce. Immediately after mixing, the effective stress is constant over the vertical because of the constant volumetric concentration (Equation 5). However, because of the consolidation process and the weight of the uppermost sediment, the effective stresses at the bottom are expected to start increasing rapidly. Finally, Figure 15 also shows that the degree of over- consolidation is different depending on the mixing time.
5 Conclusion
This paper examined the impact of the initial concentration, denoted as c0, and the stress state post-mixing on the consolidation behaviour of dredged sediment. Dredged sediment is a mixture of sediment and water where c0 > cgel. The study presented two distinct experimental procedures to determine material parameters: settling columns and SIC tests. The material parameters derived from these two setups were not identical, indicating that the stress history, plastic deformation during mixing (when preparing the SIC test sample), or initial concentration could influence the obtained values. This discrepancy can be attributed to the alteration in the stress state caused by sample homogenisation through mixing. This process results in the existence of an over-consolidated crust-like part relative to the stress profile prior to mixing. This occurs because the mean of the integral of the effective stress does not equate to the integral of the mean of the effective stress. As a result, the values of k obtained from the SIC tests were larger than those determined with the settling columns, while the pattern with the effective stress was the opposite. These differences in material parameters particularly affect the value of Kk and, consequently, the consolidation time. Interestingly, the values of self-similarity (fractal dimension nf) obtained from both the settling column and SIC tests were identical. A combination of SIC tests and settling tests is essential to accurately encompass the full range of effective stress and void ratio. This approach is necessary to determine the k-ϕ and σeff -ϕ relationships with precision across a wide range of ϕ.
The initial concentration profile of the sediment plays a significant role in the consolidation behaviour. By dredging and mixing Markermeer sediment, the aforementioned change in the stress state is induced compared to the situation prior to dredging. This process creates over-consolidated initial conditions, which influence the consolidation behaviour and final properties of the sediment. Specifically, the initial concentration affects the final density profile and the final bed height achieved due to varying degrees of over-consolidated initial conditions.
In this context, an initial concentration (c0) of 558.1 g/l when remixing an equilibrium profile resulted in larger final densities. However, the sediment-water interface was lower, leading to a thinner bed layer. A concentration of 175.6 g/l yielded the same layer thickness and density profile as for virgin consolidation, but required a longer consolidation time.
These factors are particularly crucial for land reclamation and wetland construction, where decisions regarding the initial concentration must be made based on the desired final state. If a thicker final layer is preferred, initial concentrations close to the gelling point (92.2 g/l in this study) are recommended. This condition was achieved with c0 = 175.6 g/l in this study. However, a very high initial concentration (e.g., c0 = 558.1 g/l in this research) can yield a denser (and thus stronger) but thinner bed.
Data availability statement
The raw data supporting the conclusions of this article will be made available by the authors, without undue reservation.
Author contributions
MB-R: Writing – review & editing, Writing – original draft, Visualization, Validation, Software, Resources, Project administration, Methodology, Investigation, Formal analysis, Data curation, Conceptualization. BvB: Writing – review & editing, Writing – original draft, Investigation, Data curation. TvK: Writing – review & editing, Writing – original draft, Supervision. JG: Writing – review & editing, Writing – original draft. JW: Writing – review & editing, Writing – original draft, Supervision, Software, Project administration.
Funding
The author(s) declare financial support was received for the research, authorship, and/or publication of this article. This study was supported with funding from the Netherlands Organization for Scientific Research (NOW, project no. 850.13.031) and from Boskalis, Van Oord, Deltares, RHDHV and Natuurmonumenten, as well as from Regieorgaan SIA (project nr. RAAK.PUB09.018). The open access fee was payed by TU Delft.
Acknowledgments
The authors would like to thank Phil Vardon for reviewing some parts of this work and Saskia Huisman for her assistance during the performance of the SIC tests.
Conflict of interest
The authors declare that the research was conducted in the absence of any commercial or financial relationships that could be construed as a potential conflict of interest.
Publisher’s note
All claims expressed in this article are solely those of the authors and do not necessarily represent those of their affiliated organizations, or those of the publisher, the editors and the reviewers. Any product that may be evaluated in this article, or claim that may be made by its manufacturer, is not guaranteed or endorsed by the publisher.
Supplementary material
The Supplementary Material for this article can be found online at: https://www.frontiersin.org/articles/10.3389/fmars.2024.1466650/full#supplementary-material
References
Abu-Hejleh A. N., Znidarčić D., Barnes B. L. (1996). Consolidation characteristics of phosphatic clays. J. Geotech. Eng. 122, 295–301. doi: 10.1061/(asce)0733-9410(1996)122:4(295
Barciela-Rial M. (2019). Consolidation and drying of slurries, a Building with Nature study for the Marker Wadden. Delft University of Technology.
Barciela-Rial M., Saaltink R., Kessel T., Chassagne C., Dekker S., de Boer H., et al. (2023). A new setup to study the influence of plant growth on the consolidation of dredged cohesive sediment. Front. Earth Sci. 11. doi: 10.3389/feart.2023.952845
Barciela-Rial M., van Paassen L., Griffioen J., Kessel T., Winterwerp J. (2020). The effect of solid-phase composition on the drying behavior of markermeer sediment. Vadose Zone J. 19, e20028. doi: 10.1002/vzj2.20028
Barciela-Rial M., Vardon P., Kessel T., Griffioen J., Winterwerp J. (2022). Effect of composition on the compressibility and shear strength of dredged cohesive sediment. Front. Earth Sci. 10. doi: 10.1142/12473
Been K., Sills G. C. (1981). Self-weight consolidation of soft soils: an experimental and theoretical study. Geotechnique´ 31, 519–535. doi: 10.1680/geot.1981.31.4.519
Dankers P. (2006). On the hindered settling of suspensions of mud and mud-sand mixtures. Delft University of Technology.
Dankers P., Winterwerp J. (2007). Hindered settling of mud flocs: Theory and validation. Continental Shelf Res. 27, 1893–1907. doi: 10.1016/j.csr.2007.03.005
De Lucas Pardo M. (2015). Effect of biota on fine sediment transport processes: A study of Lake Markermeer. Delft University of Technology.
Gibson R. E., England G. L., Hussey M. J. L. (1967). The theory of one-dimensional consolidation of saturated clays. Geotechnique´ 17, 261–273. doi: 10.1680/geot.1967.17.3.261
Hendriks H. (2016). The effect of pH and the solids composition on the settling and self-weight consolidation of mud. Delft University of Technology.
Huerta A., Kriegsmann G. A., Krizek R. J. (1988). Permeability and compressibility of slurries from seepage-induced consolidation. J. Geotech. Eng. 114, 614–627. doi: 10.1061/(ASCE)0733-9410(1988)114:5(614)
Imai G. (1979). Development of a new consolidation test procedure using seepage force. Soils Foundations 19, 45–60. doi: 10.3208/sandf1972.19.345
Kranenburg C. (1994). The fractal structure of cohesive sediment aggregates. Estuarine Coast. Shelf Sci. 39, 451–460. doi: 10.1016/S0272-7714(06)80002-8
Liu J. C., Znidarčić D. (1991). Modeling one-dimensional compression characteristics of soils. J. Geotech. Eng. 117, 162–169. doi: 10.1061/(asce)0733-9410(1991)117:1(162
Merckelbach L. M. (2000). Consolidation and strength evolution of soft mud layers. Delft University of Technology.
Merckelbach L. M., Kranenburg C. (2004a). Determining effective stress and permeability equations for soft mud from simple laboratory experiments. Géotechnique 54, 581–591. doi: 10.1680/geot.2004.54.9.581
Merckelbach L. M., Kranenburg C. (2004b). Equations for effective stress and permeability of soft mud–sand mixtures. Géotechnique 54, 235–243. doi: 10.1680/geot.2004.54.4.235
Sills B. G. (1998). Development of structure in sedimenting soils. Philos. Trans. R. Soc. A: Mathematical Phys. Eng. Sci. 356, 2515–2534. doi: 10.1098/rsta.1998.0284
Terzaghi K. (1923). Die berechnung der durchlassigkeitzifer des tones aus dem verlauf der hydrodynamischen spannungserscheinungen. mathematish-naturwissenschaftliche, klasse. Part IIa (in German). Akademie der Wissenschaften Vienna 132, 125–138.
Terzaghi K., Peck R. (1967). Soil mechanics in engineering practice. 2nd edition (New York: John Wiley).
Toorman E. (1999). Sedimentation and self-weight consolidation: constitutive equations and numerical modelling. Géotechnique 49, 709–726. doi: 10.1680/geot.1999.49.6.709
Van Olphen E. J. C. (2016). Consolidation behaviour of soft cohesive soils, the correlation between different scale model tests: Case study of the Marker Wadden. Delft University of Technology.
Winterwerp J. (1999). On the dynamic of high-concentrated mud suspensions. Delft University of Technology.
Winterwerp J., Kessel T., Maren D., Prooijen B. (2021). Fine Sediment in Open Water: From Fundamentals to Modeling. (Singapore: World Scientific). doi: 10.1142/12473
Winterwerp J. C., van Kesteren W. G. (2004). Introduction to the Physics of Cohesive Sediment Dynamics in the Marine Environment Vol. 56 (Netherland: Elsevier Science).
Znidarcic D. (1982). Laboratory determination of consolidation properties of cohesive soil (Boulder, Colorado, USA: University of Colorado at Boulder).
Keywords: dredged sediment, initial conditions, mass concentration, consolidation, Marker Wadden, Seepage Induced Consolidation Test, settling column tests, beneficial use of sediments
Citation: Barciela-Rial M, van den Bosch BAP, van Kessel T, Griffioen J and Winterwerp JC (2024) Experimental and numerical analysis of underwater consolidation of dredged sediment: a case of study for the Marker Wadden. Front. Mar. Sci. 11:1466650. doi: 10.3389/fmars.2024.1466650
Received: 18 July 2024; Accepted: 07 October 2024;
Published: 02 December 2024.
Edited by:
Byung Joon Lee, Kyungpook National University, Republic of KoreaReviewed by:
Yasuyuki Nakagawa, Port and Airport Research Institute (PARI), JapanXiaoteng Shen, Hohai University, China
Copyright © 2024 Barciela-Rial, van den Bosch, van Kessel, Griffioen and Winterwerp. This is an open-access article distributed under the terms of the Creative Commons Attribution License (CC BY). The use, distribution or reproduction in other forums is permitted, provided the original author(s) and the copyright owner(s) are credited and that the original publication in this journal is cited, in accordance with accepted academic practice. No use, distribution or reproduction is permitted which does not comply with these terms.
*Correspondence: Johan C. Winterwerp, Si5DLldpbnRlcndlcnBAdHVkZWxmdC5ubA==
 Maria Barciela-Rial
 Barend A. P. van den Bosch3
 Thijs van Kessel
 Jasper Griffioen
 Johan C. Winterwerp