 Huaiyuan Xue
 Hongyuan Shi
 Chao Zhan1,2
- 1Institute of Coastal Research, Ludong University of China, Yantai, China
- 2School of Hydraulic and Civil Engineering, Ludong University of China, Yantai, China
- 3School of Civil Engineering, University of Queensland, St Lucia, QLD, Australia
As a new type of liquid discharged into the sea, concentrated brine exhibits complex mixing and stratification patterns due to changes in its density and hydrodynamic properties. This complexity impacts salinity transmission and can result in brine intrusion disasters, directly affecting both ecosystem and human life. This research adopted brine discharge into Dingzi Bay, Shandong Peninsula, a typical estuarine bay, as a case study. 3D convective diffusion numerical simulation techniques were applied to investigate the pathways, salinity rise, impact range, and overall effects on brine dispersal in marine water environments under the combined influence of river flow and tides. The results indicated the followings: (1) Significant spatial variations were observed in flow velocities within Dingzi Bay, with higher velocities near Xiang Island (where river flow turned into the bay) and at bay mouth; (2) The brine discharge point is influenced by complex hydrographic terrain and the combined effects of river flow and tidal movements, resulting in the formation of a high salinity area at the base of the discharge point, where salinity increases by more than 4 PSU within a 100-meter radius.; (3) During high tides, high-concentration brine was clearly transported upstream along the tidal channel, with a salinity increase of ≥3psu covering an area of 5.72×10⁴ m2, extending up to 270 m upstream and 180 m downstream. Brine discharge led to significant mixing of concentrated seawater with seawater within the bay, altering the spatial and temporal distributions of salinity in Dingzi Bay and consequently affecting local sensitive marine species and water environment safety. This study systematically investigated the process of brine discharge into the ocean and its impact range. It was found that discharging brine in areas with higher currents promotes the mixing and dispersion of brine. Additionally, a seasonal discharge plan should be established to avoid discharges during periods of low runoff (such as winter) to minimize negative impacts on aquatic ecosystems and promote the health and diversity of marine ecosystems.
1 Introduction
Brine discharge typically involves returning the byproduct of the desalination process (high salinity water) back into the ocean. This can lead to a phenomenon known as “brine underflow,” where the denser, saltier water sinks and forms a layer on the seabed, potentially causing low-oxygen conditions that can suffocate benthic life (Lee et al., 2020). Marine water environment problems caused by brine discharge into the sea has attracted widespread attention in recent years; especially the issue of increased salinity in receiving waters has spurred extensive research (Purnalna et al., 2003; Zheng et al., 2014). With rapid progress of industrialization and urbanization, human activities have given rise to the discharge of large amounts of brine, significantly changing the spatial distribution of salinity in recipient marine areas (Lin et al., 2015). In addition, some research works have revealed that high-salinity water bodies have altered local marine ecological environments (Ye et al., 2018), directly threatening the survival and reproduction of some sensitive marine species (Chang-Feng et al., 2014). This ecological imbalance can impact on not only the natural habitats of marine life, but also fishery resources and human economic activities (Zhi-Guo et al., 2018). Therefore, in-depth research on the process and pathways of brine dispersion into the sea, consequent salinity increase, impact range, and effects on marine ecosystems, as well as finding effective mitigation and resolution measures for the stability of marine ecological environments in brine discharge areas is of significant scientific and practical importance (Kowalski and Mazierski, 2008).
Malfeito et al. (2005) studied the environmental impacts of Javea reverse osmosis seawater desalination plant in Alicante, Spain. They found that specific brine discharge treatment methods effectively mitigated environmental impacts, maintained salinity and water quality within the safe limits, and prevented damage to local marine ecosystems. Ruso et al. (2007) revealed that benthic communities near brine discharge outlets were homogeneous and the originally diverse communities had been replaced by communities dominated by nematodes. To alleviate the effect of brine discharge into the sea, some researchers have proposed to improve discharge methods and increase brine-seawater mixing ratios (Voutchkov, 2009). Kelaher et al. (2020) performed a long-term study on the impacts of desalination brine discharge on sensitive fish populations and found that initial brine discharge had positive impacts on surrounding fish communities, increasing fish number and diversity, but these changes were temporary. Once the discharge was stopped, fish community structures tended to revert to their original state, which indicated that the environmental impacts of brine discharge were reversible, with further monitoring and management required to ensure ecological balance. Therefore, to understand the impact of concentrated brine discharge on the salinity of receiving marine areas and to reduce the harmful effects of salinity changes on organisms, it is crucial to utilize numerical models to simulate and predict the variations in the diffusion process before and after brine discharge (Pérez-Díaz et al., 2019; Zhang et al., 2023).
After brine discharge, fan-shaped distribution patterns form near discharge outlets (Del Bene et al., 1994); although these discharge patterns have relatively limited impact ranges, they significantly increase salinity in local marine areas (Ahmad and Baddour, 2014). Purnama and Al-Barwani (2006) applied a 2D convection-diffusion equation to evaluate the environmental impacts of brine discharge from desalination plants in Oman Bay. The obtained results indicated that under specific conditions, tidal oscillations could rapidly increase salinity on both sides of the discharge point, emphasizing on the significant role of tides in brine dispersion processes near discharge outlets. In addition, increase of salinity was found to affect the growth of phytoplankton in the area. Fernández-Torquemada et al. (2019) investigated three reverse osmosis desalination plants in southeastern Spain through field observations and statistical data analyses to explore spatial and temporal distribution patterns following brine discharge. They found that brine dispersion was closely related to the discharge depth, dilution ratio, and seabed topography. Furthermore, increase of the dilution ratio of brine to raw seawater before discharge could significantly decrease the impact range of brine dispersion into the sea (Fernández-Torquemada et al., 2009). Sun et al. (2012) applied COHERENS model to deeply investigate the patterns of brine dispersion into the sea from a desalination plant in Laizhou Bay and analyzed the effects of tidal fluctuations on the variations of temperature and salinity. They showed that the convective dispersion pattern of brine was closely related to periodic fluctuations of tides, playing a key role in brine transportation and dispersion. Wang et al. (2009) applied POM model to set various discharge volumes and analyze temporal changes and distribution of salinity. Their research showed that during February, May, August, and October, there were significant increases in salinity near brine discharge points. In February, salinity could increase by 8.73psu, affecting the growth process of phytoplankton in that marine area.
This research adopted Dingzi Bay on Shandong Peninsula in China as research area. Dingzi Bay is a typical narrow estuarine bay, compared to the open sea areas, its complex bathymetry and relatively poor hydrodynamic conditions can create difficulties in convective dispersion of brine. The local marine areas surrounding the brine discharge zones experience significant salinity increase, affecting local ecological safety, particularly for certain salt-sensitive marine species (Al-Kasbi and Purnama, 2022). An in-depth study on the convective dispersion process of brine into the sea along with its salinity increase, and impact range will aid in the standardized management of brine discharge and protection of ecosystem stability in receiving marine areas (Malcangio and Petrillo, 2010). This study employs a three-dimensional convective diffusion numerical model to focus on the diffusion process, impact range, salinity increase, and its effects on the marine ecological environment following brine discharge into the sea.
2 Materials and methods
2.1 Regional background
Dingzi Bay is located in the southern marine area of Shandong Peninsula, China (Figure 1), connecting upstream to Wulong River estuary and downstream to Yellow Sea (Zhan et al., 2017). This bay is the largest and most representative ria-type tidal channel bay on Shandong Peninsula (Tian et al., 2017). It has unique geomorphological properties, with contours resembling “small mouth and big belly” shape. The northwestern area is the estuarine section of Wulong River, while the central to southeastern areas extend into coastal regions outside Wulong River estuary (Wang et al., 2023). During high tide in Dingzi Bay, the area of the bay reaches 143.75 km², with an intertidal zone covering about 119.01 km² and bay mouth width of about 6.0 km. During low tide, seawater mainly covers tidal channel areas, with tidal flats exposed on both sides.
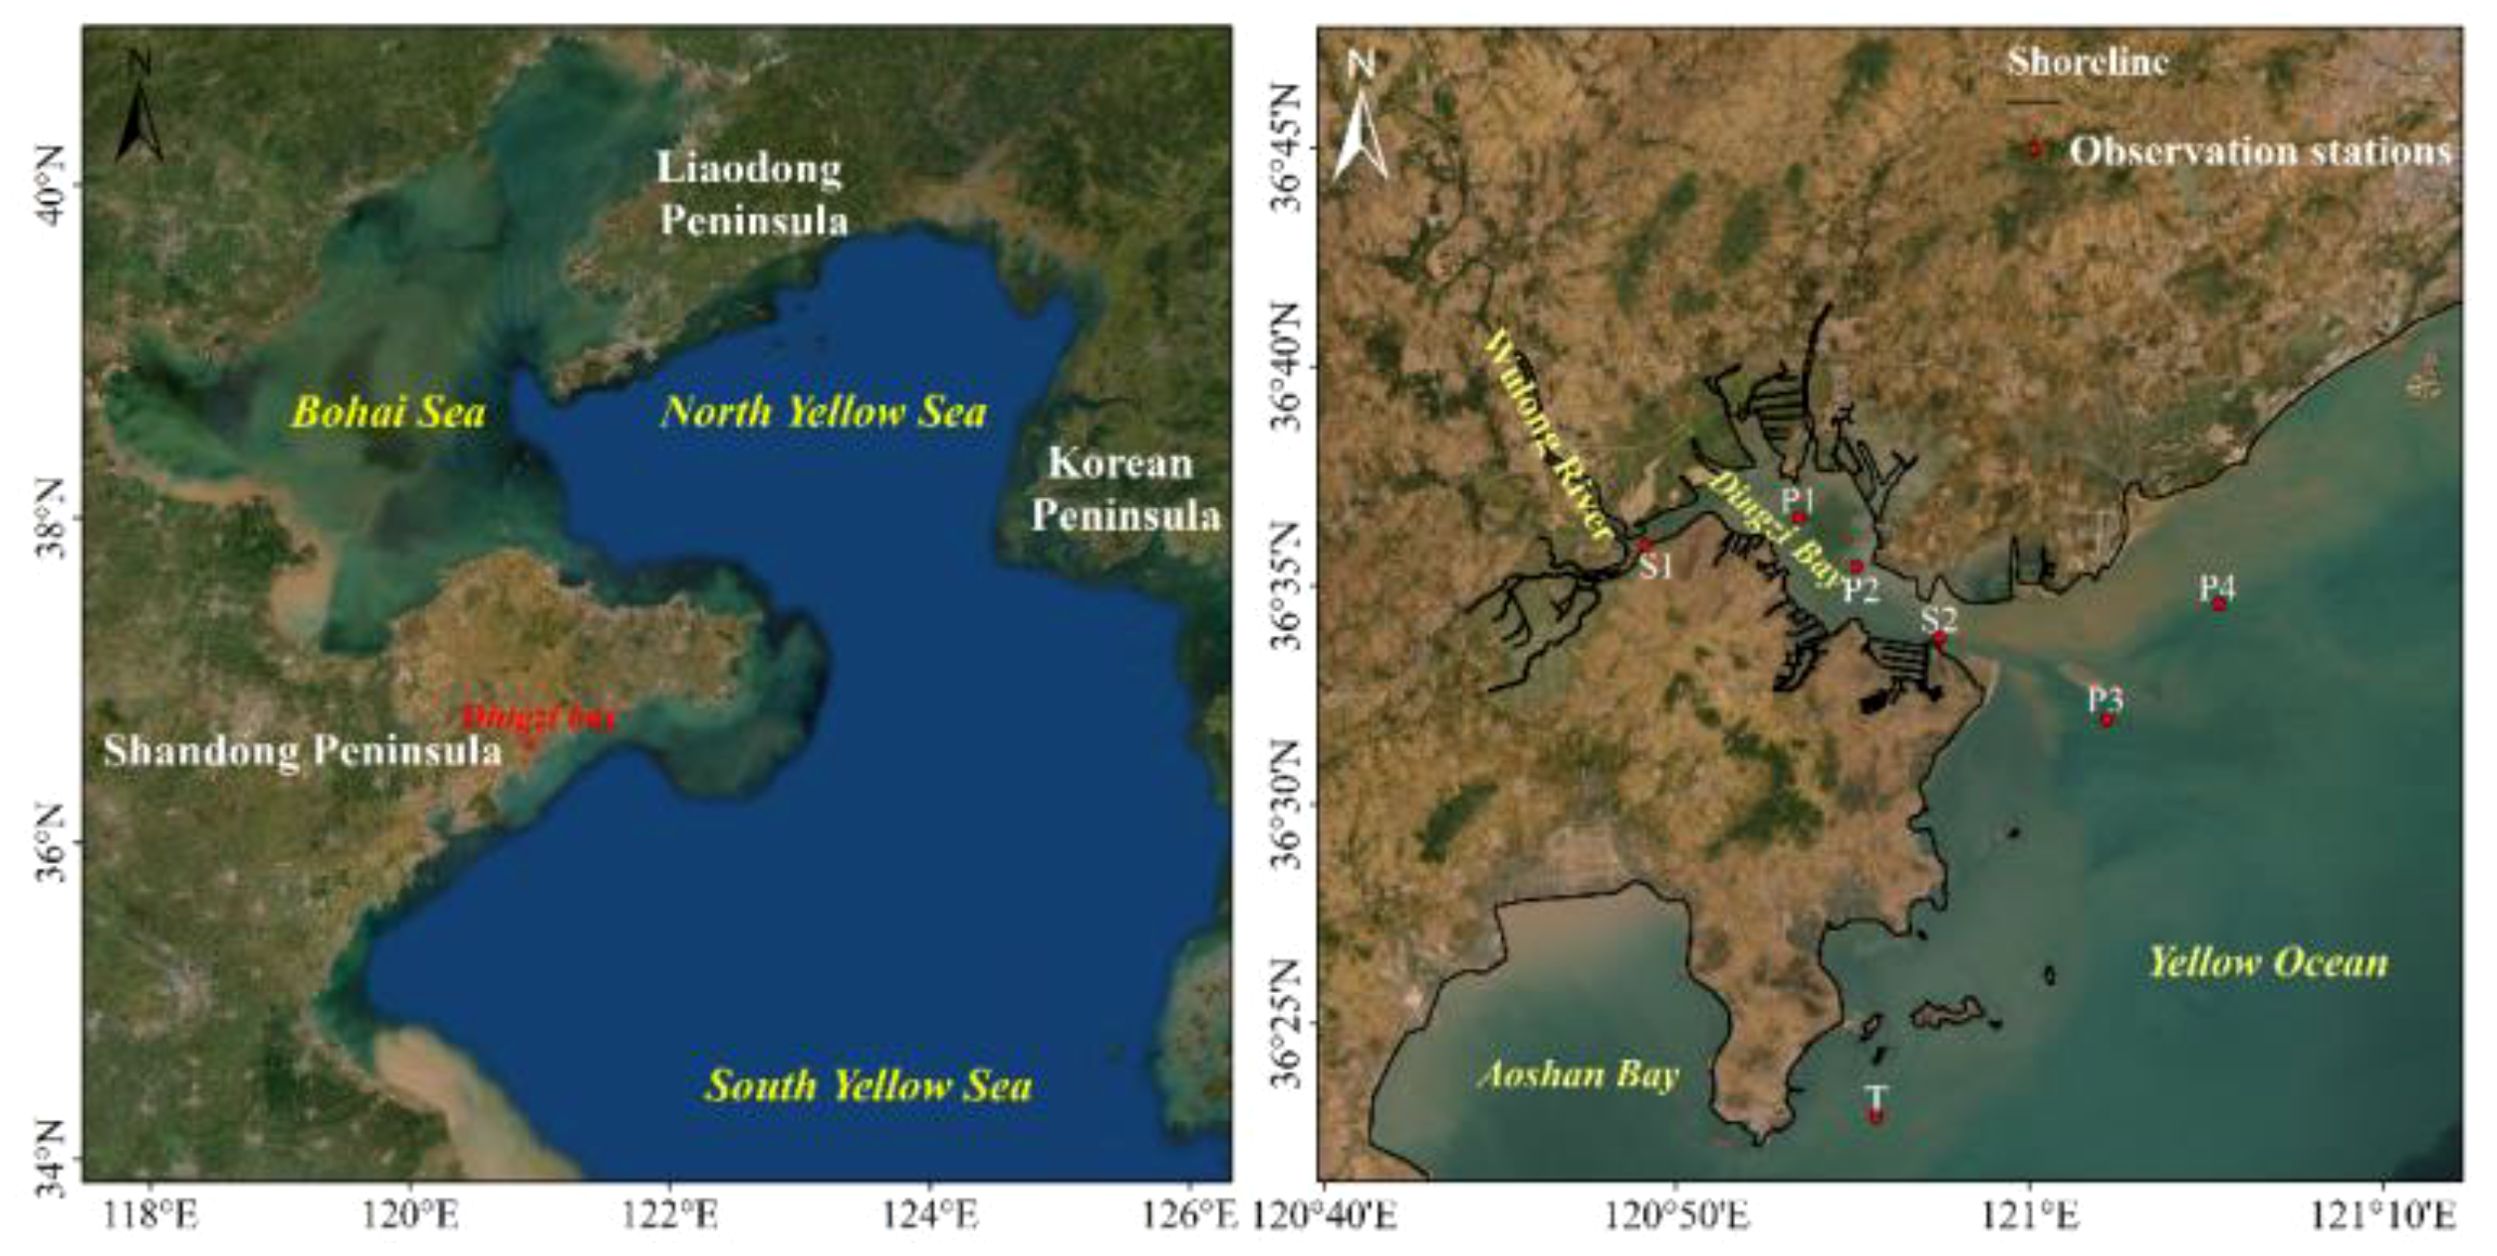
Figure 1. Research area and observation station map (P is tidal current observation point, S is salinity observation point, and T is tidal level observation point).
Geomorphological pattern of Dingzi Bay is characterized as “intertidal flats with a tidal channel.” A large ebb-tide delta, with bay mouth as its apex, develops outside the bay entrance. Tidal channel is less than 1000 m wide and about 15 km long above the bottom of the channel and channel sidewall slopes range from 0.9 to 5.2% (Figure 2). The area around the brine discharge outlet, located in tidal channel, features a seabed geomorphological pattern of “two channels with a sandbank in between.” In the middle section of cross-section DM11, central sandbank top rises about 3.4 m above the western ebb-tide channel and 6.0 m above the eastern flood-tide channel (Figure 2). In cross-section DM16, central sandbank top is 3.4 m above the bottom of the northwest ebb-tide channel and 2.5 m above the bottom of the southeast flood-tide channel.
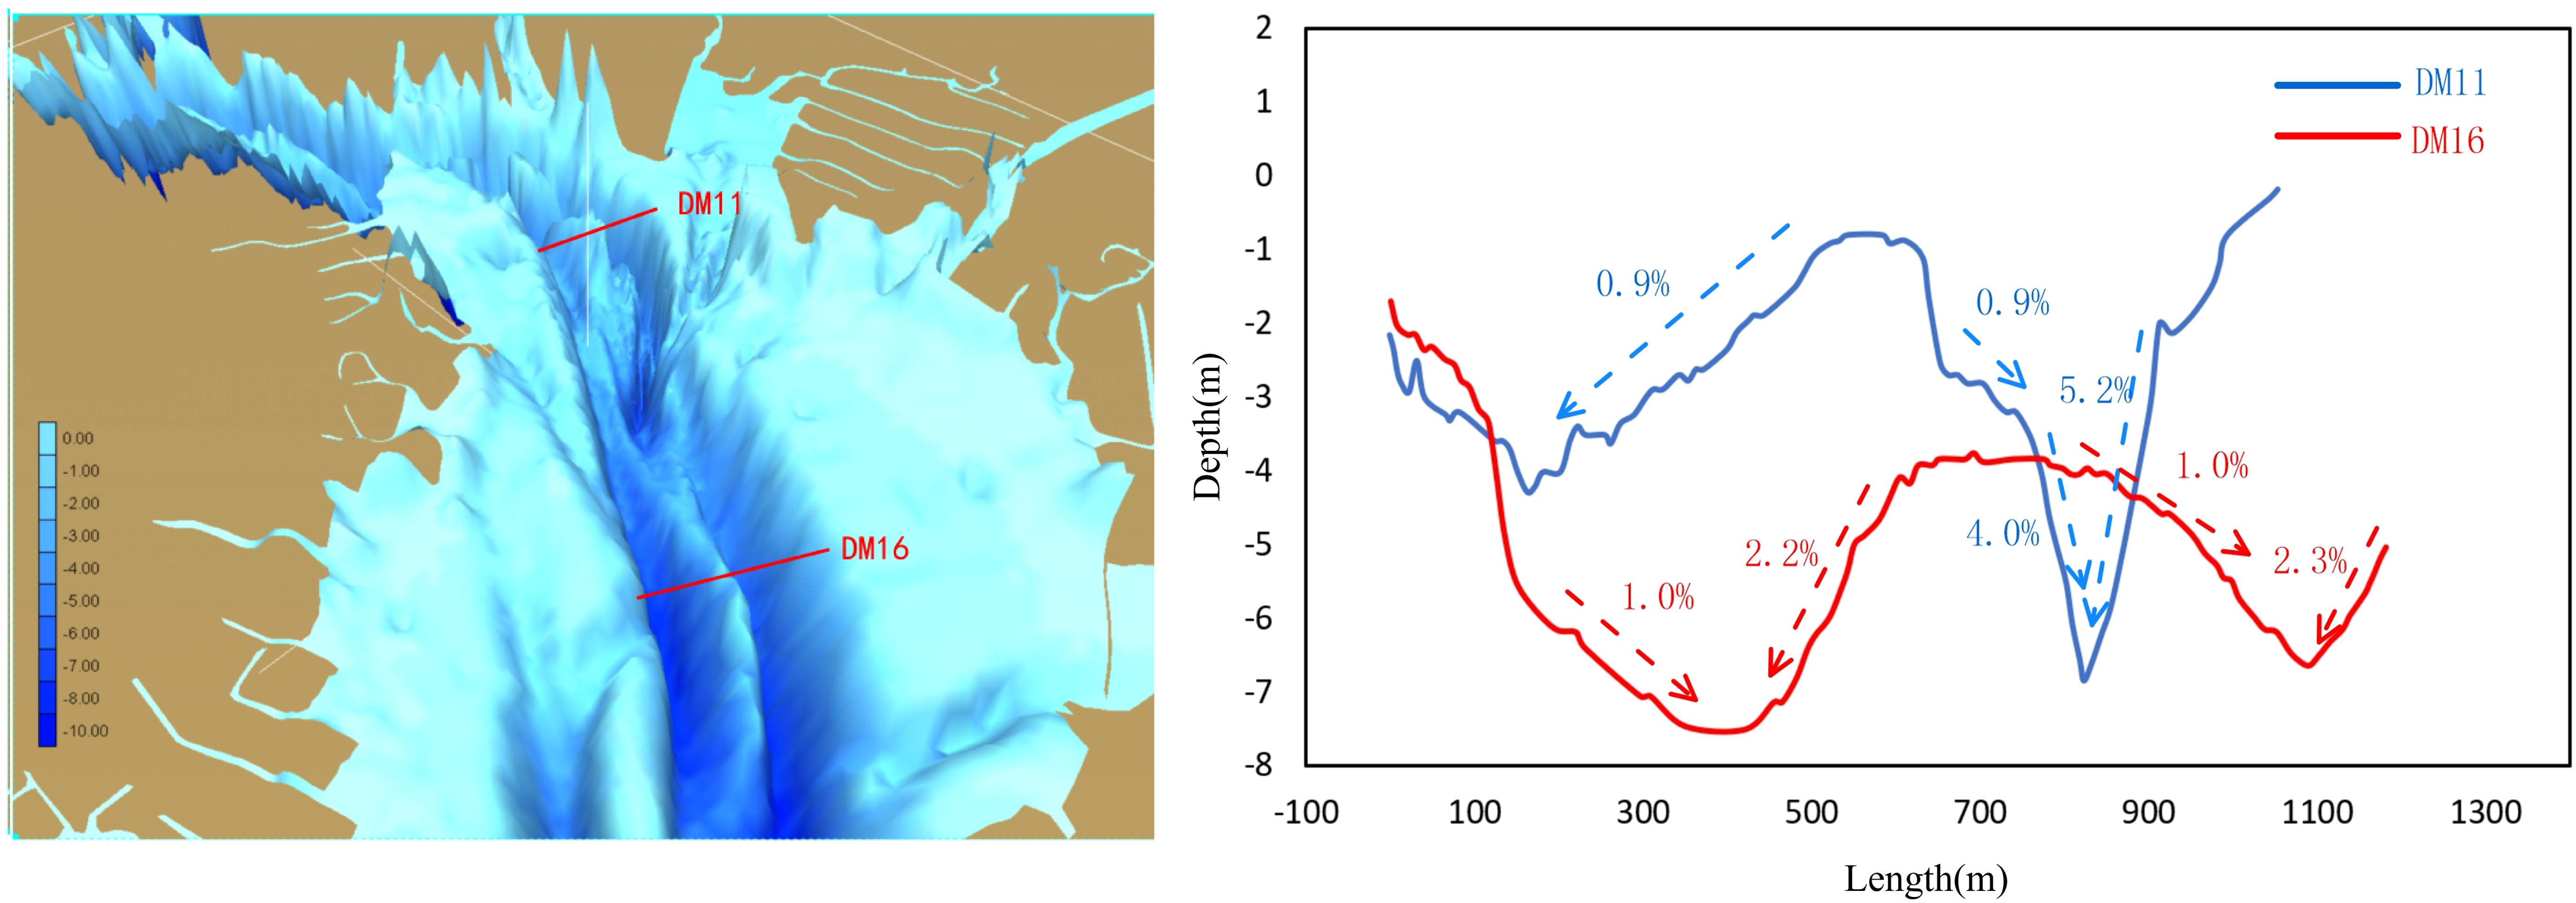
Figure 2. Topographic map near the outfall (DM11 represents the section where the outfall is located, and DM16 represents the section within the bay).
The tidal characteristics of Dingzi Bay are typical of regular semidiurnal tides, with a maximum tidal range of 4.7 meters. The tidal currents of the bay are primarily due to the narrow, elongated shoreline and the topographic effects of tidal channel, predominantly presenting a reciprocating flow from southeast to northwest. Regarding the waves outside the bay, the primary wave direction is from southeast. In summer, typhoons often cause high waves outside the bay entrance, with wave heights typically exceeding 1.5 m and reaching up to 3.5 m. However, these Most of the waves have minimal impacts inside the bay; therefore, this research model did not consider wave effects (Zhan et al., 2024).
Wulong River at the head of Dingzi Bay is a monsoon rain-fed river, with an average annual runoff of 92.7×10⁸ m³, accounting for 70-80% of the total annual runoff during flood season (Figure 3). Based on the data observed at Tuanwang station (hydrological station) from 2000 to 2022, the average monthly discharge of Wulong River into the sea was 10.71 m³/s, with multi-year average daily flow in winter being 3.21 m³/s, which was significantly increased to 24.28 m³/s in summer. On August 12th, 2006, the highest daily flow of 1870 m³/s was recorded.
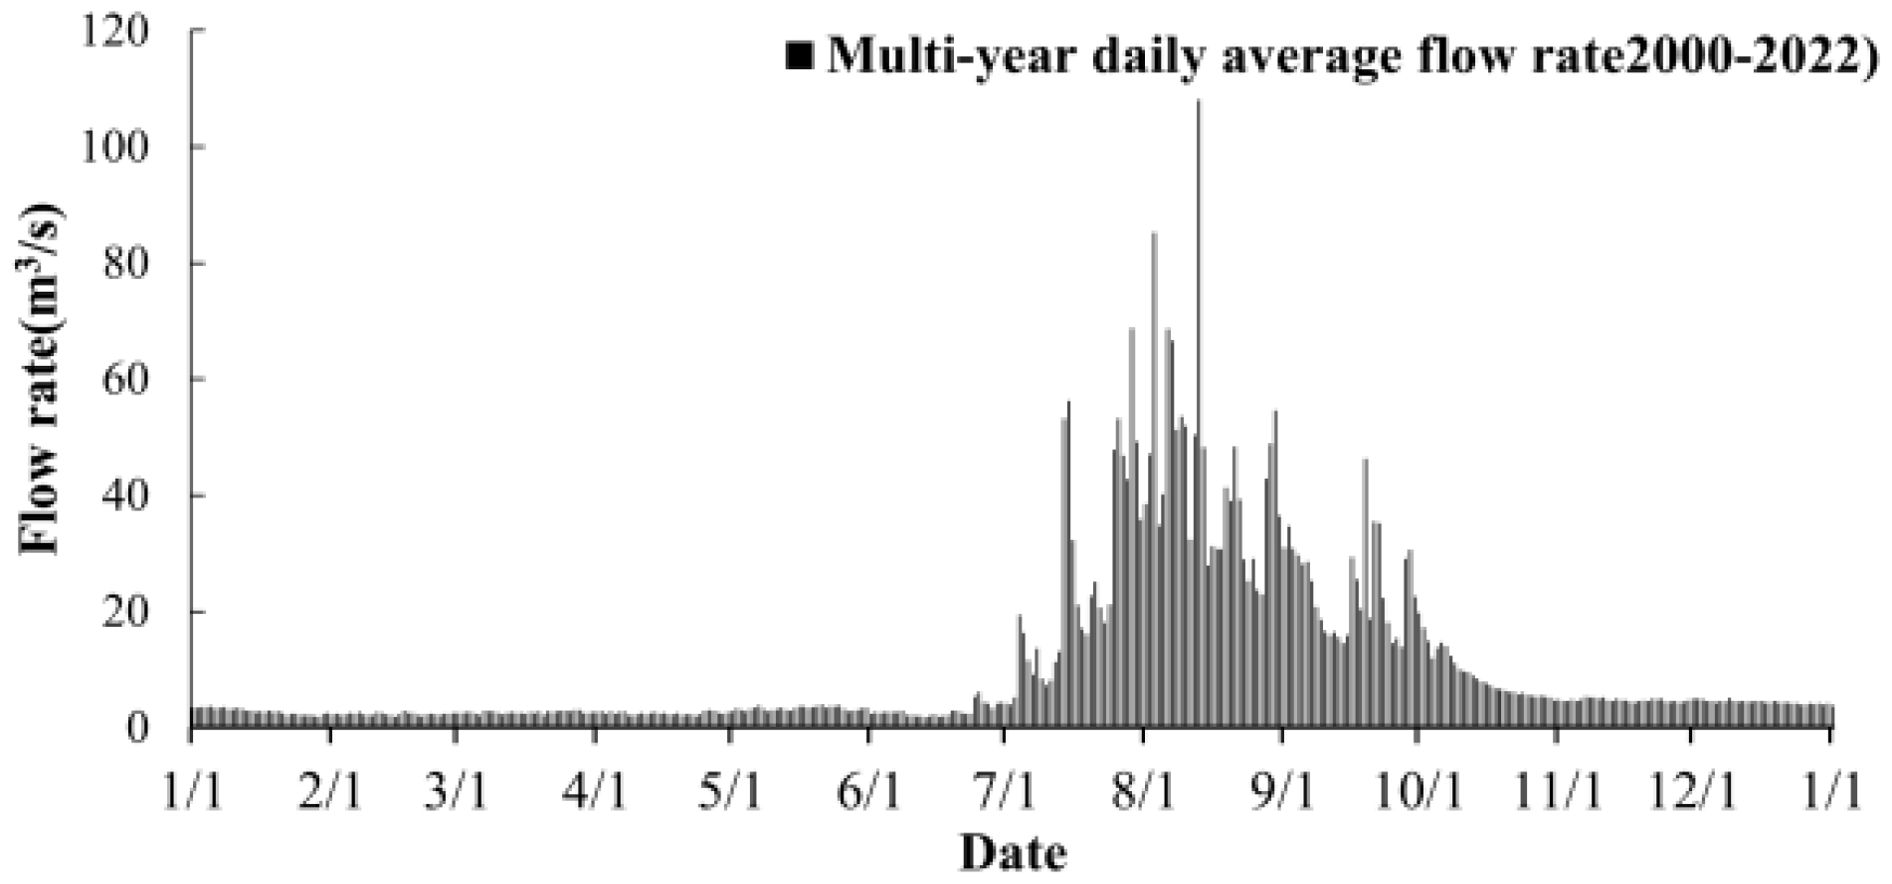
Figure 3. Multi-year daily average flow rate of Wulong River.
2.2 Model setup
Research area was located between latitudes 36.1°N and 36.8°N and longitudes 120.6°E and 121.5°E, including Wulong River Estuary, Dingzi Bay, and parts of Yellow River marine area. Bathymetric data for Wulong River Estuary and Dingzi Bay area were collected by onsite measurements with precision of 1:5000. Bathymetric data for areas outside Dingzi Bay were obtained from ETOPO global bathymetric dataset.
Considering the complex topography of Dingzi Bay coastline, to more accurately simulate natural shoreline, the developed model employed an unstructured triangular mesh (Fowler et al., 2016) to delineate the computational area and utilized dynamic boundaries to handle wet-dry grid transformations (Guo et al., 2021). Computational area included 41,866 grids and 23,393 nodes(Figure 4), divided vertically into 6 Sigma layers. To precisely calculate salinity variations near discharge outlets, the grids near these outlets were refined (Zhang et al., 2023), with the smallest grid scale in the refined area being 2 m. Using a bilinear interpolation method (Minh et al., 2024), bathymetric scatter data were applied to grid points to obtain distributions of water depths, as illustrated in Figure 5. The model has a minimum time step of 0.05 seconds and a maximum time step of 30 seconds. The boundary conditions for the Wulong River use runoff input, while the ocean boundary conditions are driven by water levels. The water levels are forecasted based on harmonic constants of various tidal constituents assimilated from satellite altimetry data using the Tide Model Driver (TMD) (Ma et al., 2024).
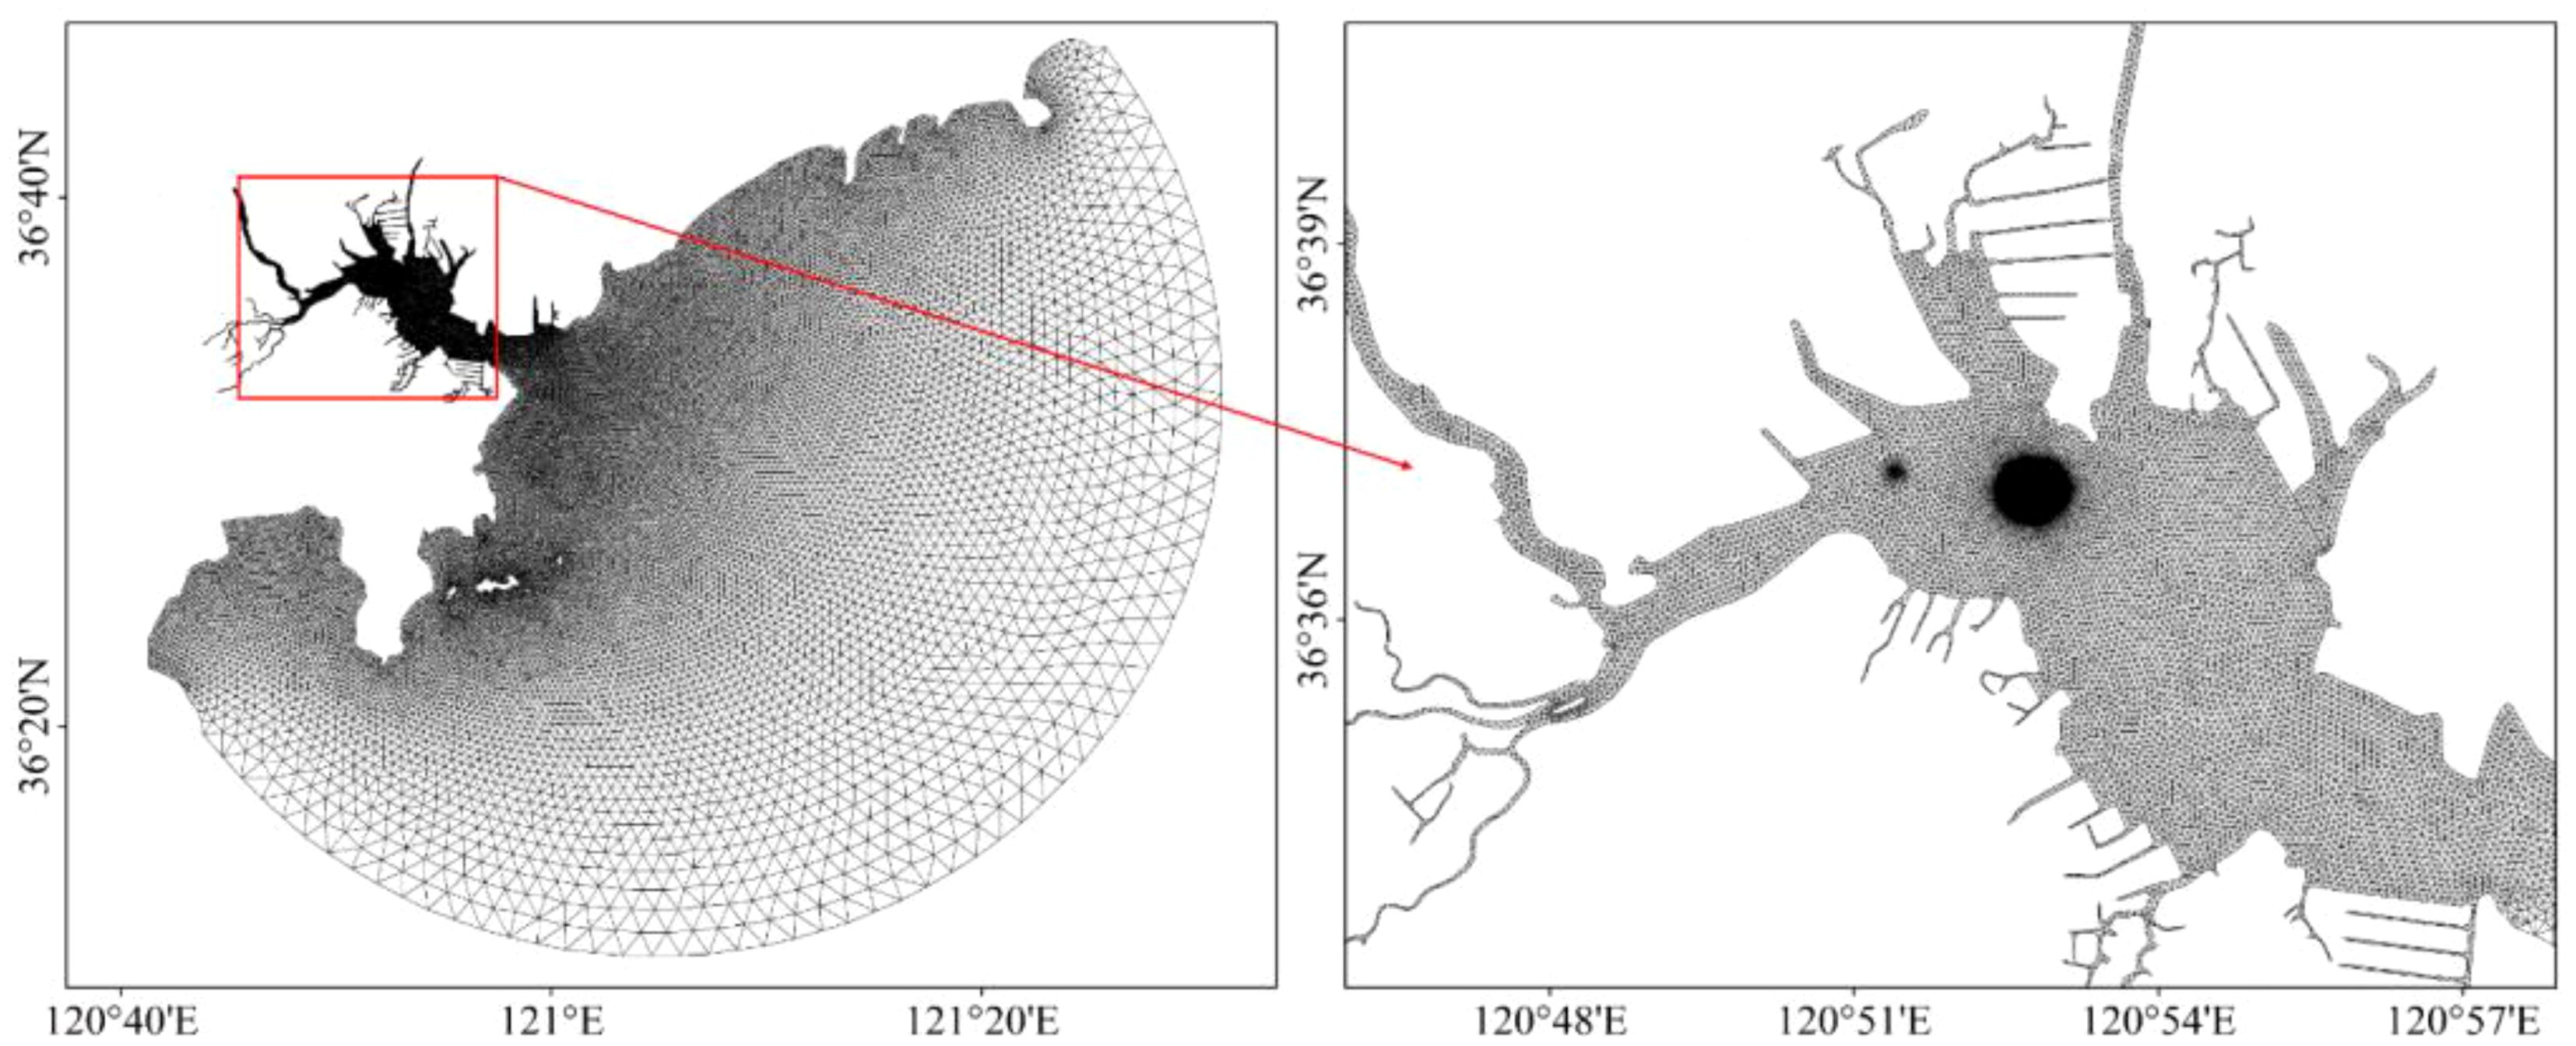
Figure 4. Dingzi Bay grid map.
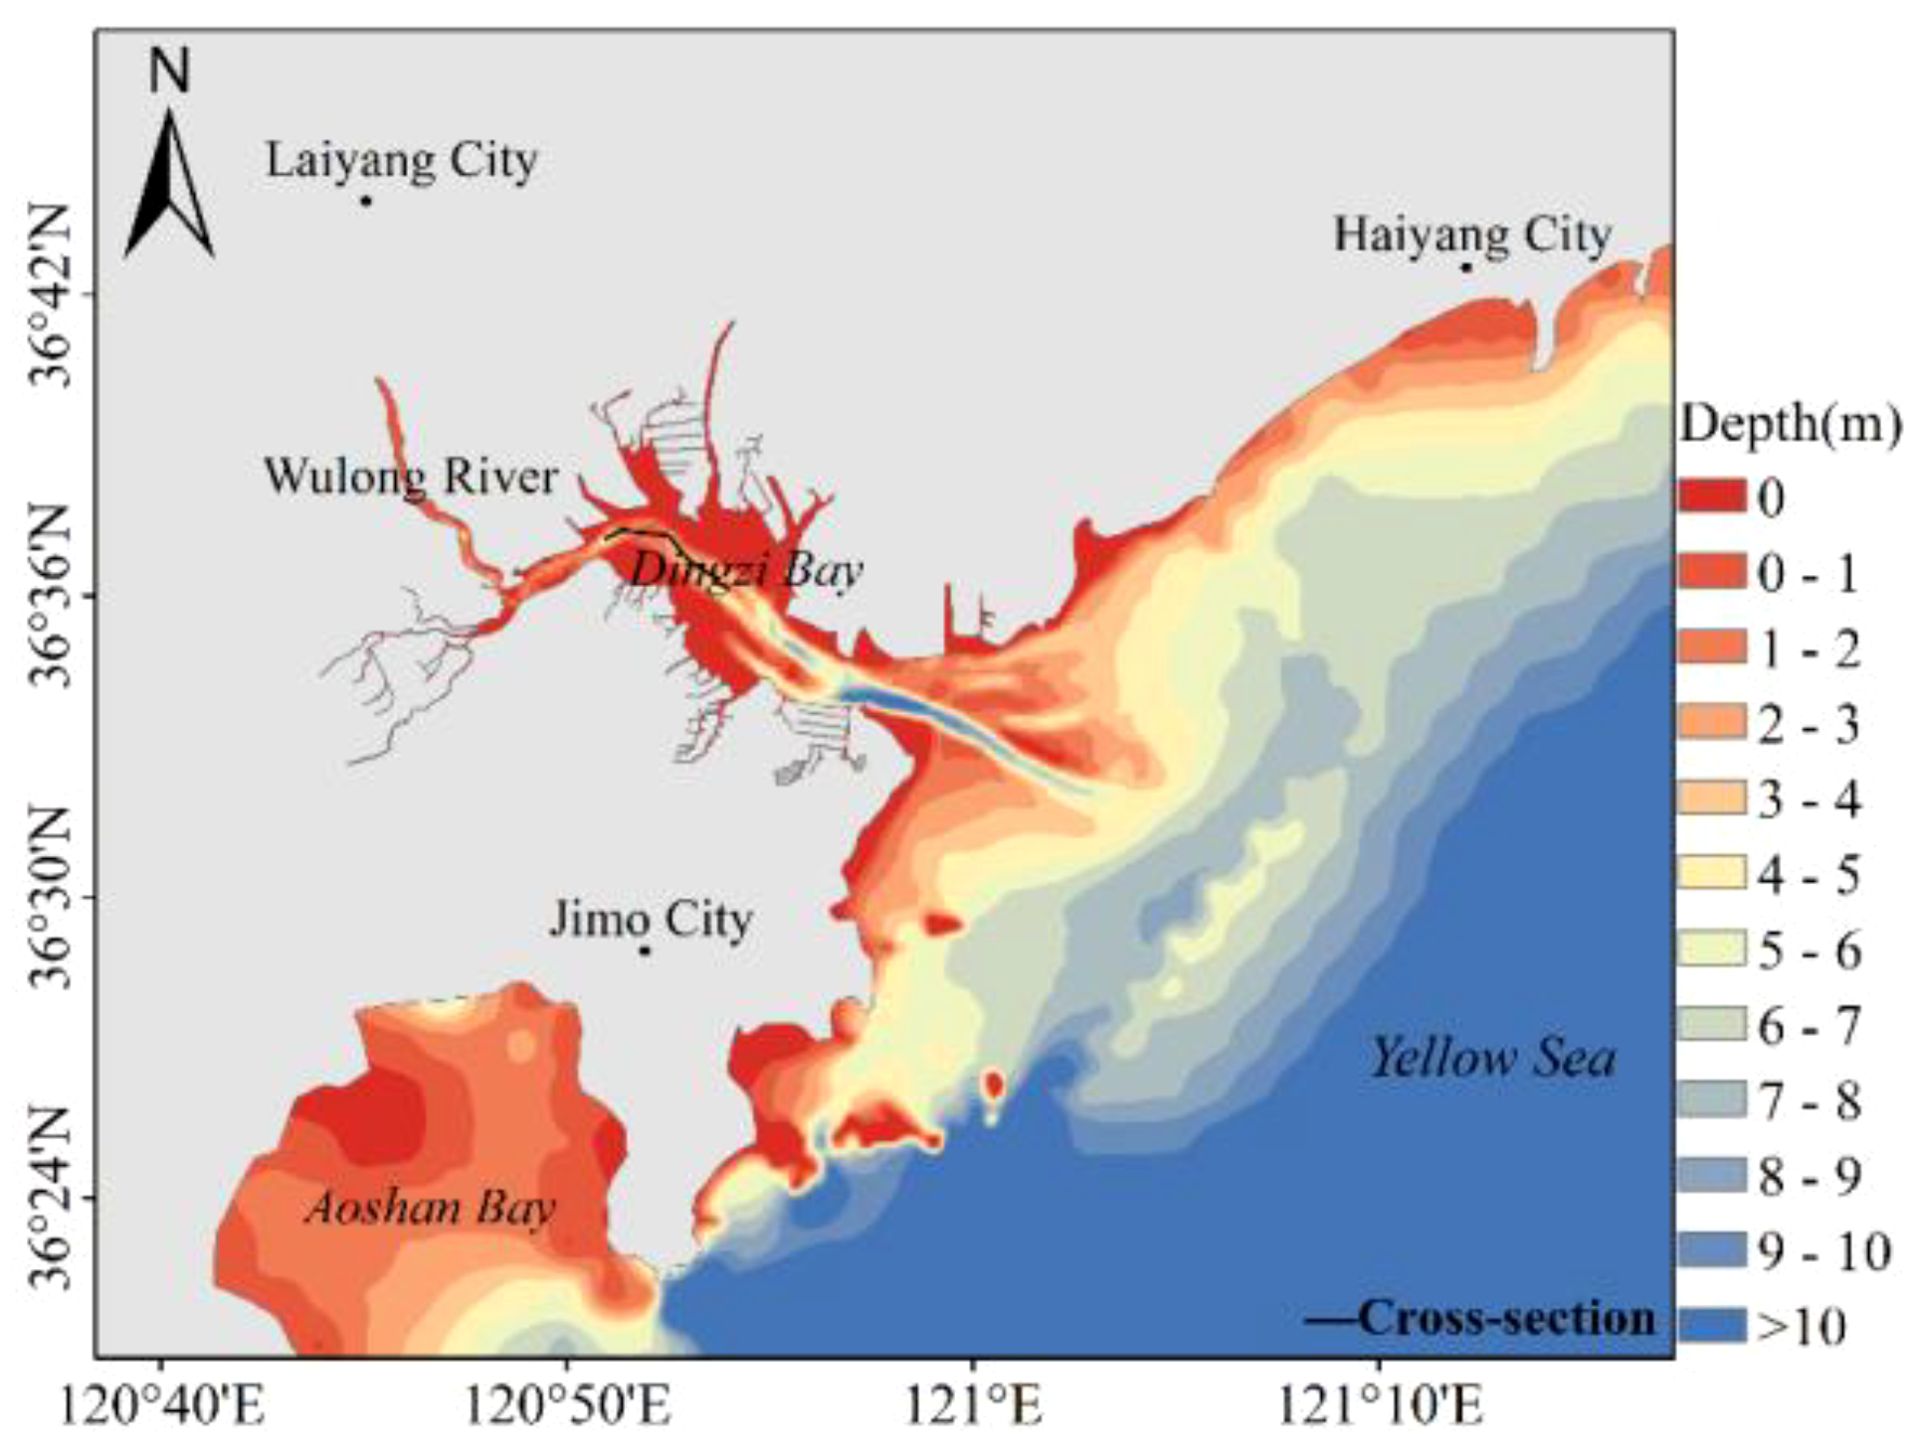
Figure 5. Dingzi Bay topographic map.
Seawater salinity data for Dingzi Bay included measurements from two tidal stations (S1 and S2 as shown in Figure 1) collected between December 25th, 2022, and January 1st, 2023. Remote sensing imagery from the same period was used to obtain the spatial distribution of surface salinity in Dingzi Bay.
Brine discharge outlet was located within the main tidal channel of Dingzi Bay, significantly affected by the upstream flow of Wulong River. The salinity of the estuarine area varied greatly in different seasons. During the dry seasons of winter and spring, salinity in the estuary was higher while In the wet seasons of summer and autumn, increased river flow led to a significant decrease in salinity due to seawater dilution by freshwater. Considering the impact of brine discharge on ecological environments, marine biomass in Dingzi Bay reached its peak in autumn, when salinity variations have the most significant impact. Furthermore, the average river flow in September was at its highest. After considering seasonal variations in Wulong River flow into the sea and biomass in Dingzi Bay, winter and autumn were selected as the representative seasons for 3D numerical simulations. The average river flows in December and September served as runoff input conditions for the model. The water intake during autumn and winter is 15.52 m³/s and 11.12 m³/s, respectively, while the discharge rates are 9.99 m³/s and 7.16 m³/s, respectively.
2.3 Model validation
To verify the feasibility and accuracy of the developed model, comprehensive validation was performed considering various parameters such as tide level, flow speed, flow direction, and salinity. Figure 6 compares simulated and observed tide levels at Nvdao Station (Figure 1, Station T) from July 16th to July 23rd, 2022, with results indicating good consistency in tide amplitude and phase. The speed and direction of flow at measurement points P1, P2, P3, and P4 from December 29th to December 30th, 2022, are also compared (Figure 7). It was found that simulation results matched well with the experimental values and flow directions were almost identical, proving that the model could accurately reflect the hydrodynamic characteristics of Dingzi Bay. Figure 8 compares the observed and simulated salinity results at measurement points S1 and S2, from December 29th to December 30th, 2022. The calculated values strong agreement with the observed data, ensuring the accuracy of subsequent model calculations.
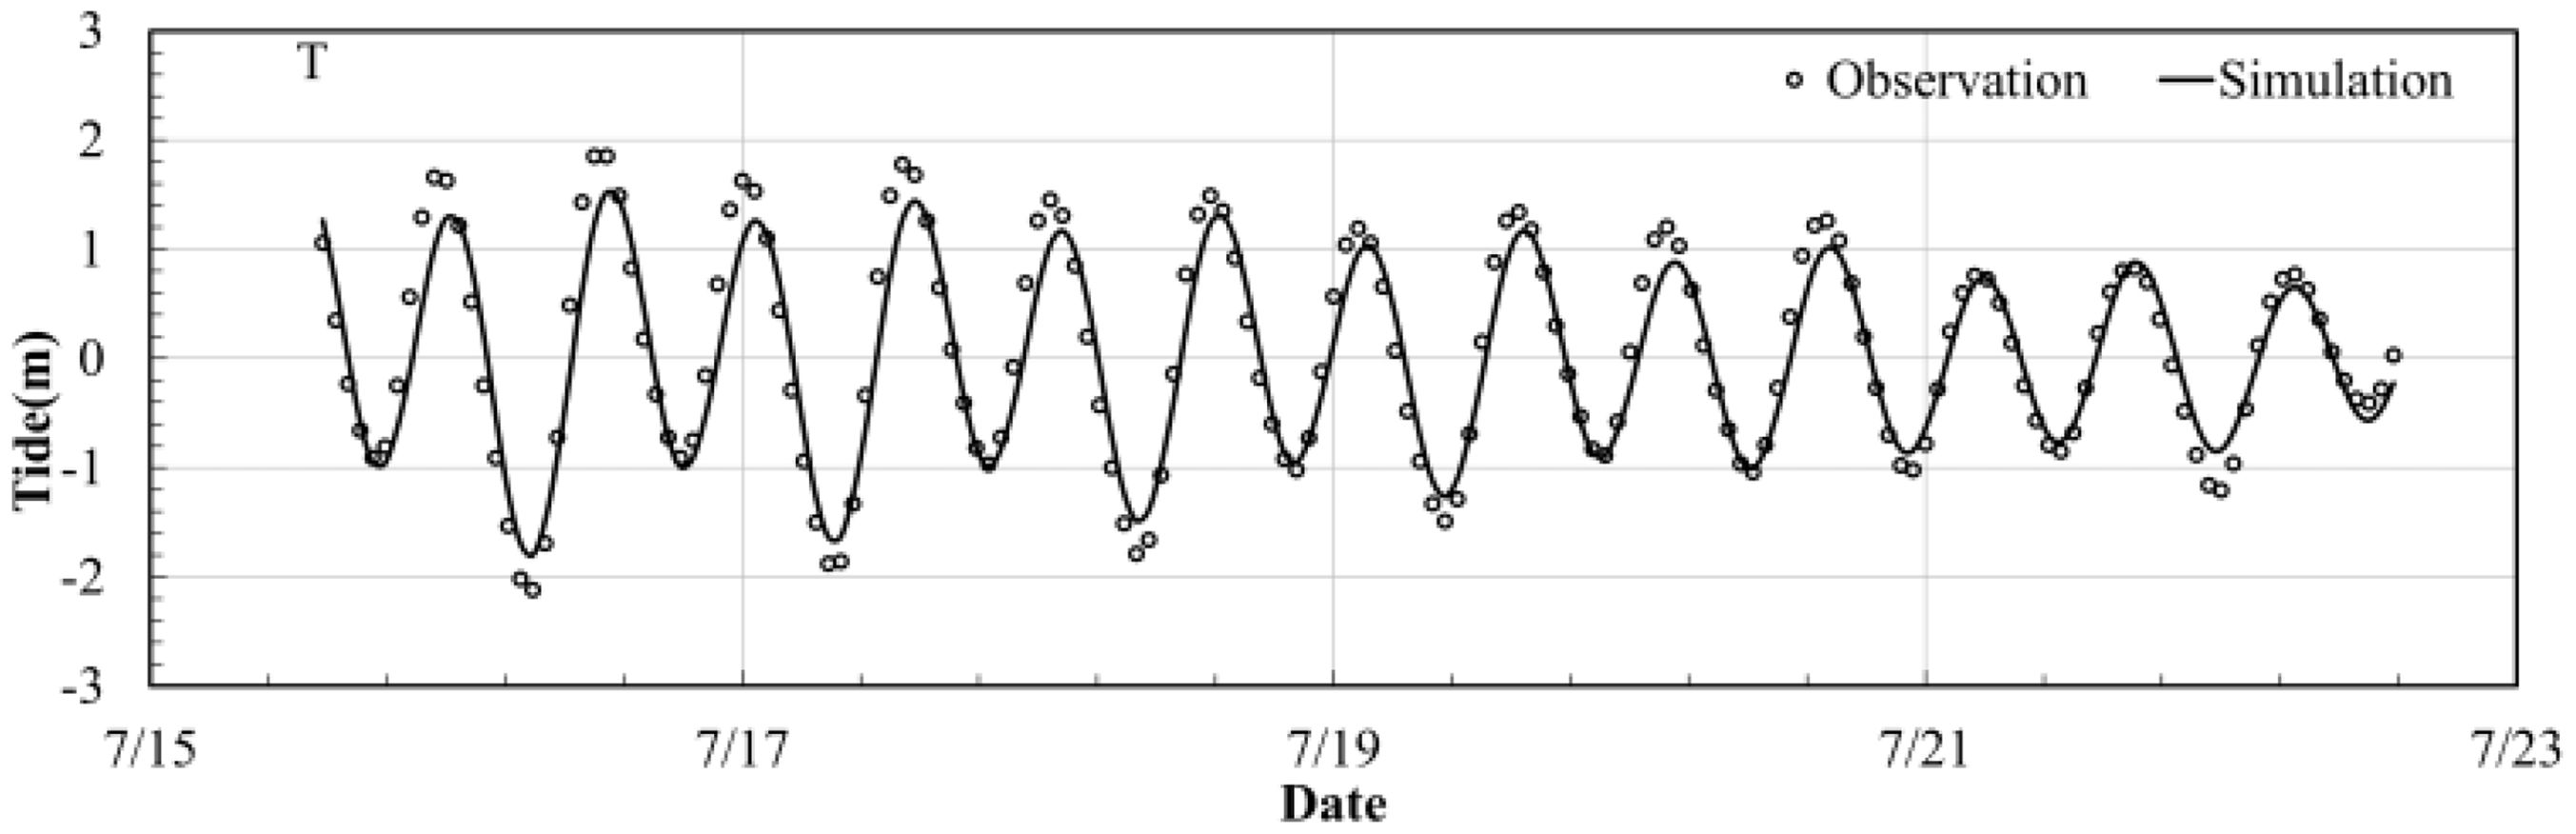
Figure 6. Comparison of calculated and measured tide levels.
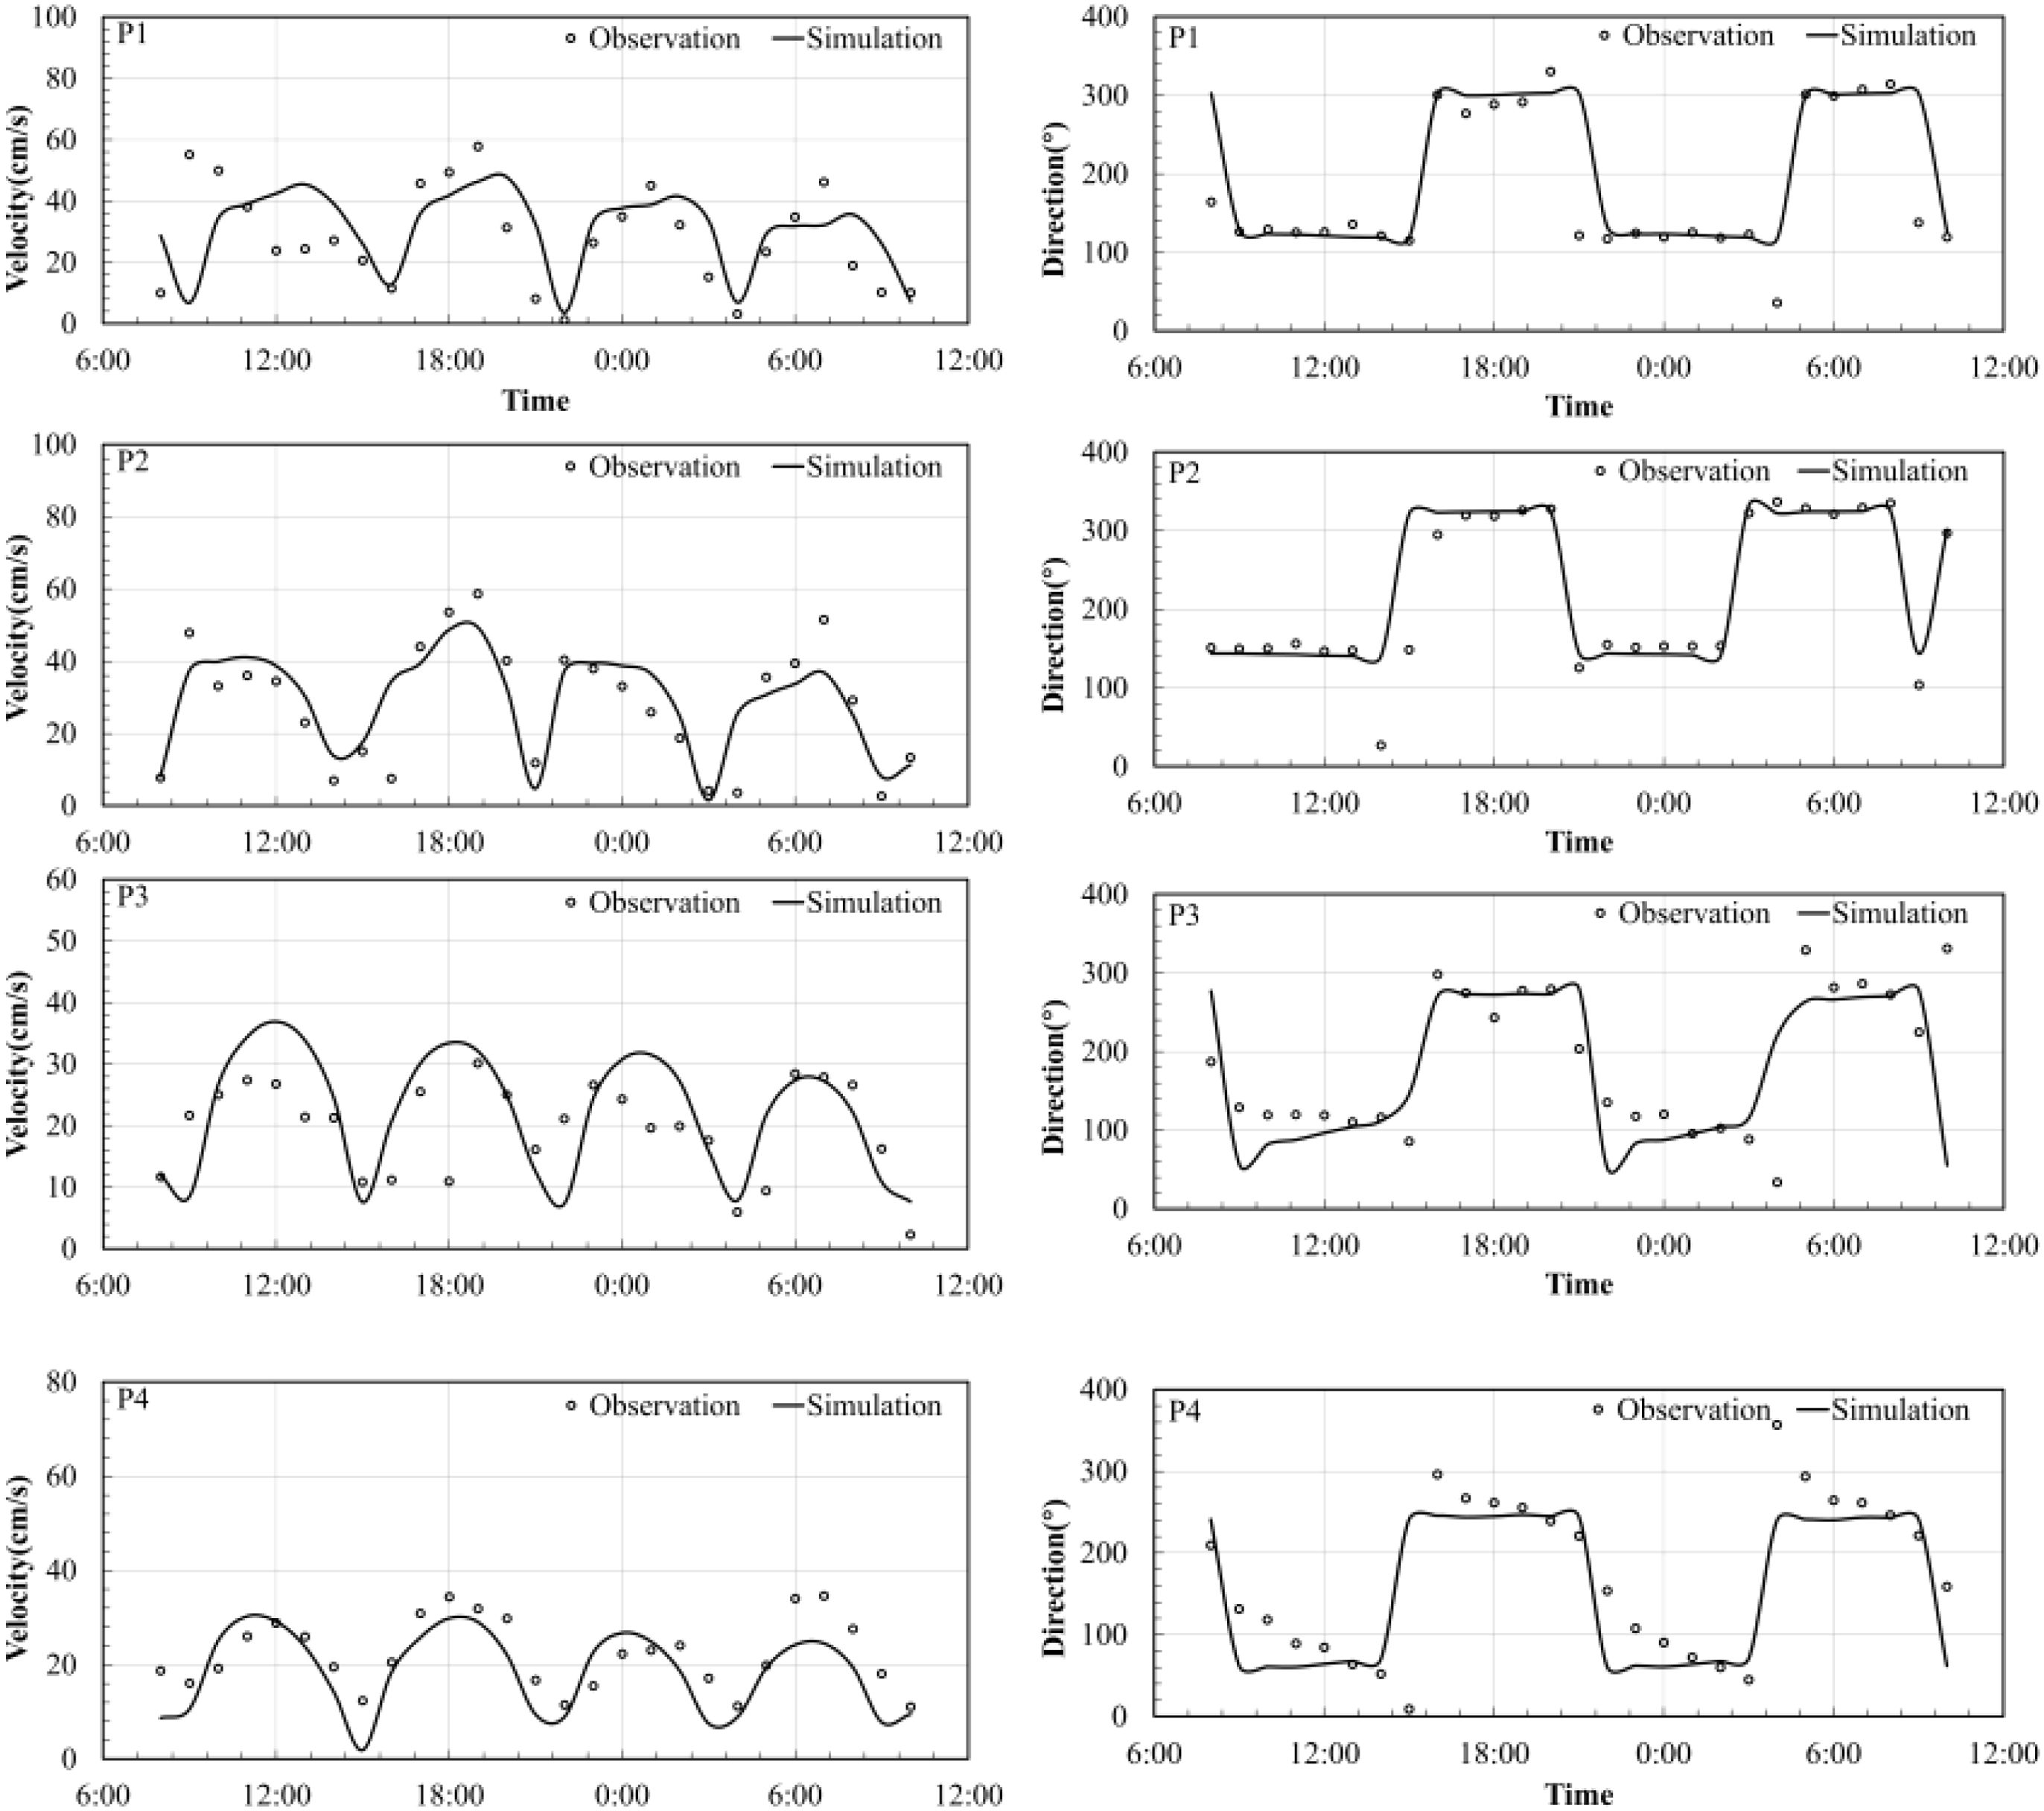
Figure 7. Tidal current verification (The left figure shows the flow velocity verification, and the right figure shows the flow direction verification).
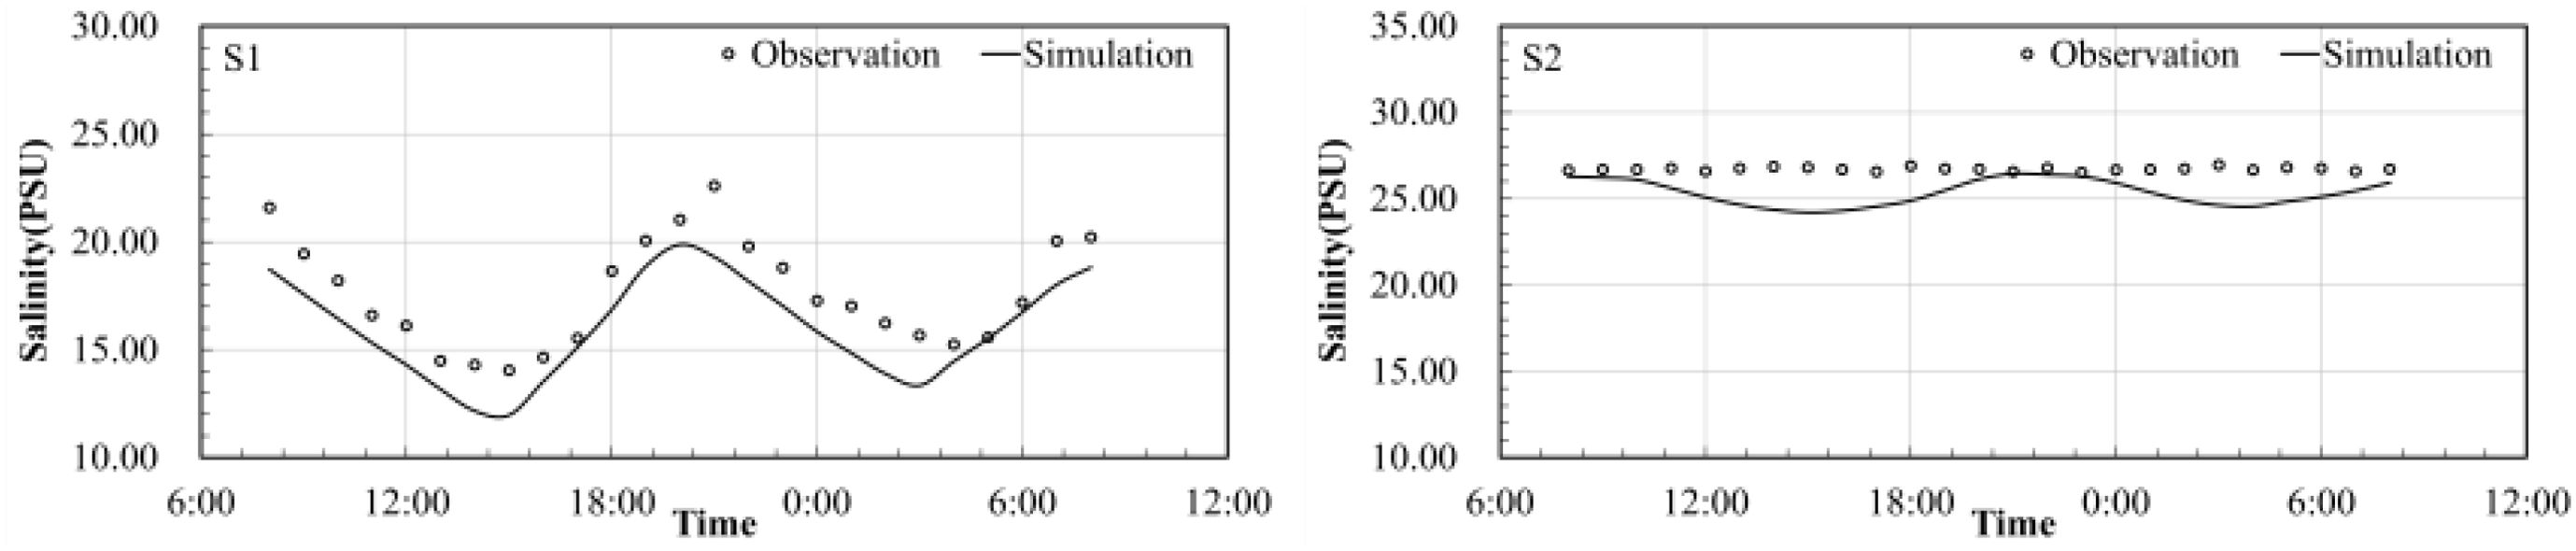
Figure 8. Salinity verification.
3 Results analysis
3.1 Characteristics of flow field changes
Dingzi Bay is a narrow estuarine tidal channel bay with seabed geomorphological pattern of “two channels with a sandbank in between.” Flood tide flows propagate upstream along the eastern side of the main tidal channel, while ebb tide flows move downstream along the western side of the channel (Figure 9). Figure 10 shows a depth average flow speed map of Dingzi Bay. In this area, the highest flow speeds are typically concentrated near the bay mouth and within the internal tidal channels of the bay. Maximum surface flow speed during flood tide is about 75-85 cm/s and during ebb tide, it is about 70-80 cm/s. Ebb tide duration (6 h 25 min) is longer than that of flood tide (5 h 58 min). Flow speeds in other bay areas are relatively lower, with flood tide flows generally stronger and of shorter duration compared to ebb tide flows.
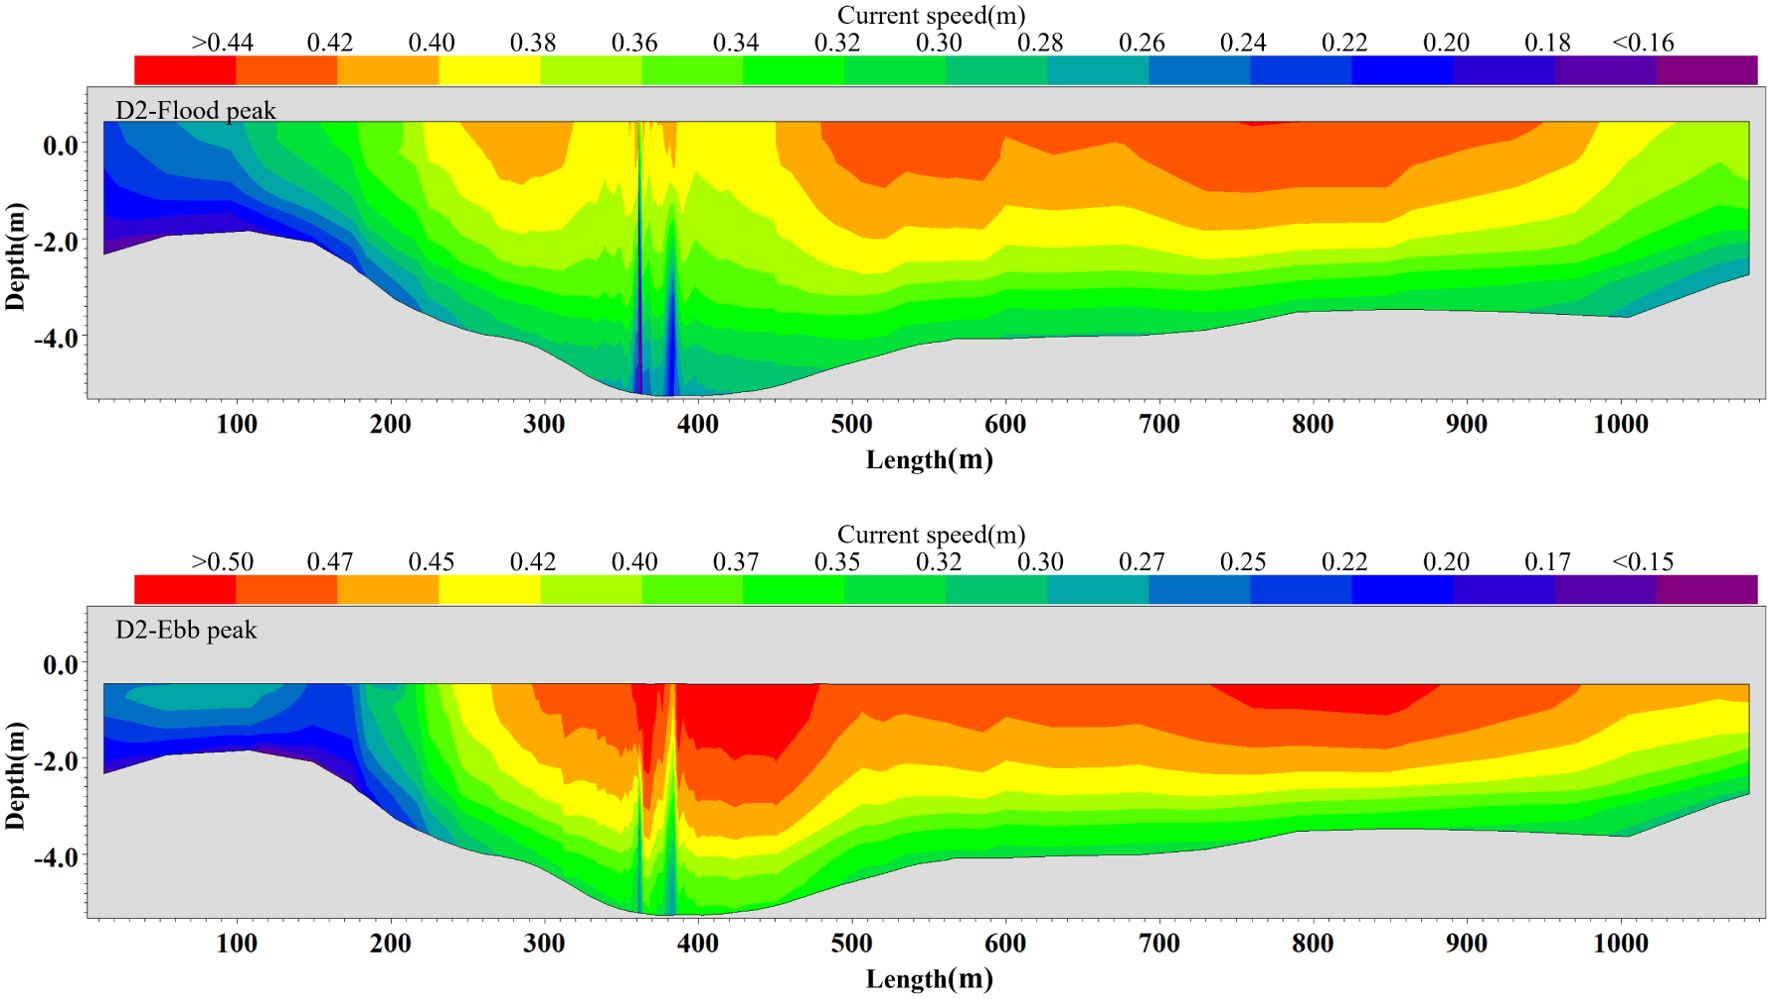
Figure 9. Vertical distributions of the flow velocity along cross-section: MD16.
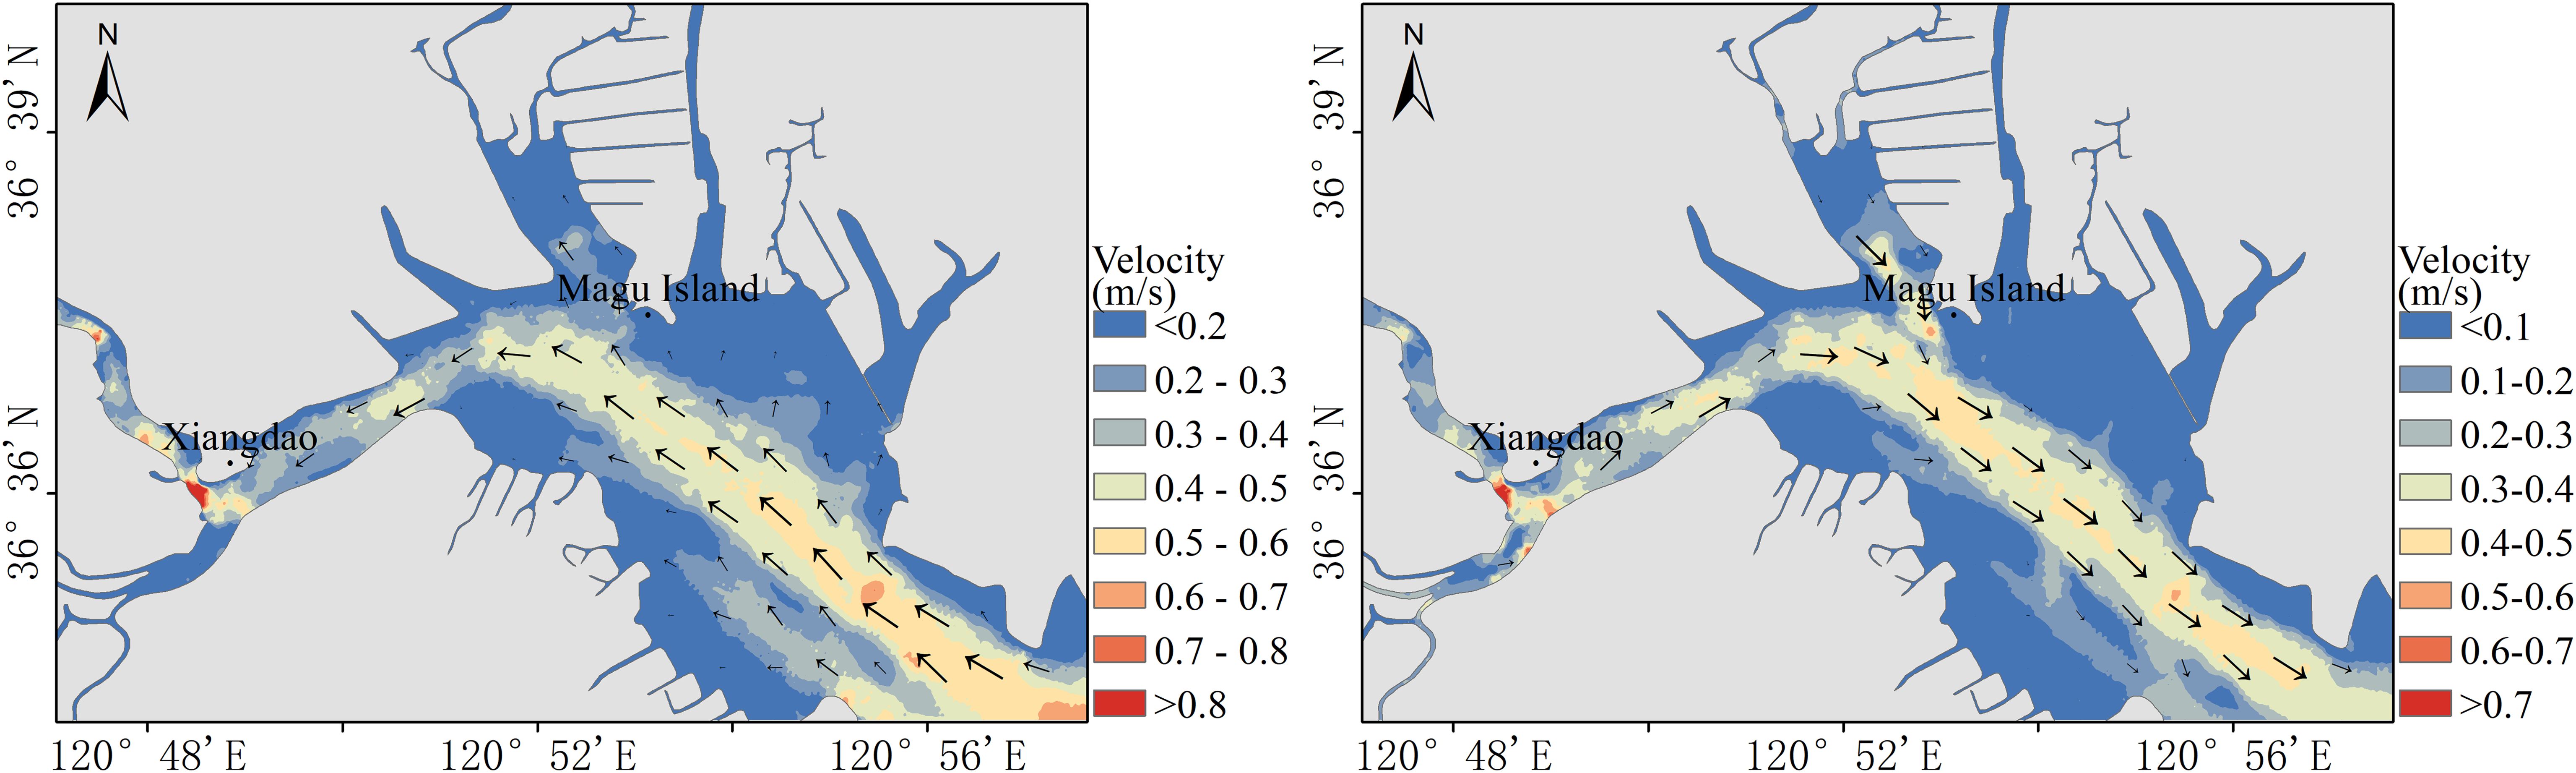
Figure 10. Flow field distribution in Dingzi Bay, (A) flood current field, and (B) ebb current field.
After entering from the open sea through Dingzi Bay mouth, the tidal flow progresses from southeast to northwest, turns west at the west side of Magu Island, and then north past the west side of Xiang Island into narrow Wulong River. Because of the narrowing of the tidal channels upstream, flood tidal currents downstream of Xiang Island are strong, presenting distinct reverse flow properties. On tidal flats on both sides of the channels, flow speeds are relatively lower and flow direction includes components moving towards the shore.
3.2 Distribution characteristics of salinity increase
As shown in Figure 11, high salinity variation zones are primarily concentrated near discharge outlets, which are affected by the tidal channels of Dingzi Bay and dynamic geomorphological conditions near these outlets, giving rise to the formation of a narrow strip extending in NW-SE direction. The magnitude of salinity variation after brine discharge was changed with season, tidal pattern, tidal phase, water layer, and specific location. Numerical simulations on Dingzi Bay indicated that in both winter and autumn, areas within the bay and near the bay mouth experienced varying degrees of salinity increase. By analyzing maximum salinity changes in vertical envelopes, it was observed that in winter, most areas had salinity increase values of less than 3psu, particularly in the narrow regions of tidal channel at discharge outlets where increases exceeded 3psu, the statistics for the area of salinity increase are shown in Table 1. In autumn, increase in most areas did not exceed 2psu, with a large area southwest of the discharge outlet experiencing 2psu increase with no instances exceeding 3psu. Seasonal variations showed that high salinity areas near the discharge outlets were more concentrated in winter, possibly due to stronger tidal effects and hydrodynamics during this season. However, areas with increased salinity in autumn were more dispersed. Although some marine communities can adapt to salinity variation exceeding 3psu, long-term and widespread ecological impacts still require thorough assessment, particularly in winter, where the ecological impacts of high salinity in tidal channel areas should be carefully considered.
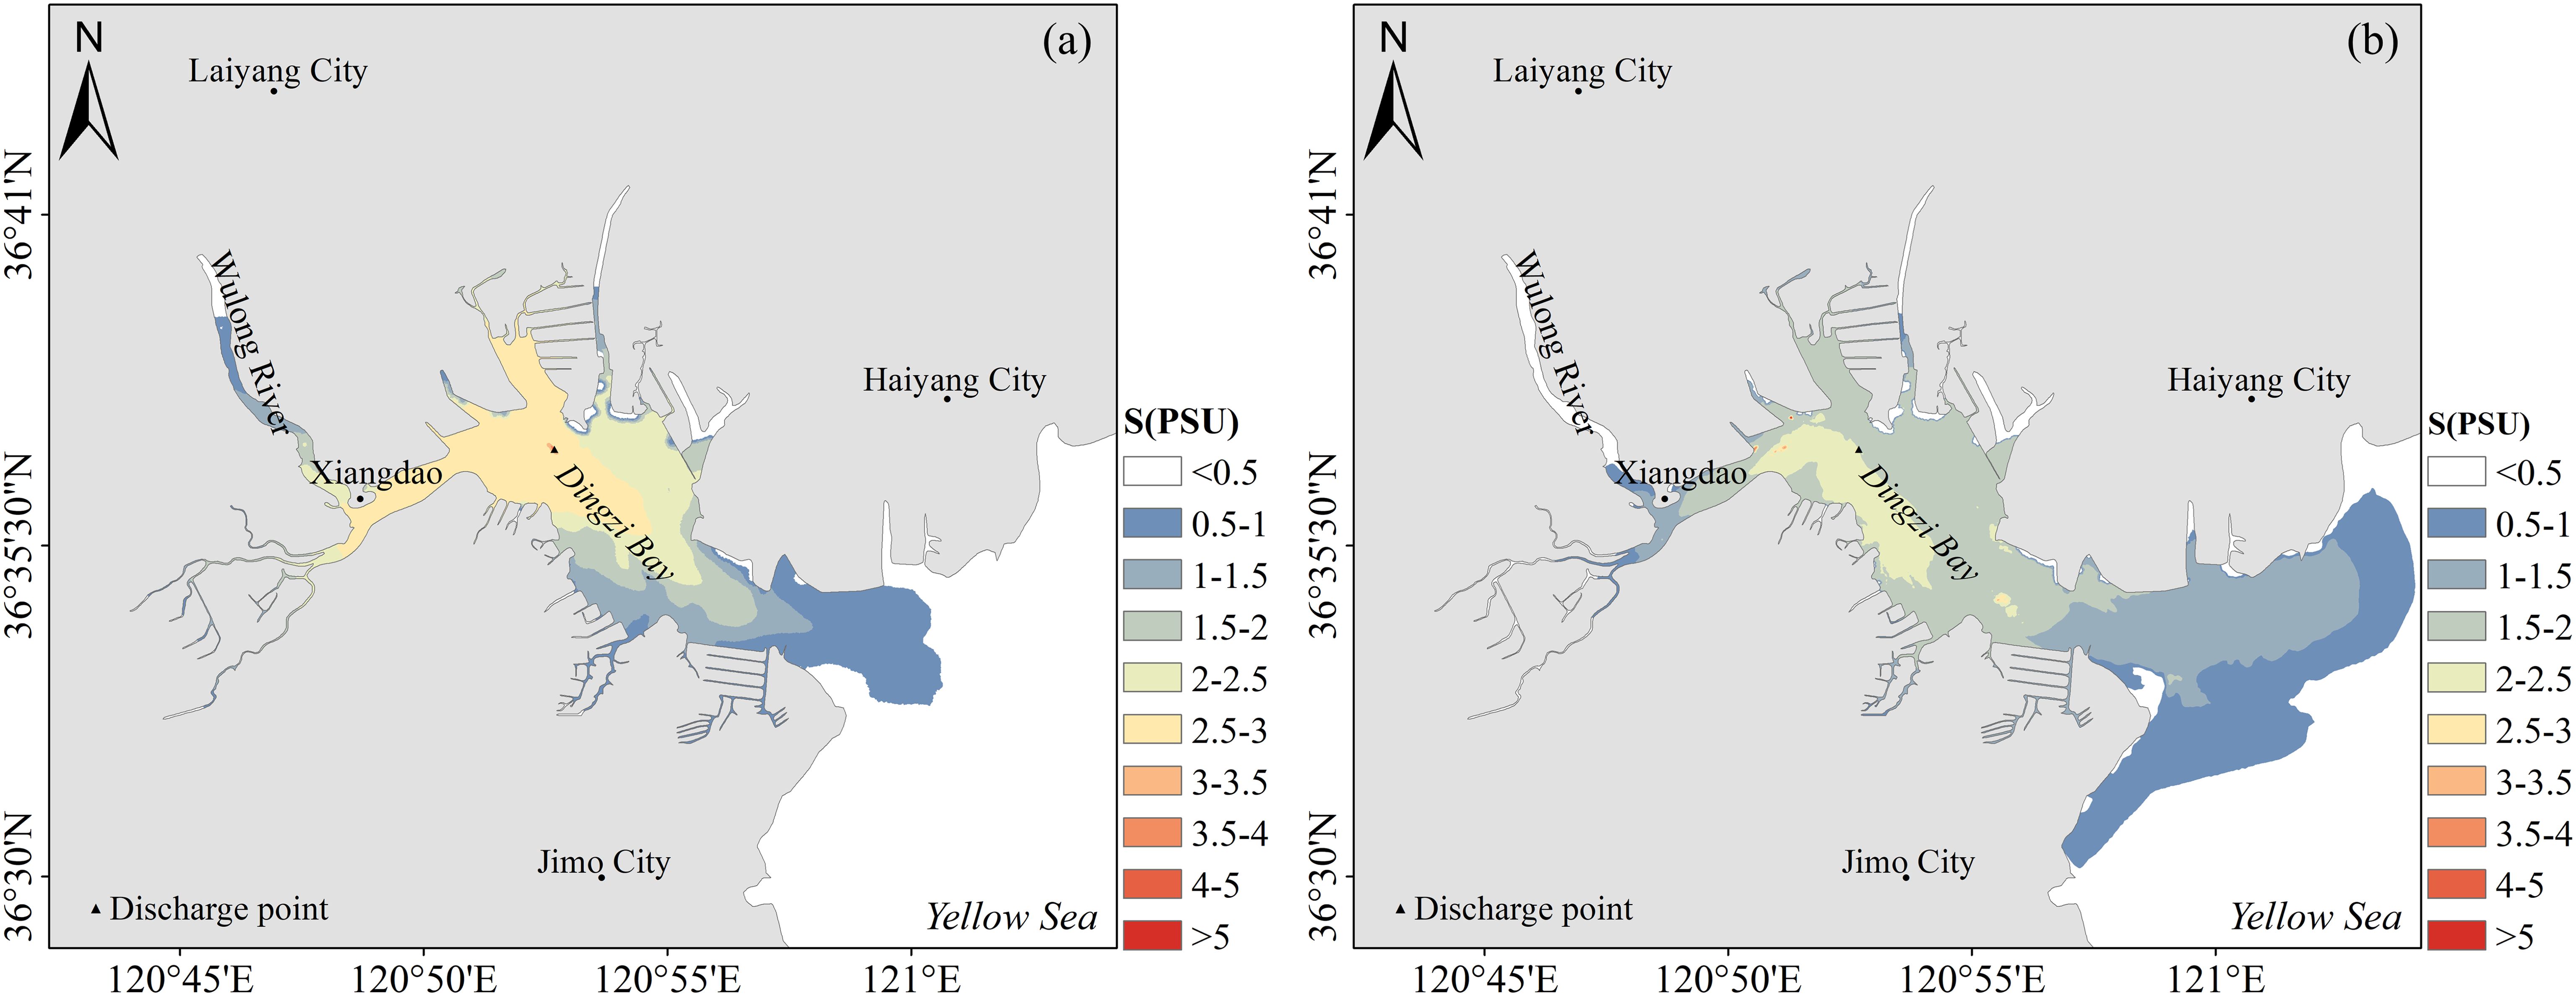
Figure 11. Distribution of salinity increase in Dingzi Bay, (A) winter and (B) autumn.
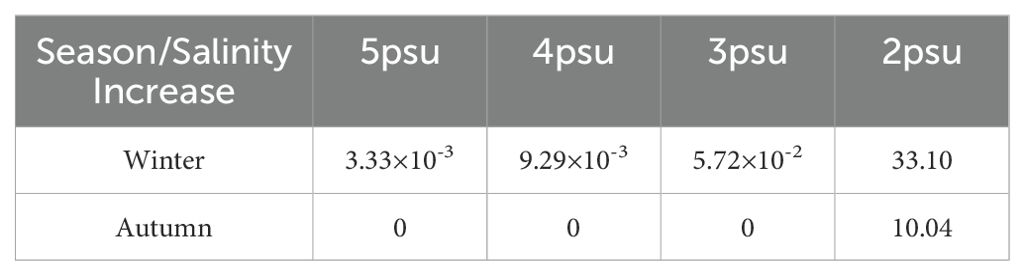
Table 1. Vertical envelop area of salinity increase (km²).
By comparing the distribution maps of increased salinity after freshwater discharge in winter (Figure 12) and autumn (Figure 13), distribution characteristics of high-concentration saline water under the effect of Wulong River runoff and tidal action were further investigated. Salinity increase distributions during the four typical tidal phases of flood rapid, flood slack, ebb rapid, and ebb slack in winter and autumn were evaluated. The areas affected by salinity increases were significantly changed with tides, especially in regions where salinity was increased by more than 2psu. During flood rapid, areas with salinity increase of more than 2psu were located at the bend of tidal channel near the discharge outlet, which roughly corresponded to the central marine area of the bay. During flood slack, they were located in the tidal channel near the discharge outlet and at bay top. During ebb rapid, they were upstream of discharge outlet in the tidal channel and at bay top while during ebb slack, they were near tidal channel close to discharge outlet.
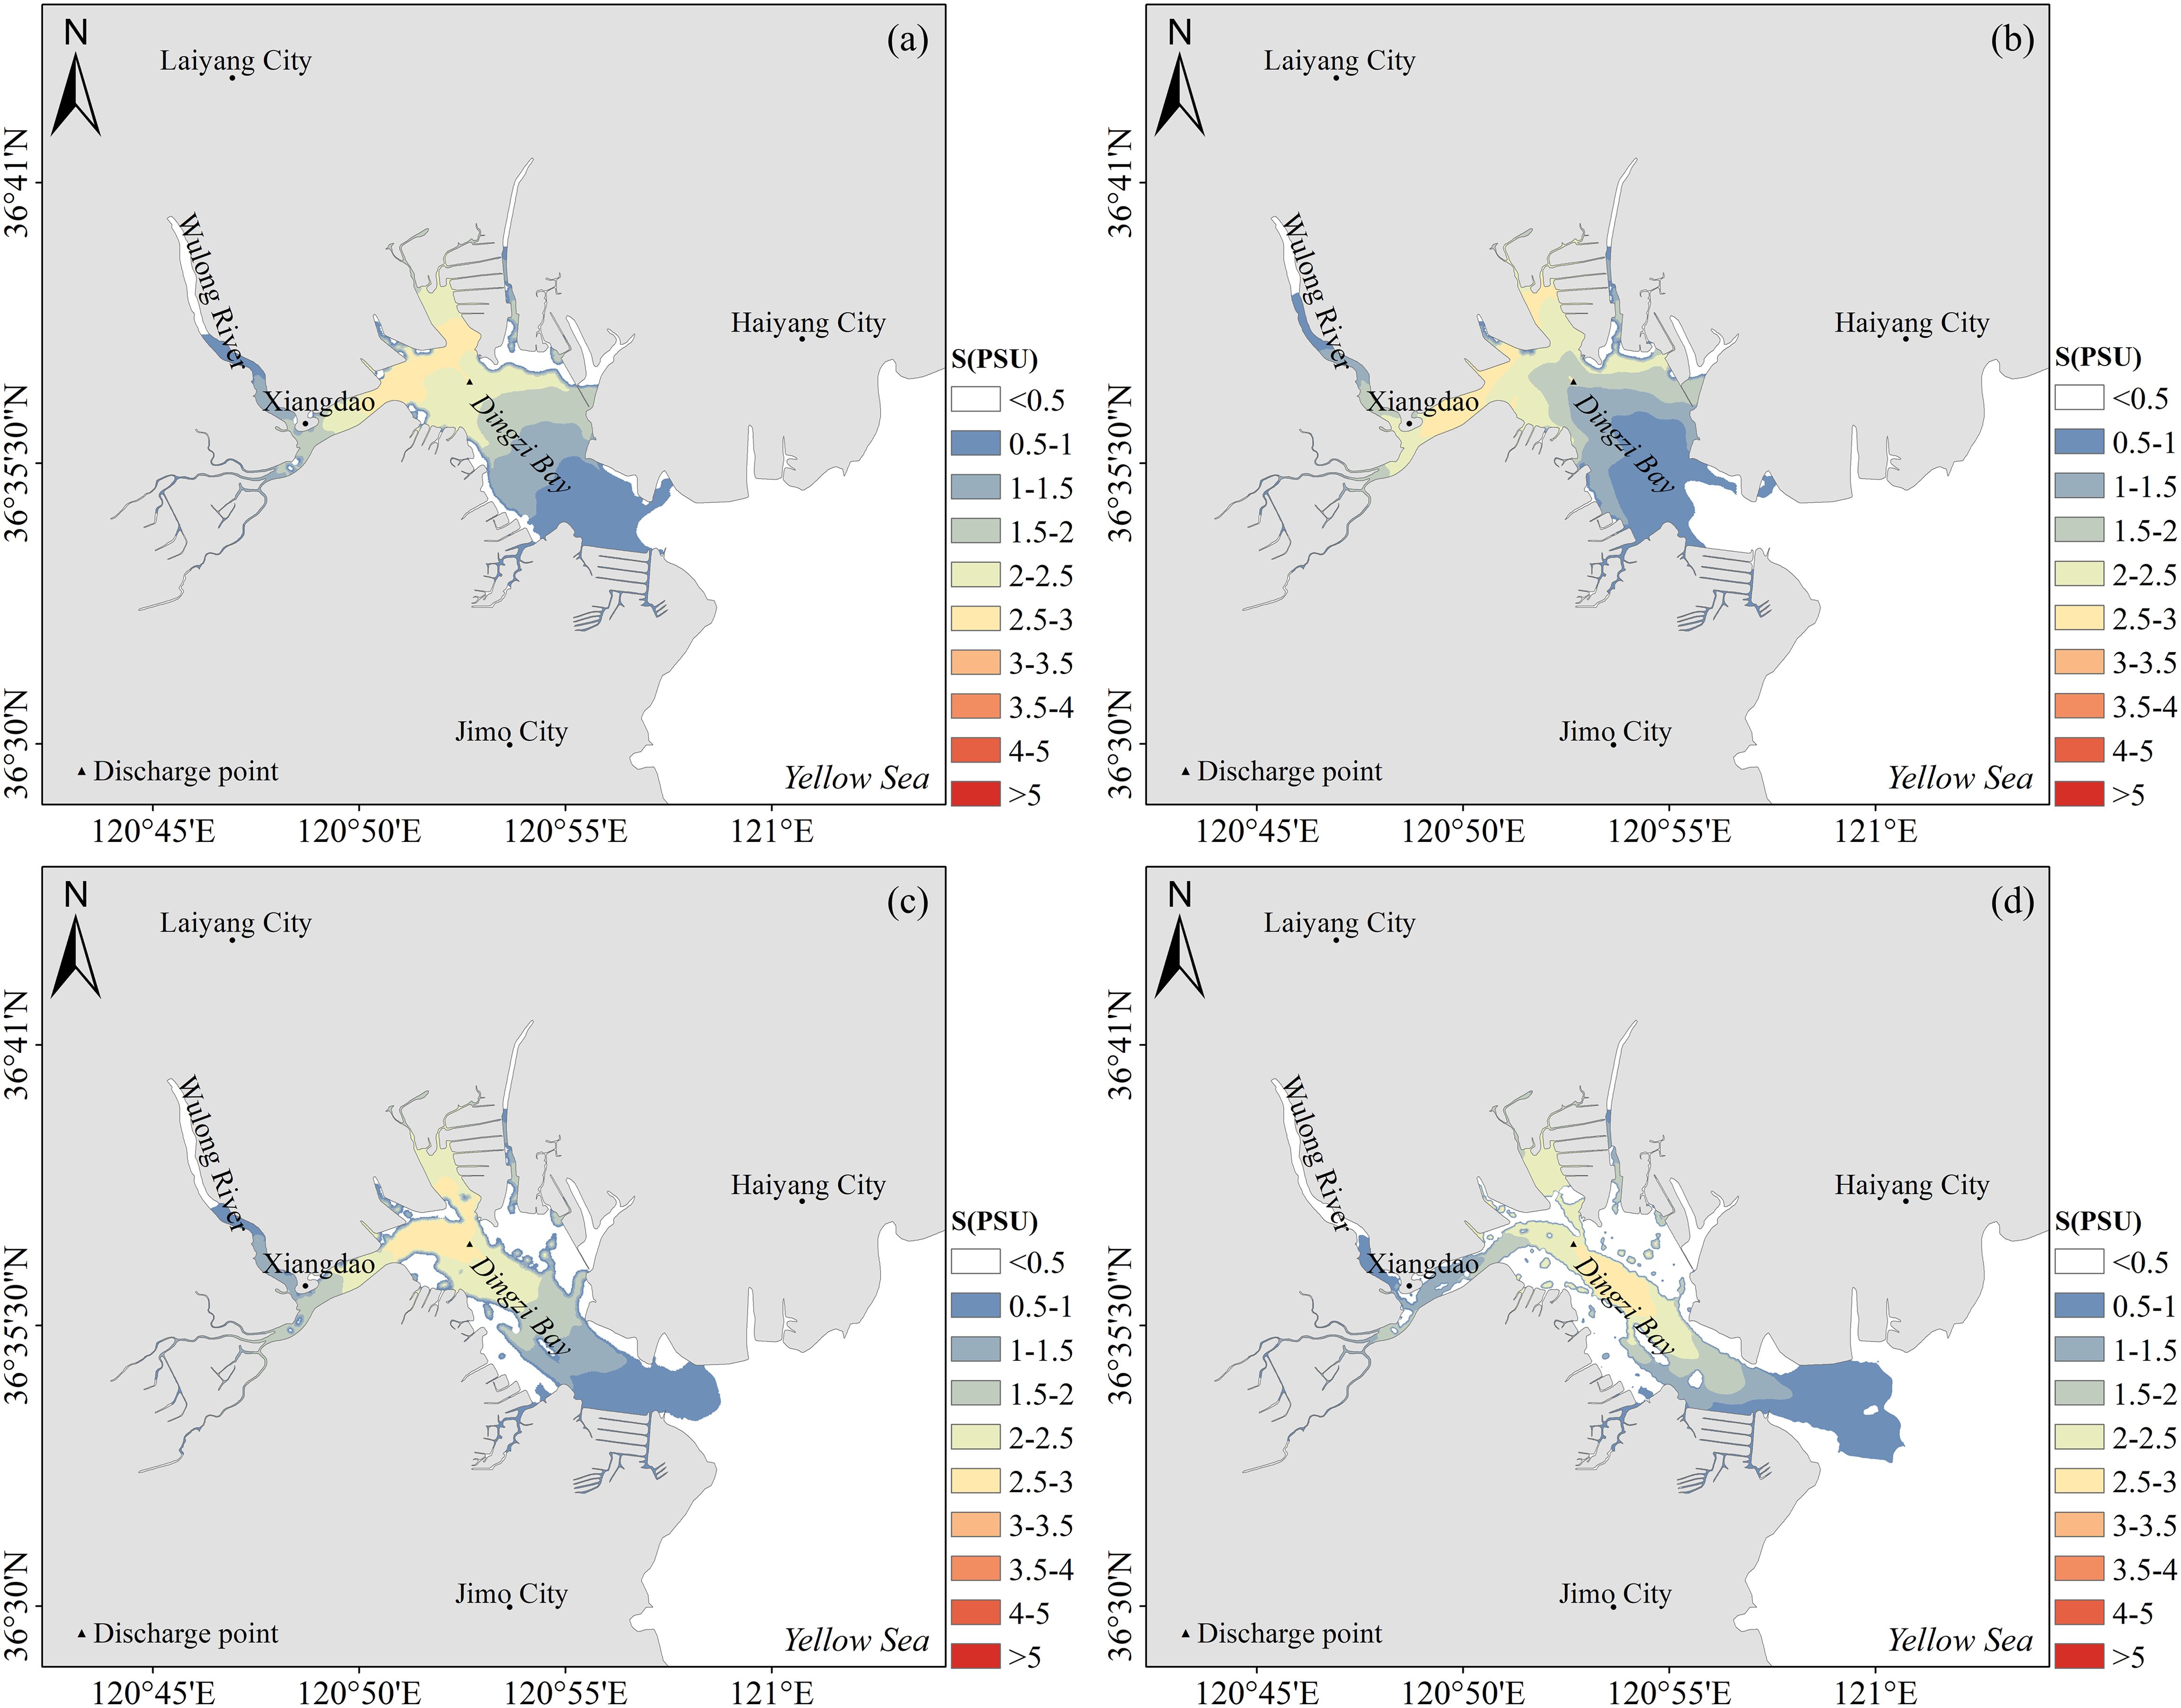
Figure 12. Typical tidal salinity increase distribution in Dingzi Bay during winter, (A) flood peak, (B) high tide slack, (C) ebb peak, and (D) low tide slack.
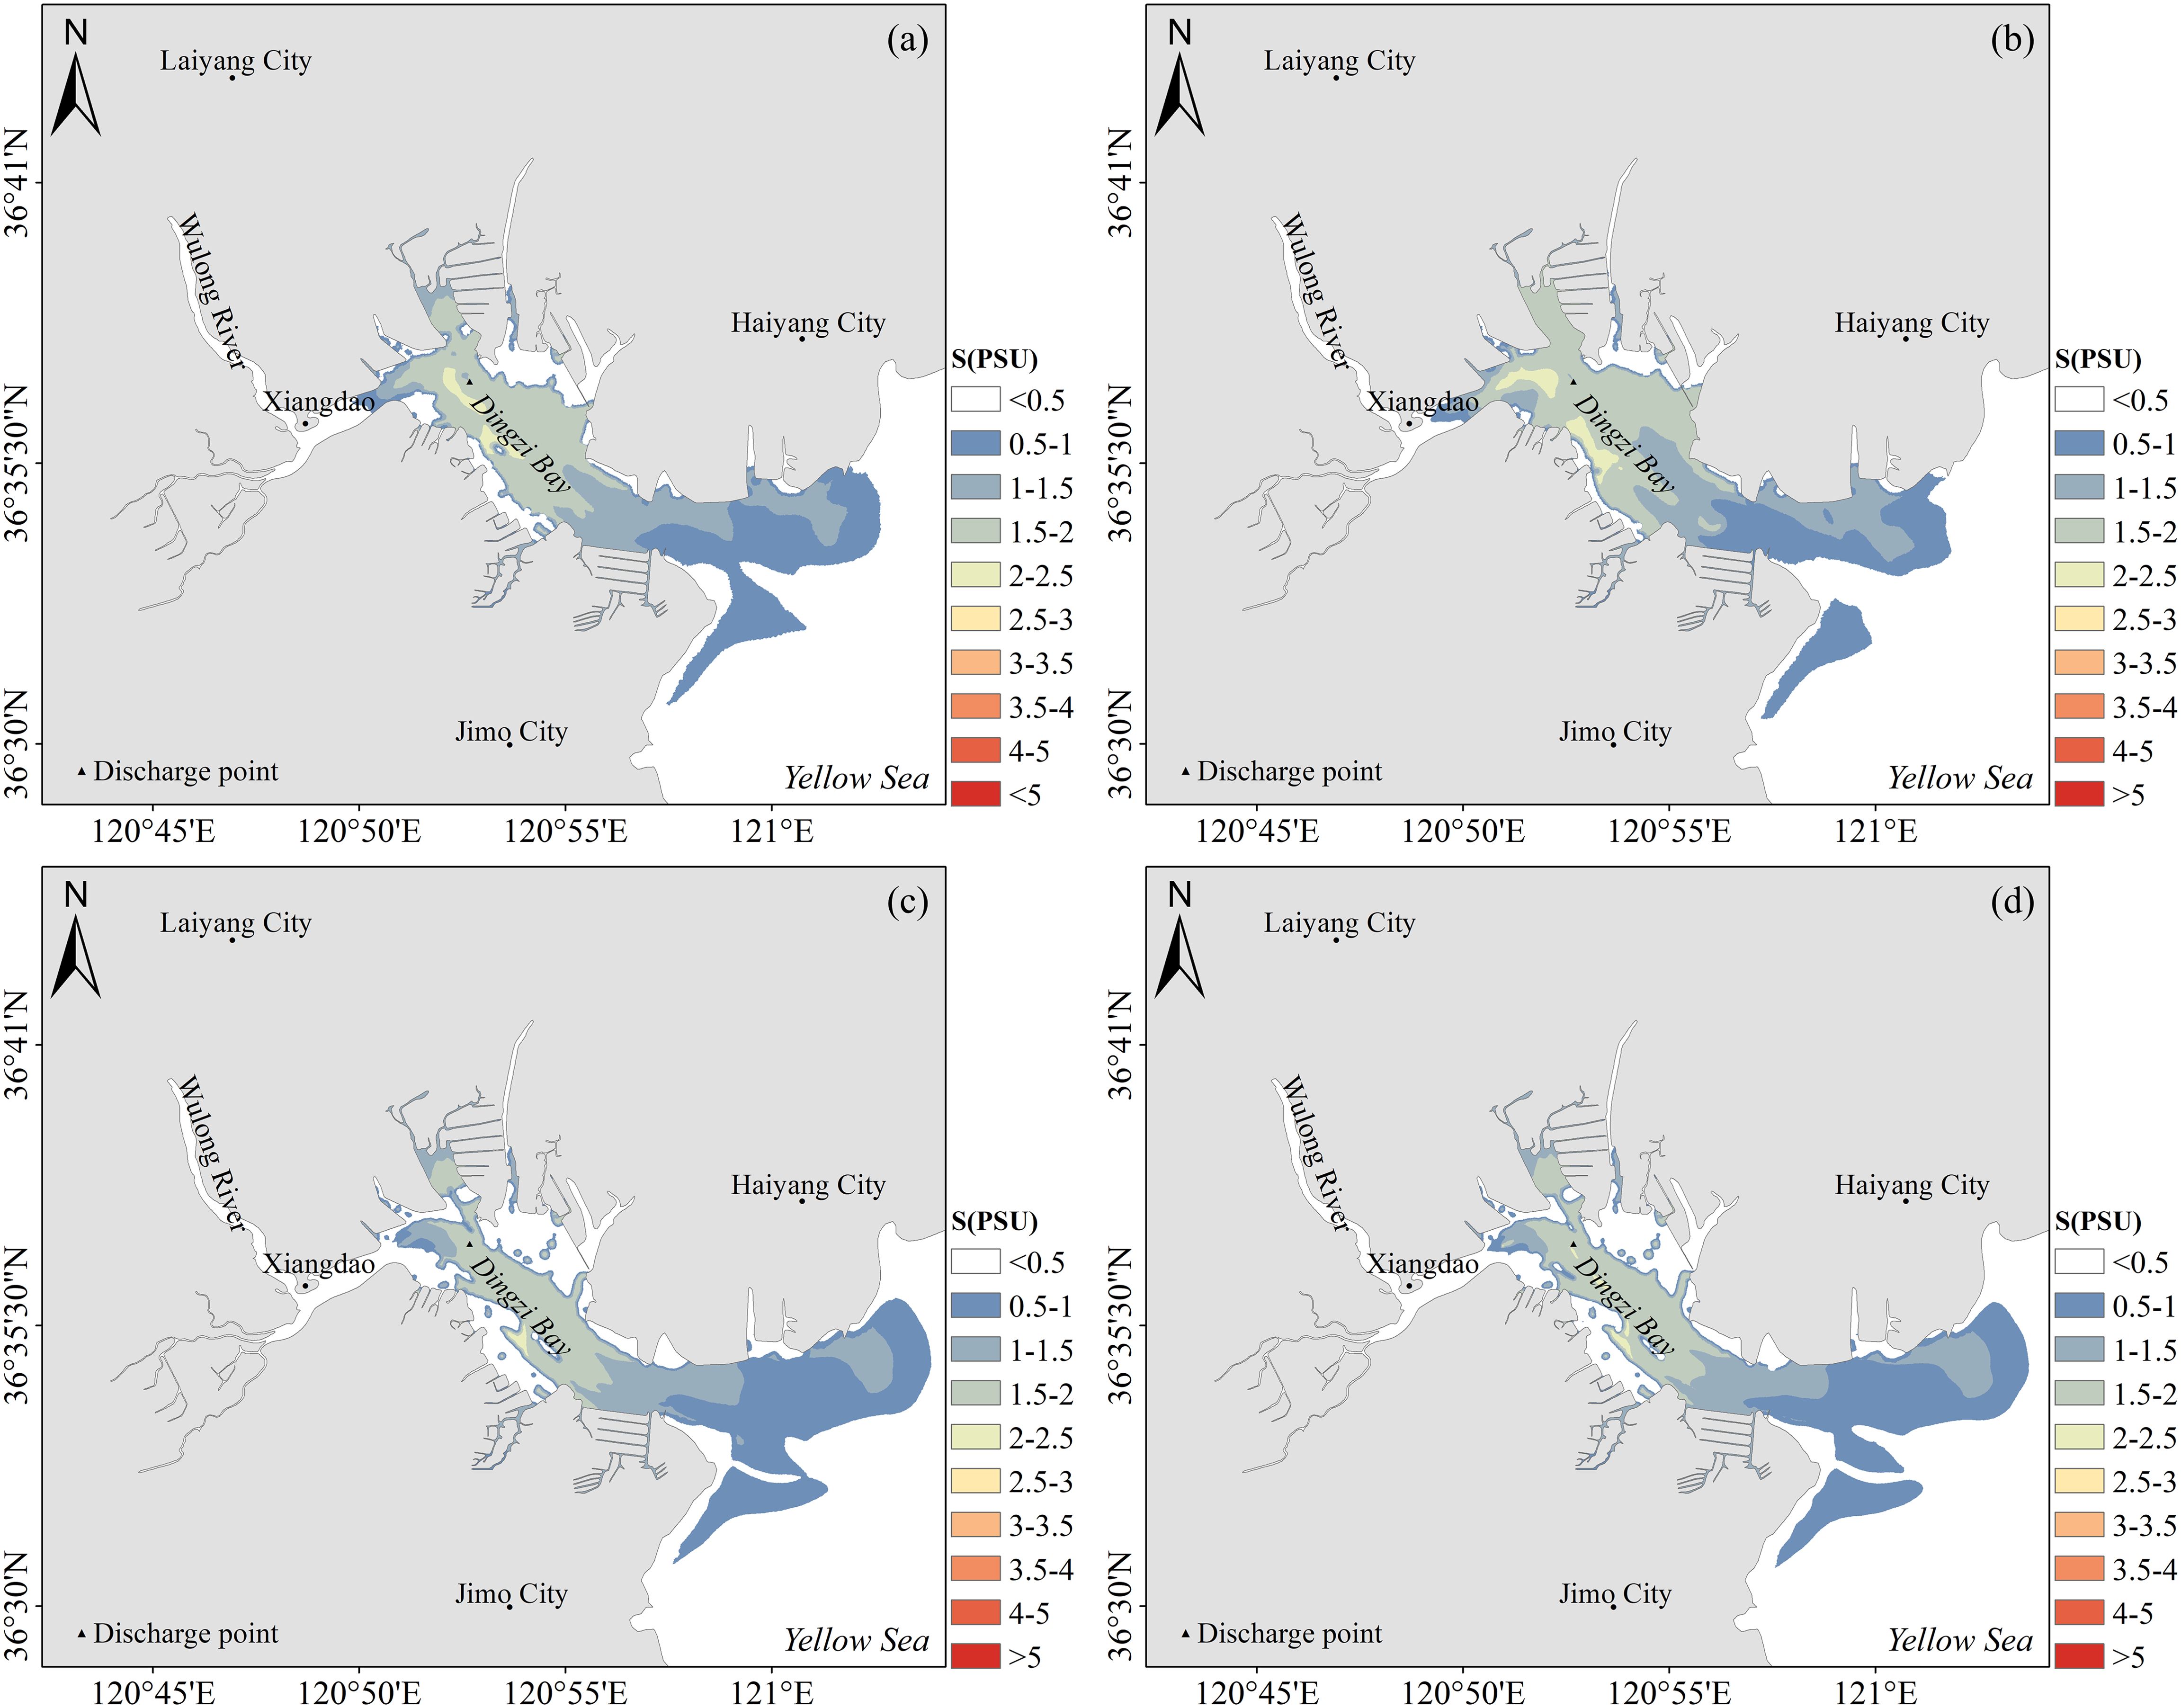
Figure 13. Typical tidal salinity increase distribution in Dingzi Bay during autumn, (A) flood peak, (B) high tide slack, (C) ebb peak, and (D) low tide slack.
3.3 Temporal changes of salinity
Statistical analysis of cumulative durations for salinity increases of over 2psu and 3psu in winter and that over 2psu in autumn showed the temporal patterns of salinity changes (Figures 14, 15). In winter, most areas with salinity increase of 2psu had cumulative duration of less than 150 h, but within 300 m range from discharge outlet, there were areas where cumulative duration exceeded 180 h. Areas with salinity increases of over 3psu and cumulative durations exceeding 60 h were mainly concentrated near the discharge outlet. Areas with 3psu increase in salinity lasting over 30 h were almost entirely within 200 m of the discharge outlet, while most areas had cumulative durations of less than 120 h, with only the area around the discharge outlet presenting durations exceeding 120 h. In autumn, due to higher Wulong River runoff and the effect of water dilution due to runoff, no high-concentration salinity increase areas occurred and overall salinity increases within the bay were lower. Areas with salinity increases of over 2psu and cumulative durations exceeding 30 h showed elliptical spatial distributions, primarily around the discharge outlet. Most areas with over 2psu increase in autumn had cumulative durations of less than 30 h, with those exceeding 30 h mainly concentrating within tidal channels. In summary, regardless of the season, the areas near the discharge outlets were key regions for the accumulation of increased salinity durations. Especially in winter, due to decreased runoff, areas with prolonged salinity increases might have more significant impacts on marine communities. In contrast, salinity increases in autumn were more gradual with fewer long-duration areas, mainly distributed in tidal channels with stronger water dynamics.
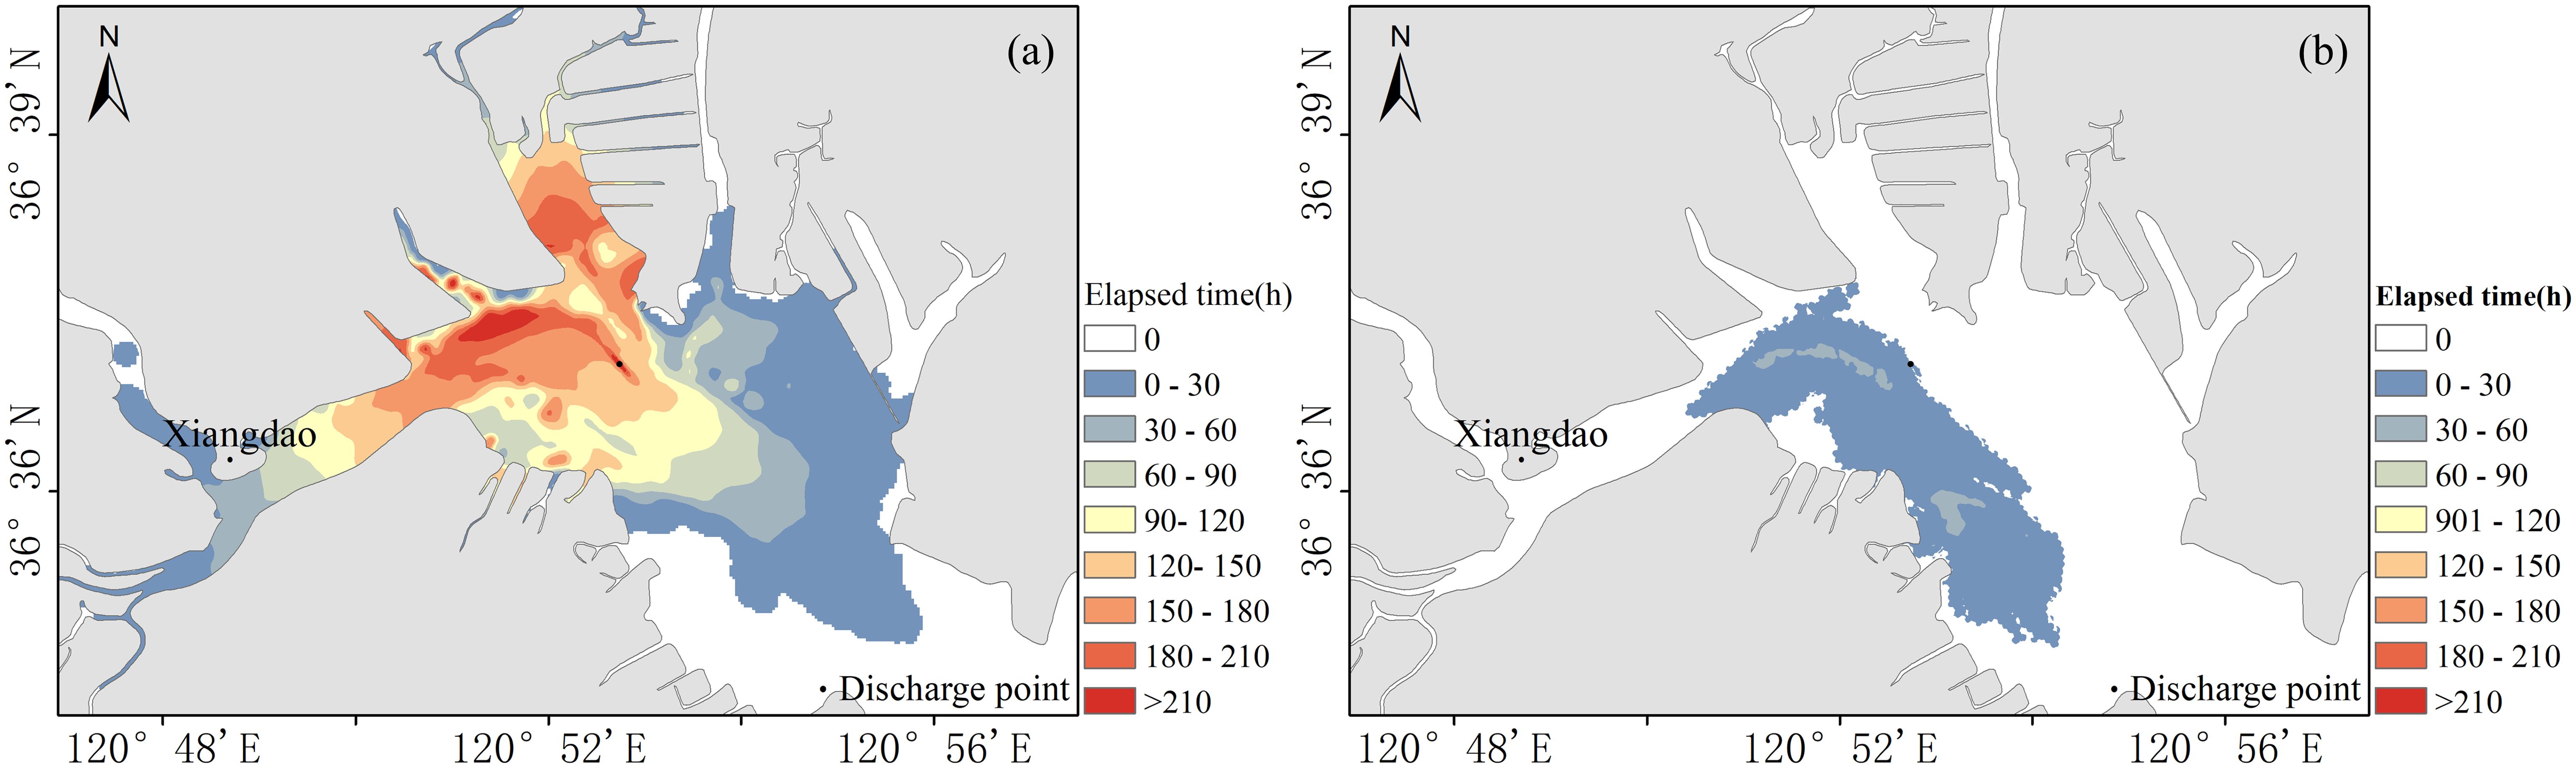
Figure 14. Duration of salinity increase of greater than 2% in Dingzi Bay, (A) winter and (B) autumn.
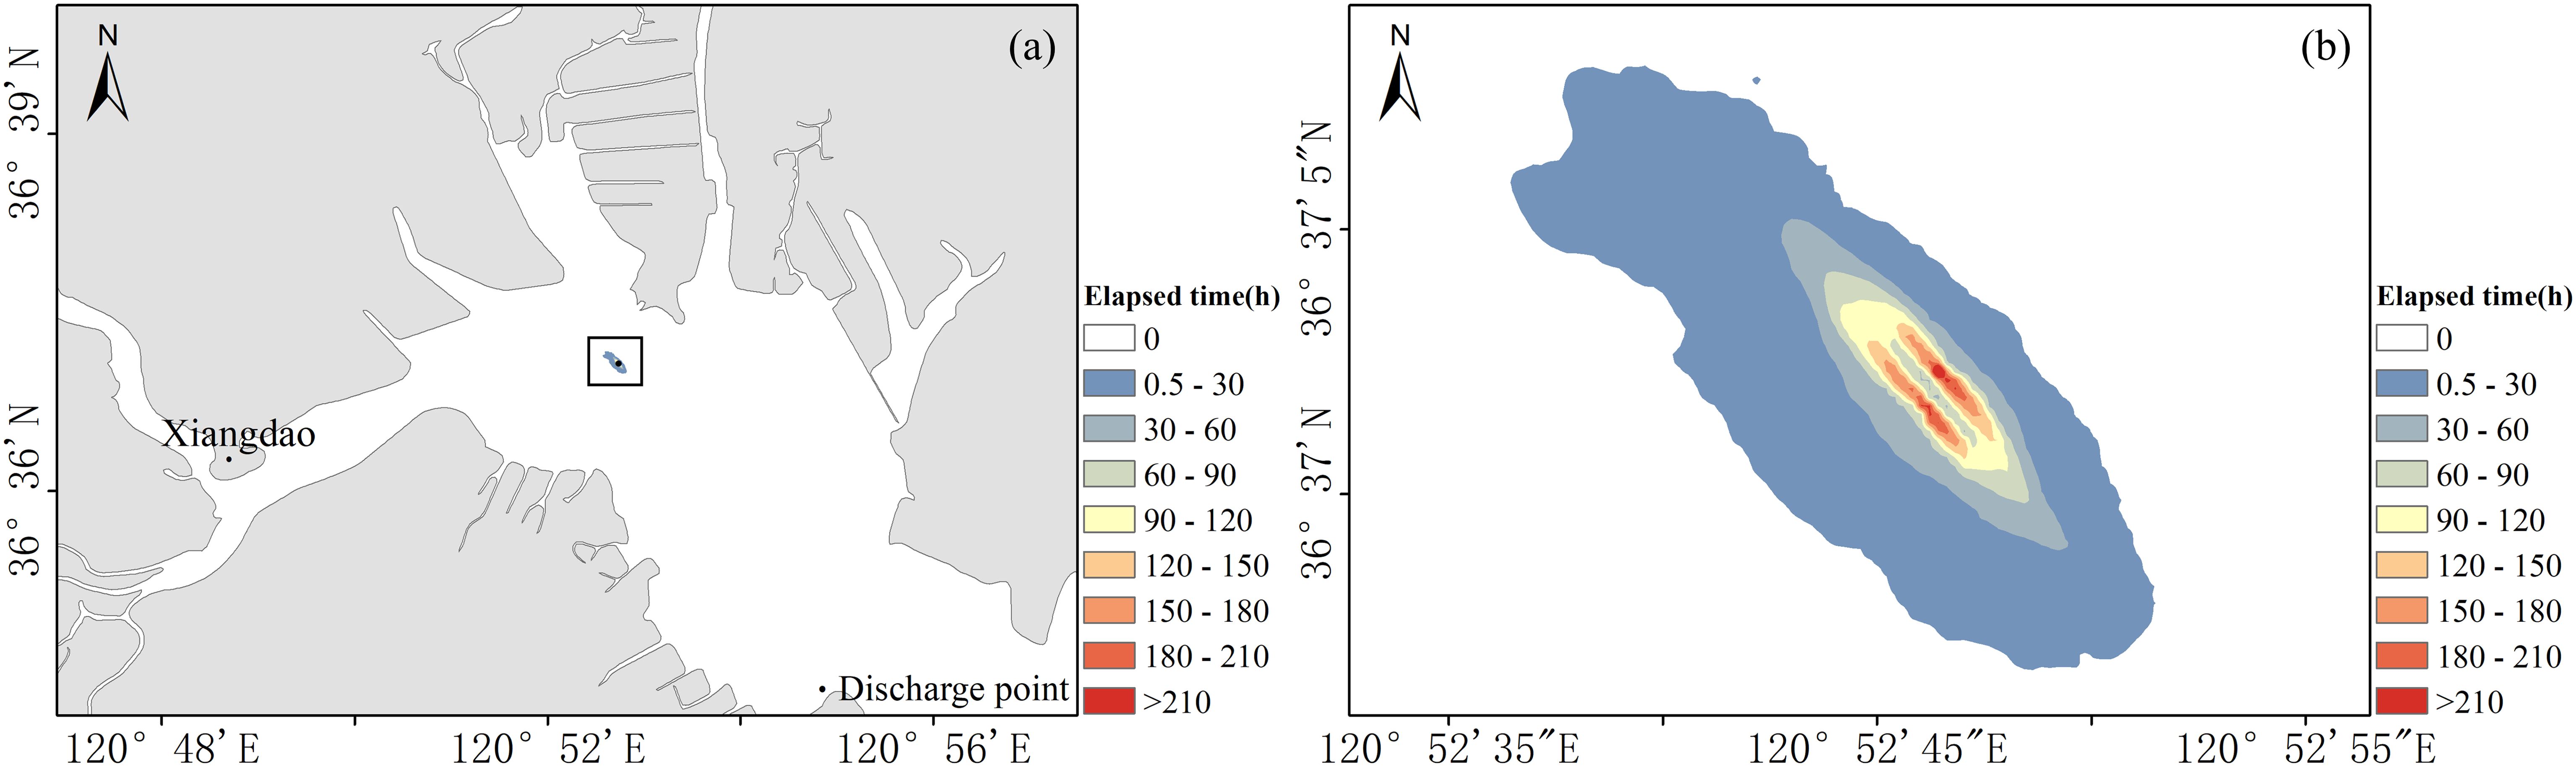
Figure 15. Duration map of salinity increase of greater than 3% in Dingzi Bay during winter.
4 Discussion
4.1 Impact of depth and flow speed changes on salinity increase
Figure 16 illustrates the cross-section (Figure 5) of depth -tide-salinity increase relationship. The figure revealed that flow speeds at surface exceeded those at mid-depths and bottom layers. Under the effect of topography, in 0-500 m depth range, due to deeper water and gentle slope, the flow was slow and steady. In 500-1000 m depth range, where the topography was more variable and water was shallower, flow speed was increased. Near discharge outlet at 1000 m depth, flow speeds were smooth but fluctuated significantly near the outlet due to discharged water and density currents. Furthermore, as the terrain flattens and water body widens, flow speeds were gradually stabilized. The vertical distribution of salinity increase was similar to those found by Tsiourtis (2001), who investigated the impacts of brine discharge from desalination plants near Garin Islands. The results revealed that while brine dispersed well at surface layer, its higher density caused it to accumulate in deep water sections, resulting in the formation of high-salinity zones, which in this research were also affected by the terrain near discharge outlets. Research has shown that since natural seawater salinity could fluctuate by ±10psu of the average annual salinity of the area, marine organisms had natural adaptability to these fluctuations. A 10psu increase in seawater salinity could be applied as a conservative estimate of the tolerance of marine organisms to salinity increase (Gao and Ruan, 2004). Monitoring results of brine discharge into the sea indicated that most marine communities could tolerate salinity increases of 2-3psu, some even up to 10psu; therefore, a 2-3psu increase had no impact on the ecosystem (Jenkins et al., 2012). Therefore, we identified areas with 3psu increase as high-concentration salinity zones. The dispersion of high-concentration saline water was found to mainly occur near incoming tide peak moments, indicating a close relationship between brine dispersion and flow speed. At low speeds, high-density brine gathered together under the effect of density gradients, dispersing to other areas near the discharge outlet when flow speed was increased. During ebb tide, the area affected by high-concentration saline water was smaller because, as the tide fell, freshwater from Wulong River diluted the water near the intake, decreasing the salinity of the brine discharged from the outlet and preventing the formation of large high-salinity zones near the outlet.
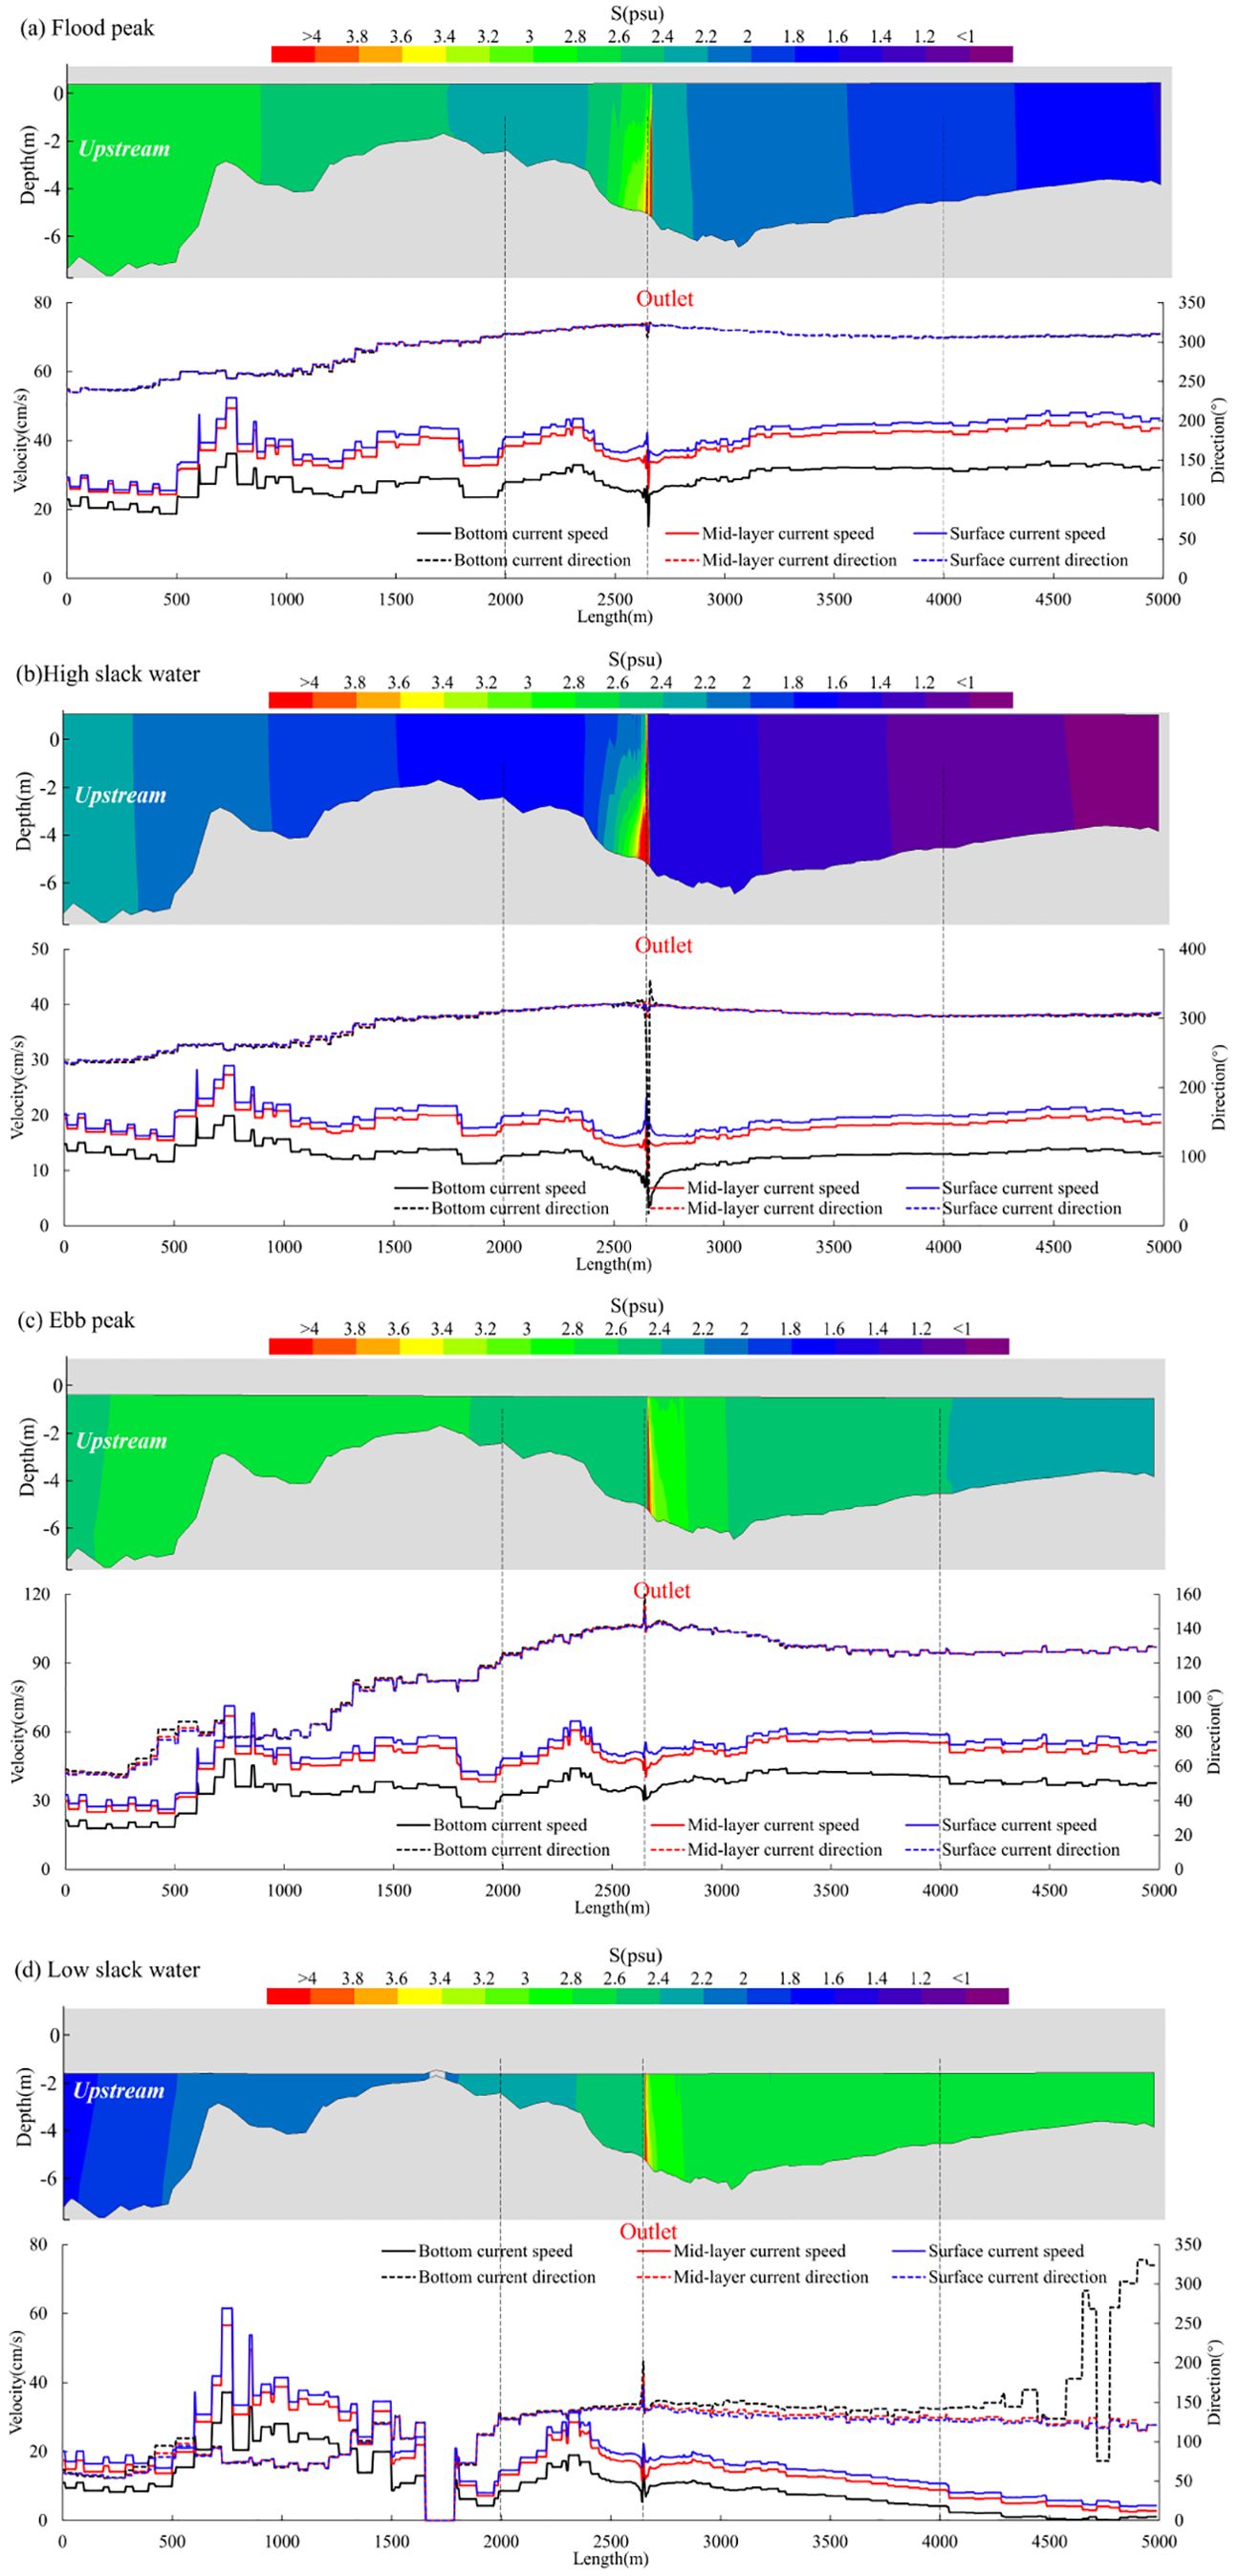
Figure 16. (A-D) Flow speed-salinity increase-topography cross-section diagram.
After brine discharge, it rapidly diffused. To investigate salinity diffusion after brine discharge, a statistical analysis was performed on the attenuation process of salinity increases along four directions (E, W, S and N) within a 500 m range from the discharge point during winter (Figure 17). Following discharge, there was a rapid attenuation of salinity within a 50-100 m range near the discharge outlet, with attenuation rates reaching 42-59% within 100 m along all four directions, with maximum attenuation rate being 0.03799 psu/m (Table 2). Within 100-500 m range, the attenuation of salinity increases was more gradual, due to the brine being sufficiently diluted and oscillating within the bay under tidal effects.
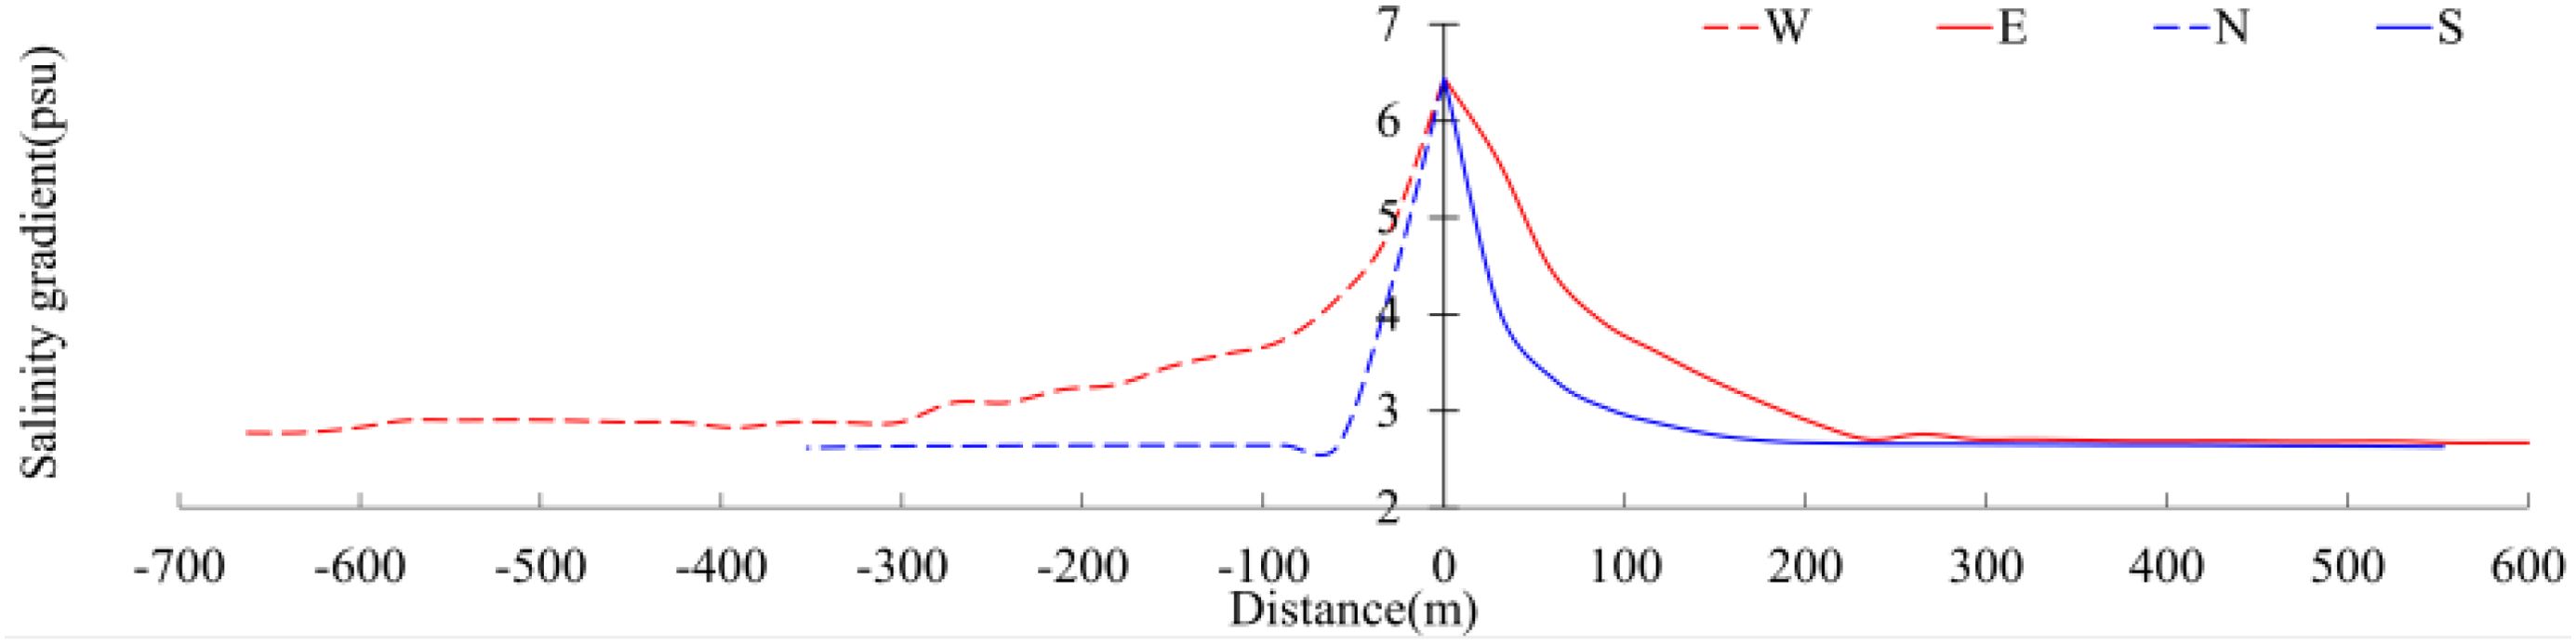
Figure 17. Salinity increase attenuation process near discharge outlet.
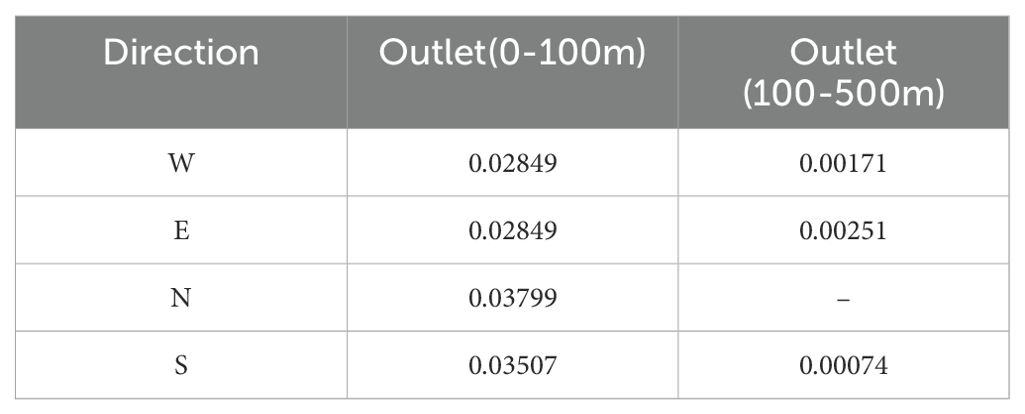
Table 2. Attenuation coefficient of salinity increase near the discharge outlet (psu/m) direction (S).
Field simulation results were generally consistent with the findings of most previous researchers (Aljohani et al., 2022), indicating that brine discharge led to significant increases in local salinity, which could potentially impact marine communities (Flavin et al., 2023). This research showed that the amount of salinity changes was related to other factors such as runoff and tides. Under the effect of tidal dynamics, the diffusion characteristics and impact ranges of brine varied between winter and autumn; therefore, when planning and managing brine discharge into the sea, it was necessary to consider the effect mechanisms of these natural conditions on discharge to adopt more effective management strategies to minimize environmental impacts.
4.2 Impact of runoff and tidal volume on salinity increase
The water in estuarine bays is supplied by rivers and the open sea and salinity variations are jointly affected by runoff and tidal flows. Due to the offsetting effects of tidal actions, the effect of tides on salt intrusion was not significant (Uncles and Stephens, 2011). He et al. (2018) analyzed historical data and numerical simulation results and found that an increase in runoff decreased salinity in estuarine areas. When freshwater flow was increased, more freshwater entered the estuary, diluting saline water and thus reducing salinity. By integrating observed data and numerical model results, Chang et al. (2024) found that with the increase of runoff, mixing of salinity intensified, leading to a significant decrease in salinity in estuary areas. In Dingzi Bay, there was a significant seasonal variation in runoff. With high runoff in autumn, salinity within the bay was decreased, resulting in a lower degree of salinity increase from brine discharge into the sea during autumn compared to winter.
Saltwater intrusion is a common phenomenon in estuarine areas (Liu et al., 2011; Jiang et al., 2024), with river runoff being the main factor affecting saltwater intrusion changes (Tian, 2019). In this research, due to internal water extraction and drainage within the bay, where extraction volume exceeded drainage volume, concentrated brine discharge decreased total water volume inside the bay, thereby increasing tidal volume within the bay and intensifying saltwater intrusion. Seawater entered freshwater areas through tidal forces and since seawater salinity outside the bay far exceeded that of freshwater, this led to significant variations in the salinity and its spatial-temporal distribution in Dingzi Bay and nearby maritime areas. The average salinity of seawater outside the bay was 28psu in winter and 27psu in autumn. Reductions of freshwater volume within the bay due to neap tides in winter and autumn were 5132160 and 7039872 m³, respectively. Based on these figures, the areas where salinity was increased by more than 0.1psu (0.1psu salinity increase zones) and salinity changes due to additional seawater intrusion within the bay were determined (Table 3).
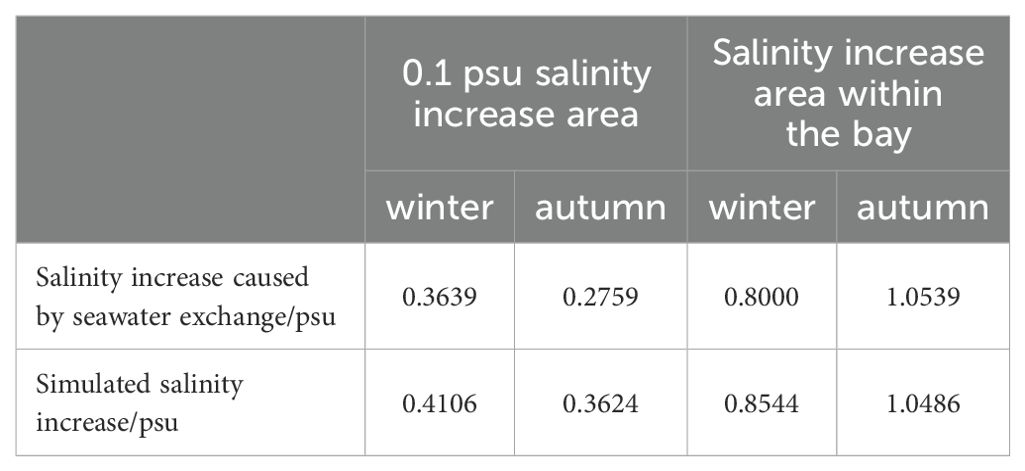
Table 3. Average salinity increase due to salt intrusion(psu).
Additional seawater intrusion resulted in average salinity increases of 0.36psu in winter and 0.28psu in autumn for 0.1psu salinity increase zones during neap tides. Average increases in bay salinity due to additional seawater intrusion during neap tides were 0.80psu in winter and 1.05psu in autumn. Therefore, brine extraction and discharge did not alter the total amount of salt in the original seawater of the bay and only reduced the amount of freshwater within the bay resulting in the addition of higher-salinity seawater from outside the bay, thus increasing total salinity within the bay. Redistribution of original salt due to concentrated brine discharge only had a certain impact on the existing salinity distribution patterns and their dynamics within the bay.
Paparella et al. (2022) showed that the Arabian Gulf was a natural extreme marine system where marine organisms had adapted to high and variable natural salinity. Minor salinity changes due to concentrated brine discharge from desalination plants did not impact the marine environment of the gulf. Even under most dire climate predictions, increase of seawater salinity and tendency toward more desalination over the coming decades are likely to have minimal impacts on gulf salinity. Furthermore, an increase in salinity could lead to greater flow through the Strait of Hormuz, thereby accelerating the renewal of water in the gulf. This accelerated water exchange process might increase high-concentration saline water influx from outside Dingzi Bay, potentially leading to further salinity increase in the bay. This issue requires continued research in future works.
5 Conclusion
This research focused on Dingzi Bay in southern Shandong Peninsula and utilized a 3D hydrodynamic numerical model to systematically simulate brine dispersion into the sea, investigating the dispersion paths, impact scope, degree of salinity increase, and effects on nearby marine ecosystems. The following key insights were obtained:
1. Flow speeds within Dingzi Bay showed significant spatial variability under the effect of topography, especially in tidal channels and nearby areas. Near the bay mouth and within bay tidal channels, flow speeds were high. Incoming tidal flows mainly propagated upstream along the eastern side of the main tidal channel, while outgoing tidal flows moved downstream along the western side.
2. Salinity near brine discharge outlet was significantly increased, forming high salinity zones at the bottom of the outlet. The extent of impact and degree of salinity changes were closely related to natural factors such as season and tide, particularly in winter, where local marine areas around the discharge zone experienced significant salinity increases, forming a conical high-salinity water body within a 20 m range of the outlet.
3. Brine discharge had not changed the total amount of salt in the original seawater of the bay, but by decreasing the amount of the freshwater within the bay, it had led to the intrusion of higher salinity seawater from outside the bay, thus increasing total salinity within the bay. Although the discharged concentrated seawater itself did not change average bay salinity, it altered the spatial and temporal distributions of the original salinity in the bay, affecting salinity distribution patterns in Dingzi Bay.
4. In winter, small areas with salinity increase of over 3psu appeared near discharge outlets, potentially significantly affecting indigenous marine organisms within these areas, while organisms in other marine areas were largely unaffected. The 1, 2, and 3psu salinity increase contour lines from brine discharge did not reach the mouth of Dingzi Bay; therefore, they had no impact on offshore aquaculture.
5. Based on the numerical model results, to reduce the impact of brine discharge, the discharge location should first be optimized by strategically placing discharge points in areas with higher flow rates to enhance the mixing and dispersion of the saline water. This approach aims to minimize high salinity zones near the discharge point. Additionally, a seasonal discharge plan should be implemented, avoiding discharge operations during periods of low runoff (e.g., winter), as these times have the most significant impact on local salinity and marine life.
Dingzi Bay flow field characteristics were complex and were affected by tides, topography, and runoff. There were significant spatial and temporal differences in tidal and ebb flow fields, particularly high salinity areas and flow velocity changes near the discharge outlets, which had significant impacts on local environments. These findings provided important scientific insights to understand the hydrodynamic characteristics of Dingzi Bay and their impact on salinity distribution, supporting the optimization of brine discharge strategies to minimize environmental impacts and protect the health and diversity of marine ecosystems.
Data availability statement
The raw data supporting the conclusions of this article will be made available by the authors, without undue reservation.
Author contributions
HX: Conceptualization, Data curation, Methodology, Software, Validation, Writing – original draft, Writing – review & editing. HS: Data curation, Investigation, Writing – original draft, Writing – review & editing. CZ: Project administration, Supervision, Writing – review & editing. QW: Data curation, Formal analysis, Project administration, Supervision, Writing – review & editing. YL: Funding acquisition, Investigation, Methodology, Resources, Visualization, Writing – original draft, Writing – review & editing. ZY: Conceptualization, Methodology, Supervision, Writing – review & editing.
Funding
The author(s) declare financial support was received for the research, authorship, and/or publication of this article. This research was funded by the Major Research Grant (42330406) from the Natural Science Foundation of China (NSFC), Shandong Provincial Natural Science Foundation, China (No.ZR2023QE310), Yantai Science and Technology Innovation Project (2023JCYJ097, 2023JCYJ094) and Supported by the Innovation Project for graduate students of Ludong University (119-810201).
Conflict of interest
The authors declare that the research was conducted in the absence of any commercial or financial relationships that could be construed as a potential conflict of interest.
Publisher’s note
All claims expressed in this article are solely those of the authors and do not necessarily represent those of their affiliated organizations, or those of the publisher, the editors and the reviewers. Any product that may be evaluated in this article, or claim that may be made by its manufacturer, is not guaranteed or endorsed by the publisher.
References
Ahmad N., Baddour R. E. (2014). A review of sources, effects, disposal methods, and regulations of brine into marine environments. Ocean Coast. Manage. 87, 1–7. doi: 10.1016/j.ocecoaman.2013.10.020
Aljohani N. S., Kavil Y. N., Shanas P. R., Al-Farawati R. K., Shabbaj Ii, Aljohani N. H., et al. (2022). Environmental impacts of thermal and brine dispersion using hydrodynamic modelling for yanbu desalination plant, on the eastern coast of the red sea. Sustainability 14, 18. doi: 10.3390/su14084389
Al-Kasbi A., Purnama A. (2022). Behavior of effluents discharged into shallow coastal waters under the influence of spring-neap tidal currents. Environ. Fluid Mechanics 22, 5–32. doi: 10.1007/s10652-021-09826-1
Chang Y., Li X. Y., Wang Y. P., Klingbeil K., Li W. H., Zhang F., et al. (2024). Salinity mixing in a tidal multi-branched estuary with huge and variable runoff. J. Hydrology 634, 16. doi: 10.1016/j.jhydrol.2024.131094
Chang-Feng Q., Jin-Ming S., Ning L. (2014). Causes of jellyfish blooms and their influence on marine environment. Yingyong Shengtai Xuebao 25, 3701–3712. doi: 10.13287/j.1001-9332.20141009.005
Del Bene J., Jirka G., Largier J. (1994). Ocean brine disposal. Desalination 97, 365–372. doi: 10.1016/0011-9164(94)00100-6
Fernández-Torquemada Y., Carratalá A., Lizaso J. L. S. (2019). Impact of brine on the marine environment and how it can be reduced. Desalination Water Treat 167, 27–37. doi: 10.5004/dwt.2019.24615
Fernández-Torquemada Y., Gónzalez-Correa J. M., Loya A., Ferrero L. M., Díaz-Valdés M., Sánchez-Lizaso J. L. (2009). Dispersion of brine discharge from seawater reverse osmosis desalination plants. Desalination Water Treat 5, 137–145. doi: 10.5004/dwt.2009.576
Flavin M. T., Fernandes J., Alqabandi R., Adams E., Han J., Al-Anzi B. (2023). Numerical modeling of plunging jets of brine: Mass transport and implications for desalination plant outfalls. Desalination 568, 10. doi: 10.1016/j.desal.2023.116996
Fowler S. J., Kosakowski G., Driesner T., Kulik D. A., Wagner T., Wilhelm S., et al. (2016). Numerical simulation of reactive fluid flow on unstructured meshes. Transport Porous Media 112, 283–312. doi: 10.1007/s11242-016-0645-7
Gao C. J., Ruan G. L. (2004). Desalination technology and engineering (Chemical Industry Press). 978-7-122-22837-6(in China).
Guo W. W., Xu H. S., Hu Z. J. (2021). Comparative research on the mesh generating of temperature difference induced heterogeneous flow with MIKE3 (China Rural Water and Hydropower). doi: 10.3969/j.issn.1007-2284.2021.06.005
He W., Zhang J., Yu X. D., Chen S., Luo J. (2018). Effect of runoff variability and sea level on saltwater intrusion: A case study of nandu river estuary, China. Water Resour. Res. 54, 9919–9934. doi: 10.1029/2018wr023285
Jenkins S., Paduan J., Roberts P., Schlenk D., Weis J. (2012). Management of brine discharges to coastal waters recommendations of a science advisory panel (Mesa, CA, USA: Southern California Coastal Water Research Project Costa). Costa Mesa: Control Board 101.
Jiang D. S., Dong C. Y., Ma Z. M., Wang X. W., Lin K. R., Yang F., et al. (2024). Monitoring saltwater intrusion to estuaries based on UAV and satellite imagery with machine learning models. Remote Sens. Environ. 308, 13. doi: 10.1016/j.rse.2024.114198
Kelaher B. P., Clark G. F., Johnston E. L., Coleman M. A. (2020). Effect of desalination discharge on the abundance and diversity of reef fishes. Environ. Sci. Technol. 54, 735–744. doi: 10.1021/acs.est.9b03565
Kowalski E., Mazierski J. (2008). Effects of cooling water discharges from a power plant on reservoir water quality. Oceanological Hydrobiological Stud. 37, 107–118. doi: 10.2478/v10009-008-0001-5
Lee M. E., Lee J., Al-Osairi Y. (2020). Study on the local sea water temperature variation for the industrial water use of Al-Zour coastal area in Kuwait. Desalination Water Treat 176, 9–17. doi: 10.5004/dwt.2020.25488
Lin J., Yan Q., Chen B. (2015). Ecological impact of thermal discharge from coastal power plants on plankton biomass in Xiangshan Bay. J. Shanghai Ocean Univ. 24, 894–905. doi: 10.12024/jsou.20150701500
Liu Y. L., Wang Q., Zhan C., Yi H. P., Tian Q., Zhang M. M. (2011). Response of drowned river valley estuary - tidal inlet bay towards human activities in the past 50 years: a case study on the Dingzi Bay, Jiaodong Peninsula, China. J. Coast. Res. 64, 676–680. https://www.jstor.org/stable/26482257
Ma P. C., Shi H. Y., Xue H. Y., Li P. P., Sun Y. K. (2024). Analysis of tidal current energy potential in the major channels of the Bohai Strait based on Delft3D. Periodical Ocean Univ. China 23, 12. doi: 10.1007/s11802-024-5721-y
Malcangio D., Petrillo A. F. (2010). Modeling of brine outfall at the planning stage of desalination plants. Desalination 254, 114–125. doi: 10.1016/j.desal.2009.12.005
Malfeito J., Díaz-Caneja J., Fariñas M., Fernandez-Torrequemada Y., Gonzalez-Correa J. M., Carratala-Gimenez A., et al. (2005). Brine discharge from the Javea desalination plant. Desalination 185, 87–94. doi: 10.1016/j.desal.2005.05.010
Minh N. Q., Huong N. T. T., Khanh P. Q., Hien L. P., Bui D. T. (2024). Impacts of resampling and downscaling digital elevation model and its morphometric factors: A comparison of hopfield neural network, bilinear, bicubic, and kriging interpolations. Remote Sens. 16, 20. doi: 10.3390/rs16050819
Paparella F., D’agostino D., Burt J. A. (2022). Long-term, basin-scale salinity impacts from desalination in the Arabian/Persian Gulf. Sci. Rep. 12, 12. doi: 10.1038/s41598-022-25167-5
Pérez-Díaz B., Castanedo S., Palomar P., Henno F., Wood M. (2019). Modeling nonconfined density currents using 3D hydrodynamic models. J. Hydraulic Eng. 145, 19. doi: 10.1061/(asce)hy.1943-7900.0001563
Purnalna A., Al-Barwani H., Al-Lawatia M. (2003). Modeling dispersion of brine waste discharges from a coastal desalination plant. Desalination 155, 41–47. doi: 10.1016/S0011-9164(03)00237-6
Purnama A., Al-Barwani H. (2006). Spreading of brine waste discharges into the Gulf of Oman. Desalination 195, 26–31. doi: 10.1016/j.desal.2005.09.036
Ruso Y. D. P., De La Ossa Carretero J. A., Casalduero F. G., Lizaso J. S. (2007). Spatial and temporal changes in infaunal communities inhabiting soft-bottoms affected by brine discharge. Mar. Environ. Res. 64, 492–503. doi: 10.1016/j.marenvres.2007.04.003
Sun X. Y., Bian H. X., Yin C. F., Chen J. S., Wang L. J. (2012). “Study on numerical simulation of concentrated brine discharged from desalination plant,” World Automation Congress 2012, Puerto Vallarta, Mexico, pp. 1–4. doi: 10.1007/s11814-011-0201-7
Tian R. (2019). Factors controlling saltwater intrusion across multi-time scales in estuaries, Chester River, Chesapeake Bay. Estuar. Coast. Shelf Sci. 223, 61–73. doi: 10.1016/j.ecss.2019.04.041
Tian Q., Wang Q., Liu Y. L. (2017). Geomorphic change in Dingzi Bay, East China since the 1950s: impacts of human activity and fluvial input. Front. Earth Sci. 11, 385–396. doi: 10.1007/s11707-016-0586-z
Tsiourtis N. X. (2001). Desalination and the environment. Desalination 141, 223–236. doi: 10.1016/S0011-9164(01)85001-3
Uncles R. J., Stephens J. A. (2011). The effects of wind, runoff and tides on salinity in a strongly tidal sub-estuary. Estuaries Coasts 34, 758–774. doi: 10.1007/s12237-010-9365-3
Voutchkov N. (2009). Salinity tolerance evaluation methodology for desalination plant discharge. Desalination Water Treat 1, 68–74. doi: 10.5004/dwt.2009.126
Wang G., Han B., Wang Y. B., Liu J., Zheng Y. C., Zheng L., et al. (2023). Distribution, source, and risk assessment of polycyclic aromatic hydrocarbons (PAHs) in surface sediments from Dingzi Bay, China. J. Sea Res. 193, 6. doi: 10.1016/j.seares.2023.102387
Wang X., Liu X., Liang S., Shi X. (2009). The effect of brine discharged from desalination plant on the distribution of the salinity in the Jiaozhou Bay. Acta Oceanologica Sin. 31, 44–51. doi: 10.3321/j.issn:0253-4193.2009.01.006
Ye Y. Y., Chen K. B., Zhou Q. Q., Xiang P., Huo Y. L., Lin M. (2018). Impacts of thermal discharge on phytoplankton in daya bay. J. Coast. Res. 83, 135–147. doi: 10.2112/si83-022.1
Zhan C., Liu C. K., Shi H. Y., Zhu J., Wang H. Y. (2024). Prediction of Diffusion of Concentrated Seawater into the Sea and Evaluation of Ecological and Environmental Impacts of Seawater Desalination Project in Estuary ——A Case Study of Shandong Peninsula Dingzi Bay. Available online at: https://link.cnki.net/urlid/12.1076.p.20240523.1143.002.
Zhan C., Yu J. B., Wang Q., Li Y. Z., Zhou D., Xing Q. H., et al. (2017). The evolutionary process of the geomorphology of tidal embayments in southern Jiaodong Peninsula, China. Estuar. Coast. Shelf Sci. 194, 182–191. doi: 10.1016/j.ecss.2017.06.016
Zhang L. L., Shi H. Y., Xing H., Li P. P., Ma P. C. (2023). Analysis of the evolution of the Yellow River Delta coastline and the response of the tidal current field. Front. Mar. Sci. 10. doi: 10.3389/fmars.2023.1232060
Zhang X. R., Shi H. Y., Zhan C., Zhu J., Wang Q., Li G. Q. (2023). Numerical simulation calculation of thermal discharge water diffusion in coastal nuclear power plants. Atmosphere 14, 19. doi: 10.3390/atmos14091371
Zheng X., Chen D., Wang Q., Zhang Z. X. (2014). Seawater desalination in China: Retrospect and prospect. Chem. Eng. J. 242, 404–413. doi: 10.1016/j.cej.2013.12.104
Keywords: concentrated brine discharge, three-dimensional numerical simulation, salinity rise, diffusion range, estuarine bay
Citation: Xue H, Shi H, Zhan C, Wang Q, Li Y and You Z (2024) Study on the three-dimensional numerical simulation of concentrated brine dispersal processes in estuarine bays. Front. Mar. Sci. 11:1466629. doi: 10.3389/fmars.2024.1466629
Received: 18 July 2024; Accepted: 09 September 2024;
Published: 27 September 2024.
Edited by:
Qin Zhu, Southern Marine Science and Engineering Guangdong Laboratory (Guangzhou), ChinaCopyright © 2024 Xue, Shi, Zhan, Wang, Li and You. This is an open-access article distributed under the terms of the Creative Commons Attribution License (CC BY). The use, distribution or reproduction in other forums is permitted, provided the original author(s) and the copyright owner(s) are credited and that the original publication in this journal is cited, in accordance with accepted academic practice. No use, distribution or reproduction is permitted which does not comply with these terms.
*Correspondence: Yan Li, eWFudGFpX2ZhbkAxNjMuY29t