- 1School of Oceanography, Shanghai Jiao Tong University, Shanghai, China
- 2State Key Laboratory of Satellite Ocean Environment Dynamics, Second Institute of Oceanography, Ministry of Natural Resources, Hangzhou, China
- 3National Satellite Ocean Application Service, Ministry of Natural Resources of the People’s Republic of China, Beijing, China
Particle scattering is a key factor affecting underwater light transport. The diffusion length , defined as 1/[b(1 − g)], where b is the scattering coefficient and g is the asymmetry factor, is obtained from the volume scattering function (VSF) of the particle and plays a vital role in assessing the potential for underwater optical detection, imaging and communication. Owing to the lack of VSF datasets, the variation in at different wavelengths in various ocean areas remains unclear. In this study, we used a dual-wavelength (488 & 532 nm) VSFLab to conduct the VSF measurement experiments in the East China Sea (ECS) and the South China Sea (SCS), obtaining VSFs from 1.5° to 178.5° at 51 stations. Seven optical properties, including absorption (a), scattering (b), attenuation (c), diffuse attenuation coefficient , backscattering , g, and , were calculated from the measured VSFs. A comparative analysis of the results was performed, which showed that the laser transmission capability at 532 nm was better than that at 488 nm in terms of the absorption or diffuse attenuation coefficient in the ECS, whereas superior performance was observed at 488 nm in the SCS. However, from the perspective of scattering, at 532 nm ((532)) demonstrated superior performance in both the ECS and SCS. This superiority was particularly noticeable in regions with exceptionally clear water, such as the eastern side of the Luzon Strait, where (532) exceeded (488) by approximately 20%. Overall, the findings of this study provide a new perspective for assessing underwater light transmission capabilities.
1 Introduction
The evaluation of the underwater attenuation length, optical thickness, or communication range is typically based on the optical characteristics of water (Mobley, 1994; Morel, 1991). The intensity of the forward-transmitting light is attenuated by absorption and scattering (Dutley, 1962). Currently, the attenuation coefficient (c) and diffuse attenuation coefficient are widely used to evaluate the capability of underwater light transfer (Jaffe et al., 2001; Liu et al., 2020; Zhang et al., 2022). The propagation of collimated light beams (such as lasers) in underwater environments is further complicated by multiscattering caused by aquatic particles, as the natural waters are typical dispersion or scattering media and exhibit significant optical variability. Multiscattering of particles results in spatial and temporal dispersions of light beams or laser pulses (Kirk, 1991; Organelli et al., 2018). The transmitted photons consist of three components: ballistic, snake, and diffusive (Yoo and Alfano, 1990). Both ballistic and snake photons retain their significant initial properties and combine to form signal photons. However, under common underwater conditions, when light travels a certain distance and undergoes multiple scatterings, the signal photons are minimal, whereas diffusive photons constitute a greater proportion of all detected photons (Di Rocco et al., 2010). Therefore, knowledge of the key optical properties of the scattering medium is required to develop photonic techniques for underwater optical imaging, communication, and detection. The assessment of the different contributions of ballistic and diffusive photons, viewed from a scattering perspective, is an effective approach for assessing the optical detection capability underwater.
Researchers have proposed advanced probabilistic methodologies to describe multiple scattering issues. Photon migration through a turbid medium could be determined by the probability function (Lutomirski et al., 1995; Kolinko et al., 1996). Starting from these probability functions the statistical moments for the coordinates in which different orders of scattering occur can be evaluated. The mean path for multiple scattering is dependent on the first-order moment of the scattering angle’s cosine and the scattering coefficient (Zaccanti et al., 1994). Currently, , which is regarded as the mean penetration distance from the source at which the photon “lose” its initial direction of motion owing to scattering, is commonly used to characterize photons undergoing multiple scattering within the dispersion medium (Kolinko et al., 1996). From , we can readily derive the probability density of the photon positions in N scattering events and compute the light intensity distribution within the medium. This plays a vital role in predicting the underwater optical performance and assessing the transition between the diffusion and forward scattering states of the light beams (Lutomirski et al., 1995; Wu et al., 2022b).
To estimate , the precise measurement of the full angle and forward small angle volume scattering function (VSF) is imperative. The VSF, here after , is defined as the radiant intensity scattered from a volume element into a unit solid angle centered in the direction θ, calculated per unit of incident irradiance E and per unit volume V.
Based on Equation 1, and the scattering phase function (SPF), expressed as , can be directly related to the VSF through Equations 2 and 3.
Although it is difficult to obtain a full-angle VSF, significant contributions have been made in the measurement of the wide-angle VSF (Chami et al., 2006; Sullivan and Twardowski, 2009a; Twardowski et al., 2012). For instance, Petzold’s pioneering work in 1972 (Petzold, 1972) on the acquisition of the SPF for three distinct water body types remains the most widely utilized publicly available VSF dataset. Instruments such as the Multispectral Volume Scattering Meter (MVSM) (Lee and Lewis, 2003), LISST- VSF (Slade et al., 2013), Multi-Angle Scattering Optical Tool (MASCOT) (Sullivan and Twardowski, 2009b), Polarized Volume Scattering Meter (POLVSM) (Chami et al., 2014), and VSFLab (Wu et al., 2022a) have been utilized to measure wide-angle VSFs. However, due to factors such as the measurement range of angles or wavelengths of the instruments, for different wavelengths in different sea areas has not been widely discussed from the measurement datasets.
Furthermore, the transmission capability of light beams in natural water varies significantly with the wavelengths. Currently, the wavelengths of 488 and 532 nm are considered as “transmission windows” in the ocean (Jaffe, 1990; Jaffe et al., 2001; Mobley et al., 2002) and are broadly employed in applications such as oceanic LIDAR, underwater imaging, and communication. Based on , many studies suggested that 532 nm is more suitable for coastal area detection (Morel, 1991; Li et al., 2020). However, owing to its lower attenuation coefficient than that at 532 nm, the wavelength of 488 nm performs better in over 60% of the global seas (Churnside, 2013; Hostetler et al., 2018; Chen et al., 2019). Similarly, by using chlorophyll concentration models based on MODIS-AQUA (Churnside, 2013) or integrating bio-optical models with the parameters of satellite-borne LIDAR systems (Zhang et al., 2022), it is evident that 532 nm performs better in coastal areas, whereas wavelengths between 485 nm and 495 nm are more suitable for open ocean applications. Liu et al. (2020) suggested that 486.134 nm is the optimal wavelength for single-wavelength satellite-borne oceanic LIDAR, and a dual-wavelength LIDAR combining 486.134 and 438.355 nm is suitable for global ocean detection based on the analysis of . Additionally, the capability of underwater optical imaging systems, which is assessed based on c (Li et al., 2023; Jaffe, 2015), reveals that the 532 nm laser is increasingly being utilized. In the field of underwater laser communication, blue-green light is favored, as evidenced by the 1 Gbps × 100 m underwater optical wireless communication system developed by the Japan Agency for Marine-Earth Science and Technology (JAMSTEC) and Trimatiz Limited (Trimatiz) (Ishibashi and Susuki, 2022). Choosing appropriate wavelengths in different seas can significantly enhance the detection capabilities. However, these studies predominantly focused on energy attenuation and overlooked the changes in the characteristics of ballistic and diffuse light. Consequently, the role of VSF in the assessment of light transmission capability has not been sufficiently explored.
In this study, to assess the light beam transmission capability of different wavelength from the perspective of scattering, a dual-wavelength wide-angle VSF measurement instrument for 488 and 532 nm, called the dual-wavelength VSFLab, was developed. Subsequently, experiments were conducted onboard in the East and South China Seas to obtain the VSFs at 51 stations. Based on the measured VSFs, common optical properties, including the absorption (a), scattering (b), attenuation (c), backscattering , and diffuse attenuation coefficient , were derived. More importantly, the exportation of the asymmetry factor (g) and diffusion length allows the analysis of photons transmission distance underwater by using the VSF. Such perspective of discussion could greatly enhance our understanding of the underwater transmission of light beams.
2 Materials and methods
2.1 Theoretical description of diffusion length
According to Lutomirski et al. (1995) and as shown in Figure 1, we assumed that the random-position vector of a photon initially at x = 0 and traveling in the z direction, which is scattered precisely N times, can be expressed as the vector.
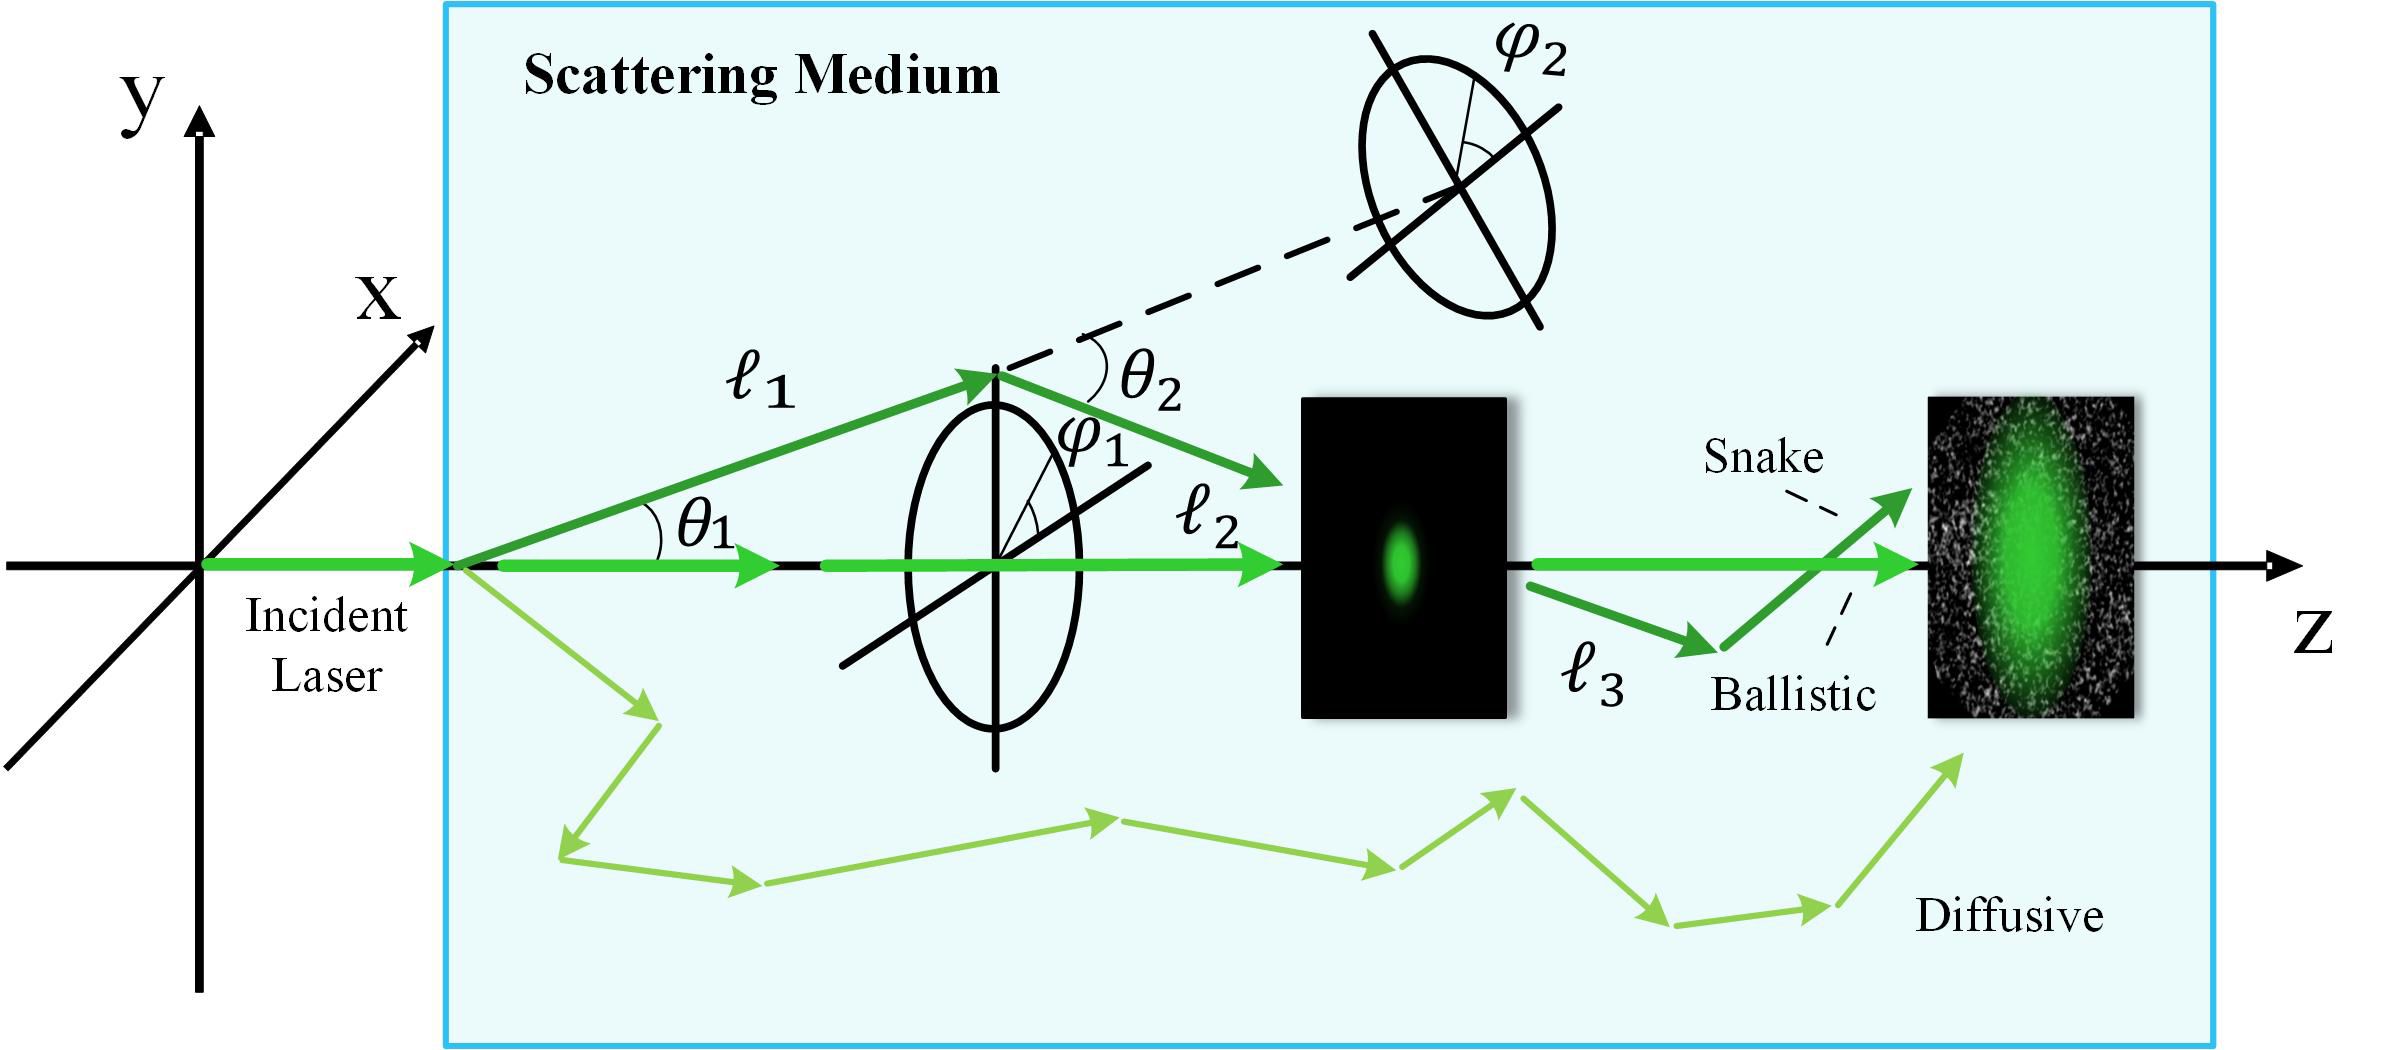
Figure 1. Schematic of laser propagation in a scattering medium showing the ballistic, snake, and diffusive photons. As the Gaussian beam propagates through the scattering medium, the divergence angle of the beam becomes larger and resolution is reduced with random noise.
where is the random distance traveled by the photon between the m and (m + 1) scattering events, and is the unit vector in the photon direction after the mth scattering.
where is a matrix that determines the change in the heading after the kth scattering event.
where and are the respective polar and azimuthal angles from the kth scattering event.
The independence of and implies the independence of under the condition of a total of N scatterings.
where
Thus,
We can finally obtain the below expression for the conditional mean propagation distance after N scatterings.
where is the scattering mean free path normalized by b, and is the mean cosine of the scattering angles given by g, which is directly related to the effect of scattering on the angular distribution, especially the shape distribution of the forward angles. For the forward-extended scattering indicatrices, 0<g<1. The quantity g = 0 corresponds to isotropic scattering and g = 1 corresponds to strictly forward scattering. This can be represented as:
When , can be deduced as shown below.
2.2 The instrument and calibration
2.2.1 Dual-wavelength VSFLab
VSFLab, which adopts the principles of POLVSM (Chami et al., 2014), was recently developed by Wu et al. (2022a). It features a separation design of the laser incident plane and detection plane, and incorporates a double periscopic optical system, allowing free rotation of the detector around the incident beam. VSFLab acquires the measurements of the VSF between 1.5° and 178.5° with an angular resolution of 0.75°. In this study, the VSFLab was upgraded to dual-wavelength.
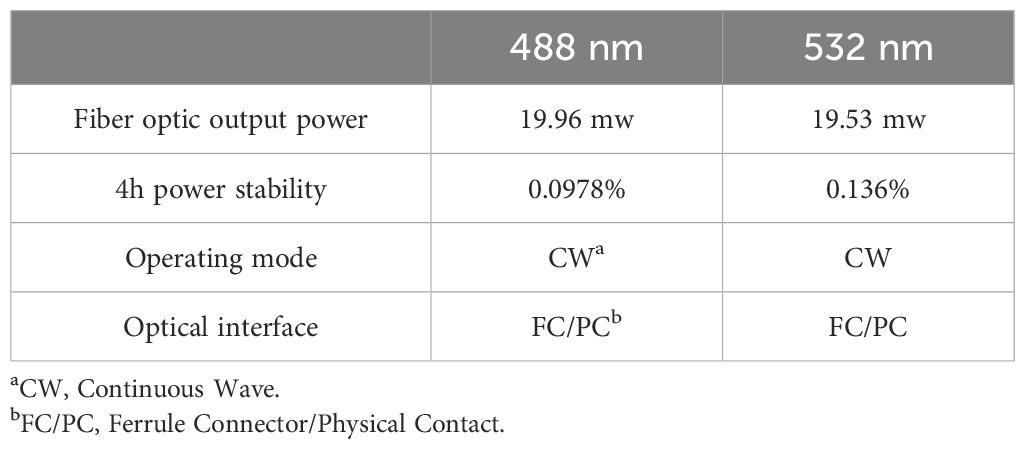
The overall schematic and photograph of the dual-wavelength VSFLab are shown in Figure 2. The dual-wavelength laser used in this study consists of two wavelengths: 488 nm and 532 nm, with a beam divergence of 1.1 mrad. The laser system (Changchun New Industries Optoelectronic Tech Co., Ltd.) integrates multiple light sources with different wavelengths, enabling seamless switching through a button and subsequent irradiation into the incident system via an optical fiber beam collimator. This design effectively eliminates measurement errors caused by repetitive movements. The laser parameters are listed in Table 1. The incident system plane comprises a beam adjustment frame, pinhole (PH1), beam splitter (BS), two silicon detectors (a reference detector and an exit light detector), and a mirror (M) to reach the incident prism (P1) prior to entering the basin filled with the water sample. The collimated beam passes through PH1 to lock the divergent stray light from the laser source. After passing through the BS, one beam of light serves as a reference and irradiates the reference photodetector (RP), whereas the other beam passes through the reflector and irradiates P1. Subsequently, the beam traverses the sample, with the direct light exiting the prism (P2) and being detected by the transmittance photodetector (TP), enabling synchronous measurement of the attenuation coefficient, , based on the Beer-Lambert Law, as follows:
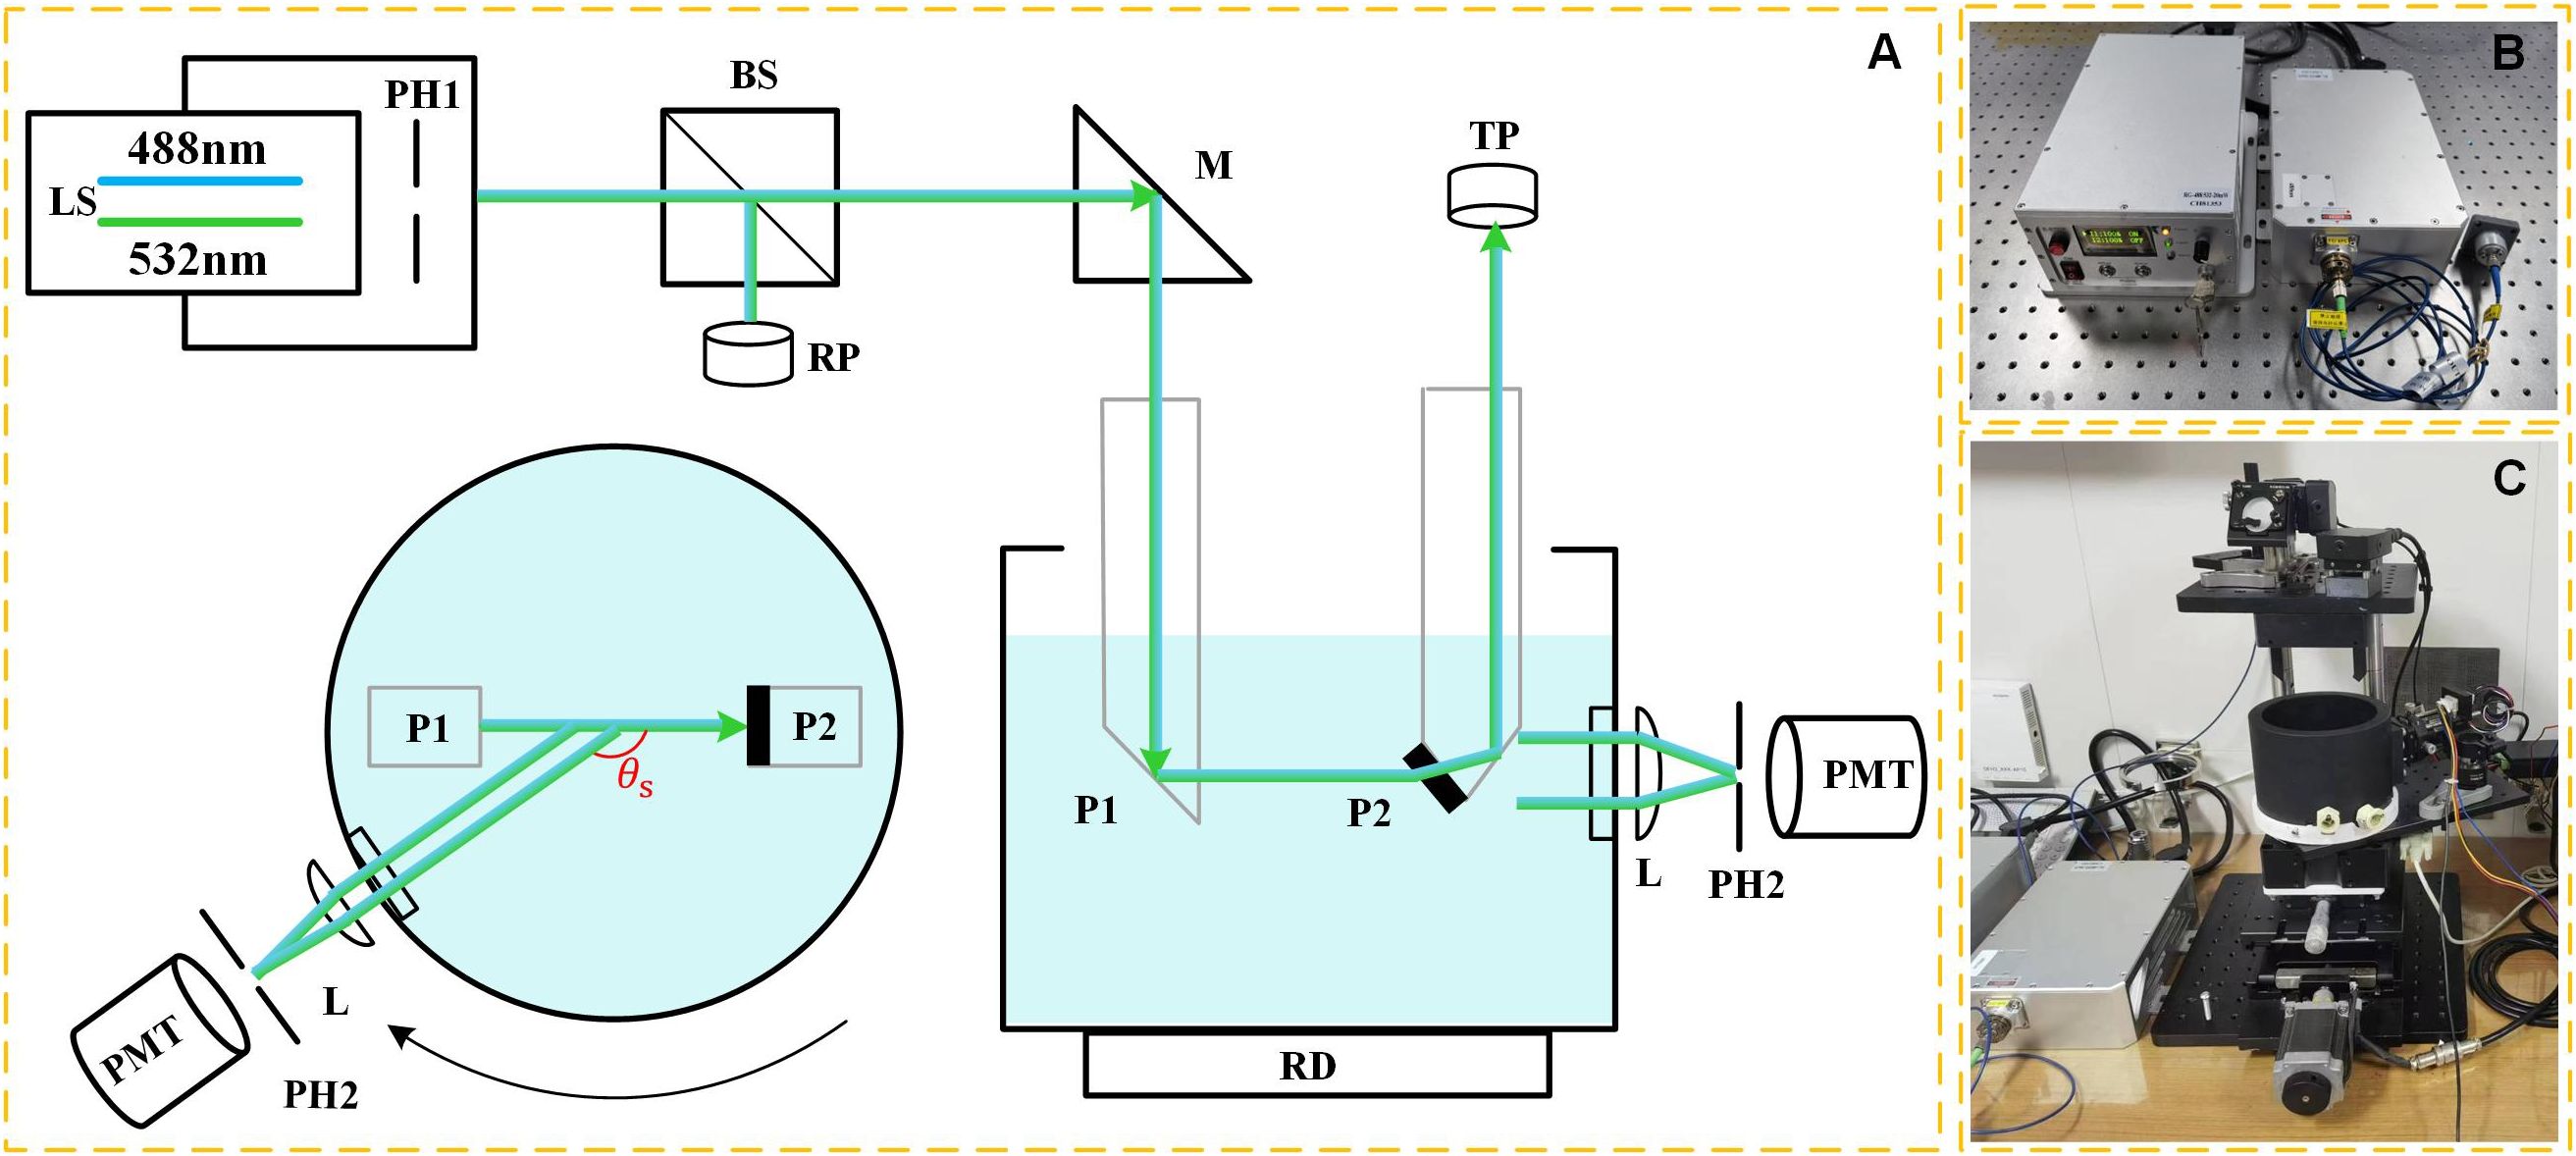
Figure 2. The schematic of the dual-wavelength VSFLab. (A) Layout and measurement principle, including laser source (LS), pinhole 1 (PH1), beam splitter (BS), reference photodetector (RP), mirror (M), prism 1 (P1), basin, prism 2 (P2), transmittance photodetector (TP), lens (L), pinhole 2 (PH2) and photomultiplier tube (PMT). The mirror (M), incident prism 1 (P1), and exit prism (P2) form a periscope-optical structure; top view of the measurement system is displayed on the left. The scattered light detecting system is composed of L, PH2, and PMT; (B) View of dual-wavelength laser system. (C) Photograph of the laboratory installation of dual-wavelength VSFLab.
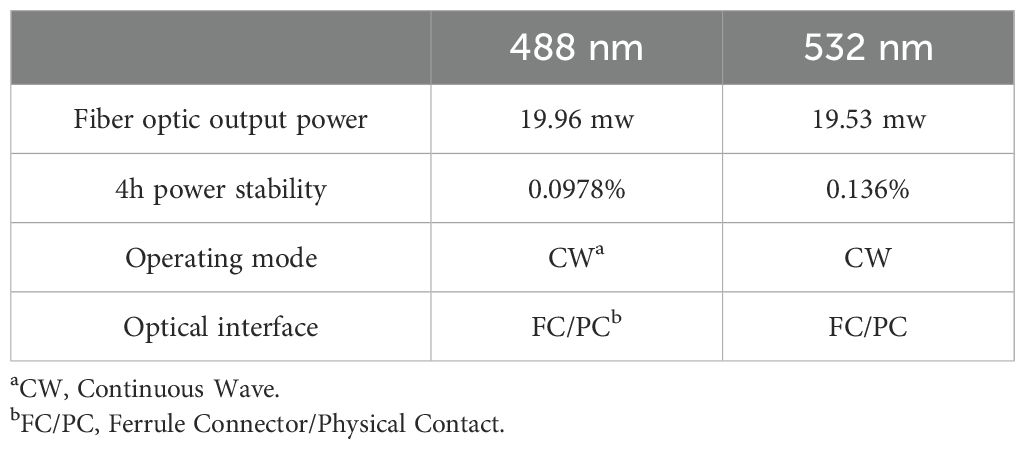
Table 1. Parameters of dual-wavelength laser manufactured by Changchun New Industries Optoelectronic Tech Co., Ltd.
where I is the laser intensity after traversing the path length (l), received by the TP, and is the intensity received by the RP. In contrast, the scattered light passes through a lens (L) and pinhole (PH2) before being received by a photomultiplier tube (PMT). The basin is equipped with a rotating motor (RD) that enables it to rotate along its central axis, facilitating the detection of scattered light at different scattering angles . The complete rotation of the VSF measurement takes only 7 s. We conducted three rotational measurements for each sample, and the average was used as the representative final result.
2.2.2 Calibration
To accurately obtain particulate VSF and evaluate the performance of the VSFlab, a series of work including correction and calibration were carried out. Calibration of the dual-wavelength VSFLab was conducted in the laboratory and included baseline measurements, scattering volume correction, amplitude calibration, and angular calibration.
a) Baseline measurements
For the baseline measurement, pure water was prepared using the Milli-Q Advantage A10 water purification system (Millipore Inc., Burlington, MA, USA) and then filtered through a polycarbonate cartridge filter of pore size 0.2 µm (PN 12991, Pall Co., Ltd., Port Washington, NY, USA) to further remove residual particle contaminations. During the onboard observations, filtered seawater was prepared for the baseline measurements. Finally, these baseline measurements were subtracted from the subsequent measurements of the particle suspensions.
b) Scattering volume correction
The scattering volume, defined as the volume illuminated by the incident beam, must remain constant for VSF measurements across all scattering angles. However, it exhibits a complex variation with the scattering angle. Therefore, it is necessary to incorporate a correction for the scattering volume. As the incident light area remains constant, the scattering volume can be simplified by using a detector to receive the scattered light path. The scattered light paths received by detectors at different scattering angles can be represented as the inverse of the sine function relative to the scattering volume 90° (approximately 0.02 cm3 in this study).
c) Amplitude calibration
The calibration procedure aims to derive the calibration coefficient to convert the original photoelectric signal (V) into the VSF . In the process of calibration, we employ polystyrene beads (Duke Standards™), for which is equal to and the refractive indices and size distributions are well-defined, enabling us to utilize the Mie theory for the VSF calculations. The specifications of the polystyrene beads used in this study are presented in Table 2. The 0.203 µm beads were smaller than the wavelength of the laser (488/532 nm), thus leading to the featureless shape of the VSF. In contrast, the large beads exhibited ripples in the angular scattering, which made the calibration highly sensitive to the angular acceptance of the detector. As mentioned by Hu et al. (2019), we used small-sized beads with a nominal diameter of 0.203 µm for calibration and other large-sized beads for validation.
where is the SPF obtained from the Mie theory and is the scattering coefficient of the beads, which is equal to the value of measured by the dual-wavelength VSFLab, as the imaginary part of the complex refractive index of the beads is very small (close to zero). The effects of the uncertainties of the 0.203 µm beads at 488 nm and 532 nm, with the mean diameter varying within , on are 3.4% and 2.8%, respectively. The imaginary part of the refractive index of the 0.203 µm beads in the visible wavelengths is relatively insignificant; hence, the influence on the scattering can be neglected (Maffione and Dana, 1997). By employing a linear regression model, we derived , which represents the slope between and voltage , obtained after scattering volume correction.
The solutions containing different concentrations of the 0.203 µm beads were used to calculate at each scattering angle and wavelength. To ensure homogeneity and prevent particle aggregation, a 100 ml master solution of 0.203 µm beads was produced and agitated on a vortex mixer. The pure water in the sample cell (approximately 450 ml) was then mixed with a certain amount (ranging from 20 ml to 70 ml) of the master solution, creating a range of solutions with c varying from 0.38 to 1.16 m−1. The beads were mixed thoroughly using a stirring rod after each addition. Moreover, the criterion for a single-scattering regime is defined in terms of a small optical thickness, which is typically less than 0.1. VSF measurements should be conducted within the single-scattering regime to ensure that multiple scattering effects on l can be neglected. The value of l for the dual-wavelength VSFLab was 0.065 m. Therefore, to approximate the single-scattering condition, c of the experimental sample was carefully controlled to remain below 1.54 m−1.
d) Angular calibration
The angular calibration was conducted to verify the consistency of the measurements. To ensure a consistent rotation within the scattering angle range of 0°–180° and evenly spaced angular intervals, we configured the instrument to initiate sampling prior to reaching 0°. Thus, the objective of angular calibration is to determine the initial and final sampling points while rectifying any angular discrepancies. The process of angle calibration is accomplished by assigning values to the detected VSF maximum or minimum using second-order polynomial curve fitting, with 3 µm standard particles selected specifically for their distinct angular features.
The high angular resolution and wide angular range of the measured particle VSFs enabled more accurate and direct calculations of the particle scattering coefficients and particle backscattering coefficients . The VSF was extrapolated in the near-forward direction to 0° using a power law dependency (Mobley et al., 2002; Zhang et al., 2011). In the full backward direction, the VSF was extended to 180° by assuming constant VSF values between 178.5° and 180° according to Mobley et al. (2002) and Wu et al. (2022a). Based on the full-angle VSF, and were computed by integrating the VSF over the whole and half range of the scattering angle, respectively.
Considering the effect of pure water, and can be expressed as:
where and are the scattering and backscattering coefficients of pure water, respectively. , , and can be calculated as follows:
where and are the SPFs of the particle and pure water.
2.3 Absorption and attenuation measurements
Hyperspectral absorption and attenuation were measured in situ using the AC-S hyperspectral spectrophotometer (WET Labs). The AC-S instruments provided spectral and measurements at 81 wavelengths with a 4 nm resolution in the range of 400-744.1 nm and a 25 cm path length with sample rate of 4 Hz. The instrument was calibrated with Milli-Q ultrapure water prior to the field experiments. Note that the AC-S was calibrated every day during the cruises. After calibration, and were calculated as follows:
where and are the absorption and attenuation measured by the AC-S; and are the absorption and scattering coefficients of pure water, respectively. The raw absorption and attenuation measurements were corrected for temperature and salinity effects using the contemporaneously recorded Conductivity-Temperature-Depth (CTD) data (Sullivan et al., 2006). Finally, was calculated as follows:
2.4 Study area
The experiments were conducted during two research cruises in the South China Sea (SCS) and East China Sea (ECS) from August 20 to November 9, 2023, onboard the Dongfanghong3 and Zheyuke2, respectively, as indicated by Table 3. The experimental area covered a variety of water types, ranging from sediment-dominated turbid coastal waters to clear West Pacific Ocean waters. A total of 51 stations were sampled. The ECS experimental area contained 20 sampling stations ranging in latitude from 27°N to 31.5°N and longitude from 121°E to 124.5°E. It is a coastal area with high suspended sediment concentration and large particle sizes. The SCS stations were within 10°N-21°N and 112°E-123°E, encompassing a total of 31 sampling stations. The locations of the sampling stations during both cruises are shown in Figure 3. To clearly present the distribution of the experimental stations, both the ECS and SCS were categorized into three sections (ECS: , , and SCS: , , ). The transition from to illustrated a shift from nearshore to offshore areas with increasing depth. In the SCS, most stations were in . Four stations located in the SCS basin and near the Nansha Islands included in , whereas two stations east of the Luzon Strait were chosen to represent the region because of their clear open ocean waters.
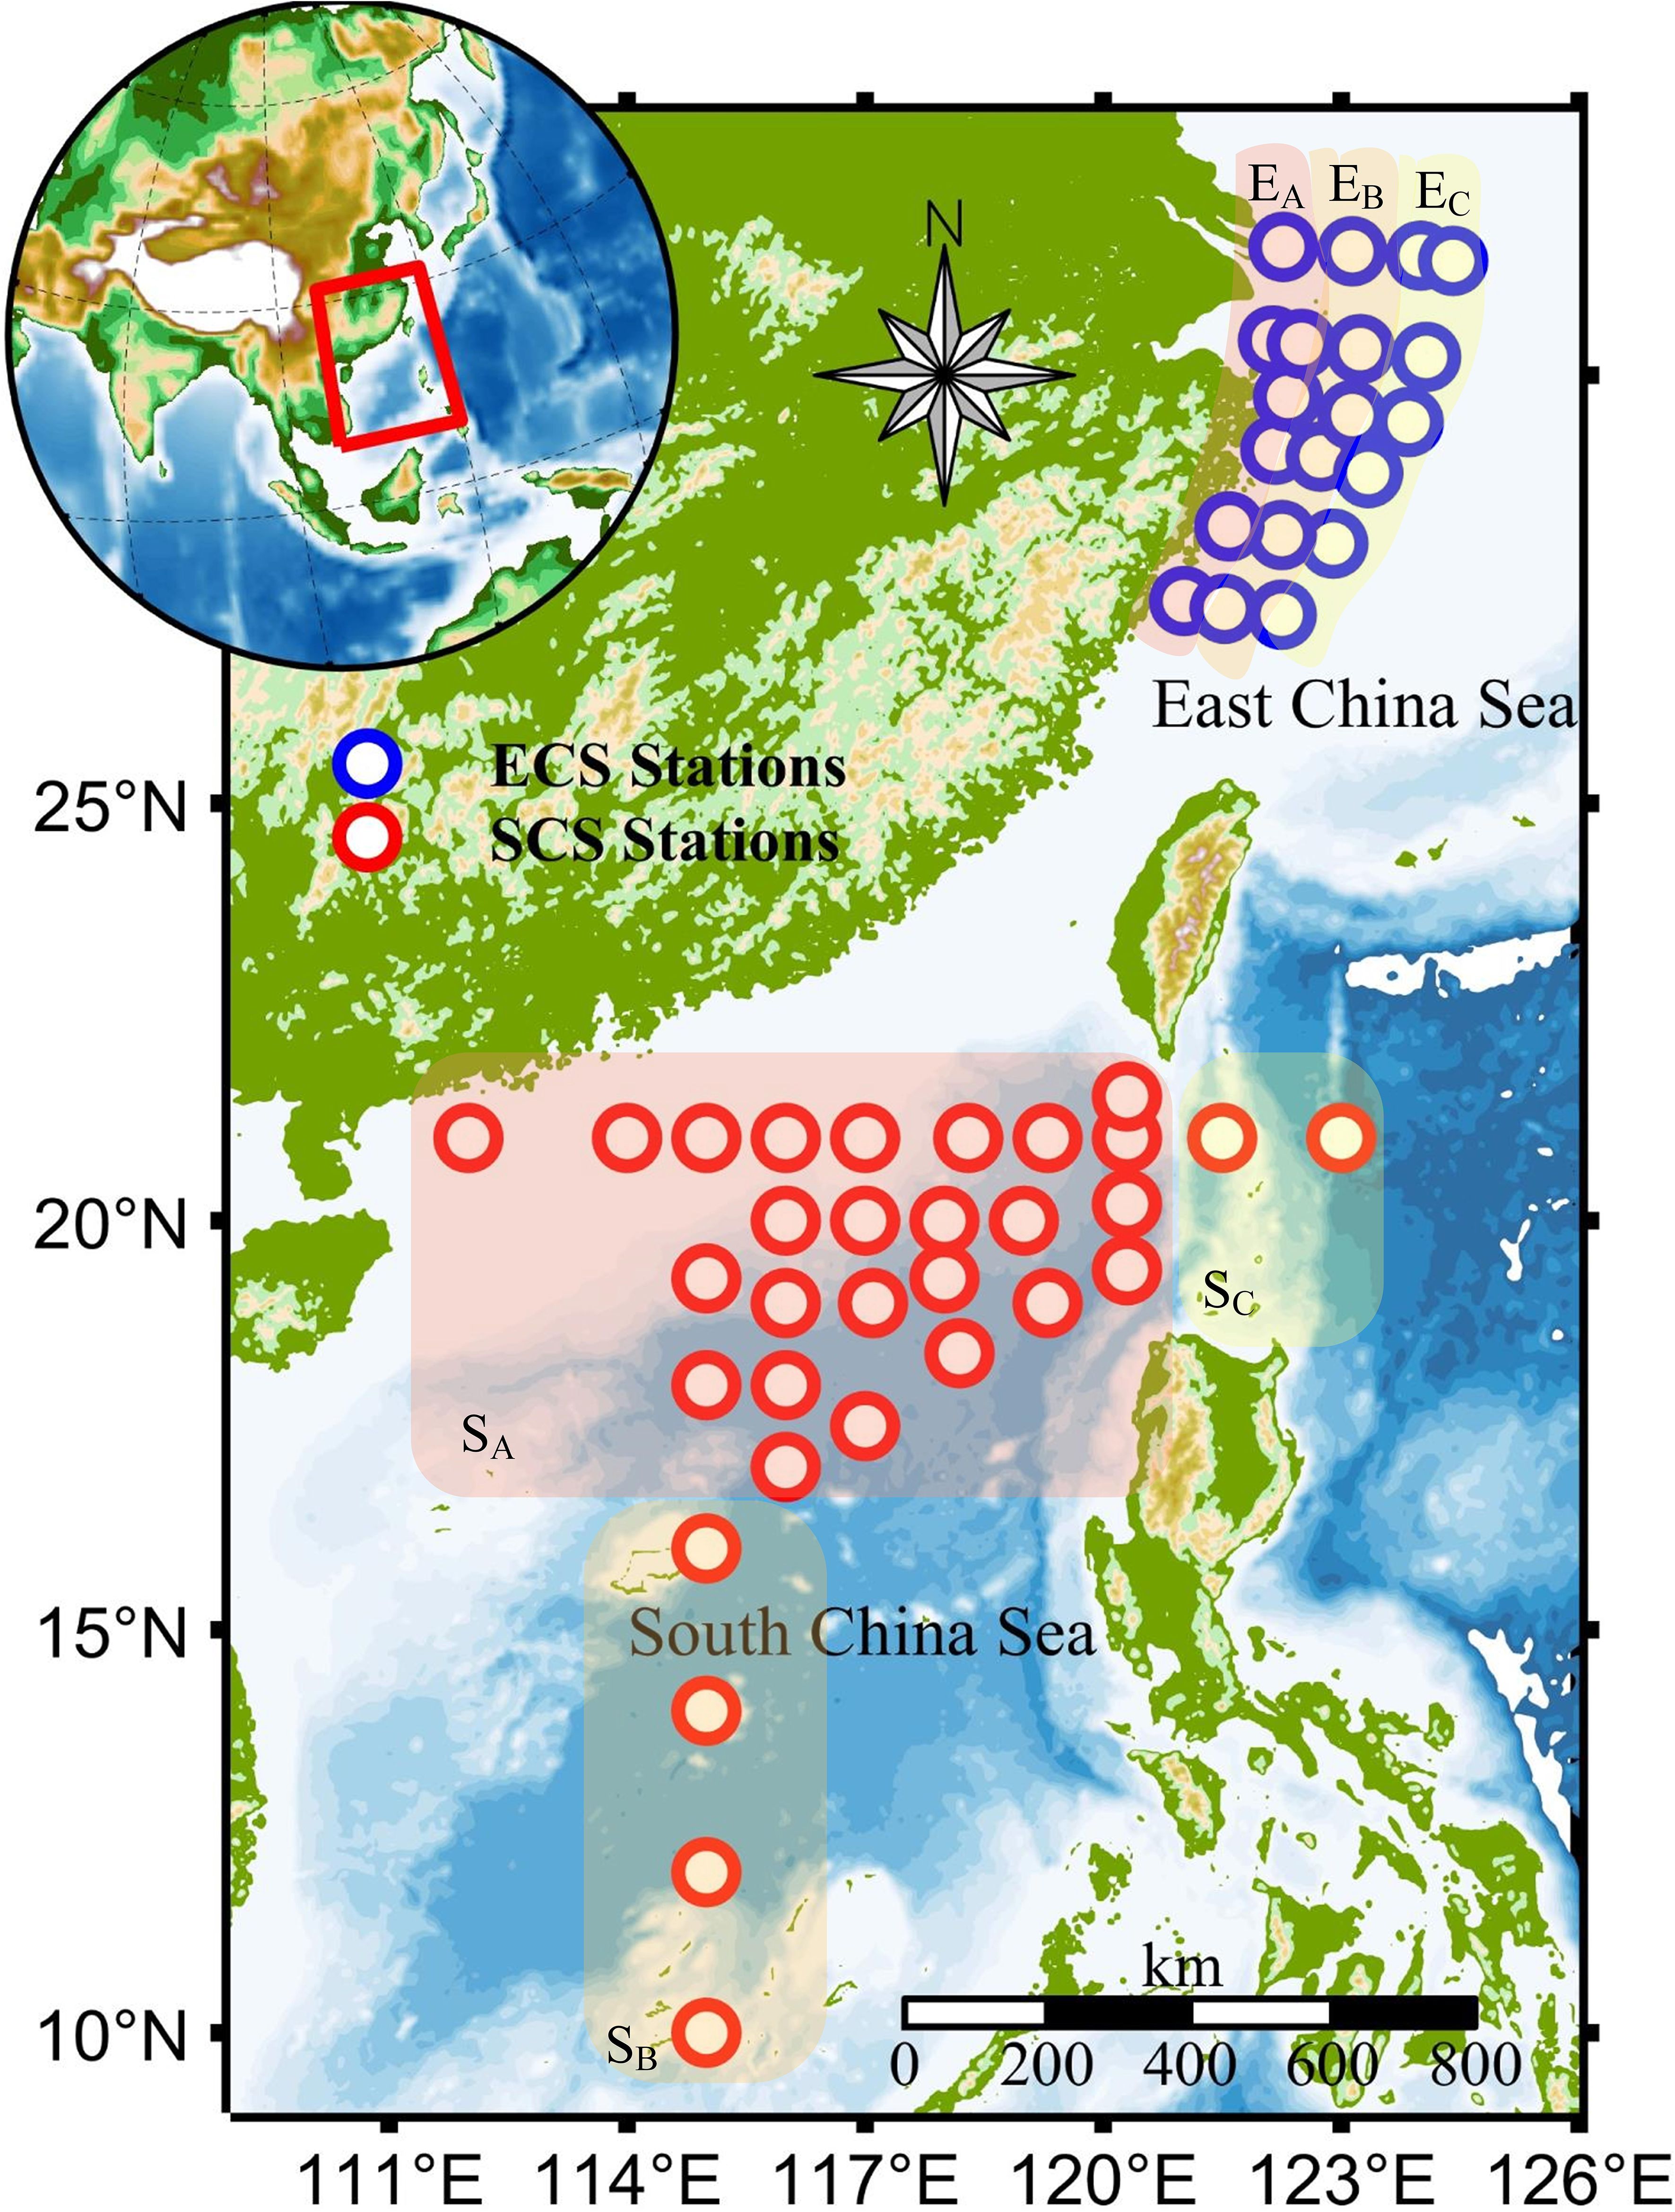
Figure 3. Locations of the stations of NORC cruise (red circles) in South China Sea and ShenLan cruise (blue circles) in East China Sea. The background is the bathymetry of the study area.
During the two cruises, the dual-wavelength VSFLab was operated onboard to measure the surface water samples collected by the CTD casts. The average water depth at the SCS stations was 1800 m; we selected samples from a depth of 5 m as surface samples. At the ECS stations, which are characterized by an average water depth of approximately 30 m, we collected the surface samples from a depth of 2 m. Synchronized measurements of the AC-S were performed at the same depth. The water samples were fully mixed using a magnetic stirrer prior to the measurements. Subsequently, the samples were appropriately diluted based on the c values of the water samples to satisfy the requirements for single scattering. Considering the influence of bubbles on the measurement results, we were extremely careful during the processes of water collection, liquid transfer, and dilution to avoid bubbles as much as possible.
3 Results and discussion
3.1 Measurements of dual-wavelength VSF
3.1.1 Validation of dual-wavelength VSFLab
According to the amplitude calibration method described in Section 2.2, the dual-wavelength VSFLab was calibrated using solutions of polystyrene beads of 0.203 µm with five concentration gradients. Through this method, of each scattering angle was determined. To ensure the reliability of the experimental data, suspensions of polystyrene beads of 3 µm were used to verify the consistency of the measurements. As shown in Figures 4A, B, the measured VSF results at the wavelengths of 488 nm and 532 nm are consist with those calculated using the Mie theory, yielding absolute percentage difference (APD) values of approximately 15.1% and 15.0%, respectively. Figures 4C, D illustrate the correlation between and the theoretical VSFs at the scattering angles of 6°, 90°, 150° and 178°. All Pearson correlation coefficients are greater than or equal to 0.96, indicating the high reliability of the calibration results.
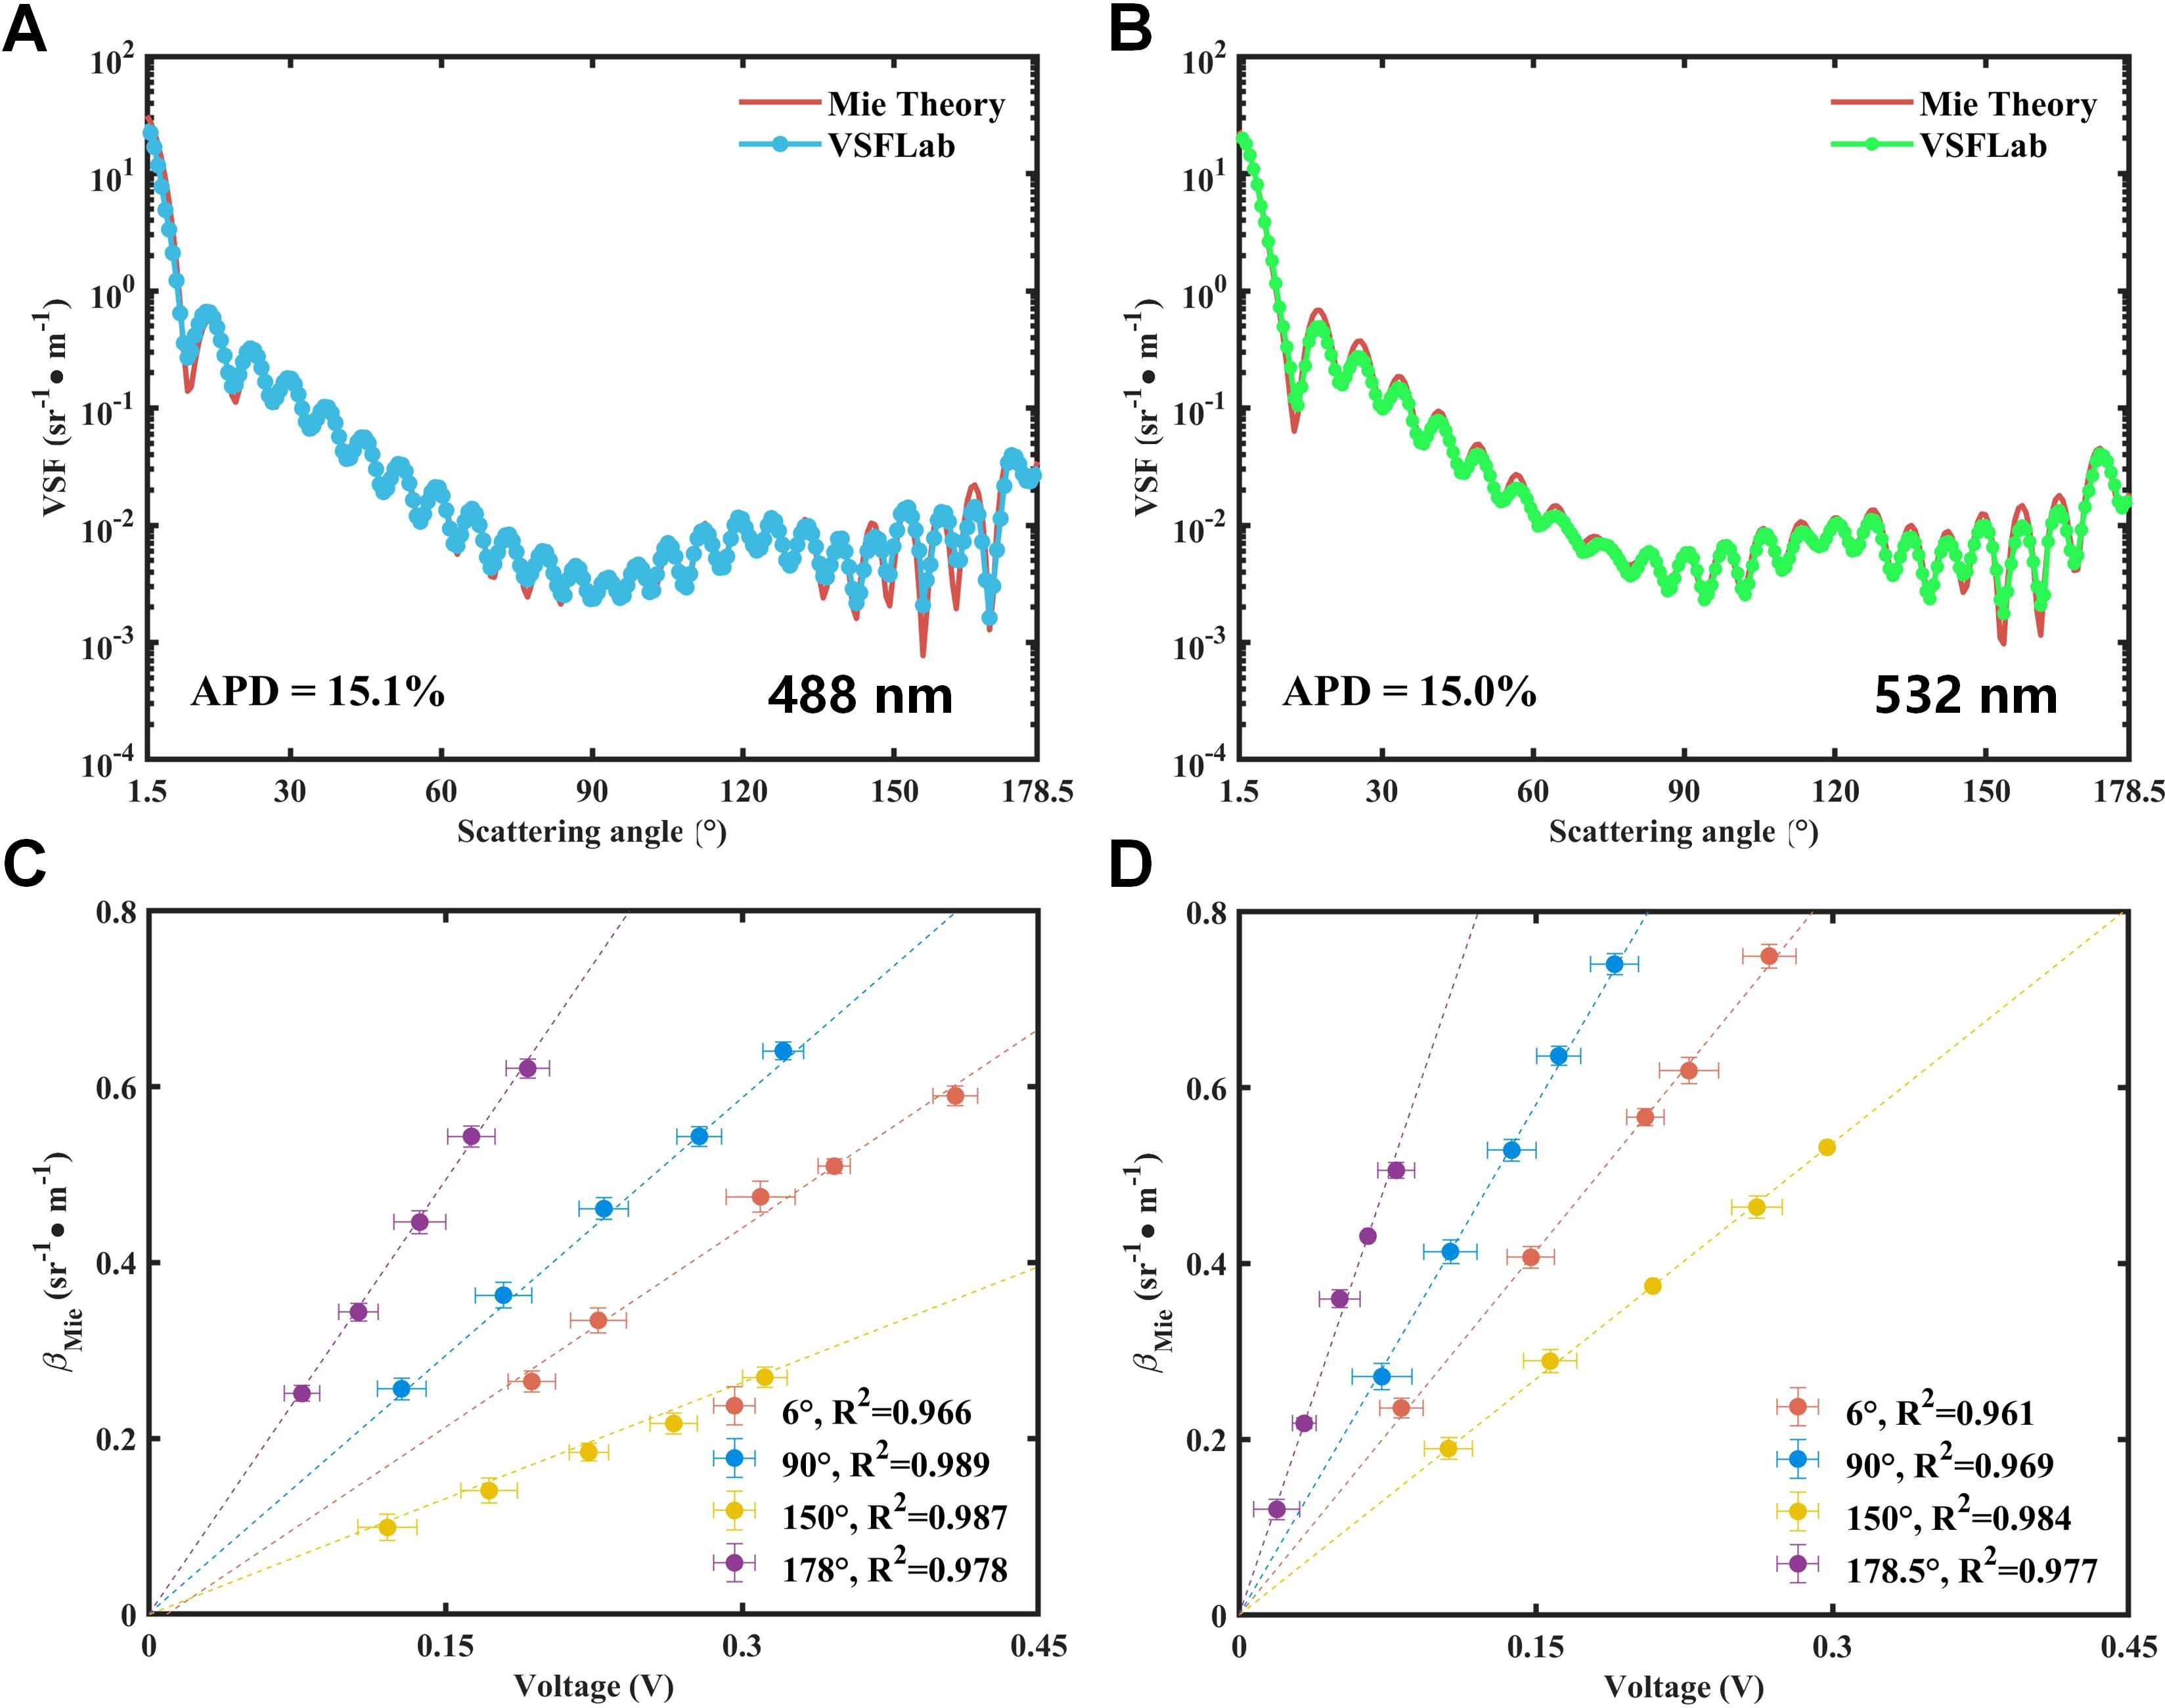
Figure 4. (A, B) Comparison of measurements of the VSF with Mie theory calculation for polystyrene beads of size 3 µm at 488 nm and 532 nm. The red line corresponds to the theoretical curves calculated using the Mie theory; the blue and green lines denote the results measured at 488 nm and 532 nm, respectively. (C, D) Scatterplot between raw signal voltage measured by dual-wavelength VSFLab and calculated VSF for 0.203 µm bead solutions with various concentrations at four scattering angles of 6° (red dots), 90° (blue dots), 150° (orange dots) and 178° (purple dots). The values at 90°, 150°, and 178° are multiplied by 10, 15, and 30 for clarity of presentation. The four lines are the results of applying a robust linear regression model. Horizontal and vertical error bars represent standard deviations estimated, from the measurements of λ) at each concentration and λ) calculated by accounting for uncertainties in the , respectively.
3.1.2 Angular variations of dual-wavelength VSFs
Figures 5A, C present the experimental results for the VSFs in the ECS and SCS, respectively. It is clear that the lowest value of the VSFs in the SCS could reach 10−4, whereas that in the ECS was 10−3, which indicates that in SCS is comparatively lower than that in the ECS. Furthermore, when considering the forward VSF, ECS demonstrated a more pronounced scattering effect than SCS. This observation implies that the particle sizes prevalent in the ECS are larger on average than those found in the SCS (Zhang et al., 2011). The intensity of the backward VSFs observed in the ECS measurements was significantly lower than that in the forward region. In experimental stations rich in minerals or inorganic particles, the difference can be as low as nearly four orders of magnitude. However, at the stations further away from the shore ( area), the differences can extend to five orders of magnitude. In the SCS, the difference was even greater and reached six orders of magnitude. High-angle-resolution SPF demonstrates distinct responses to the characteristics of various types of particles (Zugger et al., 2008). The full-angle SPFs derived from the VSFs measured in the SCS and ECS are shown in Figures 5B, D, respectively. In the ECS, there are differences in the SPFs between 0° and 30°for 488 nm and 532 nm, where the descending slope of 488 nm is notably steeper than that of 532 nm, which deviates from the observations in the other regions within the ECS. From 30° to 90°, no significant difference was observed in the SPF between the two wavelengths. However, within the angular range of 30° to 90°, a significant difference in the SPF shapes at different wavelengths becomes apparent. In the SCS, the shapes of the SPFs for the dual-wavelength are similar in the forward region (0°-60°). The rate of change for 488 nm is greater than that for 532 nm from 60° to 150°. Beyond 150°, both wavelengths exhibit an increasing trend, with the slope at 488 nm being higher than that at 532 nm. It is clear that 532 nm exhibits a greater slope before 30° than 488 nm, indicating stronger forward scattering.
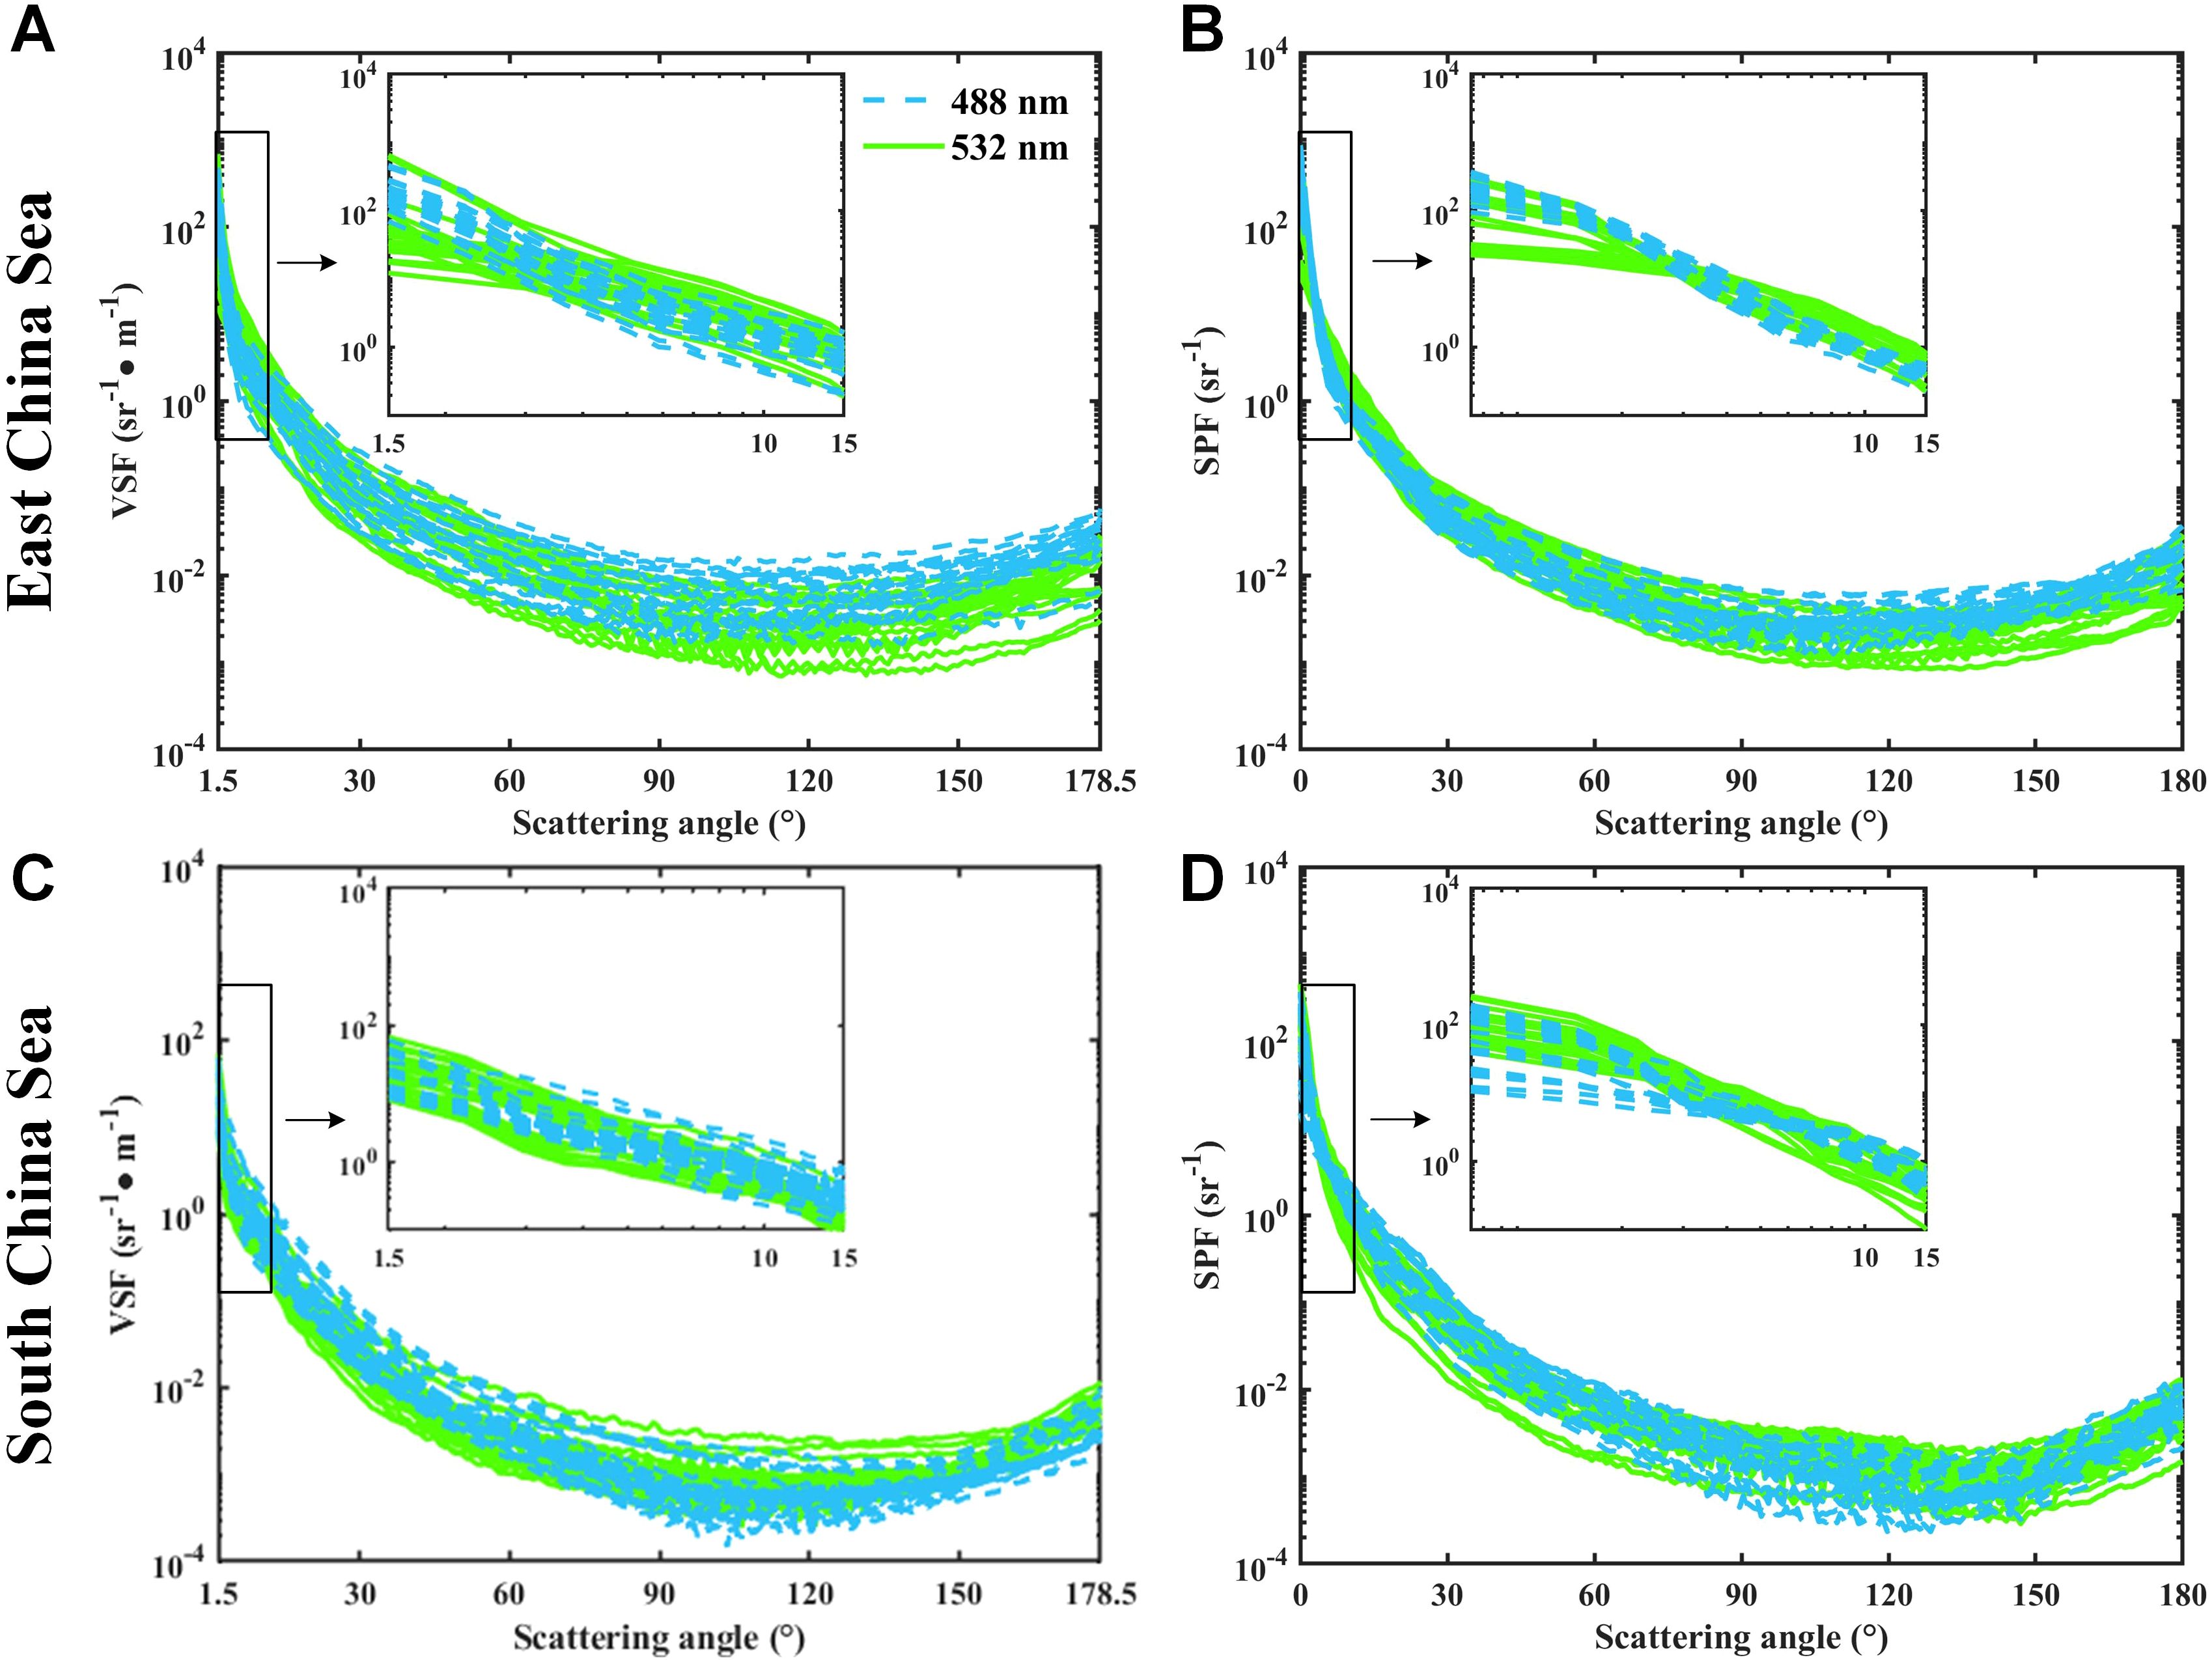
Figure 5. Experimental results of VSF and SPF in the ECS and SCS. The blue and green lines represent the results for the wavelengths of 488 nm and 532 nm, respectively. (A, C) VSFs at 488 nm and 532 nm between 1.5° and 178.5°. The subfigures show the forward scattering in log-log co-ordinate from 1.5° to 15°. (B, D) SPF at 488 nm and 532 nm between 0° and 180°. The subfigures show the SPF from 0° to 15°.
As shown in Figure 6, a comprehensive investigation of the wavelength dependence of the VSF in diverse aquatic environments was conducted. Each set displays for λ = 488, 532 nm. By normalizing the VSF at an angle of 90°, we observed a pronounced difference in the results between clear water (SCS) and turbid water (ECS). The clear water exhibits stronger symmetry, while the turbid water shows a larger difference in forward and backward scattering, indicating significantly lower symmetry. In each case, the VSF of the short wavelength is almost symmetric about θ = 90°, presumably because symmetric molecular scattering has a greater contribution to the total scattering at short wavelengths (Mobley, 1994).
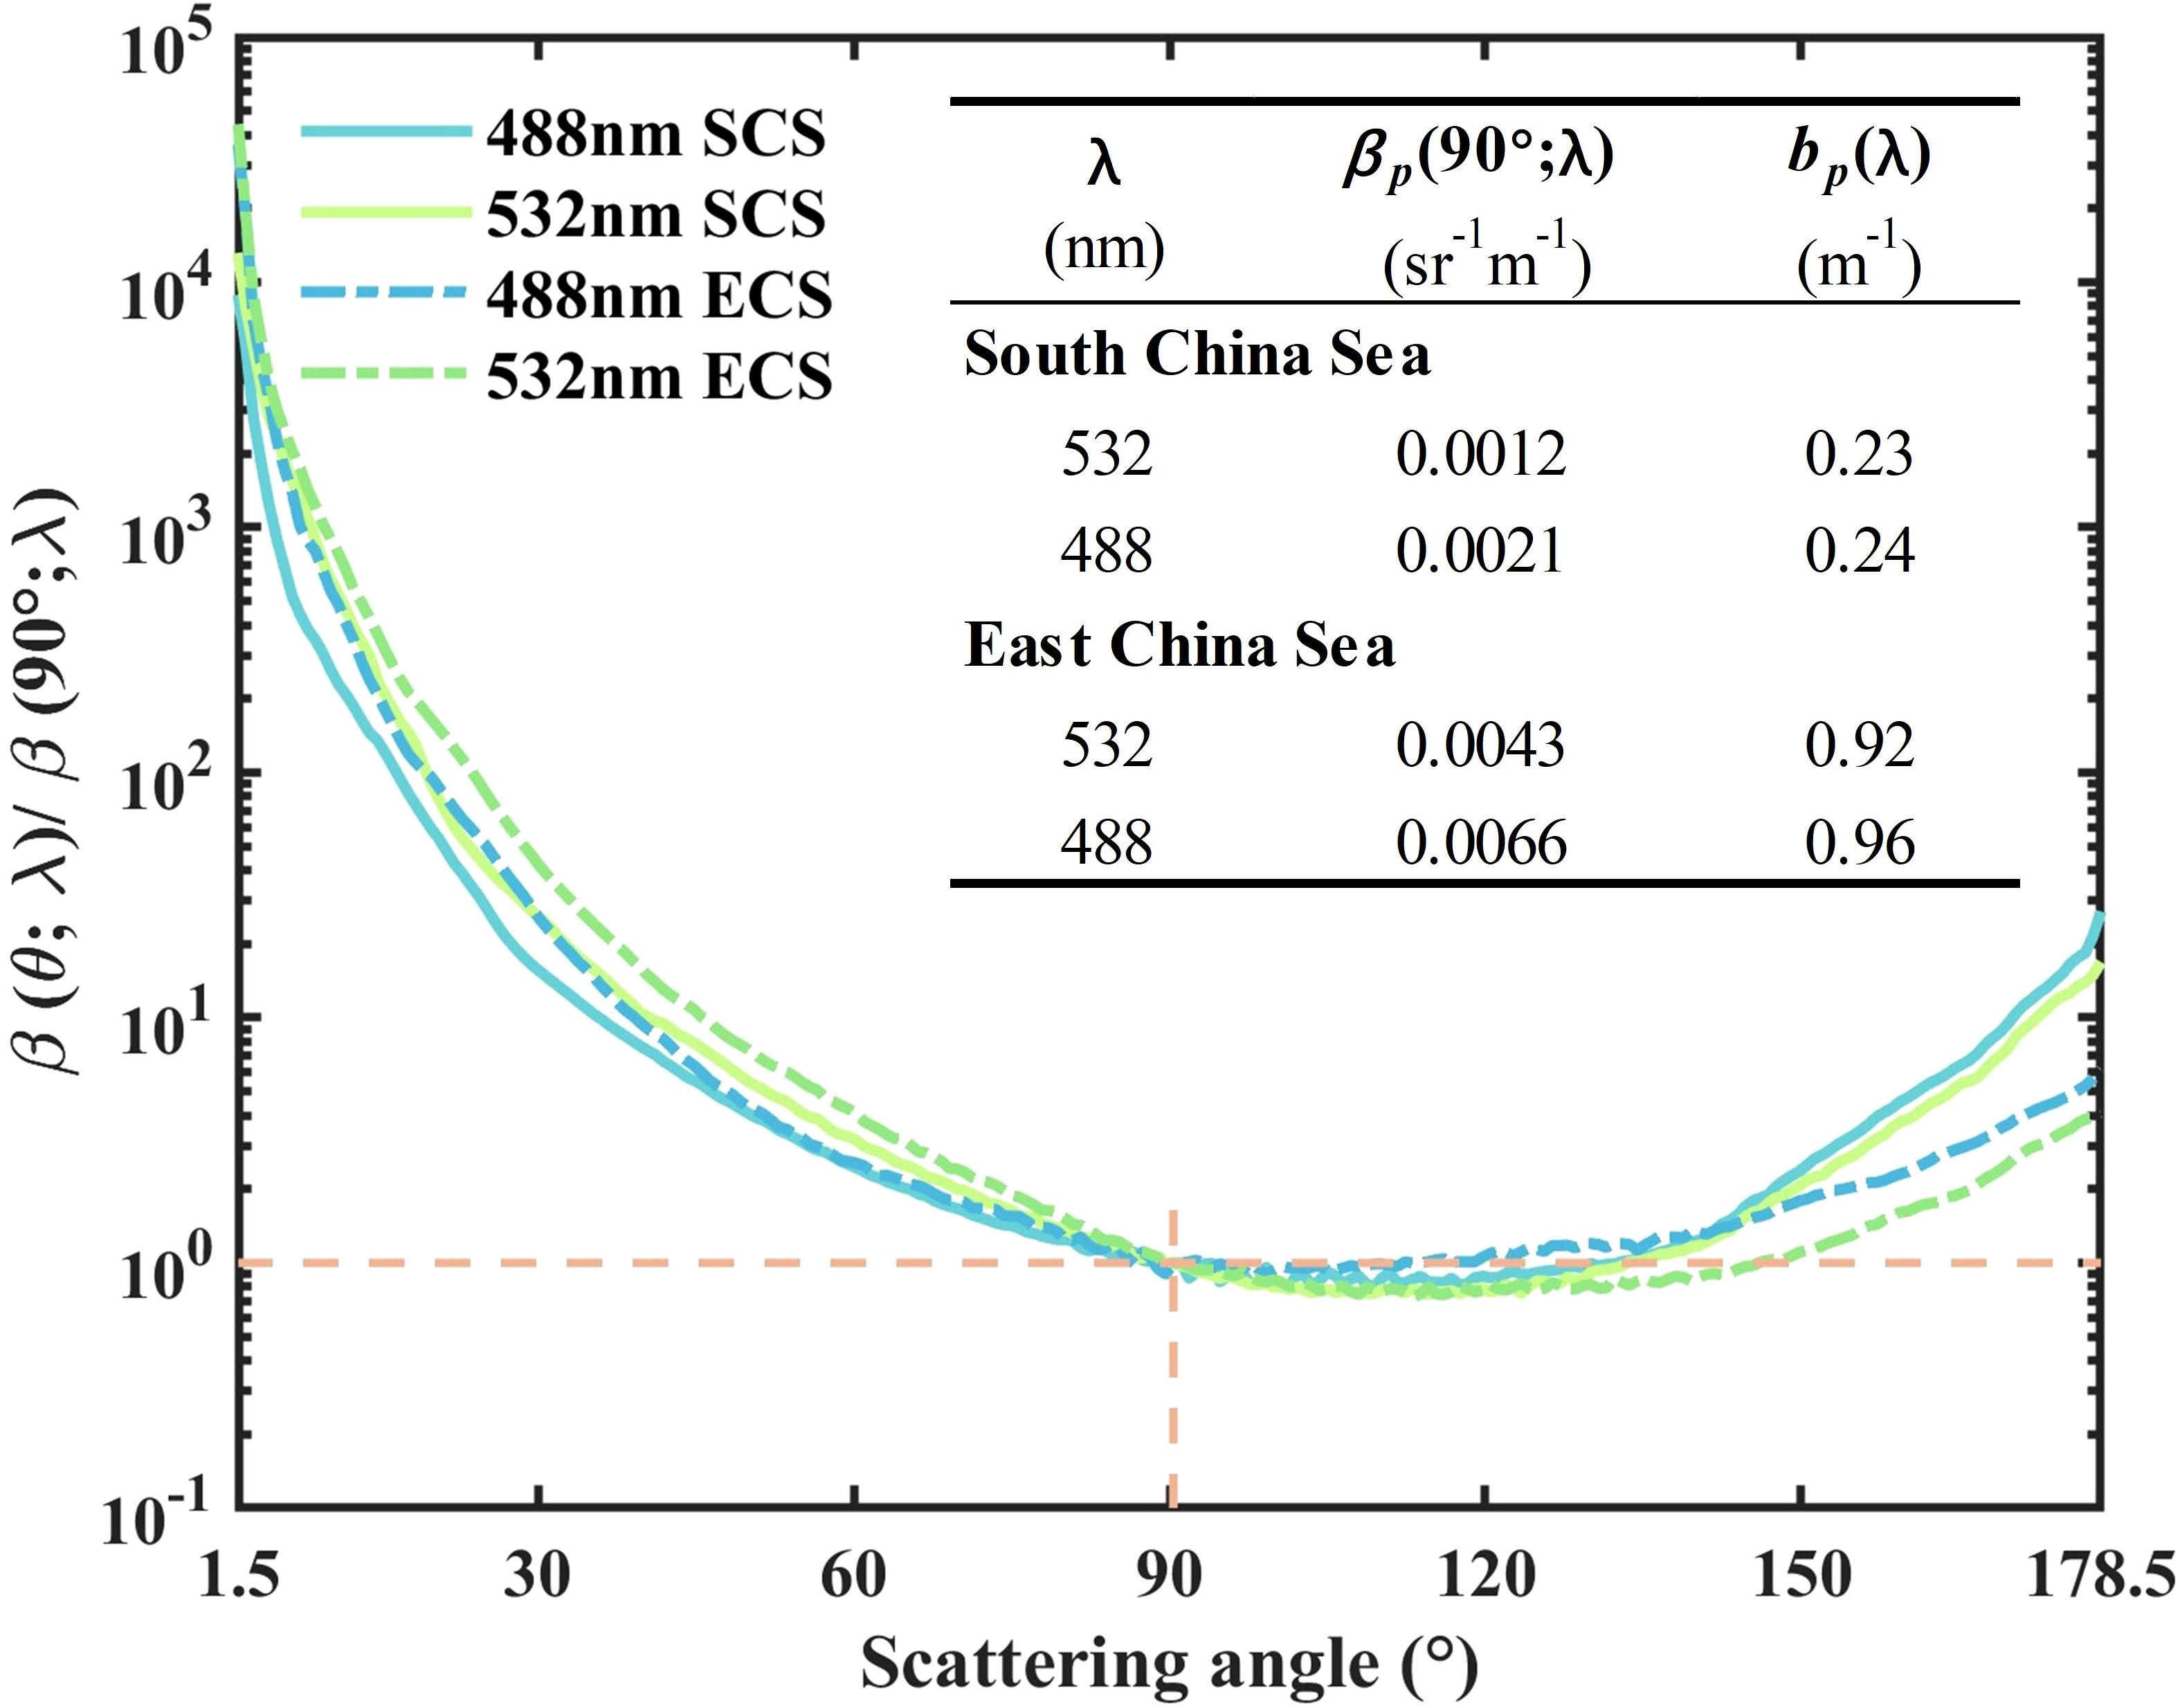
Figure 6. Wavelength dependence of VSFs measured in clear (SCS) and turbid (ECS) waters. The four lines represent the mean value of the measured VSFs at 488 nm and 532 nm. The table shows the values of λ) and λ) in SCS and ECS at different wavelengths. The intersection between the dotted orange lines marks the normalized position.
3.1.3 Comparison with AC-S
Figure 7 shows the comparative results between the AC-S measurements and at the corresponding stations, which were calculated from the reference light of the dual-wavelength VSFLab and the signal from the transmittance detector. Additionally, and , calculated from the dual-wavelength VSFLab and AC-S, respectively, were also compared. It can be observed that the precision in determining is slightly lower than that of . This was not unexpected because of the difference in the acceptance angles of the two instruments (Boss et al., 2009). However, overall, R2 exceeded 90%, indicating the reliability of the VSF measurements conducted by the dual-wavelength VSFLab.

Figure 7. Relationship between (A) (λ), (B) (λ) and (C) (λ) measured by dual-wavelength VSFLab and AC-S. The scattered blue points represent the values obtained at 488 nm, and the green points represent those measured at 532 nm. The solid blue line corresponds to the linear fit between the dual-wavelength VSFLab and AC-S measurements at 488 nm. The solid green line is the fitting line corresponding to the measurements at 532 nm. The dotted gray lines represent the 1:1 lines.
3.2 Common optical properties
Benefiting from the VSFs measured by dual-wavelength VSFLab, various common optical properties (OPs, including c, a, , , and ) can be calculated in the ECS and SCS. The distributions of these OPs for the 51 stations are illustrated in Figure 8, and the variations in the corresponding values for each regional station are presented in Figure 9.
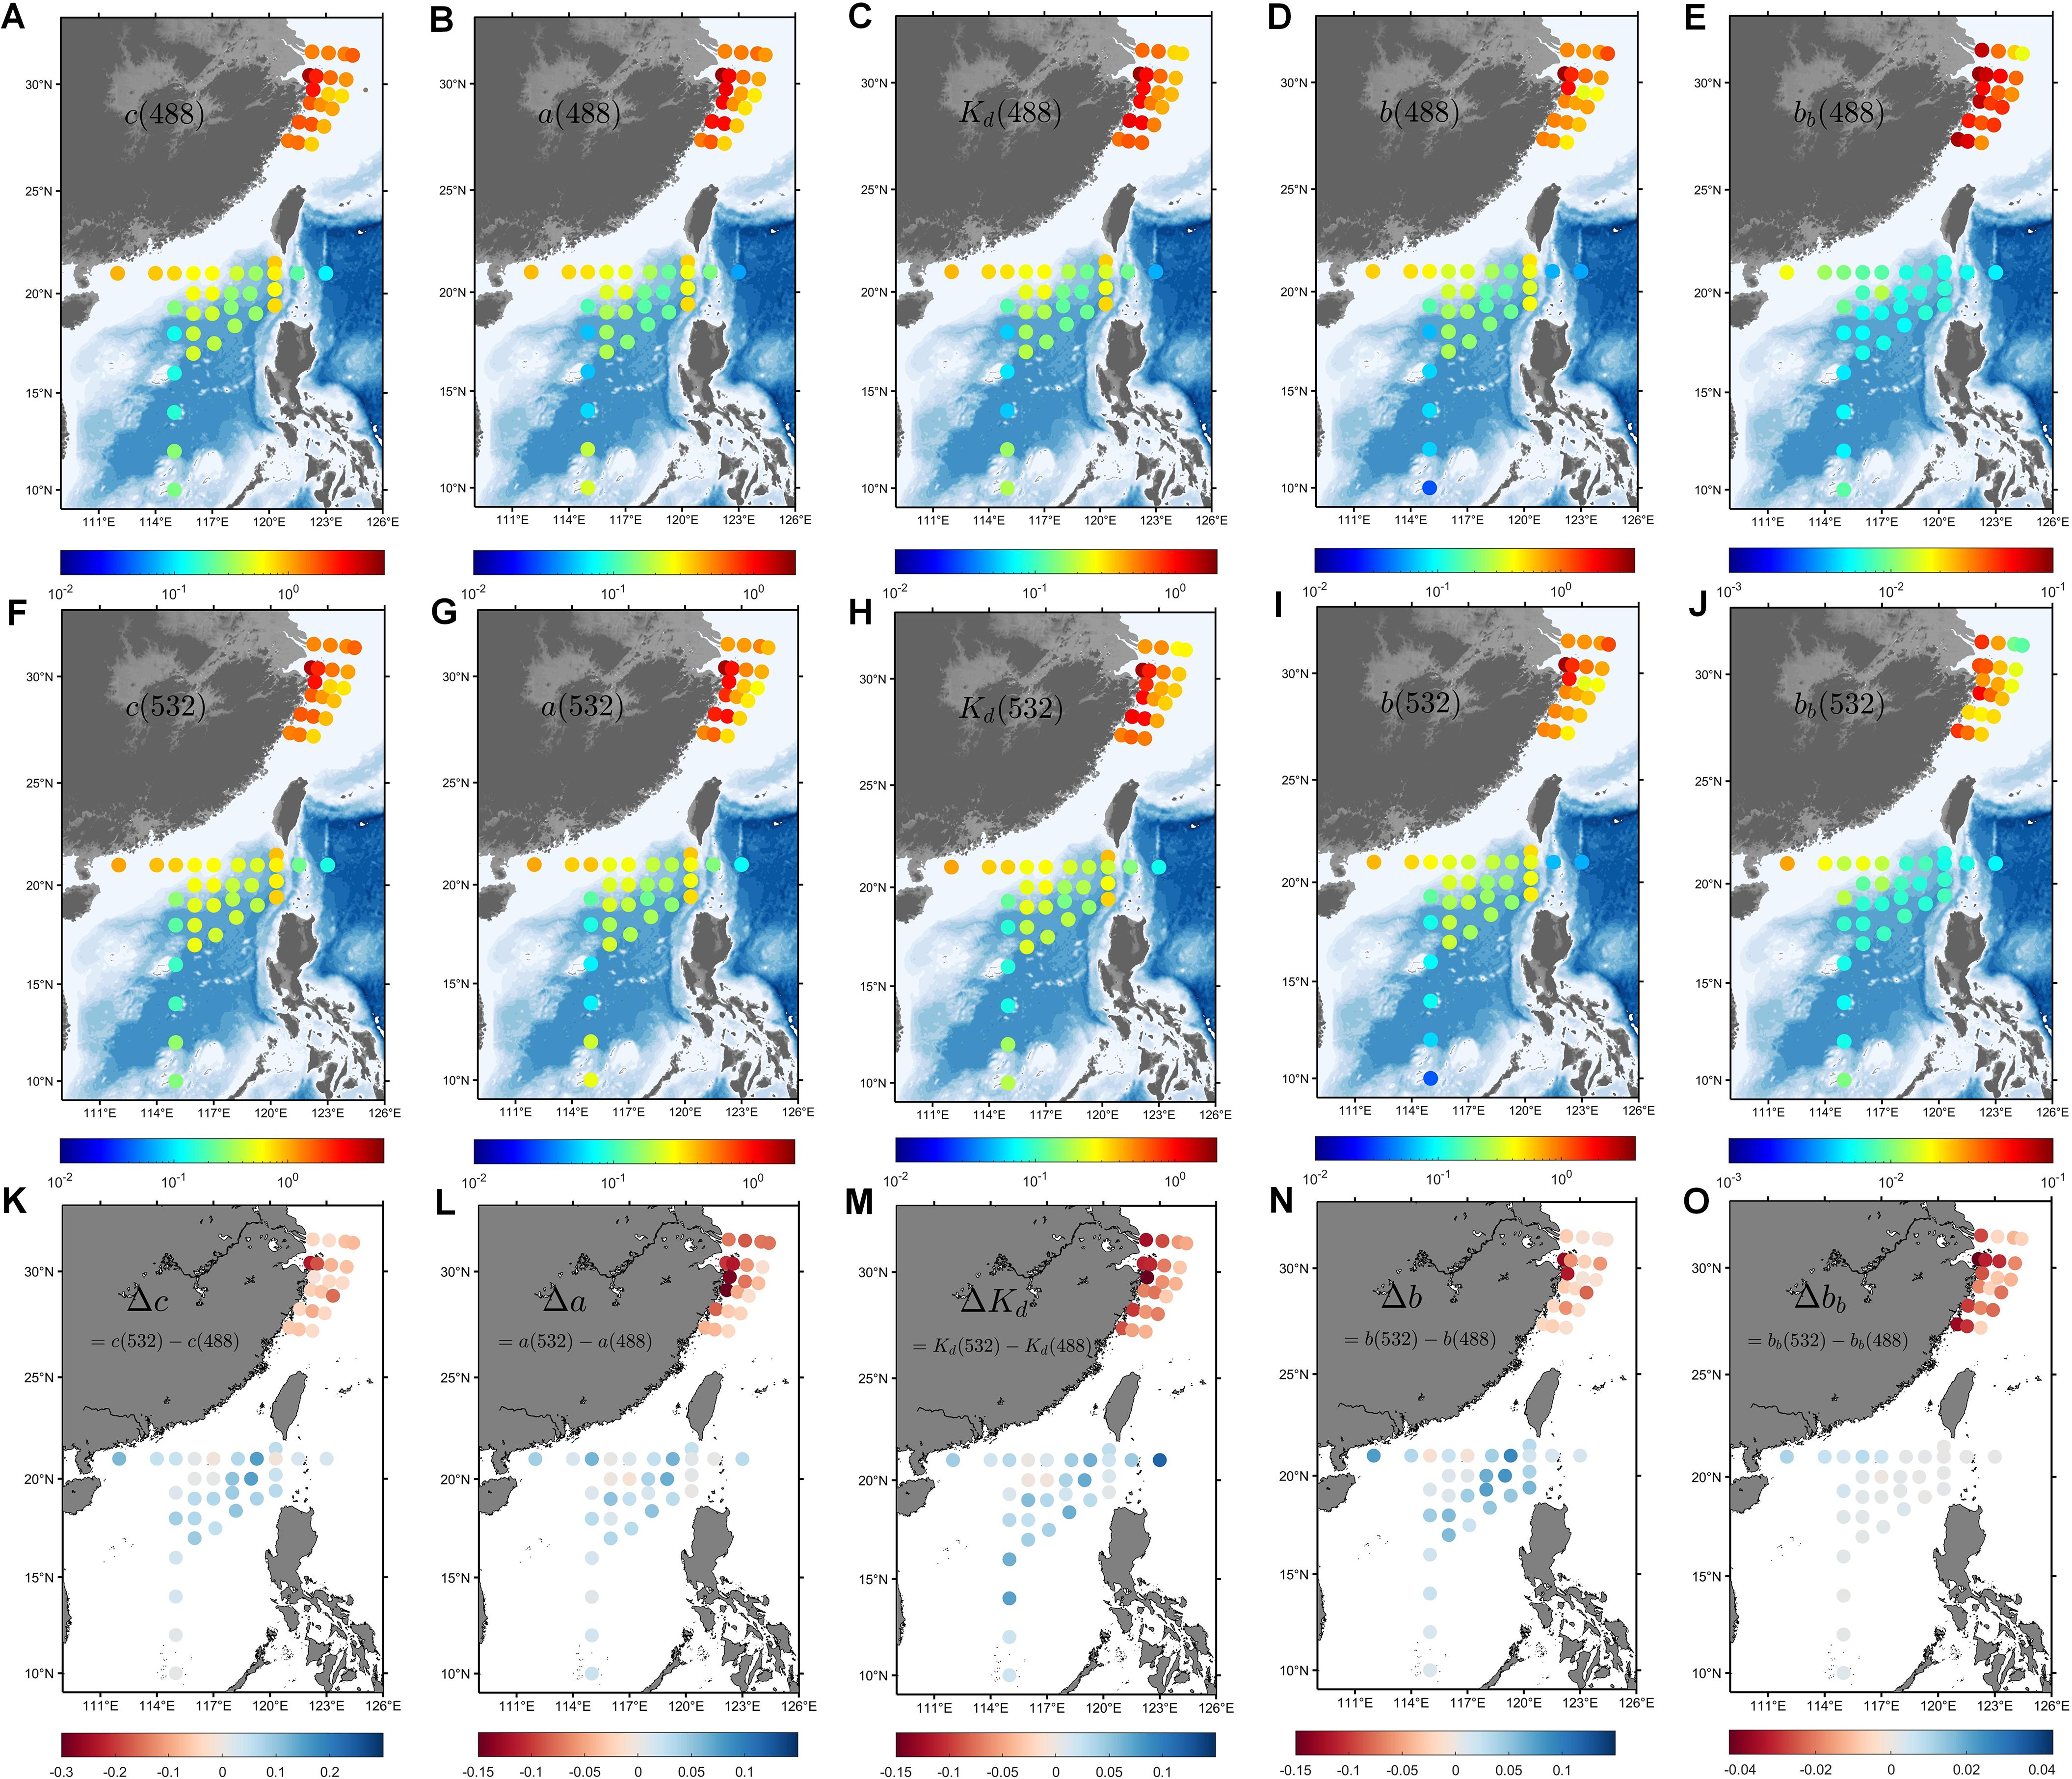
Figure 8. Distribution of common optical properties (OPs, including c, a, , b, and ) in the ECS and SCS. The first row (A–E) represents the OPs at 488 nm, the second row (F–J) represents those at 532 nm, and the third row (K–O) represents the difference between the two wavelengths, Δ(OPs) = OPs(532) − OPs(488).
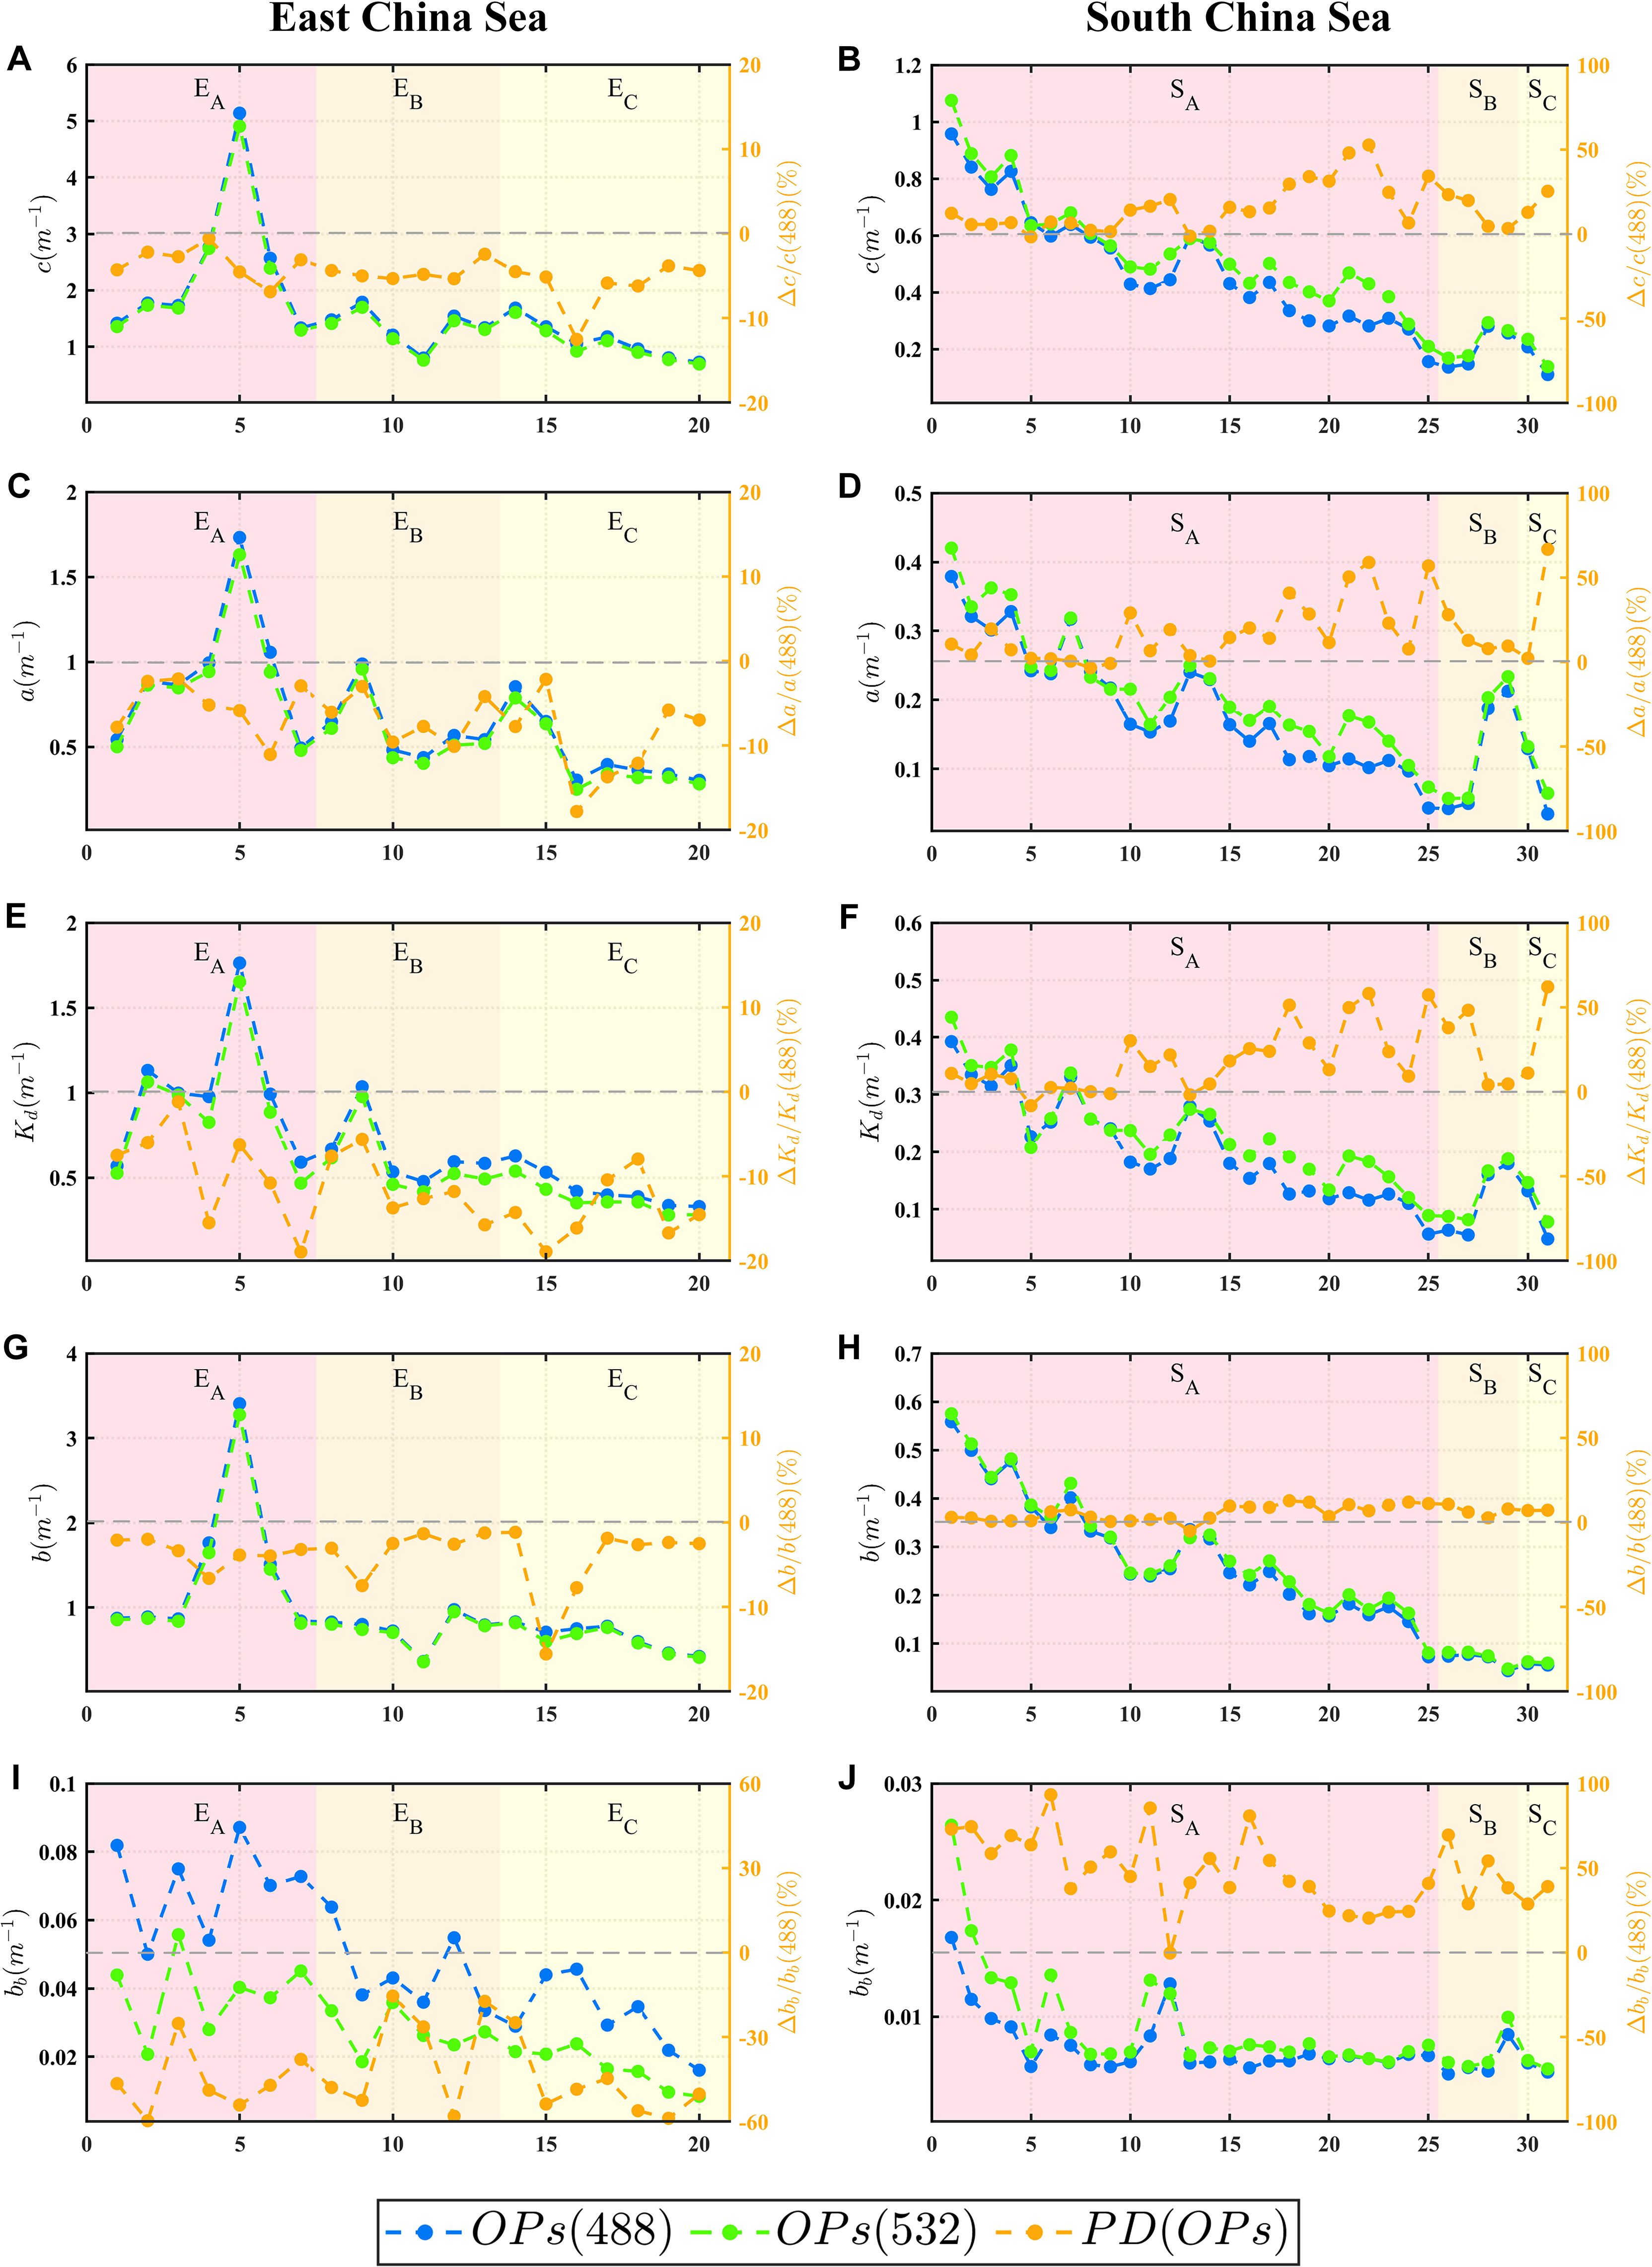
Figure 9. Comparison of OPs between 488 nm and 532 nm in the ECS and SCS , where c corresponds to (A, B), a to (C, D), Kd to (E, F), b to (G, H) and bb to (I, J). Blue and green lines represent the OPs at 488 nm and 532 nm, respectively. The orange lines represent the percentage difference (PD(OPs)) in different areas of the ECS and SCS, respectively. Note that PD(OPs) = 100 ∗ Δ(OPs)/OPs(488).
The ECS exhibited the typical characteristics of Case-II water, with high values of OPs (Figure 8). The range of c(532) was 0.82-4.91 m−1, with an average value of 2.13 m−1, whereas the values of c(488) varied within the range of 0.91-5.14 m−1, with an average of 2.35 m−1. It can be clearly seen that c(488) at each station was generally higher (8% higher on average) than c(532), and a, , and the scattering properties (including b and ) showed the same trend (Figure 9). Among these, a(488) was 8.4% higher than a(532), and the difference in was similar to that of a. The difference in between the two wavelengths was the largest, and the maximum value of (488) was nearly 60% higher than that of (532). The difference between b(488) and b(532) was the smallest, with an average of only 3%.
The SCS differs from the ECS in that it exhibits the characteristics of Case-I water in terms of the optical properties. The ranges for c(488) and c(532) in this region are 0.111 to 0.957 m−1 and 0.139 to 1.075 m−1, respectively, with average values of 0.56 m−1 and 0.61 m−1, which are significantly lower than those in the ECS (Figure 8). More importantly, in contrast to the results of the ECS, the c(488) values in the SCS were lower than c(532). In addition, this relationship between the two wavelengths can be observed for a, , b, and . By comparing the rates of change, it was found that , determined using Equation 22, had the greatest difference between the two wavelengths, and (532) was 21.3% higher than (488) on average. In comparison with , a played a decisive role in , and a(532) was 18% higher than a(488). The difference in the pure water absorption coefficient between the two wavelengths was the most important factor leading to the difference in the OPs between the different water types. In addition, in the SCS, the difference in b was observed to be the smallest, with an average difference of only 4.6%.
Overall, this study reveals from the perspective of as well as c and a that in the ECS, which represents Case-II waters in the coastal area, the OPs are generally higher than those in the SCS, which represents Case-I waters in the open ocean. On average, the values of c, a, and in the ECS were more than 25% higher than those in the SCS, which is consistent with the findings of other studies. Furthermore, by comparing the relationships between the OPs at different wavelengths in the ECS and SCS, it can be observed that among all OPs, the differences in c, a, and are similar and are predominantly governed by the variations in a. Although the relationship between b(488) and b(532) is consistent with that of the other OPs, the differences between them are minimal. From the perspective of the total energy transfer in light transmission, the transmission capability of light at 532 nm was superior to that at 488 nm in the ECS, whereas the opposite was true in the SCS, where the transmission capability of light at 488 nm was superior. This is in line with the results of the previous studies by Zhang et al. (2022) and Li et al. (2022), where the most suitable wavelength for oceanic LIDAR applications was assessed.
3.3 and
Different results can be obtained from the perspective of the VSF when discussing the underwater light transmission capability. As shown in Figure 10, the g values of the SCS and ECS were calculated based on the dual-wavelength VSFs. The g values of all measurement stations exceeded 0.85, which is similar to the results calculated by the VSFs measured by Petzold (1972). In contrast to the OPs, the g at different wavelengths showed the same magnitude relationship in different areas of the sea, that is, g(532) consistently exhibited higher values than g(488). A higher g value generally represents a stronger proportion of forward scattering.
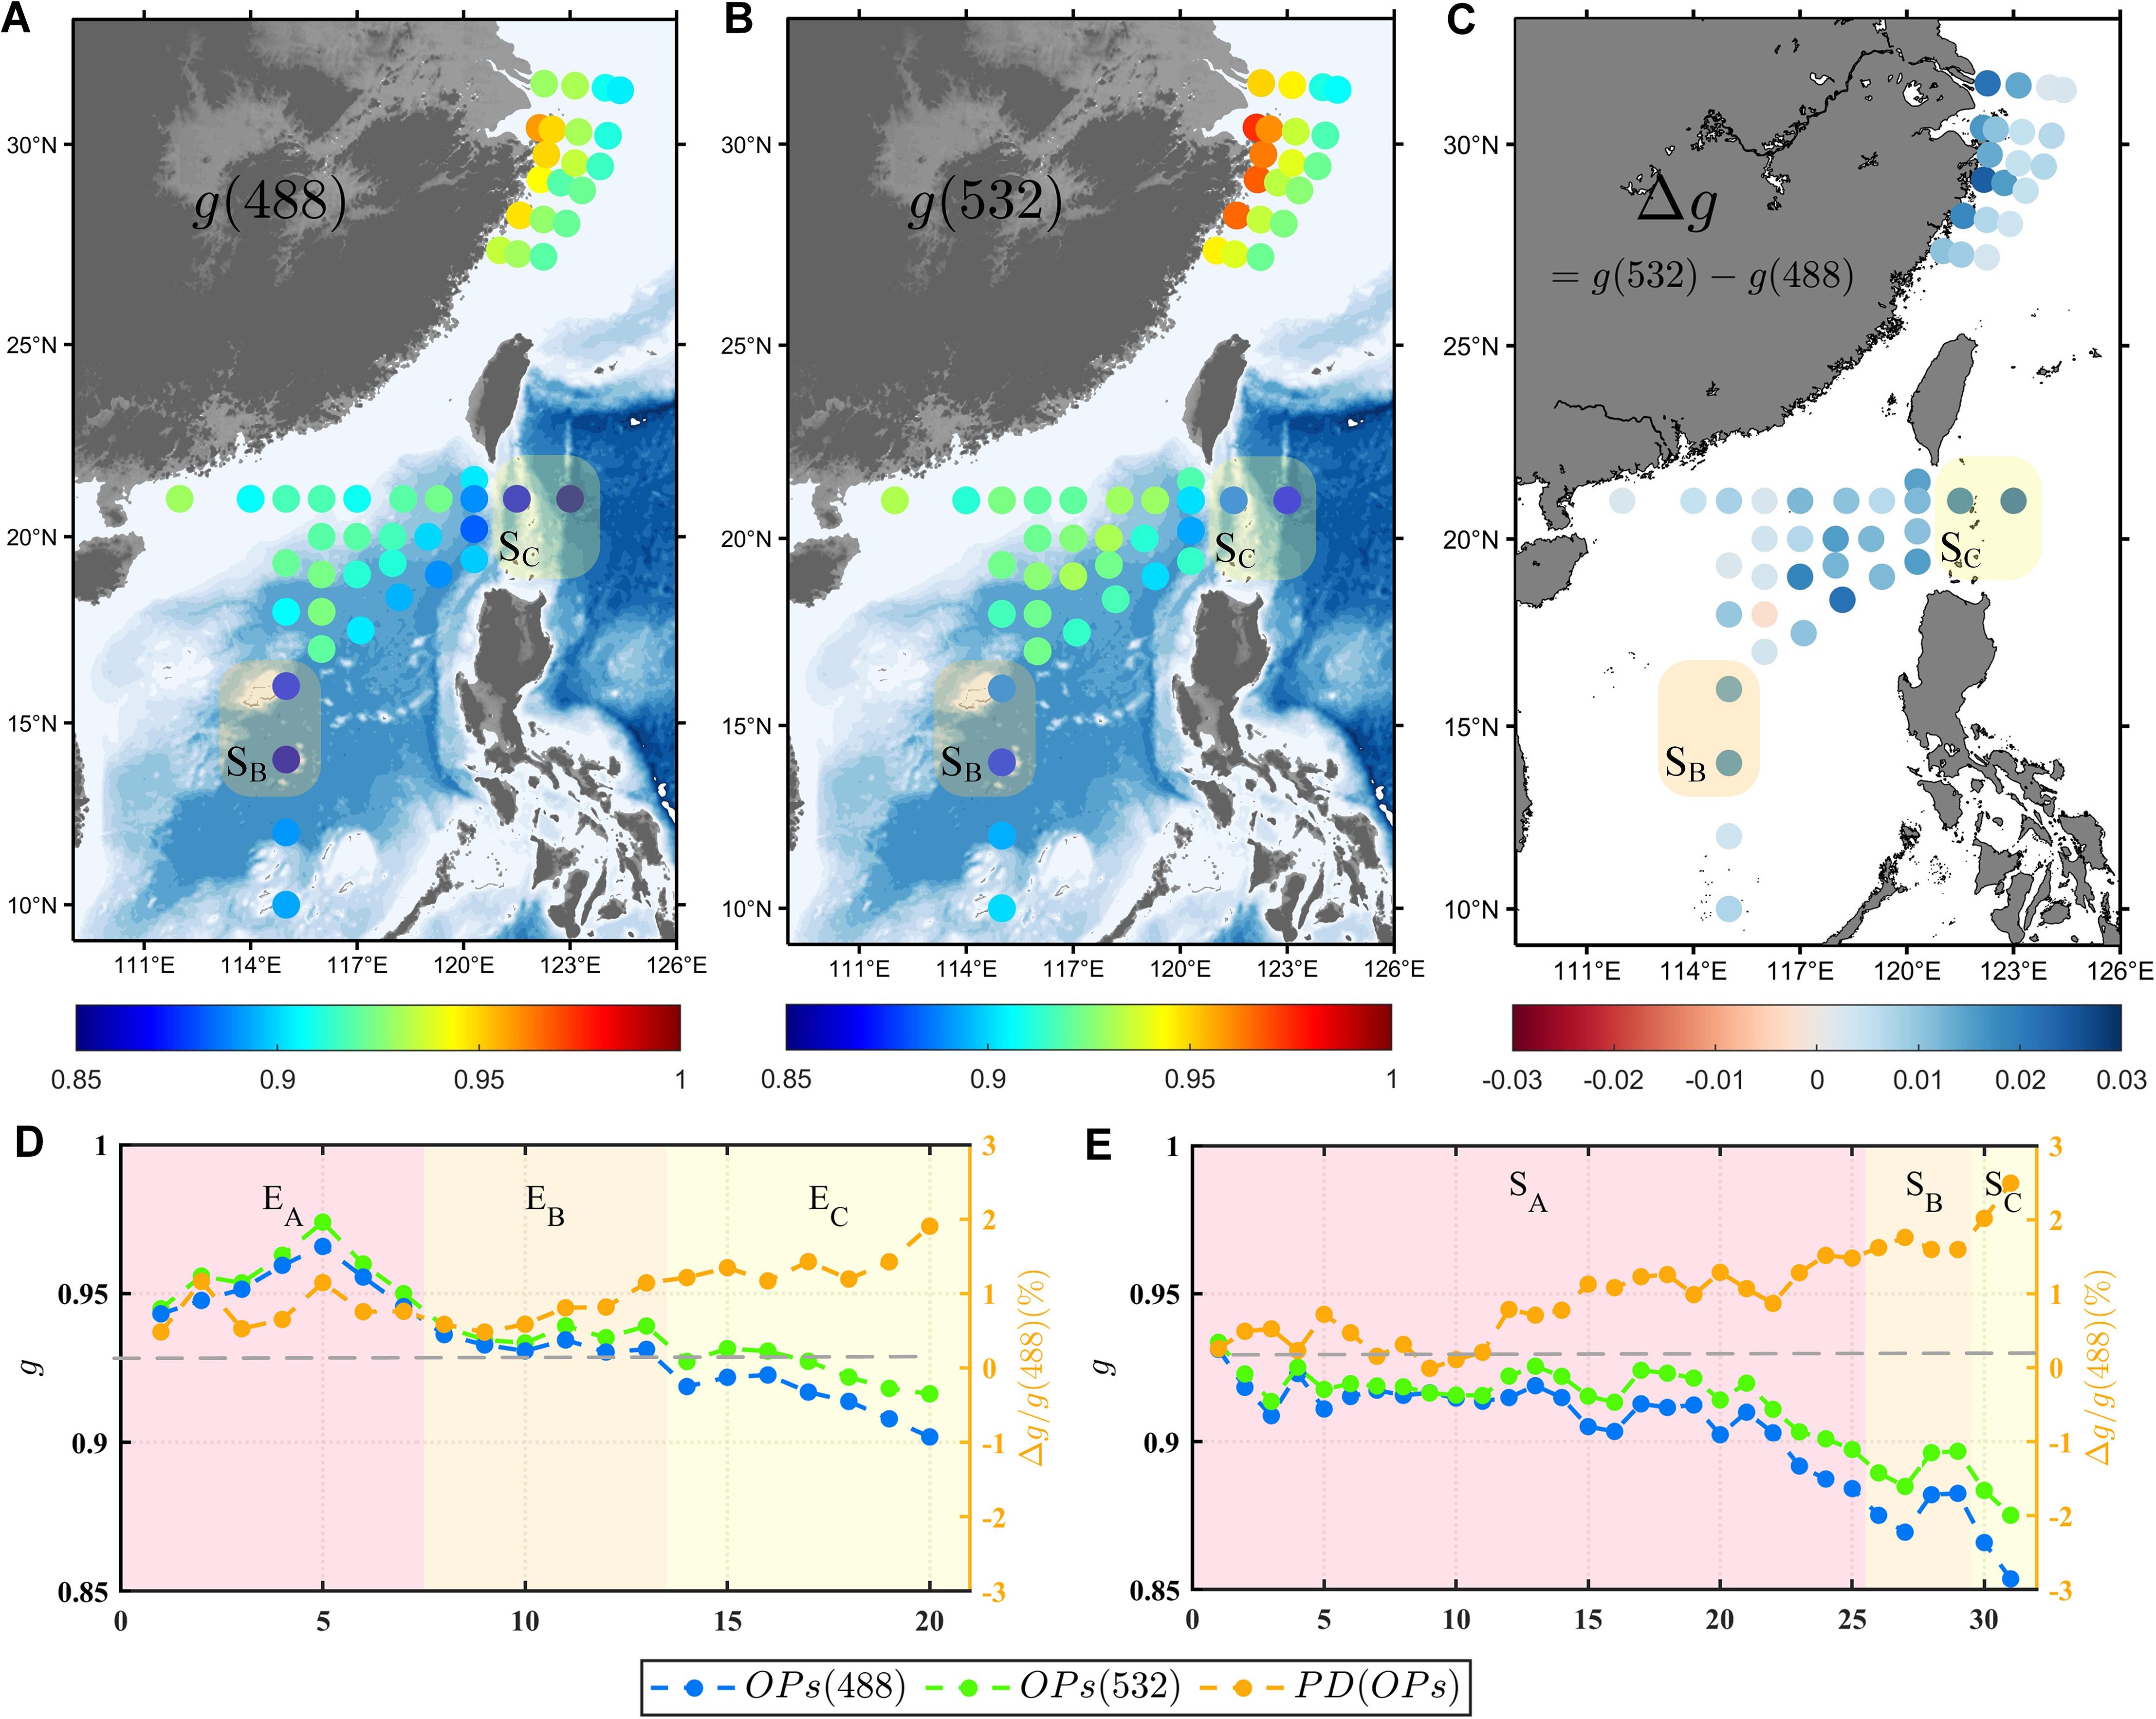
Figure 10. Distribution of g at (A) 488 nm and (B) 532 nm in ECS and SCS. (C) Difference between g(532) and g(488), Δ(g) = g(532)−g(488). (D, E) Values of g(488) (blue line), g(532) (green line) and PD(g) (orange line) in different areas of ECS and SCS. Note that PD(g) = 100 ∗ Δ(g)/g(488).
In the ECS, the g values were generally greater than 0.9. Specifically, the range of g(488) was from 0.902 to 0.966, whereas g(532) ranged from 0.916 to 0.974, with g(532) being, on average, 1.1% higher than g(488). According to Equation 13, it can be observed that the disparity in arises from the combined influence of b and g. Due to the fact that g has a value close to 1 in natural water, even slight variations in g can have a significant “amplification effect” on changes in . A 1% difference between the two wavelengths could potentially lead to a variation of over 10% in (Wu et al., 2022b). In addition, the maximum values of g(488) and g(532) occurred in the . As the water depth increased, the g value gradually decreased, reaching its minimum in the . In the SCS, g(532) was higher than g(488), and the trend of the OPs at the two wavelengths were always consistent with those in the ECS. Specifically, g(488) in the SCS ranged from 0.861 to 0.932 with an average of 0.90, whereas g(532) varied between 0.874 and 0.935 with an average of 0.92. It should be noted that in regions with the cleanest water, such as east of the Luzon Strait and basin of the southern SCS , where c was less than 0.2, g was significantly lower than that in . In , g reached its minimum value, with g(488) at 0.861 and g(532) at 0.879. Moreover, the difference between g(532) and g(488) in this area reached up to 2.7% based on the PD, which was significantly higher than that in the other areas (1.2% higher on average).
Furthermore, in fields such as underwater imaging and communication, optical detection capabilities are generally described in terms of the distance (measured in meters). Therefore, in addition to obtaining by calculating of b and g, this study presents a detection distance evaluation index based on the attenuation length (AL), denoted as or (Jaffe, 2015; Li et al., 2023). Figures 11 and 12 present the results for the dual-wavelength , , and , as well as the differences in these optical properties between the two wavelengths. In the ECS, both (488) and (532) gradually increased from the nearshore area to the offshore area . Specifically, (532) varied from a minimum of 5.2 m to a peak of 29.4 m, whereas (488) ranged between 3.8 m and 25 m. It was observed that (532) was always higher than (488), and the same conclusion could be drawn from the perspective of the AL. (488) and (532) varied from 0.28 m to 1.4 m, with (532) being on average 5.2% higher than (488). (532) was also higher than (488), with (532) ranging from 0.59 m to 3.2 m and (488) ranging from 0.58 m to 2.9 m. The maximum variation could reach up to 28%.
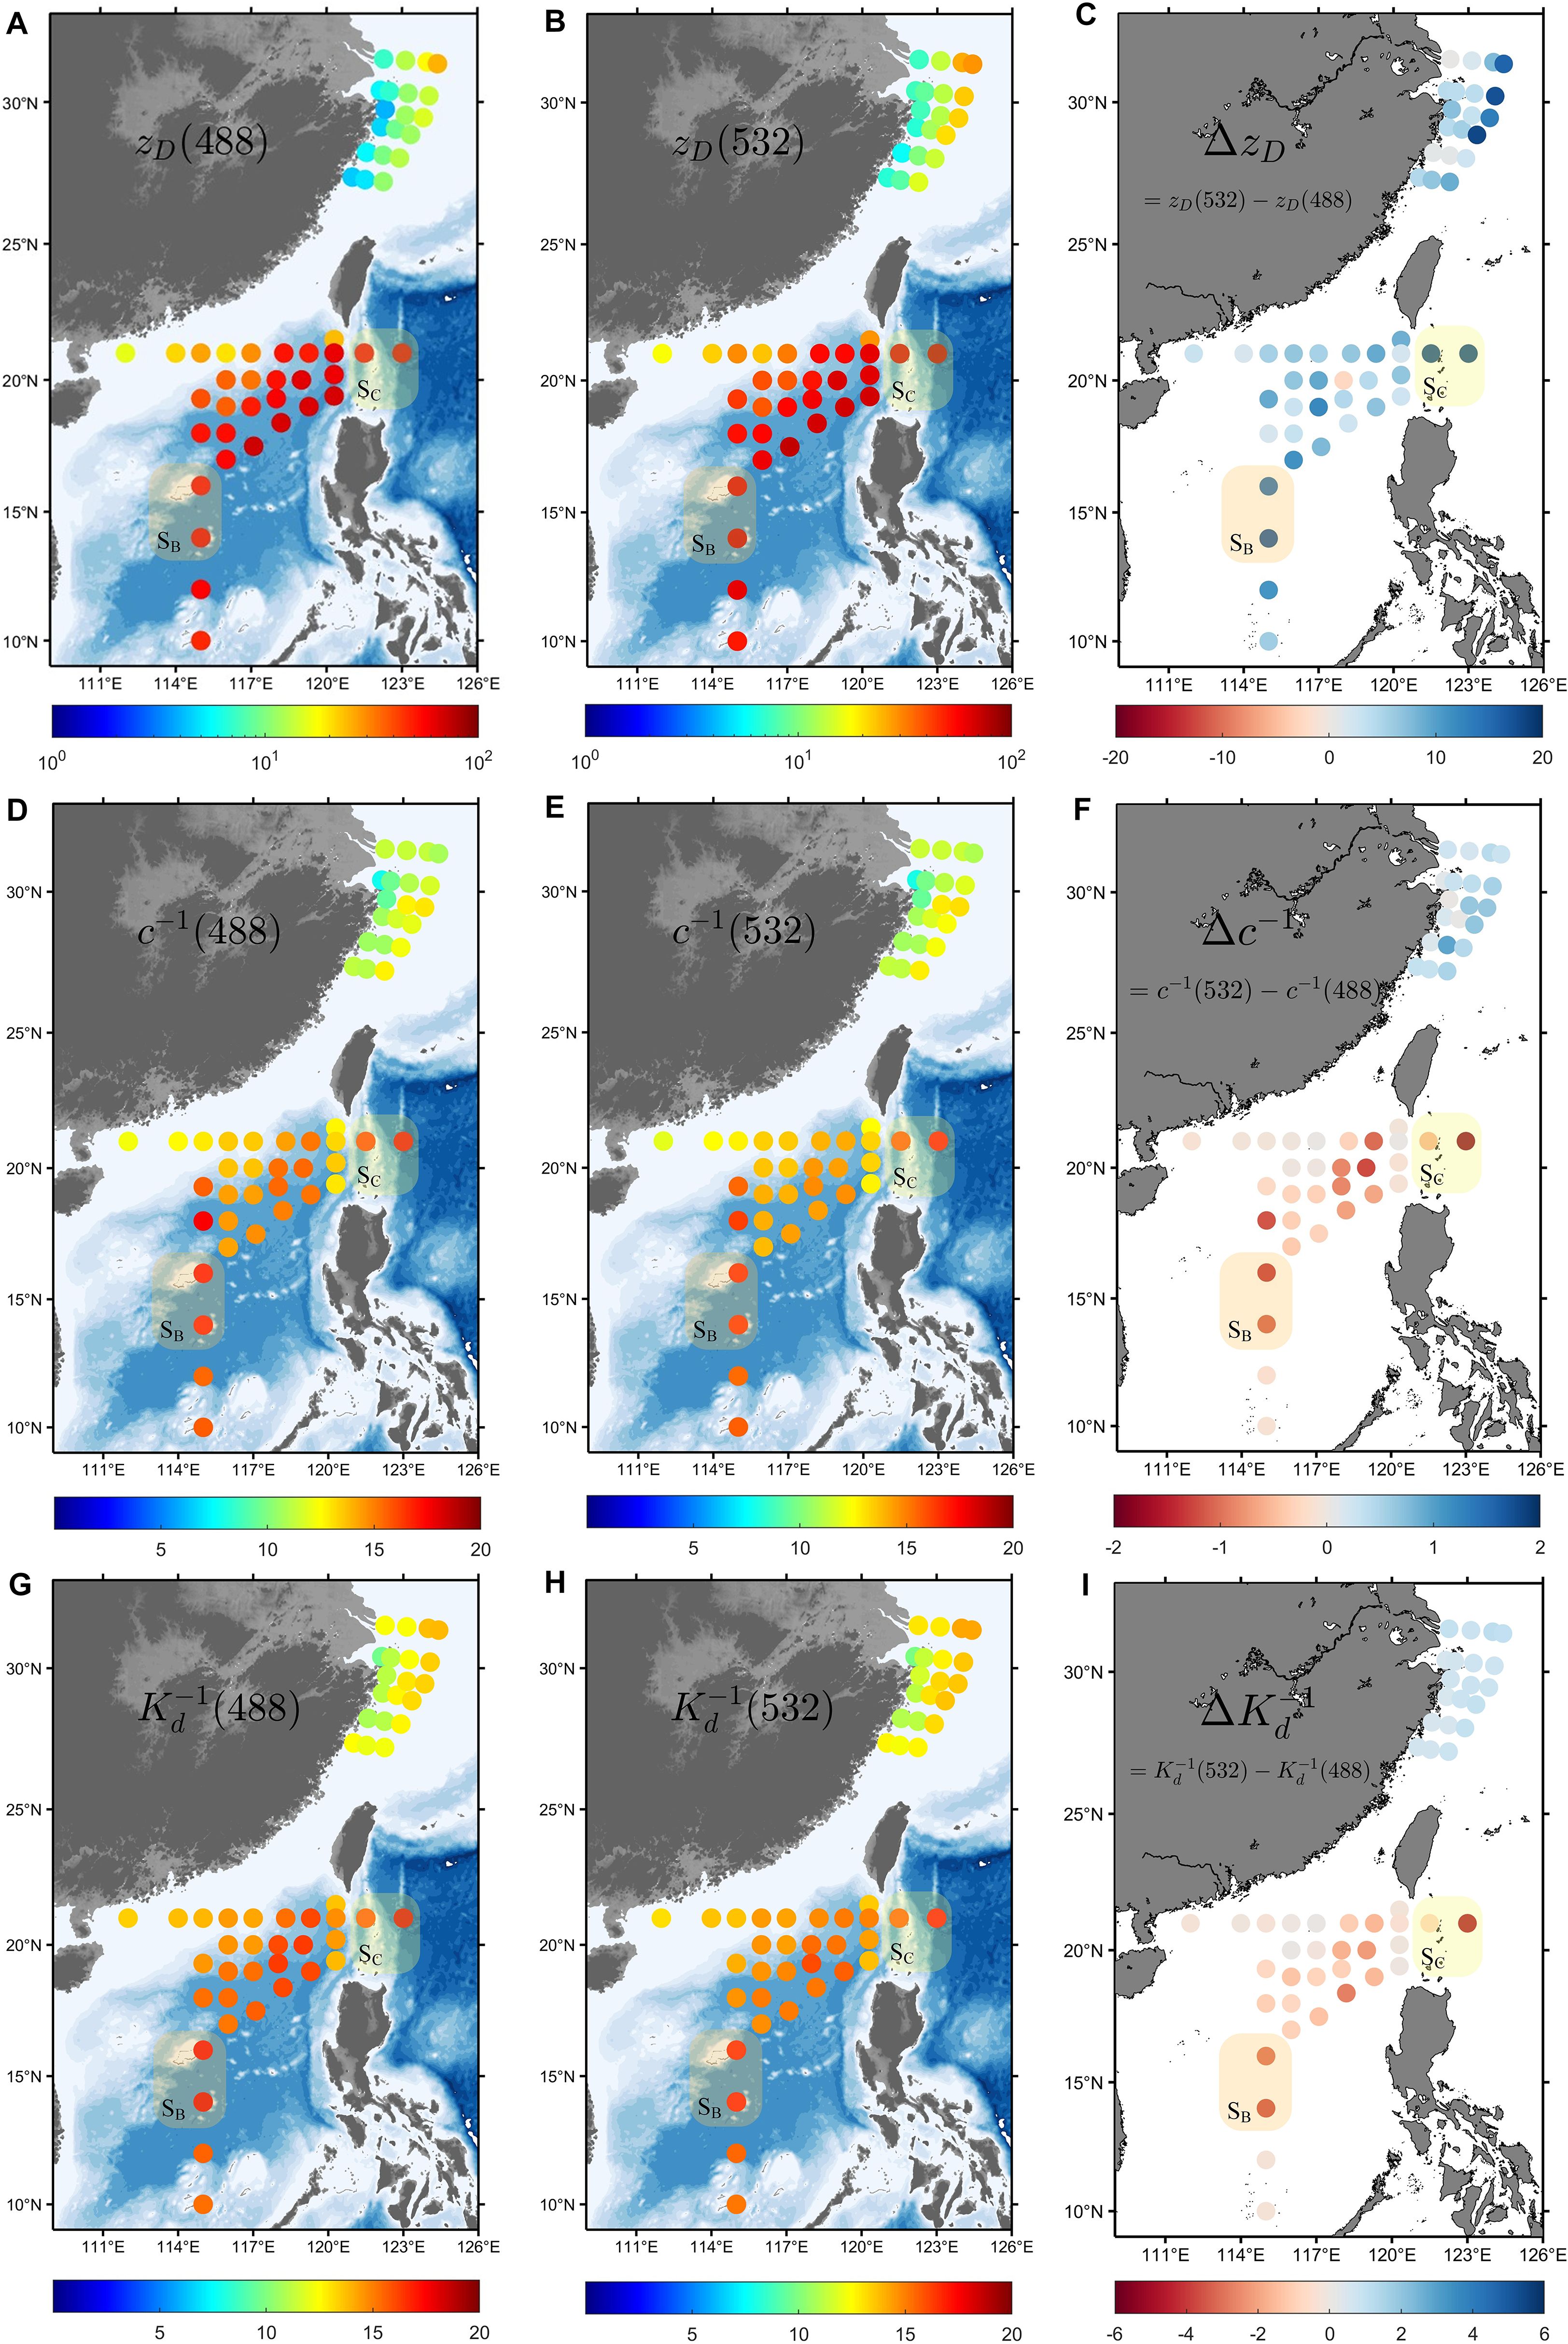
Figure 11. (A, B) Distribution of (488) and (532) in ECS and SCS. (C) Difference between (532) and (488), = (532) − (488). (D–F) Distribution of (488), (532), and their difference . (G–I) Distribution of (488), (532), and their difference .
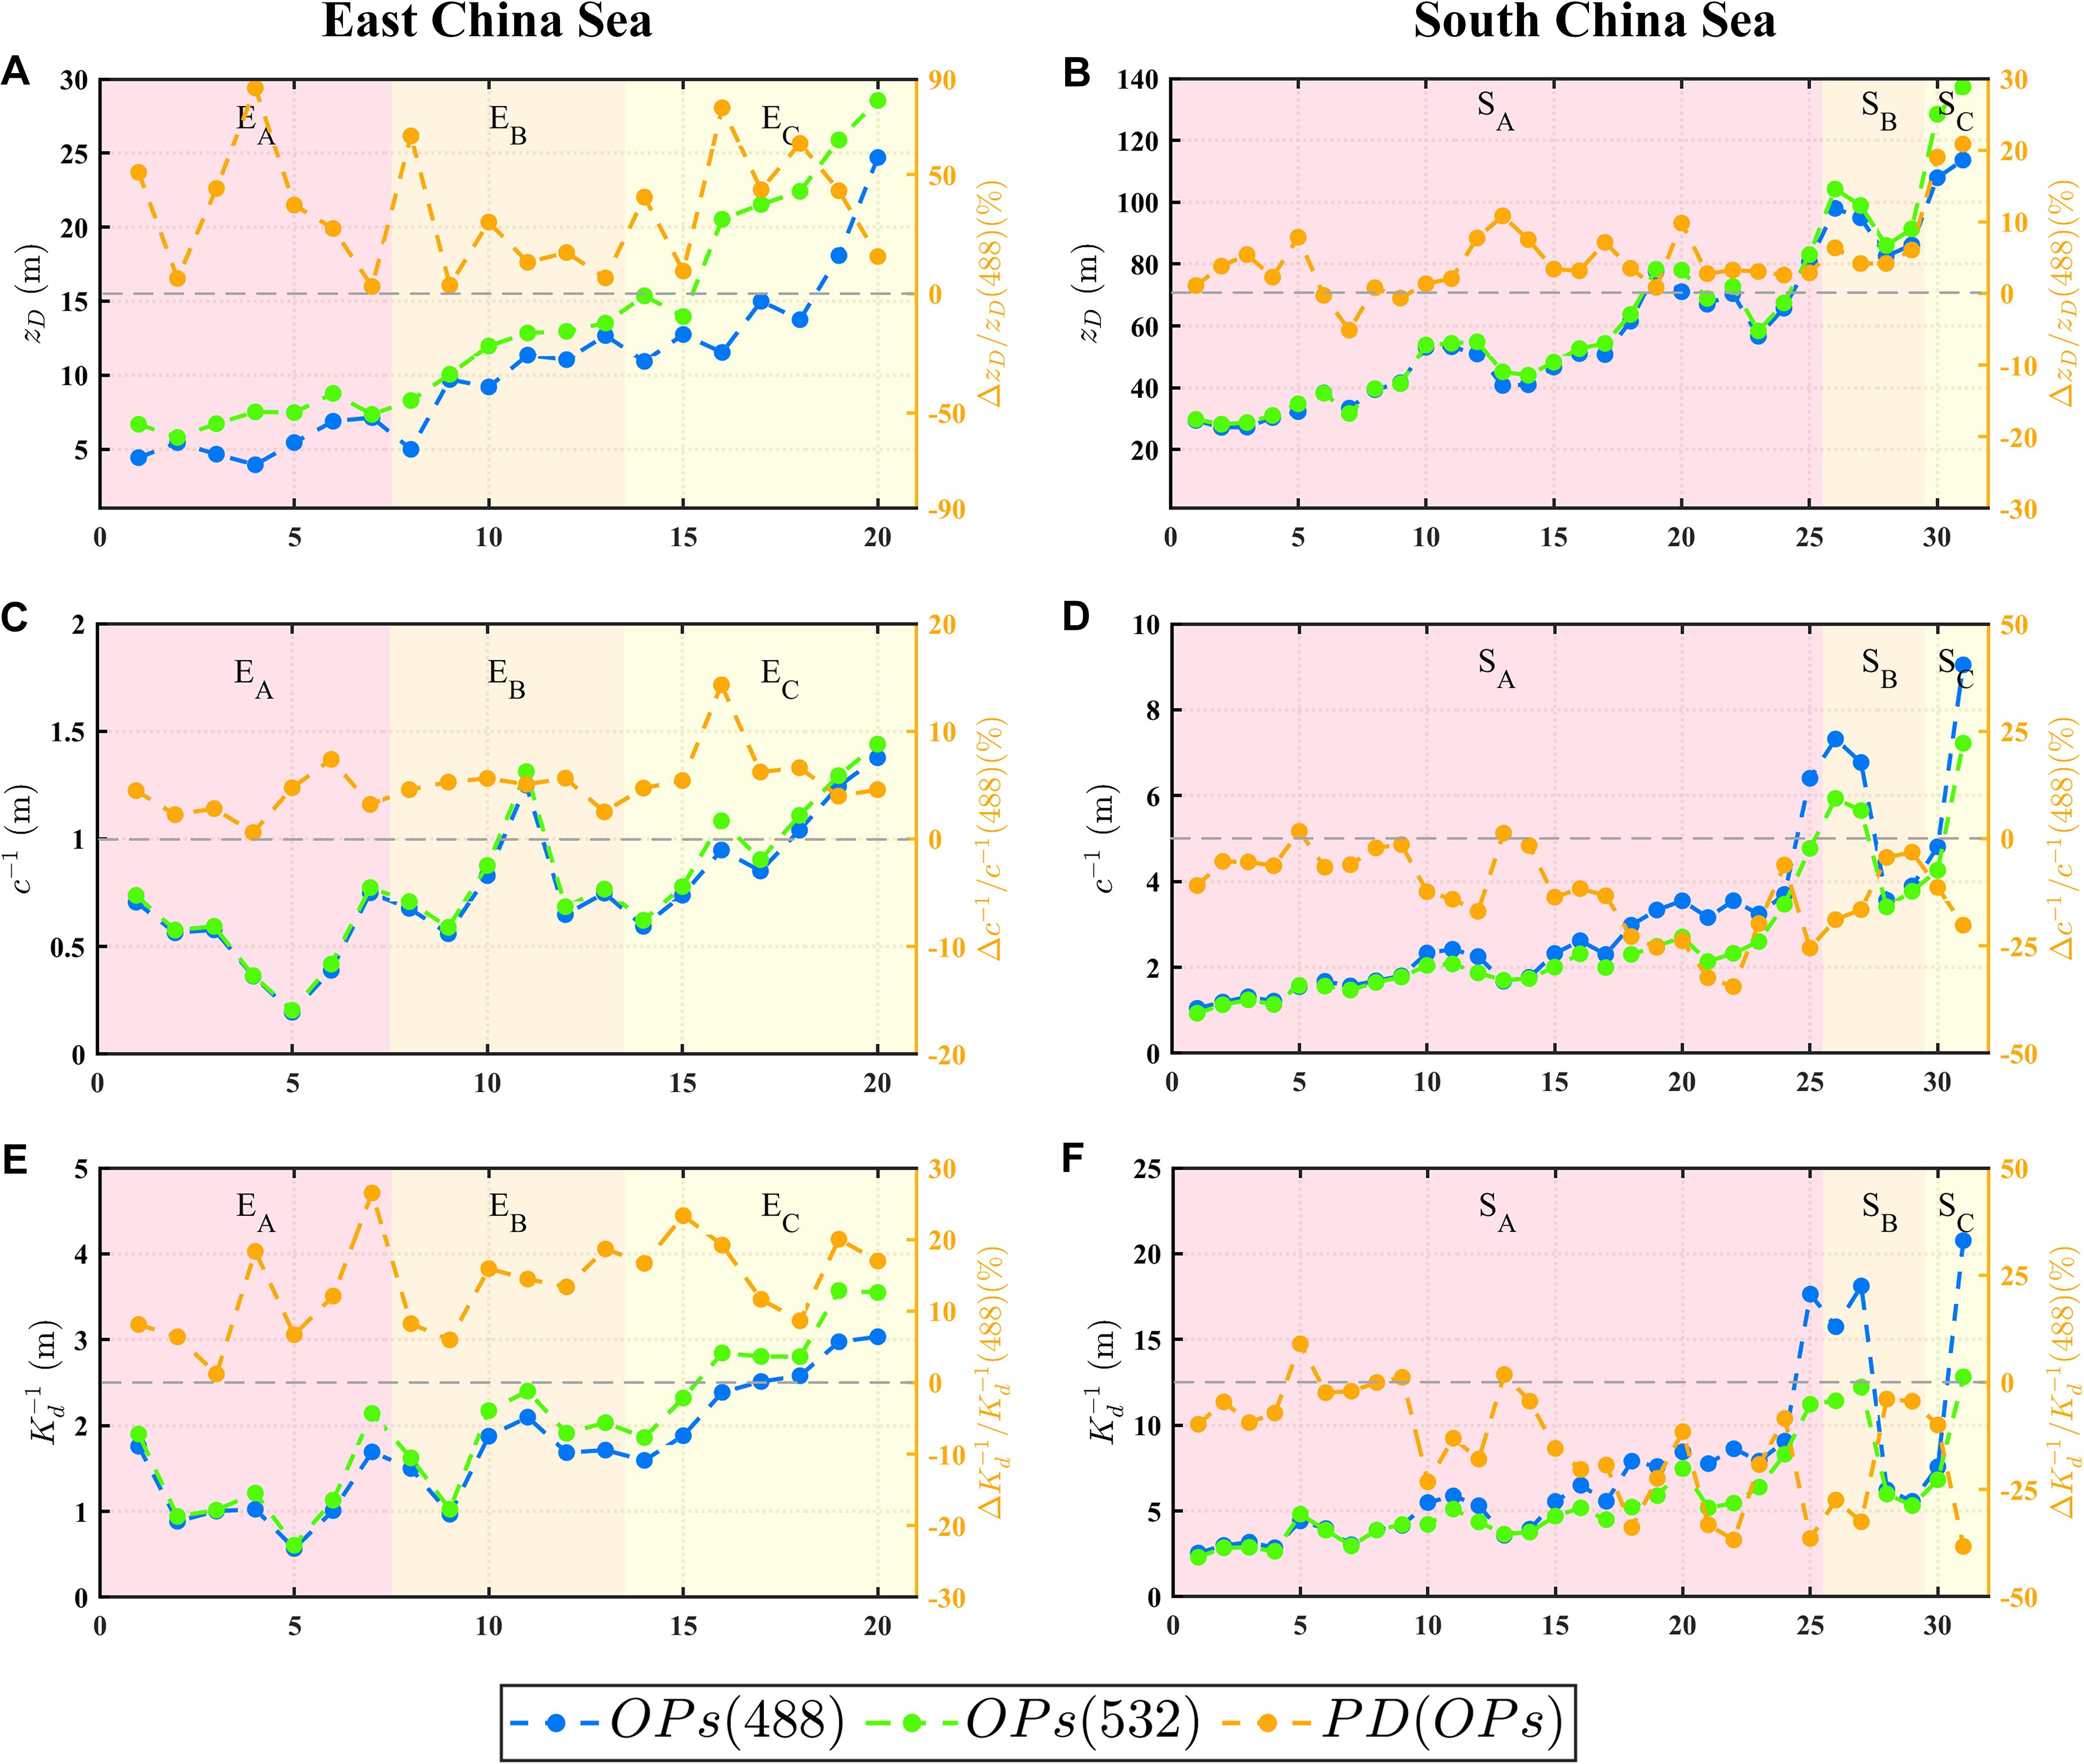
Figure 12. Comparison of (A, B), (C, D), and (E, F) between 488 nm and 532 nm in the ECS and SCS. Blue lines represent the changes in the values at 488 nm, green lines represent the changes at 532 nm, and orange lines represent the PD between different wavelengths. Note that ; and are similarly calculated.
However, different results were observed in the SCS. The main difference was that (532) remained higher than (488), which was contrary to the conclusions drawn from and . (532) varied between 28.2 m and 137.3 m, whereas (488) ranged from 27.1 m to 113.6 m, both reaching the maximum in , with (532) being on average 9.8% higher than (488). In particular, in areas with clear water, such as and , (532) was approximately 20% higher than (488). This leads to the inference that in clear water areas, the average free path of photons scattered at 532 nm was greater than that at 488 nm. This indicates that light at 532 nm can travel longer distances from the perspective of scattering. Moreover, according to the conclusion in Section 3.2, the difference in b between the two wavelengths was the smallest in the SCS. Therefore, the difference in was mainly caused by g(532) being greater than g(488). From the perspective of AL, (488) was higher than (532) and showed the same relationship between the two wavelengths. Their respective ranges were 1.28 m to 9.31 m, 1.19 m to 7.63 m, 2.38 m to 22.1 m, and 2.3 m to 12.1 m, with the average values of (488) and (488) being 10% and 12% higher than those of (532) and (532), respectively. This can be considered the most significant finding of this study, that is, in the SCS, which is a representative clean water area highly suitable for underwater optical applications, different conclusions can be drawn when comparing the underwater transmission capabilities of 532 nm and 488 nm light from the perspectives of VSF and energy. However, this does not mean that previous assessments based on and are incorrect, but rather that the evaluation method based on the properties of VSF or supplements the approach adopted in previous studies.
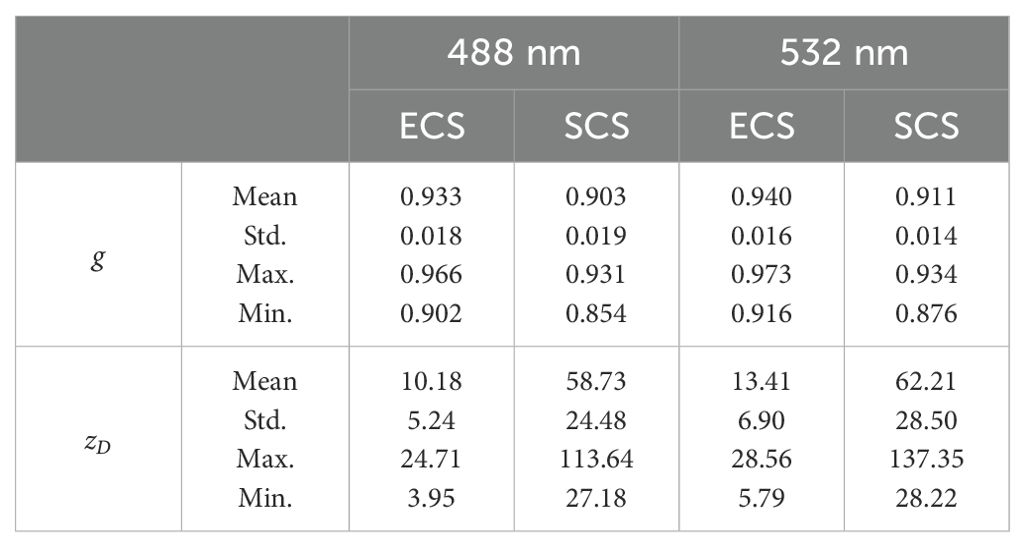
Further analysis of the VSF characteristics revealed differences between different sea areas, which likely reflected the variations in the particle type. Figure 13A illustrates the relationship between g(488) and g(532) in the ECS and the SCS. It can be observed that all values are above the 1:1 line, indicating that g(532) is higher than g(488). Notably, the values of g in the ECS were higher than those in the SCS. Interestingly, there was a linear correlation between g(488) and g(532); however, the slopes of the fitted lines for these two areas were different, which may be related to variations in the particle type (Slade et al., 2011; Koestner et al., 2020). The particle size is different in various seawater constituents (Stramski et al., 2004). Sun et al. (2019) found that the ECS is dominated by algae particles (micro) with a maximum particle size of approximately 147 µm, whereas particles in the SCS ranged from 11.6 to 49.9 µm (Zhou et al., 2022). It can be seen that the particle size in the ECS is larger than that in the SCS. Table 4 presents the statistical values of g at different wavelengths in the ECS and the SCS. It is clear that the values of g in the ECS are higher than those in the SCS. In addition, using 532 nm as an example, the maximum value of g(532) in the SCS was 0.934, which was lower than the average value of g(532) in the ECS. This is consistent with the understanding that the larger the particle, the stronger is the forward scattering, as the magnitude of g is mainly determined by the forward VSF.
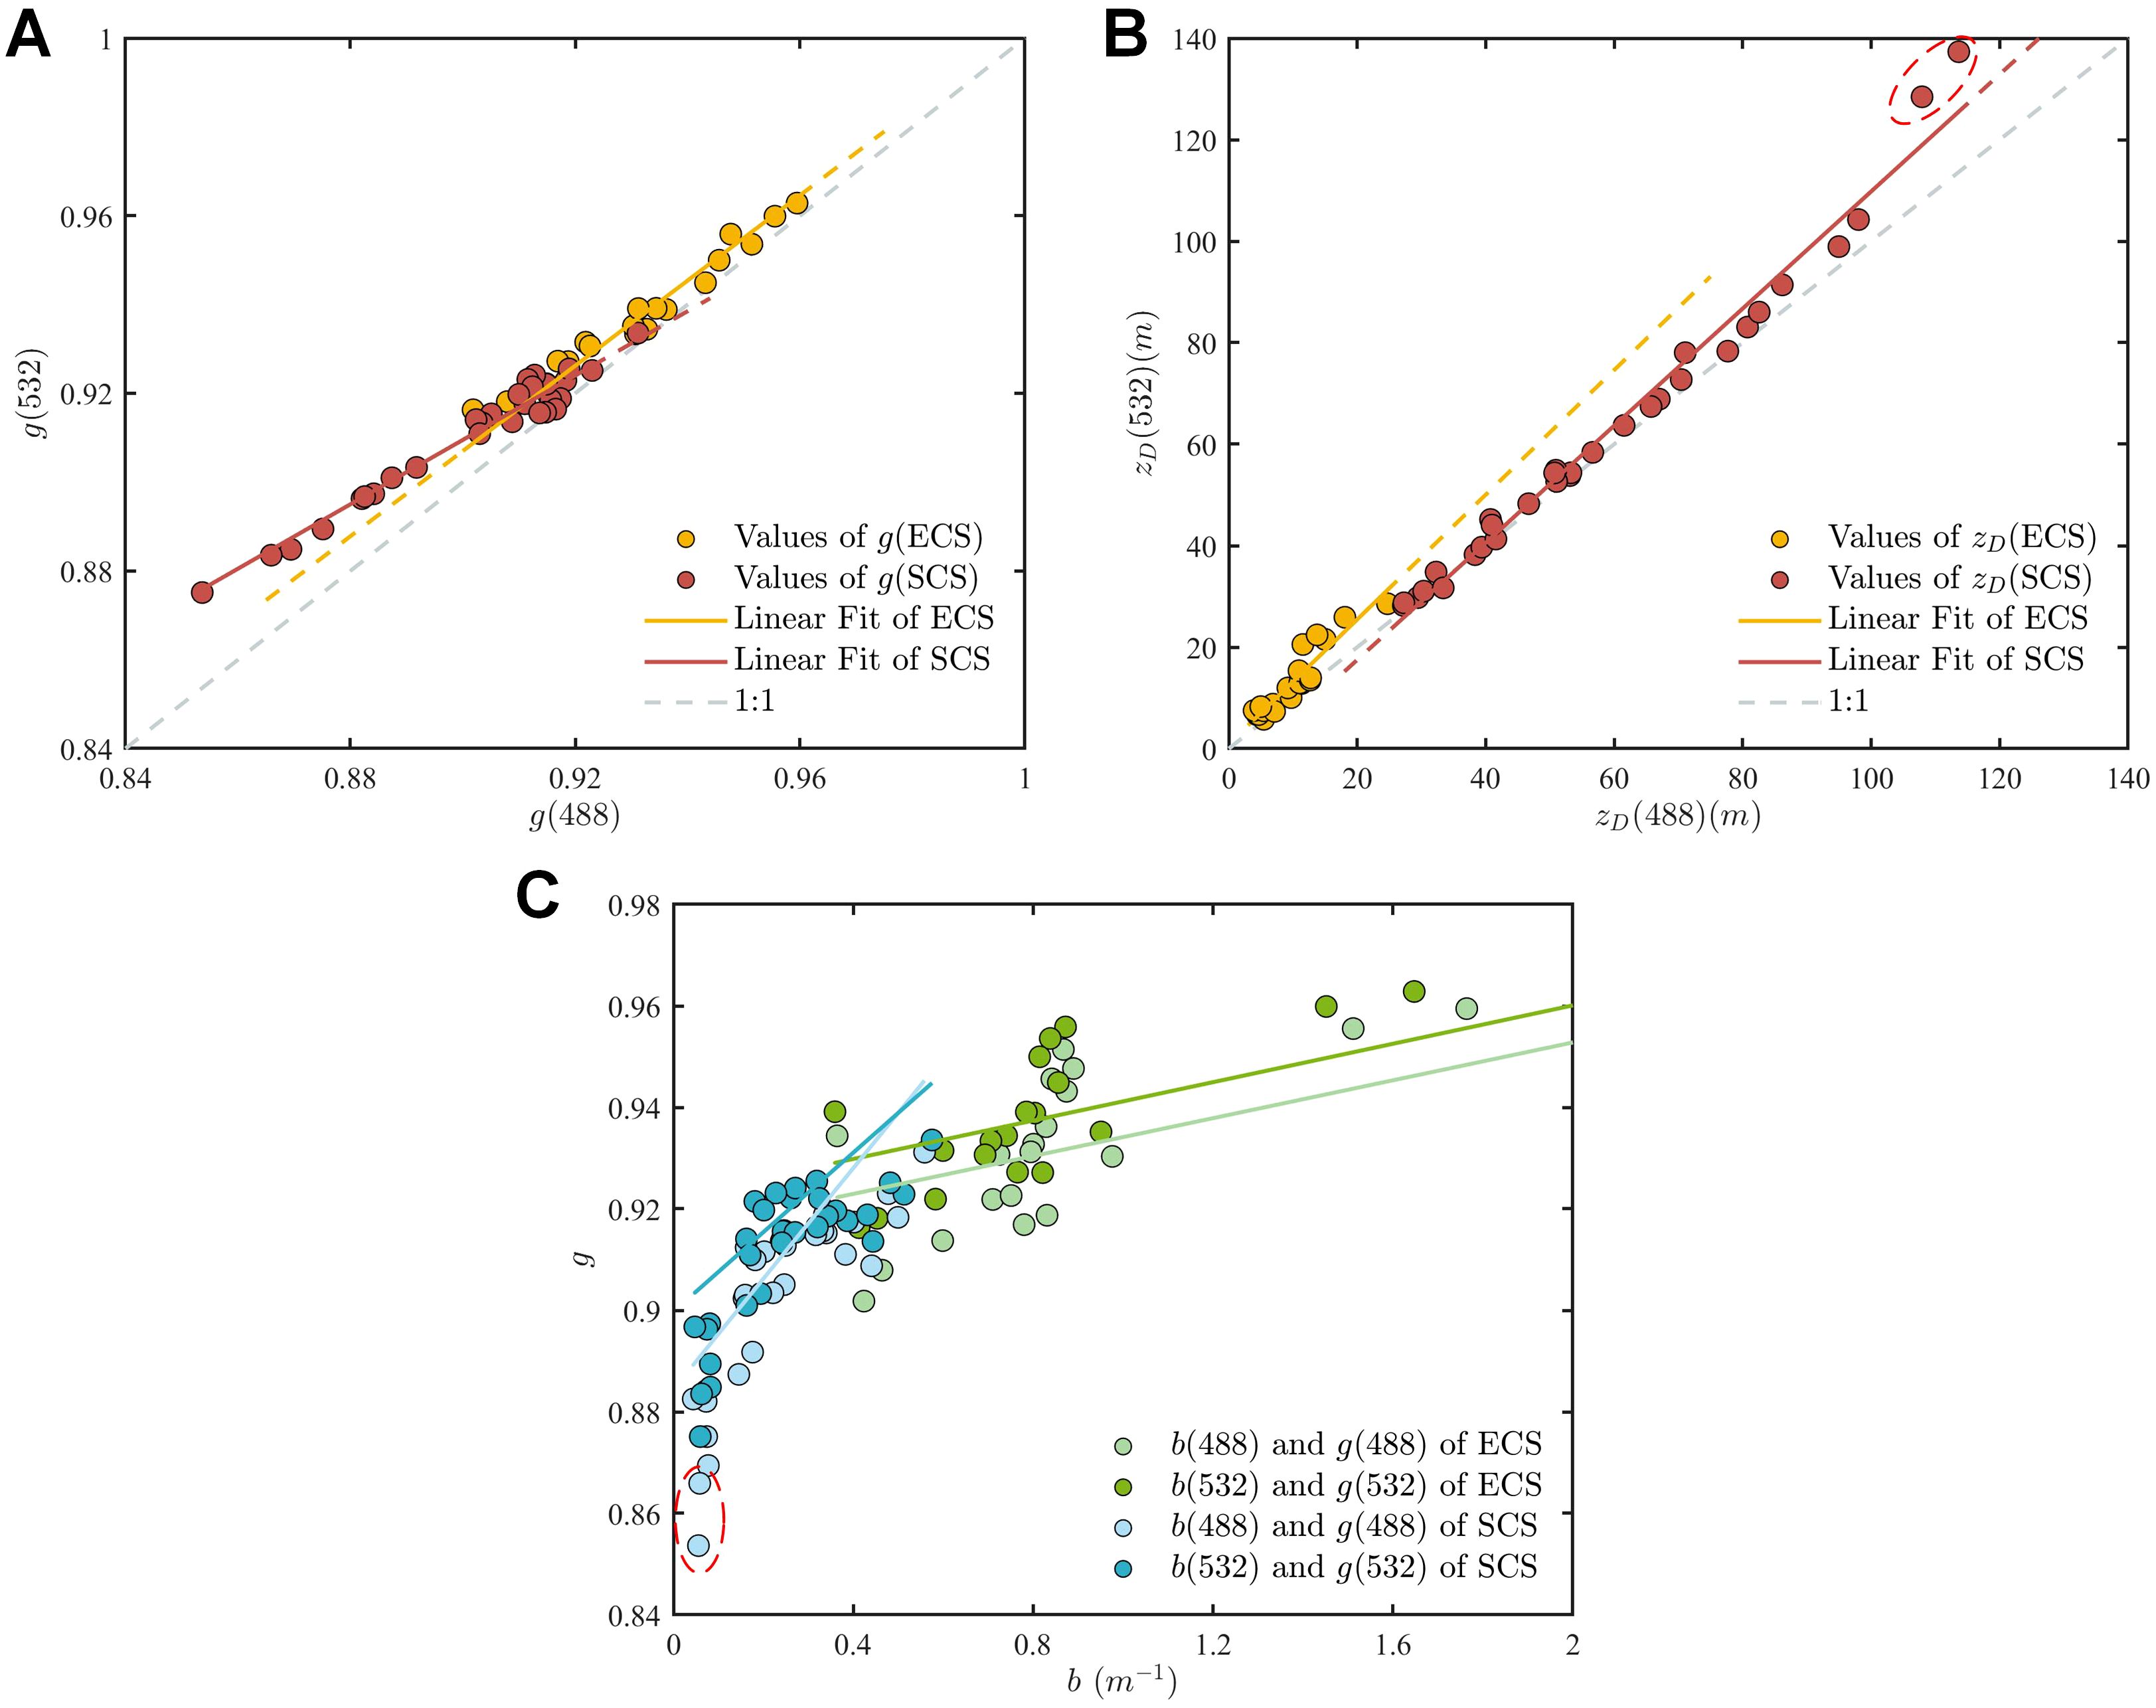
Figure 13. (A, B) Relationship between g(488) and g(532) and between (488) and (532). The orange dots represent the values of g and at 488 nm and 532 nm in the ECS, whereas the red dots represent these values in the SCS. The corresponding solid orange lines refer to the linear fit between g(488) and g(532) as well as between (488) and (532) in the ECS, whereas the red lines represent those in the SCS. The dotted gray lines represent the 1:1 lines. (C) Relationship between b and g at 488 nm and 532 nm in different areas. The blue dots represent the values of b and g in the SCS, whereas the green dots represent those in the ECS. The corresponding solid blue lines refer to the linear fit between b and g in the SCS whereas the green lines represent those in the ECS.
Figure 13B shows the relationship between (488) and (532) for the two sea areas. It can also be seen that in both the SCS and the ECS, the slope of the fitted line was greater than 1, which means (532) was higher than (488). In contrast to g, the value of in the SCS was significantly higher than that in the ECS. Table 4 lists the statistical results of . It can be seen that the average value of in the SCS was approximately four times higher than that in the ECS, and the maximum value of in the ECS was only close to the minimum value of in the SCS. Although the values of g are higher in the ECS, the analysis in Section 3.2 shows that b is generally higher than that in the SCS. This indicates the greater complexity of the particles in the ECS and increased particle concentration of Case-II water when compared with that of Case-I water, resulting in of the ECS being much smaller than that of the SCS. At the same time, it can be found that the distribution range of in the ECS is smaller than that in the SCS, which is caused by the different ranges of variation of b and g in different areas.
Figure 13C shows the relationship between b and g at the same wavelength in different sea areas. In general, g tends to decrease as b decreases. Taking 488 nm as an example, the range of variation of b in the SCS is small (0.03 to 0.57), whereas the variation in g is large (0.85 to 0.93). However, the distribution range of b in the ECS is from 0.5 to 3.3, which is significantly larger than that in the SCS, whereas that of g is 0.90 to 0.95, which is smaller than that in the SCS. This indicates that the range of variation of is primarily affected by g, and the variation trend of g with b in different areas can better reflect the differences in the particle type and VSF characteristics between the two areas.
Therefore, by combining the characteristics of particle scattering, a more comprehensive display of the effect of the complexity of water body particle characteristics on the transmission process of different wavelengths of light in water can be achieved. This provides a new perspective for evaluating the propagation capability of light at different wavelengths. In combination with the traditional energy-based evaluation method for the transmission capability, the underwater propagation capabilities can be compared more comprehensively at different wavelengths, which has considerable guiding significance for long-distance optical detection effects related to underwater light detection, imaging, and communication. This will be helpful for the design and performance evaluation of the related instruments.
4 Conclusion
In this study, we utilized the concept of scattering to assess the capabilities of underwater lasers. We measured VSFs at 488 and 532 nm at 51 stations using the dual-wavelength VSFLab in the East and South China Seas. The present measurements constitute the first representation of the VSF in these areas, allowing for a comprehensive understanding of the particulate scattering characteristics. Furthermore, based on the measured VSFs, common OPs such as a, b, c, , and specific to the experimental stations were obtained at 488 and 532 nm. Comparative analysis revealed that these OPs exhibited similar patterns, with OPs(532) being lower than OPs(488) in the ECS, whereas the opposite results were observed in the SCS. More importantly, g and were discussed from the perspective of scattering. We found that whether in the ECS or SCS, g(532) and (532) consistently exceeded g(488) and (488), which is contrary to the conclusions derived from the discussion on common optical properties. In particular, for the two stations with optimal water quality east of the Luzon Strait within the SCS, (532) was nearly 20% higher than (488). From the VSFs, we were able to assess the capabilities of laser propagation in water more comprehensively, not only from the perspective of energy attenuation but also by considering the scattering effects.
It is worth noting that our investigation was confined to specific wavelengths, and the wavelength dependence of the OPs remains largely unexplored. The absence of critical data on parameters such as particle size and refractive index limits our understanding of the light scattering and absorption processes. Therefore, future studies should incorporate measurements of these parameters and assess the effects of different wavelengths to accurately model light propagation in aquatic environments. Furthermore, we analyzed the OPs of the surface samples from specific areas during autumn, yielding a series of valuable findings. However, the applicability of the results is limited to the season and sampling range. Future research should include different seasons and broader geographic areas, as well as samples from various depths, to fully assess the oceanic light-field information.
Data availability statement
The raw data supporting the conclusions of this article will be made available by the authors, without undue reservation.
Author contributions
CH: Conceptualization, Data curation, Formal analysis, Investigation, Methodology, Software, Validation, Writing – original draft, Writing – review & editing, Resources, Visualization. BT: Conceptualization, Funding acquisition, Writing – review & editing, Formal analysis, Supervision. YP: Methodology, Software, Writing – review & editing. QS: Supervision, Writing – review & editing. HH: Project administration, Writing – review & editing. ZM: Funding acquisition, Project administration, Writing – review & editing.
Funding
The author(s) declare that financial support was received for the research, authorship, and/or publication of this article. This work was supported by the National Key Research and Development Program of China (grant No. 2022YFB3901704); Scientific Research Fund of the Second Institute of Oceanography, MNR (Grant No. SZ2332); National Natural Science Foundation of China (Grant No. 61991450 and 42276200); Project of State Key Laboratory of Satellite Ocean Environment Dynamics, Second Institute of Oceanography, MNR (Grant No. SOEDZZ2103).
Acknowledgments
We acknowledge the captains, officers, and crews of Dongfanghong3 and Zheyuke2 for providing excellent assistance during field sampling and measurements.
Conflict of interest
The authors declare that the research was conducted in the absence of any commercial or financial relationships that could be construed as a potential conflict of interest.
Publisher’s note
All claims expressed in this article are solely those of the authors and do not necessarily represent those of their affiliated organizations, or those of the publisher, the editors and the reviewers. Any product that may be evaluated in this article, or claim that may be made by its manufacturer, is not guaranteed or endorsed by the publisher.
References
Boss E., Slade W. H., Behrenfeld M., Dall’Olmo G. (2009). Acceptance angle effects on the beam attenuation in the ocean. Optics Express 17, 1535–1550. doi: 10.1364/OE.17.001535
Chami M., Shybanov E. B., Khomenko G. A., Lee M. E.G., Martynov O. V., Korotaev G. (2006). Spectral variation of the volume scattering function measured over the full range of scattering angles in a coastal environment. K. Appl. Optics 45, 3605–3619. doi: 10.1364/AO.45.003605
Chami M., Thirouard A., Harmel T. (2014). POLVSM (Polarized Volume Scattering Meter) instrument: An innovative device to measure the directional and polarized scattering properties of hydrosols. Optics Express 22, 26403. doi: 10.1364/OE.22.026403
Chen S., Xue C., Zhang T., Hu L., Chen G., Tang J. (2019). Analysis of the optimal wavelength for oceanographic lidar at the global scale based on the inherent optical properties of water. Remote Sens. 11, 2705–2715. doi: 10.3390/rs11222705
Churnside J. H. (2013). Review of profiling oceanographic lidar. Optical Eng. 53, 51405. doi: 10.1117/1.OE.53.5.051405
Di Rocco H., Iriarte D., Pomarico J. (2010). Light propagation in turbid media: A generalization of the solution given by the diffusion approximation, based on the moments of multiple scattering. J. Quantitative Spectrosc. Radiative Transfer 111, 2558–2561. doi: 10.1016/j.jqsrt.2010.07.007
Hostetler C. A., Behrenfeld M. J., Hu Y., Hair J. W., Schulien J. A. (2018). Spaceborne lidar in the study of marine systems. Annu. Rev. Mar. Sci. 10, 121–147. doi: 10.1146/annurev-marine-121916-063335
Hu L., Zhang X., Xiong Y., He M.-X. (2019). Calibration of the LISST-VSF to derive the volume scattering functions in clear waters. Optics Express 27, A1188. doi: 10.1364/OE.27.0A1188
Ishibashi S., Susuki K.-I. (2022). “1Gbps x 100m underwater optical wireless communication using laser module in deep sea,” in OCEANS 2022, hampton roads (IEEE, Hampton Roads, VA, USA), 1–7. doi: 10.1109/OCEANS47191.2022.9976975
Jaffe J. (1990). Computer modeling and the design of optimal underwater imaging systems. IEEE J. Oceanic Eng. 15, 101–111. doi: 10.1109/48.50695
Jaffe J. S. (2015). Underwater optical imaging: the past, the present, and the prospects. IEEE J. Oceanic Eng. 40, 683–700. doi: 10.1109/JOE.2014.2350751
Jaffe J., Moore K., McLean J., Strand M. (2001). Underwater optical imaging: status and prospects. Oceanography 14, 64–75. doi: 10.5670/oceanog.2001.24
Kirk J. T. O. (1991). Volume scattering function, average cosines, and the underwater light field. Limnology Oceanography 36, 455–467. doi: 10.4319/lo.1991.36.3.0455
Koestner D., Stramski D., Reynolds R. A. (2020). Assessing the effects of particle size and composition on light scattering through measurements of size-fractionated seawater samples. Limnology Oceanography 65, 173–190. doi: 10.1002/lno.11259
Kolinko V. G., De Mul F. F. M., Greve J., Priezzhev A. V. (1996). Probabilistic model of multiple light scattering based on rigorous computation of the first and the second moments of photon coordinates. Appl. Optics 35, 4541–4550. doi: 10.1364/AO.35.004541
Lee M. E., Lewis M. R. (2003). A new method for the measurement of the optical volume scattering function in the upper ocean. J. Atmospheric Oceanic Technol. 20, 563–571. doi: 10.1175/1520-0426(2003)563:ANMFTM>2.0.CO;2
Li Y., Chen M., Qi J., Deng C., Du L., Bo Z., et al. (2023). Underwater ghost imaging with detection distance up to 9.3 attenuation lengths. Optics Express 31, 38457. doi: 10.1364/OE.499186
Li K., He Y., Ma J., Jiang Z., Hou C., Chen W., et al. (2020). A dual-wavelength ocean lidar for vertical profiling of oceanic backscatter and attenuation. Remote Sens. 12, 2844–2864. doi: 10.3390/rs12172844
Li J., Tao B., He Y., Li Y., Huang H., Mao Z., et al. (2022). Range difference between shallow and deep channels of airborne bathymetry liDAR with segmented field-of-view receivers. IEEE Trans. Geosci. Remote Sens. 60, 1–16. doi: 10.1109/TGRS.2022.3172351
Liu Q., Liu D., Zhu X., Zhou Y., Le C., Mao Z., et al. (2020). Optimum wavelength of spaceborne oceanic lidar in penetration depth. J. Quantitative Spectrosc. Radiative Transfer 256, 107310. doi: 10.1016/j.jqsrt.2020.107310
Lutomirski R. F., Ciervo A. P., Hall G. J. (1995). Moments of multiple scattering. Appl. Optics 34, 7125–7136. doi: 10.1364/AO.34.007125
Maffione R. A., Dana D. R. (1997). Instruments and methods for measuring the backward-scattering coefficient of ocean waters. Appl. Optics 36, 6057–6067. doi: 10.1364/AO.36.006057
Mobley C. (1994). Light and water: radiative transfer in natural waters (San Diego, CA: AcademicPress).
Mobley C. D., Sundman L. K., Boss E. (2002). Phase function effects on oceanic light fields. Appl. Optics 41, 1035–1050. doi: 10.1364/AO.41.001035
Morel A. (1991). Light and marine photosynthesis: A spectral model with geochemical and climatological implications. Prog. Oceanography 26, 263–306. doi: 10.1016/0079-6611(91)90004-6
Organelli E., Dall’Olmo G., Brewin R. J. W., Tarran G. A., Boss E., Bricaud A. (2018). The open-ocean missing backscattering is in the structural complexity of particles. Nat. Commun. 9, 5439–5450. doi: 10.1038/s41467-018-07814-6
Petzold T. J. (1972). Volume scattering functions for selected ocean waters:. Tech. rep (Fort Belvoir, VA: Defense Technical Information Center). doi: 10.21236/AD0753474
Slade W. H., Agrawal Y. C., Mikkelsen O. A. (2013). “Comparison of measured and theoretical scattering and polarization properties of narrow size range irregular sediment particles,” in 2013 OCEANS - san diego (USA: IEEE, San Diego, CA), 1–6. doi: 10.23919/OCEANS.2013.6740987
Slade W. H., Boss E., Russo C. (2011). Effects of particle aggregation and disaggregation on their inherent optical properties. Optics Express 19, 7945–7959. doi: 10.1364/OE.19.007945
Stramski D., Boss E., Bogucki D., Voss K. J. (2004). The role of seawater constituents in light backscattering in the ocean. Prog. Oceanography 61, 27–56. doi: 10.1016/j.pocean.2004.07.001
Sullivan J. M., Twardowski M. S. (2009a). Angular shape of the oceanic particulate volume scattering function in the backward direction. Appl. Optics 48, 6811–6819. doi: 10.1364/AO.48.006811
Sullivan J. M., Twardowski M. S. (2009b). Angular shape of the oceanic particulate volume scattering function in the backward direction. Appl. Optics 48, 6811–6819. doi: 10.1364/AO.48.006811
Sullivan J. M., Twardowski M. S., Zaneveld J. R. V., Moore C. M., Barnard A. H., Donaghay P. L., et al. (2006). Hyperspectral temperature and salt dependencies of absorption by water and heavy water in the 400-750 nm spectral range. Appl. Optics 45, 5294–5309. doi: 10.1364/AO.45.005294
Sun D., Su X., Wang S., Qiu Z., Ling Z., Mao Z., et al. (2019). Variability of particulate backscattering ratio and its relations to particle intrinsic features in the Bohai Sea, Yellow Sea, and East China Sea. Optics Express 27, 3074–3090. doi: 10.1364/OE.27.003074
Twardowski M., Zhang X., Vagle S., Sullivan J., Freeman S., Czerski H., et al. (2012). The optical volume scattering function in a surf zone inverted to derive sediment and bubble particle subpopulations. J. Geophysical Research: Oceans 117. doi: 10.1029/2011JC007347
Wu C., Tao B., Guo Y., Huang H., Mao Z., Song H., et al. (2022a). Measurements of aquatic particle volume scattering function up to 178.5° in the east China sea. Appl. Sci. 12, 1894–1910. doi: 10.3390/app12041894
Wu C., Tao B., Pan Y., Huang H., Mao Z., Pan D., et al. (2022b). Forward volume scattering function (0.03°–60°) measured using an oblique-incidence particle sizer. Optics Express 30, 12848. doi: 10.1364/OE.454837
Yoo K. M., Alfano R. R. (1990). Time-resolved coherent and incoherent components of forward light scattering in random media. Optics Lett. 15, 320. doi: 10.1364/OL.15.000320
Zaccanti G., Battistelli E., Bruscaglioni P., Wei Q. (1994). Analytic relationships for the statistical moments of scattering point coordinates for photon migration in a scattering medium. Pure Appl. Optics: J. Eur. Optical Soc. Part A 3, 897–905. doi: 10.1088/0963-9659/3/5/019
Zhang Z., Chen P., Mao Z. (2022). SOLS: an open-source spaceborne oceanic lidar simulator. Remote Sens. 14, 1849–1879. doi: 10.3390/rs14081849
Zhang X., Twardowski M., Lewis M. (2011). Retrieving composition and sizes of oceanic particle subpopulations from the volume scattering function. Appl. Optics 50, 1240–1259. doi: 10.1364/AO.50.001240
Zhou W., Cao W., Zhao J., Wang G., Zheng W., Deng L., et al. (2022). Variability of scattering and backscattering of marine particles in relation to particle concentration, size distribution, and composition off the eastern hainan coast in the south China sea. Continental Shelf Res. 232, 104615. doi: 10.1016/j.csr.2021.104615
Keywords: ocean optics, volume scattering function, diffusion length, asymmetry factor, South China Sea, East China Sea
Citation: Han C, Tao B, Pan Y, Song Q, Huang H and Mao Z (2024) Comparative analysis of diffusion length based on the volume scattering function measurements from the East and South China Seas. Front. Mar. Sci. 11:1465899. doi: 10.3389/fmars.2024.1465899
Received: 17 July 2024; Accepted: 10 September 2024;
Published: 04 October 2024.
Edited by:
Jun Chen, Xi’an Jiaotong University, ChinaReviewed by:
Deyong Sun, Nanjing University of Information Science and Technology, ChinaJunwu Tang, Laoshan Laboratory, China
Copyright © 2024 Han, Tao, Pan, Song, Huang and Mao. This is an open-access article distributed under the terms of the Creative Commons Attribution License (CC BY). The use, distribution or reproduction in other forums is permitted, provided the original author(s) and the copyright owner(s) are credited and that the original publication in this journal is cited, in accordance with accepted academic practice. No use, distribution or reproduction is permitted which does not comply with these terms.
*Correspondence: Bangyi Tao, dGFvYmFuZ3lpQHNpby5vcmcuY24=
†ORCID: Chang Han, orcid.org/0009-0002-9209-2274
Bangyi Tao, orcid.org/0000-0001-5040-0983
 Chang Han
 Bangyi Tao
 Yaorui Pan2