- 1State Key Laboratory of Satellite Ocean Environment Dynamics, Second Institute of Oceanography, Ministry of Natural Resources, Hangzhou, China
- 2Southern Marine Science and Engineering Guangdong Laboratory (Zhuhai), Zhuhai, China
- 3State Key Laboratory of Marine Environmental Science, Xiamen University, Xiamen, China
- 4School of Atmospheric Sciences, Sun Yat-sen University, Zhuhai, China
- 5Zhejiang Institute of Meteorological Science, Hangzhou, China
Typhoons are strong natural events that significantly influence the marine environment. In 2018, Typhoon Mangkhut traveled over a moored station with a depth ~1900 m on continental slope in the northern South China Sea, the near-inertial oceanic responses are studied based on the Regional Ocean Modeling System (ROMS) model simulation combined with observation data. Near-inertial currents after Mangkhut can be divided into three layers: near-circular polarized in upper ocean, across-slope polarized in deep ocean and along-slope polarized near the bottom, thickness of the three layers depend on the slope steepness. According to across-slope and along-slope intensified currents, the near-bottom vertical velocities and near-inertial energy were intensified at the moored station. The across-slope forth/back near-inertial flows brought cold/warm and salty/fresh water from deeper/shallower depth, increased vertical excursions of near-bottom temperature/salinity isolines and near-inertial available potential energy. The near-inertial barotropic across-slope currents were much greater than along-slope currents, with net cooling and salinity increase of the whole water column at the moored station. The core responses to Mangkhut were within 100 km around the station. The near-inertial kinetic energy generated both at sea surface and bottom slope, then propagated vertically into ocean interior and horizontally into the South China Sea basin as well as some topography-trapped waves propagated along the slope. This work enriches the understanding of air–sea interactions in coastal regions and the effect of ocean topography, especially after a typhoon.
1 Introduction
Tropical cyclones (TCs) are strong synoptic events that have significant impact on ocean environment (Zhang et al., 2021, 2024; Zhang, 2023). Strong TC winds transfer energy into the ocean (Liu et al., 2008) and induce near-inertial currents (waves) in the wake side (Dong et al., 2021) when the TC translation speed (U) is higher than the first baroclinic longwave speed (C) (Geisler, 1970). The near-inertial current speed often reaches ~1.5 m/s near the surface (Sanford et al., 2011; Zhang et al., 2021, 2016), with a spatial scale of 10-100 km (Alford et al., 2016; Shearman, 2005) and a vertical scale ranging from 100-300 m with clockwise rotation that propagates energy downward with depth (Alford et al., 2016; Leaman and Sanford, 1975). Because of wind-current resonance (Pallàs-Sanz et al., 2016; Price, 1981), TC-induced near-inertial currents are biased toward the right side of the TC track in the Northern Hemisphere (Pallàs-Sanz et al., 2016; Zhang et al., 2016), and the pattern depends on the nondimensional TC translation speed () (Zhang et al., 2020), where is the radius of maximum winds and f is the Coriolis frequency. The horizontal angle of near-inertial wave propagation is (Geisler, 1970), and vertical structures of near-inertial currents are usually characterized by a first-baroclinic mode with an ~180° phase difference between the upper ocean mixed layer and lower-stratified layers (e.g., thermocline layer) (Chen et al., 1996; Geisler, 1970; Johnston et al., 2021; Zhang et al., 2016). The generation of near-inertial waves below the mixed layer (i.e. the thermocline response) depends on the pressure gradient produced by density anomalies induced by mixing or advection (Price, 1994), some works also view the mechanism as convergence and divergence of mixed layer base allows downward propagation of near-inertial waves and transfers momentum into the thermocline (Gill, 1984; Price, 1983), which is performed as the synchronously change of vorticity and divergence (Brizuela et al., 2023b). The downward propagations of near-inertial waves are found to enhance mixing, induce vertical heat flux and warm the seasonal thermocline (Brizuela et al., 2023a; Lu et al., 2024).
The coastal topography intensifies TC-induced near-inertial waves regardless of the TC track and intensity, which both observed on the slope (e.g. Li et al., 2021; Zhang et al., 2022) and shelf (e.g. Chen and Xie, 1997; Chen et al., 1996). Near-inertial waves on slopes or shelves can increase the local near-bottom turbulent dissipation rate (Mackinnon and Gregg, 2005; Zhang et al., 2022). Slope-intensified near-inertial waves are subject to a balance between the cross-shelf gradient of surface elevation and vertical gradient of the Reynolds stress (Chen and Xie, 1997; Chen et al., 1996; Li et al., 2021). The variance in near-inertial currents is usually highest at the shelf break and decreases along both the onshore and offshore directions (Chen and Xie, 1997; Chen et al., 1996; Shearman, 2005), and near-inertial waves excited across the shelf can propagate toward the shelf break (Chen and Xie, 1997). The near-inertial waves can be coastally trapped (Brink et al., 1987) with their amplitudes varying with the topography of the slope (Brink, 1980). After TC passage, the flow undergoes adjustment processes, during which the TC-generated energy is dispersed via energy transfer from low-frequency flow to inertial motion (Chen and Qin, 1985). Amplification and shortening of the waves could lead to their breaking and mixing near sloping bottoms, which makes them likely sinks for the near-inertial energy (Lai and Sanford, 1986).
Although TC-induced near-inertial waves in marginal seas have been studied in previous works, their full vertical water column response and the effect of the coastal topography on the near-inertial waves have been studied less frequently because the lack of in-situ observations and high-resolution model simulation. In 2018, Typhoon Mangkhut traveled over a moored station on a continental slope in the northern South China Sea, providing data to characterize the nearly full water column ocean response. In this work, we use a model simulation with horizontal resolution of 2 km and vertical resolution ~4.4 m to ~85 m to analyze the near-inertial response to Manhghut on the continental slope, hope this work can contribute to the knowledge of coastal dynamics and air-sea interaction on the continental region, especially after a typhoon. In Section 2, we present information of the observations, topography and TC, as well as the model setup. In Section 3, we describe the raw and near-inertial responses at the observation station and the near-inertial responses in the horizontal, across-slope and along-slope sections as well as four typical selected positions along the across-slope direction. In Section 4, we examine the effect of the topography on the typhoon-induced near-inertial responses. Finally, the conclusions of this work are outlined in Section 5.
2 Data and methods
2.1 Observation station, topography and Typhoon Mangkhut (2018)
The mooring station was deployed at 116.889°E and 19.800°N on July 13 in 2018 and recovered on May 14 in 2019, which occurs on the slope of the South China Sea, with a water depth of ~1900 m. The inertial frequency was ~4.9401×10⁻⁵ s-1, and the inertial period was ~35.33 h (1.472 day). The along- and across-slope directions are 42° and 312°clockwise from the true north direction (X and Y directions in Figures 1A, B), respectively. The moored station comprises an upward-looking 75-K acoustic Doppler current profiler (ADCP) and a McLane moored profiler (MMP) (Figure 1C). Additional details of the observation setup have been shown in Zhang et al. (2022). There was southwestward along-slope near-bottom background mean flow below 1400 m, along with greater diurnal tide than semi-diurnal tide that enhanced near-bottom background dissipation rate at the moored station (Zhang et al., 2022).
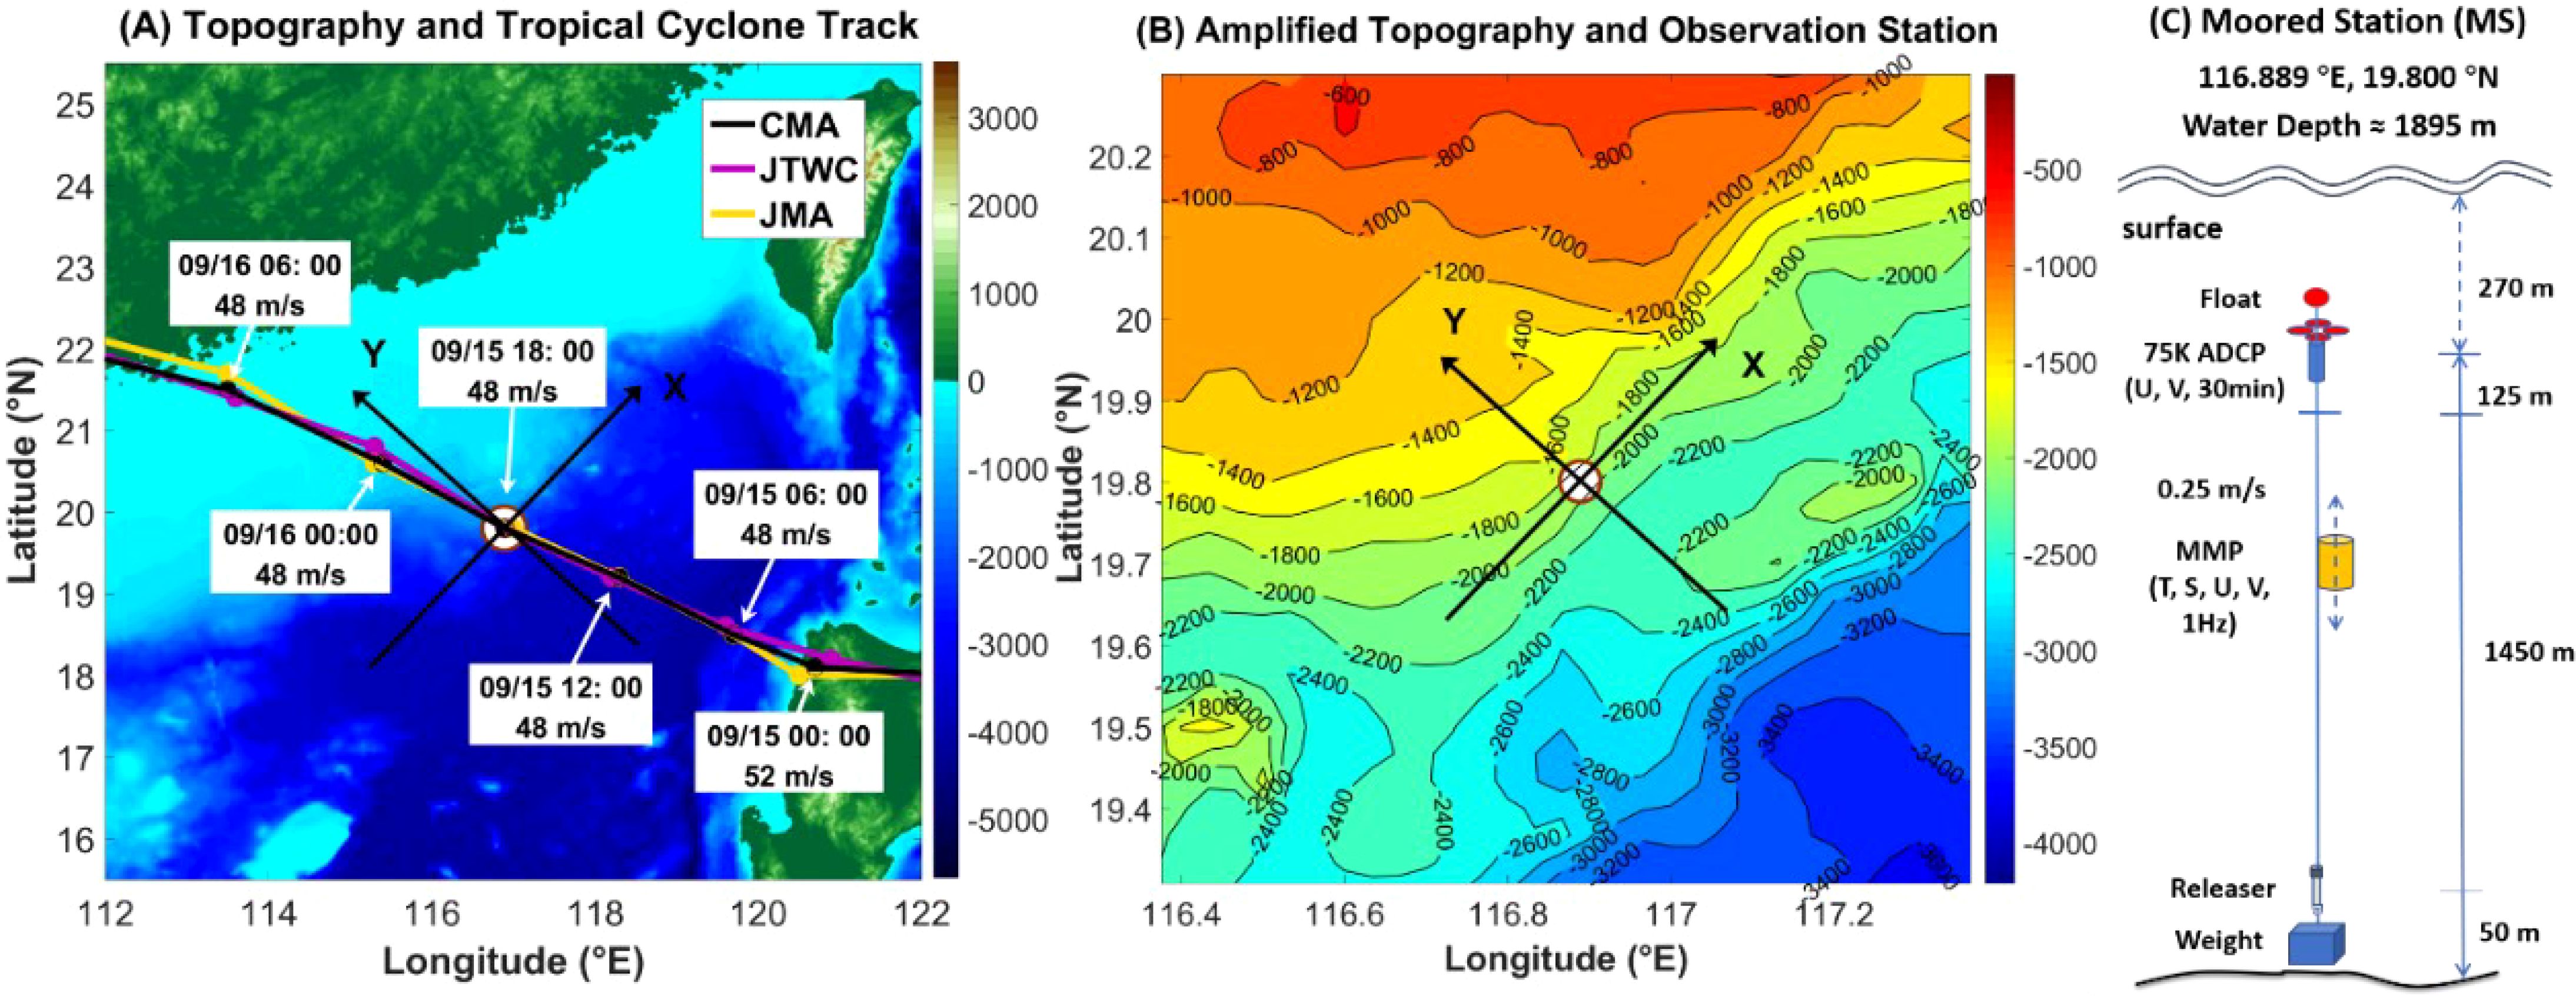
Figure 1. Moored station (MS, brown hallowed circle) and Typhoon Mangkhut track (A) with amplified topography (B) and moored station design (C). Black arrows indicate the along-slope (X) and across-slope (Y) directions. The track data originate from the China Meteorological Administration (black), Joint Typhoon Warning Center (purple), and Japan Meteorological Agency (orange). The times for typhoon tracks are universal time (UTC).
The best-track data for Typhoon Mangkhut (2018) in Figure 1A were obtained from the China Meteorological Administration (CMA; http://tcdata.typhoon.org.cn/en/zjljsjj_zlhq.html) (Lu et al., 2021; Ying et al., 2014), the Joint Typhoon Warning Center (JTWC; http://www.usno.navy.mil/JTWC), and the Japan Meteorological Agency (JMA; http://www.jma.go.jp/jma/jma-eng/jma-center/rsmc-hp-pub-eg/besttrack.html). CMA data is mainly used for the information of Typhoon Mangkhut as it is reported to be more accurate than other two datasets when it influences China (Ren et al., 2011). In CMA data, Typhoon Mangkhut traveled over the moored station at 18:00 on September 15 in 2018 with a maximum wind speed (Vmax) of 48 m/s and a translation speed (U) of ~8.35 m/s. The TC heading was 291°clockwise from the true north and intersected the slope at 21°. As the radius of maximum winds (Rm) was 37.04 km, the nondimensional translation speed () was ~4.563, so Typhoon Mangkhut was a relatively fast-moving TC and could cause obvious wind-current resonance, rightward biased upper ocean response and near-inertial waves on the leeward side of the TC center, as indicated in Zhang et al. (2020).
2.2 Model simulation
The coupled ocean–atmosphere–wave–sediment transport (COAWST) modeling system (Warner et al., 2010) was used for the simulation experiments. Since this work focuses on the ocean response, only the Regional Ocean Modeling System (ROMS; http://www.myroms.org) was activated. The detailed model settings and validation of the model results can be found in Wu et al. (2022) and are briefly described here for completeness. The model domain covers the entire South China Sea and part of the Northwest Pacific Ocean east of Luzon. The horizontal grid spacing is spatially variable, with a resolution of 2 km in the northern part of the South China Sea where the ocean response to Typhoon Mangkhut is focused. The topography for the model simulations is the GEBCO_2022 grid (ice surface elevation; https://www.doi.org/10.5285/e0f0bb80-ab44-2739-e053-6c86abc0289c). Vertically, we used 60-level stretched generalized terrain-following coordinate (s) with vertical stretching parameters θs, θb, and Tcline, which were set to 7, 2.0, and 300 m, respectively. The finest vertical resolution is ~4.4 m at surface (0 m) and coarsest ~85 m near bottom (300 m above bottom) at the observation station, and this design ensures a higher resolution in the surface and bottom boundary layers to resolve the physical processes of interest in this study.
The atmospheric forcing at the sea surface was estimated using bulk equations in the model (Warner et al., 2010; Wu et al., 2022) based on the wind field, air temperature, air pressure, precipitation, relative humidity and radiative heat fluxes provided by the fifth generation ECMWF atmospheric reanalysis of the global climate (ERA5) reanalysis data. ERA5 reanalysis data (Hersbach et al., 2020) were obtained from: https://cds.climate.copernicus.eu/cdsapp#!/dataset/reanalysis-era5-single-levels?tab=form. Considering that the ERA5 wind field (with a maximum wind speed of ~33 m/s) could underestimate the maximum wind speed (~48 m/s) of Typhoon Mangkhut during its passage through the South China Sea and for simplicity, according the method proposed by Guan et al. (2014). Our ERA5 wind field during typhoon passage through the northern South China Sea (2018/9/15-2018/9/17) was multiplied by 1.4 to roughly satisfy the maximum typhoon wind speed. The initial fields required for the model as well as the boundary forcing were provided by the Hybrid Coordinate Ocean Model (HYCOM) global model. The tidal forcing was incorporated in accordance with the TPXO global tidal model (Egbert and Erofeeva, 2002), which was derived from 13 tidal constituents (K1, O1, P1, Q1, K2, M2, N2, S2, MF, MM, M4, MS4, and MN4). The simulation period ranged from 2017/1/1-2018/10/30.
2.3 Calculation methods for energy
To further evaluate the typhoon-induced near-inertial motions at the observation station, the near-inertial kinetic energy (NIKE) and near-inertial available potential energy (NIAPE) at the observation station were calculated. Here, we defined the NIKE as:
where ρ is the water density and and are the near-inertial eastward and northward currents, respectively. According to Zhao et al. (2010), the available potential energy can be obtained as:
where N is the buoyancy frequency, is the vertical isothermal displacement, which can be calculated as , and η’ is the anomaly of η relative to that before Typhoon Mangkhut (averaged over 10 to 12 September). As there are uncertainties in N, the time-averaged N over the observation time range was finally used as the APE, and the near-inertial filtered APE was adopted as the NIAPE.
3 Results
3.1 Raw response at the observation station
During passage over the observation station, Typhoon Mangkhut immediately caused strong mixed layer currents as high as 1.5 m/s, with the intensified mixed layer currents that decaying during nearly seven to eight near-inertial periods (Figures 2B, D, H, J). Mangkhut may induced southwestward (negative) along-slope and offshore across-slope barotropic currents if compare the vertical averaged currents before and after the typhoon (Figure 2A), which is more obvious if average only MMP data as the out of phases of the currents within and below the mixed layer (Figure 2F). The interior and near-bottom currents amplified to ~0.2 m/s (Figures 2C, E) due to the barotropic forcing of the typhoon on the water, along with upward propagation of the response and amplification of the vertical excursions of temperature and salinity isolines (Figures 3A, F).
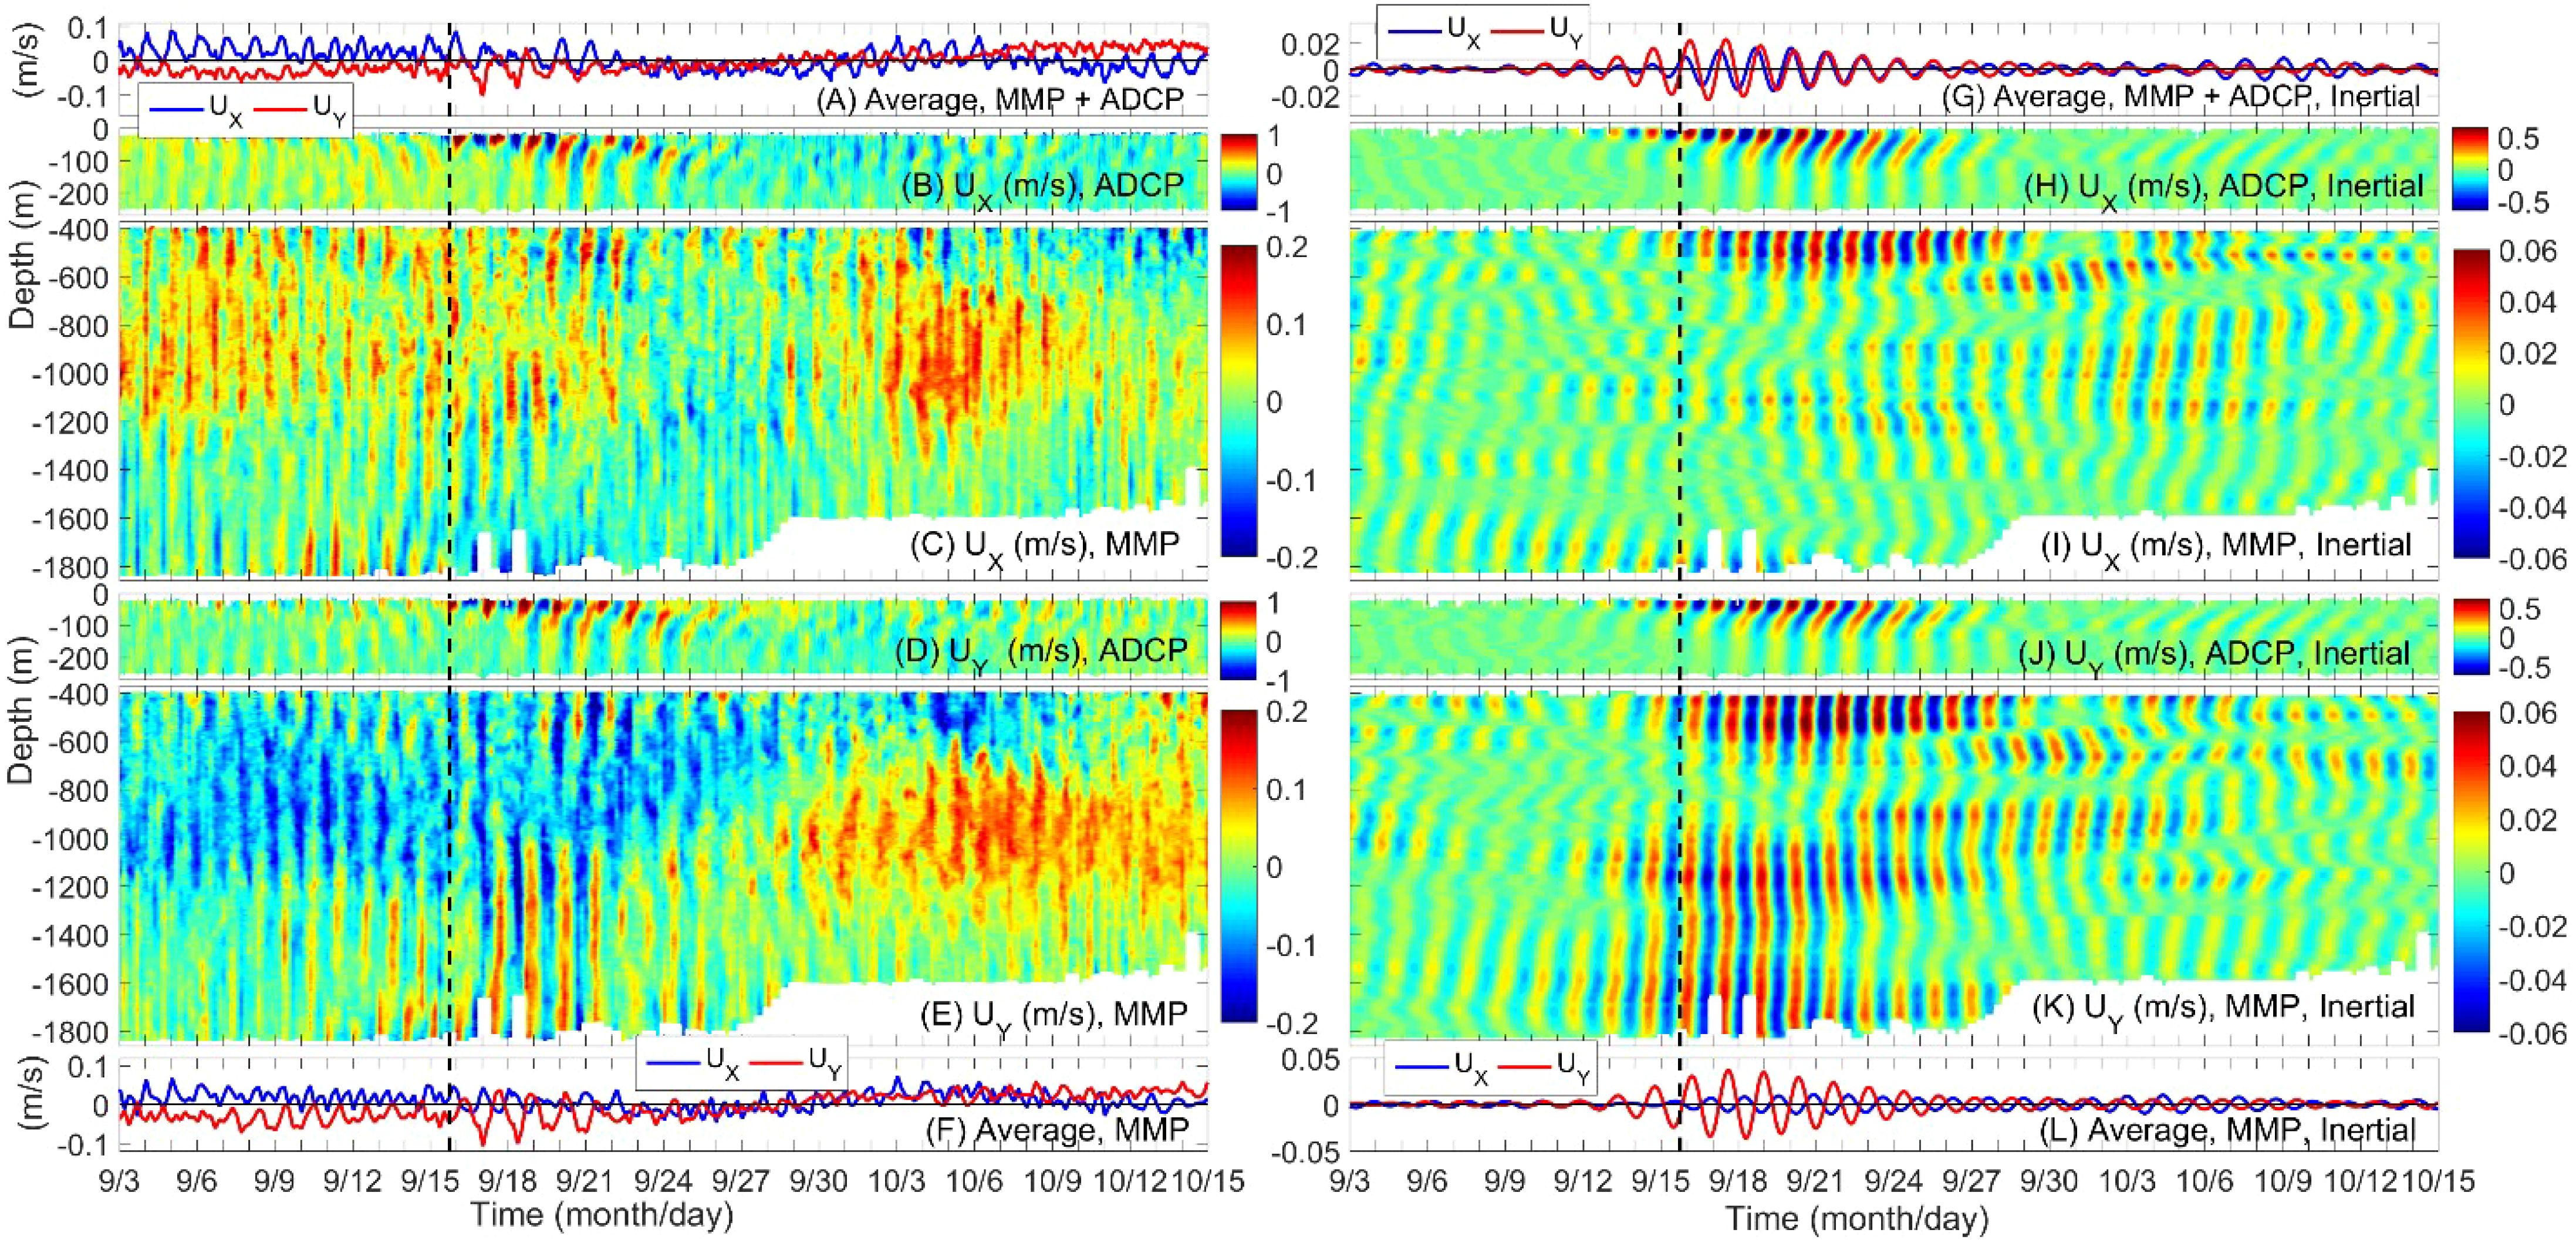
Figure 2. (A–F) Observed along-slope (B, C, UX, m/s) and across-slope (D, E, UY, m/s) currents (shading) at the moored station, along with the vertical average of the observation from both ADCP and MMP (A, m/s) and only MMP (F, m/s). (G–L) Same to (A–F) but for near-inertial filtered currents with the raw data filtered by 0.85–1.15 times of the local inertial frequency (1.472 day). The vertical black dashed lines indicate the times when the TC is closest to the observation station.
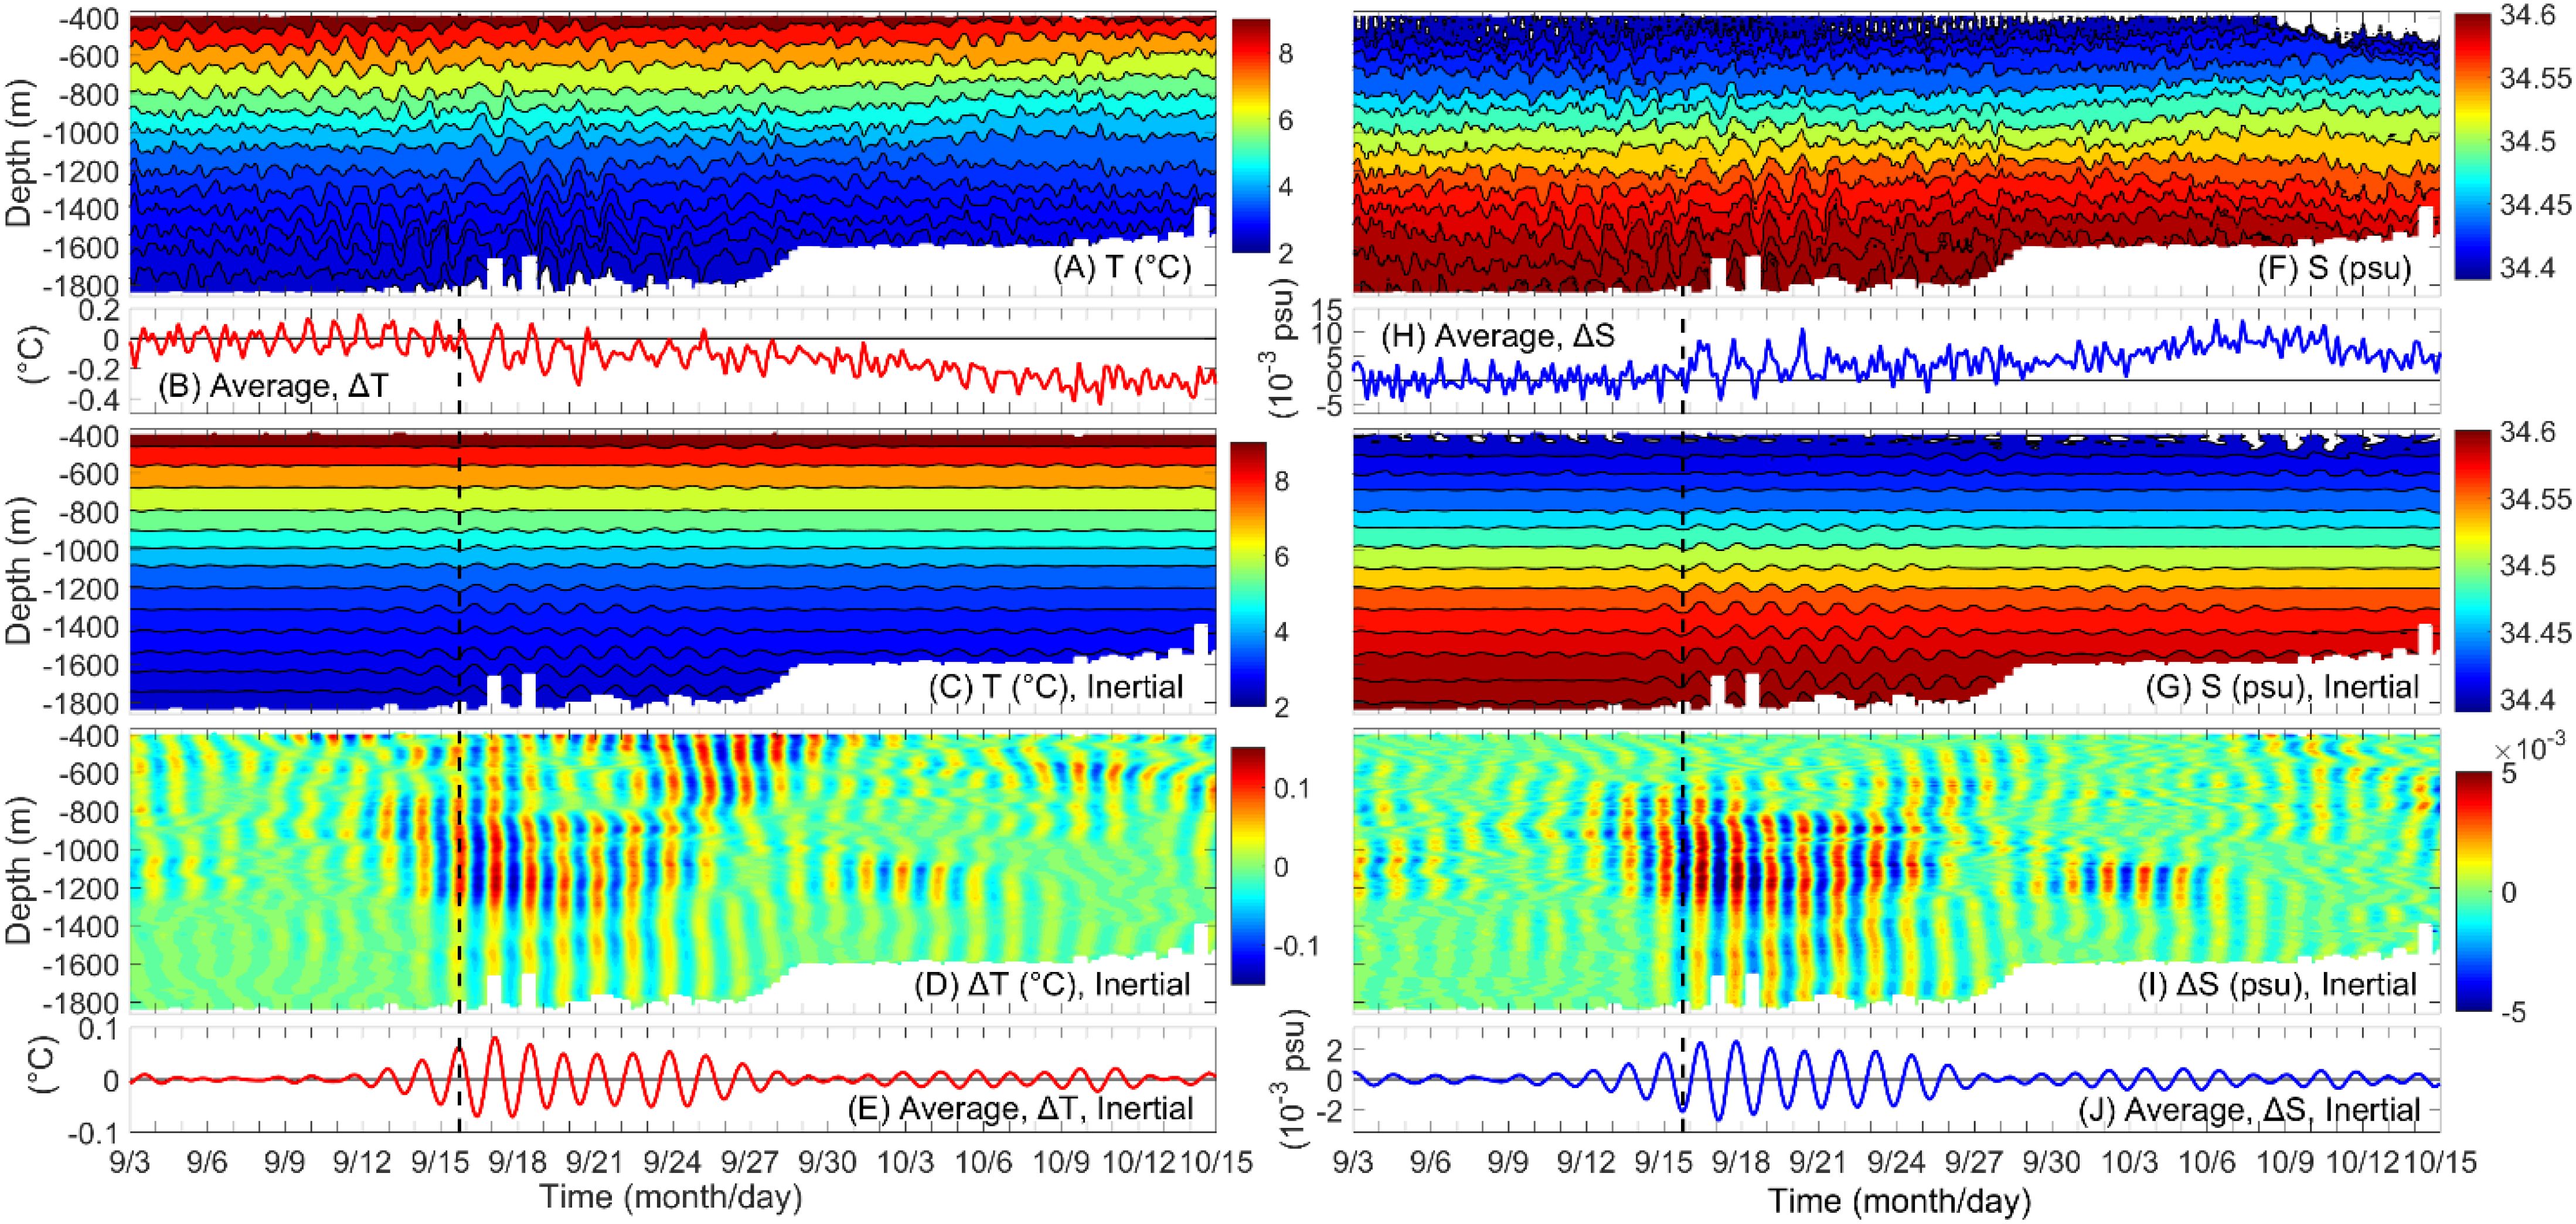
Figure 3. (A, B) Observed temperature (T, °C) along with its vertical average (B, °C) from MMP at the moored station. (C, D) Same to (A) but for near-inertial filtered temperature (C) and temperature anomaly (D). (E) Same to (B) but for vertical average of the near-inertial filtered temperature anomaly. (F–J) Same to (A–C) but for salinity (psu). Temperature and salinity anomalies are raw data that minus their average over 10 to 13 September. Near-inertial currents are filtered by 0.85–1.15 times of the local inertial frequency (1.472 day). The vertical black dashed lines indicate the times when the TC is closest to the observation station.
Manghut induced net cooling and salinity increase of the water below 400 m that reached ~-0.2 °C and ~0.008 psu (Figures 3C, G), which due to the net uplift of the water column near the typhoon track that caused by the typhoon-induced surface divergence (Zhang, 2023), bring the cold and salty water from slope bottom as mentioned in Zhang et al. (2022). The temperature and salinity anomalies propagated downward (Figures 3D, I) along with the near-inertial waves (Figures 2I, K), may because the near-inertial waves induced mixing and vertical heat flux in ocean interior (Brizuela et al., 2023a; Lu et al., 2024) accompanied with the geostrophic adjustment after TC forcing (Lu et al., 2016; Lu and Shang, 2024).
3.2 Near-inertial responses at the observation station
For the background currents at the observation station, the amplitude of diurnal tide reached ~0.1 m/s and was much greater than semi-diurnal tide (~0.01 m/s), the mean currents show nearly eastward flow upper than 1400 m and southwestward along-slope flow below 1400 m. However, we do not pursue it further here as they are primarily showed in Zhang et al. (2022) and beyond the scope of this study. Generally speaking, the currents after a typhoon are the composite result of the superposition of inertial currents and tidal motions (Guan et al., 2014; Liu et al., 2018; Zhang et al., 2022). However, as mentioned in previous works (Li et al., 2021; Zhang et al., 2022), local tides and near-inertial waves exhibit no significant interactions in the northern South China Sea. Therefore, typhoon-induced near-inertial responses can be studied individually. Near-inertial responses at the observation station.
Typhoon Mangkhut immediately intensified the near-inertial across-slope and along-slope currents of the whole water column (Figure 2G), and induced mixed layer near-inertial currents more than 1 m/s during its passage, which decayed along with downward propagation and the near-inertial waves were dispersed with increasing tilt of the isophasal lines over time (Figures 2H, J). Mangkhut also increased the near-inertial currents in the interior and deep ocean simultaneously, with greater across-slope components (Figures 2K, L) than the along-slope components (Figures 2I, L). The onshore (offshore) deep ocean currents corresponded to upwelling (downwelling) and upward (downward) movements of the temperature and salinity isolines (Figures 3A, D, F, I), resulting in a decrease (increase) in temperature (Figure 3B) and an increase (decrease) in salinity (Figure 3H), as well as near-inertial variations of their vertical averaged anomalies (Figures 3E, J). The amplitude of the vertical averaged near-inertial temperature and salinity anomalies significantly increased by Mangkhut, reached ~0.08 °C and 0.003 psu.
The model simulations reproduced the near-inertial currents response to Typhoon Mangkhut (Figures 4A–E), except that the simulated upper ocean mixed layer (Figures 4A, C) was thicker than that in the observations (Figures 4A, C), which is a common shortcoming of model simulations of oceanic responses to TCs (Huang et al., 2009; Sanford et al., 2011; Zedler et al., 2009; Zhang et al., 2016). The model also reproduced the near-bottom near-inertial intensified vertical excursions of temperature and salinity isolines (Figures 4K-N), except that the simulated variations in the interior and deep ocean were higher in the model simulations than in the observations, with the near-inertial currents reaching ~0.08 m/s (0.15 m/s) and the near-inertial vertical excursions of the temperature/salinity isolines reaching ~100 m (180 m) in the observations (model simulations), which may occur because the variations could be underestimated due to the low (~4 hour) temporal resolution of MMP observations, as explained in previous works (Klymak et al., 2011; Zhang et al., 2022). The model also reproduced the phenomenon in observations that vertical averaged (barotropic) across-slope currents were much stronger than the along-slope currents (Figure 4E), along with the intensified variations of vertical averaged (barotropic) temperature and salinity anomalies (Figure 4O). In short, the model is able to reproduce the phase and the intensified across-slope currents as well as the temperature and salinity anomalies of the near-inertial responses in observation, so it is worthy to be used for further studies of the near-inertial responses at the moored station as well as the three-dimensional responses near the observation station.
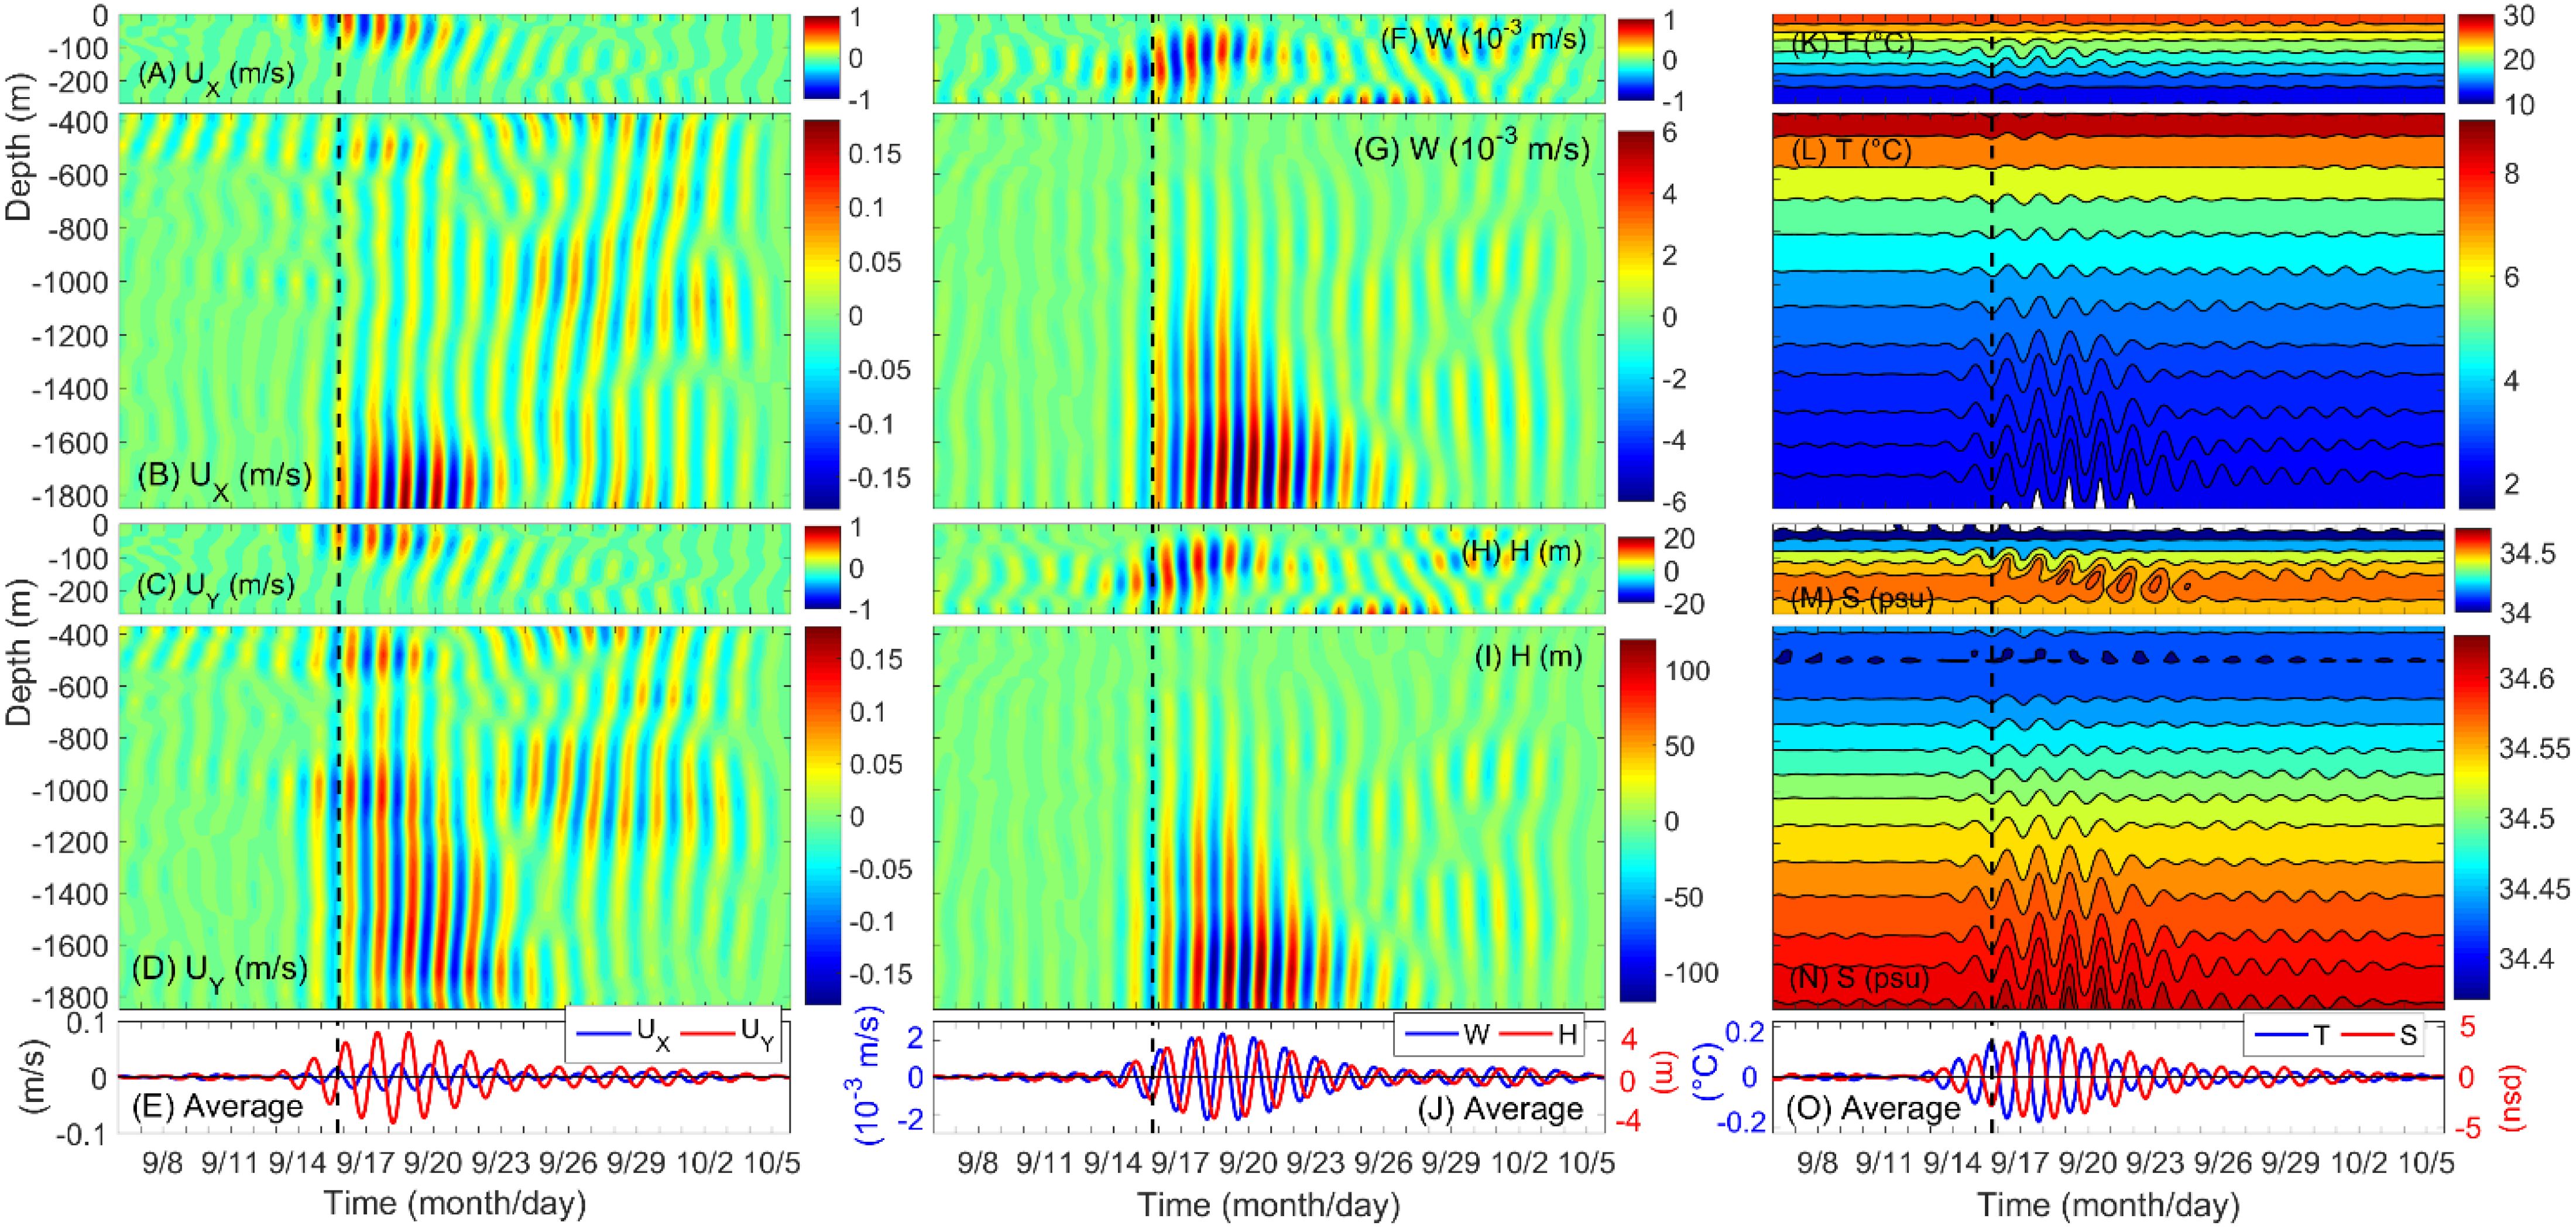
Figure 4. (A–E) Model simulated near-inertial filtered along-slope (A, B, UX, m/s) and across-slope currents (C, D, UX, m/s) along with their vertical average (E). (F–J) Same to (A–E) but for vertical velocity (W, 10-3 m/s) and vertical motion (H, m) of water by near-inertial velocities with positive for upward movement. (K–O): Same to (A–E) but for temperature (T, °C) and salinity (S, psu). Near-inertial currents are filtered by 0.85–1.15 times of the local inertial frequency (1.472 day). The vertical black dashed lines indicate the times when the TC is closest to the observation station.
The cross-check of observations and model simulations (Figures 3, 4) confirm that the intensified near-inertial across-slope currents is responsible for the bottom-intensified near-inertial vertical velocities (reached 0.006 m/s) and vertical motions (reached 120 m) of water that reaches to nearly 1000 m in the ocean interior (Figures 4F–J), while onshore (offshore) across-slope flows correspond to upwelling (downwelling) and upward (downward) movements of water that brought cold and salty (warm and fresh) water from the slope bottom.
3.3 Near-inertial energy at the observation station
Typhoon Mangkhut continuously imported near-inertial energy into ocean, while the near-surface NIKE increased from ~3 days before the typhoon was closest to the observation station, reached 400 (200) J/m3 from ~2 to 4 days in the mixed layer after Mangkhut in the observations (model results), gradually decayed and propagated downward (Figures 5A-D). Typhoon Mangkhut immediately increased the near-bottom NIKE due to a barotropic response that encounters the slope, after which the near-bottom NIKE slowly propagated upward (~200 m in a week). Mangkhut enhanced the NIAPE in the mixed layer bottom in the upper ocean (Figure 5G), where the vertical temperature gradient is high, and below 1000 m, where the vertical velocity is high (Figures 5F, H). The NIKE and NIAPE are alternatives that indicate the transition between kinetic and potential energy by near-inertial waves. The NIKE contributed more to NIKE+NIAPE in the upper ocean (<250 m, Figure 5E), but the NIKE and NIAPE were comparable in the middle and deep ocean layers (>400 m Figure 5I). Notably, the maximum near-bottom NIAPE occurred at depths from ~1500 to 1800 m (Figure 5H), rather than reaching its maximum at the bottom.
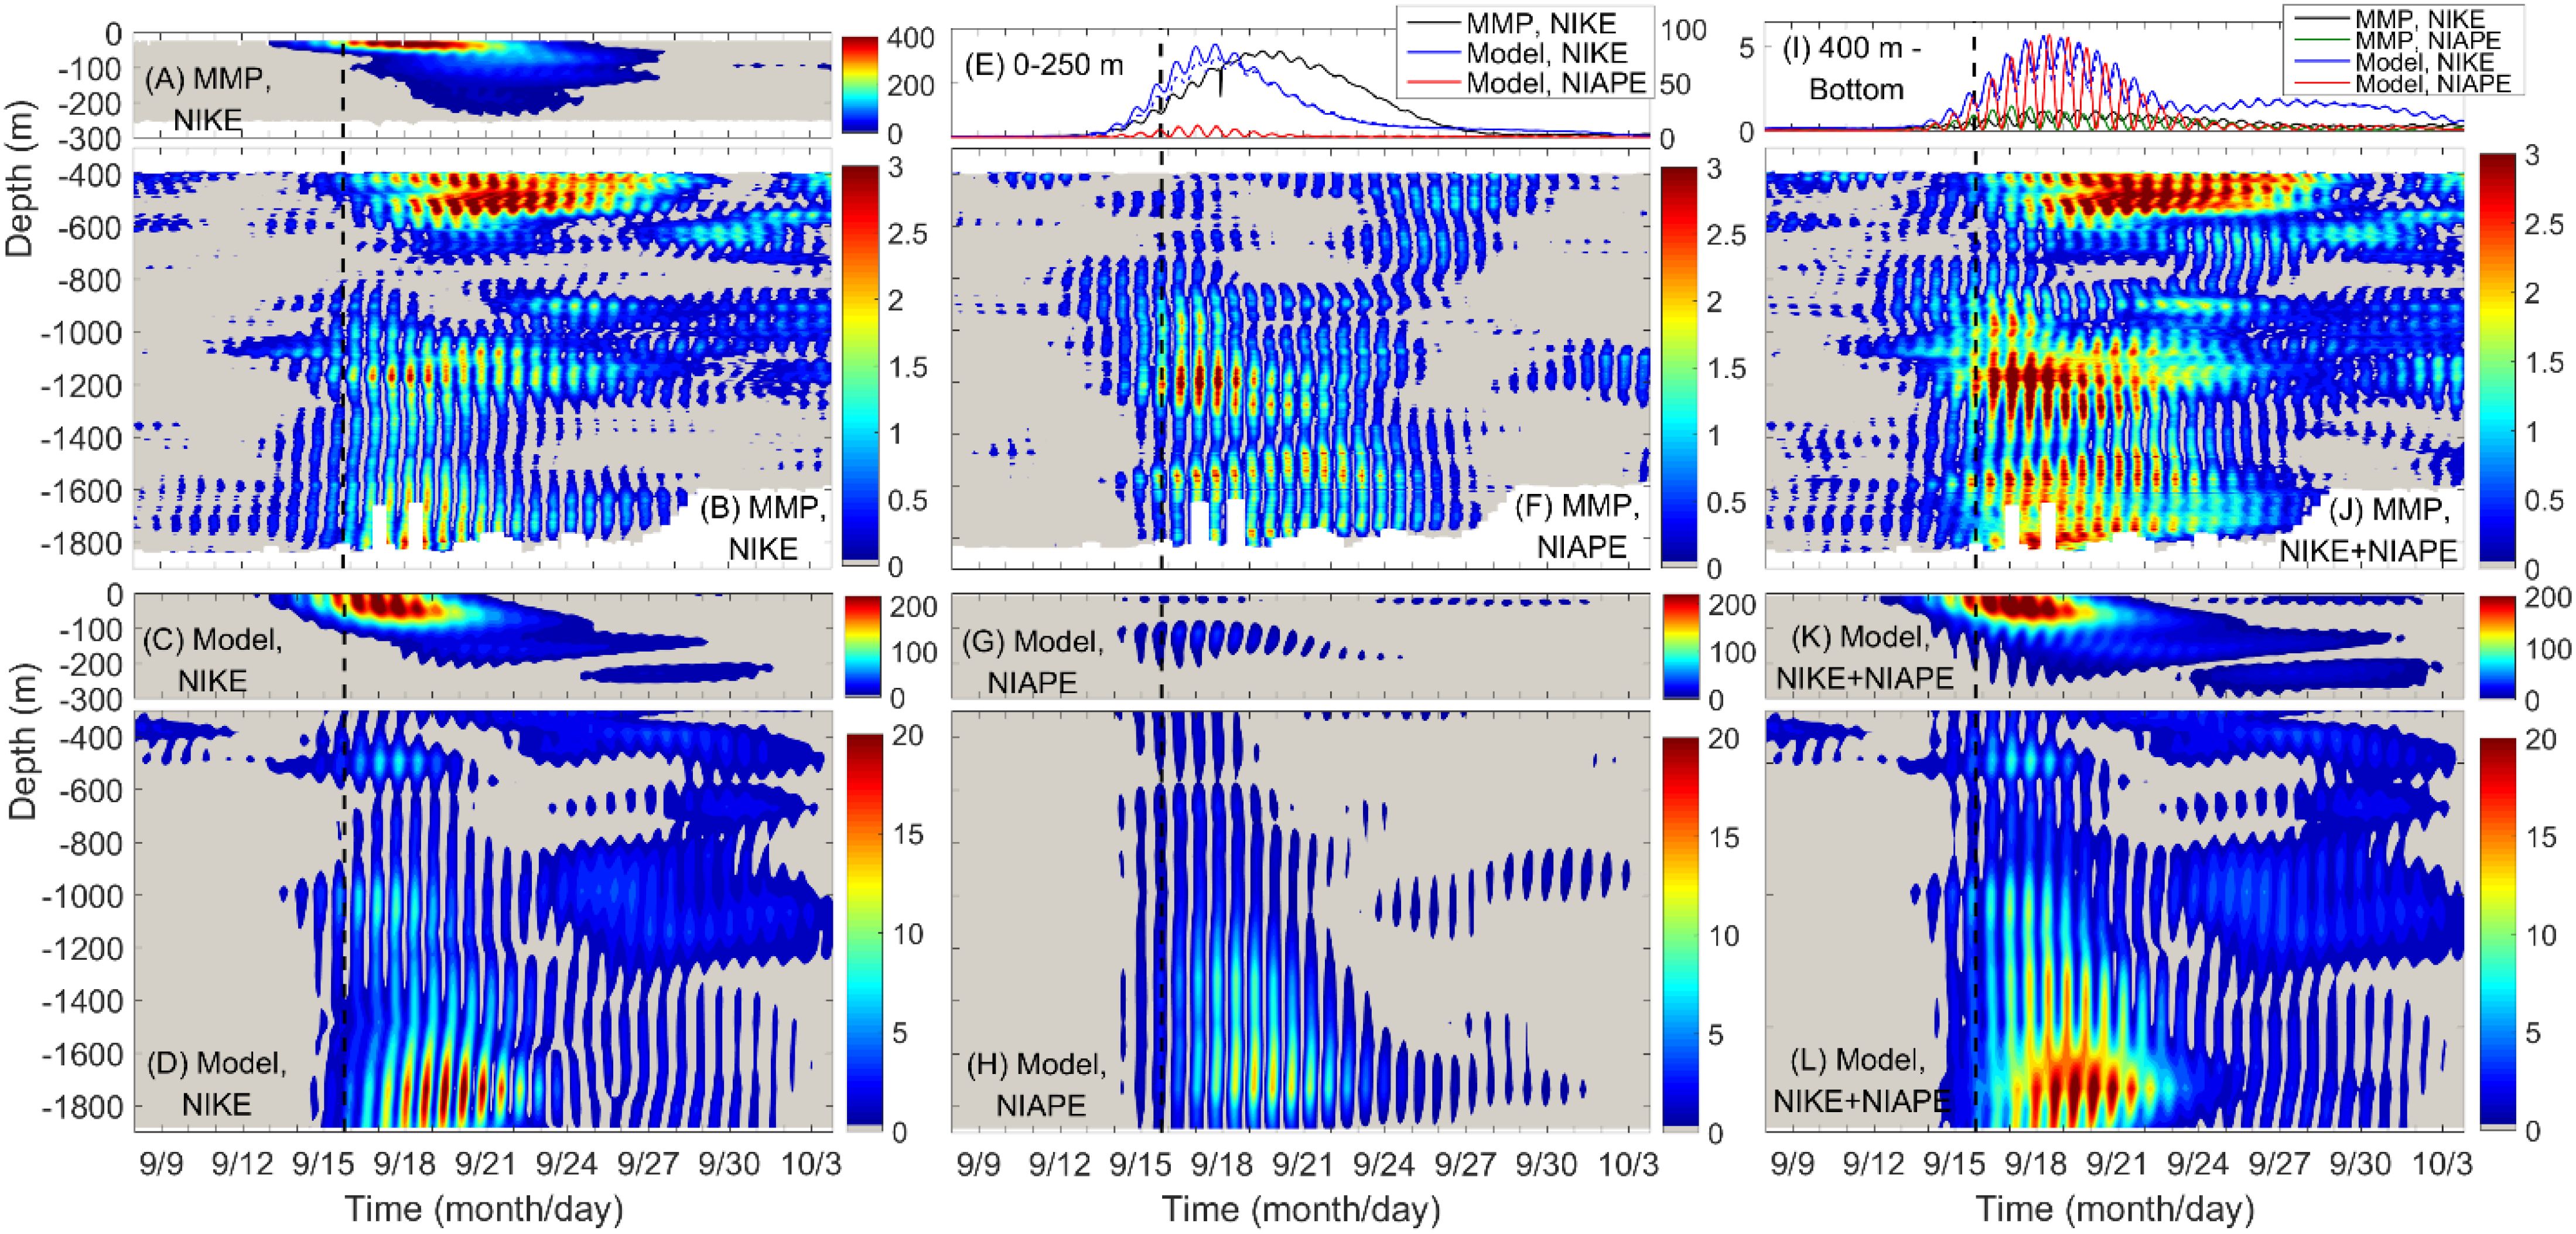
Figure 5. Near-inertial kinetic energy (NIKE, J/m3, A–D), near-inertial available potential energy (NIAPE, J/m3, F–H), and their sum (NIKE+NIAPE; J/m3, J–L) observed by the MMP (A, B, F, J) and simulated by numerical model (C, D, G, H, K, L). (E) NIKE and NIAPE averaged over 0-250 m in the MMP observations (black) and model results (blue and red). (I) is the same as (E) but for the average from 400 m to the bottom, except that green denotes the NIAPE based on the MMP observations. The vertical black dashed lines indicate the times when the TC is closest to the observation station.
The upper ocean NIKE reached its maximum ~4 days (~2 days) after Typhoon Mangkhut in the observations (model simulations), and the NIKE decay in the upper ocean was slower in the observations than in the model simulations, indicating that the model more easily gained kinetic energy from the TC and dissipated quicker. The amplitudes of the NIKE and NIAPE in the model simulations were larger than those in the observations below 400 m, which may occur because the MMP underestimates the currents and temperature response due to its low resolution, as explained before. The amplitude of near-bottom NIKE+NIAPE show more obvious near-inertial variations than upper ocean (Figures 5J–L), indicate the energy budget and propagation along with the onshore and offshore near-bottom near-inertial flows.
3.4 Horizontal distribution of the deep ocean near-inertial response near the slope
Because the model reproduces the near-inertial response in the ocean interior and deep ocean, the model results can be used to further analyze the spatial distribution of the near-inertial response near the continental slope. As deep ocean responses seem regulated by the topography, the horizontal distributions of near-inertial responses at 1000 m (Figures 6A–I, 7A–I) and 1600 m (Figures 6J–R, 7J–R) are further checked in this section to show the effect of continental slope.
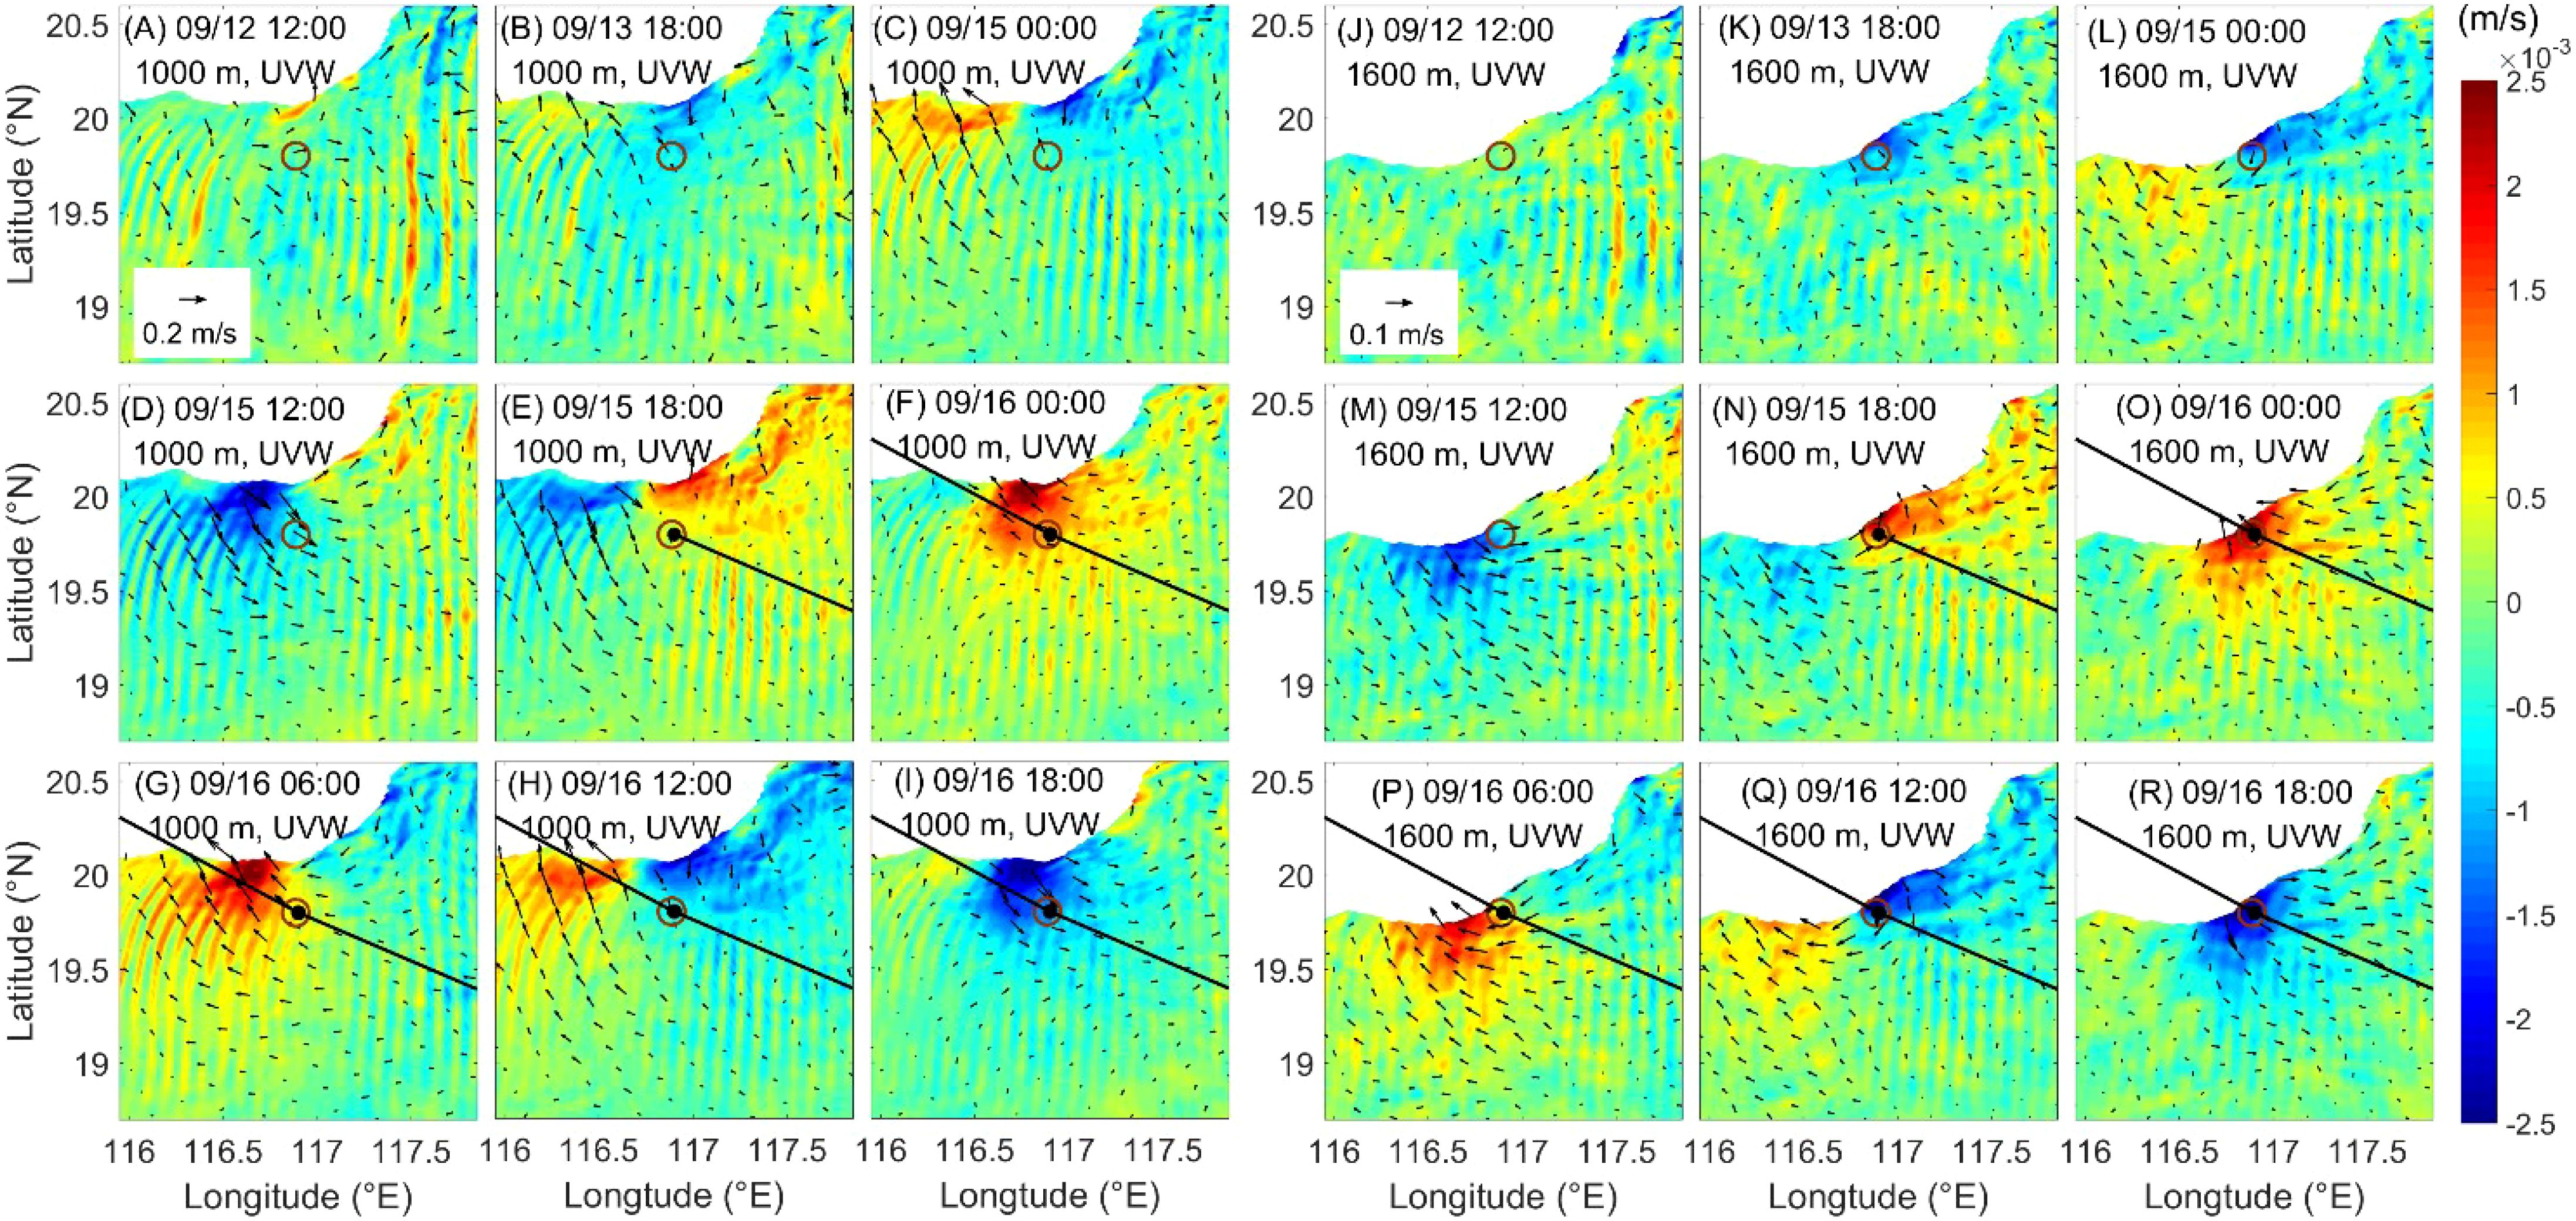
Figure 6. Top view of the near-inertial currents at 1000 m (A–I) and 1600 m (J–R) during the passage of Typhoon Mangkhut at different times. The vectors denote horizontal currents, and the shadings indicate vertical currents with the positive (negative) values corresponding to upwelling (downwelling). The brown hollowed circles denote the observation station. The black lines indicate Mangkhut’s tracks, and the black dots are the position of Mangkhut’s center at UTC 18:00, 15 September. X and Y denote the along- and across-slope directions, respectively.
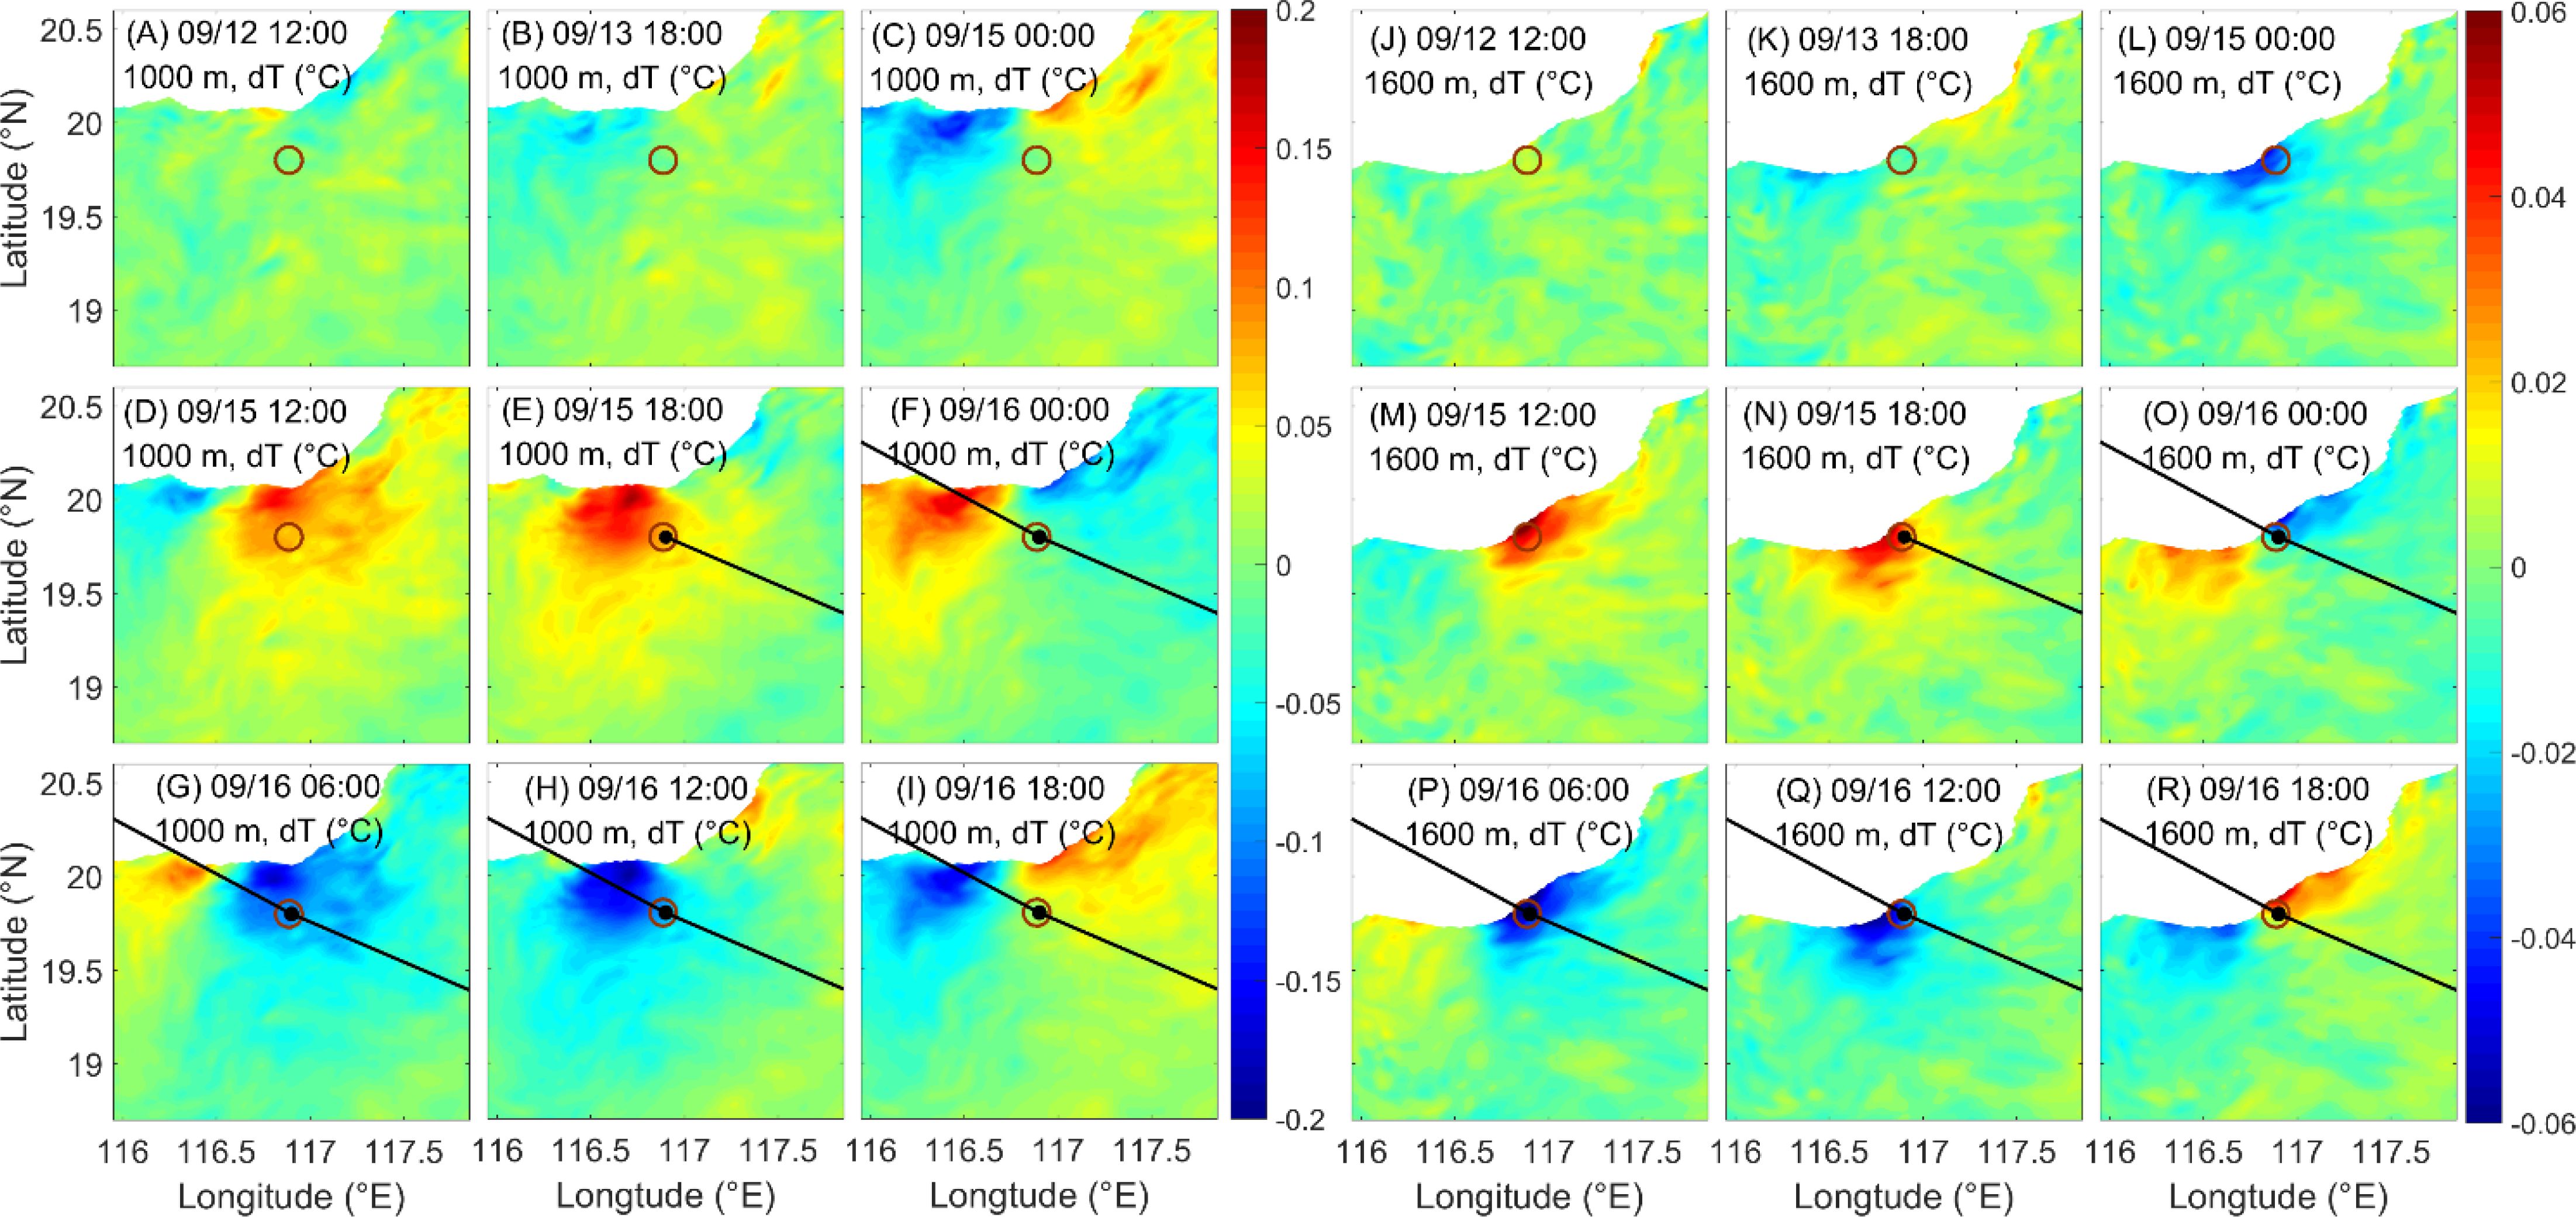
Figure 7. Top view of the near-inertial temperature anomalies (dT) at 1000 m (A–I) and 1600 m (J–R) during the passage of Typhoon Mangkhut at different times. The brown hollowed circles indicate the observation station. The black lines indicate Mangkhut’s tracks, and the black dots denote the position of Mangkhut’s center at UTC 18:00, 15 September. X and Y indicate the along- and across-slope directions, respectively. dT are near-inertial temperature relative to their average over 10 to 13 September.
Typhoon Mangkhut mainly caused deep ocean near-inertial currents near its track (Figures 6, 7), and the near-inertial waves propagated both northwestward and southeastward with an adjacent wave crest or trough with a horizontal scale of ~10 km. The near-inertial responses on the slope were bottom-intensified, and the groups of alternating near-inertial crests and troughs were transformed into a region of upwelling or downwelling that reached 2.5×10⁻³ m/s with a horizontal scale of ~100 km, while upwelling (downwelling) corresponded to onshore (offshore) near-inertial horizontal currents (Figure 6). As the upslope (downslope) flows transported colder (warmer) and saltier (fresher) water from deeper (shallower) depths, the variations in the temperature and salinity anomalies accordingly increased (Figure 7). Note that Typhoon Mangkhut first caused downwelling and offshore currents in front of the TC (e.g., 09/15 12:00, as shown in Figures 6D, M) and then turned to upwelling after TC forcing (e.g., 09/16 00:00, as shown in Figures 6F, O).
The bottom-intensified near-inertial responses are strong near TC track and close to the continental slope and decayed in off TC track and offshore direction. The observation station was within the scope of intensified deep ocean response (Figures 6, 7), so the enhanced deep ocean onshore and offshore flows due to the topography effect are responsible for the phenomenon that deep ocean near-inertial currents were stronger in across-slope direction than along-slope direction at the observation station (Figures 4B, D, F, H).
3.5 Near-inertial response in the across-slope and along-slope sections
Actually, slope-intensified near-inertial waves are a common feature on continental slopes where wind-induced near-inertial waves exist, with their maximum at shelf breaks and decay both offshore and onshore (Chen et al., 1996; Li et al., 2021; Schlosser et al., 2019). Thus, the across-slope (Figure 8) and along-slope (Figure 9) sections are assessed to further obtain the vertical distributions of the near-inertial responses near the observation station.
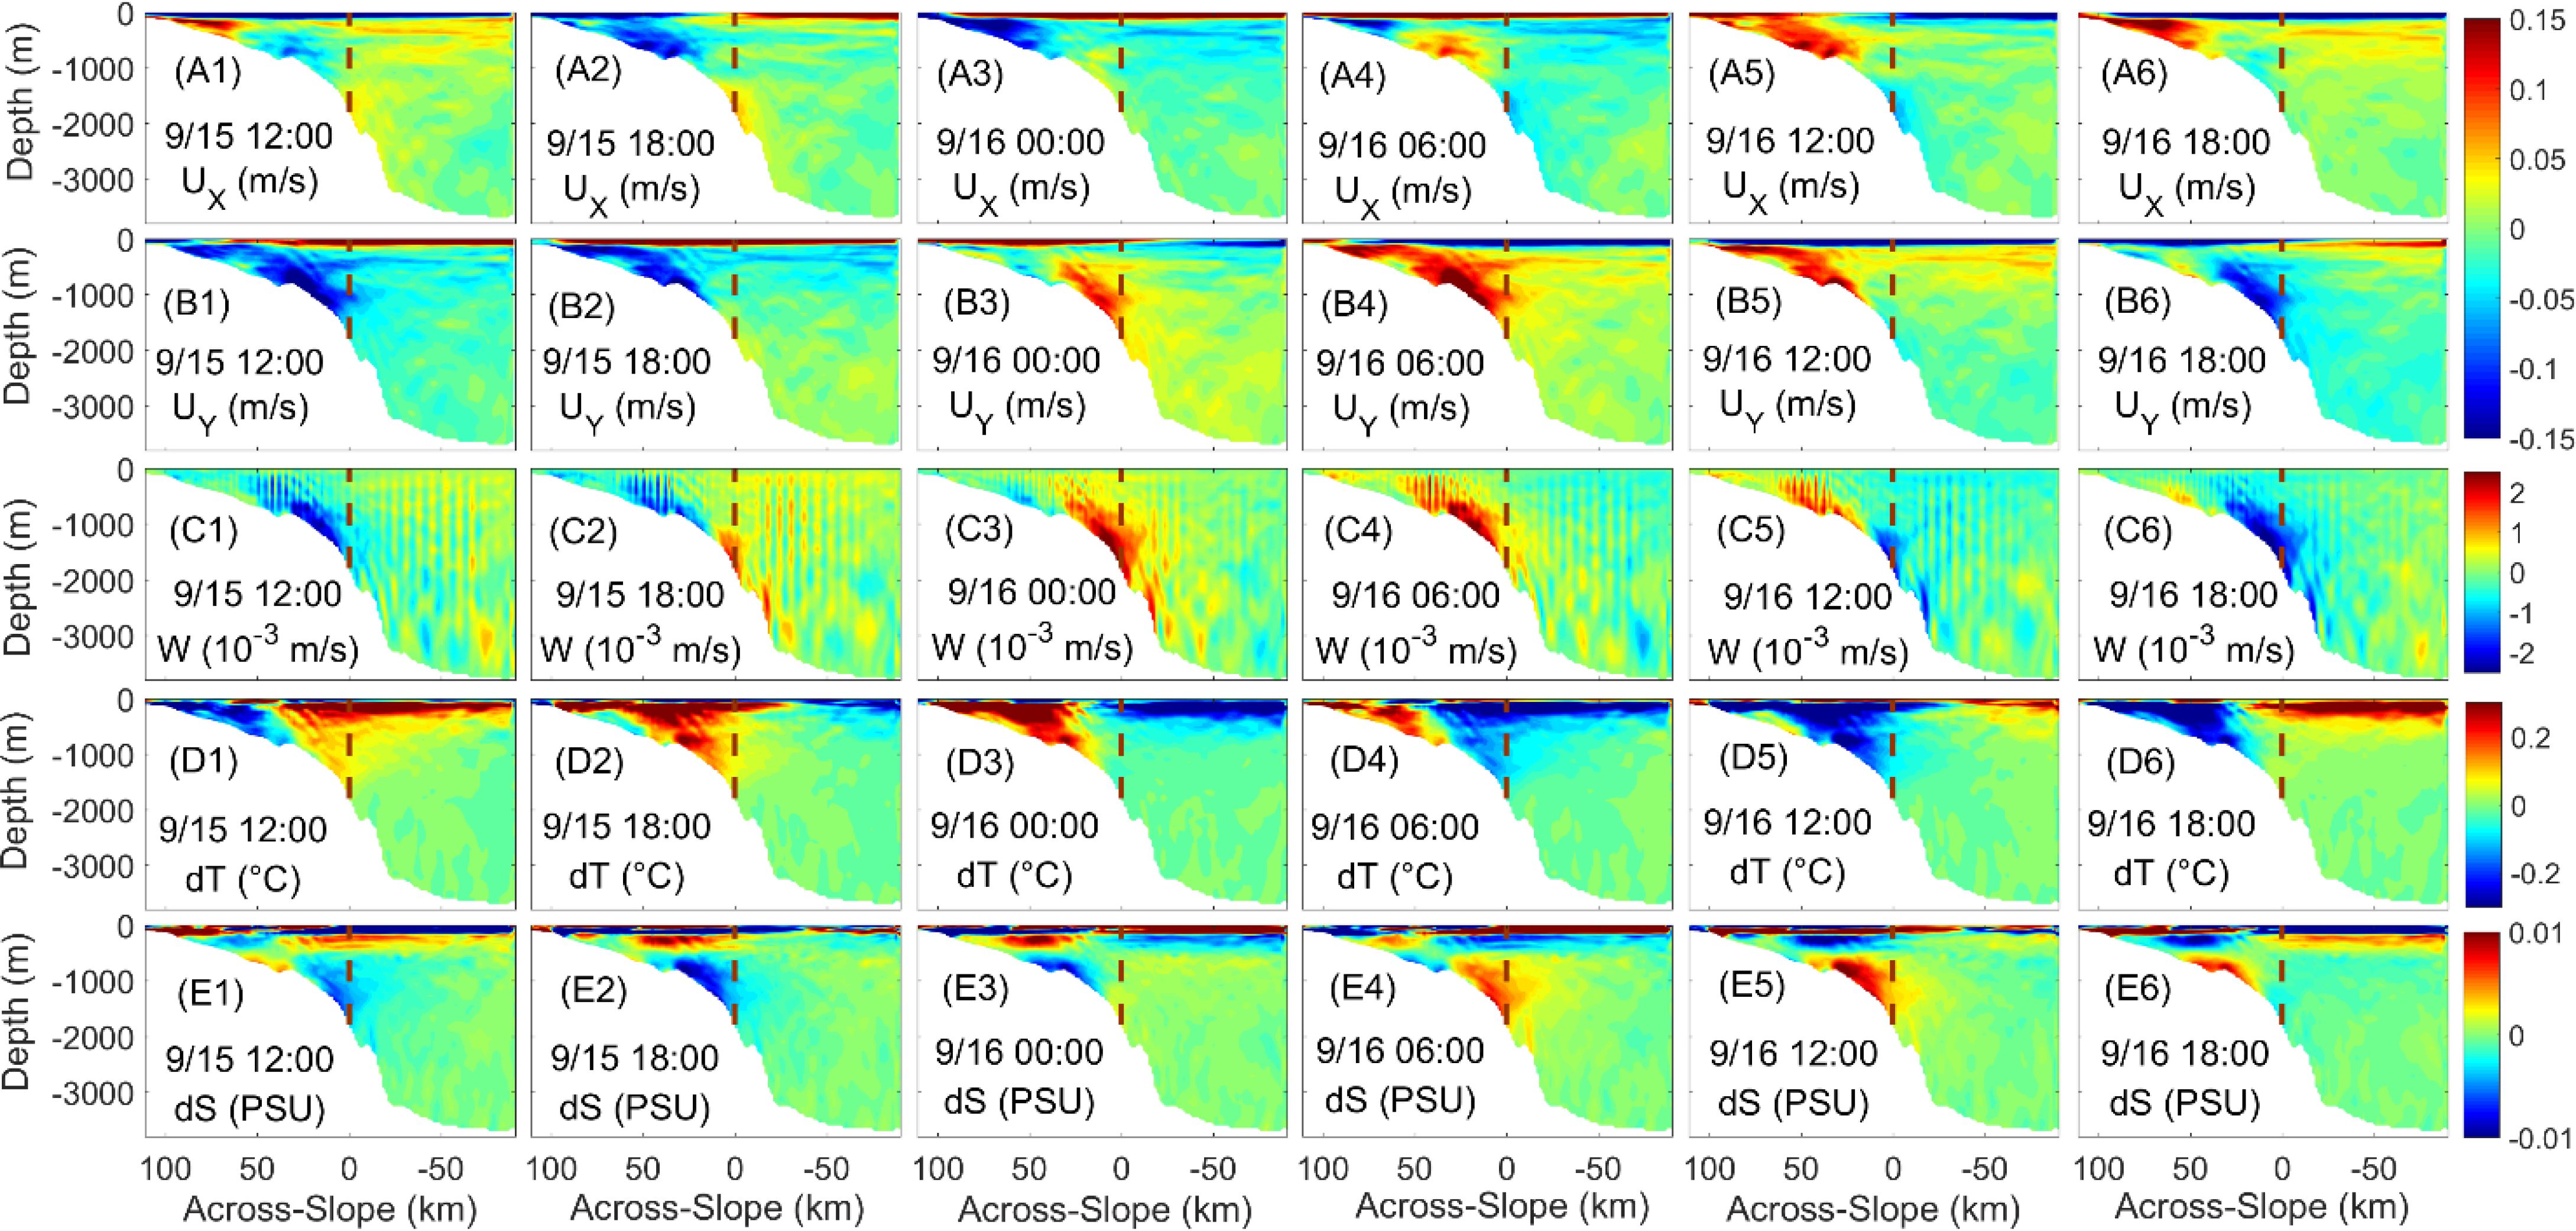
Figure 8. Side view of the near-inertial along-slope (UX, m/s; A1–A6), across-slope (UY, m/s; B1–B6) and vertical (W, 10-3 m/s; C1–C6) currents as well as the temperature (dT, °C; D1–D6) and salinity (dS, PSU; E1–E6) anomalies in the across-slope section according to Y direction in Figure 1 during Typhoon Mangkhut at different times. dT and dS are near-inertial values of temperature and salinity relative to their average over 10 to 13 September. Vertical currents with positive (negative) values correspond to upwelling (downwelling). The vertical brown dashed lines represent the position of observation station.
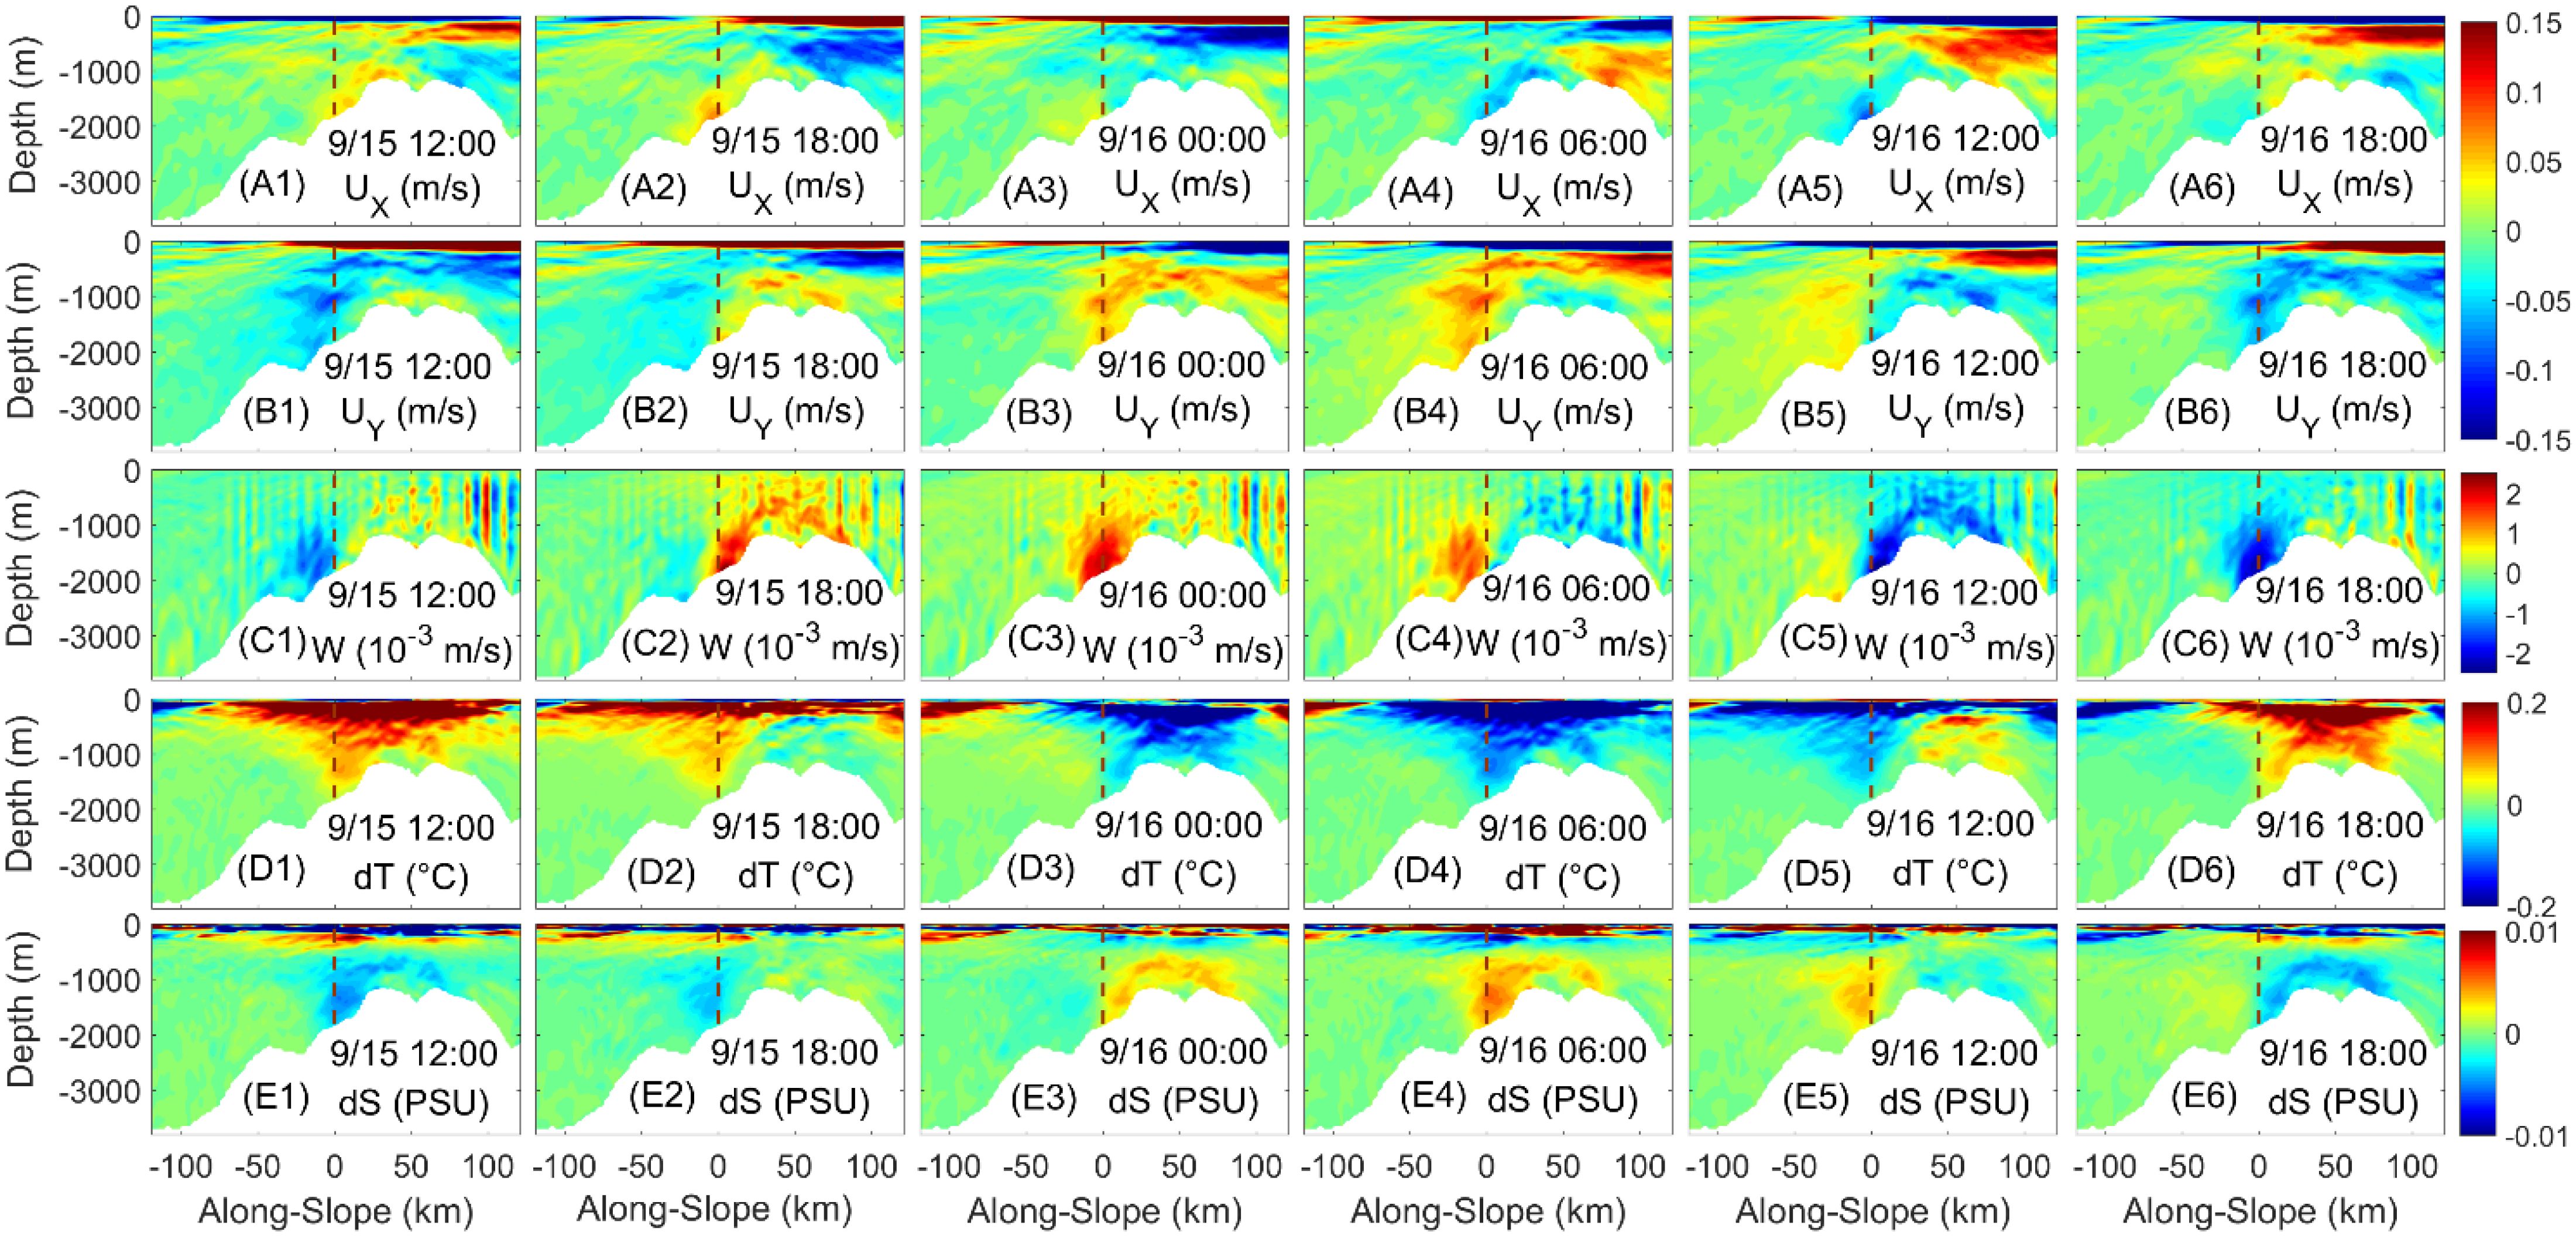
Figure 9. (A1-E6): Same as Figure 8 but for the side view of along-slope section according to X direction in Figure 1.
The near-inertial waves exhibited slope-intensified characteristics with the maximum near-bottom horizontal currents near the shelf break along the across-slope direction (Figures 8A1-A6, B1-B6). Flow adjustment to the pre-TC quasi-geostrophic state leads to near-inertial energy accumulation at the shelf break, regardless of TC track and intensity (Li et al., 2021). Consistent with the top view, the side view also shows that near-bottom onshore (offshore) across-slope horizontal currents occurred along with upwelling (downwelling) on the slope and shelf, i.e., a positive (negative) near-bottom vertical velocity (Figures 8C1-C6) corresponds to positive (negative) near-bottom across-slope flow (Figures 8B1-B6). The near-bottom vertical velocities were mainly intensified at positions where the slope gradient quickly changed, approximately 50 km in front and 25 km behind the observation station along the across-slope direction (Figures 8C1–C6). The intensifications of the near-bottom near-inertial across-slope currents were consistent with the vertical velocity, indicating onshore upslope (offshore downslope) flows as the cause of local near-bottom cold (warm) or positive (negative) salinity anomalies (Figures 8D1-D6, E1-E6). Note that Typhoon Mangkhut also intensified both the along- and across-slope currents in the shallow water region (<500 m) but with a lower vertical velocity, i.e., 50 to 100 km in front of the observation station along the across-slope direction, which is the intensified two-layer structure in shallow water mentioned in previous works, e.g., Li et al. (2021).
The side view (Figure 9) shows clockwise movements of near-bottom water along with the near-inertial responses, which also indicates that the response at the observation station was mainly driven by local near-inertial motions of water within ~100 km. The water depth was shallower and the near-bottom near-inertial response was stronger on the northeastern (positive) side of the observation station than on the southwestern (negative) side. The mechanisms were similar to those along the across-slope direction, in that local near-inertial movements of water on the northeastern (positive) side of the observation station corresponded to compression of the vertical water column, which subsequently intensified the near-bottom along-slope currents (Figures 9A1-A6), overlying across-slope currents (Figures 9B1-B6) and vertical velocity (Figures 9 C1-C6) in the range of approximately -10 to 50 km along the along-slope direction. Similar to the across-slope section, the near-bottom temperature and salinity anomalies (Figures 9D1-D6, E1-E6) were controlled by the intensified near-bottom flows.
4 Summary and discussion
Typhoon Mangkhut (2018) traveled over an observation station comprising an upward-looking 75-K ADCP and MMP deployed on the slope of the northern South China Sea at 116.889°E and 19.800°N with a water depth of ~1895 m. Typhoon Mangkhut induced a near-inertial response throughout the entire water column, with surface mixed layer currents reaching ~1 m/s and deep ocean currents reaching ~0.08 m/s. The deep ocean vertical excursions of the temperature and salinity isolines increased from ~120 to 200 m. The polarization of the upper (deep) ocean near-inertial currents was nearly circular (nearly rectilinear across the slope), i.e., the near-inertial across-slope currents were similar to (much stronger than) the along-slope currents in the upper (deeper) ocean. Near the bottom, the across-slope currents turned clockwise to be along-slope currents with increasing depth.
The numerical model simulation results showed that the typhoon-induced near-inertial deep ocean response was mainly intensified where Typhoon Mangkhut generated direct influences and was topographically trapped by the slope, reaching its maximum at the shelf break, which decayed along the ~50-80 km offshore direction. The contraction (expansion) of the water column during near-inertial motion on the slope caused additional along-slope bottom currents and overlying across-slope currents. As a result, the near-bottom upslope (downslope) currents transported water from the deeper (shallower) ocean and caused cold and saline (warm and fresh) anomalies, which could explain the near-bottom amplification of the vertical excursions of the temperature and salinity isolines at the observation station. The upslope and downslope flows were largely consistent with the across-slope rectilinearly polarized currents. The offshore topographical protrusion on the flanks of the typhoon track and the along-slope direction also promoted convergence in the shallower regions as well as divergence in the deeper regions, further intensifying the near-inertial response near the observation station.
In summary, the slope topography intensified the near-bottom near-inertial waves and deformed the polarization in the middle and deep ocean layers. The slope-intensified near-bottom near-inertial waves were also trapped by the slope, they drove and impacted the water column on the slope and shelf where the TC influences. Figure 10A gives a brief sketch of the deformation of near-inertial motions in the across-slope direction, and Figures 10B, C give a sketch of how the movement of water column in the across-slope direction corresponds to upslope and downslope flows as well as the advection of temperature and salinity anomalies. This work provides an example of the near-inertial ocean response to a TC on the continental slope, which enriches our understanding of TC–ocean interactions as well as the effect of the topography on the ocean.
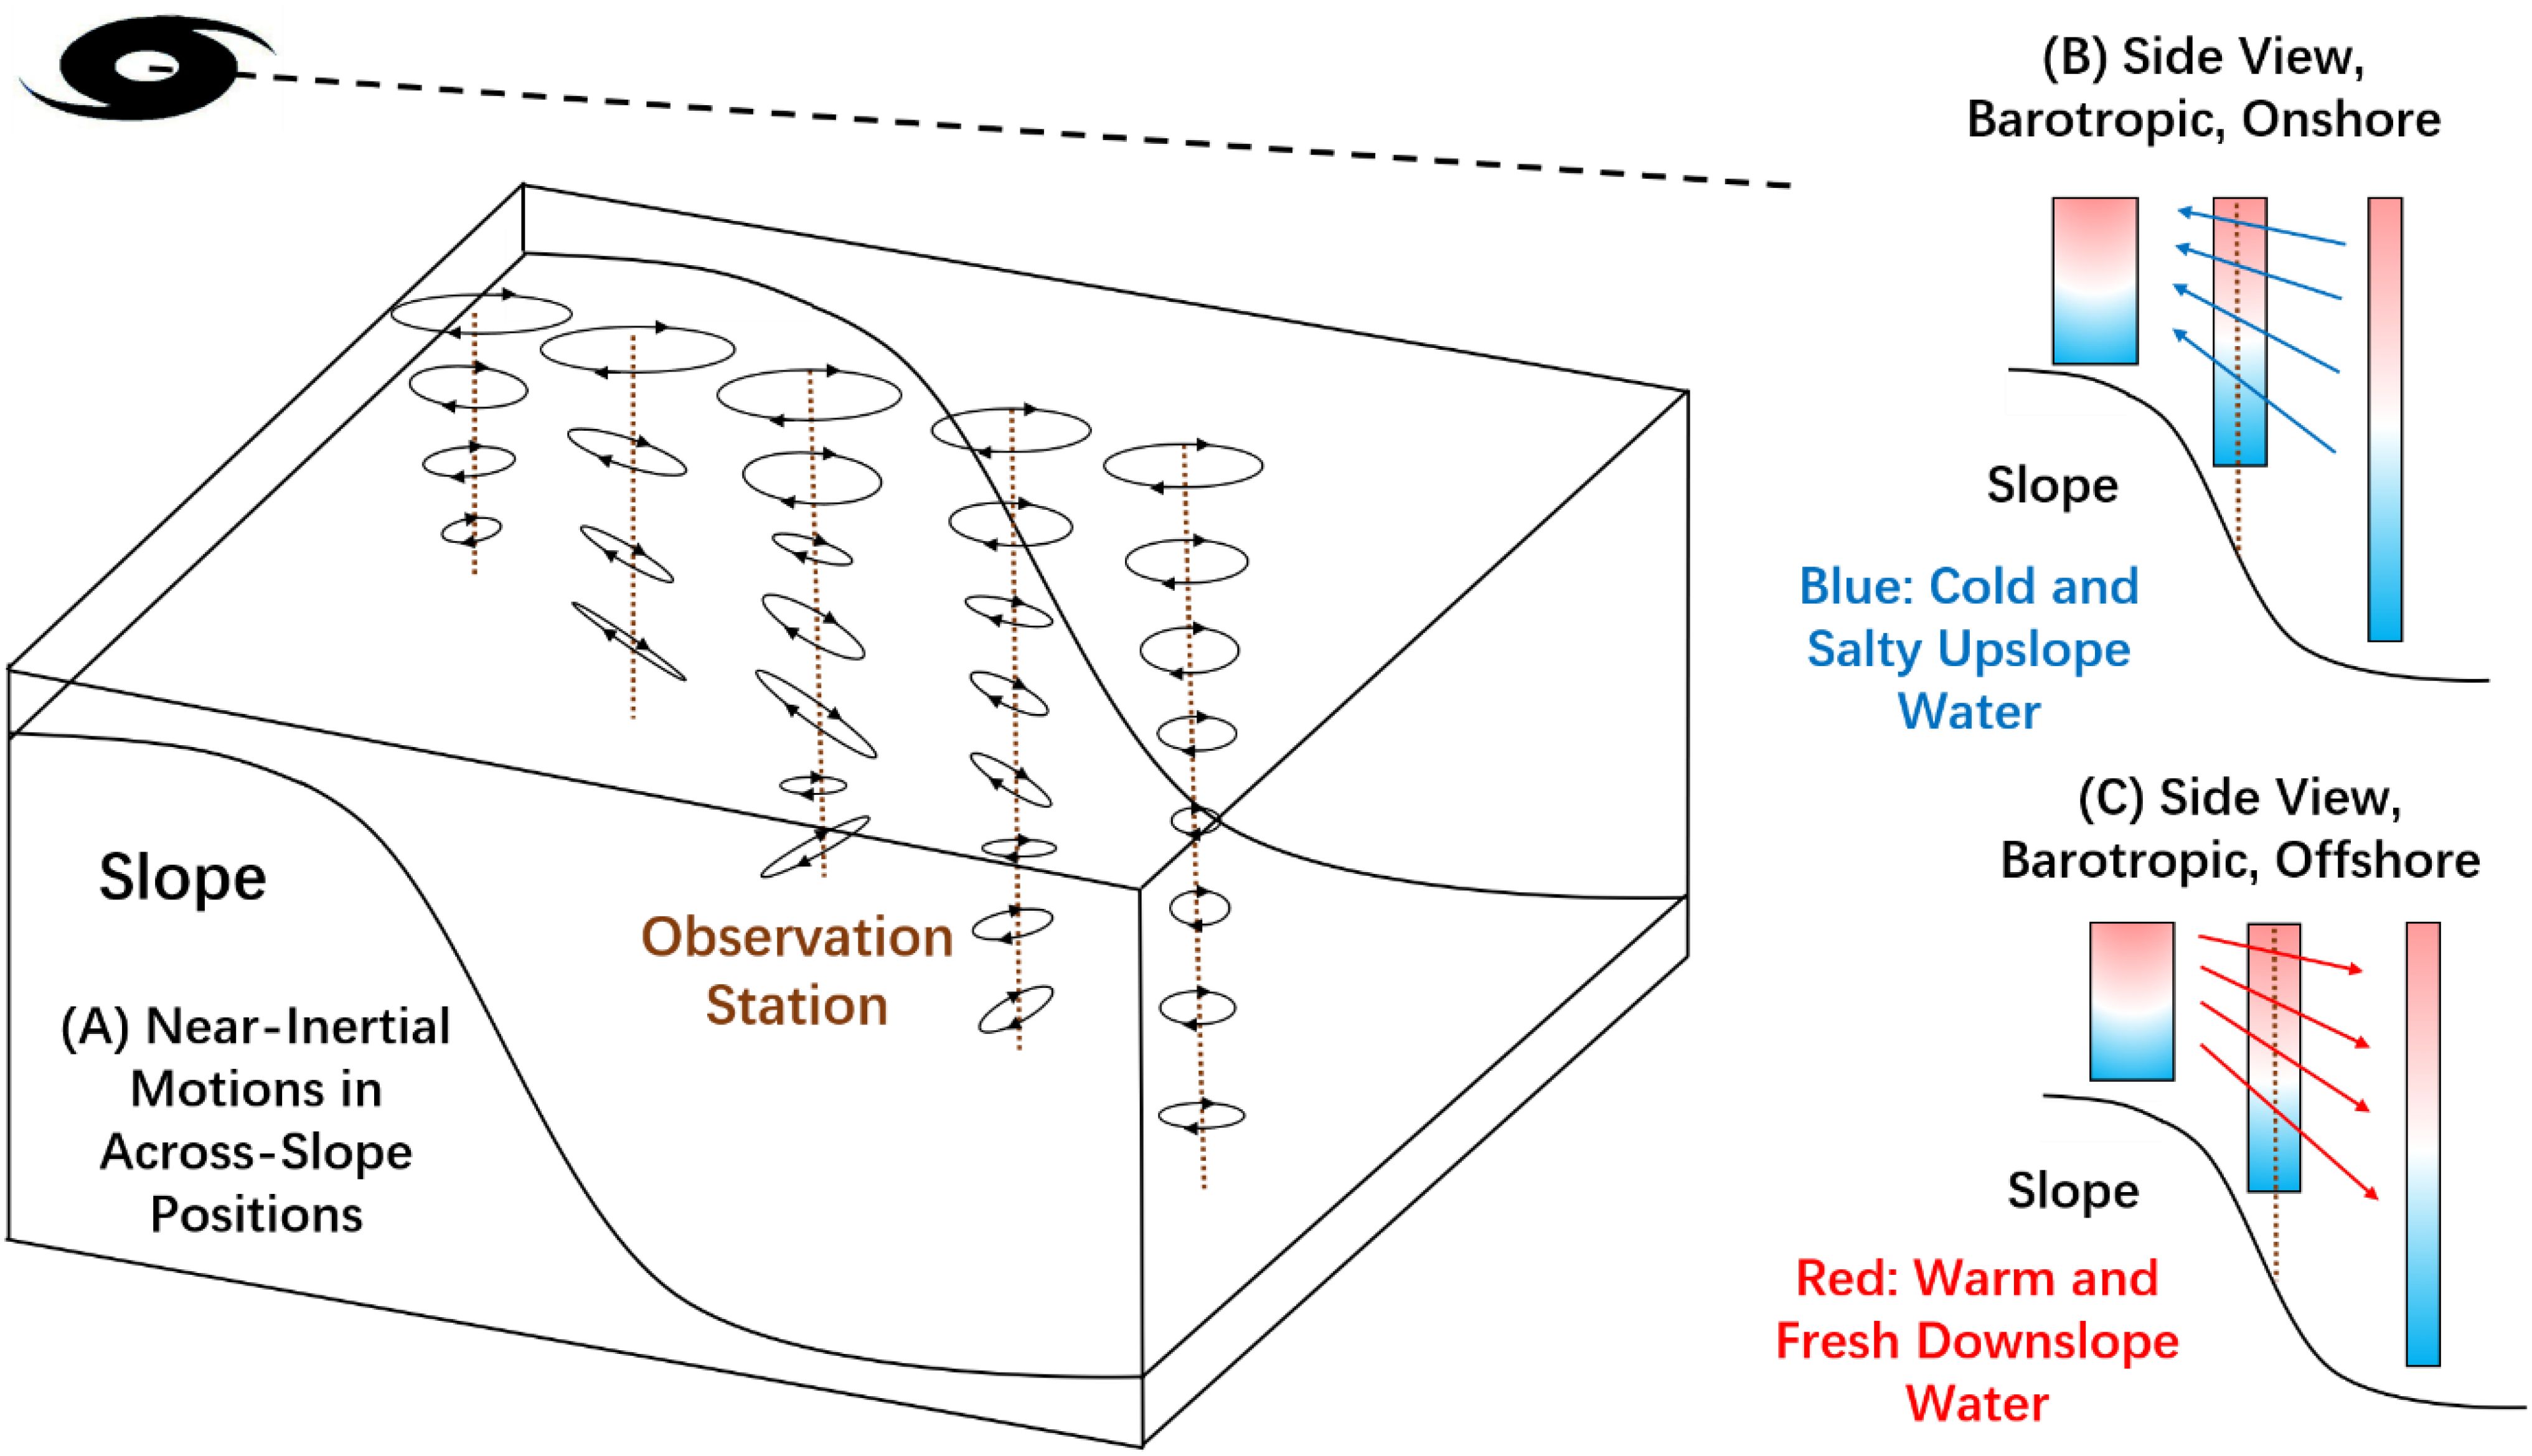
Figure 10. (A) Sketch of the near-inertial motions in across-slope direction. The angles of the main axis of the ellipses at different depths are determined by the directions of the isolines of along-slope and across-slope currents in the along-slope and across-slope sections in the model simulation. (B, C) Vertical motion of water column and across-slope advection of warm/cold and salty/fresh water due to the barotropic across-slope near-inertial motions.
Data availability statement
The raw data supporting the conclusions of this article will be made available by the authors, without undue reservation.
Author contributions
HZ: Conceptualization, Formal analysis, Investigation, Methodology, Validation, Writing – original draft, Writing – review & editing. RW: Methodology, Resources, Writing – review & editing. FL: Validation, Writing – review & editing. XN: Methodology, Resources, Writing – review & editing. DT: Writing – review & editing.
Funding
The author(s) declare financial support was received for the research, authorship, and/or publication of this article. This research was funded by the National Natural Science Foundation of China (42176015, 42227901), the Scientific Research Fund of the Second Institute of Oceanography, MNR (JG2309), the Key R&D Program of Zhejiang Province (2024C03257), the National Key Research and Development Program of China (2023YFF0805300, 2023YFF0805301), the Project supported by Southern Marine Science and Engineering Guangdong Laboratory (Zhuhai) (SML2021SP207), the Innovation Group Project of Southern Marine Science and Engineering Guangdong Laboratory (Zhuhai) (316323005), the MEL Visiting Fellowship (MELRS2303), and the Global Change and Air-Sea Interaction II Program (GASI-01-WPAC-STspr). This research is also supported by the CMA-FDU Joint Laboratory of Maine Meteorology, as well as the Shanghai Frontiers Science Center of Atmosphere-Ocean Interaction, Fudan University, Shanghai, China.
Conflict of interest
The authors declare that the research was conducted in the absence of any commercial or financial relationships that could be construed as a potential conflict of interest.
Publisher’s note
All claims expressed in this article are solely those of the authors and do not necessarily represent those of their affiliated organizations, or those of the publisher, the editors and the reviewers. Any product that may be evaluated in this article, or claim that may be made by its manufacturer, is not guaranteed or endorsed by the publisher.
References
Alford M. H., MacKinnon J. A., Simmons H. L., Nash J. D. (2016). Near-inertial internal gravity waves in the ocean. Annu. Rev. Mar. Sci. 8, 95–123. doi: 10.1146/annurev-marine-010814-015746
Brink K. H. (1980). Propagation of Barotropic continental shelf waves over irregular bottom topography. J. Phys. Oceanography 10, 765–778. doi: 10.1175/1520-0485(1980)010<0765:POBCSW>2.0.CO;2
Brink K. H., Chapman D. C., Halliwell G. R. (1987). A stochastic model for wind-driven currents over the continental shelf. J. Geophysical Res. 92, 1783–1797. doi: 10.1029/JC092iC02p01783
Brizuela N. G., Alford M. H., Xie S.-P., Sprintall J., Voet G., Warner S. J., et al. (2023a). Prolonged thermocline warming by near-inertial internal waves in the wakes of tropical cyclones. Proc. Natl. Acad. Sci. U.S.A. 120, e2301664120. doi: 10.1073/pnas.2301664120
Brizuela N. G., Johnston T. M. S., Alford M. H., Asselin O., Rudnick D. L., Moum J. N., et al. (2023b). A vorticity-divergence view of internal wave generation by a fast-moving tropical cyclone: insights from super typhoon mangkhut. J. Geophysical Research: Oceans 128, e2022JC019400. doi: 10.1029/2022jc019400
Chen C., Qin Z. (1985). On geostrophic adjustment process of oceanic motions. Scientia Sin. - Ser. B 28, 1093–1100. doi: 10.1360/yb1985-28-10-1093
Chen C., Reid R. O., Nowlin W. D. (1996). Near-inertial oscillations over the Texas-Louisiana shelf. J. Geophysical Research: Oceans 101, 3509–3524. doi: 10.1029/95jc03395
Chen C., Xie L. (1997). A numerical study of wind-induced, near-inertial oscillations over the Texas-Louisiana shelf. J. Geophysical Research: Oceans 102, 15583–15593. doi: 10.1029/97jc00228
Dong W., Feng Y., Chen C., Wu Z., Xu D., Li S., et al. (2021). Observational and modeling studies of oceanic responses and feedbacks to typhoons Hato and Mangkhut over the northern shelf of the South China Sea. Prog. Oceanography 191, 102507. doi: 10.1016/j.pocean.2020.102507
Egbert G. D., Erofeeva S. Y.. (2002). Efficient inverse modeling of barotropic ocean tides. J. Atmosp. Ocean. Technol. 19, 183–204. doi: 10.1175/1520-0426(2002)019,0183:EIMOBO.2.0.CO;2
Geisler J. E. (1970). Linear theory of the response of a two layer ocean to a moving hurricane. Geophysical Fluid Dynamics 1, 249–272. doi: 10.1080/03091927009365774
Gill A. E. (1984). On the behavior of internal waves in the wakes of storms. J. Phys. Oceanography 14, 1129–1151. doi: 10.1175/1520-0485(1984)014<1129:OTBOIW>2.0.CO;2
Guan S., Zhao W., Huthnance J., Tian J., Wang J. (2014). Observed upper ocean response to typhoon Megi (2010) in the Northern South China Sea. J. Geophysical Research: Oceans 119, 3134–3157. doi: 10.1002/2013jc009661
Hersbach H., Bell B., Berrisford P., Hirahara S., Horányi A., Muñoz-Sabater J., et al. (2020). The ERA5 global reanalysis. Q. J. R. Meteorological Soc. 146, 1999–2049. doi: 10.1002/qj.3803
Huang P. S., Sanford T. B., Imberger J. (2009). Heat and turbulent kinetic energy budgets for surface layer cooling induced by the passage of Hurricane Frances (2004). J. Geophysical Research: Oceans 114, C12023. doi: 10.1029/2009jc005603
Johnston T. M. S., Wang S., Lee C. Y., Moum J. N., Rudnick D. L., Sobel A. (2021). ). Near-inertial wave propagation in the wake of super typhoon Mangkhut: measurements from a profiling float array. J. Geophysical Research: Oceans 126, e2020JC016749. doi: 10.1029/2020jc016749
Klymak J. M., Alford M. H., Pinkel R., Lien R.-C., Yang Y. J., Tang T.-Y. (2011). The breaking and scattering of the internal tide on a continental slope. J. Phys. Oceanography 41, 926–945. doi: 10.1175/2010jpo4500.1
Lai D. Y., Sanford T. B. (1986). Observations of hurricane-generated, near-inertial slope modes. J. Phys. Oceanography 16, 657–666. doi: 10.1175/1520-0485(1986)016<0657:OOHGNI>2.0.CO;2
Leaman K. D., Sanford T. B. (1975). Vertical energy propagation of inertial waves: A vector spectral analysis of velocity profiles. J. Geophysical Res. 80, 1975–1978. doi: 10.1029/JC080i015p01975
Li R., Chen C., Dong W., Beardsley R. C., Wu Z., Gong W., et al. (2021). Slope-intensified storm-induced near-inertial oscillations in the south China Sea. J. Geophysical Research: Oceans 126, e2020JC016713. doi: 10.1029/2020jc016713
Liu J., He Y., Li J., Cai S., Wang D., Huang Y. (2018). Cases study of nonlinear interaction between near-inertial waves induced by typhoon and diurnal tides near the Xisha Islands. J. Geophysical Research: Oceans 123, 2768–2784. doi: 10.1029/2017jc013555
Liu L. L., Wang W., Huang R. X. (2008). The mechanical energy input to the ocean induced by tropical cyclones. J. Phys. Oceanography 38, 1253–1266. doi: 10.1175/2007jpo3786.1
Lu X., Yu H., Ying M., Zhao B., Zhang S., Lin L., et al. (2021). Western north Pacific Tropical cyclone database created by the China meteorological administration. Adv. Atmospheric Sci. 38, 690–699. doi: 10.1007/s00376-020-0211-7
Lu X., Dong C., Zhang H., Lim Kam Sian K. T. C., Yang J., Xu Z., et al. (2024). Observational analysis of vertical heat flux caused by typhoon‐induced near‐inertial waves under the modulation of mesoscale eddies. J. Geophys. Res.: Oceans 129, e2024JC021053. doi: 10.1029/2024jc021053
Lu Z., Shang X. (2024). Limited width of tropical cyclone-induced baroclinic geostrophic response. J. Phys. Oceanography. 54, 1071–1088. doi: 10.1175/JPO-D-23-0096.1
Lu Z., Wang G., Shang X. (2016). Response of a preexisting cyclonic ocean eddy to a typhoon. J. Phys. Oceanography 46, 2403–2410. doi: 10.1175/jpo-d-16-0040.1
Mackinnon J. A., Gregg M. C. (2005). Near-inertial waves on the New England Shelf: The role of evolving stratification, turbulent dissipation, and bottom drag. J. Phys. Oceanography 35, 2408–2424. doi: 10.1175/JPO2822.1
Pallàs-Sanz E., Candela J., Sheinbaum J., Ochoa J. (2016). Mooring observations of the near-inertial wave wake of Hurricane Ida (2009). Dynamics Atmospheres Oceans 76, 325–344. doi: 10.1016/j.dynatmoce.2016.05.003
Price J. F. (1981). Upper ocean response to a hurricane. J. Phys. Oceanography 11, 153–175. doi: 10.1175/1520-0485(1981)011<0153:UORTAH>2.0.CO;2
Price J. F. (1983). Internal wave wake of a moving storm. Part I: Scales, energy budget and observations. J. Phys. Oceanography 13, 949–965. doi: 10.1175/1520-0485(1983)013<0949:iwwoam>2.0.co;2
Price J. F. (1994). Forced stage response to a moving hurricane. J. Phys. Oceanography 24, 233–260. doi: 10.1175/1520-0485(1994)024<0233:fsrtam>2.0.co;2
Ren F., Liang J., Wu G., Dong W., Yang X. (2011). Reliability analysis of climate change of tropical cyclone activity over the western north Pacific. J. Climate 24, 5887–5898. doi: 10.1175/2011jcli3996.1
Sanford T. B., Price J. F., Girton J. B. (2011). Upper-ocean response to hurricane Frances (2004) observed by profiling EM-APEX floats. J. Phys. Oceanography 41, 1041–1056. doi: 10.1175/2010jpo4313.1
Schlosser T. L., Jones N. L., Bluteau C. E., Alford M. H., Ivey G. N., Lucas A. J. (2019). Generation and propagation of near-inertial waves in a Baroclinic current on the Tasmanian shelf. J. Phys. Oceanography 49, 2653–2667. doi: 10.1175/jpo-d-18-0208.1
Shearman R. K. (2005). Observations of near-inertial current variability on the New England shelf. J. Geophysical Res. 110, C02012. doi: 10.1029/2004jc002341
Warner J. C., Armstrong B., He R., Zambon J. B. (2010). Development of a coupled ocean–atmosphere–wave–sediment transport (COAWST) modeling system. Ocean Model. 35, 230–244. doi: 10.1016/j.ocemod.2010.07.010
Wu R., Jia L., Li C., Liu Y., Han B., Chen D. (2022). Impact of horizontal resolution (Submesoscale permitting vs. Mesoscale resolving) on ocean dynamic features in the South China Sea. Earth Space Sci. 9, e2022EA002448. doi: 10.1029/2022ea002448
Ying M., Zhang W., Yu H., Lu X., Feng J., Fan Y., et al. (2014). An overview of the China meteorological administration tropical cyclone database. J. Atmospheric Oceanic Technol. 31, 287–301. doi: 10.1175/jtech-d-12-00119.1
Zedler S. E., Niiler P. P., Stammer D., Terrill E., Morzel J. (2009). Ocean's response to Hurricane Frances and its implications for drag coefficient parameterization at high wind speeds. J. Geophysical Res. 114, C04016. doi: 10.1029/2008jc005205
Zhang H. (2023). Modulation of upper ocean vertical temperature structure and heat content by a fast-moving tropical cyclone. J. Phys. Oceanography 53, 493–508. doi: 10.1175/JPO-D-22-0132.1
Zhang H., Chen D., Zhou L., Liu X., Ding T., Zhou B. (2016). Upper ocean response to typhoon Kalmaegi (2014). J. Geophysical Research: Oceans 121, 6520–6535. doi: 10.1002/2016jc012064
Zhang H., He H., Zhang W.-Z., Tian D. (2021). Upper ocean response to tropical cyclones: a review. Geosci. Lett. 8, 1. doi: 10.1186/s40562-020-00170-8
Zhang H., Liu X., Wu R., Chen D., Zhang D., Shang X., et al. (2020). Sea surface current response patterns to tropical cyclones. J. Mar. Syst. 208, 103345. doi: 10.1016/j.jmarsys.2020.103345
Zhang H., Tian D., Sun Y., Yang M., Yang S., Zhou Y., et al. (2024). Unmanned vehicles probed inner-core air-sea conditions during Super Typhoon Koinu (2023). Sci. Bull. doi: 10.1016/j.scib.2024.10.018
Zhang H., Xie X., Yang C., Qi Y., Tian D., Xu J., et al. (2022). Observed impact of typhoon mangkhut (2008) on a continental slope in the South China Sea. J. Geophysical Research: Oceans 127, e2022JC018432. doi: 10.1029/2022jc018432
Keywords: air-sea interactions, near-inertial waves, ocean topography, ocean currents, marginal sea, moored observation, numerical simulation
Citation: Zhang H, Wu R, Liu F, Ni X and Tian D (2024) Near-inertial ocean response to a typhoon on a continental slope in the Northern South China Sea. Front. Mar. Sci. 11:1465492. doi: 10.3389/fmars.2024.1465492
Received: 16 July 2024; Accepted: 30 October 2024;
Published: 20 November 2024.
Edited by:
Chunyan Li, Louisiana State University, United StatesReviewed by:
Xueen Chen, Ocean University of China, ChinaFan Zhang, East China Normal University, China
Copyright © 2024 Zhang, Wu, Liu, Ni and Tian. This is an open-access article distributed under the terms of the Creative Commons Attribution License (CC BY). The use, distribution or reproduction in other forums is permitted, provided the original author(s) and the copyright owner(s) are credited and that the original publication in this journal is cited, in accordance with accepted academic practice. No use, distribution or reproduction is permitted which does not comply with these terms.
*Correspondence: Renhao Wu, d3VyZW5oYW9AbWFpbC5zeXN1LmVkdS5jbg==
 Han Zhang
 Renhao Wu
 Fu Liu5
 Xiaobo Ni
 Di Tian