- 1School of Civil Engineering and Architecture, Jiangsu University of Science and Technology, Zhenjiang, Jiangsu, China
- 2Institute of Geotechnical Engineering, Nanjing Tech University, Nanjing, Jiangsu, China
- 3Civil Engineering and Earthquake Disaster Prevention Center of Jiangsu Province, Nanjing, Jiangsu, China
Soft clay in the offshore area of the Yangtze River estuary has been investigated considering its basic physical properties. Forty-five unconfined compressive strength tests were conducted on the remolded marine soft clay to investigate the impacts of curing time T, water content w, plasticity index IP, and clay particle content ρc on the thixotropic static shear strength ratio As of the marine soft clay from the Yangtze River estuary. Results show that the stress–strain curves were primarily strain hardening and strain softening curve types. Unconfined compressive strength qu increased with an increase in T. All specimens with different basic physical properties were capable of thixotropic strength recovery. When T = 0–28 days, As increased rapidly, while for T > 28 days, As of most specimens increased slightly or tended to stabilize. The impacts of w, IP and ρc on As do not follow a consistent pattern, but there is a strong correlation between As and w/wL (wL is the liquid-limit water content). For w/wL < 0.75, As increased with increasing w/wL, whereas for w/wL ≥0.75, As decreased with increasing w/wL. We proposed a simple and widely applicable power function prediction model for the As of the soft clay from the Yangtze River estuary.
1 Introduction
Soft clays are widely distributed across marine sites around the world. Due to their unique sedimentary environment and consolidated state, the basic physical properties of marine soft clays differ substantially from those of terrestrial soils (Wu et al., 2023; Xiao et al., 2024). These differences are characterized by their low strengths, high porosity ratios, low permeability, high sensitivity, and high compressibility. Once disturbed, the structure of a marine-deposited soft clay is damaged, leading to a substantial decrease in its strength and flow behavior, thereby exhibiting thixotropy. In 1927, Peterfi first introduced the concept of “thixotropy,” which is used to describe a reversible phenomenon where a colloidal solution can be transformed from a liquid state to a solid state and then from a solid state to a liquid state. When the clayey soil is disturbed by external forces, it gets remolded, leading to a decrease in strength. However, after being left undisturbed for a certain period under constant temperature and humidity conditions, its strength increases. For example, during the installation of a pile or a suction anchor, the in situ marine clay is damaged and transformed into a remolded soil. After a marine structure such as a pile, anchor, or cable is installed, the lateral strength of the remodeled soil around its foundation will increase over time due to thixotropy. Part of this strength can provide sufficient frictional resistance for the pile or suction anchor in the early stage. The thixotropy of soft clays is important for the design of anchored foundations. For example, Kul’Chitskii (1975) found that about one month after disturbance, the strength of the soil around the pile was about twice that of the soil when it was first disturbed. Therefore, if the contribution of the thixotropy of the clay to the soil strength is taken into account in the design of the foundations for actual marine engineering sites, a significant amount of costs can be saved.
For a long time, many scholars have conducted extensive research on the thixotropy of soils involved in the geotechnical engineering field. Boswell (1949) conducted a thixotropy study on a large number of sediments in the geotechnical engineering field, and found that except for clean sands and gravels (Ma et al., 2024a; Ma et al., 2024b; Ma et al., 2024; Qin et al., 2024), most materials exhibited various degrees of thixotropy. Soft clays, in particular, exhibited higher thixotropy compared to other materials, and these thixotropic properties are commonly observed (Dullaert and Mewis, 2006; Seng and Tanaka, 2012; Shahriar et al., 2018; Peng et al., 2021a; 2021b; Ren et al., 2021). Moretto (1948) conducted unconfined compressive strength tests on four different clays and found that all four clays were capable of thixotropic strength recovery, with some of them recovering nearly to the strength levels of in situ clays. Alam et al. (2021) conducted unconfined compressive and direct shear tests, and found that the thixotropic strength of a clay mainly depends on its liquid limit, activity, clay particle content, and initial grain structure. Shahriar and Jadid (2018) conducted one-dimensional consolidation tests, and found that the yield stress of dredged clays increased with increasing thixotropic time, and they developed a prediction model for the yield stress ratio of dredged clays with different initial water contents. Tang et al. (2022) investigated the changes of mechanical properties of the clay from Zhanjiang during the thixotropic process. They quantitatively analyzed the relationships between the thixotropic time and the cohesion, internal friction angle, and initial tangential modulus, and developed the Duncan-Chang model that considers the thixotropy of clay. Yang et al. (2021) investigated the impacts of thixotropy and reconsolidation on the undrained shear strength and shear modulus of marine clays, and found that reconsolidation counteracted the increase in shear strength and shear modulus caused by thixotropy. Wei et al. (2023) identified significant thixotropy in loess and demonstrated that the increase in thixotropic strength of loess during the thixotropic process was due to increased cohesion and frictional force in the soil structure. Ren et al. (2024) conducted fall-cone tests and found that the thixotropic strength of a deep-sea clay increased rapidly in the early stage and then its increase slowed down with increasing thixotropic time. They also observed that during the thixotropic process, the microstructure of the clay changed from a dispersed structure with parallel-aligned particles to a well-flocculated dispersed structure.
The thixotropic properties of marine soft clays are crucial for maintaining the bearing capacities of offshore engineering foundations in the early stage, and deserve the attention of the engineering community during the designing of offshore engineering foundations (Ren et al., 2021). Although the above studies on the thixotropy of soft clays have achieved certain results, there is a lack of research on the thixotropy of the soft clay in the offshore area at the Yangtze River estuary due to its complex regional variations. In particular, there is a lack of analytical research on the impacts of its physical and mechanical properties on its thixotropy. In addition, there are few prediction models for the thixotropy of soft clays. Given the shortcomings of the above studies, we focused on water content w, plasticity index IP, clay particle content ρc, and curing time T, and conducted unconfined compressive strength tests to measure and analyze the thixotropy of the marine soft clay from the Yangtze River estuary. The research findings can provide reference data for the early-stage bearing capacities of actual engineering foundations at the Yangtze River estuary, and also help us understand more deeply the unique engineering properties of marine soft clays.
2 Test plan
2.1 Test materials and preparation of specimens
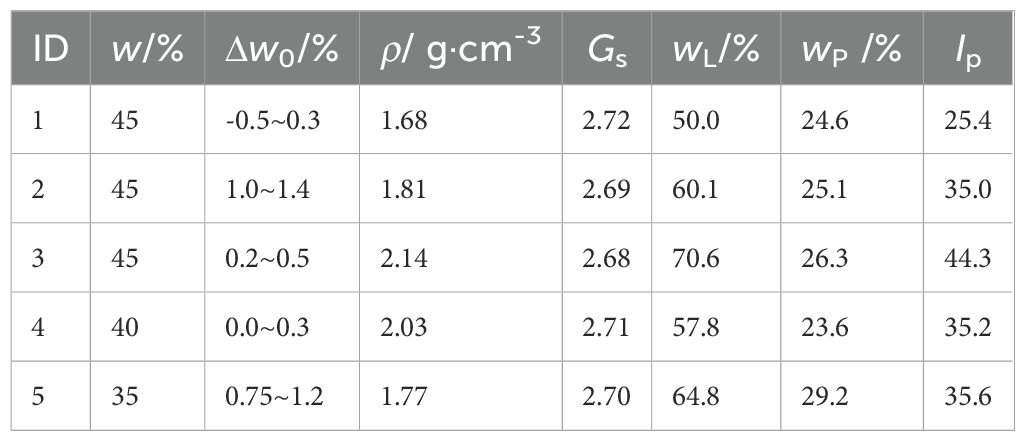
The specimens were taken from the offshore waters of the Qidong section of the Yangtze River estuary. The physical properties, including water content w, specific gravity Gs, natural density ρ, and plasticity index IP, were determined according to ASTM D2487-11 (2017); ASTM D854 (2014); ASTM D2216-982 (2019); ASTM D1556/D1556M (2015), and ASTM D4318 (2017), respectively. The results are summarized in Table 1. The measured IP and w of the in situ soil were used as the basic physical properties for the remolded specimens in the tests. The remolding procedure is as follows: 1) Dry, crush, and sieve the in situ soil (sieve pore size 0.25 mm); 2) Weigh the predetermined mass of soil (keeping the dry density at 1.5 g/cm3), add the corresponding mass of water according to the specified w, and mix thoroughly until the mixture becomes a uniform soil paste; 3) Fill the prepared uniform soil paste into a standard triaxial specimen-saturation mold in eight layers, and ensure high consistent compaction and uniform height for each layer; 4) Wrap the prepared cylindrical specimens with a diameter of 50 mm and height of 100 mm in plastic wrap, and store them a constant temperature and humidity environment (humidity of 98%, and temperature of 20°C) for curing times of 0, 7, 14, 28, and 60 days. Before the test, check the water contents of the cured specimens layer by layer. The difference between the cured water content and the initial water content Δw0 should not exceed 1.5% for the test to proceed.
2.2 Test instrument and test plan
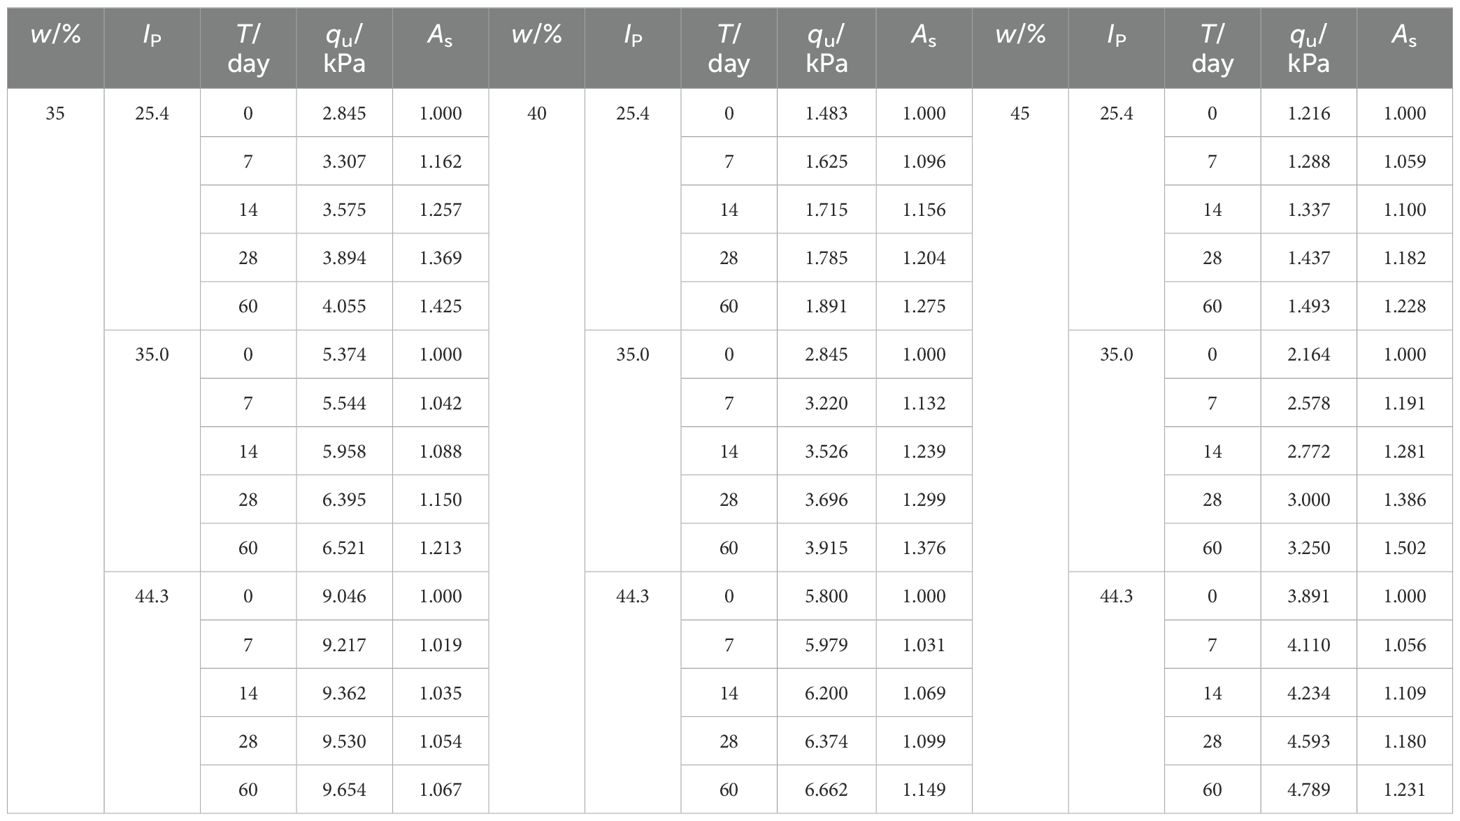
The unconfined compressive strength test is one of the common indoor tests for studying the thixotropic properties of clays. In this test, an electric strain-controlled unconfined pressure gauge was used, and specimens with an IP of 25.4, 35, and 44.3, respectively, were selected. Specimens with different IP values were prepared with water contents of (w) 35%, 40%, and 45%, respectively. Considering the impact of time on the thixotropic properties of the remodeled marine soft clay, five different curing times (T) of 0, 7, 14, 28, and 60 days were used to investigate their impacts on the thixotropic properties. Taking the above factors into account, we conducted a total of 45 unconfined compressive strength tests. The specific test conditions are shown in Table 2.
3 Analysis of test results
The thixotropic static shear strength ratio As is defined as follows:
where qu,t is the unconfined compressive strength qu with a curing time of T, and qu,0 is the qu with a curing time of 0. As reflects the recovery of the thixotropy static shear strength with any T. It is used to indicate the strength of the specimen. The qu and As of the specimens under different test conditions are shown in Table 3. The value of qu is defined as the peak strength when the specimen experiences a brittle failure, or the strength corresponding toa strain of 15%when the specimen experiences a plastic failure.
Figure 1 shows the axial stress–strain curves for the remodeled marine soft clay with different T values. As shown in the figure, the stress–strain curves are of two types: Strain hardening and stress softening curves. With IP = 25.4, all the stress–strain curves for the specimens with T = 0, 7, 14, 28 and 60 days are strain hardening stress–strain curves. With IP = 35.0, w = 35% or Ip = 44.3, w = 35%, the stress–strain curves for the specimens are strain softening stress–strain curves with the increase of T. With IP = 35, w = 45%, the stress–strain curves for the specimens gradually changed from strain hardening to strain softening stress–strain curves with the increase of T, in which case the primary failures are cracks on the surface. The main reasons for the different development patterns are the following. When the w of a specimen is low and its IP is high, its soil particles are fine and surface water film is thin. The water inside the specimen is mainly bound water, thereby resulting in tightly connected soil particles and a high unconfined compressive strength which will cause the specimen to experience a considerable brittle failure once a failure occurs. Conversely, as its w increases and IP decreases, the water inside the specimen is mainly free water and the bound water film becomes thicker. The water on the surface of the soil particles acts as a lubricant, which reduces the frictional resistance between them. This would result in a lower unconfined compressive strength, which will cause the specimen to experience a plastic failure once a failure occurs, and cause the stress to decrease or increase at a slower pace. It is noteworthy that with T = 0 days, all the stress–strain curves for the specimens are strain hardening stress–strain curves. As T increased, the axial stress–strain curves gradually changed to strain softening stress–strain curves, developing a relationship similar to the drained axial stress–strain relationship in over consolidated clays. This is mainly because with T = 0, the main factors affecting qu are the hardness and the newly formed structure of the soil. As the T increases, the thixotropic effect leads to a rearrangement of the soil particles, thus increasing the contact between them, and gradually forming a new structure. Under an external load, soil particles are compressed and slide, leading to the complete disappearance of its structural integrity, which ultimately results in a strain softening failure.
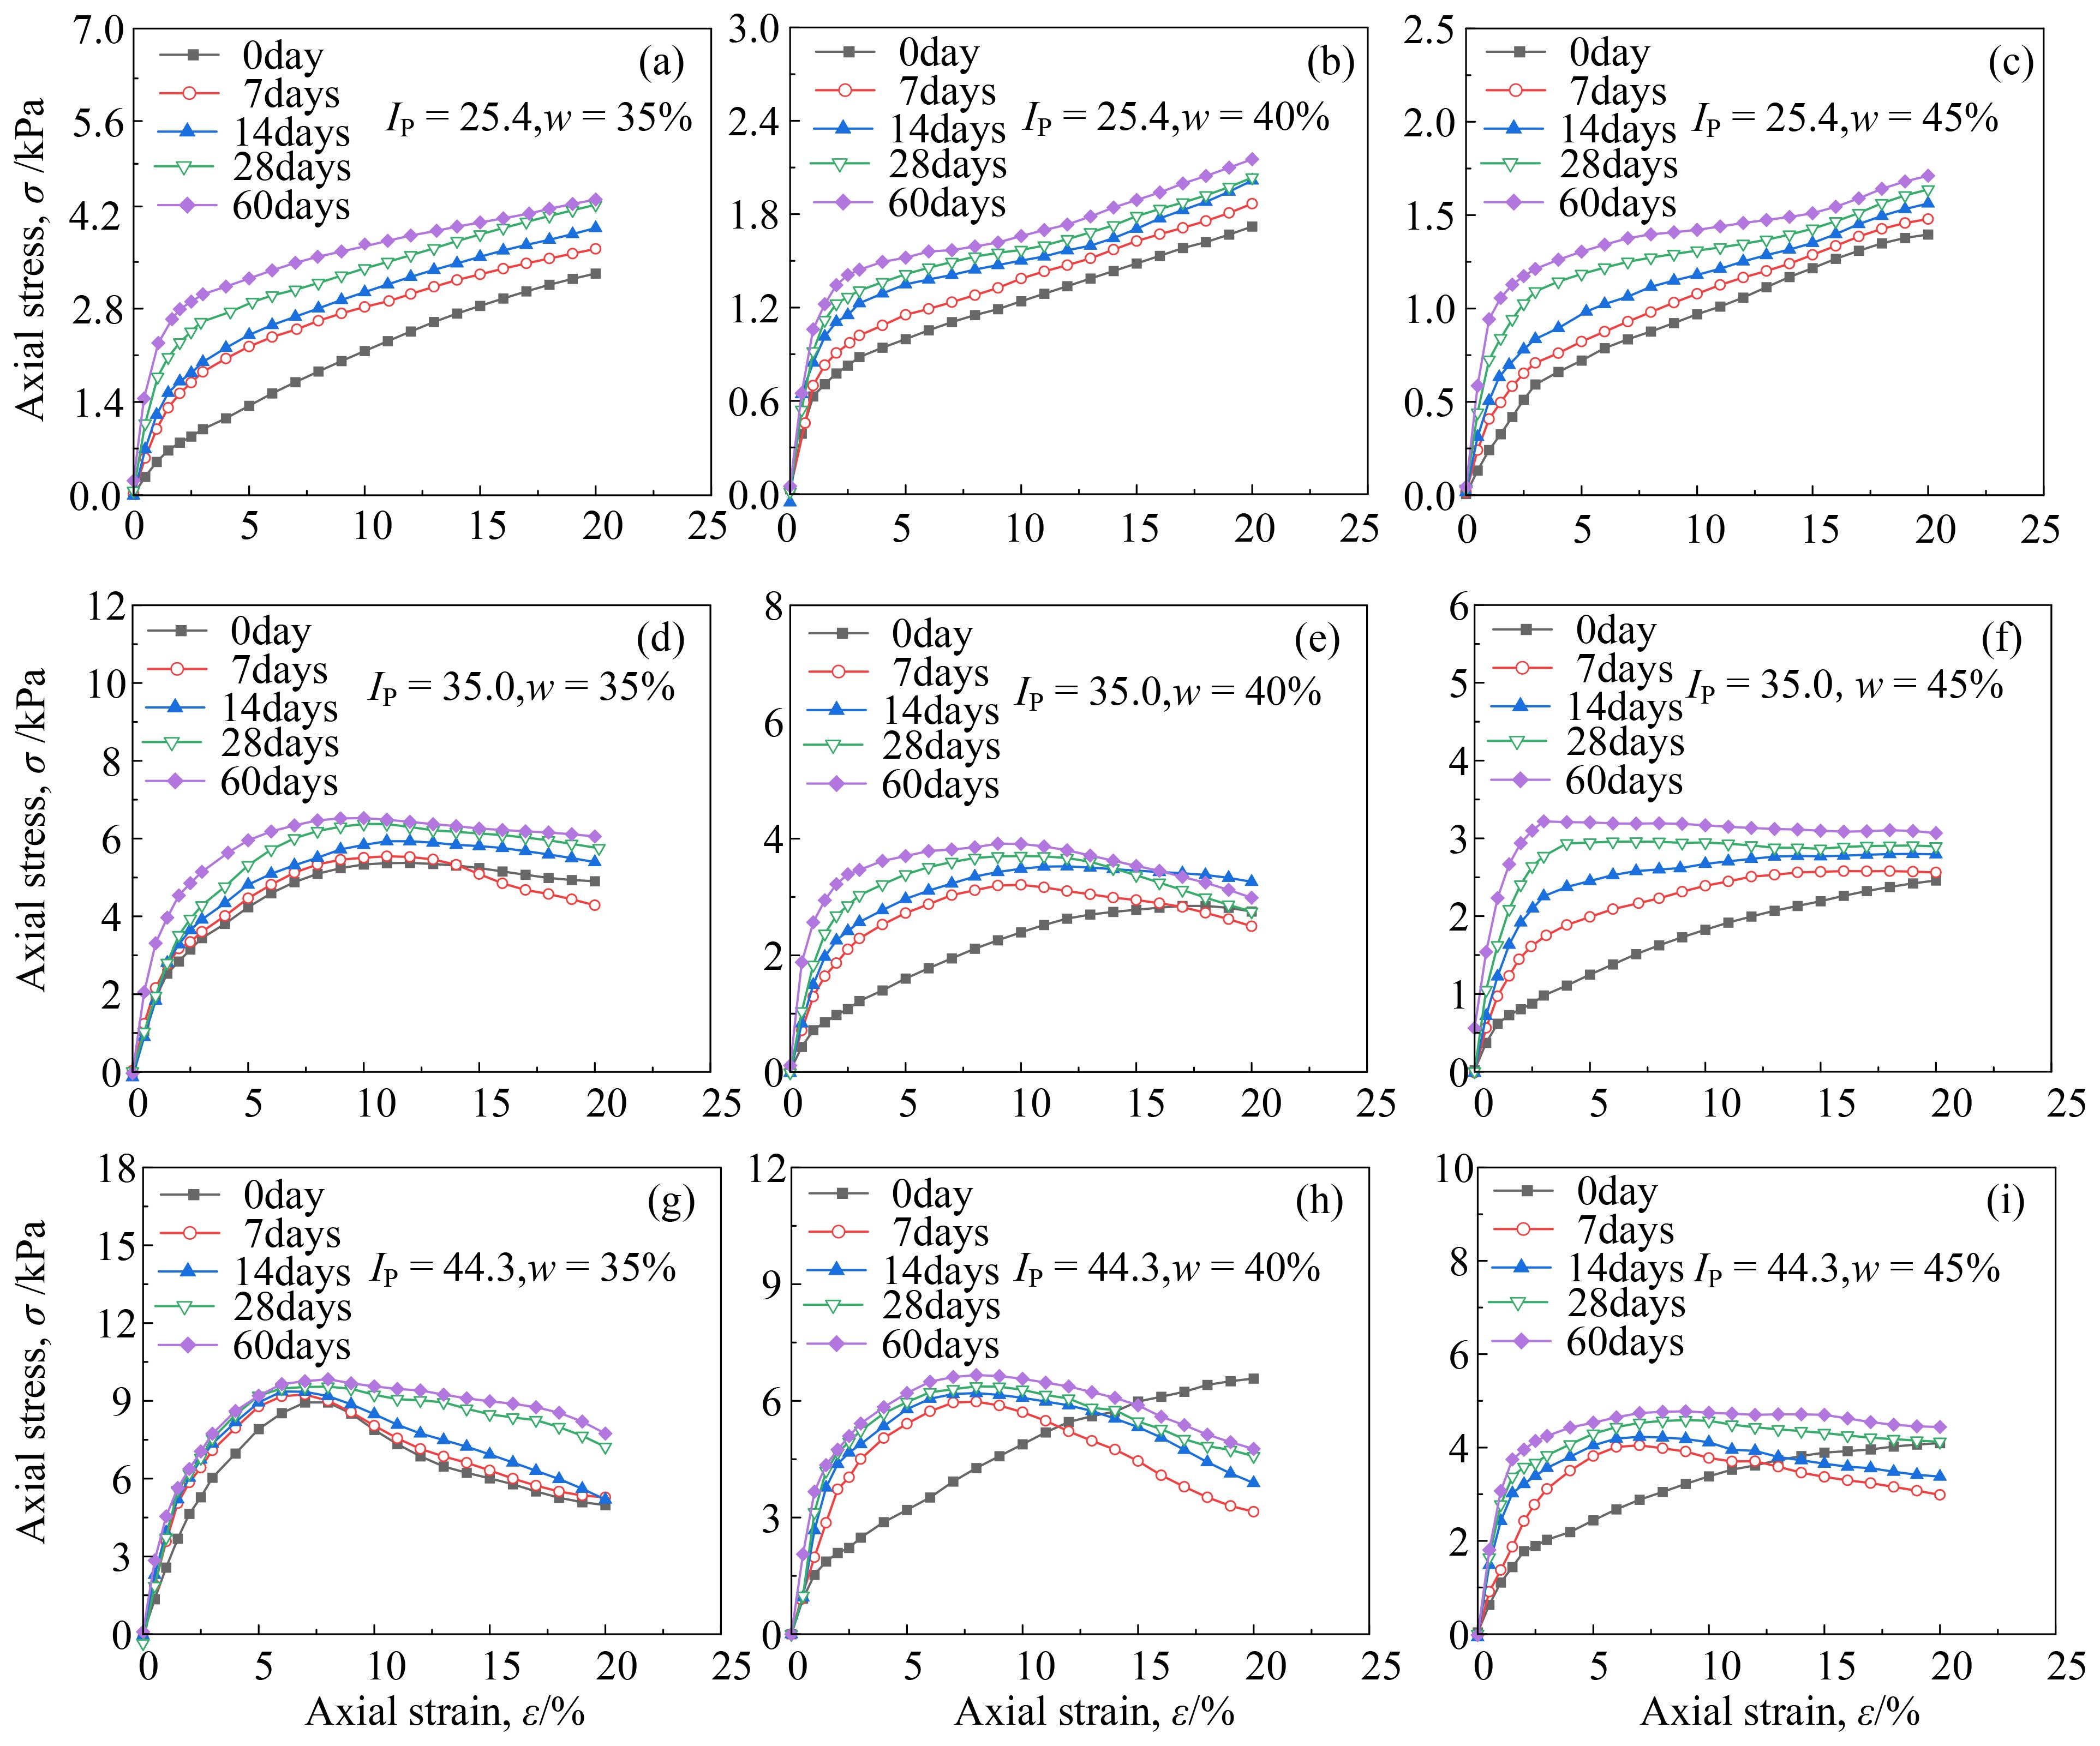
Figure 1. Axial stress–strain curves for the remodeled marine soft clay with different T values (A–I represent the test results under different conditions).
3.1 Recovery of the thixotropic strength
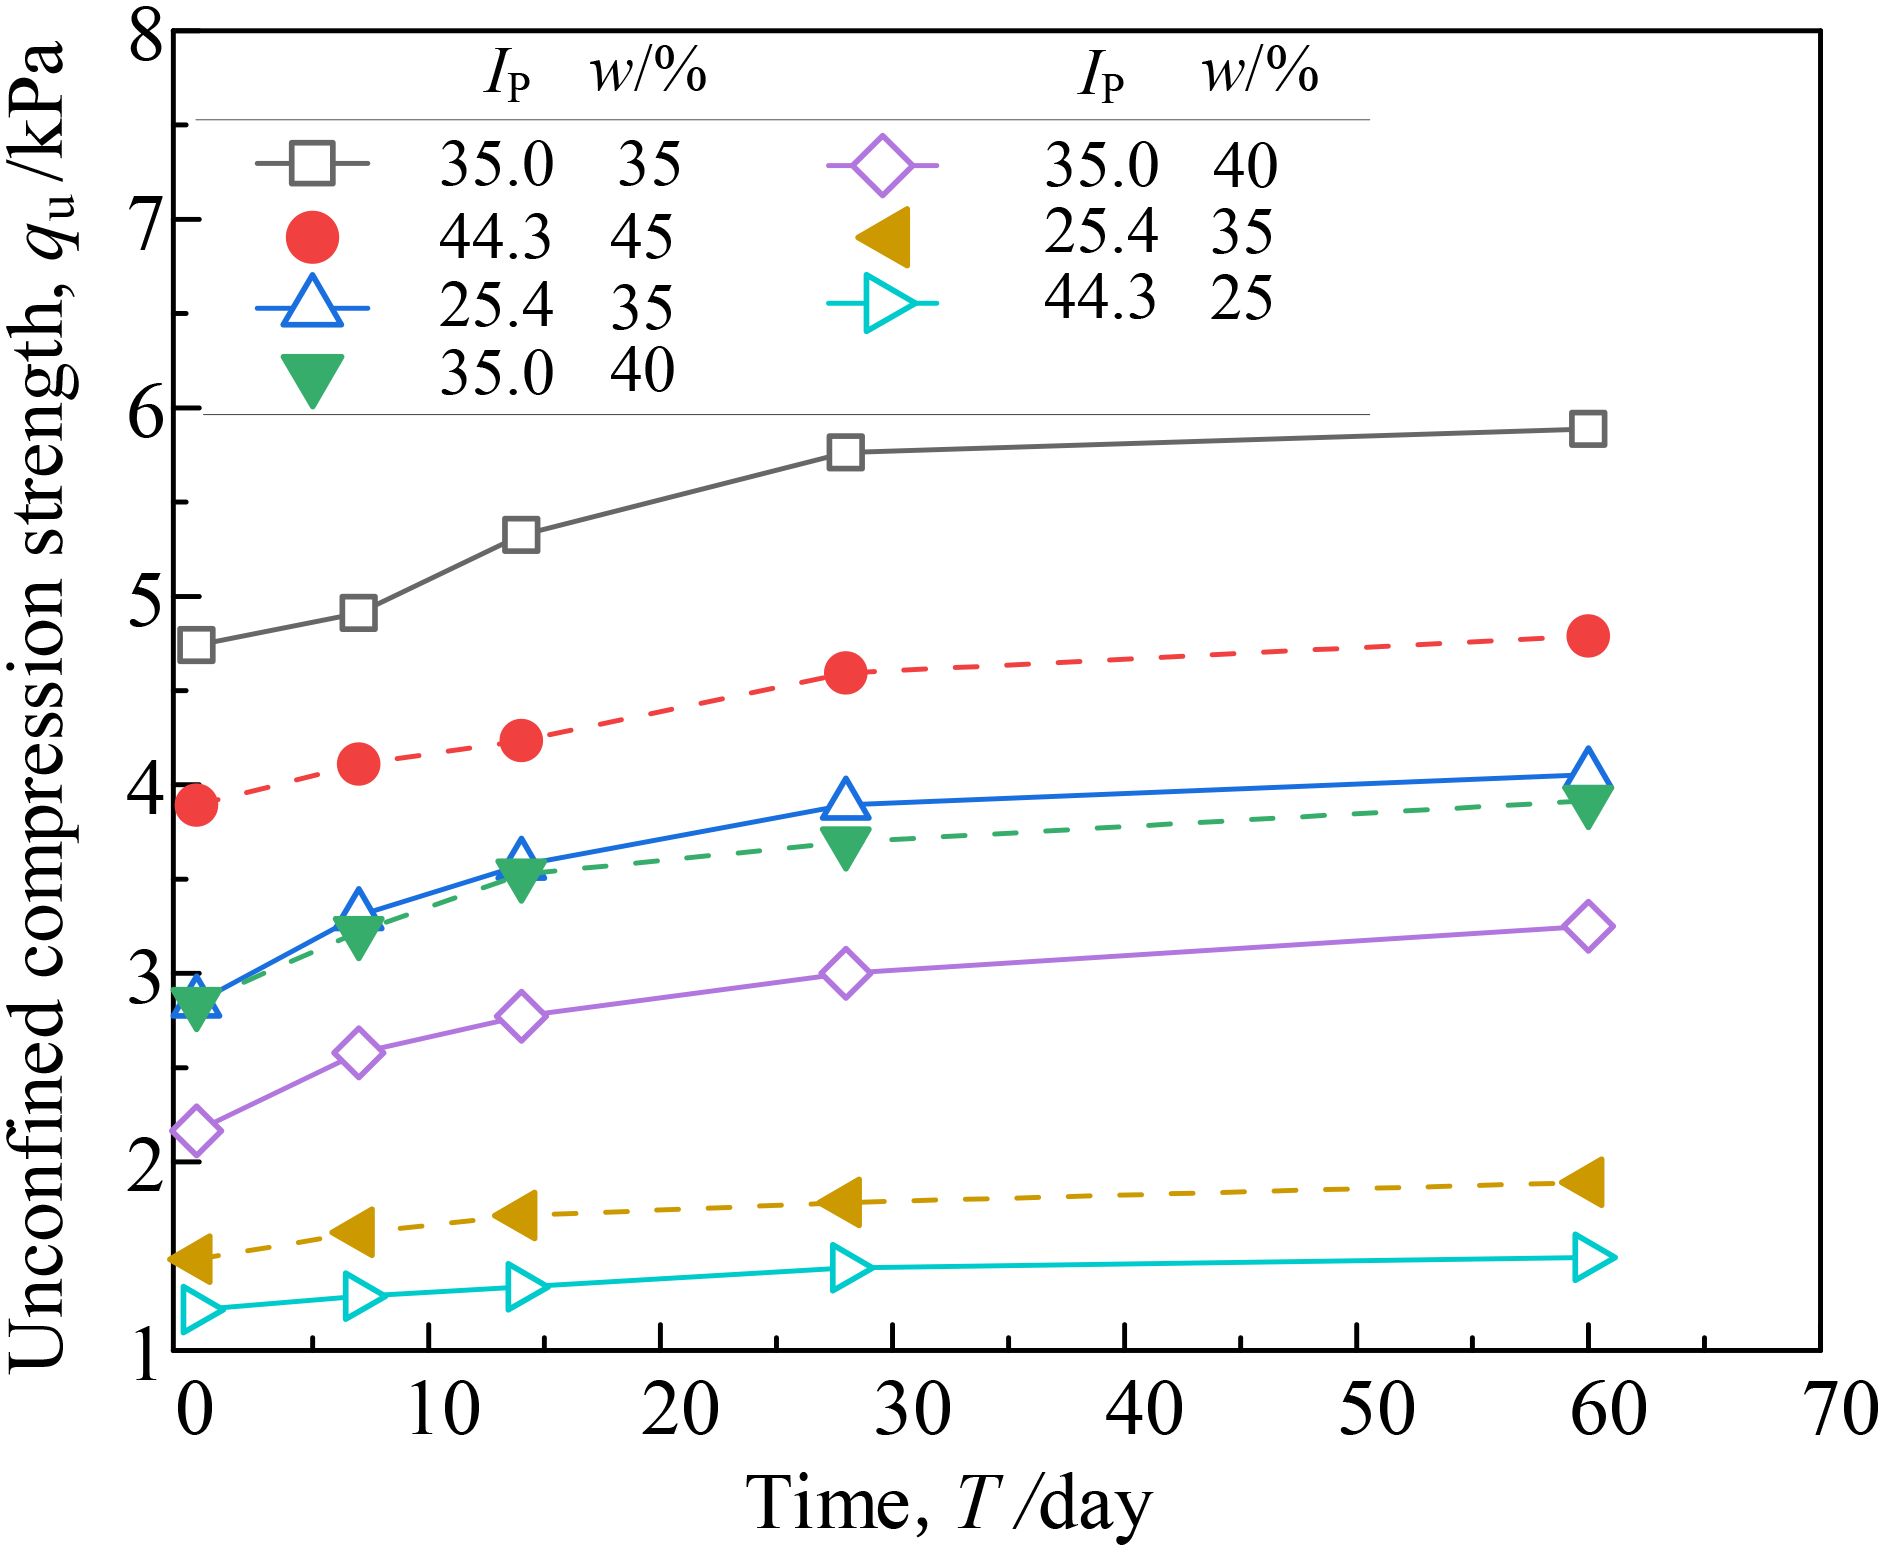
To investigate the impact of T on the unconfined compressive strength qu of the remolded marine soft clay, Figure 2 shows the qu- T curve. As shown in the figure, under the influence of the thixotropic effect, the qu of all specimens increased with the increase of T. All the specimens were capable of thixotropic strength recovery, with qu increasing rapidly in the early stage, and its increase slowing down in the later stage. With IP = 35.0 and w = 45%, the qu increased from 2.16 kPa to 3.25 kPa as the T increased from 0 to 60 days, marking a 50.18% increase in qu, and the highest thixotropic strength recovery capability. With IP = 35.0 and w = 35%, the qu increased from 5.37 kPa to 6.52 as the T increased from 0 to 60 days, marking a 21.34% increase in qu, and the lowest thixotropic strength recovery capability. In general, the remodeled marine soft clay under different test conditions showed different levels of thixotropic strength recovery capability. The qu increased with increasing T, but this does not imply that the qu would increase infinitely within an infinitely long curing time. For instance, the specimen with IP = 25.4 and w = 35% was measured to have a qu of 4.05 kPa after 60 days of curing, which is substantially lower than the strength of its in situ clay, i.e., 14.69 kPa.
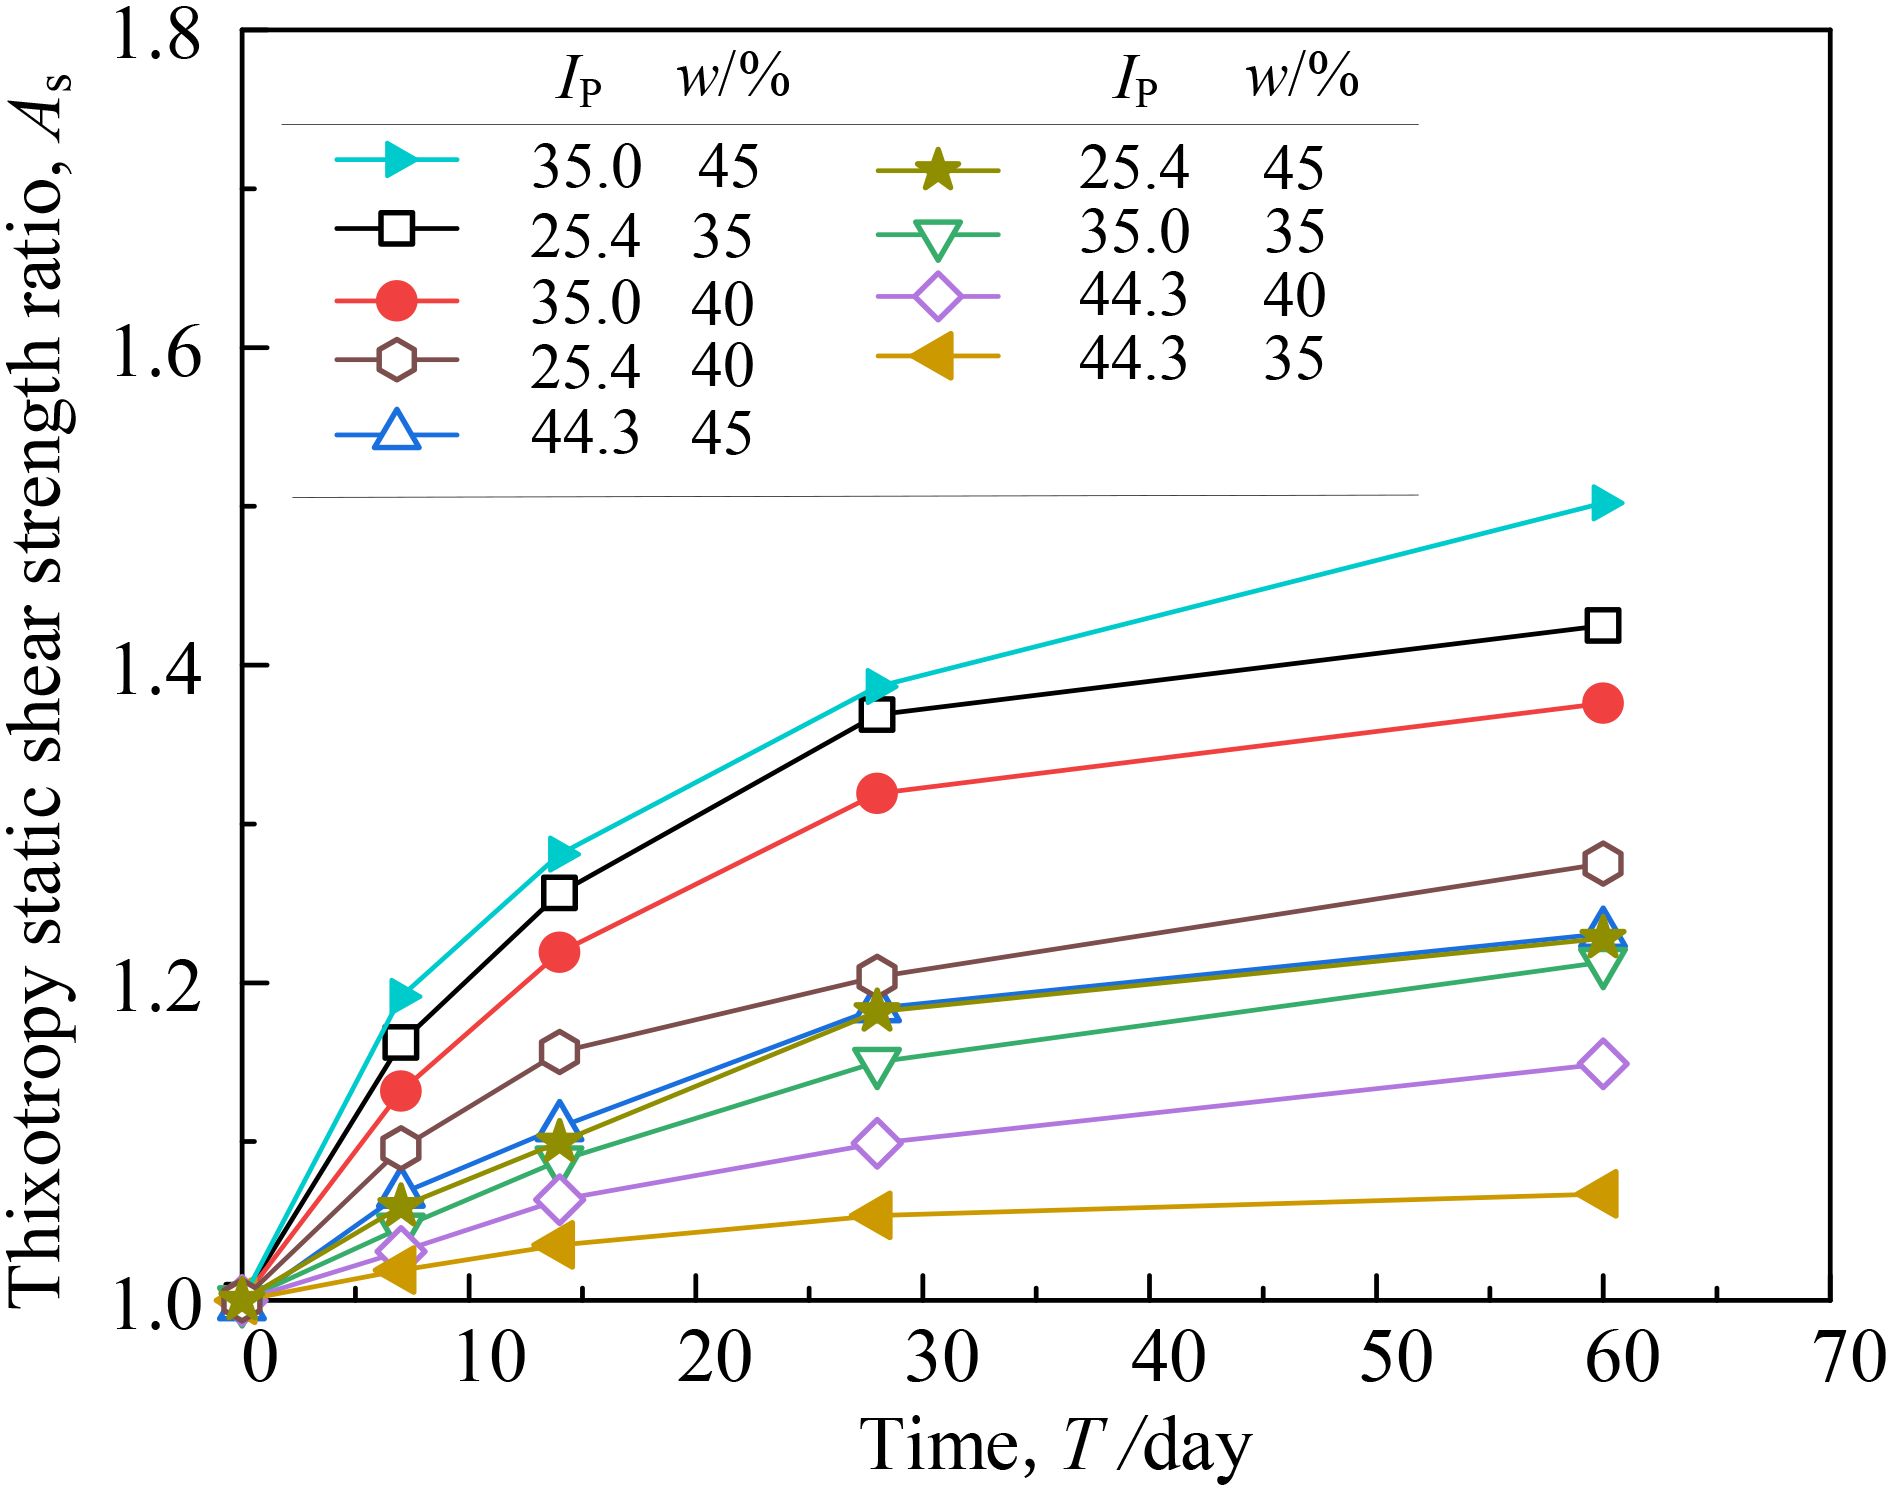
Figure 3 shows the As–T curves for the remolded marine soft clay under different test conditions. With T = 0–28 days, As increased rapidly; with T > 28, As of most specimens increased slightly or tended to stabilize. However, with IP = 35, and w = 45%, As of the specimens continued to increase after 28 days, demonstrating a high thixotropic strength recovery capability. With T = 60 days, the As of the specimen with IP = 35, and w = 45% was the highest, i.e., 1.5, among all specimens; the As of the specimen with IP = 25.4, and w = 35% was the second highest, i.e., 1.4; the As of the specimen with IP = 45, and w = 35% was the lowest, i.e., 1.2; the As values of the remaining specimens were in the range of 1.2–1.4. In general, the thixotropy of a soft clay is a prolonged and continuous process.
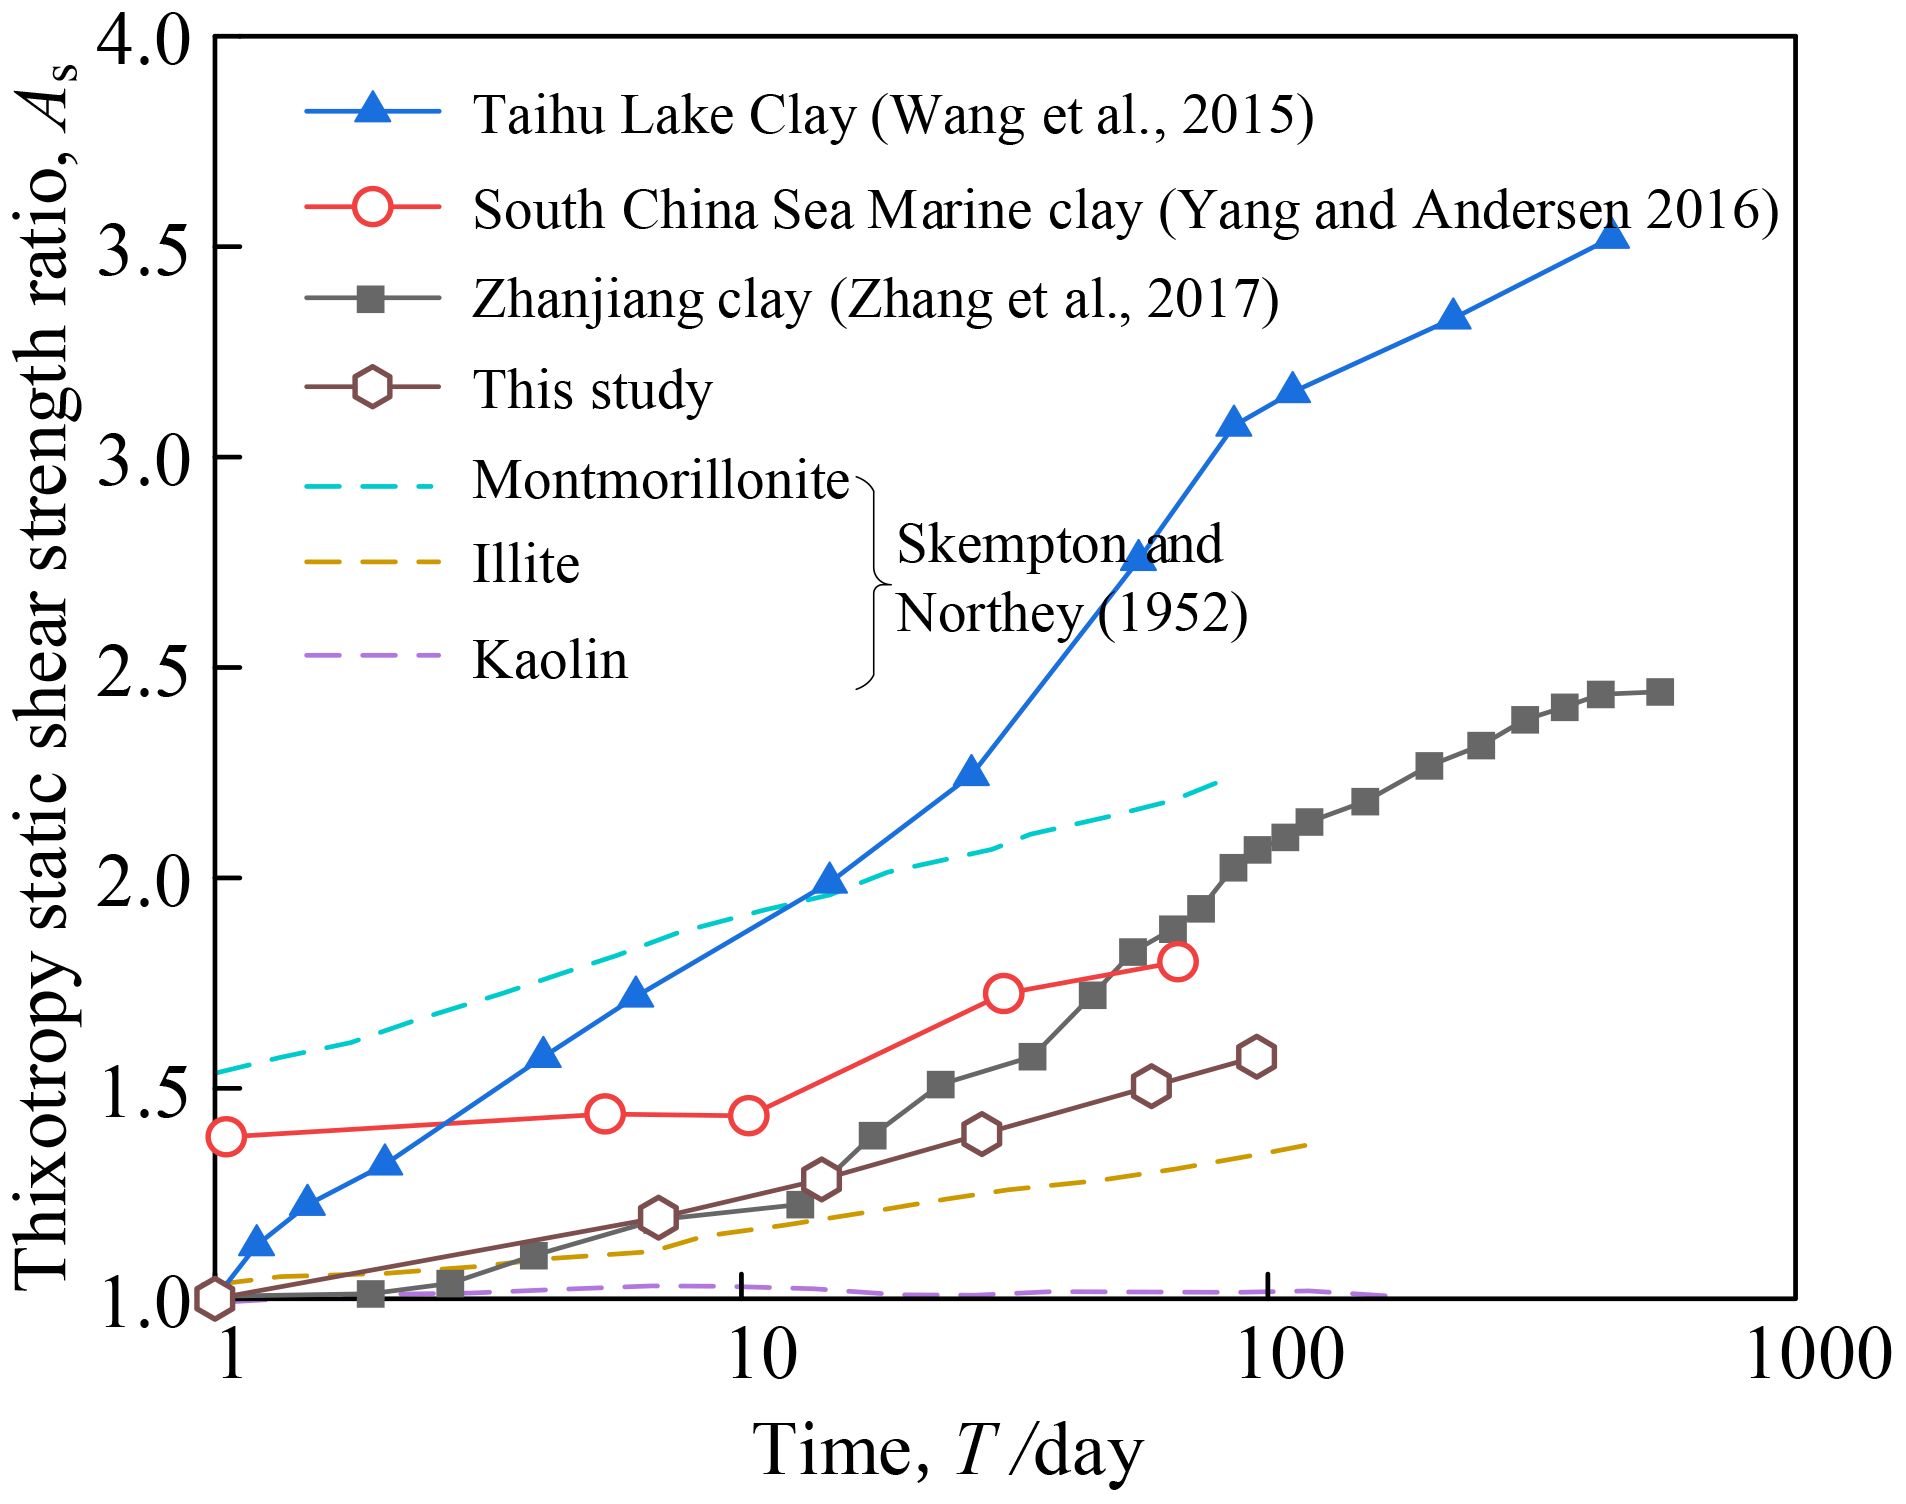
Figure 4 shows the As- T curves for the soft clay from the Yangtze River estuary and clayey soils from other regions Taihu Lake (Wang et al., 2015), Zhanjiang (Zhang et al., 2017), and South China Sea (Yang and Andersen, 2016). The figure also contains data for three pure clay minerals: montmorillonite, illite, and kaolin (Skemption and NorThey, 1952). As shown in the figure, with T < 14 days, the As of the clay from the Yangtze River estuary is close to those of the clay from Zhanjang and illite; with T > 14 days, the As of the clay from the Yangtze River estuary is higher than that of illite, but lower than that of the clay from Zhanjiang. With T = 0, 7, 14, 28, 60, and 100 days, the As of the clay from the Yangtze River estuary is significantly lower than those of the marine clay from the South China Sea, montmorillonite, and clay from Taihu Lake, and its As variation curve clearly lies below the curves for the clays from these three regions, indicating a lower thixotropic strength recovery capability of the clay from the Yangtze River estuary. In addition, the As values of the three pure clay minerals differed considerably. Despite increasing T, Kaolin showed no thixotropic effect with an As being close to 1.0. The As of illite increased linearly but with a lower thixotropy, and reached approximately 1.35 with T = 100 days. Montmorillonite showed the highest thixotropy compared to the other two clay minerals, with its As peaking at 2.75 with T = 100 days.
The thixotropic static shear strength ratio As is defined as the ratio of the strength with a curing time of T to the strength with a curing time of 0. This ratio can reflect the variation in the static shear strength of a soil over the curing time, and is used to evaluate the variation in the thixotropic strength. As can be used to indicate the relative variation in the static shear strength, rather than the absolute variation. Based on this, to further evaluate the absolute variation in the static shear strength of the remodeled marine soft clay under the influence of the thixotropic effect, the following equation is used to define the thixotropy static shear strength recovery ratio Bs:
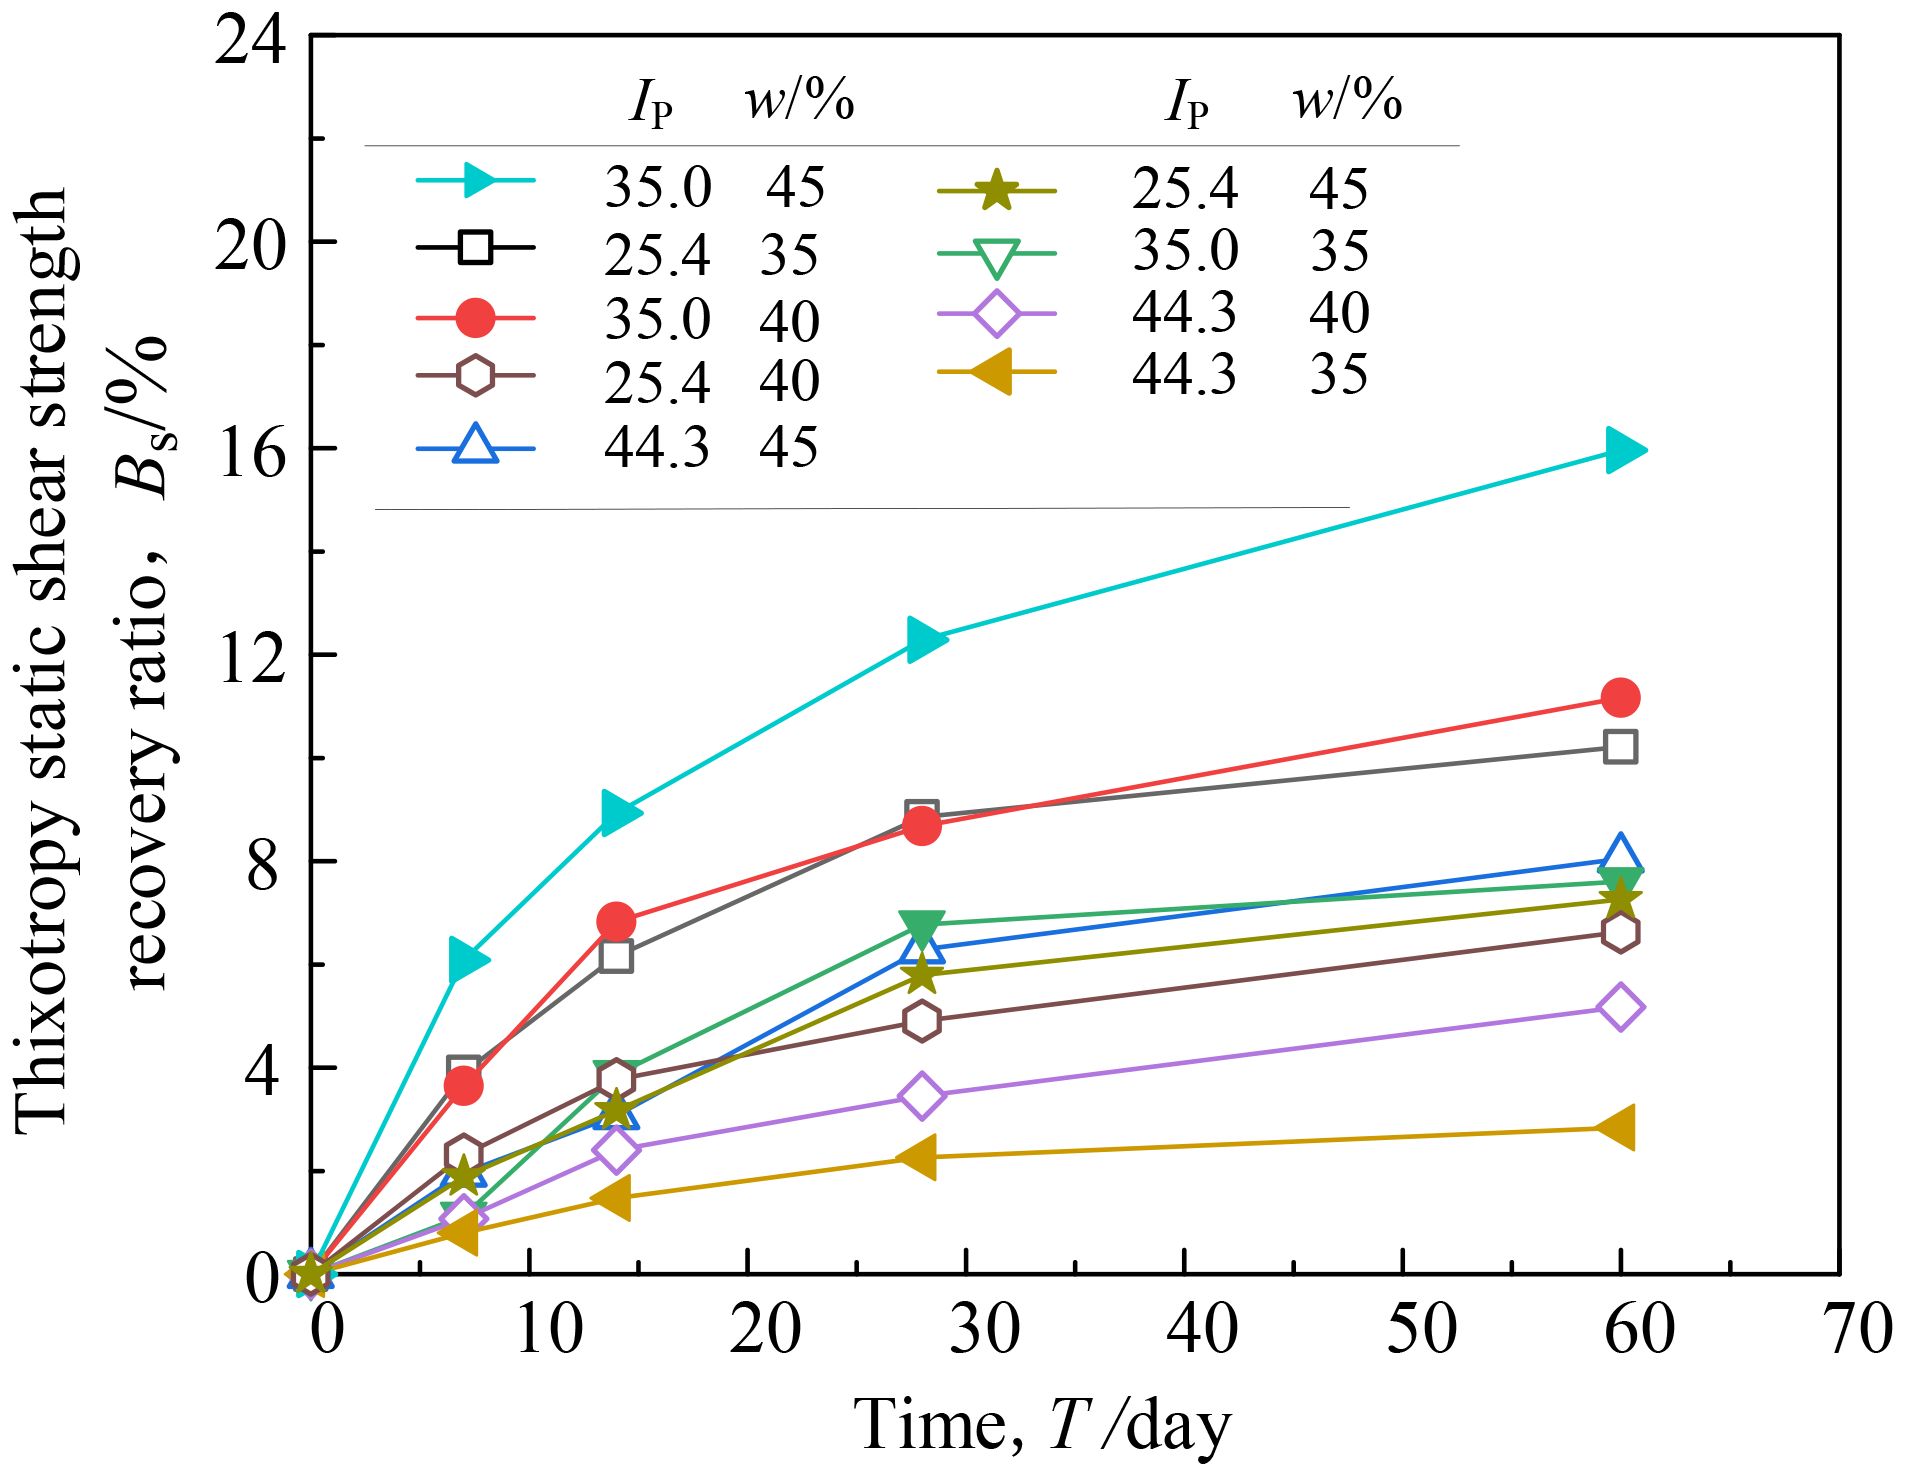
Bs can represent the percentage ratio of the strength recovered during the thixotropic process to the strength lost due to disturbance (Zhang et al., 2017). Figure 5 shows the Bs–T curves for the specimens under different test conditions. As shown in the figure, the two specimens with the highest and lowest Bs also have the highest and lowest As, respectively. However, not all test conditions show a one-to-one correspondence in their arrangement. A comparison of Figures 3 and 5 shows that a specimen with a high As does not necessarily have a high Bs (e.g., the specimen with IP = 25.4 and w = 35%), while a specimen with a low As has a high Bs (e.g., the specimen with IP = 35 and w = 35%). This is mainly related to the differences in the basic physical properties of the specimens. When the soil is disturbed by external factors, the cohesion between soil particles and the balance system of anions and cations are disrupted, leading to the destruction of the naturally formed soil structure, and a decrease in soil strength. Although its thixotropy will recover some strength, the recovery is limited. In this study, the thixotropy static shear strength of the soft clay from the Yangtze River estuary recovered after 60 days of curing only accounted for 3.1%–16% of the strength lost due to disturbance. This indicates that even with a long curing time, it is difficult for a clayey soil to restore to its in situ strength, reflecting the fact that all clayey soils are partially thixotropic (Zhang et al., 2017).
3.2 Impact of IP on As
Figure 6 shows the Ip–As curves with different T values. As shown in figure, with w = 35%, the As of the specimens with different T values decreased with the increase of Ip. The specimens with w = 35% and IP = 44.3 had the lowest As in the range of 1.02–1.07 during a curing time of 7–60 days; the specimen with w = 35% and IP = 25.4 had an As in the range of 1.16–1.43 during a curing time of 7–60 days. With w = 40% or w = 45%, the As of the specimen first increased and then decreased with the increase of Ip. Hence, with different w values, the impact of w on As does not follow a monotonic pattern. This is mainly related to the structural differences between different clay minerals. When w is moderate, a higher IP means a larger specific surface area, which facilitates particle rearrangement and exchange of ions. These influencing factors can, to a certain extent, promote the occurrence of the thixotropic effect in soft clays. In addition, with the same IP, the As of all the specimens increased with the increase of T. With T = 7 days, the As of each specimen was the lowest, and with T = 60 days, the As of each specimen was the highest.

Figure 6. As–IP curves for the remolded marine soft clay with different T values (A–C represent different moisture contents).
3.3 Impact of ρc on As
Figure 7 shows the As–ρc curves with different T values. ρc is the proportion of the mass of particles with a diameter < 0.005 mm to the total mass. This value reflects the fineness of the soil particles and their ability to adsorb bound water. As shown in the figure, with w = 35%, As increased with increasing ρc during a curing time of 7, 14, 28 or 60 days; with w = 40% or w = 45%, As increased first and then decreased with increasing ρc with different T values. The specimen with w = 45% and ρc = 35.6 reached its highest As of 1.5 with T = 60 days, while the specimen with w = 35% and ρc = 33.8 had an As of only 1.02 with T = 7 days. In general, the impact of ρc on As does not follow a monotonic pattern. The higher the ρc, the higher the capacity of the soil to adsorb bound water, and with an appropriate w, the more likely the soil particles will be rearranged to form a new structure more favorable for thixotropy.

Figure 7. As–ρc curves for the remolded marine soft clay with different T values (A–C represent different moisture contents).
3.4 Impact of w on As
Mitchell (1960) pointed out that w is a major parameter affecting the thixotropic properties of soils. Figure 8 shows the As–w curves for the remolded marine soft clay with different T values. With IP = 25.4, As decreases with increasing w with different T values; with IP = 25.4 or IP = 45, As increases with increasing w with different T values. Hence, with different IP values, the impact of w on As does not follow a monotonic patter. In addition, with the same w, As increases with increasing T.

Figure 8. As–w curves for the remolded marine soft clay with different T values (A–C represent different plasticity indices).
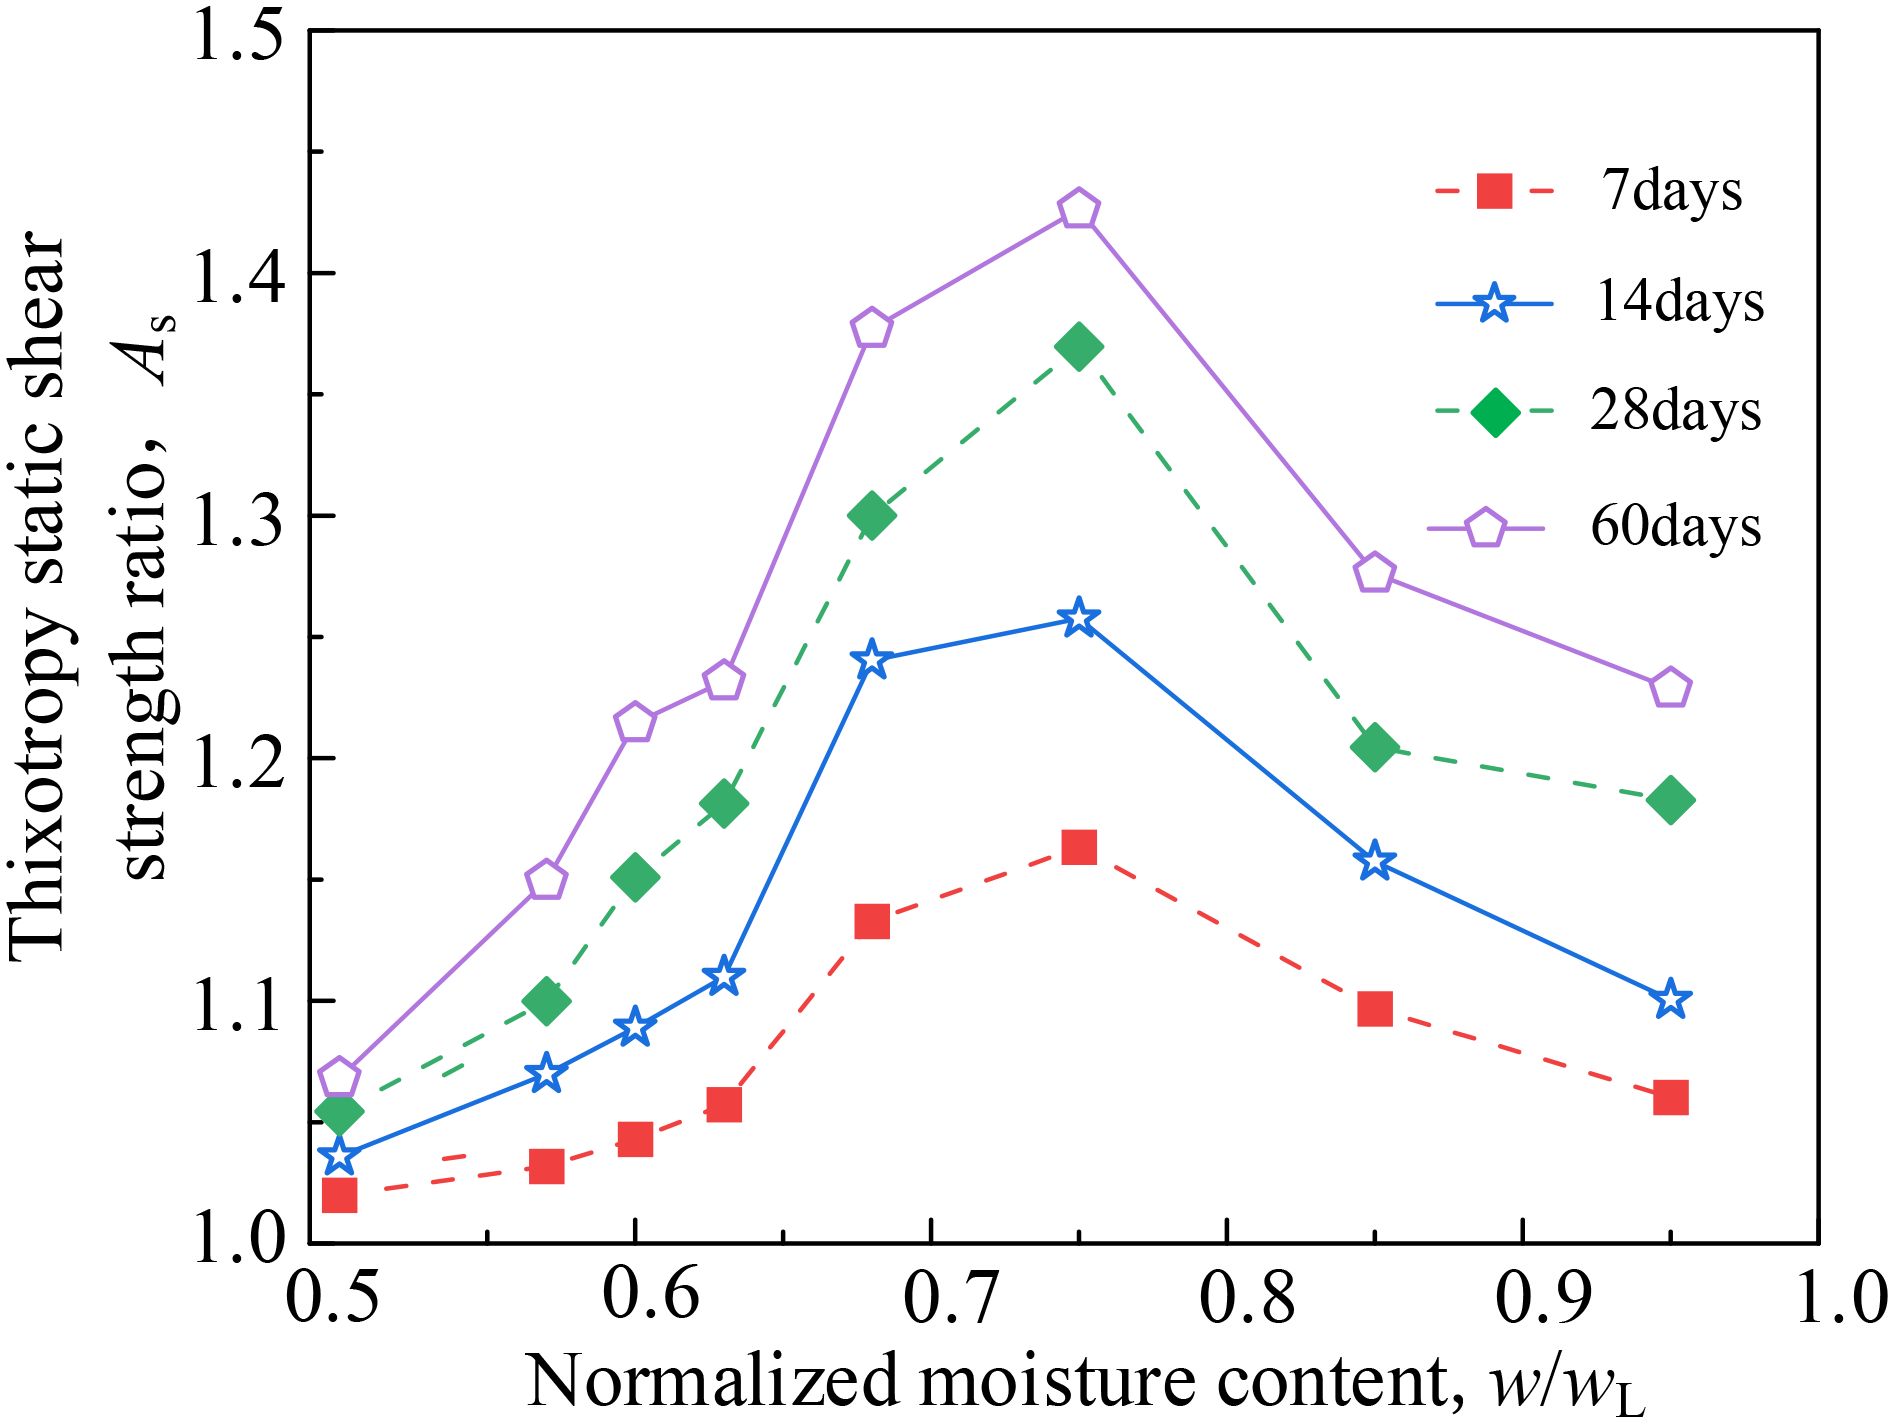
In summary, the impacts of w, IP and ρc on As do not follow a monotonic pattern. In addition, due to differences in surface area and mineral composition, soils vary in their capacity to adsorb bound water. With the same w, in a specimen with a high IP, all the water may be bound water, while in a specimen with a low IP, a significant portion of water may already be free water. Investigating the impact of w or IP on the thixotropic static shear strength ratio As may not fully explain the thixotropic properties of a marine soft clay. Therefore, we introduced the normalized water content w/wL, which can comprehensively reflect the combined impact of w and IP on As. It is analogous to the liquidity index, which can comprehensively reflect the hardness of a soil. Normalized water content w/wL is an important parameter for assessing the thixotropic properties of clayey soils, and many scholars have studied its impacts on As. Skemption and NorThey (1952) reported that with w/wL < 1, As would decrease with decreasing w. Mitchell (1960) found that when w/wL is in the range of 0.56–0.74, soils exhibit a significant thixotropic effect. Shahriar and Jadid (2018) found that with w/wL = 0.75, the As of a soil will reach its highest value. Based on the above research findings, the threshold value of the normalized water content w/wL with respect to its impact on As is 0.75. However, due to differences in the basic physical properties of the marine soft clay, to investigate the impact of w/wL on the As of the remolded marine soft clay, the As–w/wL curves with different T values are shown in Figure 9. It can be observed that with different T values, As first increased and then decreased with increasing w/wL. With T = 7 days, As was the lowest. With T = 60 days, w/wL increased from 0.5 to 0.75, and As increased from 1.07 to 1.43; with w/wL > 0.75, As decreased, and with w/wL = 0.95, As decreased to 1.23. This indicates that with w/wL = 0.75, As was the highest. The above results are consistent with the findings of Shahriar and Jadid (2018) regarding the impact of w/wL on As. However, due to complex regional variations and differences in basic physical properties of the marine soft clay, As values of the marine soft clay with different w/wL ratios differ from one another.
w/wL can comprehensively reflect the thickness of the electric double layer as well as the relative contents of bound water and free water in a soil, thereby affecting the thixotropic properties of the soil. Mitchell (1960) hypothesized the mechanism of thixotropy in soils, suggesting that after the soil is disturbed to a remolded state, a significant amount of energy remains in the soil. This energy induces the rearrangement of particles and the movement of water molecules until the energy is dissipated, and the internal structure of the soil reaches a state of equilibrium. In addition, the attraction between soil particles is closely related to the spacings between them. Even slight changes in spacings can considerably impact the soil strength. Therefore, with a constant w/wL, particle movement is the primary factor in strength recovery. For a soft clay, when its w/wL is low (w/wL = 0.5), there is less free water between soil particles, and most of the water is bound water. The bound water films around the soil particles are very thin, and bound water is affected significantly by the electric field, thus resulting in a strong attraction between particles, which makes it difficult for the soil particles to spontaneously rearrange during the thixotropic process, thereby leading to a lower thixotropic strength recovery capability of the soil. When the normalized water content is moderate (w/wL ≈ 0.75), the amount of free water between particles increases. During the thixotropic process, free water flows through the inter-particle pores, carrying clay particles to fill the pores. The thickness of the electric double layer around clay particles is moderate, and the spacings between particles are appropriate. This allows for more spontaneous movement and rearrangement of particles, facilitating the formation of a new flocculated structure, and thereby leading to a higher thixotropic strength recovery capability of the soil. When the normalized water content is high (w/wL > 0.75), there is a significant amount of free water between soil particles, and the thickness of the electric double layer increases, which increases the spacings between particles. This would result in a very weak attraction during the thixotropic process, making it difficult for the particles to form a new flocculated structure, thereby leading to a lower thixotropic strength recovery capability of the soil.
4 Prediction model for the thixotropic static shear strength ratio
As is an important parameter used to characterize the recovery of the thixotropy static shear strength of a soft clay under static loading. In practical engineering, it would be cost saving if the contribution of As to the strength of the clay is taken into account. In order to facilitate the design and construction of actual engineering sites, it is necessary to establish relationships between the thixotropic static shear strength ratio AS and the parameters. This study analyzed a total of 45 tests in the test plan, and developed a power function model between the thixotropic static shear strength ratio and the curing time as shown in Equation 3:
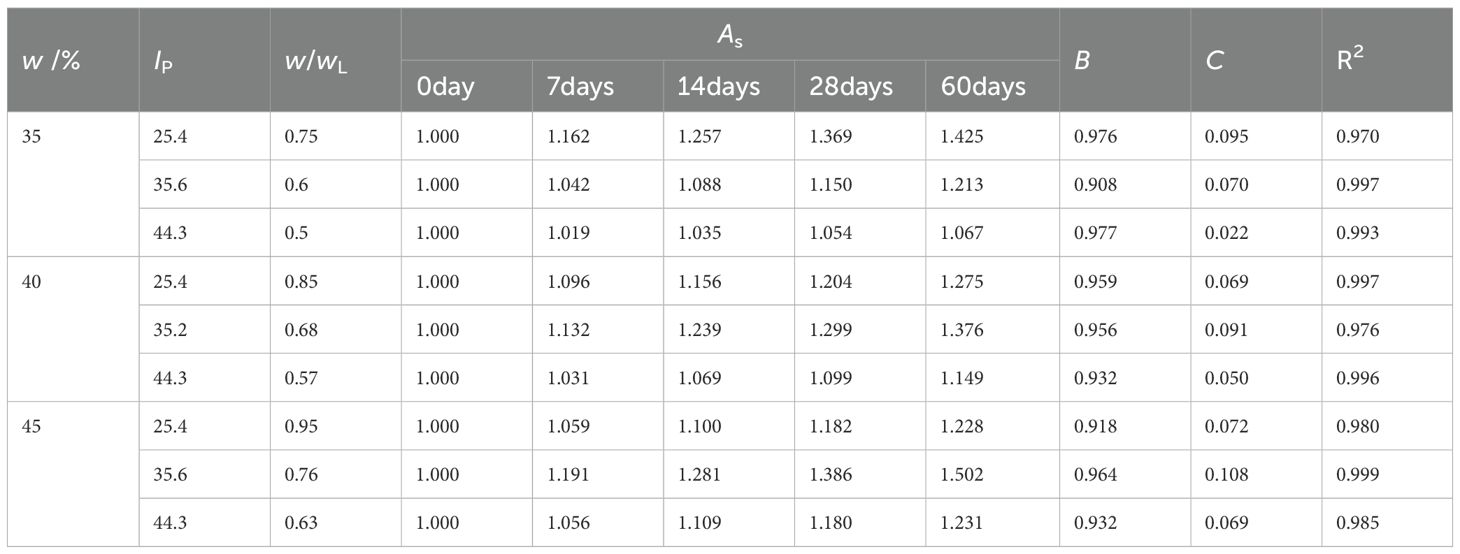
where As is the thixotropic static shear strength ratio; T is the curing time; B and C are the fitting parameters. Equation 3 was used to fit the As of the remolded marine soft clay from the Yangtze River estuary. Table 4 lists the values of As of the specimens under different test conditions as well as the values of the fitting parameters calculated using Equation 3.
In summary, the impact of w/wL on As depends on a threshold value of 0.75. With w/wL < 0.75, As increases with the increase of w/wL; with w/wL > 0.75, As decreases with the increase of w/wL. Therefore, to better distinguish between the two scenarios, Figure 10 shows the As–T curves with w/wL ≤ 0.75 and w/wL ≥ 0.75, respectively. As shown in Figure 10, the overall fitting results are better when the power function model is used for fitting. Under certain thixotropic static conditions, the prediction equation for As proposed in this section is both reliable and effective.
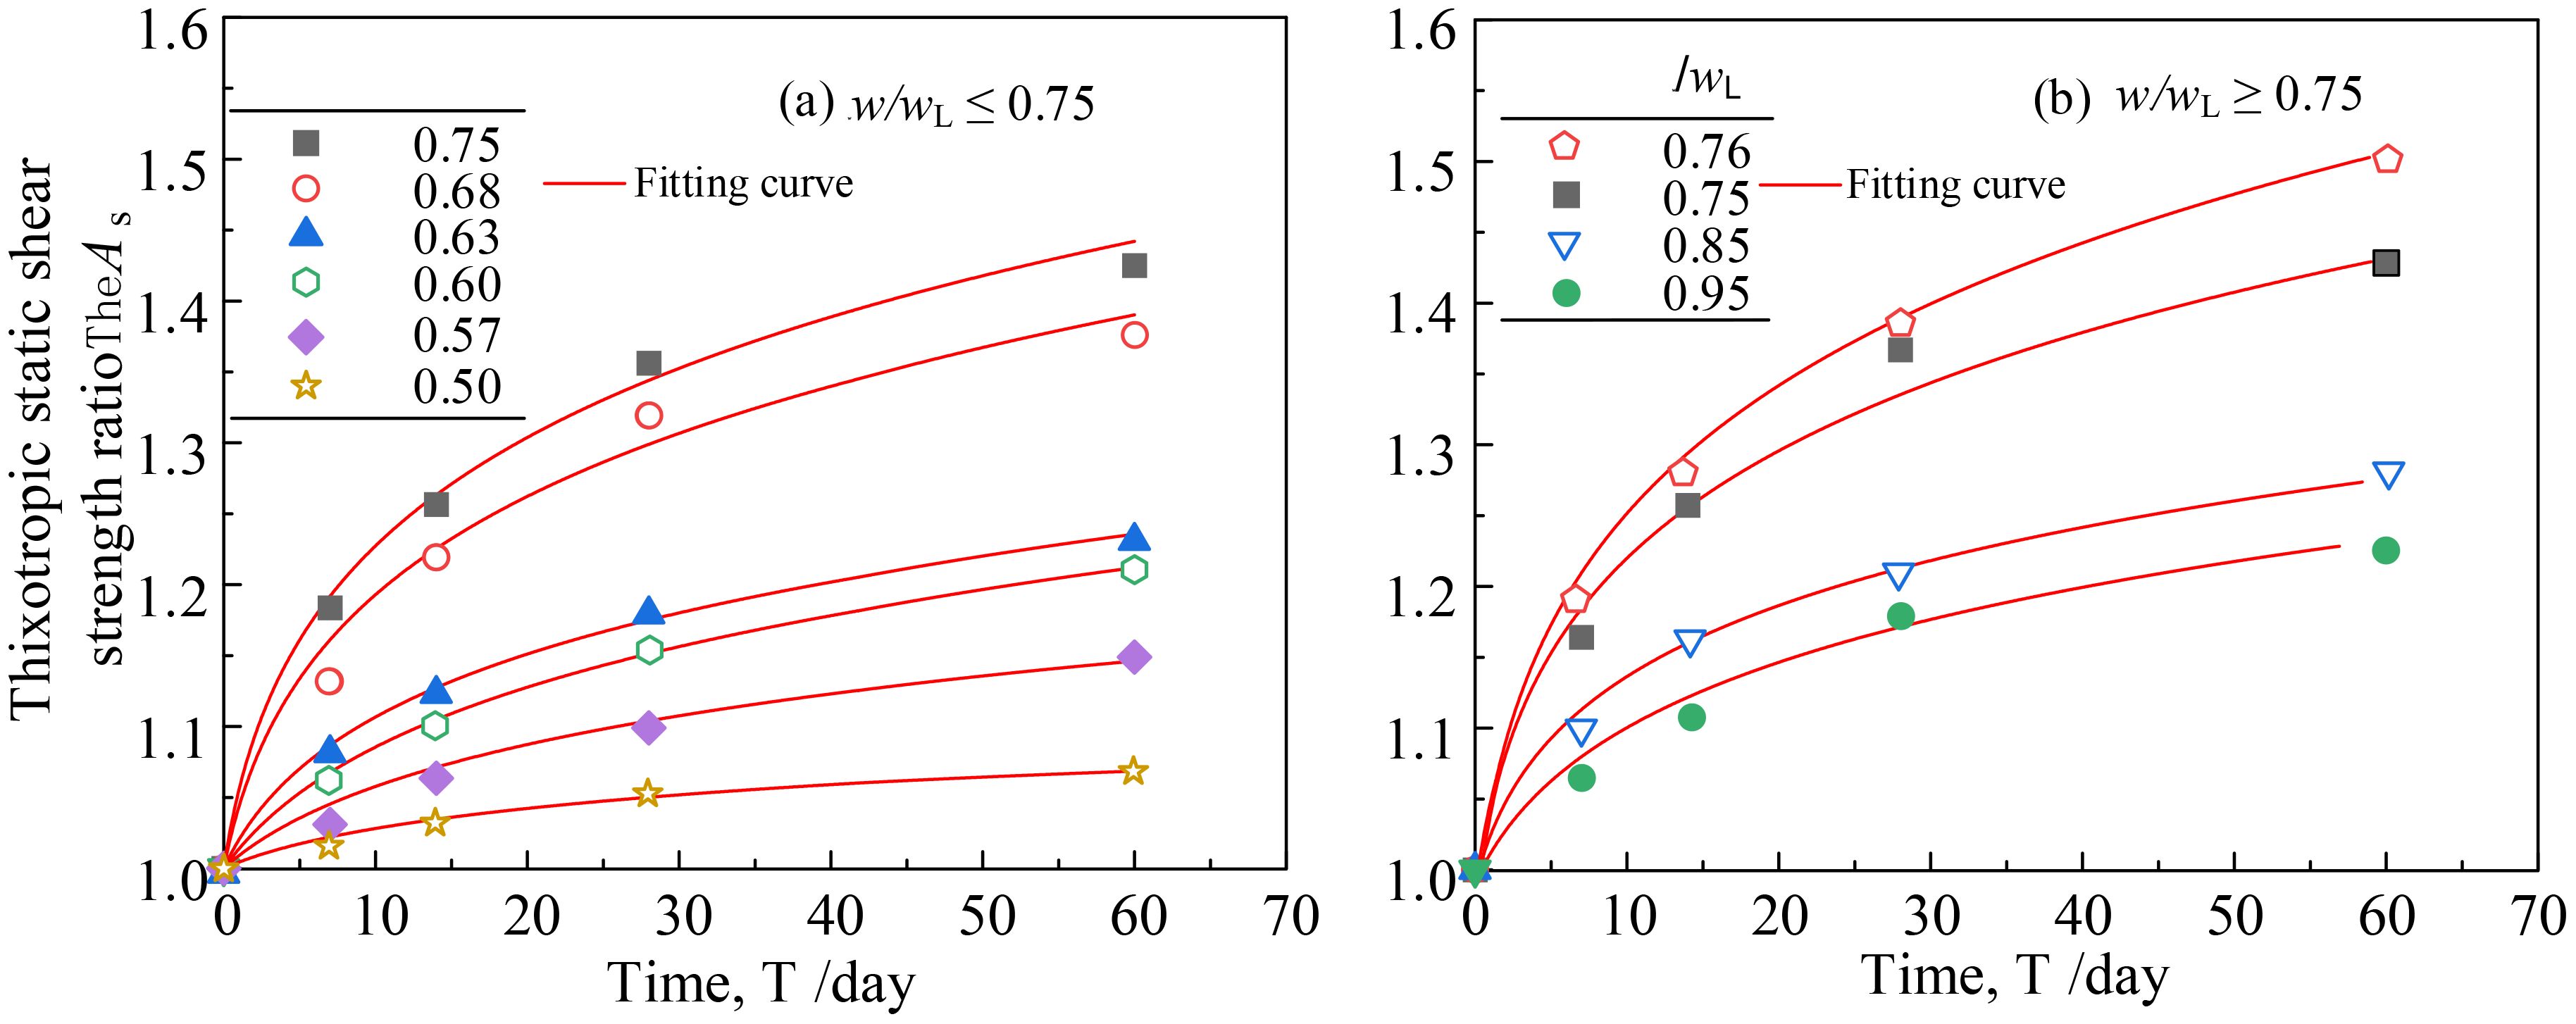
Figure 10. As–T curves with different w/wL ratios for the remolded marine soft clay (A, B represent different w/wL).
Currently, there are few prediction models for As, and there are significant differences among different sites. To verify the applicability and accuracy of the prediction model proposed in this paper, Figure 11 shows the As- T curves for the clayey soils from four different regions Bangladesh (Shahriar and Jadid, 2018), the South China Sea (Yang and Andersen, 2016), Taihu Lake (Wang et al., 2015), and Zhanjiang (Zhang et al., 2017). Using Equation 3 to fit the data revealed that the fitting results were excellent, with all R² values greater than 0.95, while the lowest R² value for the clay from the South China Sea clay was still 0.954. This indicates that using Equation 3 to evaluate the As of clays from different sites is advantageous due to its simplicity and broad applicability.
5 Conclusion
In this study, we conducted 45 unconfined compressive strength tests on the remolded marine soft clay from the Yangtze River estuary. By analyzing its axial stress–strain curves, thixotropic strength recovery capability, and the impacts of curing time T, water content w, plasticity index IP, and clay particle content ρc on its thixotropic static shear strength ratio As, we drew the following conclusions:
1. As values increased with an increase in T. For T = 0–28 days, the As increased rapidly, whereas for T > 28, As increased slightly or tended to stabilize. All specimens were capable of thixotropic strength recovery. Furthermore, a specimen with a high As does not necessarily have a high thixotropy static shear strength recovery ratio Bs. There is no one-to-one correspondence between the two.
2. The impacts of w, IP, and ρc on As do not follow a consistent pattern, but there is a strong correlation between As and w/wL (wL is the liquid-limit water content). As increased and decreased with increasing w/wL for w/wL < 0.75 and w/wL > 0.75, respectively.
3. The As of the remodeled soft clay is affected by the coupling effect of w, IP and T. We proposed a power function prediction model for the As of the soft clay from the Yangtze River estuary and verified its applicability.
Data availability statement
The original contributions presented in the study are included in the article/supplementary material, further inquiries can be directed to the corresponding author/s.
Author contributions
BW: Conceptualization, Data curation, Investigation, Methodology, Validation, Visualization, Writing – original draft, Writing – review & editing. YH: Data curation, Investigation, Methodology, Validation, Visualization, Writing – review & editing. EZ: Data curation, Investigation, Methodology, Validation, Visualization, Writing – review & editing. XX: Data curation, Investigation, Methodology, Validation, Visualization, Writing – review & editing. QW: Conceptualization, Data curation, Funding acquisition, Investigation, Methodology, Supervision, Validation, Visualization, Writing – review & editing.
Funding
The author(s) declare that no financial support was received for the research, authorship, and/or publication of this article.
Conflict of interest
The authors declare that the research was conducted in the absence of any commercial or financial relationships that could be construed as a potential conflict of interest.
Publisher’s note
All claims expressed in this article are solely those of the authors and do not necessarily represent those of their affiliated organizations, or those of the publisher, the editors and the reviewers. Any product that may be evaluated in this article, or claim that may be made by its manufacturer, is not guaranteed or endorsed by the publisher.
References
Alam M. K., Shahriar A. R., Islam M. S., Islam N., Abedin M. Z. (2021). Experimental investigation on the strength and deformation aspects of thixotropic aging in reconstituted clays. Geotech Geol Eng 39, 2471–2486. doi: 10.1007/s10706-020-01639-1
ASTM D1556/D1556M. (2015). Standard Test Method for Density and Unit Weight of Soil in Place by Sand-Cone Method (West Conshohocken, PA, USA: ASTM International). doi: 10.1520/D1556_D1556M-15E01
ASTM D2216-982. (2019). Standard Test Method for Laboratory Determination of Water (Moisture) Content of Soil and Rock by Mass (West Conshohocken, PA, USA: International). doi: 10.1520/D2216-19
ASTM D2487-11. (2017). Standard Practice for Classification of Soils for Engineering Purposes (Unified Soil Classification System) (West Conshohocken, PA, USA: ASTM International). doi: 10.1520/D2487-17E01
ASTM D4318. (2017). Standard Test Method for Sand Content by Volume of Bentonitic Slurries (West Conshohocken, PA, USA: ASTM International). doi: 10.1520/D4318-17E01
ASTM D854. (2014). Standard Test Methods for Specific Gravity of Soil Solids by Water Pycnometer (West Conshohocken, PA, USA: ASTM International). doi: 10.1520/D0854-14
Boswell P. G. H. (1949). A preliminary examination of the thixotropy of some sedimentary rocks. J. Geotech 104, 499–526. doi: 10.1144/GSL.JGS.1948.104.01-04.23
Dullaert K., Mewis J. (2006). A structural kinetics model for thixotropy. J. Non-Newton Fluid 139, 21–30. doi: 10.1016/j.jnnfm.2006.06.002
Kul’Chitskii G. B. (1975). Thixotropy of soils of the Middle Ob region and its consideration when constructing pile foundations. J. Soil Mech. Found Eng 12, 168–170. doi: 10.1007/BF01707641
Ma W. J., Qin Y., Xu Z. H., Chen G. X. (2024). Prediction model for generation trend of axial deformation of saturated coral sand under cyclic loading. Soil Dyn. Earthq. Eng. 184, 108861. doi: 10.1016/j.soildyn.2024.108861
Ma L, Ke J, Chen T. (2024a). Dynamic mechanical behaviors of coral sand under drop weight impact. Acta Geotechnica 19, 699–716. doi: 10.1007/s11440-023-01911-7
Ma L, Deng J, Wang M. (2024b). Effect of diagenetic variation on the static and dynamic mechanical behavior of coral reef limestone. Int. J. Mining Sci. Technol. doi: 10.1016/j.ijmst.2024.07.004
Mitchell J. K. (1960). Fundamental aspects of thixotropy in soils. J. Soil Mechanics Foundations Division ASCE 86, 19–52. doi: 10.1061/JSFEAQ.0000271
Moretto O. (1948). Effect of natural hardening of the unconfined compression strength of remolded clay. Proc. 2nd Int. Conf. Soil Mech. and Found. Engr. 1, 137–144.
Peng J., Luo S. M., Wang D. F., Cao Y. M., DeGroot D. J., Zhang G. P. (2021a). Multiple thixotropisms of liquid limit–consistency clays unraveled by multiscale experimentation. J. Geotech Geoenviron Eng 148, 04021165. doi: 10.1061/(ASCE)GT.1943-5606.0002705
Peng J., Luo S. M., Wang D. F., Ren Y., Fan L. L., DeGroot D. J., et al. (2021b). Quantitative evaluation of thixotropy-governed microfabric evolution in soft clays. Appl. Clay Sci. 210, 106157. doi: 10.1016/j.clay.2021.106157
Peterfi T. (1927). The separation of the fertilization membrane of sea urchin eggs. Arch. Entwicklungsmech Organ 112, 660–695. doi: 10.1007/bf02253780
Qin Y., Yang Z. T., Long H., Ma W. J., Wu Q., Chen G. X. (2024). Threshold strain for the accumulation of excess pore-water pressure in saturated coral sands under complex cyclic loading patterns. Ocean Eng. 310, 118691. doi: 10.1016/j.oceaneng.2024.118691
Ren Y. B., Yang S. L., Andersen K. H., Yang Q., Wang Y. (2021). Thixotropy of soft clay: A review. Eng. Geol. 287, 106097. doi: 10.1016/j.enggeo.2021.106097
Ren Y. B., Zhang S. X., Wang Y., Yang Q., Zhou Z. F. (2024). Experimental study on the thixotropic mechanism of deep-sea clay from the perspective of microstructure and bound water. Acta Geotech 19, 685–698. doi: 10.1007/s11440-023-01967-5
Seng S., Tanaka H. (2012). Properties of very soft clays: A study of thixotropic hardening and behavior under low consolidation pressure. Soils Found 52, 335–345. doi: 10.1016/j.sandf.2012.02.010
Shahriar A. R., Abedin M. A., Jadid R. (2018). Thixotropic aging and its effect on 1-D compression behavior of soft reconstituted clays. Appl. Clay Sci. 153, 217–227. doi: 10.1016/j.clay.2017.12.029
Shahriar A. R., Jadid R. (2018). An experimental investigation on the effect of thixotropic aging on primary and secondary compression of reconstituted dredged clays. Appl. Clay Sci. 162, 524–533. doi: 10.1016/j.clay.2018.05.023
Skemption A. W., NorThey R. D. (1952). The sensitivity of clays. Geotechnique 2, 30–53. doi: 10.1680/geot.1952.3.1.30
Tang B., Liu T. L., Zhou B. H. (2022). Duncan-chang E-υ Model considering the thixotropy of clay in the zhanjiang formation. Sustainability-Basel 14, 12258. doi: 10.3390/su141912258
Wang L., Cao L. L., Li L., Yang L. J., Sun T. L., Shi P., et al. (2015). Thixotropic characterization of dredged silt from Lake Taihu and Lake Baima. J. Eng. Geol. 23, 548–553.
Wei L., Dang F., Ding J., Wu X., Li J., Cao Z. (2023). An analysis of thixotropic micropore variation and its mechanism in loess. Front. Ecol. Evol. 11. doi: 10.3389/fevo.2023.1242462
Wu Q., Zhu E. C., Xiao X., Li Y. X., Chen G. X. (2023). Cyclic resistance evaluation of marine clay based on CPTu data: a case study of Shaba Wind Farm. Front. Mar. Sci. 10. doi: 10.3389/fmars.2023.1300005
Xiao X., Wang Z. F., Wu Q., Zhou R. R., Chen G. X. (2024). Shear-thinning non-Newtonian fluid-based method for investigating cyclic stiffness degradation of marine clay. Ocean Eng 300, 117499. doi: 10.1016/j.oceaneng.2024.117499
Yang S. L., Andersen K. H. (2016). Thixotropy of marine clays. Geotech Test J. 39, 20150020. doi: 10.1520/GTJ20150020
Yang S. L., Ren Y. B., Andersen K. H. (2021). Effects of thixotropy and reconsolidation on the undrained shear characteristics of remoulded marine clays. Ocean Eng 239, 109888. doi: 10.1016/j.oceaneng.2021.109888
Keywords: marine soft clay, thixotropic strength, unconfined compressive strength tests, prediction model, physical properties
Citation: Wang B, Huang Y, Zhu E, Xiao X and Wu Q (2024) Experimental study on the thixotropic strength of the marine soft clay from the Yangtze River estuary. Front. Mar. Sci. 11:1462550. doi: 10.3389/fmars.2024.1462550
Received: 10 July 2024; Accepted: 16 September 2024;
Published: 03 October 2024.
Edited by:
Yakun Guo, University of Bradford, United KingdomReviewed by:
Xianwei Zhang, Chinese Academy of Sciences (CAS), ChinaGang Wang, Chinese Academy of Sciences (CAS), China
Copyright © 2024 Wang, Huang, Zhu, Xiao and Wu. This is an open-access article distributed under the terms of the Creative Commons Attribution License (CC BY). The use, distribution or reproduction in other forums is permitted, provided the original author(s) and the copyright owner(s) are credited and that the original publication in this journal is cited, in accordance with accepted academic practice. No use, distribution or reproduction is permitted which does not comply with these terms.
*Correspondence: Enci Zhu, emVjOTkxOEAxNjMuY29t
 Binghui Wang
 Yanyu Huang
 Enci Zhu
 Xing Xiao
 Qi Wu
Qi Wu