
95% of researchers rate our articles as excellent or good
Learn more about the work of our research integrity team to safeguard the quality of each article we publish.
Find out more
ORIGINAL RESEARCH article
Front. Mar. Sci. , 19 September 2024
Sec. Aquatic Physiology
Volume 11 - 2024 | https://doi.org/10.3389/fmars.2024.1461451
 Lingzhan Xue1
 Yu Gao2*Songpei Zhang3Manxin Weng1,4Gaoxiong Zeng1
 Jiajia Chen1Mengxiang Liao1
 Sayyed Mohammad Hadi Alavi5Yann Guiguen6
The fused in sarcoma (FUS) protein is a DNA/RNA binding protein from the ten-eleven translocation protein family that is associated with neurodegeneration, and it has been shown to promote cell proliferation through the growth hormone/insulin-like growth factor 1 (Gh/Igf-1) signaling pathway. The zig-zag eel (Mastacembelus armatus) is a newly discovered species exhibiting sexual dimorphism in growth, and the potential role of fus in the growth and development of this species remains largely unknown. Herein, we analyzed the homology, conserved domains, evolutionary characteristics, and conserved syntenies of fus in several teleost species. The expression of fus was predominant in the brain and exhibited sexual dimorphism in the brain, muscle, and liver of zig-zag eels. We found that microRNA (miR)-146-5p, miR-489-3p, and 24 other miRNAs were targeted to the fus 3′ untranslated region, which might affect muscle and bone development in adults. The igf1, insulin-like growth factor 1 receptor a (igf1ra), insulin-like growth factor 2 receptor (igf2r), growth hormone-releasing hormone-like receptor (ghrhrl), growth hormone secretagogue receptor type 1 (ghsr), and glucocorticoid receptor (gr) genes contained a higher abundance of GU-rich fus motifs compared to the other four genes analyzed in zig-zag eels. We also measured the expression of fus mRNA during fish culture at various stocking densities to further elucidate the relationship between fus expression and the Gh/Igf-1 axis. After 100 days of fish cultivation, the expression of fus and ghrhrl decreased and the expression of ghrh and gr increased as the culture density increased (p < 0.05). The expression of fus exhibited a remarkable positive correlation with a specific growth rate. These results indicate that fus mediates growth differences by regulating the expression of several growth-related genes including Gh/Igf-1 axis genes in zig-zag eels.
The fused in sarcoma (FUS) protein, also known as translocated in liposarcoma (TLS), is a DNA/RNA binding protein that belongs to the ten-eleven translocation (TAF15/EWS/TLS) protein family. FUS rapidly shuttles between the nucleus and cytoplasm, binding RNA, as well as single- and double-stranded DNA, and is involved in DNA repair, pairing of homologous DNA, and RNA metabolism (Iko et al., 2004; Gal et al., 2011; Lagier-Tourenne et al., 2012). Previous studies have identified FUS and its fusion oncogenes to significantly promote cell proliferation (Cironi et al., 2008; Ward et al., 2014). Additionally, loss of FUS expression may contribute to the increased cell proliferation that induces cancer progression (Brooke et al., 2011), which is associated with neurodegenerative diseases (Deng et al., 2014). FUS mainly as a causative or risk factor is associated with cancer and neurodegeneration (Deng et al., 2014; Assoni et al., 2023; Xiao et al., 2024), and mutation of the fus gene can result in severe motor phenotype features (Armstrong and Drapeau, 2013). Generally, the absence of the neurodegenerative phenotype following only Fus loss of function suggests that Taf15 and Ewsr1, belonging to FET family proteins, may play a compensatory role in vertebrates (Kino et al., 2015). However, fus−/− zebrafish (Danio rerio) showed a reduced life span (Bourefis et al., 2020) and decreased body length and weight (Dan et al., 2019), but were fertile and exhibited normal development, motoneurons, and swimming ability (Lebedeva et al., 2017). These results suggest that fus functions in growth, but its effects on growth and neurons are not well understood.
Sexual dimorphism encompasses phenotypic differences (such as body size, shape, and color) between males and females as well as intersex distinctions in physiology and behavior (Mei and Gui, 2015). Several previous studies showed that mutation of fus is important for female-biased sexual size dimorphism, life span, and motor capacity in zebrafish (Armstrong and Drapeau, 2013; Dan et al., 2019; Bourefis et al., 2020). Cheng et al. (2022) reported female-biased expression of the Ewing Sarcoma protein-like (ewsr1) gene, which encodes an RNA-binding protein closely related to Fus, during gonadal development of Chinese tongue sole (Cynoglossus semilaevis), which suggested an essential role of ewsr1 in the ovarian development (Cheng et al., 2022). In another study, Shen et al. (2022) showed that the DEAD-Box Helicase 3 Y-Linked protein more strongly promoted FUS aggregation, leading to an XY-specific increase of FUS granules in cells (Shen et al., 2022).
The growth hormone/insulin-like growth factor 1 (Gh/Igf-1) pathway plays a crucial role in regulating growth and development, metabolic processes, and cellular repair (Cannata et al., 2010; Reinecke, 2010; Bidosee et al., 2011; Rius-Francino et al., 2011; Guntur and Rosen, 2013; Ndandala et al., 2022). Gh/Igf-1 is also responsible for brain growth, development, and myelination, as well as contributing to neurogenesis and plasticity (Åberg et al., 2006). FUS is mostly localized in the nuclei of neurons but is mainly postsynaptic during early developmental stages (Deshpande et al., 2019). Cironi et al. (2008) reported that FUS is a potential regulator of the Igf-1 promotor in mesenchymal stem cells (Cironi et al., 2008), and Trautmann et al. (2017) found that overexpression or small interfering RNA-mediated knockdown of FUS-DNA damage-inducible transcript 3 activated or reduced expression of insulin-like growth factors (IGFs) and their receptor mRNAs in mammals (Trautmann et al., 2017). Researchers have also reported that microRNAs (miRNAs) are crucial regulatory factors for the execution of FUS function (Du et al., 2009; Dini Modigliani et al., 2014). For instance, miRNA-141 inversely regulates FUS in neuroblastoma cell lines (Wang et al., 2016). These findings suggest that regulation of FUS function by miRNAs and crosstalk between FUS and growth parameters may be involved in sexual dimorphism.
The zig-zag eel (Mastacembelus armatus) is an economically important fish belonging to the order Symbranchiformes. Owing to its high protein content, the zig-zag eel is both a popular aquarium and food fish, resulting in high market value and aquaculture potential in Southeast Asian countries (Yang et al., 2023). Our previous study has reported the characterization of sex change in zig-zag eel (Xue et al., 2021b), which is a newly discovered species exhibiting sexual dimorphism in growth. Fish are cultured at different densities, significantly affecting various growth parameters and fish welfare (Saraiva et al., 2022), including growth rate, feed conversion ratio, survival rate, behavioral stress, and yield. Therefore, it is essential to balance stocking density, yield, and fish welfare to achieve sustainable and profitable aquaculture. In this study, we assessed the relationship between fus gene expression and growth rate difference based on 100 days of culture at different densities in juveniles of zig-zag eel. As miRNAs likely have regulatory functions on fus expression, we assessed their potential regulation of fus, and we also compared the expression of miRNAs between males and females. Our results provide valuable information about the role of fus regulation of the Gh/Igf-1 axis in fish growth, and they can be used to improve zig-zag eel culture in the context of sexual dimorphism of growth.
The use and manipulation of zig-zag eels in this study complied with animal welfare laws, guidelines, and policies approved by the Scientific Ethics Committee of Yunnan Agricultural University, Kunming, China. To minimize the stress response, animals were anesthetized with 100 mg/L tricaine methanesulfonate (MS222, Sigma-Aldrich, MO, USA) prior to all sampling.
The amino acid of Fus and cDNA sequences of fus were retrieved from zig-zag eel reference genome fMasArm1.2 (GCA_900324485.2) and were compared to the corresponding transcripts publicly available in the Phylofish database (Guindon et al., 2010). The similarity of cDNA sequences was calculated after alignment using the Clustal Omega (EMBL-EBI) (Madeira et al., 2022).
The amino acid sequences were aligned based on their respective orthologs using ClustalW (EMBL-EBI) (Larkin et al., 2007). Phylogenetic relationship reconstruction of Fus protein in teleost was performed using the maximum likelihood method implemented in PhyML 3.0 (Guindon et al., 2010) with Smart Model Selection (Lefort et al., 2017) using 1,000 bootstrap replicates. The Fus amino acid sequences from 14 teleost species and from mammals (human and mouse), which were used as an outgroup, were retrieved from the Ensembl database. The accession number for each sequence was provided in Supplementary File 1. A synteny map of the conserved genes in blocks around Fus was constructed with 14 teleost species. The synteny map was created with the GenomicusGenofish (Nguyen et al., 2018) (https://www.genomicus.bio.ens.psl.eu/genomicus-fish-04.02/cgi-bin/search.pl, accessed in August 2021, database version: 04.02).
The transcriptome data of zig-zag eel used in this study were obtained from Sequence Read Archive, National Center for Biotechnology Information (NCBI) (Bethesda, MD), including accession numbers SRR12321654, SRR12321655, SRR12321656, SRR12321659, SRR12321660, SRR12321661, SRR12321662, SRR12321663, and SRR12321664 for testis, spleen, brain, muscle, liver, heart, intestine, gill, and fin from adult male, respectively, and accession numbers SRR12321676, SRR12321677, SRR12321678, SRR12321679, and SRR12321680 for ovary from adult female (Xue et al., 2021a).
Raw data were first processed to generate clean reads before assembly. Trimmomatic software was used to remove adapter and low-quality reads at default parameters (Bolger et al., 2014). All the clean reads were first aligned to zig-zag eel reference genome fMasArm1.2 (GCA_900324485.2) by STAR (Dobin et al., 2013). Then, reading counts for the individual transcript of each sample were produced with HTSeq-count (Anders et al., 2015). Different sequencing sample data were normalized in TPM (Transcripts Per Kilobase Million).
Samples of whole brain and sections of liver, muscle, heart, gill, intestine, caudal fin, spleen, testis, and ovary (spawning capable phase) were collected from 3-year adult zig-zag eel (n = 4). These samples were immediately frozen in liquid nitrogen and stored at –80°C for RNA extraction. The primer sequences are shown in Supplementary Table S1.
A qPCR was performed to determine tissue distribution of fus mRNA. The qPCR reactions were carried out in 20 μL in triplicate with 10 μL of Green Master mix (TsingKe, Beijing, China), 1.0 μL of fivefold diluted cDNA, 0.5 μL of each primer (10 μM), and 8.0 μL of ddH2O using a StepOnePlus™ Real-Time PCR Instrument (Applied Biosystems, Foster City, CA, USA). Amplification condition was set for 30 s at 95°C, followed by 40 cycles of 5 s at 95°C, and 30 s at 60°C. A negative control (reaction without cDNA) was performed for each assay. Melting-curve analysis was performed for each primer pair to validate amplification of the specific products. Quantification cycle (Ct) values used in the calculations were the means obtained from each cDNA in triplicate. The relative expression of fus mRNA in each tissue was calculated by normalizing to the expression of the reference gene, ribosomal protein S18 (rps18), β-actin, and 18S ribosomal RNA (18S rRNA) using the comparative threshold 2−ΔΔCt method, respectively. The geometric mean of relative expression of each target gene was calculated.
The sequence and location of the genes related to the Gh/Igf-1 axis were retrieved from zig-zag eel reference genome fMasArm1.2 (GCA_900324485.2), including insulin-like growth factor 1 (igf1), insulin-like growth factor 1 receptor a (igf1ra), insulin-like growth factor 2b (igf2b), insulin-like growth factor 2 receptor (igf2r), growth hormone-releasing hormone (ghrh), growth hormone (gh), growth hormone-releasing hormone-like receptor (ghrhrl), glucocorticoid receptor (gr), ghrelin/obestatin prepropeptide (ghrl), and growth hormone secretagogue receptor type 1 (ghsr). Amino acid sequences of each gene blasted to their respective orthologs to confirm their annotation. Ensembl Gene ID and locations on chromosome are shown in Supplementary Table S2. According to the existing data of CLIP-seq by Nascent-seq analysis, six GU-rich (6GUR) fus motifs (TGTG, CTGG, TGGT, GCTG, GTGG, and TTGG) were selected (Takeda et al., 2017). GGKGG and NNCGCGN were selected according to the RBPmap, a database concerning the prediction and mapping of RNA binding proteins’ (RBPs) binding sites (Paz et al., 2014). These gene positions were loaded into Integrative Genomics Viewer (IGV, version 2.16). fus motif-matched tracks were created using the “find motif’’ tool in the IGV (Robinson et al., 2011).
After extraction of total RNA from testis (spawning capable phase) by the Trizol reagent kit (Invitrogen, Carlsbad, CA, USA), the RNA molecules with a size of 18–30 nt were enriched by polyacrylamide gel electrophoresis (PAGE), and the 3′ and 5′ adapters were added into the RNA molecules. The ligation products were reverse-transcribed by PCR amplification to generate a cDNA library and sequenced using Illumina Novaseq6000 by Gene Denovo Biotechnology Co. (Guangzhou, China). After screening, the sequences <18 nt were discarded. All remaining high-quality sequences were aligned with the GeneBank database (http://www.ncbi.nlm.nih.gov/) and Rfam database (Kalvari et al., 2018) to remove rRNA, scRNA, snoRNA, snRNA, and tRNA. All of the clean tags were also aligned with zig-zag eel reference genome fMasArm1.2 (GCA_900324485.2) to remove exon, intron, and repeat sequences. Then, all of the clean tags were searched against the miRBase database (Kozomara and Griffiths-Jones, 2011) to identify known specific miRNAs by miRDeep2 (Mackowiak, 2011). Each miRNA was then manually blasted against miRbase to confirm its mature sequences.
Gene-specific primers and nested primers for 3′-RACE fragments were designed from partial fus cDNA fragments. PCRs were performed using a SMARTer RACE cDNA amplification kit (CLONTECH) following the manufacturer’s instructions. The fus 3′ untranslated region (UTR) sequence was used for miRNA–mRNA target prediction using targetscan (McGeary et al., 2019), RNAhybrid (Rehmsmeier et al., 2004), and miRanda3.3 (Enright et al., 2003) software with an energy (kcal/mol) cutoff of 18. The overlapping miRNAs among these software predictions were identified as candidate miRNAs targeted to fus 3′UTR.
Two conserved miRNAs were selected for validation by RT-qPCR analysis on an ABI StepOne Plus RT-PCR detection system (Applied Biosystems, Foster City, Calif., USA). For both males and females, total RNA was isolated from the liver and muscle, respectively. Reverse transcription of DNase-treated RNA (1,000 ng) to cDNA was performed using a specific stem-loop RT primer and RevertAidFirst Stand cDNA Synthesis Kit (Thermo Scientific Fermentas). The resulting cDNA was then used for RT-qPCR of miRNAs by using miRNA-specific primers combined with universal primers. All the primers for miRNA validation are listed in Supplementary Table S1. Each reaction consisted of 20 μL of SYBR Green mix (GeneCopoeia, Rockville, MD, USA), 1.0 μL of 10 mM specific forward primer and universal primer, 7.0 μL of RNase-free H2O, and 1.0 μL of 10-fold diluted cDNA. Reactions were denatured at 95°C for 10 min followed by 40 cycles of 95°C for 15 s and 60°C for 30 s. Melting-curve analysis was performed for each primer pair to confirm that the specific products were amplified. Ct values used in the calculations were the means obtained from each cDNA in triplicate. Ct values were normalized by the geometric mean of reference U6 rRNA, and relative expression levels for each miRNA were calculated using 2−ΔΔCt methods.
A total of nine polyethylene net cages (length 6.0 m, width 3.0 m, and depth 2.0 m) with a net aperture of 3 mm were set up at the middle of each pond at least 7 days before stocking juveniles. A bait station and a microporous tube aeration were set up for each cage. The peripheral region of cage was surrounded by aquatic plants such as Hydrilla verticillium.
The juveniles of zig-zag eels were fasted for 24 h before stocking. Those with uniform size (6 months old, total length 16.37 ± 0.36 cm; body weight: 12.60 ± 0.19 g) showing no deformities and disease were selected and then randomly divided into three groups with different densities for a 100-day culture including low density (L, 1,000 juvenile fish per cage), medium density (M, 2,000 juvenile fish per cage), and high density (H, 3,000 juvenile fish per cage). Each density was stocked with three biological replicates. The water temperature was between 25 and 28°C for the 100-day stocking experiment. The juveniles were fed twice daily (8:00 a.m. and 6:00 p.m.) at a rate of 3%–4% of fish mass with the formulated diet containing 47% protein (Fujian Tianma Science and Technology Group Co., Ltd., Fujian, China). The ponds were inspected three times daily to observe the status of fish health. Water parameters were weekly recorded, and nonionic ammonia, nitrite, pH, and dissolved oxygen were ≤0.5 mg/L, ≤0.08 mg/L, 7.0–8.5, and >5 mg/L, respectively.
At the end of the 100-day culture period, survival rate (100× final fish number/initial fish number) was calculated. Fifteen specimens from each stocking density were selected randomly for morphology measurement (including body length and body weight), and tissue samples (whole brain) were immediately frozen in liquid nitrogen and stored at −80°C for gene expression analyses. Moreover, mRNA expression of Gh/Igf-1 genes was determined in the brain using a qPCR as described above. The relative expression of mRNA was calculated by normalizing the expression of the reference genes and the low-density group, using the comparative threshold 2−ΔΔCt method, respectively.
Several common growth parameters were estimated, including weight gain [WG = 100 × (FBW − IBW)/IBW], specific growth rate [SGR = 100 × (ln FBW − ln IBW)/feeding days], daily growth coefficient [DGC = 100 × (FBW1/3 − IBW1/3)/feeding days], average daily growth [ADG = (FBW − IBW)/feeding days], feed coefficient [Fc = the weight of feed intake/(FBW − IBW)], and survival rate. IBW, FBW, FBL, and d were initial body weight, final body weight, final body length, and day, respectively.
Unless otherwise noted, values were presented using box plots generated by the ggpubr and ggplot2 in R (Version: 2.2.5). The normal distribution and variance homogeneity of measurement data were measured. Two-way non-parametric Scheirer–Ray–Hare test (scheirerRayHare function from the r companion package v 2.4.34) with Bonferroni adjustment was used to examine miRNA expression. One-way analysis of variance (ANOVA) followed by a Tukey’s honestly test was used for comparison between groups with normal distribution, and a nonparametric test (Kruskal–Wallis test or Mann–Whitney test) was used for comparison between groups without normal distribution. Pearson correlation coefficient (r) was calculated between the gene expression levels and growth parameters using the psych package in R software. Differences were considered statistically significant at p < 0.05.
The full-length fus cDNA of the zig-zag eel consists of 14 exons with a length of 2,962 base pairs, and it encodes a 541-amino-acid protein with an estimated molecular weight of 55 kDa. The Fus protein exhibits a high degree of homology in protein domains with other members of the ten-eleven translocation protein family, and it contains an N-terminal with a serine-tyrosine-glutamine-glycine-rich region, a central conserved RNA recognition motif between two glycine-rich (G-rich) regions, and a C-terminal with a cysteine2/cysteine2 zinc finger motif (Figure 1A).
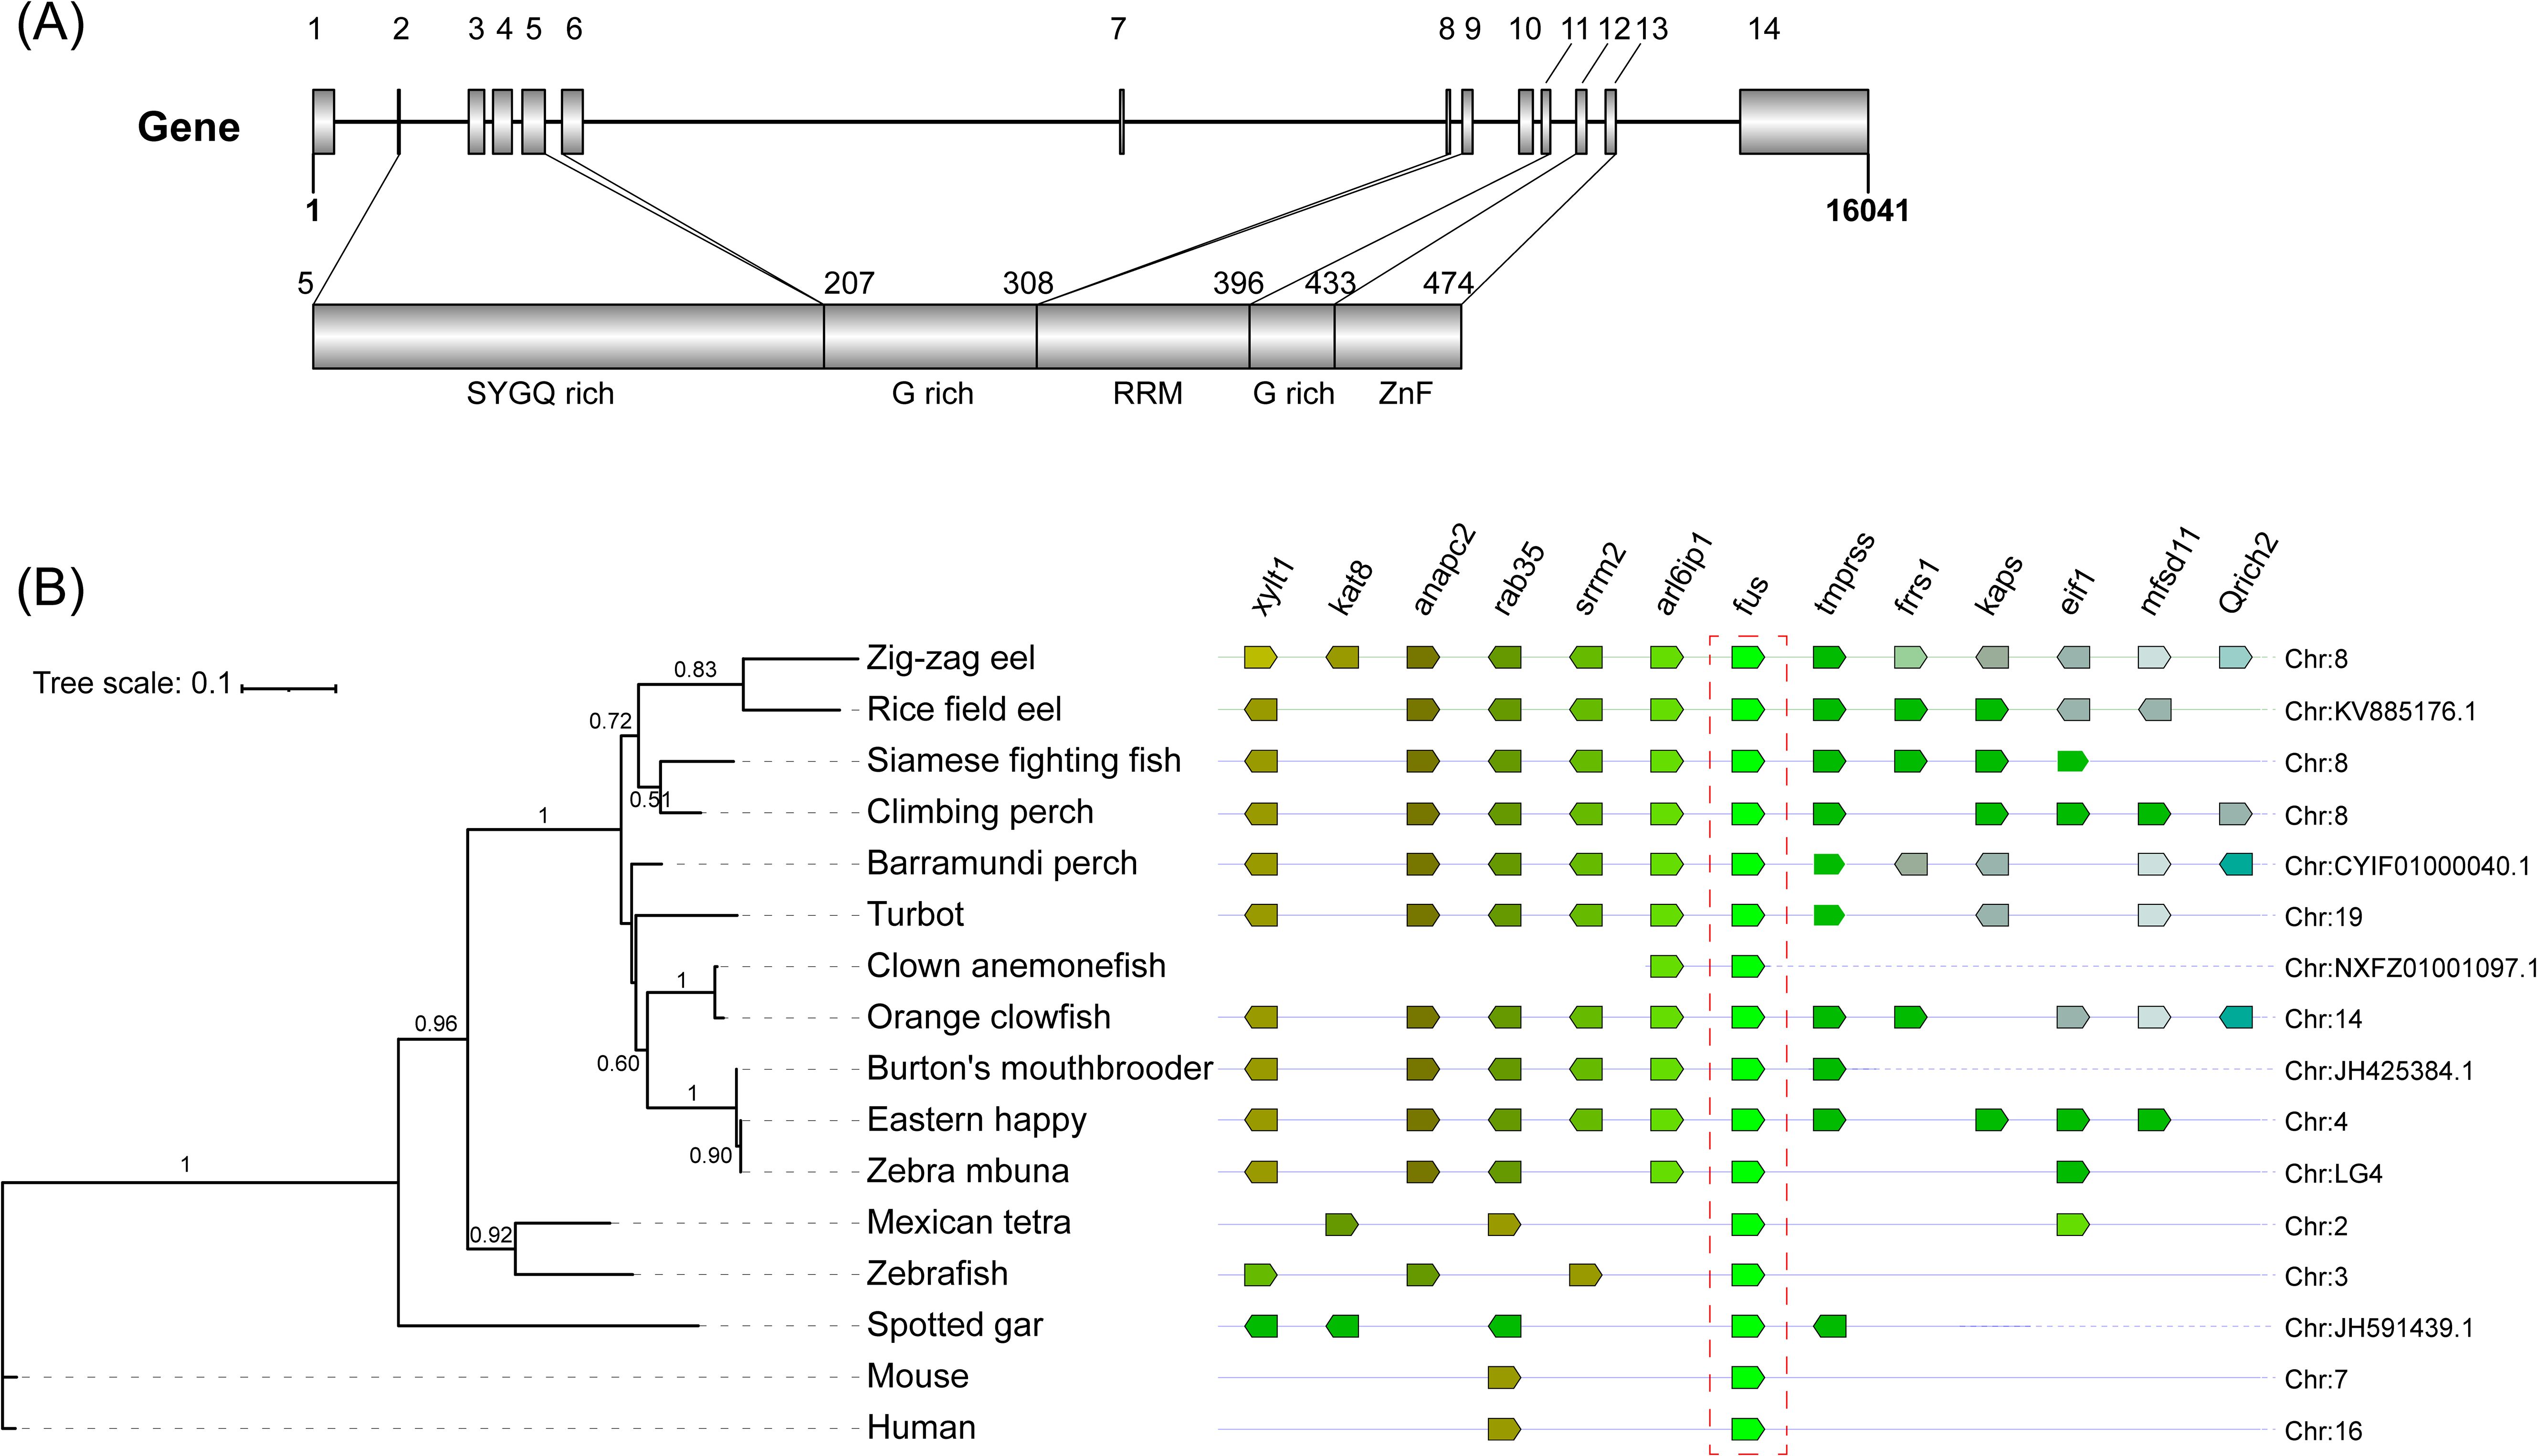
Figure 1. (A) Structural organization and functional domains of Fus/Tls gene and protein in zig-zag eel (Mastacembelus armatus). Fus/Tls gene is encoded by 14 exons that cover a 16.04-kb region on chromosome 8. Protein coding exons (filled boxes) and non-coding exons (open boxes) are drawn to scale. SYGQ rich, serine–tyrosine–glycine–glutamine-rich domain; G rich, glycine-rich domain; RRM, RNA recognition motif; ZnF, cysteine2/cysteine2 zinc finger motif. (B) Synteny map of genomic regions around fus genes (highlighted by the red box) in teleost. The phylogenetic tree of amino acid sequences was constructed in PhyML 3.0 using the maximum likelihood method with Smart Model Selection (bootstrap = 1,000). Orthologs of each gene are shown in the same color, and the direction of the arrow indicates the gene orientation. Ortholog names are listed above and the genomic location of the orthologs are listed on the right side.
To determine the origin of the fus paralogs, we generated a map of conserved syntenies for fus in several teleost species compared with fus of mammals (human and mouse) as an outgroup (Figure 1B). The fus gene was segregated into different branches, and the zig-zag eel fus was clustered with that of the rice field eel (Monopterus albus) (bootstrap 0.83/1). Some fragments of the zig-zag eel fus were present in the genomes of Siamese fighting fish (Betta splendens) and climbing perch (Anabas testudineus), which are classified taxonomically in other orders. Further analyses of the genome showed that genes located upstream (i.e., arl6ip1, rab35, and anapc2) and downstream (i.e., tmprss) of fus on chromosome 8 of zig-zag eels were conserved syntenies in select teleost species, but not in the Mexican tetra (Astyanax mexicanus) or zebrafish. These results suggest that the zig-zag eel fus gene and the fus gene of other teleosts had a common ancestor and that the gene is located on chromosome 8.
To characterize the expression profiles of fus, the TPM value was calculated from RNA sequencing data, and gene expression of selected tissues in male and female samples was measured. The fus mRNA was predominantly expressed in the brain compared to peripheral organs/tissues (Figure 2), and the level in the brain was significantly higher in males than in females (p < 0.05; Figure 2). The fus mRNA level was also significantly higher in the muscle and liver of males than in these tissues in females (p < 0.05; Figure 2). The fus mRNA level in the spleen, heart, gonad, intestine, gill, and caudal fin did not differ significantly between males and females.
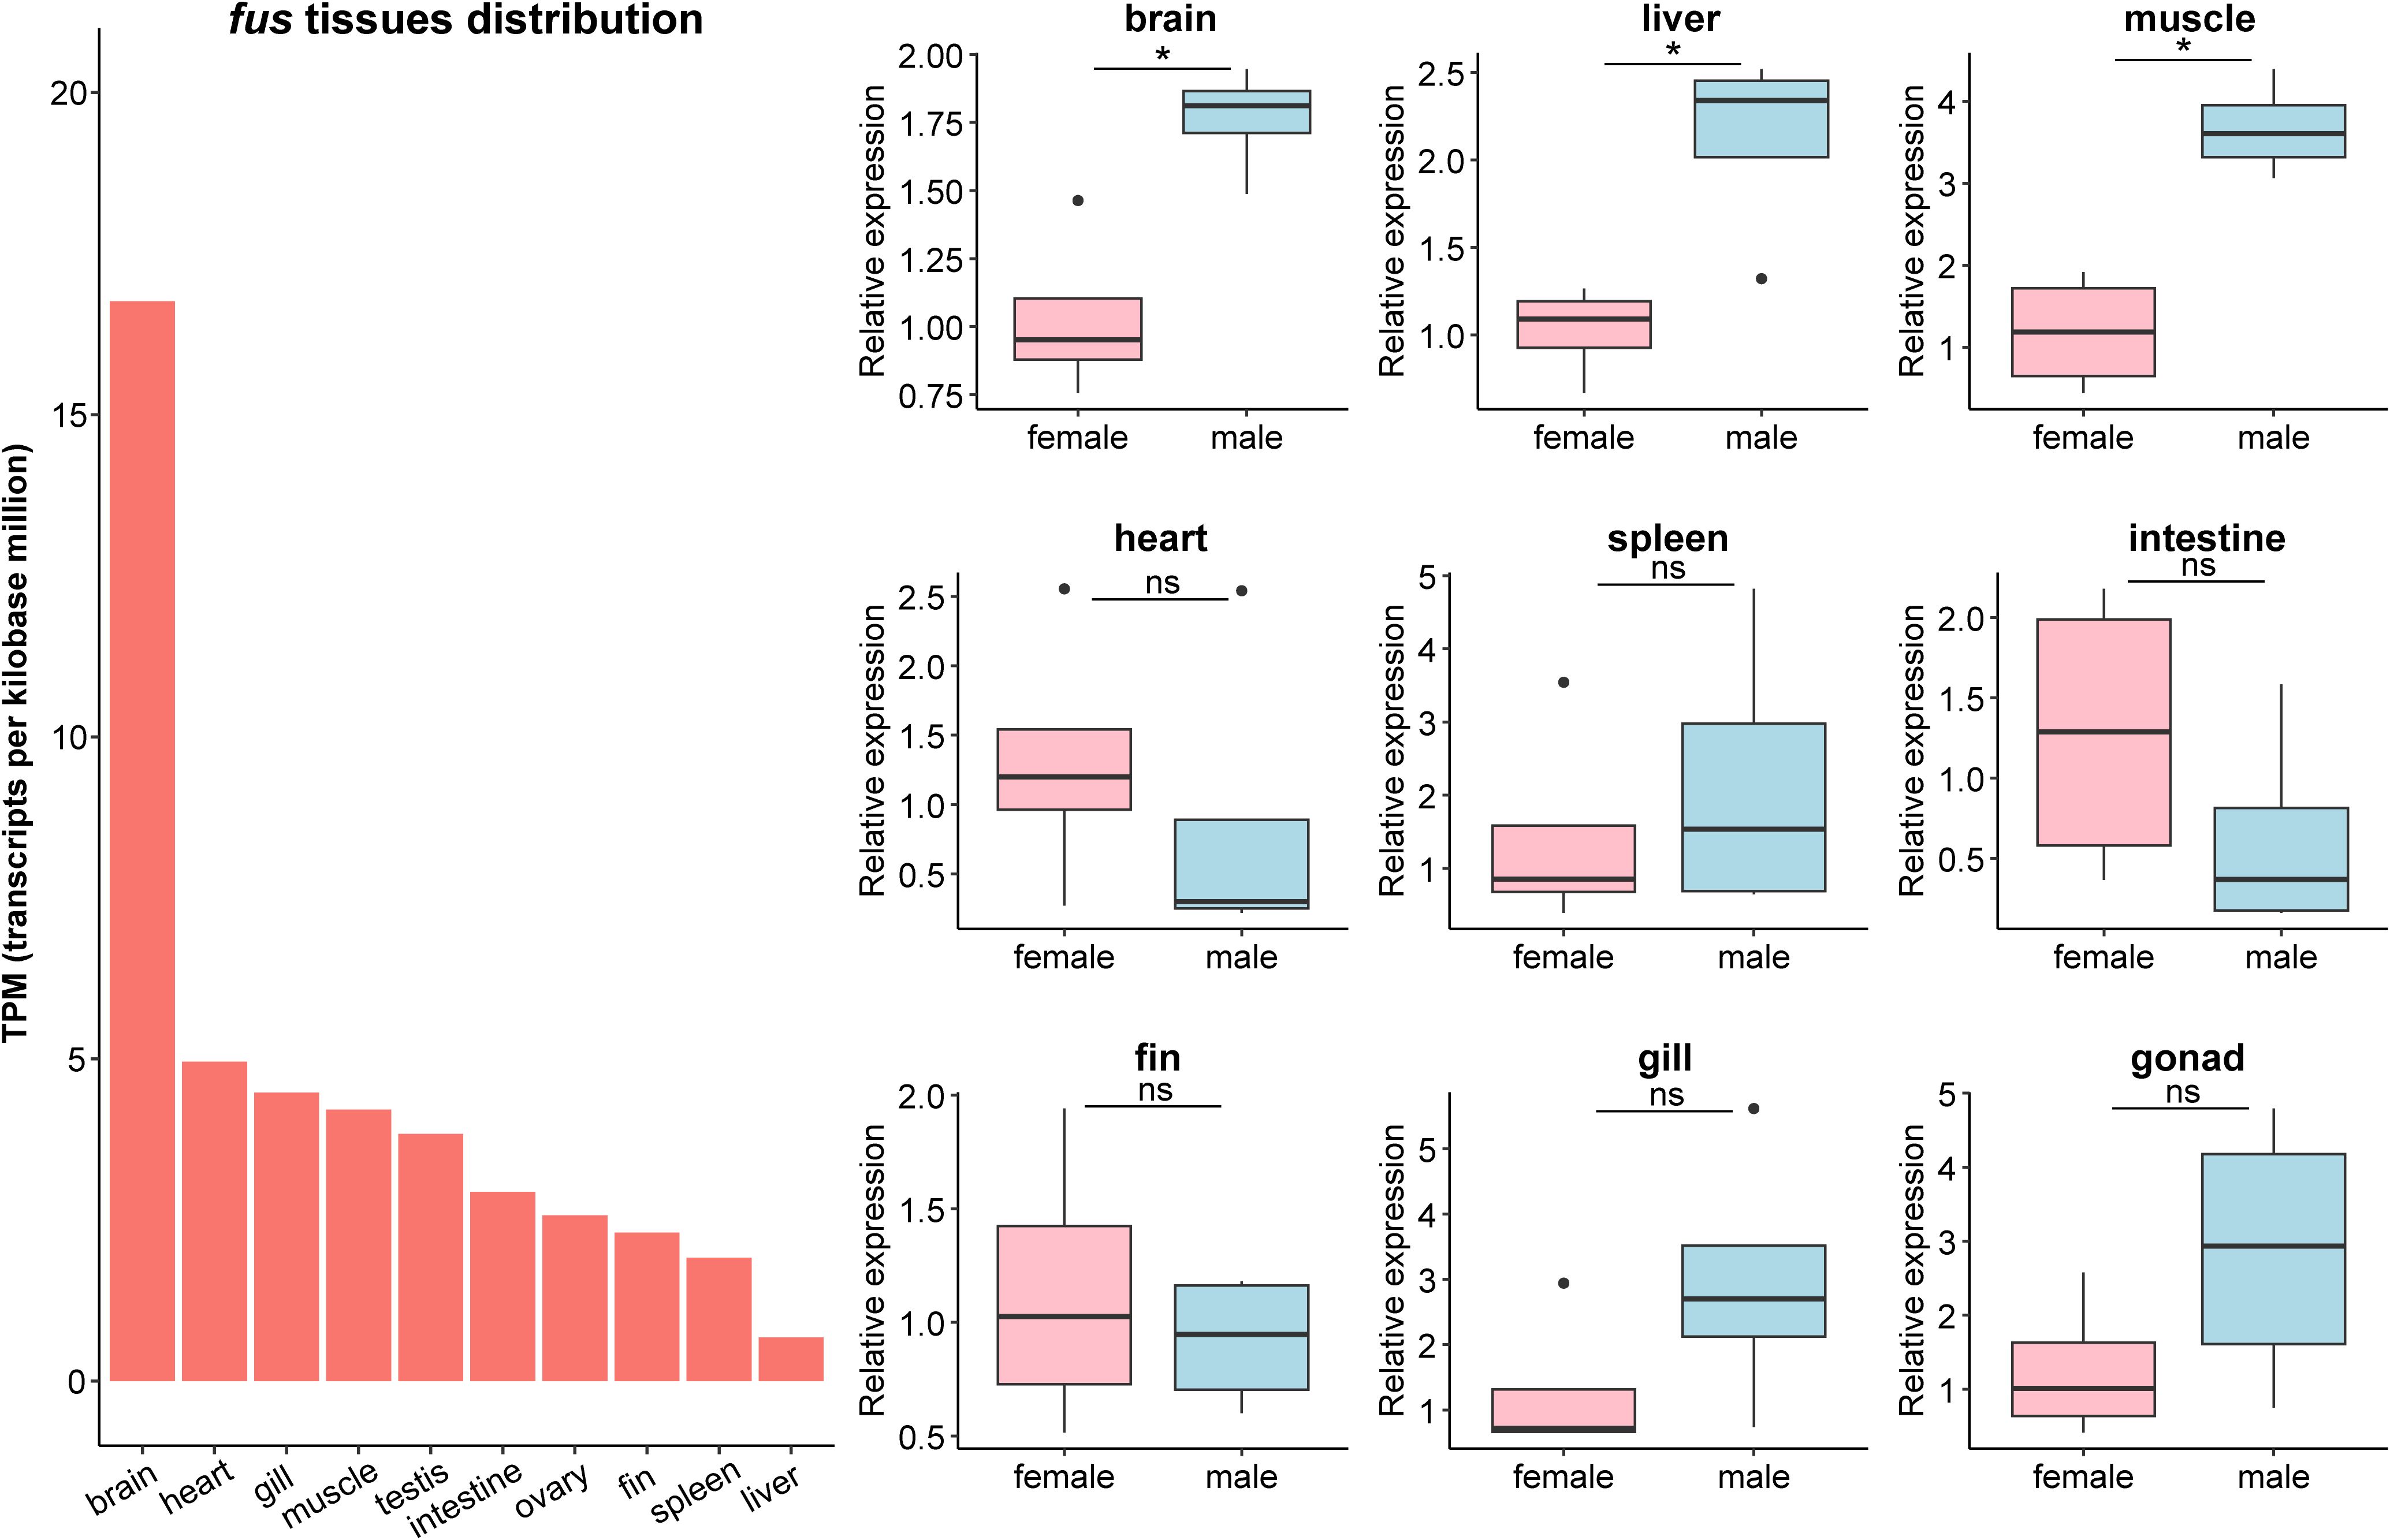
Figure 2. Transcripts per kilobase million (TPM) value and relative gene expressions of fus in central and peripheral tissues of the female and male zig-zag eel (Mastacembelus armatus). The relative gene expressions in different tissues are normalized to the expression of the female and expressed as boxplot by ggplot2 (n = 4). Black dot indicates an outlier. Significant differences were examined by the nonparametric Mann–Whitney test with two-tailed test. The asterisk (*) indicates significant differences between female and male, p < 0.05, while “ns” indicates non-significant.
Sequences of miR-146-5p and miR-489-3p were validated by cloning from genomic DNA collected from zig-zag eels. The predicted binding sites of miRNAs on the fus 3′UTR are shown in Supplementary Figure S1 and Supplementary File 2. Because of the strict restrictions for prediction, the seed regions of these selected miRNAs were completely complementarily paired with the fus target gene in the 3′UTR. Among 26 miRNAs, 14 bound to the target as 7mer-m8 match types (53.8%), 1 bound as a 7mer-1a match type (3.8%), and 11 bound as 8mer-1a match types (42.3%).
In both sexes, we observed higher expression of miR-146-5p in the liver than in the muscle (p < 0.05, Figure 3). Moreover, the liver expression of miR-146-5p showed sexual dimorphism, with higher expression in females than in males. The expression level of miR-489-3p in the liver was also higher in females than in males. However, no difference in the muscle expression level was observed between sexes.
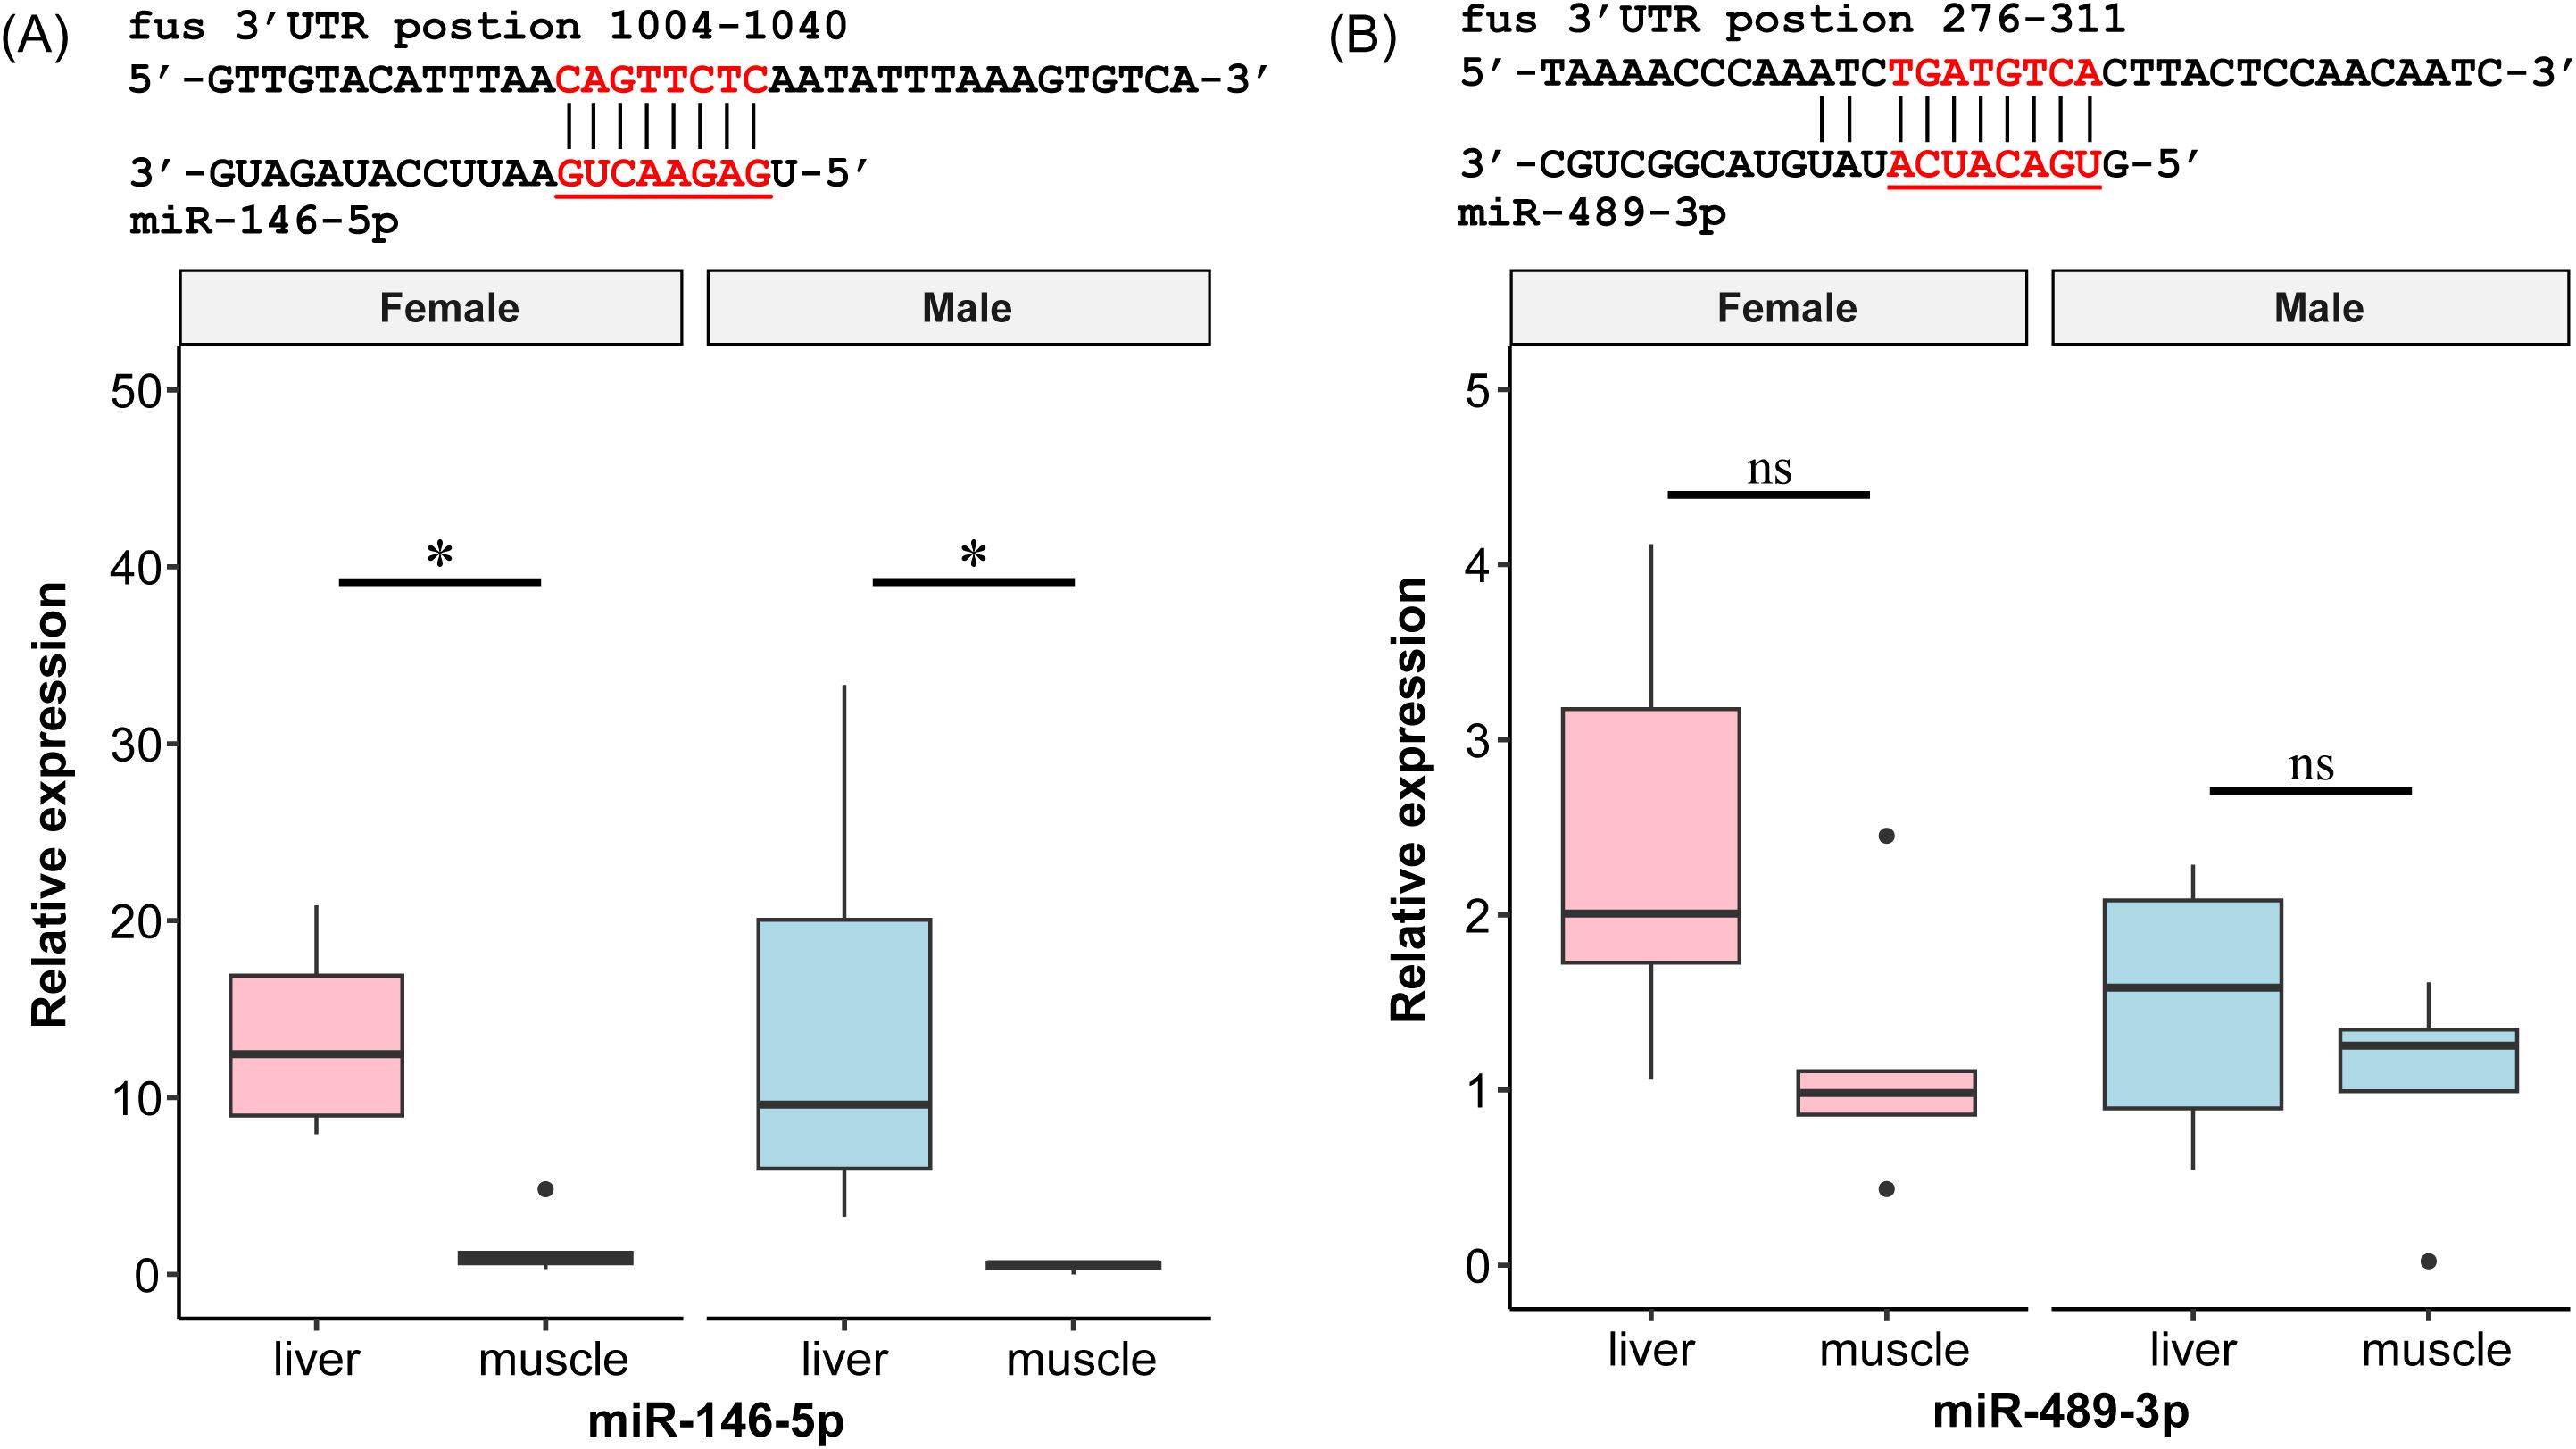
Figure 3. (A, B) Prediction and expression of miRNAs with potential target gene fus of zig-zag eel (Mastacembelus armatus). Underlining indicates seed region of miRNA. Red font indicates the fus 3′UTR complementary sequence of the seed region. The relative gene expressions are normalized to the expression of the female’s muscle and expressed as boxplot by ggplot2 (n = 3). Black dot indicates an outlier. Significant differences were examined by the two-way non-parametric Scheirer–Ray–Hare test with Bonferroni adjustment. The asterisk (*) indicates significant differences between liver and muscle within the same gender, p < 0.05, while “ns” indicates non-significant.
To identify the locations where FUS binds to the related genes on the Gh/Igf-1 axis, we selected six GU-rich fus motifs (TGTG, CTGG, TGGT, GCTG, GTGG, and TTGG) and GGKGG and NNCGCGN according to the existing data from CLIP-seq and the RBPmap database. We found that the igf1, igf1ra, igf2r, ghrhrl, ghsr, and gr genes exhibited a higher abundance of GU-rich fus motifs compared to the other four genes analyzed in zig-zag eels (Figure 4). The interactions between these genes on the Gh/Igf-1 axis and the RNA-binding protein FUS indicated their crucial roles during RNA processing and modification.
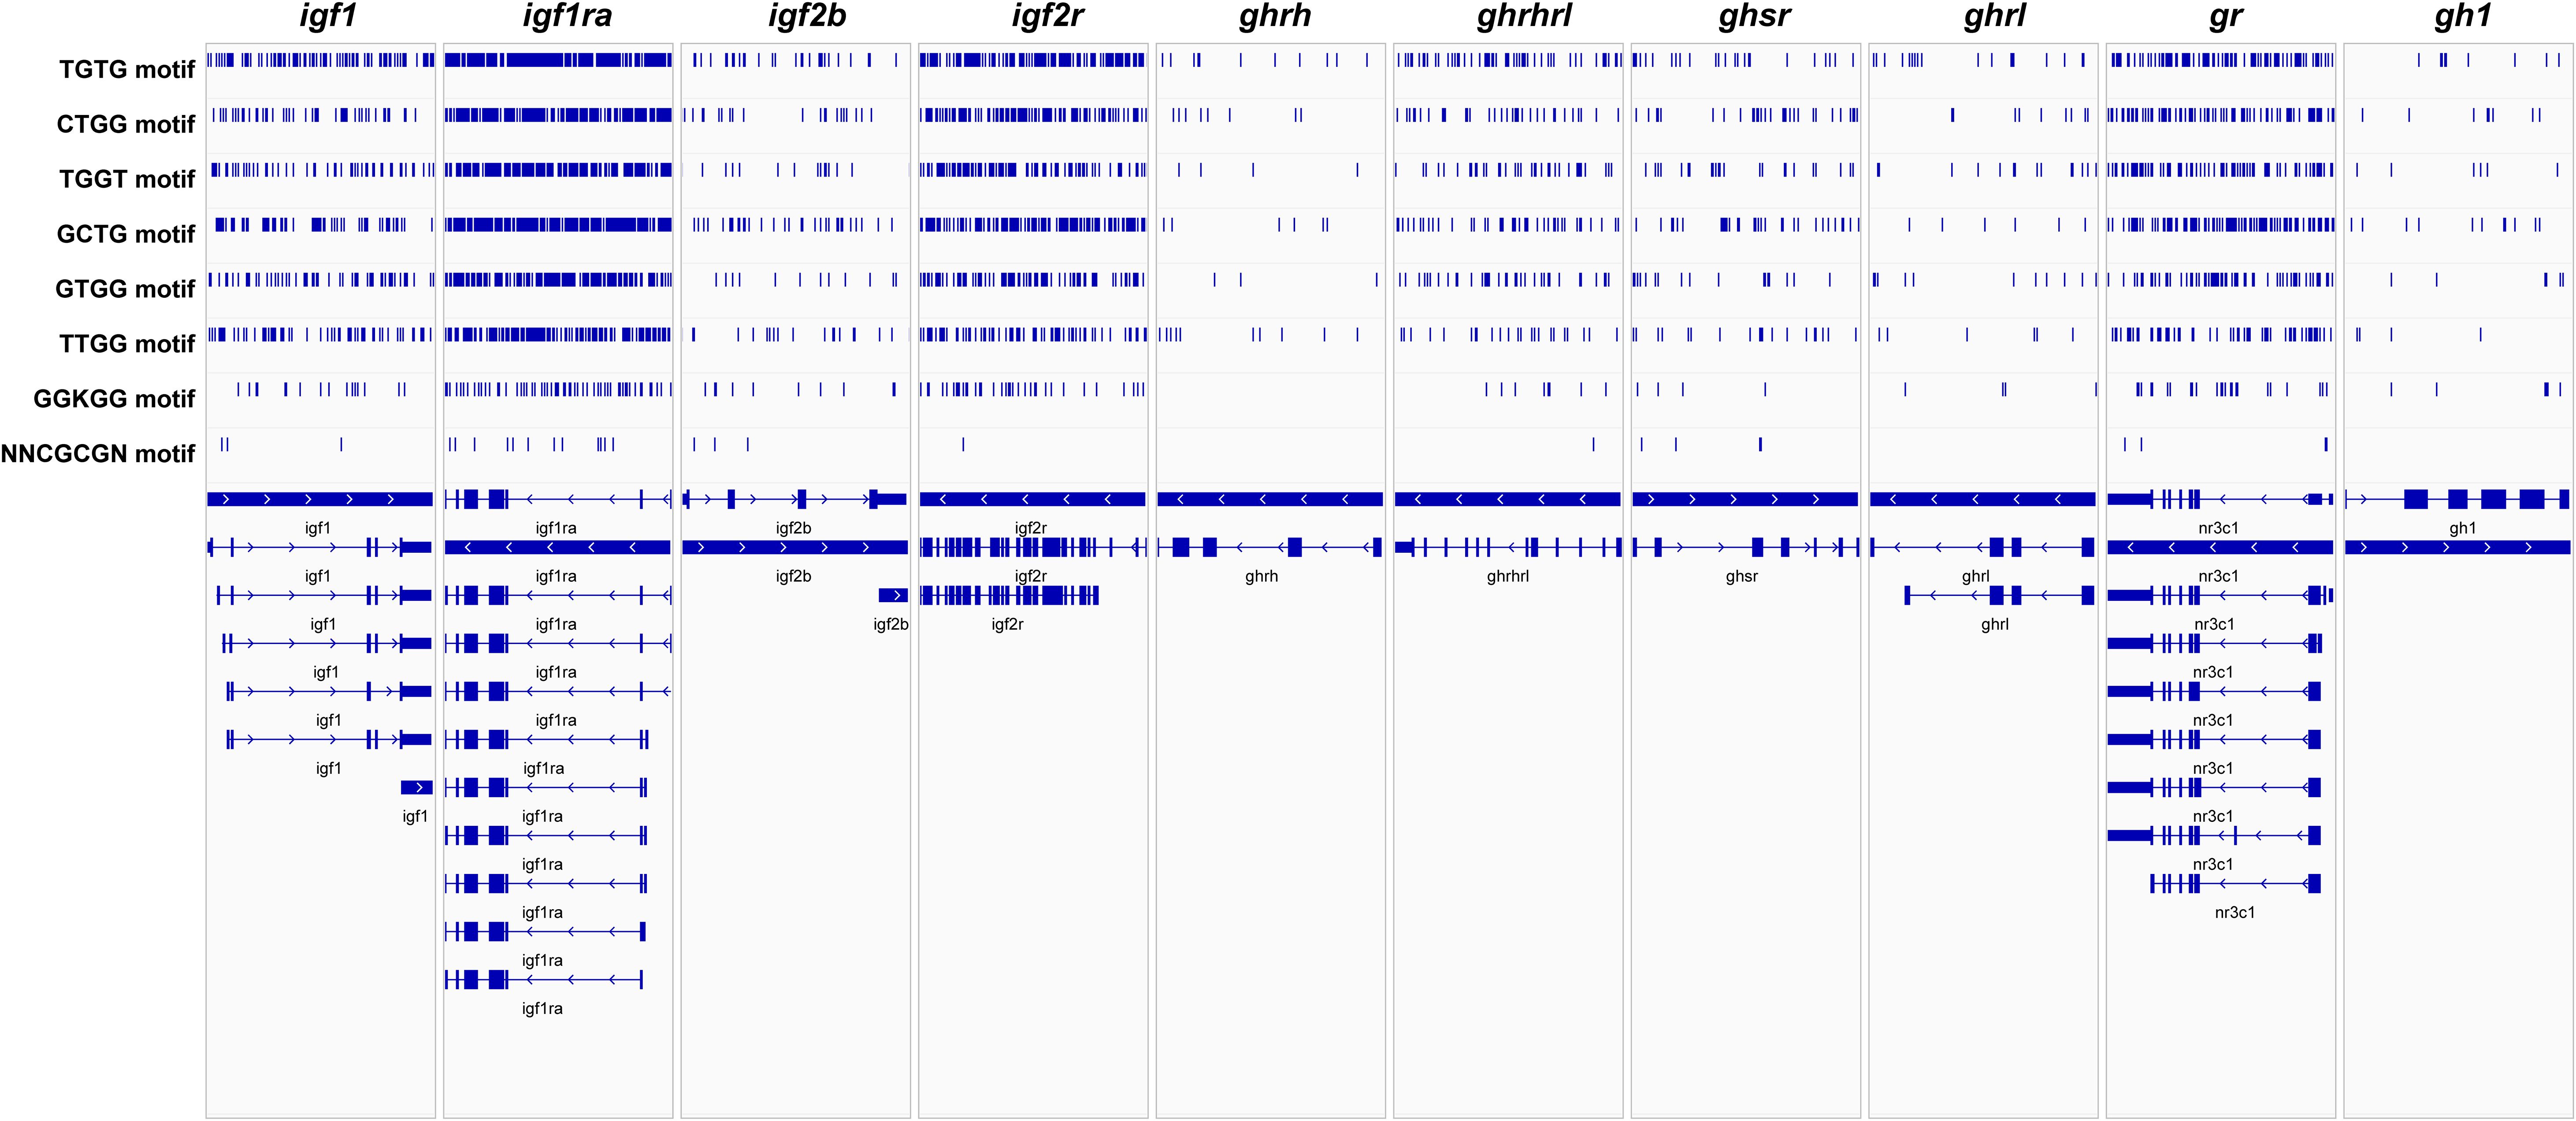
Figure 4. FUS motifs in insulin-like growth factor 1 (igf1), insulin-like growth factor 1 receptor a (igf1ra), insulin-like growth factor 2b (igf2b), insulin-like growth factor 2 receptor (igf2r), growth hormone-releasing hormone (ghrh), growth hormone-releasing hormone like receptor (ghrhrl), growth hormone secretagogue receptor type 1 (ghsr), ghrelin/obestatin prepropeptide (ghrl), glucocorticoid receptor (gr), and growth hormone protein 1 (gh1). Vertical blue lines in the top indicate the prediction of fus-binding sites in each gene. The arrows and bars in the bottom indicate different transcript structures of each gene and the direction of transcription.
After 100 days of culture, the body weight and growth parameters WG, SGR, DGC, and ADG were significantly lower when juvenile zig-zag eels were cultured at high-density groups compared to those cultured at low-density groups (p < 0.05, Figure 5, Table 1). The FBW values of zig-zag eels in the low- and high-density groups were 57.90 ± 1.86 g and 24.63 ± 1.14 g, respectively (Table 1), indicating higher growth speed at low density. However, survival rate did not differ significantly among the different culture densities.
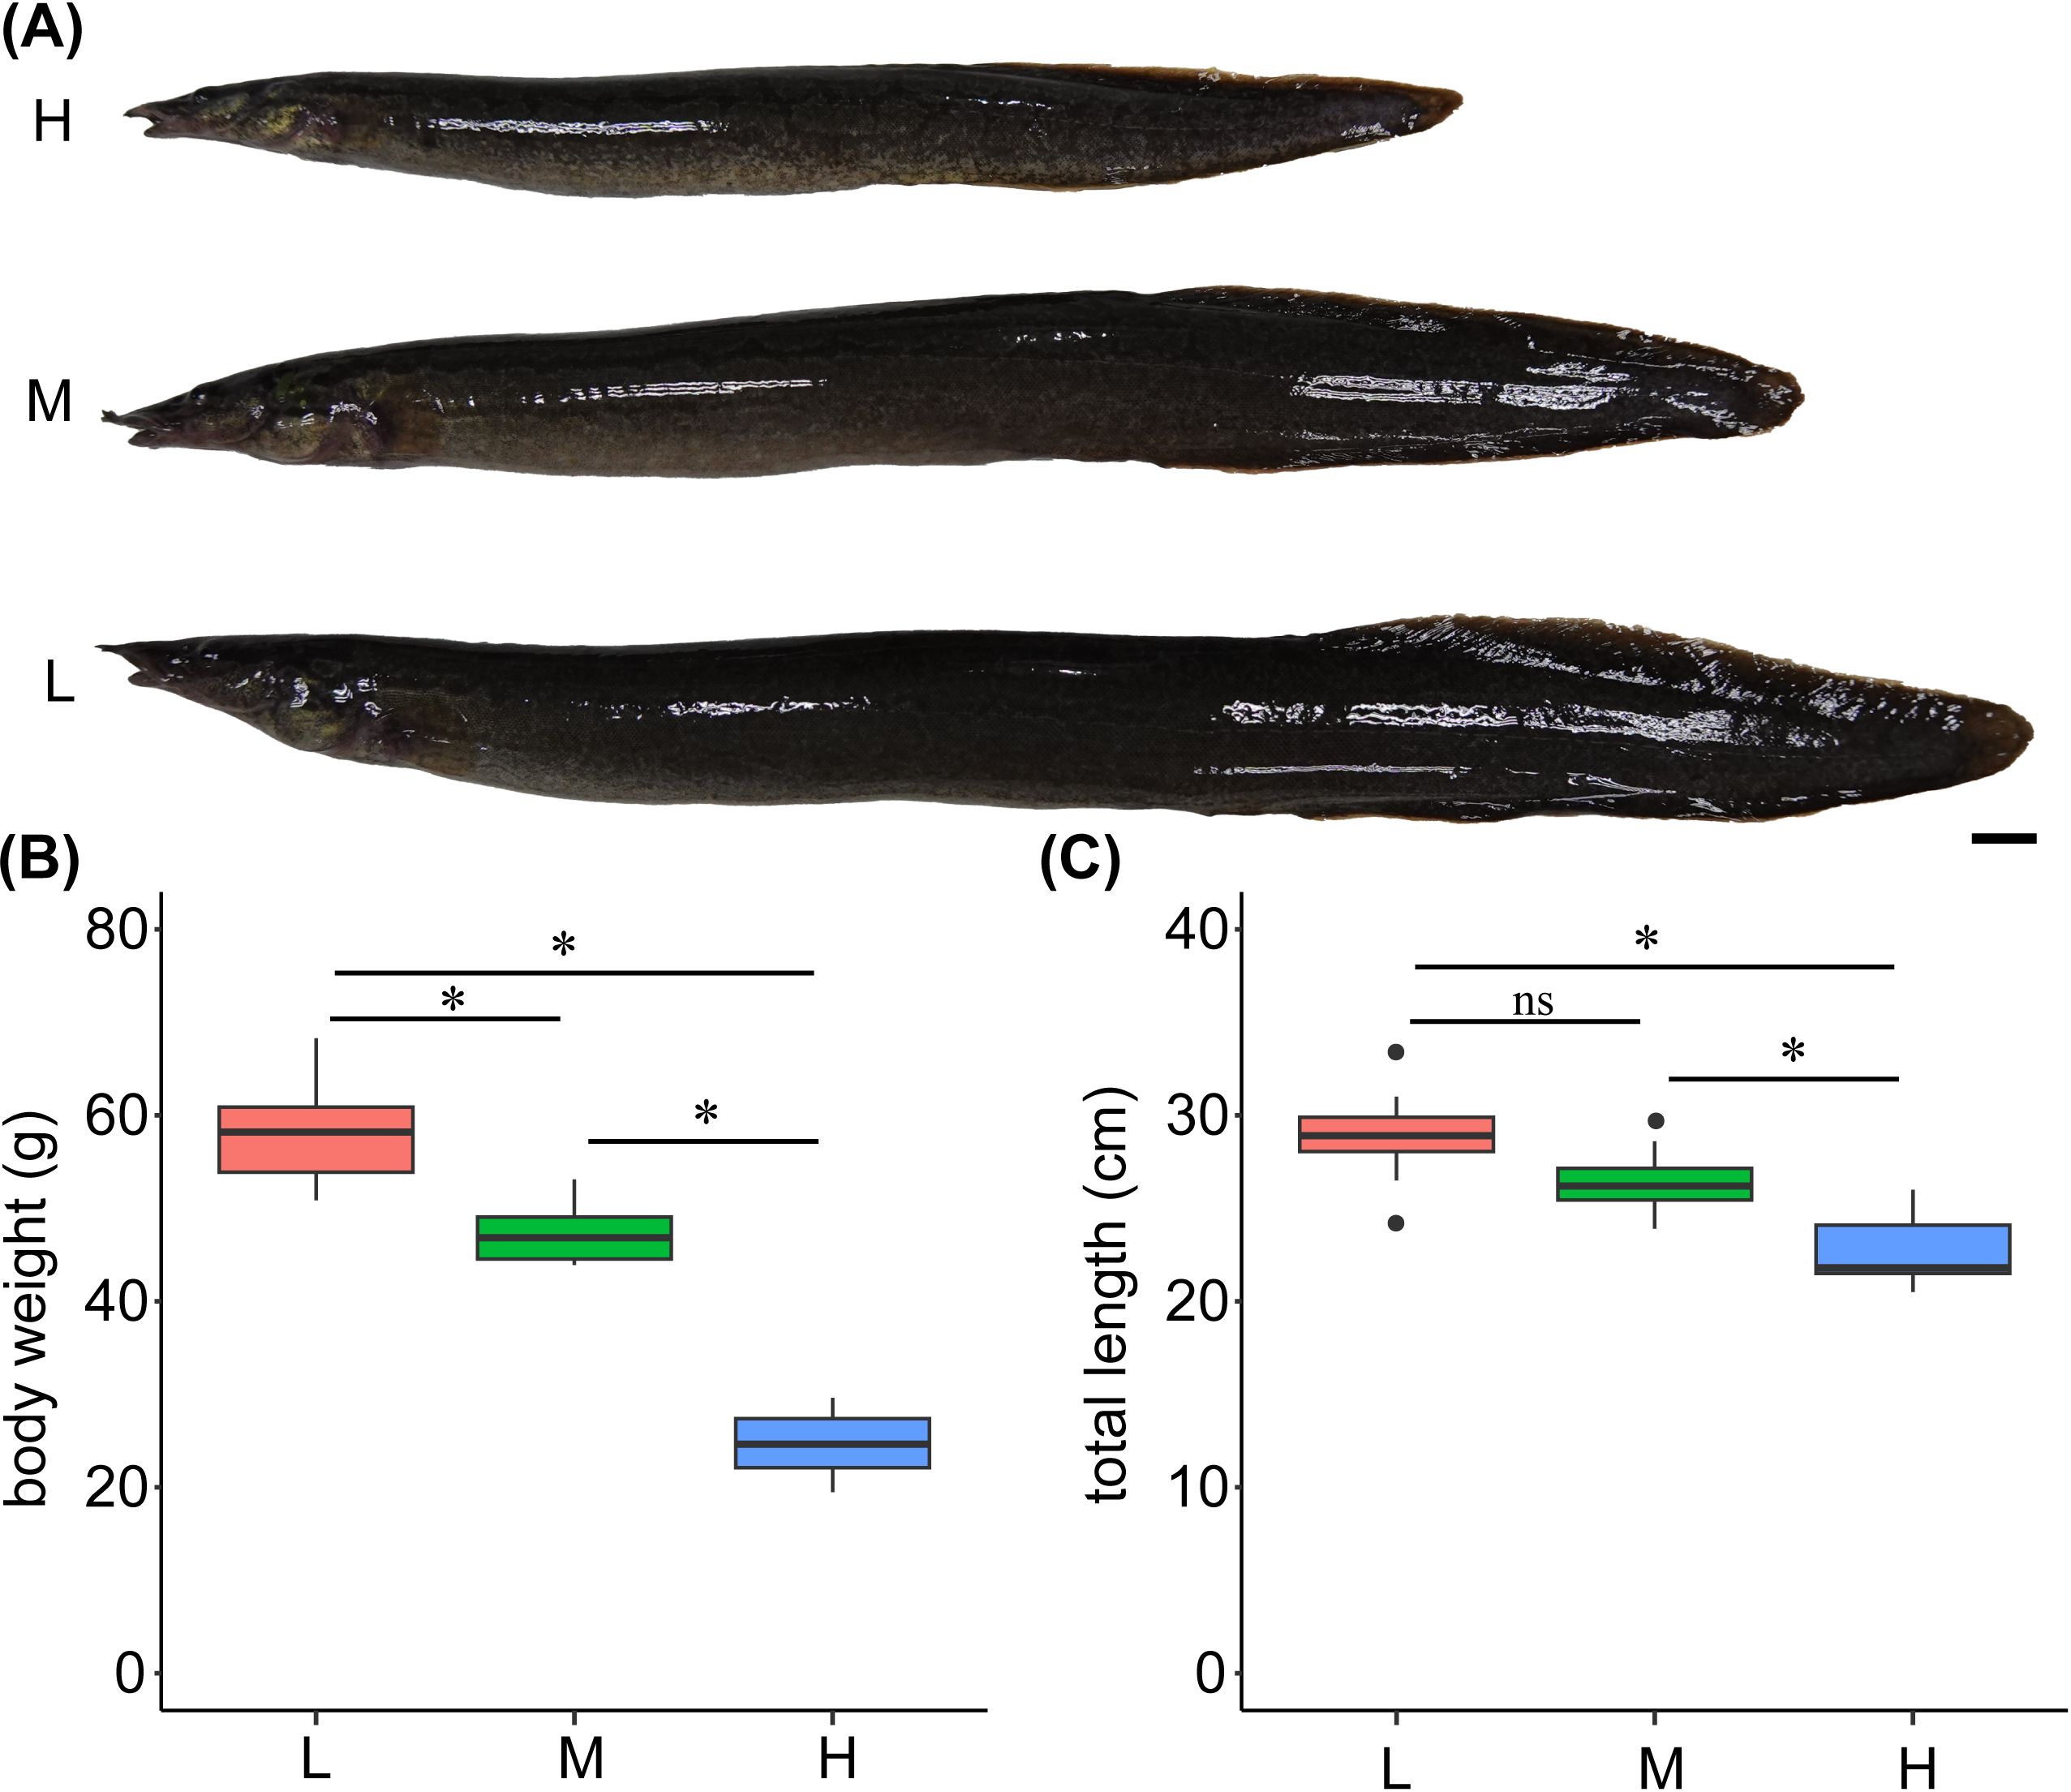
Figure 5. (A-C) The body weight and total length of juvenile zig-zag eel (Mastacembelus armatus) reared under different stocking densities for 100 days. Scale bar: 1 cm. L, low density; 1,000 fish/net-cage; M, medium density; 2,000 fish/net-cage; H, high density; 3,000 fish/net-cage. The values are expressed as boxplot by ggplot2 (n = 15). Black dot indicates an outlier. Significant differences were examined by nonparametric Kruskal–Wallis one-way ANOVA test. The group marked with an asterisk (*) indicates significant differences, p < 0.05, while “ns” indicates non-significant.
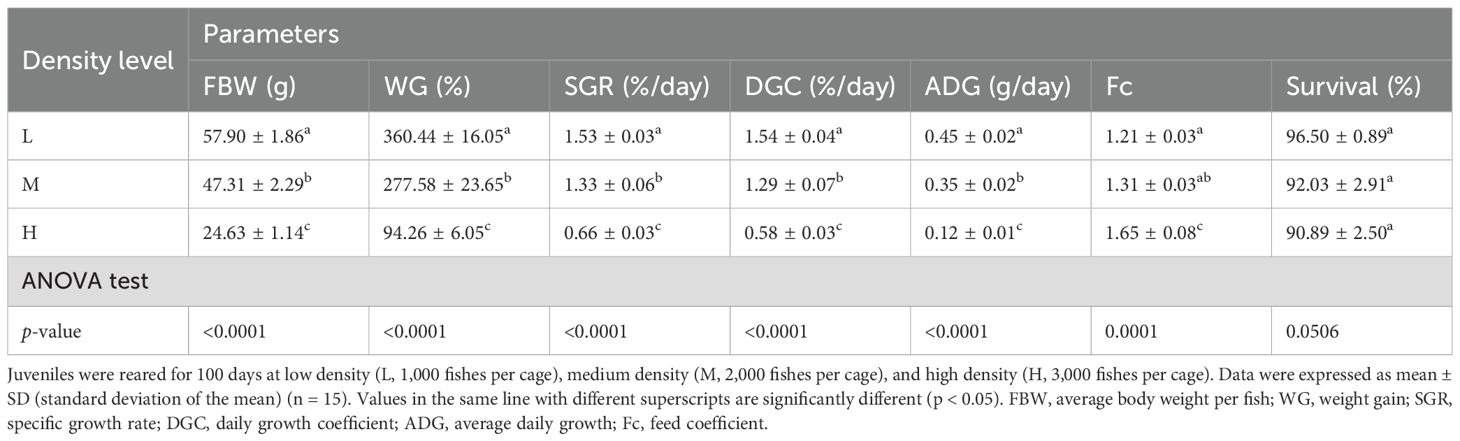
Table 1. Growth parameters of zig-zag eel (Mastacembelus armatus) reared at different stocking densities.
To investigate interactions between Gh/Igf-1 and fus genes, we measured the mRNA expression levels of igf1ra, igf2b, igf2r, ghrh, ghrhrl, and gr in the brain of juveniles reared at different densities (Figure 6). The expression level of fus mRNA decreased with increasing culture density, and the difference was significant between the high-density group (3,000 fish per cage) and the low-density group (1,000 fish per cage) (p < 0.05). Ghrh and gr expression levels were significantly higher in the high-density group, whereas the expression of ghrhrl was significantly lower than the values in the low-density group (p < 0.05). mRNA levels of igf1ra, igf2b, and igf2r did not differ significantly among the different culture densities. An analysis of the Pearson correlation coefficient between gene expression and growth parameters exhibited a remarkable positive correlation between the expression levels of fus and SGR (Supplementary Figure S2).
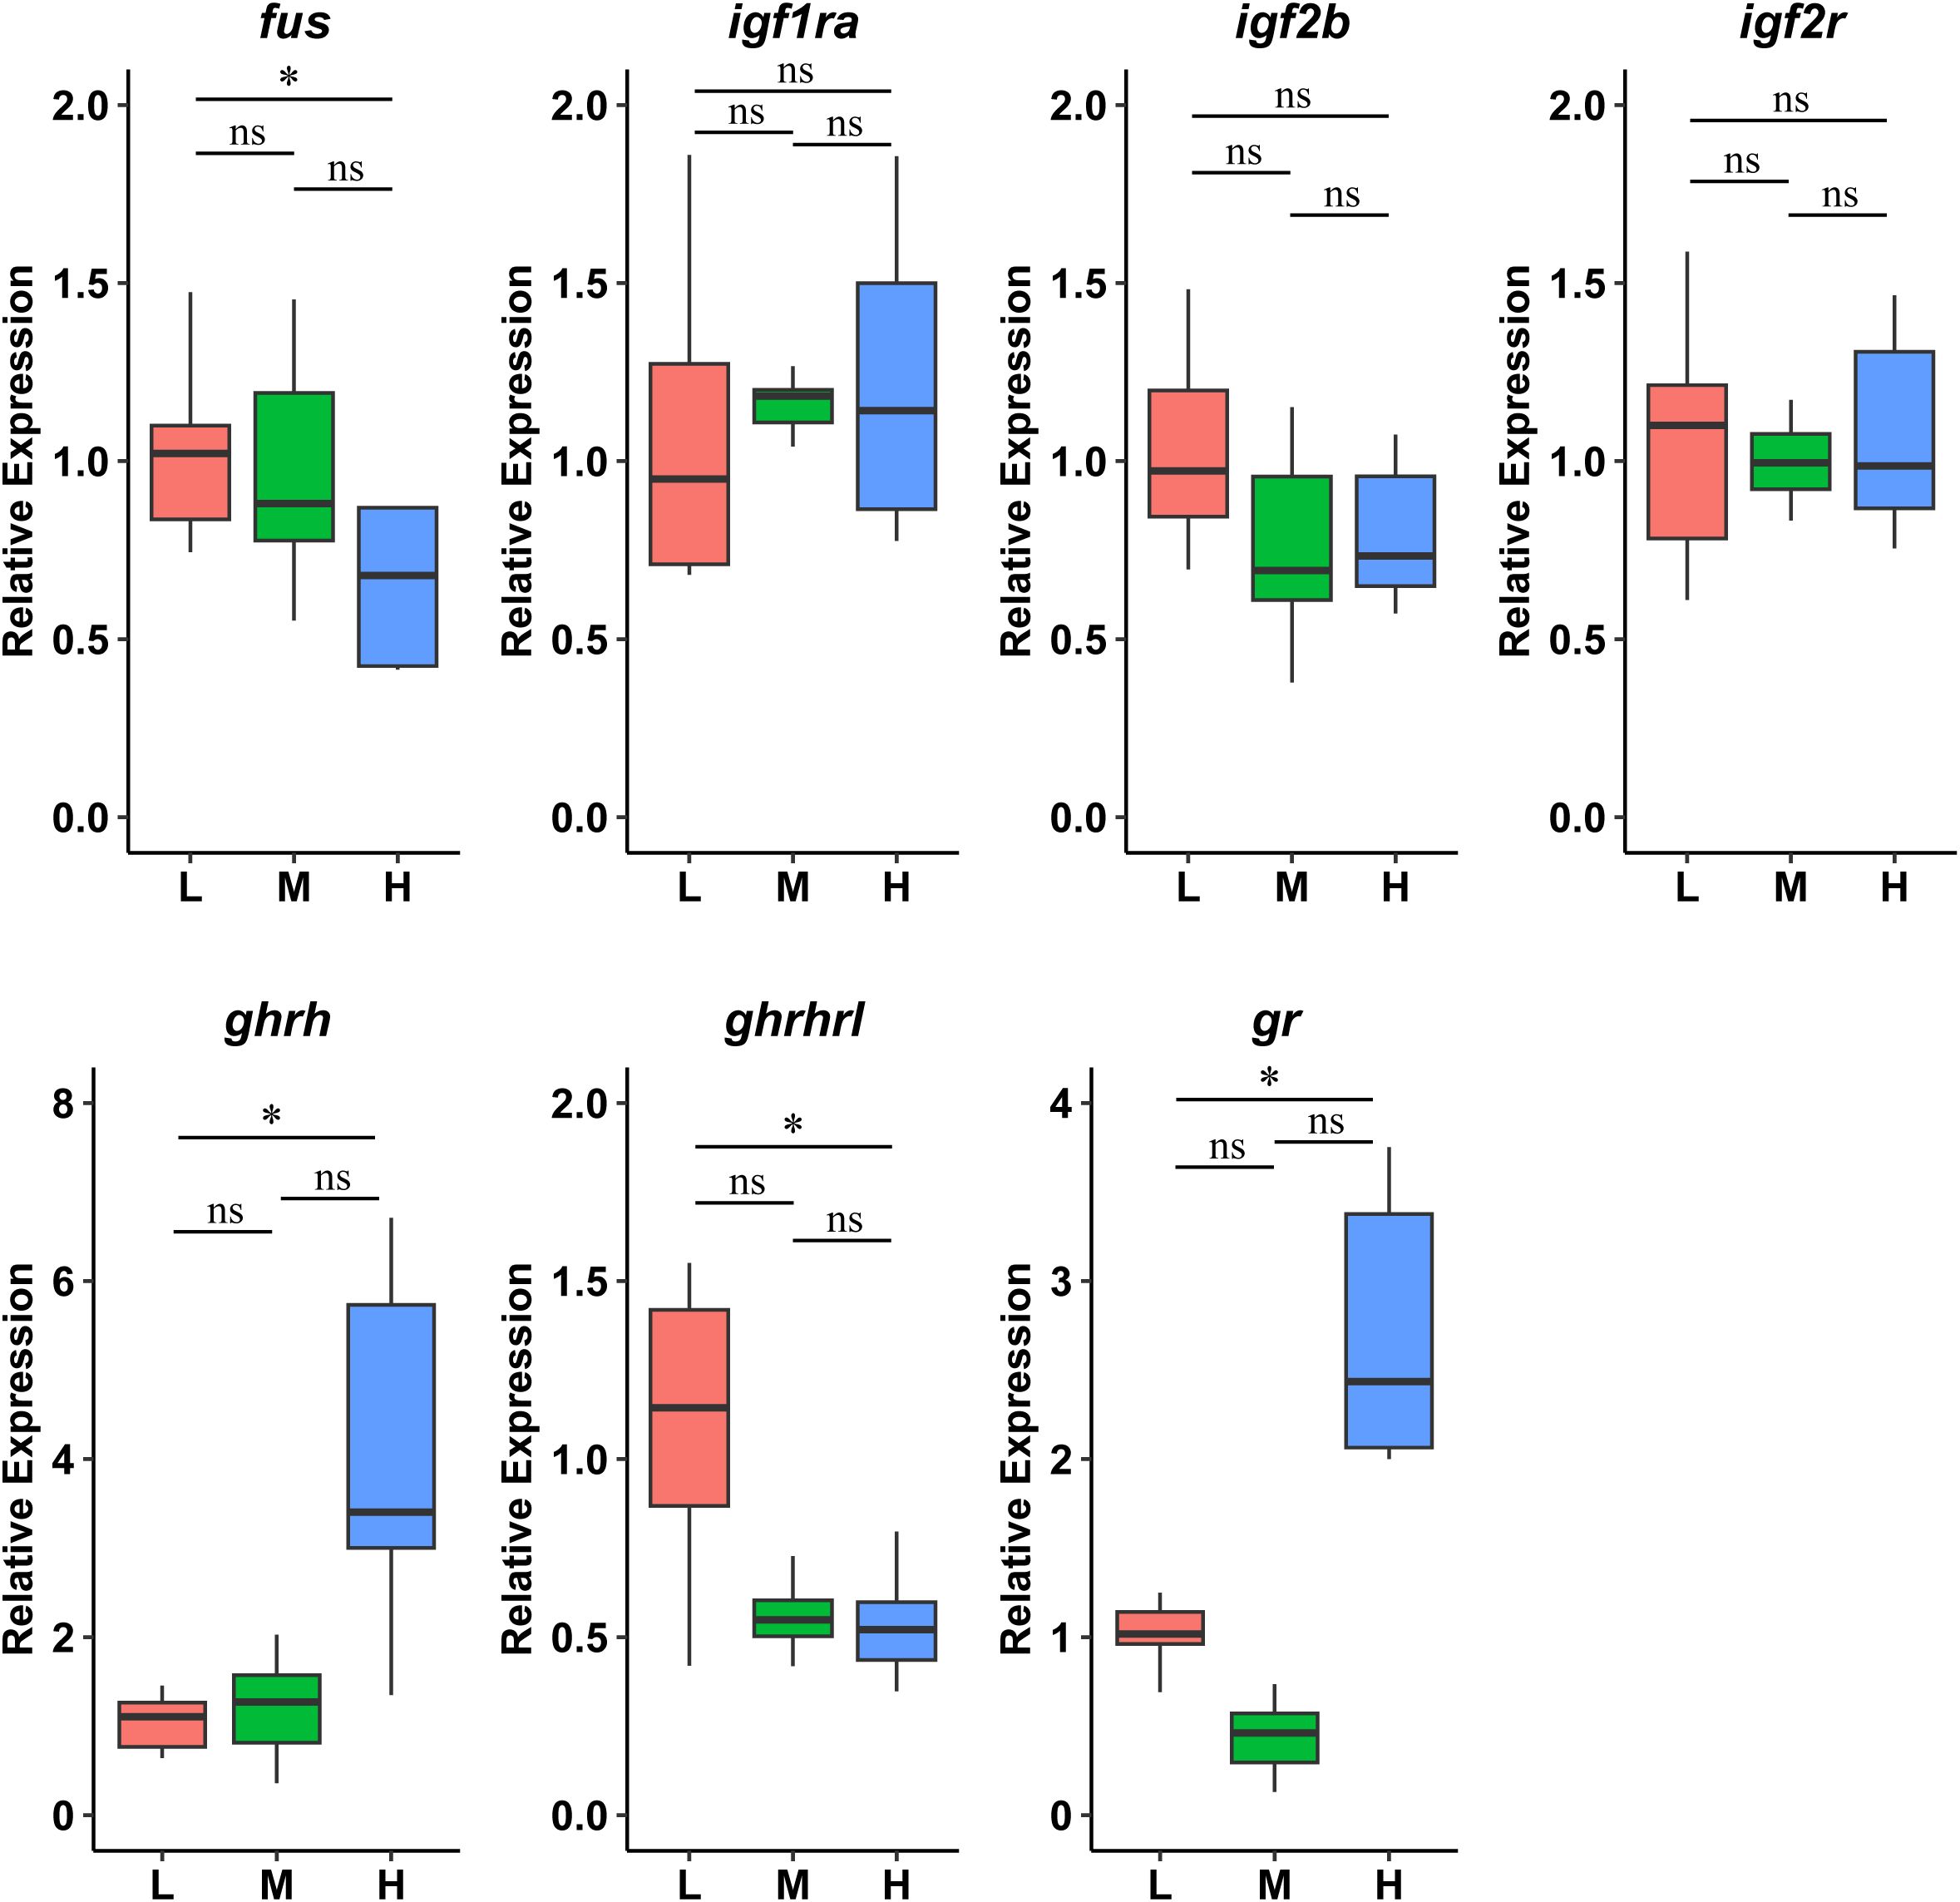
Figure 6. Relative gene expression related to the Gh/Igf-1 axis in the brain of zig-zag eel (Mastacembelus armatus) reared under different stocking densities for 100 days. L, low density; 1,000 fish/net-cage; M, medium density; 2,000 fish/net-cage; H, high density; 3,000 fish/net-cage. The values are expressed as boxplot by ggplot2 (n = 3). Significant differences were examined by one-way ANOVA followed by a Tukey’s honestly test. The group marked with an asterisk (*) indicates significant differences, p < 0.05, while “ns” indicates non-significant.
A previous study showed that FUS-affected genes involved multiple signaling components and transcription factors with diverse functions during early frog development and gastrulation (Dichmann and Harland, 2012). Typically, genes that are located in close proximity to a chromosome exhibit a tendency to be inherited together and are often involved in the same biological pathways or processes. For example, the upstream genes (arl6ip1 and Rab35) have similar functions to fus. Arl6ip1 is required for neural crest migration (Tu et al., 2012), and its delivery reduces neurodegenerative pathology (Lim et al., 2023). Rab35 mediates the developmental process through actin remodeling, which is crucial for blood vessel development, gastrulation, and skeletogenesis (Remsburg et al., 2021; Francis et al., 2022).
Sexual dimorphism across various species is fundamentally developed and expressed through the action of sex steroid hormones (McCarthy and Arnold, 2011). In this study, fus expression exhibited sexual dimorphism in the brain, liver, and muscle. Similarly, significant gender differences have also been observed in the anatomical patterns of cortical and subcortical pathology in amyotrophic lateral sclerosis (ALS), a neurodegenerative disease (Bede et al., 2014). FUS plays a crucial role in connecting androgen receptor signaling with cell-cycle progression, as it is downregulated in response to androgen (Brooke et al., 2011). Bianchi et al. (2017) reported that the role of Gh/Igf-1 was intertwined with or acted through the agency of other hormones, including sex steroids such as 17β-estradiol (E2) or testosterone (T) (Bianchi et al., 2017). These findings suggest that the cell-cycle progression mediated by fus is related to the phenotype of sexual dimorphism through sex steroid hormones.
In a study of human stem cells, FUS/ERG fusion protein triggers activation of the Igf-1 promoter, leading to increased expression of Igf-1 (Cironi et al., 2008). Endocrine regulation of growth in fish is similar to that in higher vertebrates (Yaron and Levavi-Sivan, 2011). We performed a fish culture experiment in which we reared juvenile zig-zag eels under different culture densities to investigate the correlation between fus and Gh/Igf-1 genes. Although juveniles showed differences in growth, mRNA expression levels of igf1ra, igf2b, and igf2r in the brain did not differ among the different density groups. In accordance with these results, previous studies of fus-mutated zebrafish and mice demonstrated that both the mRNA and protein levels of the majority of genes were only mildly changed in the brain (Scekic‐Zahirovic et al., 2016; Lebedeva et al., 2017), suggesting that genetic background effects influenced gene expression (Lebedeva et al., 2017). Wild-type FUS is mostly localized in the nuclei of neurons (Gal et al., 2011); however, mutated FUS protein mainly localized in the cytoplasm instead of the normal nuclear localization, which may lead to the loss of FUS nuclear function, thereby affecting the expression of its directly regulated RNA targets (Scekic‐Zahirovic et al., 2016). The FUS protein bound to the transcription initiation complex TFIID and regulated the activity of RNA polymerase II (Efimova et al., 2017). This may involve influencing the transcription of Gh/Igf-1-related genes. High-density culture resulted in downregulated fus expression and a reduction in growth parameters, including body weight. This finding is consistent with a study of the phenotype of fus knockout zebrafish, which showed reduced body length and body weight (Dan et al., 2019). In the present study, we noticed a higher abundance of GU-rich fus motifs in intron regions of Gh/Igf-1-related genes. By binding to extended intron regions, FUS may influence the splicing process of its target genes (Nakaya et al., 2013), thereby contributing to the alternative splicing of Gh/Igf-1-related genes, and play a role in body development.
We also found that the expression of ghrh and ghrhrl in zig-zag eels showed opposite trends as the culture density increased. In half-smooth tongue sole (C. semilaevis), which exhibit sexual dimorphism in growth, Ji et al. (2011) found an inverse relationship between the expression of ghrh and body weight gain (Ji et al., 2011). GHRH binding to GHRHR stimulates GH synthesis and release from anterior pituitary cells. Generally, GHRH mRNA expression accompanies GH deficiency (Hurley and Phelps, 1993). Furthermore, GH can exert negative feedback through direct actions on the hypothalamus and pituitary or indirectly through the actions of Igf-1 produced in the liver (Wong et al., 2006). We found that the decrease in GHRHR in zig-zag eels in the high-density group led to the reduced binding efficiency of GHRH, resulting in insufficient production of GH. GR, also known as NR3C1, serves as the binding site for cortisol and other glucocorticoids. Vijayan et al. (2003) previously showed that long-term exposure to cortisol increases the abundance of gr mRNA in the liver of rainbow trout (Oncorhynchus mykiss) (Vijayan et al., 2003). In Atlantic salmon (Salmo salar), the expression levels of two gr splice variants were upregulated due to increased stocking density (Romero et al., 2020). In our study, the increased expression of gr indicated the occurrence of crowding stress in the high-density group.
IGFs are part of a complex system that cells use to interact with their physiological environment. When GH is released from the pituitary gland, it stimulates the liver to produce IGF-1, a potent growth factor that acts on various tissues, including muscle, a primary target of IGF-1 (Wood et al., 2005). Notably, miR-146-5p was a highly expressed miRNA among selected miRNAs that were identified in the liver and muscle of both male and female. Several studies reported that miR-146a-5p promoted the proliferation and migration of smooth muscle cells (Luo et al., 2017; Xue et al., 2019) and miR-489 maintained the skeletal muscle satellite cells in a quiescent state (Cheung et al., 2012). In this study, it is speculated that miR-146 and miR-489 were involved in the physiological processes of muscle cells. Both miR-489 and miR-146a may also play a role in the regulation of the release of sex steroids (Gao et al., 2018; Soni et al., 2022). Previous research also showed that miR-141-3p negatively regulates fus expression (Wang et al., 2016) and is involved in the GH regulation in the pituitary (Zhang et al., 2018). The longer GH interpulse interval in males, compared to females, drives sex-specific liver gene expression and sexually dimorphic growth patterns (Davey et al., 1999; Tannenbaum et al., 2001). We infer that specific miRNAs influence the cell progression mediated by IGFs in the liver, thereby affecting the growth of muscles in a sex-specific manner. However, further studies will need to analyze how FUS-mediated growth differences impact the regulation of GH by specific miRNAs in the brain. Additionally, the competitive endogenous RNA (ceRNA) mechanism involves long non-coding RNAs (lncRNAs) binding to miRNAs, thereby inhibiting miRNA activity and indirectly regulating the expression of miRNA target genes. For example, lncRNA DUBR sponge miR-142 promotes upregulation of the FUS protein, which could affect cell proliferation in acute myeloid leukemia (Yin et al., 2021). Our results showed that the miR-146-5p and miR-489-3p that target fus potentially affected adult somatic muscle development mediated by sex hormones, indicating a regulatory role of the complex multilevel interaction between fus and miRNAs on the growth of zig-zag eels.
The present study analyzed the homology, conserved domains, evolutionary characteristics, and conserved syntenies of fus in several teleost species. Furthermore, fus gene was predominantly expressed in the brain of zig-zag eels and that it showed a sexually dimorphic expression pattern in the brain, muscle, and liver among nine selected tissues. In this study, fus 3′UTR sequence was cloned from the zig-zag eels, which was the first time to predict the miRNAs involved in regulating fus in zig-zag eels. Lastly, we further provided a novel view that fus mediates growth differences by regulating the expression of several growth-related genes including Gh/Igf-1 axis genes in zig-zag eels. These results would contribute to enhancing the cognition of the functional evolutionary divergence of fus in vertebrate evolution and fus-mediated growth differences in zig-zag eels. As an RNA-binding protein, the mechanism of complex multilevel regulation by which miRNA regulates fus expression, which, in turn, affects Gh/Igf-1 axis, needs to be further clarified.
The raw data supporting the conclusions of this article will be made available by the authors, without undue reservation.
The animal study was approved by the Scientific Ethics Committee of Yunnan Agricultural University, Kunming, China. The study was conducted in accordance with the local legislation and institutional requirements.
LX: Conceptualization, Formal analysis, Funding acquisition, Resources, Supervision, Writing – original draft. YGa: Conceptualization, Formal analysis, Funding acquisition, Supervision, Visualization, Writing – original draft, Writing – review & editing. SZ: Formal analysis, Visualization, Writing – original draft. MW: Data curation, Investigation, Writing – original draft. GZ: Data curation, Investigation, Writing – original draft. JC: Data curation, Investigation, Writing – original draft. ML: Data curation, Investigation, Writing – original draft. SA: Formal analysis, Investigation, Writing – review & editing. YGu: Writing – review & editing.
The author(s) declare financial support was received for the research, authorship, and/or publication of this article. This work was jointly supported by funding from the Young Talent Project of the “Xing Dian Talent Support Program” of Yunnan Province in 2022, the projects from Fujian Provincial Bureau of Ocean and Fisheries (FJHY-YYKJGG-2022-2-1, FJHY-YYKJGG-2022-2-2, and FJHY-YYKJ-2022-2-9), the project from Fujian Provincial Department of Science and Technology (2023R1013005 and 2023S0058), and the Natural Science Foundation of China (32002360). YGa and SZ were also financially supported by the Chinese Scholarship Council (202208530097, 202108160002).
The authors declare that the research was conducted in the absence of any commercial or financial relationships that could be construed as a potential conflict of interest.
All claims expressed in this article are solely those of the authors and do not necessarily represent those of their affiliated organizations, or those of the publisher, the editors and the reviewers. Any product that may be evaluated in this article, or claim that may be made by its manufacturer, is not guaranteed or endorsed by the publisher.
The Supplementary Material for this article can be found online at: https://www.frontiersin.org/articles/10.3389/fmars.2024.1461451/full#supplementary-material
Åberg N. D., Brywe K. G., Isgaard J. (2006). Aspects of growth hormone and insulin-like growth factor-I related to neuroprotection, regeneration, and functional plasticity in the adult brain. Sci. World J. 6, 287372. doi: 10.1100/tsw.2006.22
Anders S., Pyl P. T., Huber W. (2015). HTSeq–a Python framework to work with high-throughput sequencing data. Bioinformatics 31, 166–169. doi: 10.1093/bioinformatics/btu638
Armstrong G., Drapeau P. (2013). Loss and gain of FUS function impair neuromuscular synaptic transmission in a genetic model of ALS. Hum. Mol. Genet. 22, 4282–4292. doi: 10.1093/hmg/ddt278
Assoni A. F., Foijer F., Zatz M. (2023). Amyotrophic lateral sclerosis, FUS and protein synthesis defects. Stem Cell Rev. Rep. 19, 625–638. doi: 10.1007/s12015-022-10489-8
Bede P., Elamin M., Byrne S., Hardiman O. (2014). Sexual dimorphism in ALS: Exploring gender-specific neuroimaging signatures. Amyotrophic Lateral Sclerosis Frontotemporal Degeneration 15, 235–243. doi: 10.3109/21678421.2013.865749
Bianchi V. E., Locatelli V., Rizzi L. (2017). Neurotrophic and Neuroregenerative Effects of GH/IGF1. Int. J. Mol. Sci. 18, 2441. doi: 10.3390/ijms18112441
Bidosee M., Karry R., Weiss-Messer E., Barkey R. J. (2011). Growth hormone affects gene expression and proliferation in human prostate cancer cells. Int. J. Andrology 34, 124–137. doi: 10.1111/j.1365-2605.2010.01064.x
Bolger A. M., Lohse M., Usadel B. (2014). Trimmomatic: a flexible trimmer for Illumina sequence data. Bioinformatics 30, 2114–2120. doi: 10.1093/bioinformatics/btu170
Bourefis A.-R., Campanari M.-L., Buee-Scherrer V., Kabashi E. (2020). Functional characterization of a FUS mutant zebrafish line as a novel genetic model for ALS. Neurobiol. Dis. 142, 104935. doi: 10.1016/j.nbd.2020.104935
Brooke G. N., Culley R. L., Dart D. A., Mann D. J., Gaughan L., Mccracken S. R., et al. (2011). FUS/TLS is a novel mediator of androgen-dependent cell-cycle progression and prostate cancer growth. Cancer Res. 71, 914–924. doi: 10.1158/0008-5472.CAN-10-0874
Cannata D., Vijayakumar A., Fierz Y., Leroith D. (2010). The GH/IGF-1 axis in growth and development: new insights derived from animal models. Adv. Pediatr. 57, 331–351. doi: 10.1016/j.yapd.2010.09.003
Cheng P., Chen Z., Xu W., Wang N., Yang Q., Shi R., et al. (2022). Potential involvement of ewsr1-w gene in ovarian development of Chinese tongue sole. Cynoglossus semilaevis. 12, 2503. doi: 10.3390/ani12192503
Cheung T. H., Quach N. L., Charville G. W., Liu L., Park L., Edalati A., et al. (2012). Maintenance of muscle stem-cell quiescence by microRNA-489. Nature 482, 524–528. doi: 10.1038/nature10834
Cironi L., Riggi N., Provero P., Wolf N., Suvà M.-L., Suvà D., et al. (2008). IGF1 is a common target gene of ewing's sarcoma fusion proteins in mesenchymal progenitor cells. PloS One 3, e2634. doi: 10.1371/journal.pone.0002634
Dan H., Ren F., Xiong S., Chen X., Yang T., Mei J. (2019). FUS is essential for somatic growth and sexual size dimorphism in zebrafish. Acta Hydrobiologica Sin. 43, 465–472. doi: 10.7541/2019.057
Davey H. W., Wilkins R. J., Waxman D. J. (1999). STAT5 signaling in sexually dimorphic gene expression and growth patterns. Am. J. Hum. Genet. 65, 959–965. doi: 10.1086/302599
Deng H., Gao K., Jankovic J. (2014). The role of FUS gene variants in neurodegenerative diseases. Nat. Rev. Neurol. 10, 337–348. doi: 10.1038/nrneurol.2014.78
Deshpande D., Higelin J., Schoen M., Vomhof T., Boeckers T. M., Demestre M., et al. (2019). Synaptic FUS localization during motoneuron development and its accumulation in human ALS synapses. Front. Cell. Neurosci. 13, 256. doi: 10.3389/fncel.2019.00256
Dichmann D. S., Harland R. M. (2012). fus/TLS orchestrates splicing of developmental regulators during gastrulation. Genes Dev. 26, 1351–1363. doi: 10.1101/gad.187278.112
Dini Modigliani S., Morlando M., Errichelli L., Sabatelli M., Bozzoni I. (2014). An ALS-associated mutation in the FUS 3'-UTR disrupts a microRNA-FUS regulatory circuitry. Nat. Commun. 5, 4335. doi: 10.1038/ncomms5335
Dobin A., Davis C. A., Schlesinger F., Drenkow J., Zaleski C., Jha S., et al. (2013). STAR: ultrafast universal RNA-seq aligner. Bioinformatics 29, 15–21. doi: 10.1093/bioinformatics/bts635
Du L., Schageman J. J., Subauste M. C., Saber B., Hammond S. M., Prudkin L., et al. (2009). miR-93, miR-98, and miR-197 regulate expression of tumor suppressor gene FUS1. Mol. Cancer Res. 7, 1234–1243. doi: 10.1158/1541-7786.MCR-08-0507
Efimova A. D., Ovchinnikov R. K., Roman A. Y., Maltsev A. V., Grigoriev V. V., Kovrazhkina E. A., et al. (2017). The FUS protein: Physiological functions and a role in amyotrophic lateral sclerosis. Mol. Biol. 51, 341–351. doi: 10.1134/S0026893317020091
Enright A. J., John B., Gaul U., Tuschl T., Sander C., Marks D. S. (2003). MicroRNA targets in drosophila. Genome Biol. 5, R1. doi: 10.1186/gb-2003-5-1-r1
Francis C. R., Kincross H., Kushner E. J. (2022). Rab35 governs apicobasal polarity through regulation of actin dynamics during sprouting angiogenesis. Nat. Commun. 13, 5276. doi: 10.1038/s41467-022-32853-5
Gal J., Zhang J., Kwinter D. M., Zhai J., Jia H., Jia J., et al. (2011). Nuclear localization sequence of FUS and induction of stress granules by ALS mutants. Neurobiol. Aging 32, 2323.e2327–2323.e2340. doi: 10.1016/j.neurobiolaging.2010.06.010
Gao G.-Z., Zhao Y., Li H.-X., Li W. (2018). Bisphenol A-elicited miR-146a-5p impairs murine testicular steroidogenesis through negative regulation of Mta3 signaling. Biochem. Biophys. Res. Commun. 501, 478–485. doi: 10.1016/j.bbrc.2018.05.017
Guindon S., Dufayard J. F., Lefort V., Anisimova M., Hordijk W., Gascuel O. (2010). New algorithms and methods to estimate maximum-likelihood phylogenies: assessing the performance of PhyML 3.0. Syst. Biol. 59, 307–321. doi: 10.1093/sysbio/syq010
Guntur A. R., Rosen C. J. (2013). IGF-1 regulation of key signaling pathways in bone. Bonekey Rep. 2, 437. doi: 10.1038/bonekey.2013.171
Hurley D. L., Phelps C. J. (1993). Altered growth hormone-releasing hormone mRNA expression in transgenic mice with excess or deficient endogenous growth hormone. Mol. Cell. Neurosci. 4, 237–244. doi: 10.1006/mcne.1993.1030
Iko Y., Kodama T. S., Kasai N., Oyama T., Morita E. H., Muto T., et al. (2004). Domain architectures and characterization of an RNA-binding protein, TLS. J. Biol. Chem. 279, 44834–44840. doi: 10.1074/jbc.M408552200
Ji X.-S., Chen S.-L., Jiang Y.-L., Xu T.-J., Yang J.-F., Tian Y.-S. (2011). Growth differences and differential expression analysis of pituitary adenylate cyclase activating polypeptide (PACAP) and growth hormone-releasing hormone (GHRH) between the sexes in half-smooth tongue sole Cynoglossus semilaevis. Gen. Comp. Endocrinol. 170, 99–109. doi: 10.1016/j.ygcen.2010.09.011
Kalvari I., Nawrocki E. P., Argasinska J., Quinones-Olvera N., Finn R. D., Bateman A., et al. (2018). Non-coding RNA analysis using the Rfam database. Curr. Protoc. Bioinf. 62, e51. doi: 10.1002/cpbi.51
Kino Y., Washizu C., Kurosawa M., Yamada M., Miyazaki H., Akagi T., et al. (2015). FUS/TLS deficiency causes behavioral and pathological abnormalities distinct from amyotrophic lateral sclerosis. Acta Neuropathol. Commun. 3, 24. doi: 10.1186/s40478-015-0202-6
Kozomara A., Griffiths-Jones S. (2011). miRBase: integrating microRNA annotation and deep-sequencing data. Nucleic Acids Res. 39, D152–D157. doi: 10.1093/nar/gkq1027
Lagier-Tourenne C., Polymenidou M., Hutt K. R., Vu A. Q., Baughn M., Huelga S. C., et al. (2012). Divergent roles of ALS-linked proteins FUS/TLS and TDP-43 intersect in processing long pre-mRNAs. Nat. Neurosci. 15, 1488–1497. doi: 10.1038/nn.3230
Larkin M. A., Blackshields G., Brown N. P., Chenna R., Mcgettigan P. A., Mcwilliam H., et al. (2007). Clustal W and clustal X version 2.0. Bioinformatics 23, 2947–2948. doi: 10.1093/bioinformatics/btm404
Lebedeva S., De Jesus Domingues A. M., Butter F., Ketting R. F. (2017). Characterization of genetic loss-of-function of Fus in zebrafish. RNA Biol. 14, 29–35. doi: 10.1080/15476286.2016.1256532
Lefort V., Longueville J. E., Gascuel O. (2017). SMS: smart model selection in PhyML. Mol. Biol. Evol. 34, 2422–2424. doi: 10.1093/molbev/msx149
Lim J. H., Kang H. M., Kim D. H., Jeong B., Lee D. Y., Lee J.-R., et al. (2023). ARL6IP1 gene delivery reduces neuroinflammation and neurodegenerative pathology in hereditary spastic paraplegia model. J. Exp. Med. 221, e20230367. doi: 10.1084/jem.20230367
Luo Y., Xiong W., Dong S., Liu F., Liu H., Li J. (2017). MicroRNA−146a promotes the proliferation of rat vascular smooth muscle cells by downregulating p53 signaling. Mol. Med. Rep. 16, 6940–6945. doi: 10.3892/mmr.2017.7477
Mackowiak S. D. (2011). Identification of novel and known miRNAs in deep-sequencing data with miRDeep2. Curr. Protoc. Bioinf. 36. doi: 10.1002/0471250953.bi1210s36
Madeira F., Pearce M., Tivey A. R. N., Basutkar P., Lee J., Edbali O., et al. (2022). Search and sequence analysis tools services from EMBL-EBI in 2022. Nucleic Acids Res. 50, W276–W279. doi: 10.1093/nar/gkac240
McCarthy M. M., Arnold A. P. (2011). Reframing sexual differentiation of the brain. Nat. Neurosci. 14, 677–683. doi: 10.1038/nn.2834
McGeary S. E., Lin K. S., Shi C. Y., Pham T. M., Bisaria N., Kelley G. M., et al. (2019). The biochemical basis of microRNA targeting efficacy. Science 366, 1741. doi: 10.1126/science.aav1741
Mei J., Gui J.-F. (2015). Genetic basis and biotechnological manipulation of sexual dimorphism and sex determination in fish. Sci. China Life Sci. 58, 124–136. doi: 10.1007/s11427-014-4797-9
Nakaya T., Alexiou P., Maragkakis M., Chang A., Mourelatos Z. (2013). FUS regulates genes coding for RNA-binding proteins in neurons by binding to their highly conserved introns. RNA. 19, 498–509. doi: 10.1261/rna.037804.112
Ndandala C. B., Dai M., Mustapha U. F., Li X., Liu J., Huang H., et al. (2022). Current research and future perspectives of GH and IGFs family genes in somatic growth and reproduction of teleost fish. Aquaculture Rep. 26, 101289. doi: 10.1016/j.aqrep.2022.101289
Nguyen N. T. T., Vincens P., Roest Crollius H., Louis A. (2018). Genomicus 2018: karyotype evolutionary trees and on-the-fly synteny computing. Nucleic Acids Res. 46, D816–D822. doi: 10.1093/nar/gkx1003
Paz I., Kosti I., Ares M. Jr., Cline M., Mandel-Gutfreund Y. (2014). RBPmap: a web server for mapping binding sites of RNA-binding proteins. Nucleic Acids Res. 42, W361–W367. doi: 10.1093/nar/gku406
Rehmsmeier M., Steffen P., Hochsmann M., Giegerich R. (2004). Fast and effective prediction of microRNA/target duplexes. RNA 10, 1507–1517. doi: 10.1261/rna.5248604
Reinecke M. (2010). Influences of the environment on the endocrine and paracrine fish growth hormone–insulin-like growth factor-I system. J. Fish Biol. 76, 1233–1254. doi: 10.1111/j.1095-8649.2010.02605.x
Remsburg C., Testa M., Song J. L. (2021). Rab35 regulates skeletogenesis and gastrulation by facilitating actin remodeling and vesicular trafficking. Cells Dev. 165, 203660. doi: 10.1016/j.cdev.2021.203660
Rius-Francino M., Acerete L., Jiménez-Amilburu V., Capilla E., Navarro I., Gutiérrez J. (2011). Differential effects on proliferation of GH and IGFs in sea bream (Sparus aurata) cultured myocytes. Gen. Comp. Endocrinol. 172, 44–49. doi: 10.1016/j.ygcen.2011.03.024
Robinson J. T., Thorvaldsdottir H., Winckler W., Guttman M., Lander E. S., Getz G., et al. (2011). Integrative genomics viewer. Nat. Biotechnol. 29, 24–26. doi: 10.1038/nbt.1754
Romero A., Vega M., Santibáñez N., Spies J., Pérez T., Enríquez R., et al. (2020). Salmo salar glucocorticoid receptors analyses of alternative splicing variants under stress conditions. Gen. Comp. Endocrinol. 293, 113466. doi: 10.1016/j.ygcen.2020.113466
Saraiva J. L., RaChinas-Lopes P., Arechavala-Lopez P. (2022). Finding the “golden stocking density”: A balance between fish welfare and farmers' perspectives. Front. Veterinary Sci. 9, 930221. doi: 10.3389/fvets.2022.930221
Scekic‐Zahirovic J., Sendscheid O., El Oussini H., Jambeau M., Sun Y., Mersmann S., et al. (2016). Toxic gain of function from mutant FUS protein is crucial to trigger cell autonomous motor neuron loss. EMBO J. 35, 1077–1097-1097. doi: 10.15252/embj.201592559
Shen H., Yanas A., Owens M. C., Zhang C., Fritsch C., Fare C. M., et al. (2022). Sexually dimorphic RNA helicases DDX3X and DDX3Y differentially regulate RNA metabolism through phase separation. Mol. Cell 82, 2588–2603.e2589. doi: 10.1016/j.molcel.2022.04.022
Soni M., Saatci O., Gupta G., Patel Y., Keerthi Raja M. R., Li J., et al. (2022). miR-489 confines uncontrolled estrogen signaling through a negative feedback mechanism and regulates tamoxifen resistance in breast cancer. Int. J. Mol. Sci. 23, 8086. doi: 10.3390/ijms23158086
Takeda J.-I., Masuda A., Ohno K. (2017). Six GU-rich (6GUR) FUS-binding motifs detected by normalization of CLIP-seq by Nascent-seq. Gene 618, 57–64. doi: 10.1016/j.gene.2017.04.008
Tannenbaum G. S., Choi H. K., Gurd W., Waxman D. J. (2001). Temporal relationship between the sexually dimorphic spontaneous GH secretory profiles and hepatic STAT5 activity. Endocrinology 142, 4599–4606. doi: 10.1210/endo.142.11.8480
Trautmann M., Menzel J., Bertling C., Cyra M., Isfort I., Steinestel K., et al. (2017). FUS–DDIT3 fusion protein-driven IGF-IR signaling is a therapeutic target in myxoid liposarcoma. Clin. Cancer Res. 23, 6227–6238. doi: 10.1158/1078-0432.CCR-17-0130
Tu C.-T., Yang T.-C., Huang H.-Y., Tsai H.-J. (2012). Zebrafish arl6ip1 Is Required for Neural Crest Development during Embryogenesis. PloS One 7, e32899. doi: 10.1371/journal.pone.0032899
Vijayan M. M., Raptis S., Sathiyaa R. (2003). Cortisol treatment affects glucocorticoid receptor and glucocorticoid-responsive genes in the liver of rainbow trout. Gen. Comp. Endocrinol. 132, 256–263. doi: 10.1016/S0016-6480(03)00092-3
Wang Z., Lei H., Sun Q. (2016). MicroRNA-141 and its associated gene FUS modulate proliferation, migration and cisplatin chemosensitivity in neuroblastoma cell lines. Oncol. Rep. 35, 2943–2951. doi: 10.3892/or.2016.4640
Ward C. L., Boggio K. J., Johnson B. N., Boyd J. B., Douthwright S., Shaffer S. A., et al. (2014). A loss of FUS/TLS function leads to impaired cellular proliferation. Cell Death Dis. 5, e1572–e1572. doi: 10.1038/cddis.2014.508
Wong A. O. L., Zhou H., Jiang Y., Ko W. K. W. (2006). Feedback regulation of growth hormone synthesis and secretion in fish and the emerging concept of intrapituitary feedback loop. Comp. Biochem. Physiol. Part A: Mol. Integr. Physiol. 144, 284–305. doi: 10.1016/j.cbpa.2005.11.021
Wood A. W., Duan C., Bern H. A. (2005). Insulin-like growth factor signaling in fish. Int. Rev. Cytology 243, 215–285. doi: 10.1016/S0074-7696(05)43004-1
Xiao X., Li M., Ye Z., He X., Wei J., Zha Y. (2024). FUS gene mutation in amyotrophic lateral sclerosis: a new case report and systematic review. Amyotrophic Lateral Sclerosis Frontotemporal Degeneration 25, 1–15. doi: 10.1080/21678421.2023.2272170
Xue L., Gao Y., Wu M., Tian T., Fan H., Huang Y., et al. (2021a). Telomere-to-telomere assembly of a fish Y chromosome reveals the origin of a young sex chromosome pair. Genome Biol. 22, 203. doi: 10.1186/s13059-021-02430-y
Xue L., Jia D., Xu L., Huang Z., Fan H., Chen B., et al. (2021b). Bulk and single-cell RNA-seq reveal the sexually dimorphic expression pattern of dmrtb1 in zig-zag eel (Mastacembelus armatus). Aquaculture 545, 737194. doi: 10.1016/j.aquaculture.2021.737194
Xue L., Luo S., Ding H., Liu Y., Huang W., Fan X., et al. (2019). Upregulation of miR-146a-5p is associated with increased proliferation and migration of vascular smooth muscle cells in aortic dissection. J. Clin. Lab. Anal. 33, e22843. doi: 10.1002/jcla.22843
Yang Y., Wang Y., Wu Y., Liu Y., Liu C., Jiang Z., et al. (2023). Population genetics of zig-zag eel (Mastacembelus armatus) uncover gene flow between an isolated island and the mainland China. Front. Mar. Sci. 10, 1100949. doi: 10.3389/fmars.2023.1100949
Yaron Z., Levavi-Sivan B. (2011). “HORMONAL CONTROL OF REPRODUCTION AND GROWTH | Endocrine regulation of fish reproduction,” in Encyclopedia of Fish Physiology. Ed. Farrell A. P. (Academic Press, San Diego), 1500–1508.
Yin Z., Shen H., Gu C. M., Zhang M. Q., Liu Z., Huang J., et al. (2021). MiRNA-142-3P and FUS can be Sponged by Long Noncoding RNA DUBR to Promote Cell Proliferation in Acute Myeloid Leukemia. Front. Mol. Biosci. 8, 754936. doi: 10.3389/fmolb.2021.754936
Keywords: culture density, GH/IGF-1 axis, FUS, miRNA, growth
Citation: Xue L, Gao Y, Zhang S, Weng M, Zeng G, Chen J, Liao M, Alavi SMH and Guiguen Y (2024) Expression pattern of the fused in sarcoma gene and its contextual influence on the density-specific response of the growth hormone/insulin-like growth factor 1 axis in zig-zag eels (Mastacembelus armatus). Front. Mar. Sci. 11:1461451. doi: 10.3389/fmars.2024.1461451
Received: 08 July 2024; Accepted: 26 August 2024;
Published: 19 September 2024.
Edited by:
Rui Jia, Chinese Academy of Fishery Sciences (CAFS), ChinaReviewed by:
Mingkun Luo, Chinese Academy of Fishery Sciences (CAFS), ChinaCopyright © 2024 Xue, Gao, Zhang, Weng, Zeng, Chen, Liao, Alavi and Guiguen. This is an open-access article distributed under the terms of the Creative Commons Attribution License (CC BY). The use, distribution or reproduction in other forums is permitted, provided the original author(s) and the copyright owner(s) are credited and that the original publication in this journal is cited, in accordance with accepted academic practice. No use, distribution or reproduction is permitted which does not comply with these terms.
*Correspondence: Yu Gao, Z2FveXVAeW5hdS5lZHUuY24=
Disclaimer: All claims expressed in this article are solely those of the authors and do not necessarily represent those of their affiliated organizations, or those of the publisher, the editors and the reviewers. Any product that may be evaluated in this article or claim that may be made by its manufacturer is not guaranteed or endorsed by the publisher.
Research integrity at Frontiers
Learn more about the work of our research integrity team to safeguard the quality of each article we publish.