 Mingliang Li1,2
 Dezhi Chen3
 Hao Wu1*
 Jieping Tang4Yiyi Zhang5
 Feng Luo6Fugang Gou2Xulong Gong2
 Ya Ping Wang1*
- 1Ministry of Education Key Laboratory for Coast and Island Development, Nanjing University, Nanjing, China
- 2Department of Environmental Geology, Geological Survey of Jiangsu Province, Nanjing, China
- 3Key Laboratory of Tropical Marine Ecosystem and Bioresource, Fourth Institute of Oceanography, Ministry of Natural Resources, Beihai, China
- 4School of Electronic and Information Engineering, Guangdong Ocean University, Zhanjiang, China
- 5Research Department of Tidal Flat, Tidal Flat Research Center of State Oceanic Administration (SOA) (Jiangsu), Nanjing, China
- 6College of Harbor, Coastal and Offshore Engineering, Hohai University, Nanjing, China
Wave- and current-supported fluid mud on gently sloped continental shelves represents a type of sediment gravity flow capable of rapidly transporting substantial sediment over short periods, significantly contributing to coastal geomorphic evolution. To investigate the dynamics of intertidal fluid mud events, in-situ observations were conducted from May 9 to May 18, 2017, using a seabed tripod system at the lower intertidal flat of the central Jiangsu coast, China. Fluid mud was observed following a medium wind-wave event, with a maximum significant wave height of 0.42 m. The liquefied seabed, loosened by liquefaction, facilitated bed erosion and sediment resuspension. Fluid mud layers, with mean suspended sediment concentrations (SSCs) exceeding 10 g/L, periodically formed during high slack tide, early flood, and late ebb phases. These layers varied in thickness from 4 cm to 20 cm and exhibited strong stratification caused by suspended sediment. Fluid mud disappeared when the bottom turbulence kinetic energy exceeded a threshold of 0.00045 m²/s² due to an increase in current velocity. The downslope movement of intertidal fluid mud was estimated using a theoretical buoyancy-friction model and validated by observed offshore-directed velocity jets at 0.1 m above the seabed during high slack tide phases. Additionally, onshore winds favored fluid mud formation during early flood phases, while offshore winds favored it during late ebb phases. These observations suggest that fluid mud can form on intertidal flats under conditions where tidal flows and winds align, contributing to a deeper understanding of the formation mechanisms of shallow gravity flows and the improvement of sediment transport models.
1 Introduction
Fluid mud is a dense suspension of water and fine-grained sediments, with sediment concentrations ranging from tens to hundreds of grams per liter within the near-bed layer (Winterwerp, 1999; McAnally et al., 2007a; Mehta and Belemkar, 2014). It has been observed in coastal rivers (Wells, 1983; Uncles et al., 2006; Wu et al., 2022; Tang et al., 2023), continental shelves (Kineke et al., 1996; Gabioux et al., 2005; Yu et al., 2024), and even open seas (Puig et al., 2004; Wallmann et al., 2006). Sediment supply and hydrodynamics determine the status of fluid mud, particularly its formation and evolution processes (Ross and Mehta, 1989; Mehta, 1991; Traykovski et al., 2000; Wan et al., 2014). Additionally, the downslope movement of fluid mud transports large amounts of sediments across the shelf (Wright et al., 2001; Yu et al., 2017), substantially influencing coastal morphological and biological evolution processes (Ichaso and Dalrymple, 2009; Flores et al., 2018).
Existing research has examined fluid mud and associated gravity flows through various approaches, including field observation (Odd et al., 1993; Hale and Ogston, 2015; Ge et al., 2020; Niu et al., 2023; Tang et al., 2023; Yu et al., 2024), numerical modeling (Scully et al., 2003; Guan et al., 2005; Hsu et al., 2007), experimental analysis (Winterwerp and Kranenburg, 1997; Parsons et al., 2001; Aleebrahim and Jamali, 2023), and combined methods (Wright et al., 2001; Nishida et al., 2013; Wan et al., 2014). Theoretically, McAnally et al. (2007a) summarized three main mechanisms causing fluid mud: sediment settling and aggregation processes stronger than dewatering processes, seabed liquefaction and fluidization induced by waves, and sediment advection and convergence processes. Moreover, Wright et al. (Wright et al., 2001; Wright and Friedrichs, 2006) suggest that turbulence and shear stress from wave and current energy suspend bed sediment, generating fluid mud that moves downslope due to gravity. This relationship can be expressed in terms of the bulk Richardson number (Rib): if Rib=0.25, the feedback between turbulence and suspended sediments remains balanced, supporting the fluid mud layer; if Rib>0.25, the damping of turbulence by stratification causes sediment to settle, reducing Rib towards 0.25; if Rib<0.25, the enhanced turbulence resuspends more sediment into the water column, causing Rib to rise back to 0.25.
Many physical and biological processes are related to the formation of fluid mud (Wolanski et al., 1988; Winterwerp, 1999; Shi, 1998; McAnally et al., 2007b; Habermann and Wurpts, 2008; Xu et al., 2020), such as flocculation, hindered settling, mixing, gelling, and microbiological processes. Recently, the hydrodynamic processes of fluid mud have garnered significant attention, particularly concerning the effects of extreme weather conditions and human intervention. Ge et al. (2020) found that the initial appearance of fluid mud was caused by typhoon-intensified, salinity-induced stratification in a field survey conducted in the Changjiang Estuary during the period of turbidity maximum. Yu et al. (2017) found that tidal eddies induced by harbor headland construction contributed to the formation of a benthic fluid mud layer on a muddy intertidal flat.
Although fluid mud occurrence is thought to be more prevalent than expected (Wright and Friedrichs, 2006), the current literature documenting fluid mud remains limited and incomplete in terms of locations and observing conditions. Specifically, the formation and dynamics of fluid mud are rarely studied in intertidal mudflat areas (Christie et al., 1999; Andersen et al., 2006; Yu et al., 2017) due to the challenges posed by extremely shallow water levels and hyperturbid conditions for in-situ observation. To date, reported fluid mud events on intertidal flats mainly focus on the thickness of the fluid mud layer or high SSC characteristics using acoustic altimeters or turbidimeters (Gouleau et al., 2000; Andersen et al., 2006; Shi et al., 2016), while detailed analyses of interactions between fluid mud and hydrodynamics remain limited.
In this study, we focus on the formation and breakdown of fluid mud, and the dynamics of fluid mud downslope movement in the form of sediment gravity flow on intertidal mudflats. Based on in-situ observational data from the central Jiangsu intertidal mudflat, we aim to achieve a better understanding of fluid mud dynamics and its morphological impact on intertidal mudflat areas.
2 Study area
The study area is located along the central Jiangsu coast in China (Figure 1A), facing the western part of the South Yellow Sea, approximately 100 km from the Abandoned Yellow River to the north. Historically, the Abandoned Yellow River discharged into the South Yellow Sea from 1128 to 1185 CE, forming a large estuarine delta at its mouth with abundant fine-grained sediment input (Ren and Shi, 1986; Wang et al., 2012; Shi et al., 2016). The delta began to erode when the river course shifted from the South Yellow Sea to the Bohai Sea after 1185 CE (Ren and Shi, 1986). Due to the sediment supply eroded from the submarine delta, the immediate offshore area of the Jiangsu coast is characterized by high turbidity water and fine-grained seabed sediment (Xing et al., 2012; Ni et al., 2014; Xiong et al., 2017). The regional tide is semidiurnal and macrotidal, with an average tidal range between 3 and 5.5 m (Ren and Shi, 1986; Zhang, 1992). The study area experiences a monsoon climate, with prevailing winds from the southwest and south in summer, and from the northwest and north in winter (Yang, 1982; Wang et al., 2012). Two small rivers are located to the north and south of the observation site respectively (Figure 1B), but tidal barrages across the river mouths were closed for crop irrigation during the observation period.
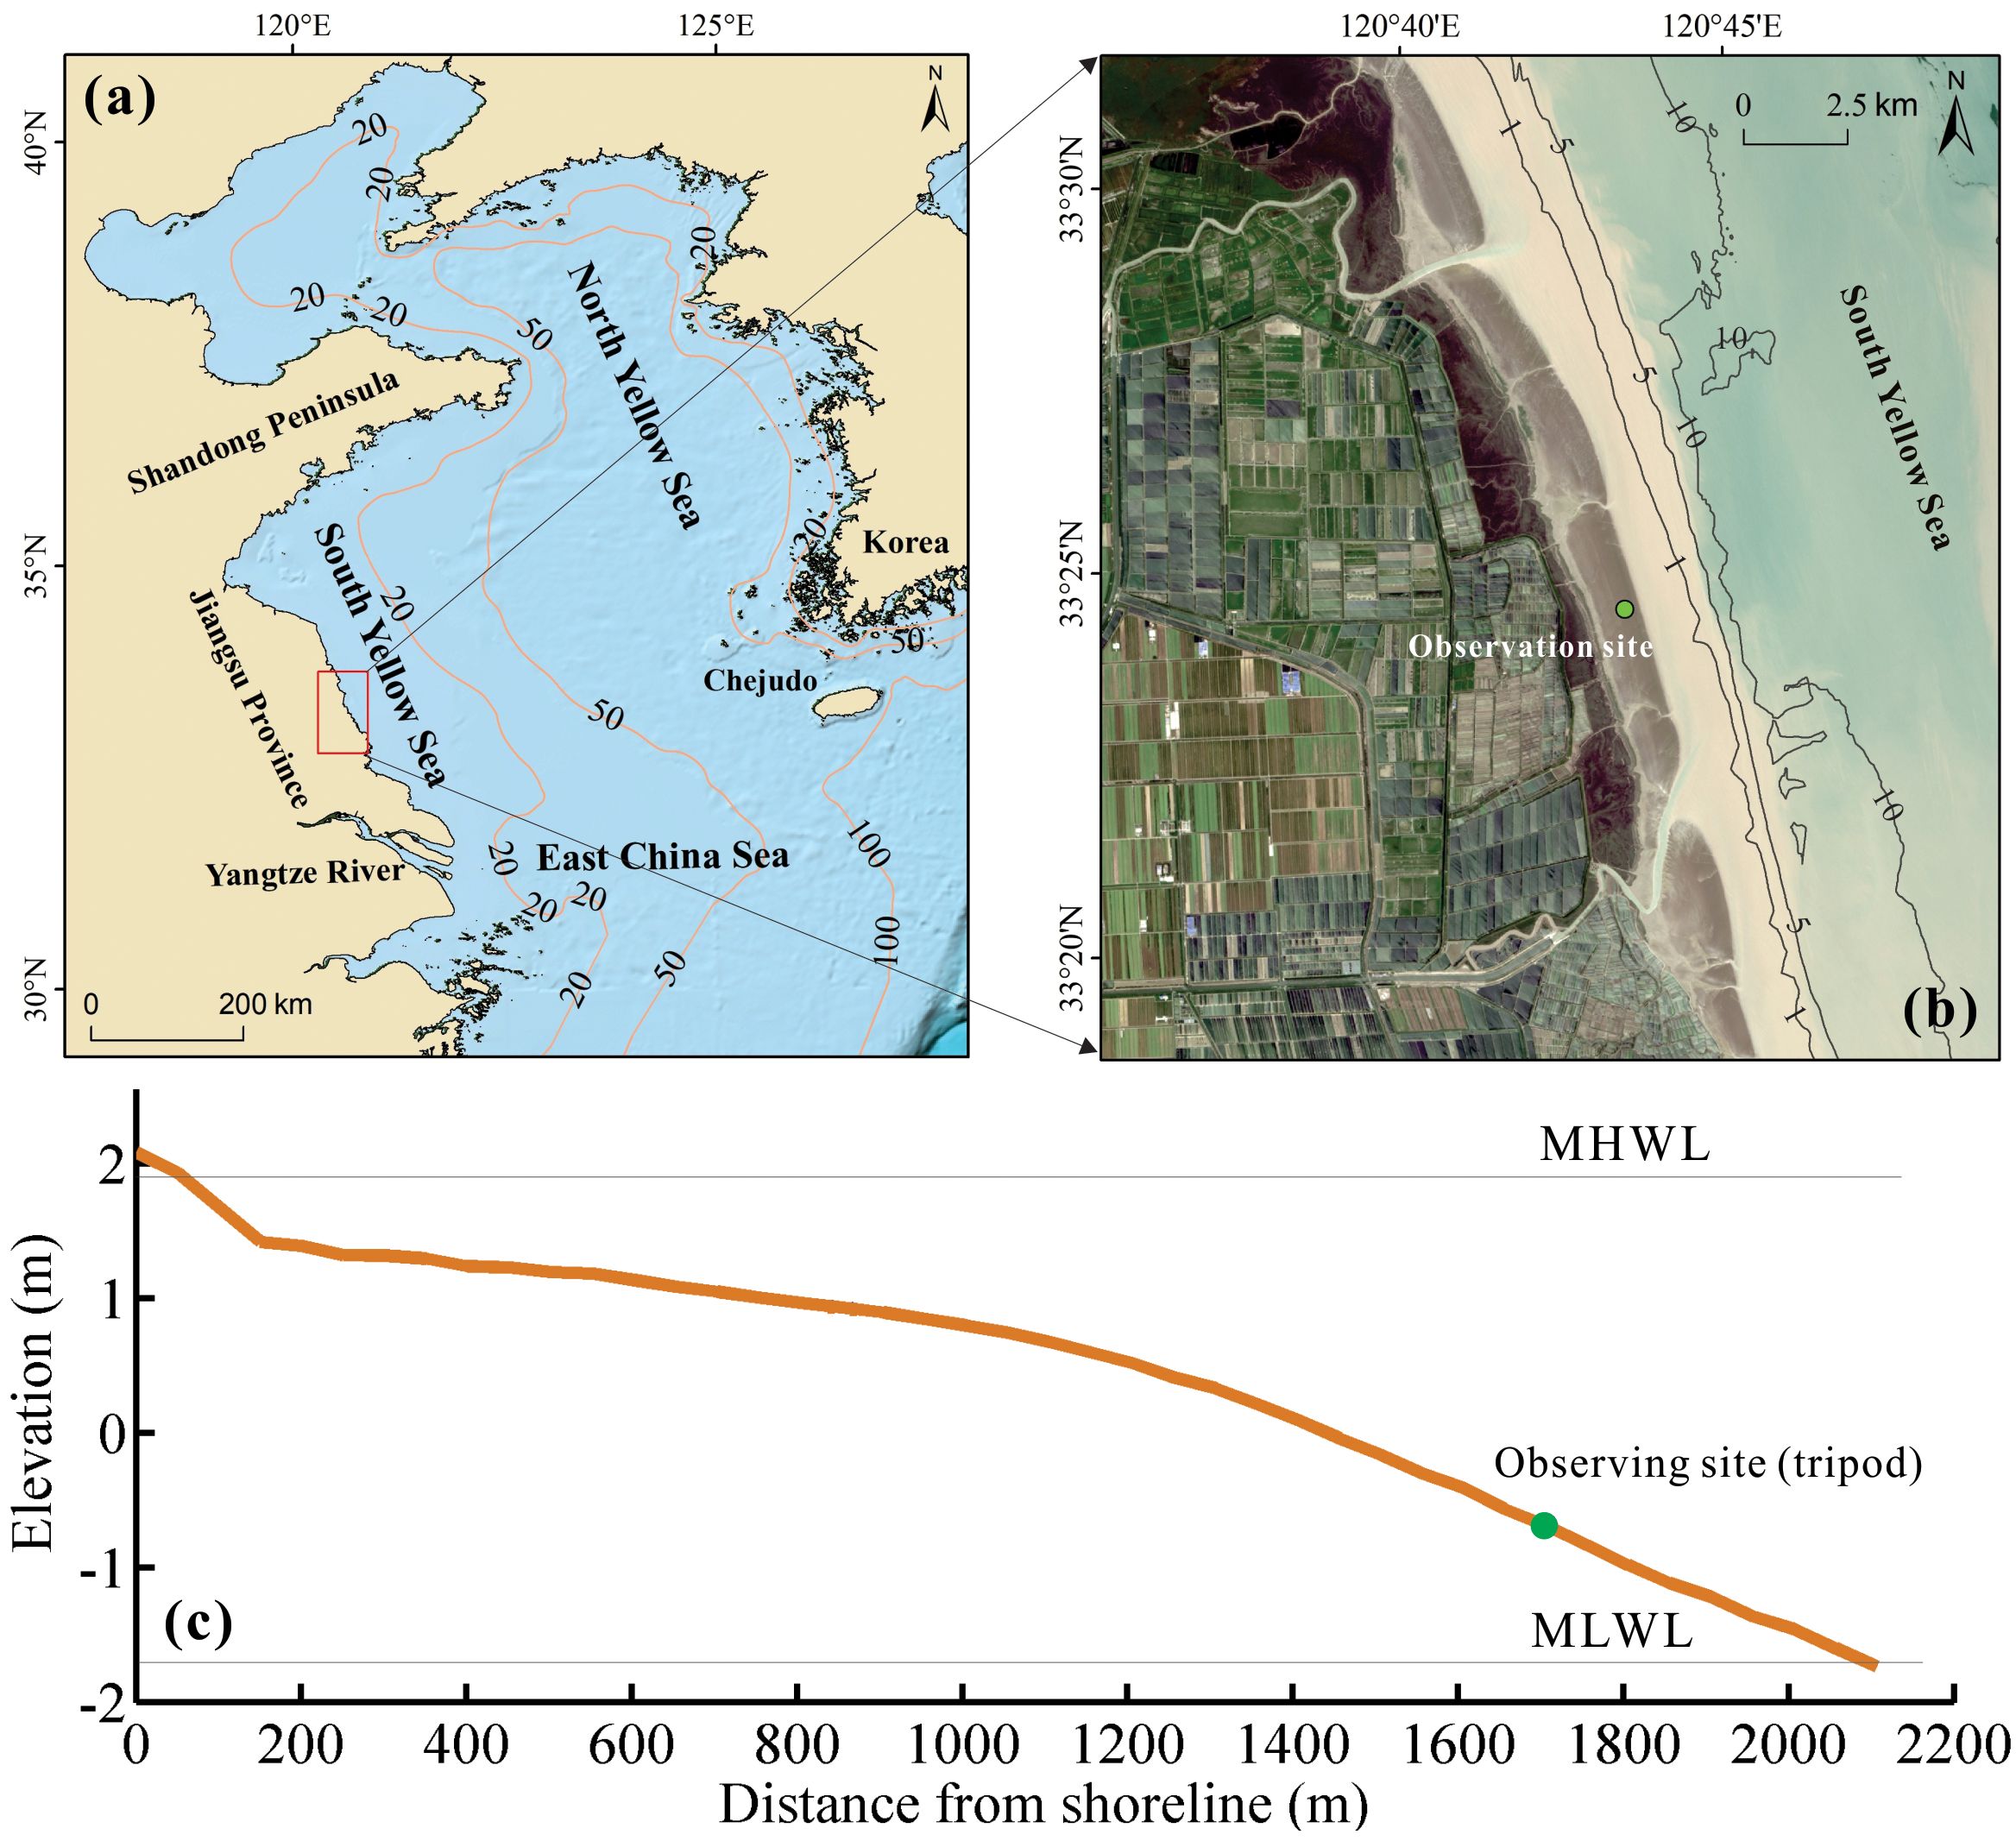
Figure 1. Location of the study area: (A) Map of the Jiangsu coast; (B) Location of the in-situ observation site on the intertidal flat; (C) Cross-shore profile measured by GNSS-RTK on May 12, 2017. The zero point refers to the mean sea level, and the green dot indicates the position of the bottom boundary tripod.
The intertidal flat is wide, accretional, and gently sloped (0.001 for the upper part and 0.003 for the lower part at our observation site; see Figure 1C), due to high suspended sediment concentrations (ranging between 0.2 and 3.0 g/L) that favor accretion processes (Wang et al., 2012; Shi et al., 2016). Typically, the upper part of the tidal flat is colonized by Spartina alterniflora salt marshes (Gao et al., 2014; Chen et al., 2020). The surficial seabed sediments mainly consist of silt and fine sand, with clay content decreasing towards the sea (Wang and Ke, 1997; Wang et al., 2012). Wave conditions are relatively weak, with wave heights less than 1 m approximately 85% of the year (Xing et al., 2012). The wave climate for the intertidal flat area is dominated by wind waves (Wang et al., 2012; Shi et al., 2016; Chen et al., 2020). Maximum tidal currents can exceed 1 m/s along the coast, indicating a tide-dominated environment (Wang et al., 2019).
3 Methods
3.1 Data collection
In May 2017, a field observation was conducted on the central Jiangsu intertidal mudflat. A bottom boundary tripod equipped with oceanographic instruments was deployed on the lower intertidal seabed (Figure 1C; Table 1), and details of the instrument deployment are shown in Figure 2. Vertical velocity profiles were measured using an up-looking Signature 1000 positioned 0.1 m above the seabed, operating with a sampling frequency of 8 Hz and a cell size of 0.2 m. Near-bed three-dimensional high-frequency velocities were measured by two acoustic Doppler velocimeters (ADV) sampling at 16 Hz, deployed 0.1 m and 0.5 m above the seabed, respectively. Water turbidity was measured by two Optical Backscatter Sensors (OBS-3A) deployed 0.8 m and 0.5 m above the seabed, with the OBS at 0.8 mab moved to 0.3 mab on May 14 to capture fluid mud signals, sampling at 1 Hz for 8 seconds every 5 minutes. A Seabird CTD (SBE-26plus) was deployed 0.5 m above the seabed to measure the salinity, conductivity, and temperature of the near-bottom seawater. To capture the turbidity profile of the bottom boundary, a Lindorm SediMeter SM3 was moored vertically above the seabed, measuring five water turbidity profiles every 5 minutes from 0 to 0.36 mab.
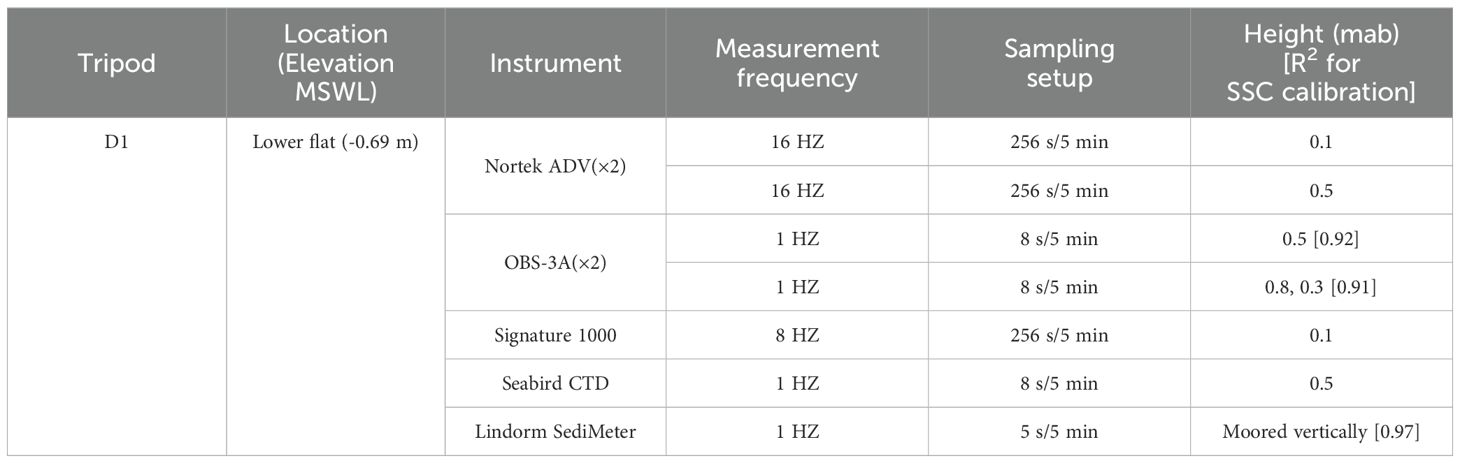
Table 1. Instrument deployment scheme for tripod D1 measurements.
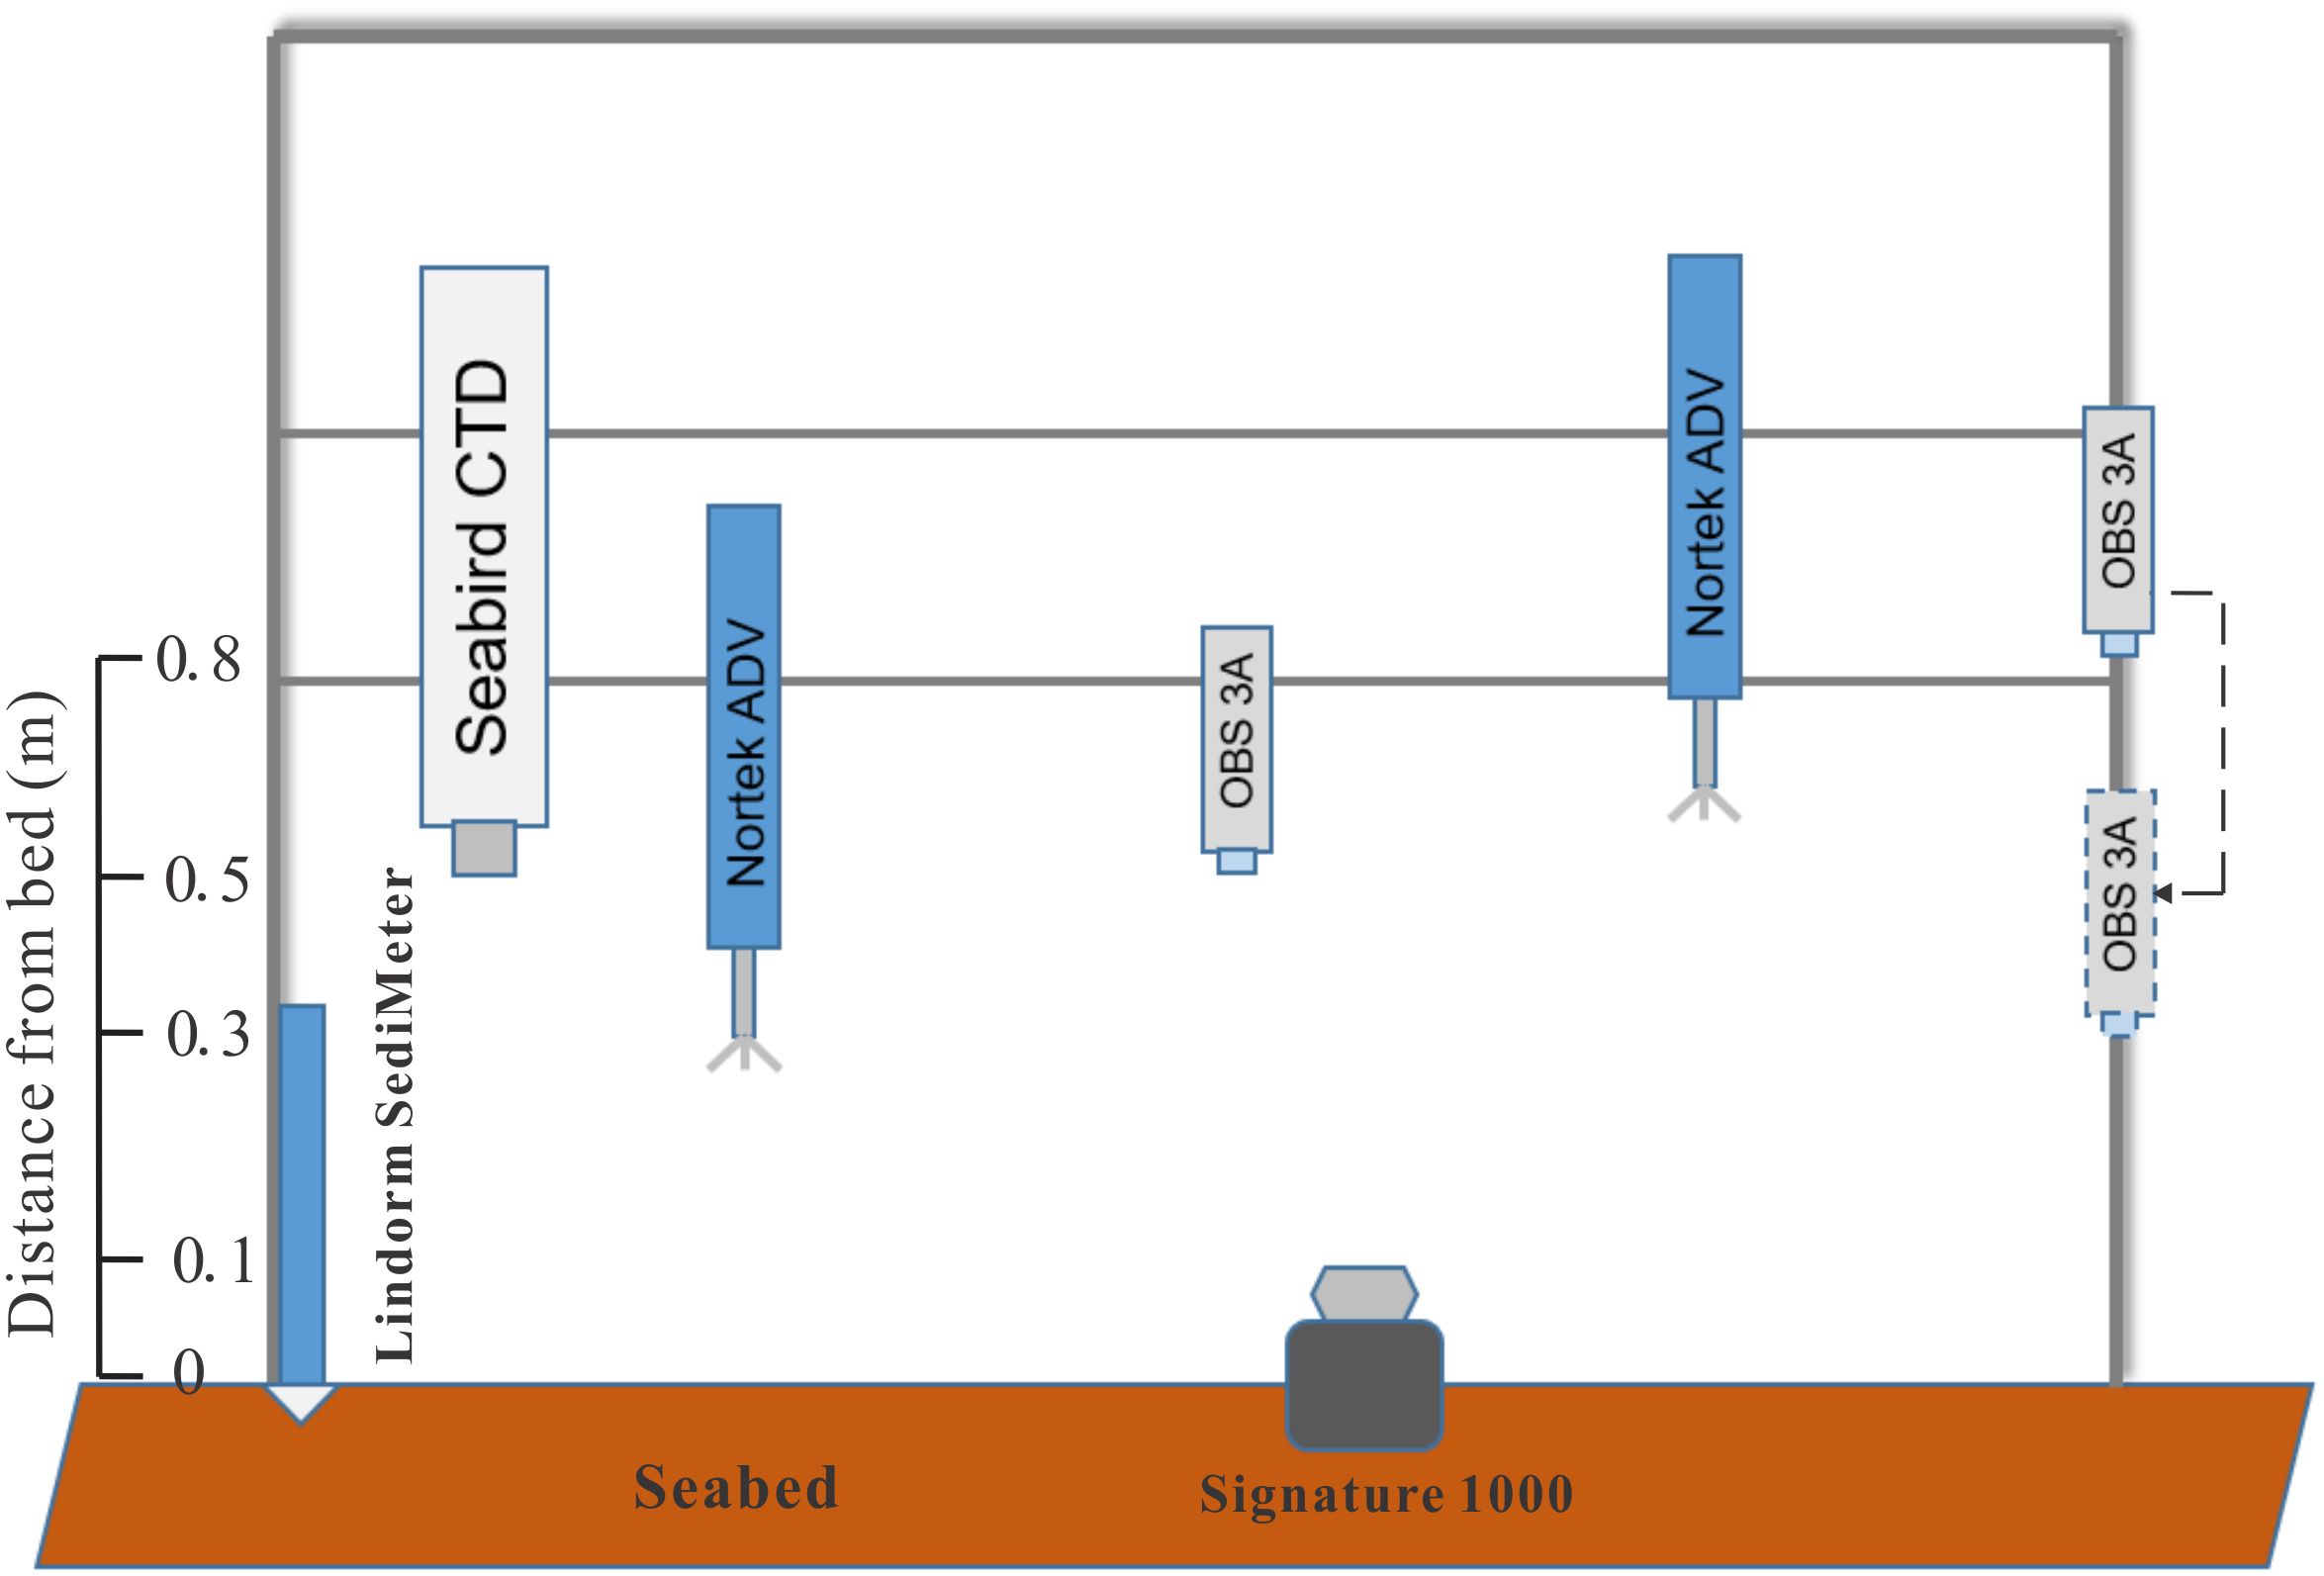
Figure 2. A schematic diagram of the near-bed observation system designed for the intertidal area.
Water samples were collected from a nearby moored boat during the observation period to measure the grain size of suspended sediment and calibrate the optical turbidity sensors (Figure 3), such as the OBS-3A and SediMeter. The correlation coefficients are shown in Table 1. Surficial seabed sediment samples within 5 cm of the observation site were also collected during no-water stages and analyzed in the lab for grain size distribution. The cross-shore bathymetric profile was acquired using GNSS-RTK on May 12, 2017, during the observation period.
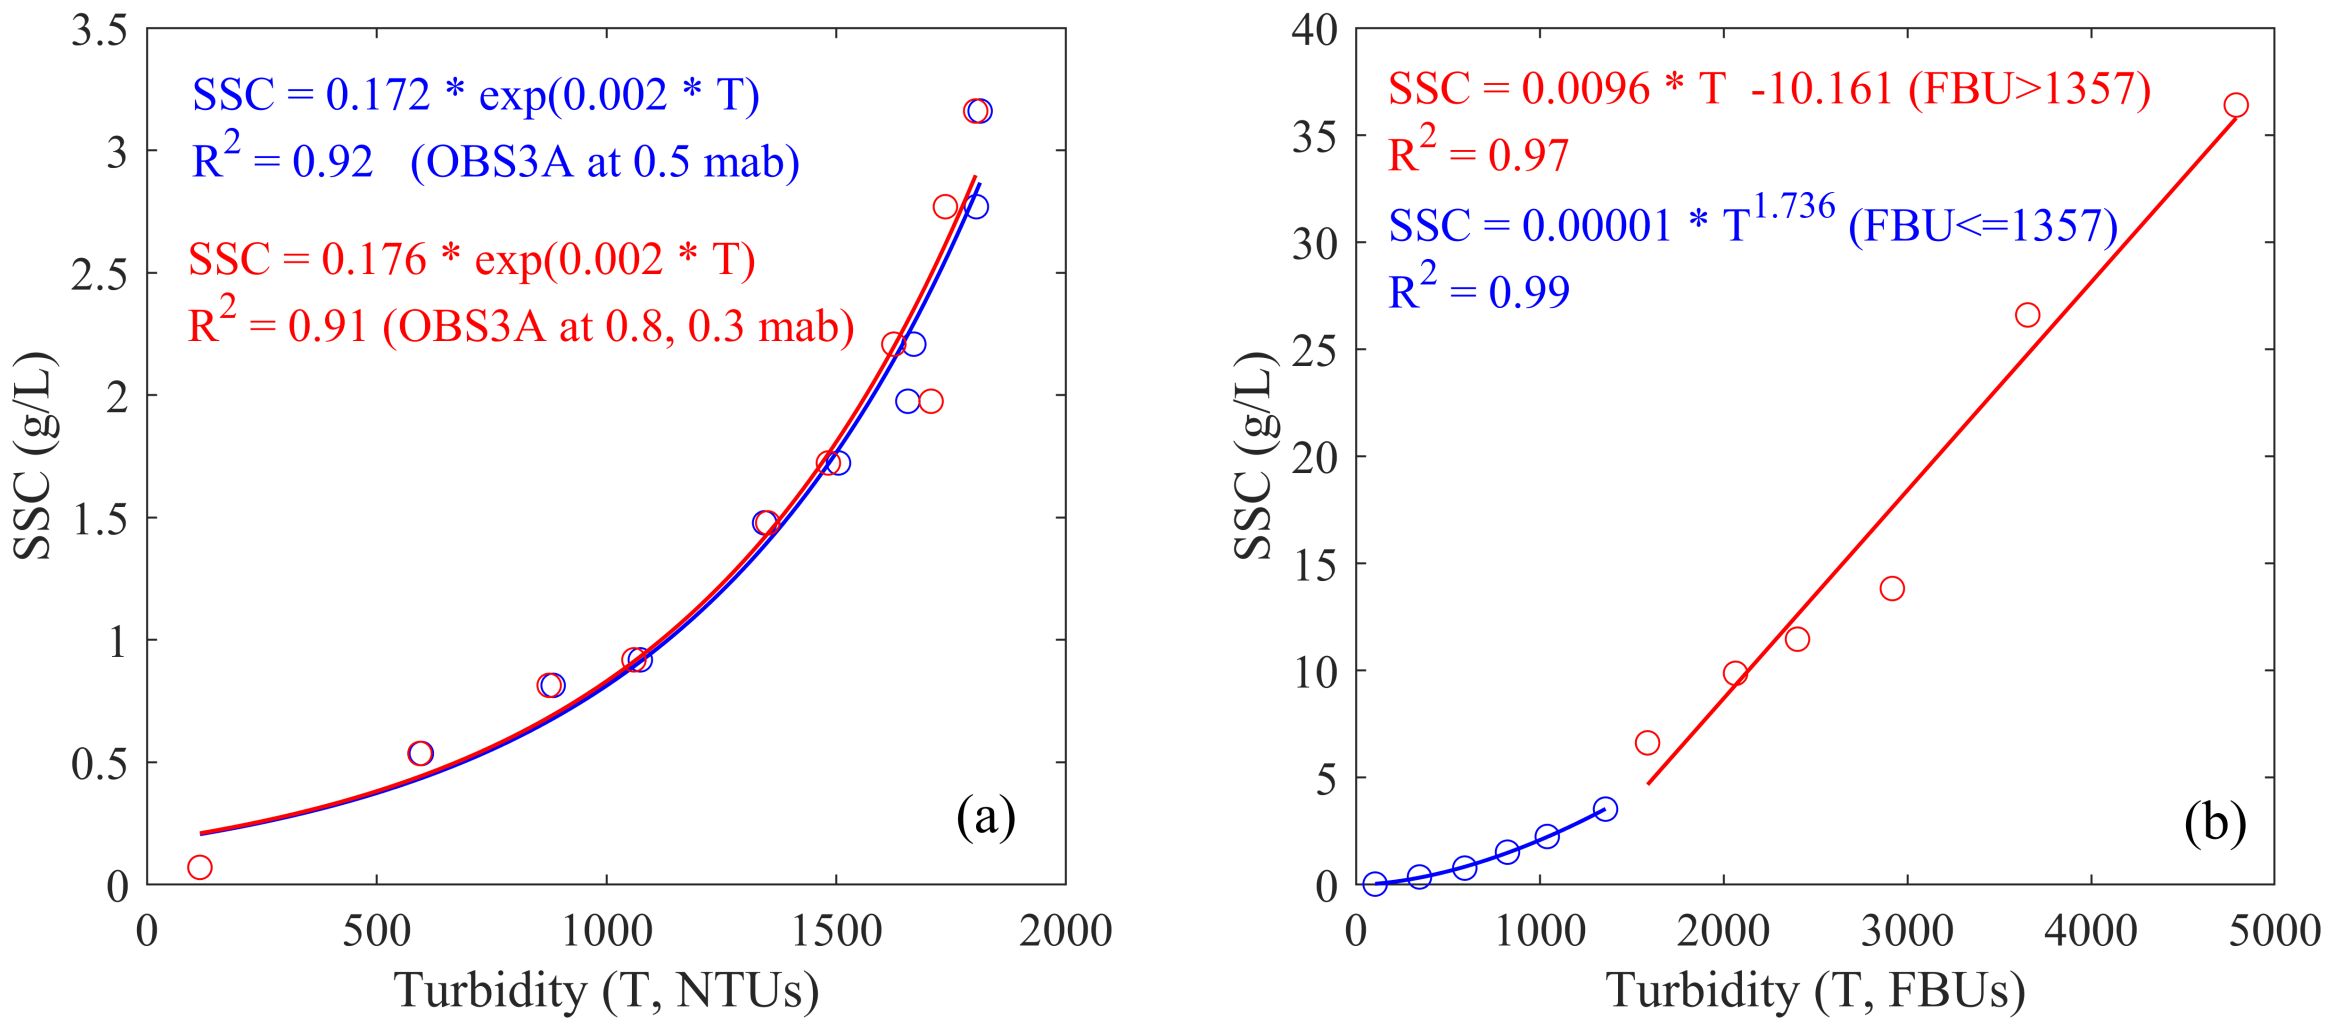
Figure 3. Suspended sediment concentrations calibration curves: (A) Turbidities measured by OBS-3A; (B) Turbidities measured by Lindorm SediMeter.
Water depth was calibrated using the pressure data recorded by the Signature 1000 device, while water salinity and temperature data were obtained from the Seabird CTD. Additionally, wave parameters, including significant wave height, wave direction, and wave period, were extracted using the PUV method (Sobey and Hughes, 1999; Gordon et al., 2001).
3.2 Bed shear stress
The bed shear stresses related to currents at 0.1 mab was calculated directly from the measured Reynolds stresses as (Equation 1) (Soulsby and Whitehouse, 1997; MacVean and Lacy, 2014):
where ρ is seawater density, u´ and w´ are the turbulent fluctuations in horizontal and vertical directions. Velocities measured by ADVs could be decomposed into mean current (), turbulent fluctuations () and wave fluctuations () by using the “phase method” (Bricker and Monismith, 2007; MacVean and Lacy, 2014). The Reynolds method is proved to be suitable for central Jiangsu coast by recent field works (Shi et al., 2016; Yang et al., 2016; Xiong et al., 2018; Yu et al., 2024).
The wave-related shear stress is calculated as (Equation 2) (Soulsby and Whitehouse, 1997):
where fw is the wave friction factor, could be calculated as (Equation 3):
In the above equation, A=uwTp/(2π) means the semi-orbital excursion, is the bottom wave orbital velocity (Wiberg and Sherwood, 2008; Xiong et al., 2018). Z0 means the bottom roughness height which remains relatively constant during the observation period. So a typical value 0.05 is taken for Z0 as suggested (Dyer, 1986; Soulsby and Whitehouse, 1997; Yu et al., 2024).
The combined bed shear stress due to wave-current interactions during a wave cycle could be estimated as follows (Equation 4) (Soulsby and Whitehouse, 1997):
where τcw is wave-current combined bed shear, τc is bed shear stress due to tidal currents, τw is bed shear stress due to waves.
The critical shear stress for erosion was calculated as follows (Equations 5–7) (Soulsby and Whitehouse, 1997):
Where ρs is sediment particle density (2650 kg/m3), ρ is water density (1030 kg/m3), D is sediment grain size. In this study, the mean surficial sediment grain size is 5.64 φ, as presented in section 5.
3.3 Liquefaction degree
The dimensionless parameter liquefaction degree L (Equation 8) was introduced by Klammler et al. (2021), which was defined as:
where σz (Equation 9) represents the wave-induced vertical effective stress. The parameters γw and γs denote the specific weights of seawater and saturated sediment, respectively. For Equation 9, αm and ∊m are the amplitude and phase of surface waves with varying wave numbers and frequencies, which can be derived from measured high-frequency ADV pressure data using Fourier analysis. S(z) varies with depth and depends on several bed properties, including porosity, horizontal and vertical hydraulic conductivities, degree of saturation, shear modulus, Poisson’s ratio, density and elastic modulus of fluid, the absolute pore pressure for the average water depth, and the vertical thickness of the sediment bed above an assumed rigid, impermeable bedrock. The detailed analysis and calculation code can be referred to in the mentioned article.
3.4 Parameterization of fluid mud dynamics
The buoyancy-friction model (Equation 10) is a widely used method for parameterizing wave- and current-supported fluid mud dynamics. Fluid mud dynamics are considered to be governed by a balance of forces between the downslope component and friction. In its simplest form, this balance can be expressed using a linearized Chezy equation (Wright et al., 2001; Traykovski et al., 2007; Flores et al., 2018):
where the left and right side of the equation represents gravitational forcing term and friction term respectively. In the equation, H is the thickness of the fluid mud, g´ is the reduced gravity, sinα means the seabed slope, CD is the drag coefficient, taken as 0.0035 in this study (Tang et al., 2023; Yu et al., 2024), ug is the gravitational flow velocity, and umax is the maximum velocity at the interface between overlying water and the fluid mud layer, umax = where uw means wave orbital velocity, and uc means ambient current velocity. The bulk Richardson number (Equation 11) is often used to evaluate the relationship between the buoyancy restoring force and the turbulence generated by flow shear within the gravity flow, which could be estimated as (Wright et al., 2001):
where B= means the buoyancy anomaly integrated over the thickness of the fluid mud layer, C(Z) is the suspended sediment concentration (g/L), s means the submerged weight of the sediment relative to seawater, ρs is the sediment density. By assuming that Rib at a critical value 0.25, when there is an unlimited supply of fine grained sediment that allows the highly turbid boundary to remains critically stratified at all times, thus the feedback between turbulence and suspended sediment maintains balanced, which ug and B could be achieved from the model closure (Friedrichs and Wright, 2004; Scully et al., 2003; Flores et al., 2018).
4 Results
4.1 Winds, waves and currents
There were no storm events during the field observation period. Wind speeds ranged from 1.01 to 9.95 m/s, with a mean value of 4.45 m/s (Figure 4A). The wind direction was mainly from the northeast and southeast (Figure 4A). Water depth exhibited semidiurnal variations with tidal ranges of approximately 2.8 m (Figure 4B). During our observation period, the mean water depth at the observation site was 1.69 m. The mean significant wave height (Hs) was 0.19 m, with a maximum value of 0.49 m, indicating weak to moderate wave activity. Onshore winds enhanced wave activity, with the maximum significant wave height reaching 0.49 m during periods of strong onshore winds (Figure 4C). The bottom wave orbital velocity (uw) ranged from 0.03 m/s to 0.39 m/s (Figure 4B), showing a similar trend to significant wave height.
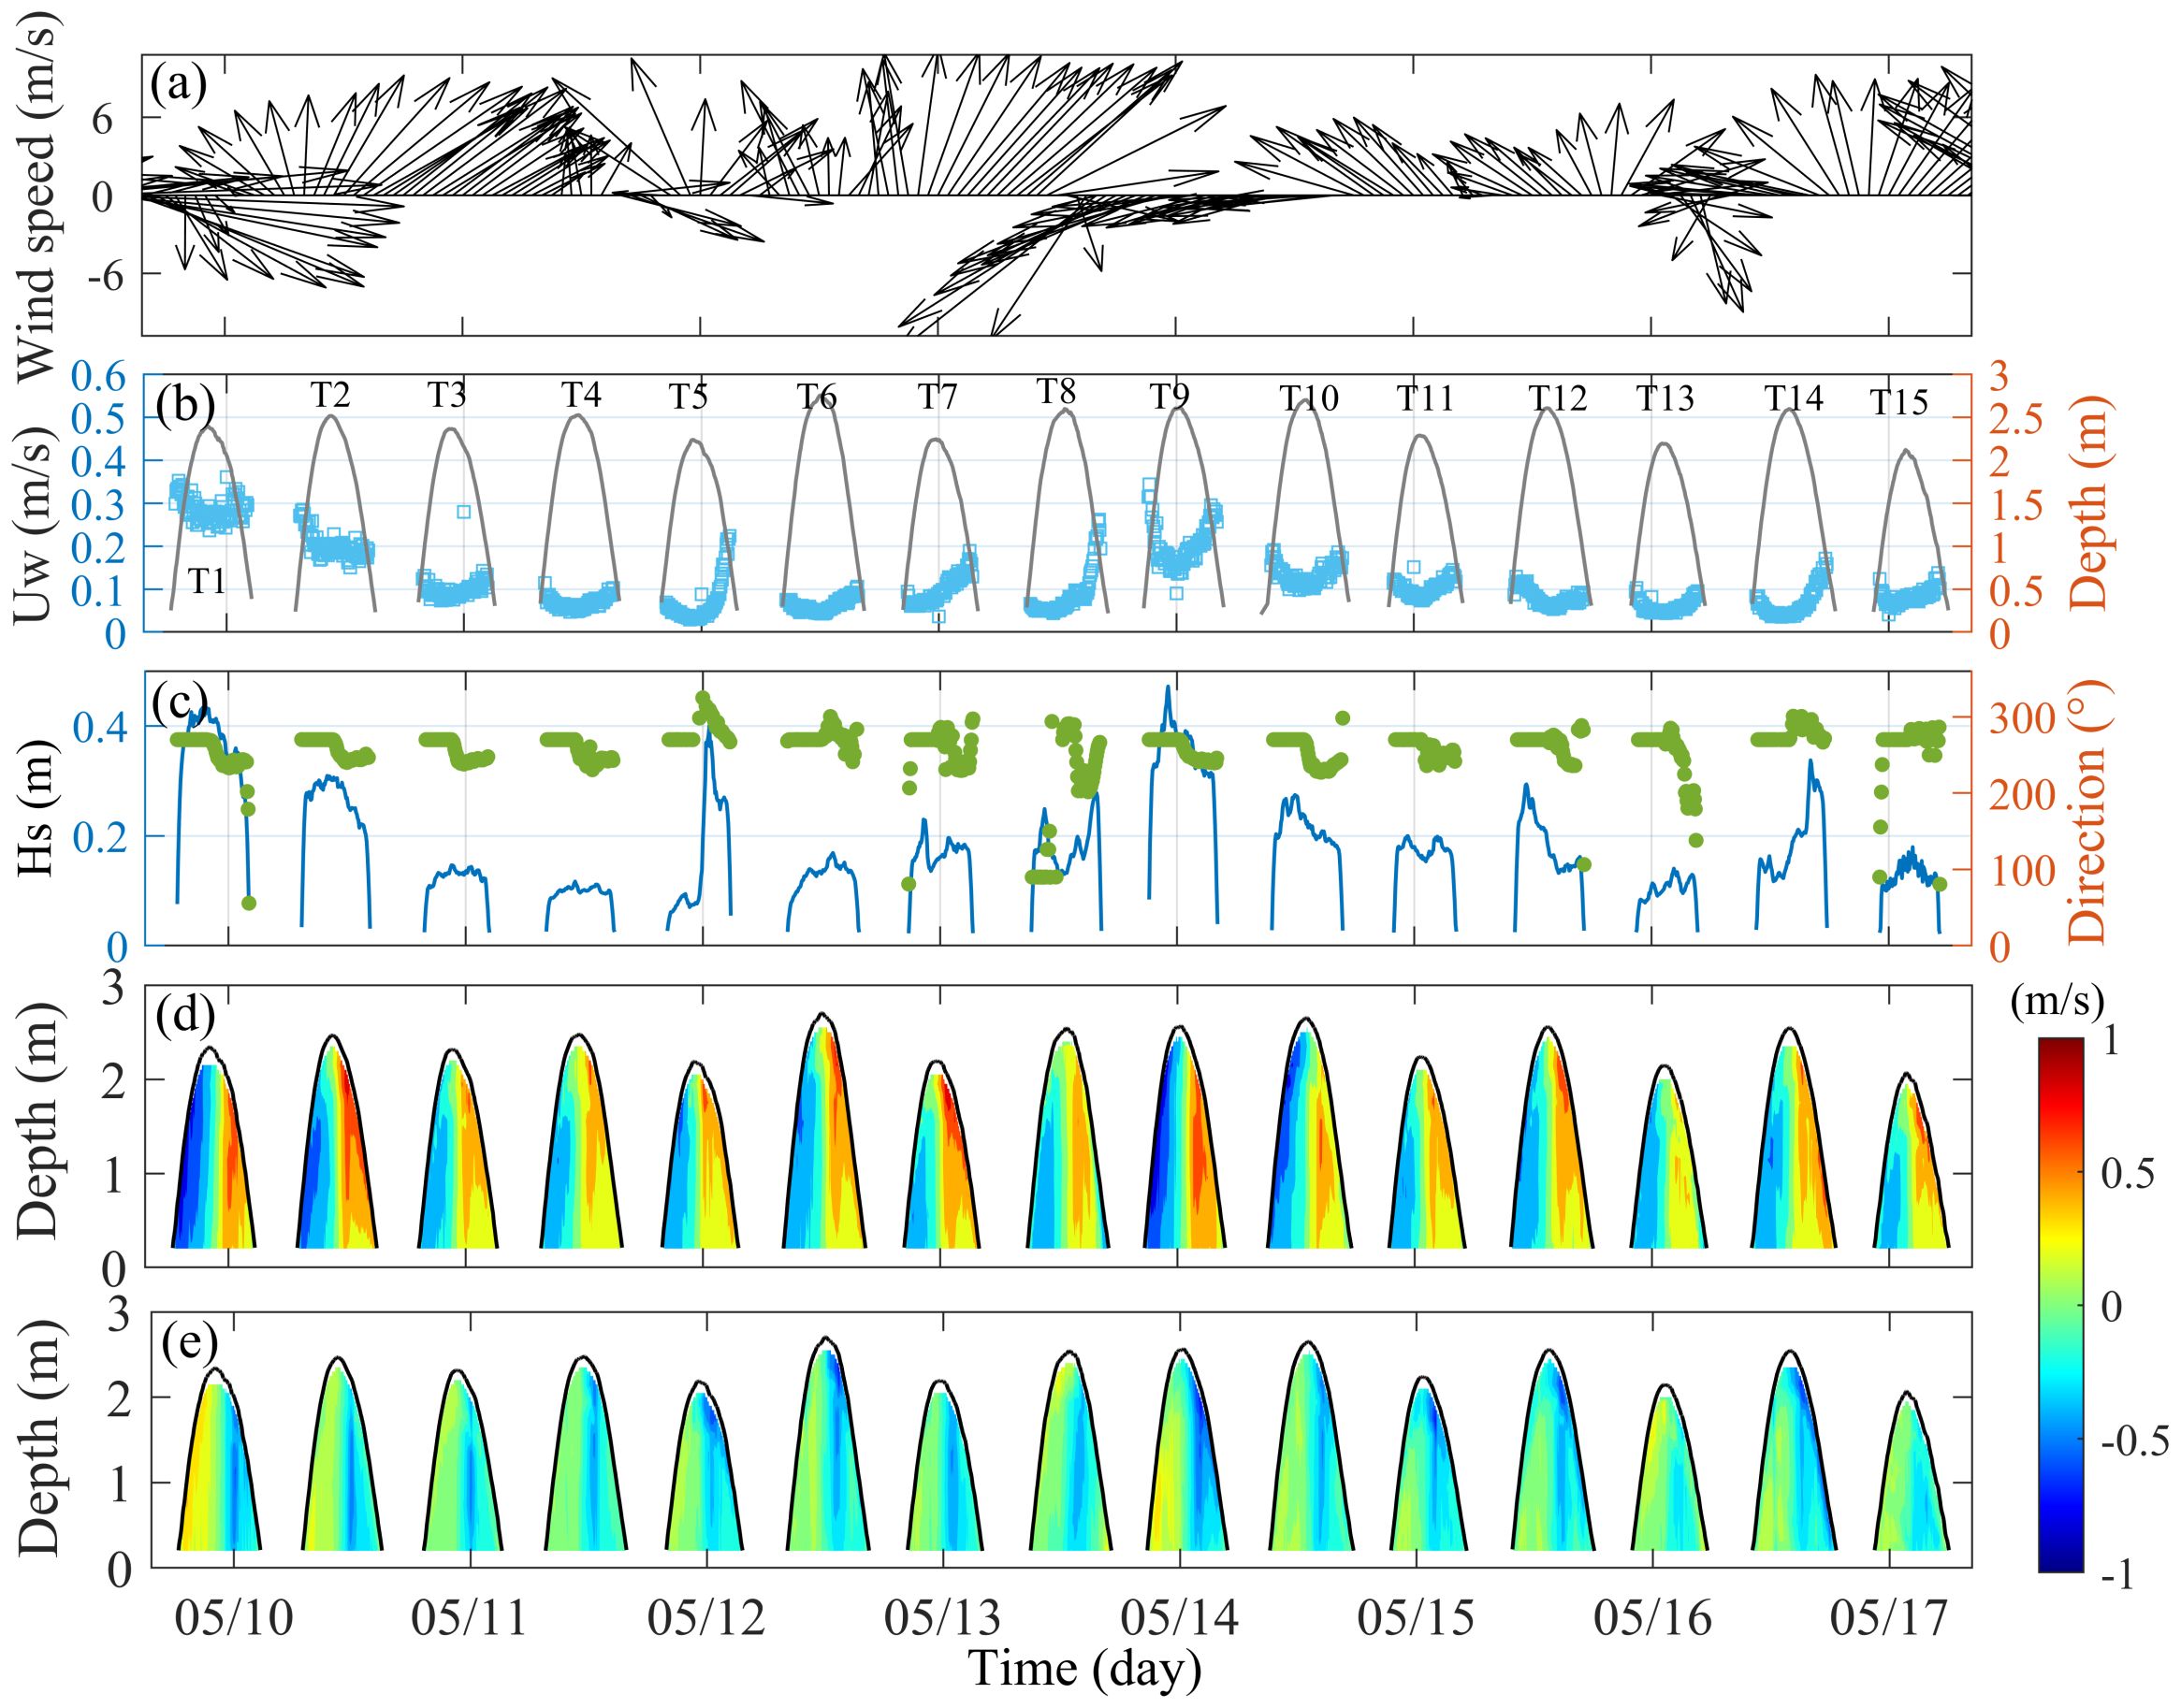
Figure 4. Time series of wind, wave, and current parameters from May 9 to 18: (A) Wind vectors; (B) Water depth and wave orbital velocity; (C) Significant wave height and wave direction; (D) Cross-shore velocity, with positive values indicating offshore direction; (E) Alongshore velocity, with positive values indicating northwestern direction. Tides 1 to 15, starting from the left, are abbreviated as T1 to T15 in subsequent sections.
The tidal currents were decomposed into alongshore and cross-shore components (Figures 4D, E). A positive alongshore current value signifies 23° anti-clockwise from the north, and the cross-shore current is perpendicular to the shore. The observed tidal elevation exhibited flood and ebb asymmetry (Figure 4D), with flood tide durations ranging from 3.33 to 4.17 hours and ebb tide durations from 3.67 to 4.41 hours. In the cross-shore direction (Figure 4D), the mean flood tide current velocity was 0.25 m/s, lower than the mean ebb tide current velocity of 0.35 m/s, indicating an ebb tide-dominated environment (Figure 4E). The maximum velocities for flood and ebb tides were 0.89 m/s and 0.93 m/s, respectively. In the alongshore direction, the mean flood current velocity was 0.11 m/s, and the mean ebb tide current velocity was 0.19 m/s. The maximum alongshore velocities for flood and ebb tides were 0.42 m/s and 0.71 m/s, respectively. During the high slack tide period, both flood and ebb tidal currents were negligible, with depth-averaged current velocities ranging from 0.027 m/s to 0.14 m/s.
4.2 Bed shear stress, sediment concentrations and bed level changes
Wave-induced bed shear stress exhibited a trend similar to that of wave orbital velocity and significant wave height. Wave-induced bed shear stress ranged from 0.009 to 0.48 Pa (Figure 5D), with a mean value of 0.13 Pa, which exceeds the threshold shear stress of 0.095 Pa for sediment erosion. During the initial two tides (Figure 5D), wave-induced bed shear stress ranged from 0.17 to 0.43 Pa, indicating a wave-dominated erosional environment. The current-induced shear stress displayed significant tidal fluctuations, ranging from 0.03 to 0.74 Pa, with the minimum occurring during slack tide and the maximum during the peak flood current and peak ebb current stages (Figure 5D). The mean current-induced shear stress was 0.24 Pa, significantly higher than the threshold stress for sediment erosion. Overall, wave and current-induced bed shear stress was primarily determined by tidal currents during periods of weak waves (Figure 5D).
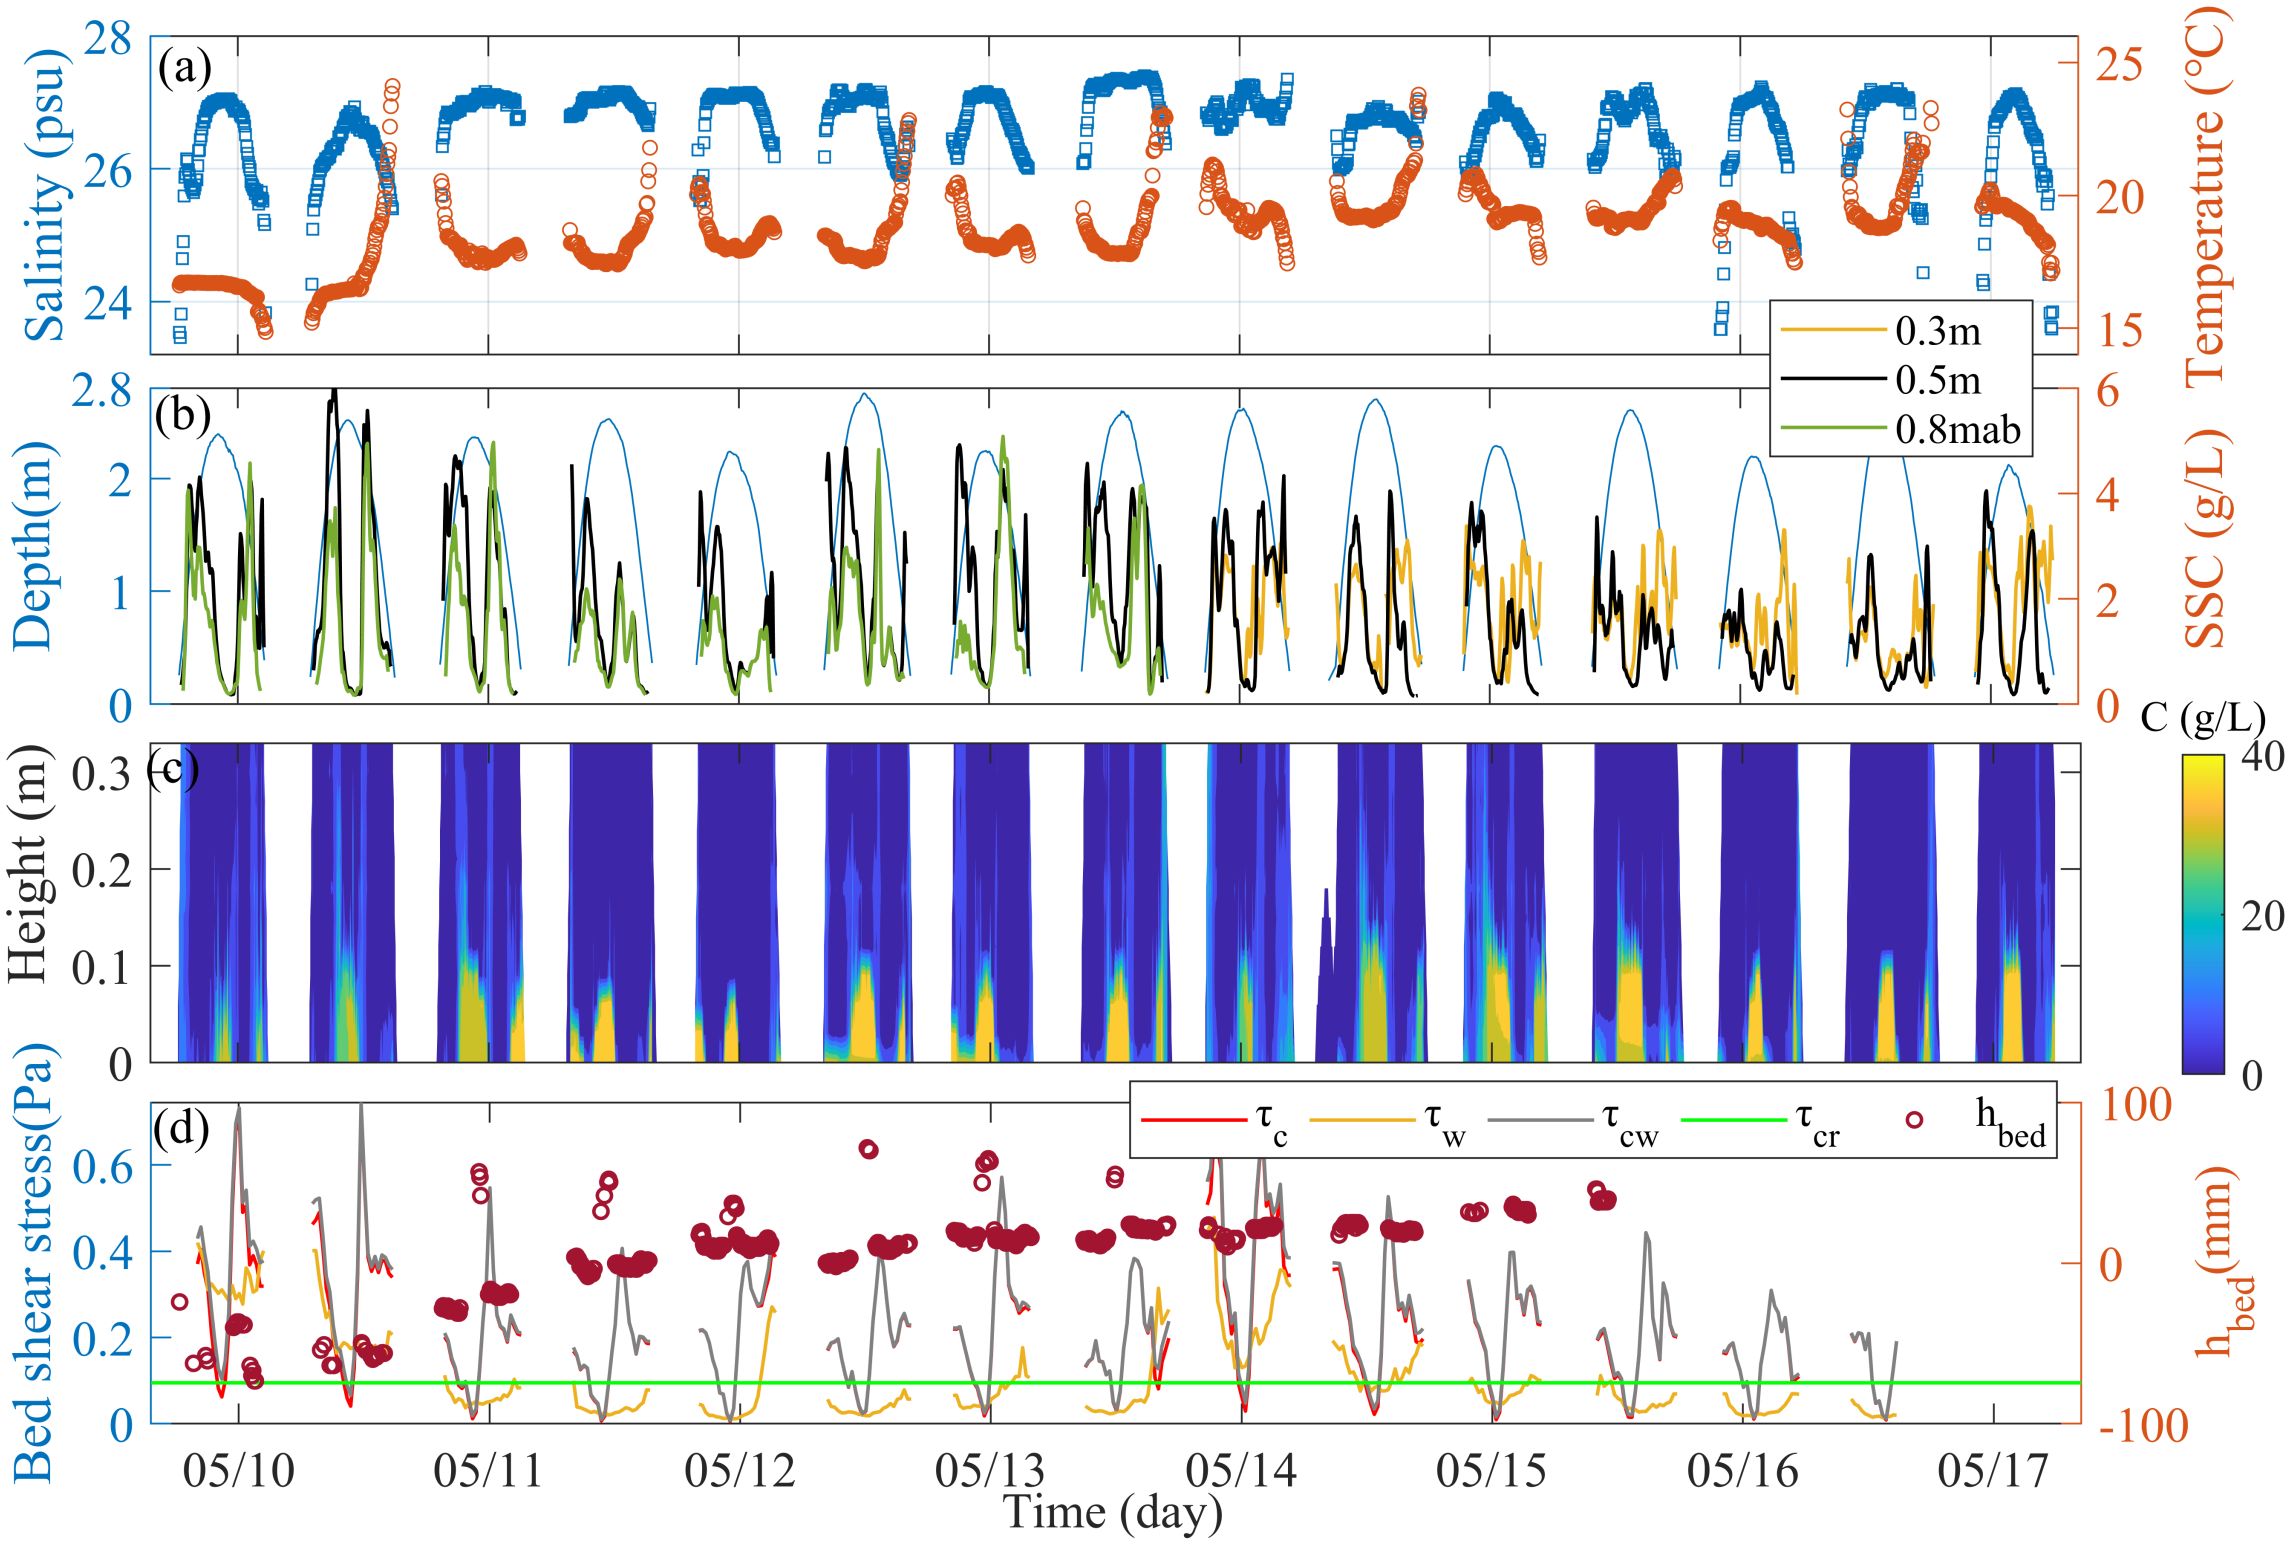
Figure 5. Observed near-bed sediment dynamic parameters: (A) Water salinity and temperature measured by CTD at 0.5 m above the seabed (mab); (B) Suspended sediment concentrations calibrated from OBS-3A at 0.3 m, 0.5 m, and 0.8 m; (C) Near-bed suspended sediment concentration calibrated from SediMeter, the yellow color denotes to fluid mud layer; (D) Bed shear stress values for τc, τw, and τcw, with the green line indicating the critical erosion shear stress (τcr). Dots represent bed level changes, where the zero point corresponds to bed elevation 0.25 m below the ADV probe.
Sediment concentrations above 0.3 m from the seabed were highly correlated with bed shear stresses (Figures 5B–D). During peak flood and ebb phases, suspended sediment concentrations (SSCs) increased rapidly due to strong bed shear stresses induced by waves and currents, reaching up to 5.78 g/L and 4.98 g/L at 0.5 m and 0.8 m above the seabed, respectively (Figure 5B). Meanwhile, a thin (<10 cm) and highly turbid fluid mud layer formed within the near-bed water column during the early flood and late ebb phases, with maximum near-bed SSCs reaching up to 38 g/L (Figure 5C). During high slack tide phases, SSCs in the upper water column (>30 cm) were extremely low, ranging between 0.17 g/L and 0.68 g/L (Figure 5B). However, suspended sediment within the ≈15 cm thick near-bed water column exhibited a temporally steady and highly turbid fluid mud layer, with maximum SSCs reaching up to 40 g/L (Figure 5C). The mean salinity at the observation site was 26.66 psu, showing a trend similar to water depth and an inverse trend with local water temperature (Figure 5A), corresponding to a well-mixed saline environment due to the extremely shallow water depth and lack of freshwater input. Bed level deviations recorded from the near-bed (0.1 mab) ADV sensor ranged from -0.09 m to 0.07 m, indicating strong seabed erosion and accretion processes under the combined influences of waves and currents (Figure 5D).
4.3 Observed fluid mud events
Sediment concentration greater than 10 g/L is commonly used as a threshold to distinguish fluid mud (Kineke and Sternberg, 1992; Tang et al., 2023). Periodic fluid mud events were observed in the near-bed layer (<30 cm), as evidenced by the SSC profiles calibrated from SediMeter turbidity data during our measurement period (Figures 5C, 6). At the observation site, fluid mud events occurred during three typical phases: early flood, high slack tide, and late ebb stages (Figures 5C, 6). During the early flood phase, seven fluid mud events (T1, T4, T5, T6, T7, T9 and T11) were identified, with durations ranging from 0.35 to 1.42 hours and thicknesses ranging from 4 to 7 cm (Figures 5C, 6). During the late ebb phase, thirteen fluid mud events (T1, T3-T6, T8-T15) were identified, with durations ranging from 0.5 to 2.16 hours and thicknesses ranging from 5 to 9 cm (Figures 5C, 6). Fluid mud events were observed during all high slack tide periods (T1-T15), with thicknesses ranging from 7 to 20 cm and durations ranging from 1.53 to 3.5 hours (Figures 5C, 6). Comparatively, fluid mud formed during slack tide phases exhibited greater thickness and longer duration, consistent with findings from similar research (Flores et al., 2018; Wu et al., 2022; Yu et al., 2024).
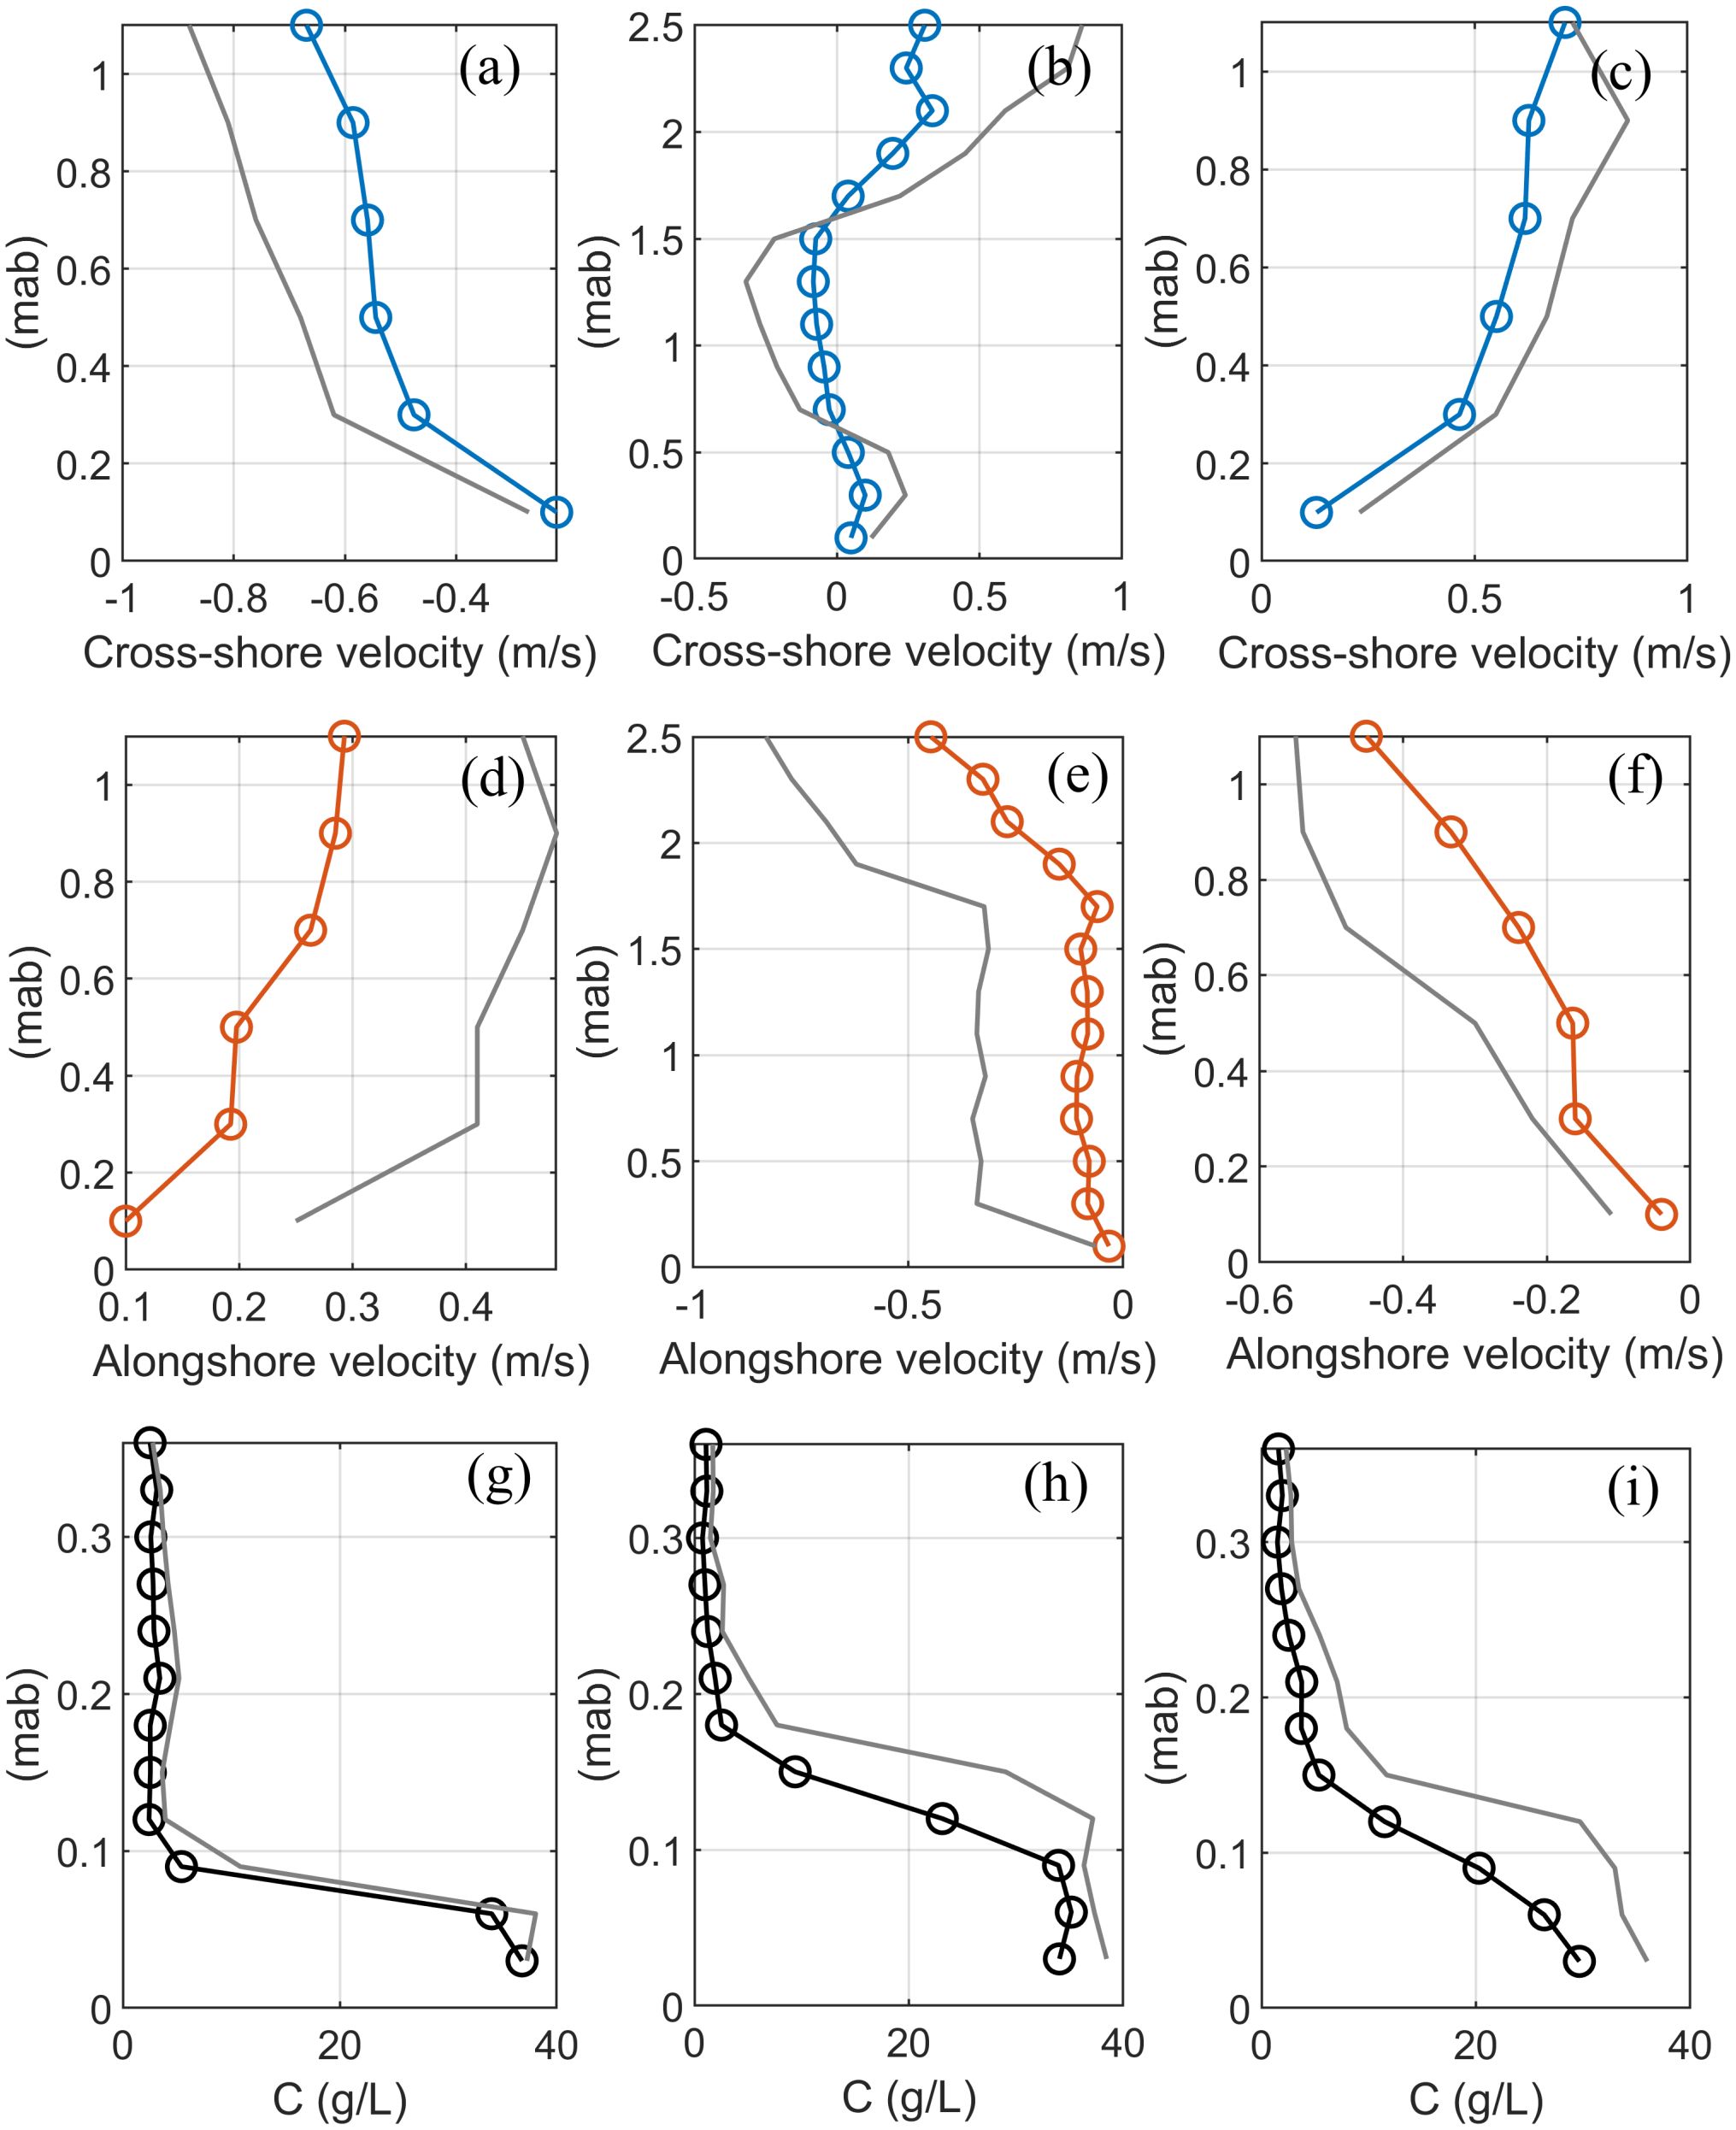
Figure 6. Velocity and sediment concentration profiles of fluid mud events: (A, D) show the entire velocity profile during early flood stages; (B, E) represent the entire velocity profile during slack tide stages; (C, F) illustrate the entire velocity profile during late ebb stages. Velocity at 0.1 m above the seabed was derived from near-bed ADV data. Gray lines indicate the envelope of maximum velocities. Panels (G–I) present sediment concentration profiles corresponding to the same stages as their upper columns over the bottom 0.36 m. Gray lines represent the envelope of maximum sediment concentrations, calibrated from SediMeter data. Each profile was derived from 4 to 15 individual measurements. Positive values indicate flow directed toward the northwest (alongshore) and offshore (cross-shore).
To illustrate the vertical hydrodynamic structure during fluid mud events, phase-averaged vertical velocity and near-bed sediment concentration profiles are presented in Figure 4. These phase averages are further segregated into early flood, slack tide, and late ebb phases to better understand the interactions between fluid mud events and hydrodynamics. In the cross-shore direction (Figures 6A, C), vertical velocity profiles for early flood and late ebb stages were approximately logarithmic, indicating relatively strong tidal acceleration effects (Soulsby and Dyer, 1981; Collins et al., 1998; Jia et al., 2006; Zhang et al., 2014; Zhang et al., 2024). However, during high slack tide phases, the vertical velocity profiles exhibited a stable laminar structure (Figure 6B). A near-bed offshore current jet, less than 0.10 m/s, was observed in the near-bed layer (<30 cm), with a weak onshore current above it in the middle layer (Figure 6B). Meanwhile, the surface layer was dominated by an offshore current that was slightly stronger than the lower layers (Figure 6B). This anomalous near-bed, offshore-directed weak current jet during high slack tide is a prominent sign of downslope fluid mud movement, often referred to as gravity flows (Traykovski et al., 2007; Flores et al., 2018; Yu et al., 2024).
In the alongshore direction, the current flowed northwest during the early flood phase and southeast during the late ebb phase (Figures 6D, F), showing significant deviations from the mean value among different tidal cycles based on the envelope of maximum velocities. There were no differentiated velocity structures during slack tide phases (Figure 6E), suggesting no movement of fluid mud along the shelf. The sediment concentration profiles revealed a thin, highly turbid layer with a thickness of 3 to 20 cm (Figures 5C, 6G–I), characterized by high concentration gradients and an exponential relationship between SSCs and depth, as verified by other field and laboratory studies (Souza et al., 2004; Traykovski et al., 2007; Flores et al., 2018; Wu et al., 2022; Liu et al., 2022; Tang et al., 2023).
Additionally, the instruments failed to capture the three-dimensional velocity structure in the lower 10 cm layer due to the setup height of the bottom ADV, which could explain the lack of measured hydrodynamic signals distinguishing gravity flows during early flood and late ebb stages for the thinner (<10 cm) fluid mud layer during these phases. However, fluid mud was proven to move downslope as gravity flows, even with a gentler bed slope near our observation site (Yu et al., 2017; Tang et al., 2023; Yu et al., 2024), as well as at other similar wave and tide-dominated muddy coasts (Jaramillo et al., 2009; Sheremet et al., 2011; Hale and Ogston, 2015).
5 Discussions
5.1 Wave-induced bed liquefaction and sequent surficial sediment refinement
Wave-generated cyclic loads of vertical pore pressure are considered the main trigger for bed liquefaction, leading to bed sediment fluidization and segregation, which moves fine sediments upward, making them more easily eroded and transported (Liu et al., 2013; Jia et al., 2014; Klammler et al., 2020). Wave-induced pore pressure accumulation in liquefied cohesive sediments has been found to enhance sediment erosion and suspension (Aldridge and Rees, 1997; De Wit and Kranenburg, 1997; Jia et al., 2014; Dong et al., 2022). This enhanced sediment availability and resuspension substantially contribute to the formation of a near-bed high sediment concentration layer, such as a fluid mud layer, which can be sustained or affected by turbulence, hindered settling, or stratification processes (Wolanski et al., 1992; Knoch and Malcherek, 2011; Wu et al., 2022). However, wave-induced bed liquefaction has rarely been investigated through in-situ field observations and has been widely explored using experimental or combined methods due to the temporary confinement of marine instruments (Jia et al., 2014; Jeng et al., 2020; Zhang et al., 2020; Tang et al., 2023). To describe the combined effect of wave-exceeded pore pressure at and below the sediment surface, we adopted a dimensionless liquefaction degree (L) (portion of vertical effective stress) and depth (Z) (sediment failure depth due to liquefaction) to construct a surrogate index for seabed sediment liquefaction and entrainment processes (Klammler et al., 2020, 2021; Billings et al., 2023; Postacchini et al., 2023; Yang et al., 2023). The bed is stabilized and compressed when L and Z equal 0. When 0< L< 1, there is an increasing possibility of bed instability, erosion, and sediment entrainment, though not fully liquefied, whereas Z approaches 0− due to liquefaction occurring below the surface bed. When L ≥ 1, this indicates a fully liquefied bed state (e.g., a fluidized bed), and the failure depth (Z) is negative, where sediment entrainment actually occurs (Klammler et al., 2020, 2021; Wu et al., 2023).
The bed in the central Jiangsu intertidal area is predominantly composed of clay and silt, this mixture exhibits significant potential for liquefaction in laboratory settings (Monkul et al., 2015; Krim et al., 2019; Zhang et al., 2020). Evidence for bed liquefaction is presented in Figure 5, using both measured and predicted data. The predicted liquefaction degree indicates strong bed liquefaction during events T1, T2, T5, T8, and T9 (Figure 7B). Specifically, during the first two tides, the mean liquefaction degree is 0.71 (Figure 7B), indicating increasing bed instability with continuous wave activity. The high-frequency water pressure series recorded by the near-bed ADV was more unstable during T1 and T2 (Figure 7A), and appeared closely related to the liquefaction degree rather than significant wave height (Figures 7A, B), suggesting strong fluctuations of seawater due to frequent wave loading (Zhang et al., 2020). The maximum liquefaction degree exceeds 1 during T1, with a maximum failure depth of 0.068 m, indicating a transient fully liquefied state (Figure 7B). This liquefaction status is confirmed by the abrupt changes in the attitudes of seabed-mounted AD2CP instruments (Figure 7C) and rapid bed elevation erosion (Figure 7D). Although not fully liquefied after T1, the fluidized seabed remained generally stable and could be replenished by occasional medium wave events during T5, T8, and T9 (Figures 7A, B).
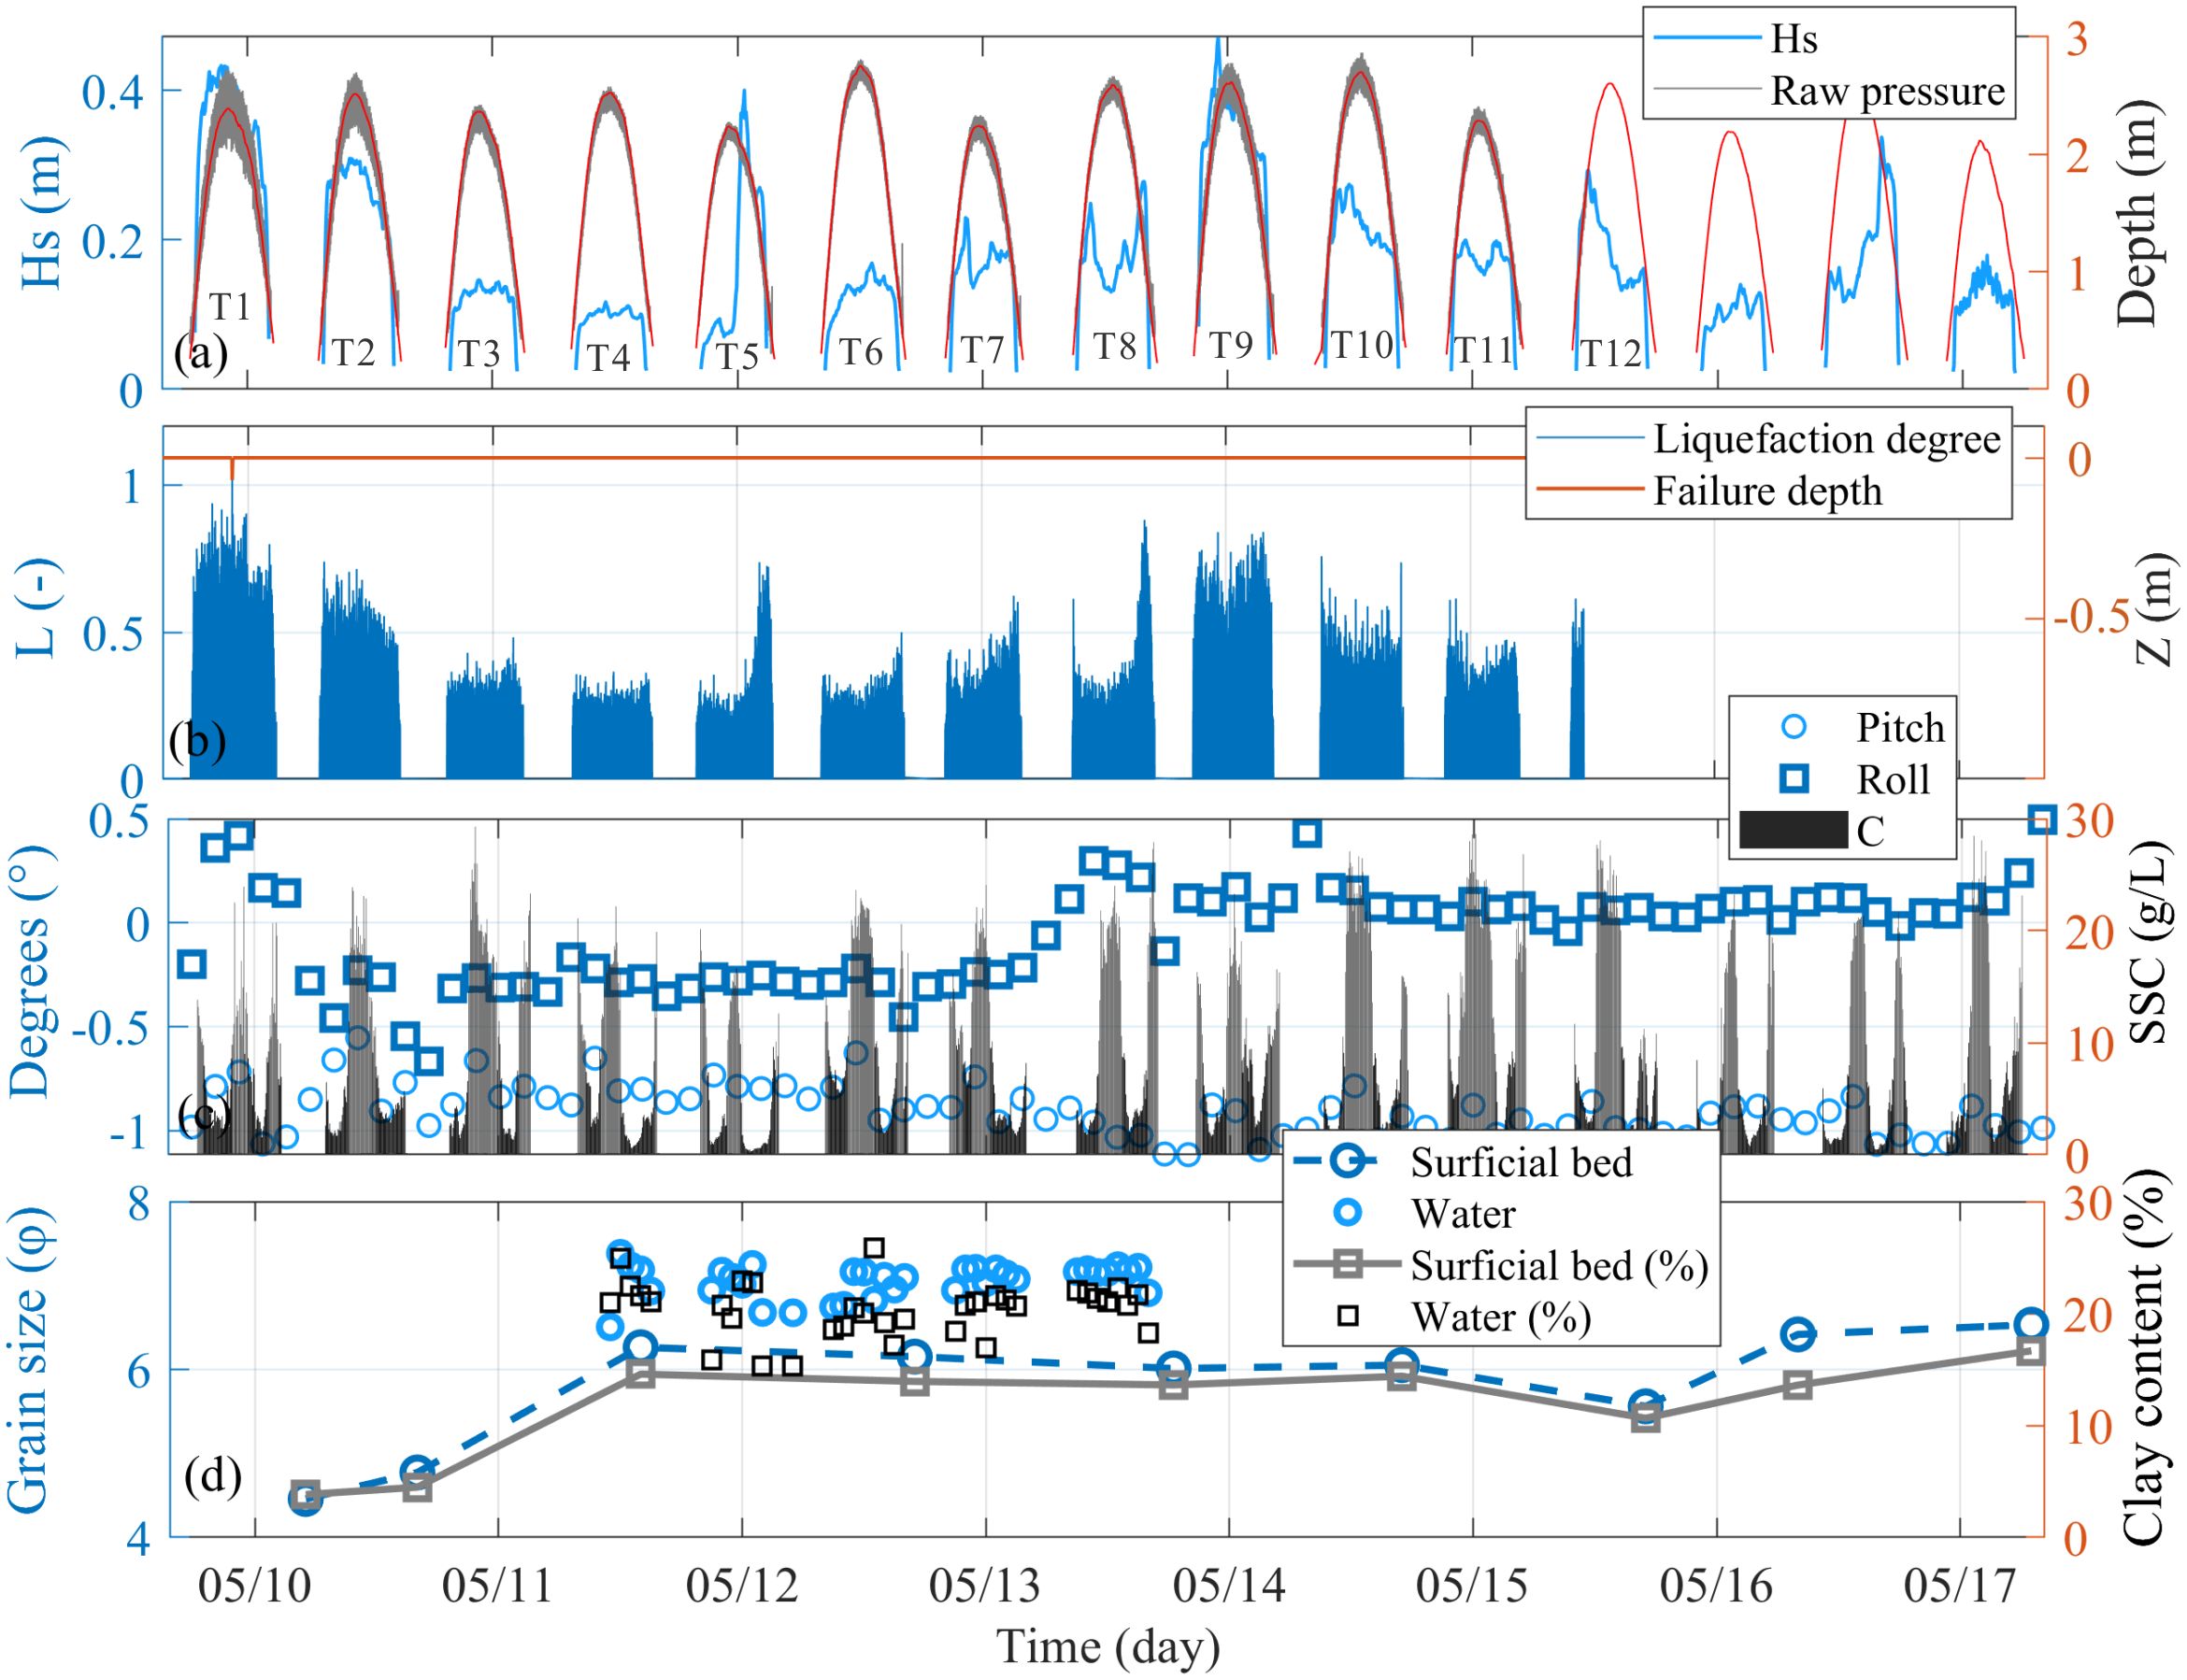
Figure 7. Measured and predicted wave-induced bed liquefaction indicators: (A) Significant wave height, water depth, and raw pressure data retrieved from near-bed ADVs; (B) Predicted liquefaction degree and failure depth following Klammer et al (Klammler et al., 2020, 2021). The blank area on the right represents no data due to battery failure of near-bed ADV at 0.1 mab; (C) Pitch and roll data retrieved from the bottom AD2CP mounted on the seabed. The lower bars denote mean near-bottom (< 20 cm) SSCs; (D) Grain size parameters of surficial bed (< 5 cm) from May 10 to May 17 and hourly near-bottom (~15 cm) water samples from May 11 to May 13.
The entrainment of sediment into overlaying waters occurred during the first liquefaction event T1, with a measured maximum eroding depth of 0.073 m (Figure 5D). This observation is corroborated by the predicted failure depth of 0.068 m (Figure 7B) and near-bed SSCs exceeding 10 g/L (Figure 7C). The erosion rate during T1, around the fully liquefied stage, was 0.047 mm/min (Figure 5D), significantly higher than during subsequent tides. This indicates that massive erosion occurs when the sediment transitions from grain-supported to fluid-supported states (Foda et al., 1997; Tzang et al., 2011; Traykovski et al., 2015; Trowbridge & Traykovski, 2015; Niu et al., 2023), forming a fluid mud layer. Additionally, a significant signal of bed liquefaction is the observation of the fluidized status right after ebb tides, as evidenced by sediment samples collected from the surficial bed and near-bed water between different tides (Figures 7D, 8). Specifically, a photo clearly shows a thin fluid mud layer (~5 cm) after the ebb tide, indicating an active and fluidized seabed state (Figure 8). Furthermore, the decreasing grain size of surficial sediment, from 4.45 φ (May 10) to 6.54 φ (May 17), corresponds to continuous sediment refinement due to sustained bed liquefaction and seabed stratification (superficial fluid mud layer). This stratified seabed forms when waves sort the seabed sediment to a greater critical depth, allowing fine particles to be transported upwards through pore-water flow, while coarse sediment grains settle, leading to a liquefied upper bed and a more compact solid bed below (Traykovski et al., 2000; Guy Plint, 2014; Liu et al., 2017; Becker et al., 2018; Zhang et al., 2023). The surficial sediment refinement process is evidenced by corresponding sediment grain size parameters (Figure 7D), with clay content rising from 3.82% (May 10) to 16.67% (May 17), substantially facilitating near-bed fine sediment supply and resuspension (Lambrechts et al., 2010; Jia et al., 2014; Niu et al., 2020).
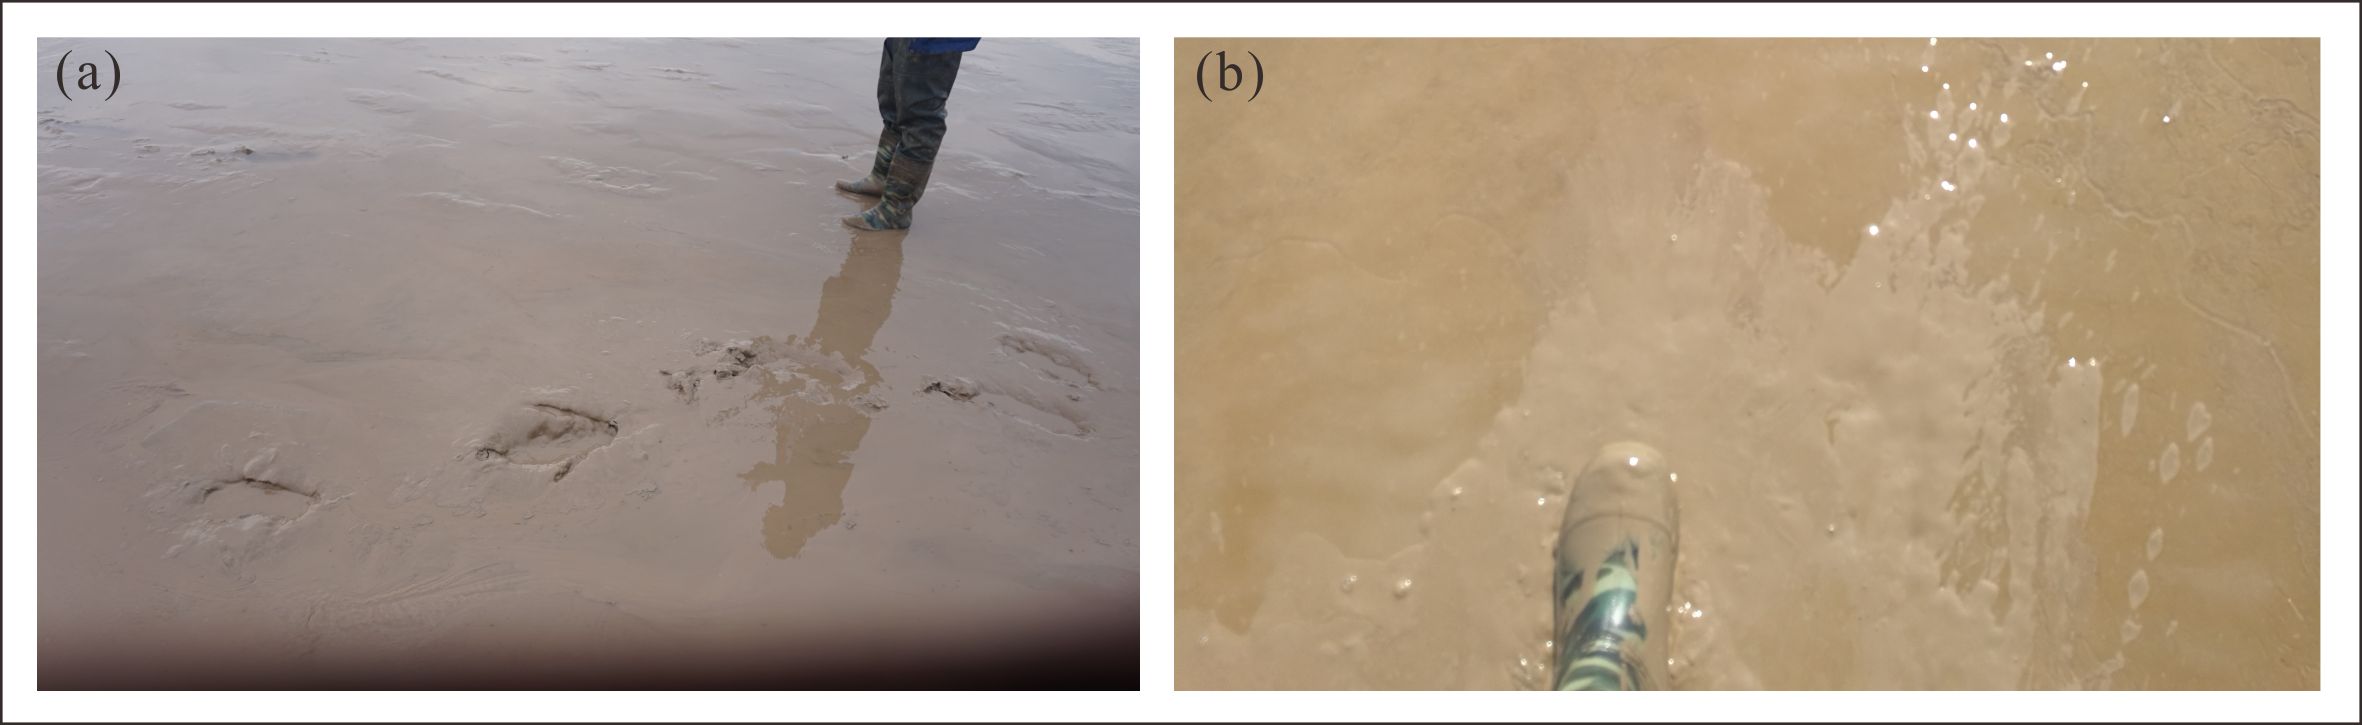
Figure 8. Surficial fluid mud at the observation site: (A) Photograph taken on May 11, 2017, at 16:57; (B) Photograph taken on May 17, 2017, at 09:14. Beneath the fluid mud layer, the seabed is compact and primarily composed of sandy silt, with clay content less than 5%.
5.2 Formation and breakdown of fluid muds
Massive fine-grained sediments were sorted and suspended due to wave-induced liquefaction and seepage (Lambrechts et al., 2010; Jia et al., 2014; Green and Coco, 2014; Zhang et al., 2018; Niu et al., 2023). Based on a liquefied and unconsolidated seabed, resuspension and advection processes were enhanced due to the continuous refinement of surficial sediment in subsequent tides, providing an almost infinite sediment supply for the formation of successive fluid mud events. Fluid mud formation and breakdown were highly dependent on near-bottom turbulent kinetic energy (TKE), especially during high slack tide phases (Figures 9B, D). Fluid mud generally formed when near-bottom (0.1 mab) TKE dropped below 0.00045 m²/s² (Figure 9B) and broke down with an increase in near-bottom TKE caused by an increase of current velocity (Figure 9D). TKE in the upper water layer (>0.3 m) was significantly stronger than in the lower layer during slack tide phases (Figure 9B), indicating an extremely stratified near-bottom layer (<0.3 m) with mean TKE ranging from 0.00039 m²/s² to 0.00073 m²/s² at 0.1 mab and from 0.019 m²/s² to 0.032 m²/s² in the upper layer (Figures 9C, D). Mean current velocity for the bottom layer (0.1 mab) ranged from 0.004 m/s to 0.23 m/s during slack tide phases, while it ranged from 0.37 m/s to 0.75 m/s for the upper layer (Figure 9D). The near-bottom stratification was characterized by sharp gradients in current velocity and SSCs during slack tide phases, leading to hindered settling and suppressed bottom turbulence once the fluid mud layer formed (Wu et al., 2022; Liu et al., 2022; Tang et al., 2023). During slack tide fluid mud events, waves served as a trigger for increased fine sediment supply and a more easily eroded seabed rather than as a dominator of fluid mud, with strong tidal currents more closely related to near-bottom TKE dynamics that actually controlled the fate of fluid mud (Figures 9A, B, D). However, waves played a crucial role in the initial liquefaction stage, fluid mud formed and broke down with slightly larger TKE during slack tide of T1, corresponding to a more turbulent environment represented by coarser surficial sediment grain size (Figures 7D, 9B, D).
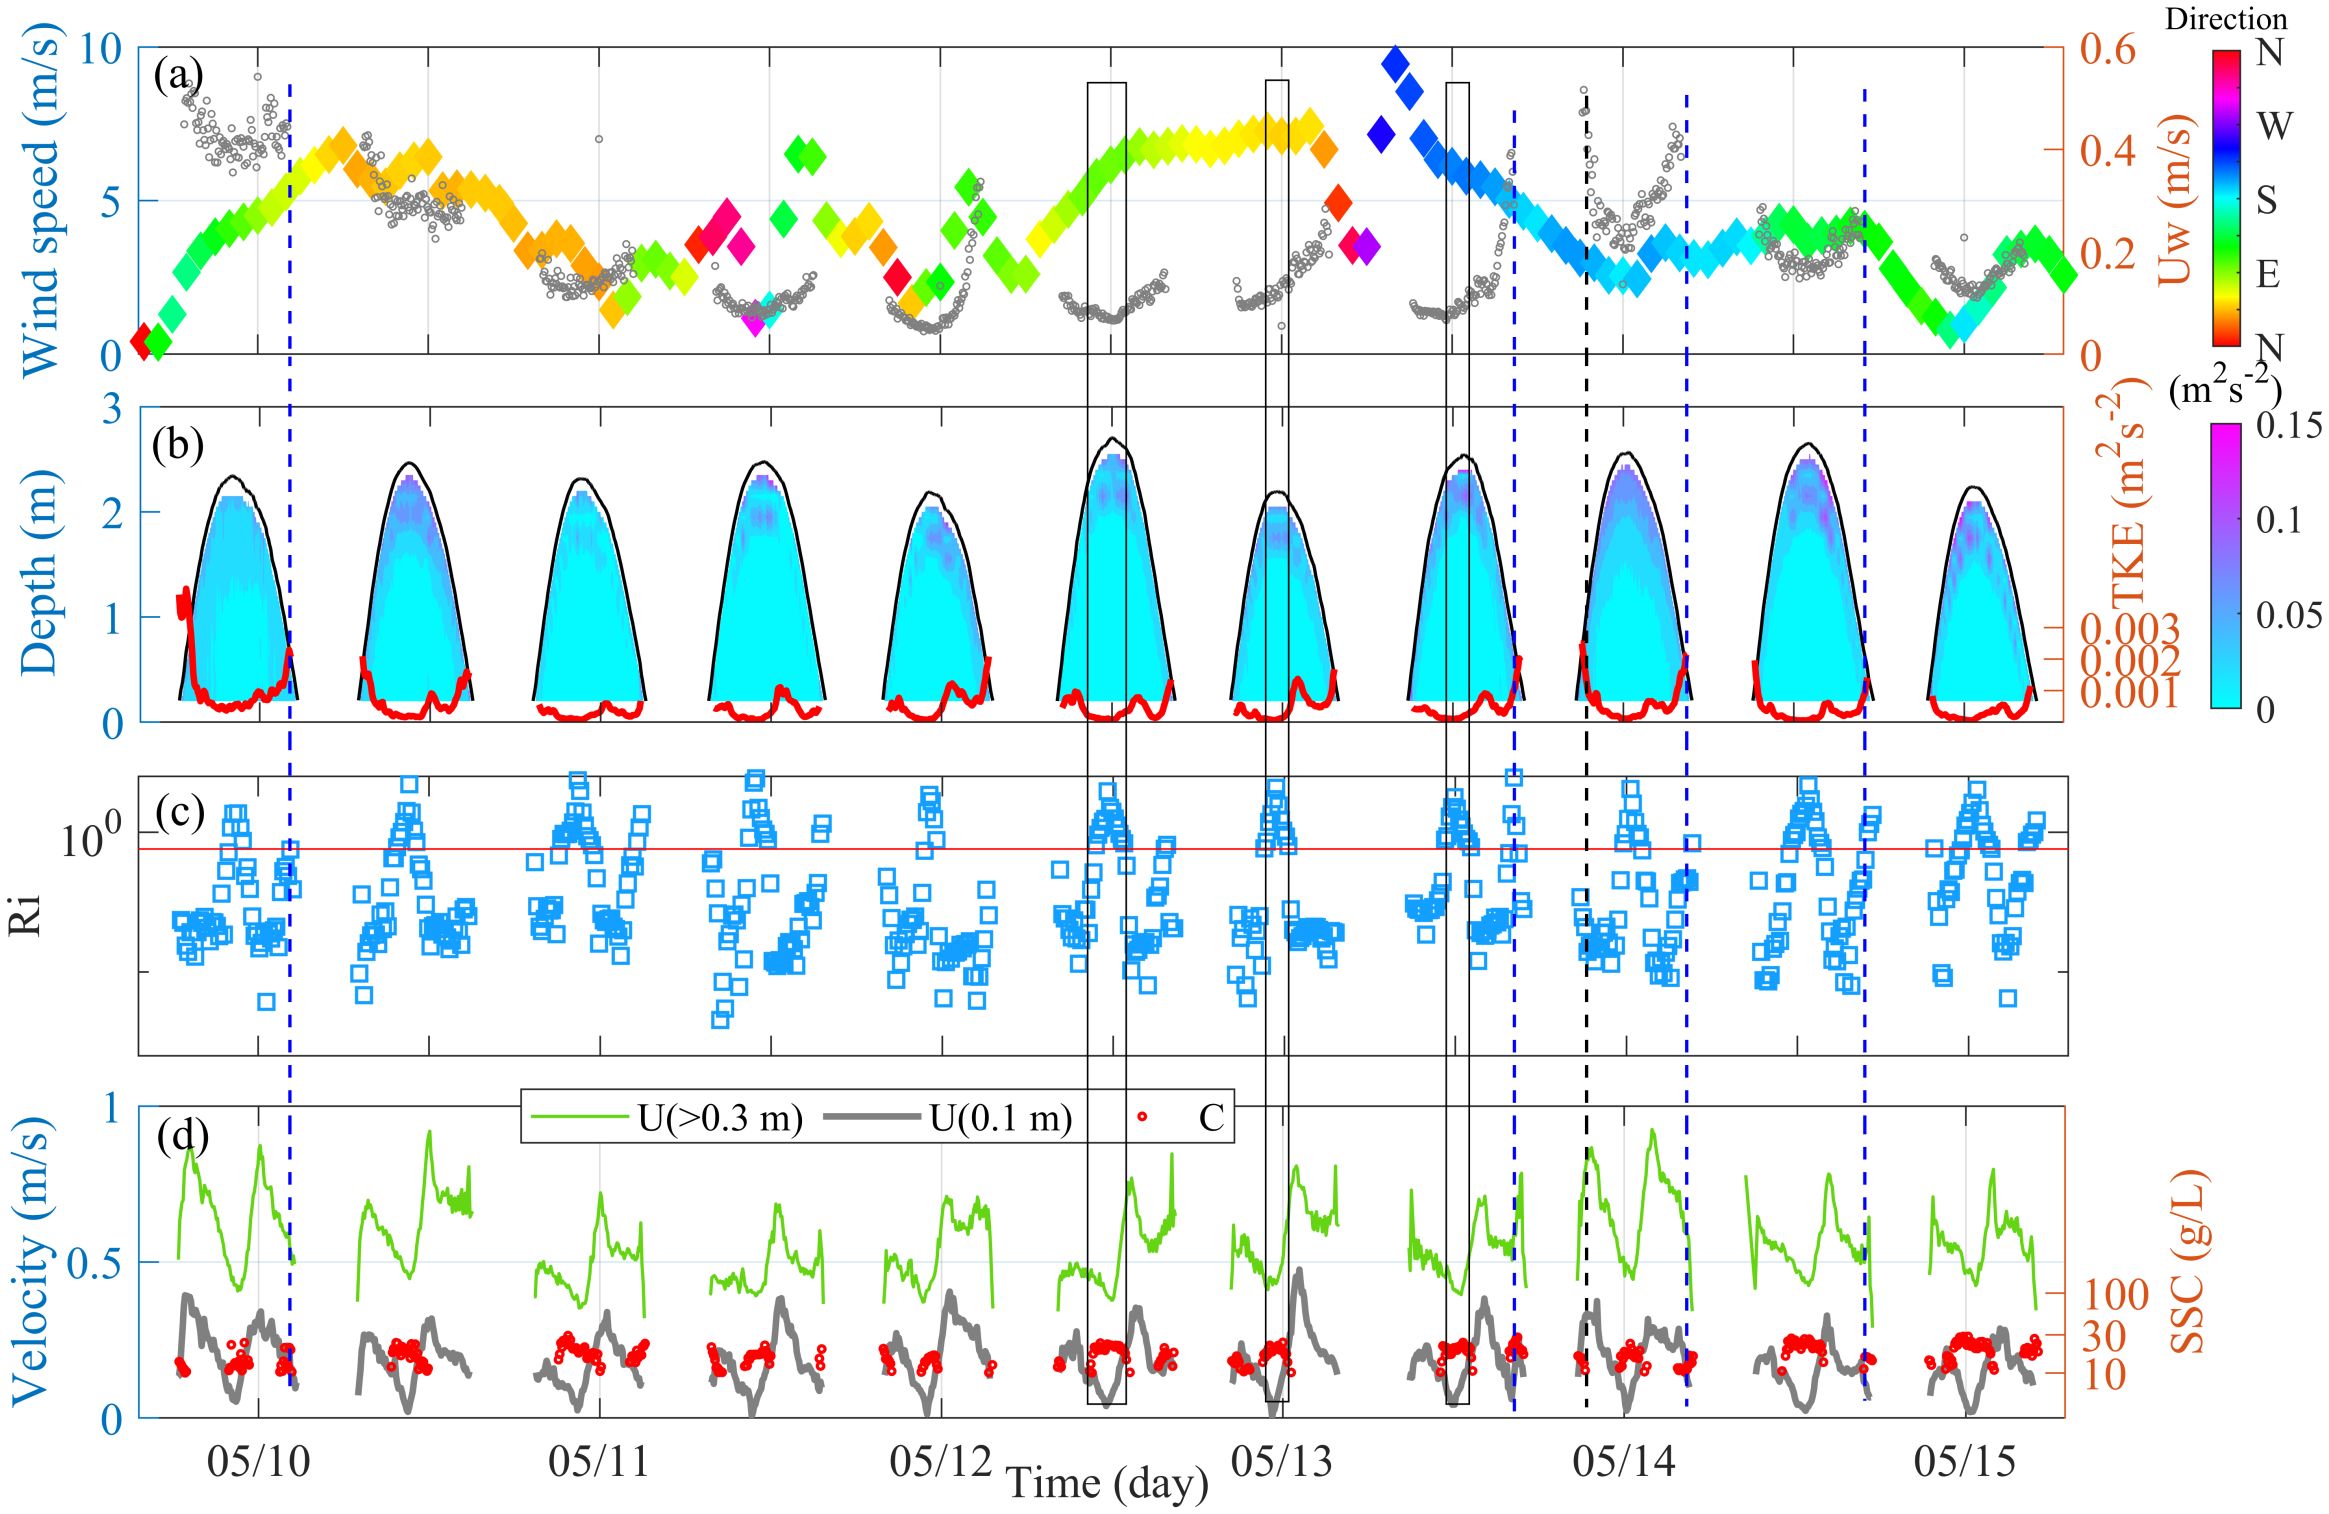
Figure 9. Typical hydrodynamic parameters for tides 1 through 11: (A) Wind speed, wind direction, and wave orbital velocity, with blue circles denoting uw; (B) Turbulent kinetic energy (TKE) of the water column, with the red line indicating TKE at 0.1 m above the bottom (mab); (C) Gradient Richardson number for the near-bottom layer (< 30 cm), with the red line indicating Ri = 0.25; (D) Mean current velocity for the upper layer (> 30 cm) and bottom layer (0.1 mab), and observed fluid mud events (red circles). The first 11 tides are shown for clarity.
Aside from slack tide phases, fluid mud was more likely to form during late ebb phases, characterized by thinner and shorter-lasting deposits when the water level was typically below 1.0 m. Although the late ebb stage was marked by effective mixing and increased turbulence, stratification could still occur in the near-bottom layer (less than 0.3 m). Fluid mud, such as that observed in T1 and T6 early flood phases, could persist even with higher turbulent kinetic energy (TKE) levels (> 0.00045 m²/s²) in the near-bottom layer (0.1 mab), as shown in Figures 7B and D, corresponding to a stratified bottom layer at the same time. In contrast, when the bottom layer was not stratified, no fluid mud formed during late ebb phases, as observed in T2 and T7, even when TKE was below the threshold. Although the TKE threshold at 0.1 mab is not fully representative of late ebb fluid mud events due to the thinner high sediment concentration layer (layer thickness< 0.1 m) compared with slack tide fluid mud, it can be inferred that a stratified near-bottom layer with TKE levels lower than the threshold is crucial for fluid mud formation during both late ebb and early flood phases.
Furthermore, our findings indicate that both wind speed and direction influence the formation of fluid mud during late ebb phases, when the near-bottom water is more susceptible to stratification. When wind speed exceeded 6 m/s, no fluid mud formed during late ebb phases, as observed in T2 and T7, suggesting a lack of stratification due to excess turbulence generated by wind waves at low water stages. Conversely, fluid mud was observed during late ebb phases when the near-bottom layer was stratified and wind speeds were less than 6 m/s. However, fluid mud also appeared during early flood phases in the absence of offshore winds. An offshore wind, even at low speeds, could significantly reduce the formation of fluid mud during early flood phases. This is because an opposing wind can decelerate or even reverse the early flood tide by introducing vertical mixing through wind fetch (Rippeth et al., 2004; Thomas, 2008; Goh and Noh, 2013), resulting in a well-mixed near-bottom layer without a significant high sediment concentration layer (Figures 9B, D, T2-T3).
5.3 Dynamics of wave and current supported fluid mud
Statistical analysis shows that the depth-averaged suspended sediment concentrations (SSCs) of the fluid mud layer ranged from 12.02 g/L to 27.46 g/L. The mean SSCs were 22.46 g/L during slack tide, 14.74 g/L during early flood, and 14.94 g/L during late ebb (Tables 2–4). Mean water depths for slack tide, early flood, and late ebb fluid mud events were 2.37 m, 0.60 m, and 0.66 m, respectively. The mean thicknesses of the fluid mud were 0.14 m, 0.05 m, and 0.08 m, and the durations were 2.77 h, 0.78 h, and 1.31 h, respectively (Tables 2–4). These parameters show a high correlation coefficient when logarithmically related (R2>0.92). Furthermore, fluid mud events during early flood and late ebb phases generally had shorter durations and lower SSCs, and were notably absent during peak flood and peak ebb periods when near-bottom currents were stronger. This suggests that increased tidal currents contribute to sediment resuspension and dispersion into the fluid mud layer and upper water column as fluid mud moves downslope (Yu et al., 2017, 2024).
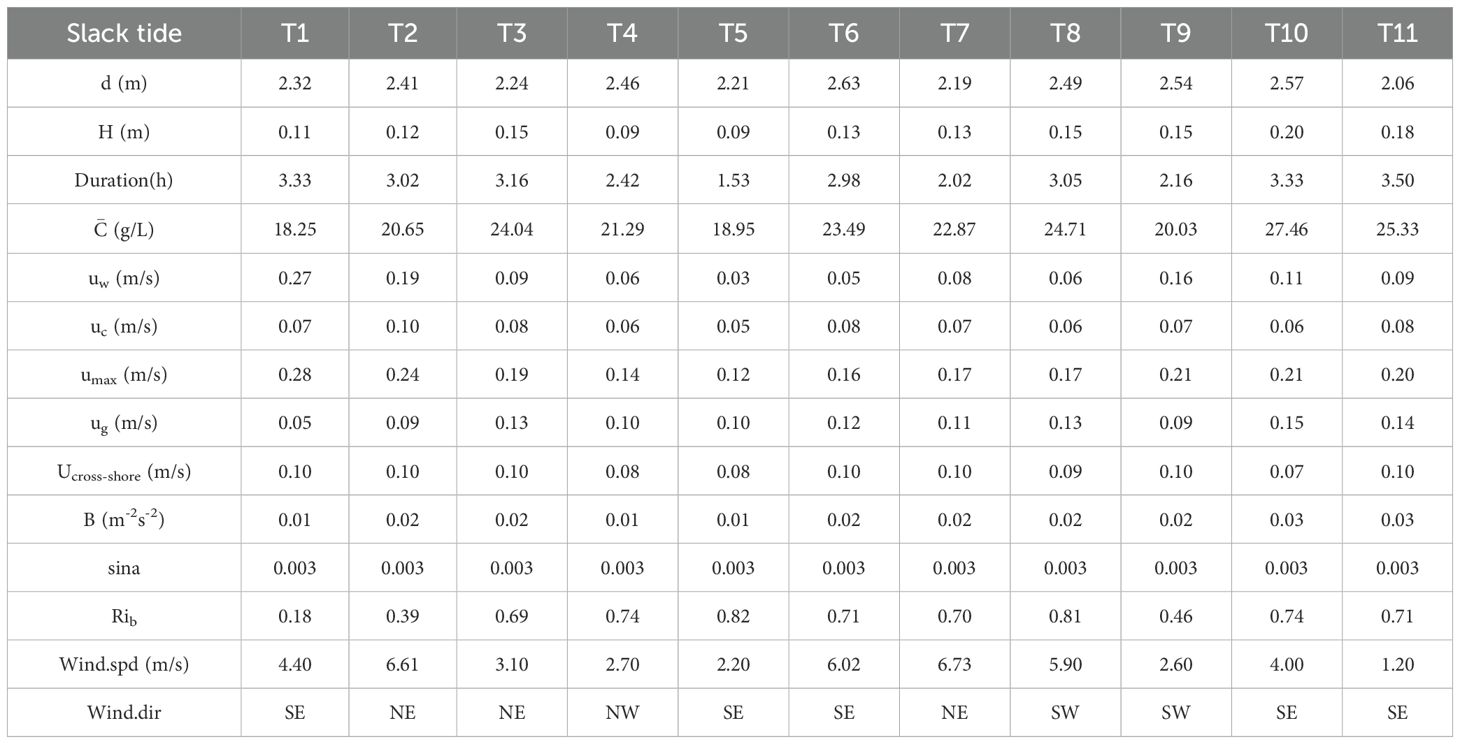
Table 2. Dynamics of fluid mud events observed during slack tide phases.
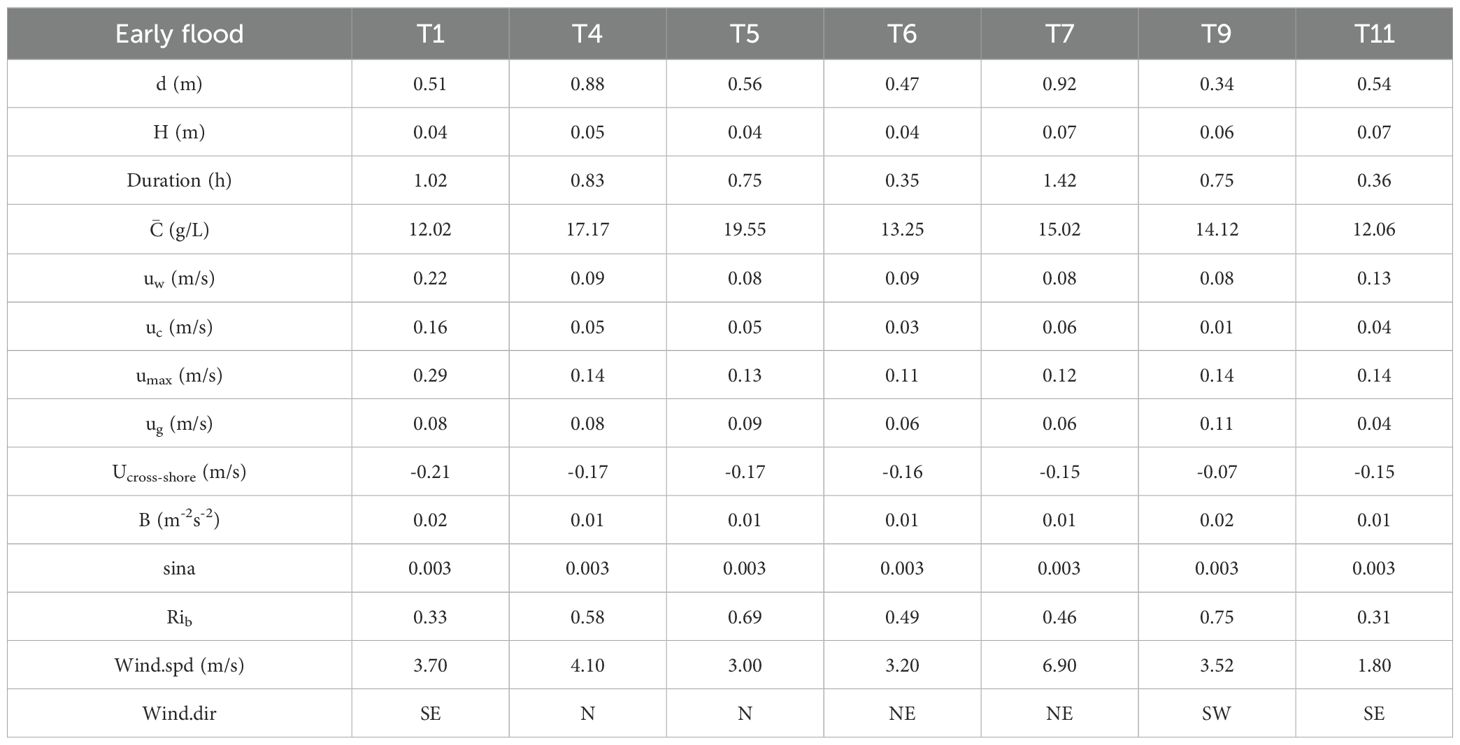
Table 3. Dynamics of fluid mud events observed during early flood phases.
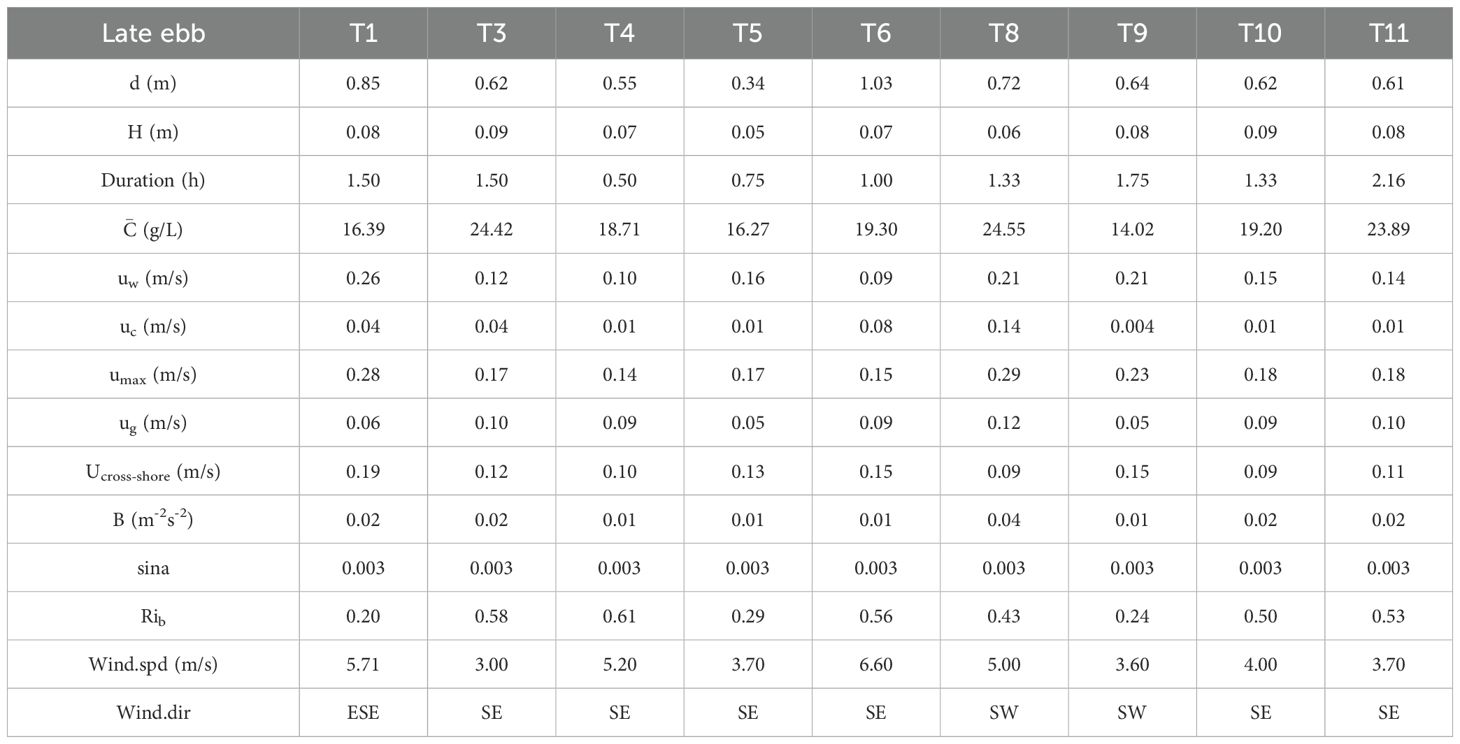
Table 4. Dynamics of Fluid Mud Events Observed During Late Ebb Phases.
In this study, a sinα value of 0.003 was used based on GNSS-RTK data, and a CD value of 0.0035 was adopted following recommendations and validations (Traykovski et al., 2000; Tang et al., 2023; Yu et al., 2024). Using the theoretical buoyancy-friction model described earlier, the estimated parameters revealed the dynamics of downslope movement of wave and current-supported fluid mud as gravity flows (Tables 2–4). The calculated bulk Richardson number (Rib) for T2 to T11 ranged from 0.24 to 0.82 (Tables 2–4), closely approximating or exceeding the critical threshold of 0.25 (Friedrichs and Scully, 2007; Jaramillo et al., 2009; Hale and Ogston, 2015; Yu et al., 2017; Tang et al., 2023), indicating a stratified near-bottom layer due to high SSC gradients. However, Rib was slightly less than 0.25 during slack tide and late ebb phases of T1, which may be attributed to the finite bed erodibility caused by the high sand content (~46.29% sand) within the seabed (Flores et al., 2018; Yu et al., 2024). This sand content likely led to bed liquefaction under continuous wave loads. For the initial two tides, umax was primarily influenced by uw (Tables 2–4), corresponding to a wave-dominated environment that promotes liquefaction processes. Furthermore, the mean uw for fluid mud events during slack tide, early flood, and late ebb phases was 0.11 m/s, 0.11 m/s, and 0.16 m/s, respectively, suggesting that the occurrence and duration of fluid mud during late ebb phases may be enhanced by stronger waves, primarily driven by offshore winds (Table 4).
The cross-shore downslope movement of fluid mud as gravity flows during high slack tide phases has been predicted using a theoretical model and validated by measurements of an anomalous offshore-directed weak current jet at 0.1 m above the bottom (mab) (Table 2, ug and Ucross-shore). The predicted gravity flow velocity (Table 2) and measured bottom cross-shore velocity are within a few centimeters of each other, consistent with observed and predicted results from a site 5 km east of our tripod (Yu et al., 2024) and similar continental shelves (Yu et al., 2017; Liu et al., 2022; Tang et al., 2023). The predicted mean gravity flow velocity is 0.11 m/s, while the measured mean bottom cross-shore velocity at 0.1 mab is 0.093 m/s, reflecting the typical gravity flow speed during high slack tide at this location (Table 2). However, no direct evidence of gravity flows was observed between early flood and late ebb phases due to the height of the near-bed ADV as previously mentioned. During early flood fluid mud events, the measured cross-shore current at 0.1 mab was onshore-directed rather than offshore-directed (Table 3), with a predicted mean gravity flow velocity (ug) of 0.074 m/s. For late ebb phases, the mean gravity flow velocity (ug) is 0.083 m/s (Table 4), while the measured mean offshore-directed current was 0.13 m/s at 0.1 mab, which did not capture the fluid mud movement accurately. Notably, Yu et al. (2024) conducted a synchronized field measurement with two tripods in a subtidal area to the east of our site in August 2018. Their results indicated that fluid mud could move downslope at 0.1 m/s with a gentler coastal slope of 0.0008 during low tidal slack phases. In comparison, our observation site D1 had a steeper slope, finer seabed sediment, and higher near-bed sediment concentration (Figure 7; Tables 3, 4), which contributes to a greater gravitational force promoting downslope movement. Gravity flows during early flood phases may be weakened by flood tides and favored by ebb tides due to differences in gravitational speed and duration (Tables 3, 4). Additionally, our study supports the hypothesis by Yu et al. (2024) that intertidal gravity flows can transport significant sediment downslope into subtidal areas during high slack tide, substantially influencing coastal sediment transport processes.
6 Conclusions
Field observations were conducted at the lower intertidal mudflat on the central Jiangsu coast, China, focusing on fluid mud events and sediment gravity flow that occurred following medium wave activity with a maximum significant wave height of 0.49 m. These events were characterized by a liquefied seabed, high sediment concentrations, and short durations.
During continuous wave activity, the liquefied seabed entrained substantial amounts of fine sediment, with the maximum erosion rate reaching 0.047 mm/min, accompanied by the refinement of surficial sediment. Fluid mud events were observed during high slack tide, early flood, and late ebb phases, featuring a thin high-concentration layer (4–20 cm) with mean sediment concentrations exceeding 10 g/L and short durations (< 3.5 h). Turbulence generated by waves and currents can sustain fluid mud when near-bed TKE is below the threshold of 0.00045 m²/s² but may disrupt the fluid mud if TKE exceeds this threshold. Additionally, onshore winds favor fluid mud events during early flood phases, whereas offshore winds are more conducive during late ebb phases.
The downslope movement of fluid mud in the form of sediment gravity flow was predicted using a theoretical model and validated by measurements of anomalous near-bed, offshore-directed weak current jets. Typical gravity flow velocities at our observation site are 0.093 m/s, 0.074 m/s, and 0.083 m/s for high slack tide, early flood, and late ebb phases, respectively. These are crucial parameters for geomorphic modeling. Overall, this study enhances the understanding of wave- and current-supported fluid mud dynamics in intertidal mudflat areas.
Data availability statement
The original contributions presented in the study are included in the article/supplementary material. Further inquiries can be directed to the corresponding authors.
Author contributions
ML: Investigation, Methodology, Validation, Writing – review & editing, Data curation, Formal analysis, Visualization, Writing – original draft. DC: Data curation, Formal analysis, Methodology, Validation, Writing – review & editing. HW: Formal analysis, Methodology, Validation, Writing – review & editing, Conceptualization, Investigation. JT: Formal analysis, Methodology, Validation, Writing – review & editing, Data curation. YZ: Data curation, Formal analysis, Writing – review & editing, Conceptualization. FL: Data curation, Writing – review & editing, Investigation. FG: Data curation, Investigation, Writing – review & editing. XG: Investigation, Writing – review & editing, Resources. YW: Investigation, Resources, Writing – review & editing, Conceptualization, Funding acquisition, Methodology, Project administration, Supervision, Validation.
Funding
The author(s) declare financial support was received for the research, authorship, and/or publication of this article. This work was supported by Jiangsu Special Program for Ocean Science and Technology Innovation (JSZRHYKJ202106) and Special Fund Project for Natural Resource Development of Jiangsu Province (2021046).
Acknowledgments
The authors thank Tingfei Lan, Jilian Xiong, Zhenhai Lv, Yuanjian Sun for their assistance in the field works and laboratory analysis.
Conflict of interest
The authors declare that the research was conducted in the absence of any commercial or financial relationships that could be construed as a potential conflict of interest.
Publisher’s note
All claims expressed in this article are solely those of the authors and do not necessarily represent those of their affiliated organizations, or those of the publisher, the editors and the reviewers. Any product that may be evaluated in this article, or claim that may be made by its manufacturer, is not guaranteed or endorsed by the publisher.
References
Aldridge J. N., Rees J. M. (1997). Interpreting observations of near-bed sediment concentration and estimation of 'pick-up' function constants (Chichester: John Wiley & Sons Limited), 458.
Aleebrahim M. A., Jamali M. (2023). Laboratory study of instability-driven mixing of fluid mud under surface wave motion. Phys. Fluids 35, 086606. doi: 10.1063/5.0158865
Andersen T. J., Pejrup M., Nielsen A. A. (2006). Long-term and high-resolution measurements of bed level changes in a temperate, microtidal coastal lagoon. Mar. Geol. 226, 115–125. doi: 10.1016/j.margeo.2005.09.016
Becker M., Maushake C., Winter C. (2018). Observations of mud-induced periodic stratification in a hyperturbid estuary. Geophysical Res. Lett. 45 (11), 5461–5469. doi: 10.1029/2018GL077966
Billings W. Z., Simeonov J., Calantoni J. (2023). Evaluating a poroelastic model via pore pressure signals in seafloor sediments. J. Geophys. Res.: Oceans 128, e2023JC019799. doi: 10.1029/2023JC019799
Bricker J. D., Monismith S. G. (2007). Spectral wave-turbulence decomposition. J. Atmos. Ocean. Technol. 24, 1479–1487. doi: 10.1175/JTECH2066.1
Chen D., Li M., Zhang Y., Zhang L., Tang J., Wu H., et al. (2020). Effects of diatoms on erosion and accretion processes in saltmarsh inferred from field observations of hydrodynamic and sedimentary processes. Ecohydrology 13, e2246. doi: 10.1002/eco.2246
Christie M. C., Dyer K. R., Turner P. (1999). Sediment flux and bed level measurements from a macro tidal mudflat. Estuarine Coast. Shelf Sci. 49, 667–688. doi: 10.1006/ecss.1999.0525
Collins M. B., Ke X., Gao S. (1998). Tidally-induced flow structure over intertidal flats. Estuarine Coast. Shelf Sci. 46, 233–250. doi: 10.1006/ecss.1997.0260
De Wit P. J., Kranenburg C. (1997). The wave-induced liquefaction of cohesive sediment beds. Estuarine Coast. Shelf Sci. 45, 261–271. doi: 10.1006/ecss.1996.0184
Dong J., Xu J., Li G., Li A., Zhang S., Niu J., et al. (2022). Experimental study on silty seabed liquefaction and its impact on sediment resuspension by random waves. J. Mar. Sci. Eng. 10, 437. doi: 10.3390/jmse10030437
Flores R. P., Rijnsburger S., Meirelles S., Horner-Devine A. R., Souza A. J., Pietrzak J. D., et al. (2018). Wave generation of gravity-driven sediment flows on a predominantly sandy seabed. Geophys. Res. Lett. 45, 7634–7645. doi: 10.1029/2018GL077936
Foda M. A., Hill D. F., DeNeale P. L., Huang C. M. (1997). Fluidization response of sediment bed to rapidly falling water surface. J. Waterway Port Coastal Ocean Eng. 123 (5), 261–265. doi: 10.1061/(ASCE)0733-950X(1997)123:5(261
Friedrichs C. T., Scully M. E. (2007). Modeling deposition by wave-supported gravity flows on the po river prodelta: from seasonal floods to prograding clinoforms. Continental Shelf Res. 27 (3-4), 322–337. doi: 10.1016/j.csr.2006.11.002
Friedrichs C. T., Wright L. D. (2004). Gravity-driven sediment transport on the continental shelf: implications for equilibrium profiles near river mouths. Coast. Eng. 51, 795–811. doi: 10.1016/j.coastaleng.2004.07.010
Gabioux M., Vinzon S. B., Paiva A. M. (2005). Tidal propagation over fluid mud layers on the Amazon shelf. Continent. Shelf Res. 25, 113–125. doi: 10.1016/j.csr.2004.09.001
Gao Y., Yan W. L., Li B., Zhao B., Li P., Li Z. B., et al. (2014). The substantial influences of non-resource conditions on recovery of plants: A case study of clipped spartina alterniflora asphyxiated by submergence. Ecol. Eng. 73, 345–352. doi: 10.1016/j.ecoleng.2014.09.051
Ge J., Chen C., Wang Z. B., Ke K., Yi J., Ding P. (2020). Dynamic response of the fluid mud to a tropical storm. J. Geophys. Res.: Oceans 125, e2019JC015419. doi: 10.1029/2019JC015419
Goh G. A., Noh Y. (2013). Mixed layer deepening due to wind-induced shear-driven turbulence. Ocean Dynam. 63, 569–582. doi: 10.1007/s10236-013-0645-x
Gordon L., Nylund S., Lohrmann A. (2001). “Test results with the EasyQ RIVER flow sensor,” in Building partnerships, 1–7. doi: 10.1061/40517(2000)322
Gouleau D., Jouanneau J. M., Weber O., Sauriau P. G. (2000). Short-and long-term sedimentation on Montportail-Brouage intertidal mudflat, Marennes-Oleron Bay (France). Continent. Shelf Res. 20, 1513–1530. doi: 10.1016/S0278-4343(00)00035-2
Green M. O., Coco G. (2014). Review of wave-driven sediment resuspension and transport in estuaries. Rev. Geophysics 52 (1), 77–117. doi: 10.1002/2013RG000437
Guan W. B., Kot S. C., Wolanski E. (2005). 3-D fluid-mud dynamics in the Jiaojiang Estuary, China. Estuarine Coast. Shelf Sci. 65, 747–762. doi: 10.1016/j.ecss.2005.05.017
Guy Plint A. (2014). Mud dispersal across a Cretaceous prodelta: storm-generated, wave-enhanced sediment gravity flows inferred from mudstone microtexture and microfacies. Sedimentology 6, 609–647. doi: 10.1111/sed.12068
Habermann C., Wurpts A. (2008). “Occurrence, behaviour and physical properties of fluid mud,” in Proceedings des Chinese-German Joint Symposium on Hydraulic and Ocean Engineering (JOINT2008), Darmstadt.
Hale R. P., Ogston A. S. (2015). In situ observations of wave-supported fluid-mud generation and deposition on an active continental margin. J. Geophys. Res.: Earth Surf. 120, 2357–2373. doi: 10.1002/2015JF003630
Hsu T. J., Traykovski P. A., Kineke G. C. (2007). On modeling boundary layer and gravity-driven fluid mud transport. J. Geophys. Res.: Oceans 112, C04011. doi: 10.1029/2006JC003719
Ichaso A. A., Dalrymple R. W. (2009). Tide-and wave-generated fluid mud deposits in the Tilje Formation (Jurassic), offshore Norway. Geology 37, 539–542. doi: 10.1130/G25481A.1
Jaramillo S., Sheremet A., Allison M. A., Reed A. H., Holland K. T. (2009). Wave-mud interactions over the muddy Atchafalaya subaqueous clinoform, Louisiana, United States: Wave-supported sediment transport. J. Geophys. Res.: Oceans 114. doi: 10.1029/2008JC004821
Jeng D. S., Wang X., Tsai C. C. (2020). Meshless model for wave-induced oscillatory seabed response around a submerged breakwater due to regular and irregular wave loading. J. Mar. Sci. Eng. 9, 15. doi: 10.3390/jmse9010015
Jia J., Wang Y., Gao S., Wang A., Li Z. (2006). Interpreting grain-size trends associated with bedload transport on the intertidal flats at Dafeng, central Jiangsu coast. Chin. Sci. Bull. 51, 341–351. doi: 10.1007/s11434-006-0341-z
Jia Y., Zhang L., Zheng J., Liu X., Jeng D. S., Shan H. (2014). Effects of wave-induced seabed liquefaction on sediment re-suspension in the Yellow River Delta. Ocean Eng. 89, 146–156. doi: 10.1016/j.oceaneng.2014.08.004
Kineke G. C., Sternberg R. W. (1992). Measurements of high concentration suspended sediments using the optical backscatterance sensor. Mar. Geol. 108, 253–258. doi: 10.1016/0025-3227(92)90199-R
Kineke G. C., Sternberg R. W., Trowbridge J. H., Geyer W. R. (1996). Fluid-mud processes on the Amazon continental shelf. Continent. shelf Res. 16, 667–696. doi: 10.1016/0278-4343(95)00050-X
Klammler H., Penko A. M., Staples T., Sheremet A., Calantoni J. (2021). Observations and modeling of wave-induced burial and sediment entrainment: Likely importance of degree of liquefaction. J. Geophys. Res.: Oceans 126, e2021JC017378. doi: 10.1029/2021JC017378
Klammler H., Sheremet A., Calantoni J. (2020). Seafloor burial of surrogate UXO by wave-induced sediment instability. IEEE J. Ocean. Eng. 45, 927–936. doi: 10.1109/JOE.2019.2919356
Knoch D., Malcherek A. (2011). A numerical model for simulation of fluid mud with different rheological behaviors. Ocean Dynam. 61, 245–256. doi: 10.1007/s10236-010-0327-x
Krim A., Arab A., Chemam M., Brahim A., Sadek M., Shahrour I. (2019). Experimental study on the liquefaction resistance of sand-clay mixtures: Effect of clay content and grading characteristics. Mar. Geores. Geotechnol. 37, 129–141. doi: 10.1080/1064119X.2017.1407974
Lambrechts J., Humphrey C., McKinna L., Gourge O., Fabricius K. E., Mehta A. J., et al. (2010). Importance of wave-induced bed liquefaction in the fine sediment budget of cleveland bay, great barrier reef. Estuarine Coast. Shelf Sci. 89 (2), 154–162. doi: 10.1016/j.ecss.2010.06.009
Liu X. L., Jia Y. G., Zheng J. W., Hou W., Zhang L., Zhang L. P., et al. (2013). Experimental evidence of wave-induced inhomogeneity in the strength of silty seabed sediments: Yellow river delta, china. Ocean Eng. 59, 120–128. doi: 10.1016/j.oceaneng.2012.12.003
Liu X., Lu Y., Yu H., Ma L., Li X., Li W., et al. (2022). In-situ observation of storm-induced wave-supported fluid mud occurrence in the subaqueous yellow river delta. J. Geophysical Research: Oceans 127 (7), e2021JC018190. doi: 10.1029/2021JC018190
Liu X., Zhang M., Zhang H., Jia Y., Zhu C., Shan H. (2017). Physical and mechanical properties of loess discharged from the yellow river into the bohai sea, china. Eng. Geology 227, 4–11. doi: 10.1016/j.enggeo.2017.04.019
MacVean L. J., Lacy J. R. (2014). Interactions between waves, sediment, and turbulence on a shallow estuarine mudflat. J. Geophys. Res.: Oceans 119, 1534–1553. doi: 10.1002/2013JC009477
McAnally W. H., Friedrichs C., Hamilton D., Hayter E., Shrestha P., Rodriguez H., et al (2007a). Management of fluid mud in estuaries, bays, and lakes. I: Present stateof understanding on character and behavior. J. Hydraul. Eng. 133, 9–22. doi: 10.1061/(ASCE)0733-9429(2007)133:1(9
McAnally W. H., Teeter A., Schoellhamer D., Friedrichs C., Hamilton D., Hayter E., et al. (2007b). Management of fluid mud in estuaries, bays, and lakes. II: Measurement, modeling, and management. J. Hydraul. Eng. 133, 23–38. doi: 10.1061/(ASCE)0733-9429(2007)133:1(23
Mehta A. J. (1991). Understanding fluid mud in a dynamic environment. Geo-Marine Lett. 11, 113–118. doi: 10.1007/BF02430995
Mehta D., Belemkar S. (2014). Pharmacological activity of spinacia oleracea linn. Asian J. Pharm. Res. Dev. 2 (1), 32–35. https://ajprd.com/index.php/journal/article/view/229.
Monkul M. M., Gültekin C., Gülver M., Akın Ö., Eseller-Bayat E. (2015). Estimation of liquefaction potential from dry and saturated sandy soils under drained constant volume cyclic simple shear loading. Soil Dynam. Earthquake Eng. 75, 27–36. doi: 10.1016/j.soildyn.2015.03.019
Ni W., Wang Y. P., Symonds A. M., Collins M. B. (2014). Intertidal flat development in response to controlled embankment retreat: Freiston shore, the wash, UK. Mar. Geology 355, 260–273. doi: 10.1016/j.margeo.2014.06.001
Nishida N., Ito M., Inoue A., Takizawa S. (2013). Clay fabric of fluid-mud deposits from laboratory and field observations: Potential application to the stratigraphic record. Mar. Geol. 337, 1–8. doi: 10.1016/j.margeo.2012.12.006
Niu J., Xie J., Lin S., Lin P., Gao F., Zhang J., et al. (2023). Importance of bed liquefaction-induced erosion during the winter wind storm in the yellow river delta, China. J. Geophys. Res.: Oceans 128, e2022JC019256. doi: 10.1029/2022JC019256
Niu J., Xu J., Li G., Dong P., Shi J., Qiao L. (2020). Swell-dominated sediment re-suspension in a silty coastal seabed. Estuarine Coast. Shelf Sci. 242, 106845. doi: 10.1016/j.ecss.2020.106845
Odd N. V., Bentley M. A., Waters C. B. (1993). Observations and analysis of the movement of fluid mud in an estuary. Nearshore Estuar. cohesive sediment transport 42, 430–446. doi: 10.1029/CE042p0430
Parsons J. D., Whipple K. X., Simoni A. (2001). Experimental study of the grain-flow, fluid-mud transition in debris flows. J. Geol. 109, 427–447. doi: 10.1086/320798
Postacchini M., Manning A. J., Calantoni J., Smith J. P., Brocchini M. (2023). A storm driven turbidity maximum in a microtidal estuary. Estuarine Coast. Shelf Sci. 288, 108350. doi: 10.1016/j.ecss.2023.108350
Puig P., Ogston A. S., Mullenbach B. L., Nittrouer C. A., Parsons J. D., Sternberg R. W. (2004). Storm-induced sediment gravity flows at the head of the Eel submarine canyon, northern California margin. J. Geophys. Res.: Oceans 109, C03019. doi: 10.1029/2003JC001918
Ren M. E., Shi Y. L. (1986). Sediment discharge of the Yellow River (China) and its effect on the sedimentation of the Bohai and the Yellow Sea. Continent. Shelf Res. 6, 785–810. doi: 10.1016/0278-4343(86)90037-3
Rippeth T. P., Lincoln B. J., Simpson J. H., Williams E., Howarth M. J. (2004). The impact of wind on coastal boundary layer dynamics. J. Phys. Oceanogr. 34, 1152–1171. doi: 10.1175/1520-0485(2004)034<1152>2
Ross M. A., Mehta A. J. (1989). On the mechanics of lutoclines and fluid mud. J. Coast. Res. S5, 51–62.
Scully M. E., Friedrichs C. T., Wright L. D. (2003). Numerical modeling of gravity-driven sediment transport and deposition on an energetic continental shelf: Eel River, northern California. J. Geophys. Res.: Oceans 108, 3120. doi: 10.1029/2002JC001467
Sheremet A., Jaramillo S., Su S. F., Allison M. A., Holland K. T. (2011). Wave-mud interaction over the muddy Atchafalaya subaqueous clinoform, Louisiana, United States: Wave processes. J. Geophys. Res.: Oceans 116, C06005. doi: 10.1029/2010JC006644
Shi Z. (1998). Acoustic observations of fluid mud and interfacial waves, Hangzhou Bay, China. J. Coast. Res. 14 (4), 1348–1353.
Shi B., Wang Y. P., Du X., Cooper J. R., Li P., Li M. L., et al. (2016). Field and theoretical investigation of sediment mass fluxes on an accretional coastal mudflat. J. hydro-environ. Res. 11, 75–90. doi: 10.1016/j.jher.2016.01.002
Sobey R. J., Hughes S. A. (1999). A locally nonlinear interpretation of PUV measurements. Coast. Eng. 36 (1), 17–36. doi: 10.1016/S0378-3839(98)00047-7
Soulsby R. L., Dyer K. R. (1981). The form of the near-bed velocity profile in a tidally accelerating flow. J. Geophys. Res.: Oceans 86, 8067–8074. doi: 10.1029/JC086iC09p08067
Soulsby R. L., Whitehouse R. J. (1997). “Threshold of sediment motion in coastal environments,” in Pacific Coasts and Ports' 97: Proceedings of the 13th Australasian Coastal and Ocean Engineering Conference and the 6th Australasian Port and Harbour Conference (Christchurch, NZ: Centre for Advanced Engineering, University of Canterbury) 1, 145–150.
Souza A. J., Alvarez L. G., Dickey T. D. (2004). Tidally induced turbulence and suspended sediment. Geophysical Res. Lett. 31 (20). doi: 10.1029/2004GL021186
Tang J., Wu H., Xing F., Zhang F., Tang B., Li G., et al. (2023). Formation and transport of fluid mud triggered by typhoon events in front of the subaqueous Changjiang Delta. Mar. Geol. 460, 107052. doi: 10.1016/j.margeo.2023.107052
Thomas L. N. (2008). Friction, frontogenesis, and the stratification of the surface mixed layer. J. Phys. Oceanogr. 38, 2478–2500. doi: 10.1175/2008JPO3942.1
Traykovski P., Geyer W. R., Irish J. D., Lynch J. F. (2000). The role of wave-induced density-driven fluid mud flows for cross-shelf transport on the Eel River continental shelf. Continent. Shelf Res. 20, 2113–2140. doi: 10.1016/S0278-4343(00)00071-6
Traykovski P., Trowbridge J., Kineke G. (2015). Mechanisms of surface wave energy dissipation over a high-concentration sediment suspension. J. Geophysical Research: Oceans 120 (3), 1638–1681. doi: 10.1002/2014JC010245
Traykovski P., Wiberg P. L., Geyer W. R. (2007). Observations and modeling of wave-supported sediment gravity flows on the po prodelta and comparison to prior observations from the eel shelf. Continental Shelf Res. 27 (3-4), 375–399. doi: 10.1016/j.csr.2005.07.008
Trowbridge J. H., Traykovski P. (2015). Coupled dynamics of interfacial waves and bed forms in fluid muds over erodible seabeds in oscillatory flows. J. Geophysical Research: Oceans 120 (8), 5698–5709. doi: 10.1002/2015JC010872
Tzang S. Y., Chen Y. L., Ou S. H. (2011). Experimental investigations on developments of velocity field near above a sandy bed during regular wave-induced fluidized responses. Ocean Eng. 38 (7), 868–877. doi: 10.1016/j.oceaneng.2010.10.015
Uncles R. J., Stephens J. A., Law D. J. (2006). Turbidity maximum in the macrotidal, highly turbid Humber Estuary, UK: Flocs, fluid mud, stationary suspensions and tidal bores. Estuarine Coast. Shelf Sci. 67, 30–52. doi: 10.1016/j.ecss.2005.10.013
Wallmann K., Drews M., Aloisi G., Bohrmann G. (2006). Methane discharge into the Black Sea and the global ocean via fluid flow through submarine mud volcanoes. Earth Planet. Sci. Lett. 248, 545–560. doi: 10.1016/j.epsl.2006.06.026
Wan Y., Roelvink D., Li W., Qi D., Gu F. (2014). Observation and modeling of the storm-induced fluid mud dynamics in a muddy-estuarine navigational channel. Geomorphology 217, 23–36. doi: 10.1016/j.geomorph.2014.03.050
Wang Y. P., Gao S., Jia J., Thompson C. E., Gao J., Yang Y. (2012). Sediment transport over an accretional intertidal flat with influences of reclamation, Jiangsu coast, China. Mar. Geol. 291, 147–161. doi: 10.1016/j.margeo.2011.01.004
Wang X., Ke X. (1997). Grain-size characteristics of the extant tidal flat sediments along the Jiangsu coast, China. Sediment. Geol. 112, 105–122. doi: 10.1016/S0037-0738(97)00026-2
Wang Y., Wang Y. P., Yu Q., Du Z., Wang Z. B., Gao S. (2019). Sand-mud tidal flat morphodynamics influenced by alongshore tidal currents. J. Geophys. Res.: Oceans 124, 3818–3836. doi: 10.1029/2018JC014550
Wells J. T. (1983). Dynamics of coastal fluid muds in low-, moderate-, and high-tide-range environments. Can. J. Fish. Aquat. Sci. 40, s130–s142. doi: 10.1139/f83-276
Wiberg P. L., Sherwood C. R. (2008). Calculating wave-generated bottom orbital velocities from surface-wave parameters. Comput. Geosci. 34, 1243–1262. doi: 10.1016/j.cageo.2008.02.010
Winterwerp J. C. (1999). On the dynamics of high-concentrated mud suspensions. communications on hydraulic and geotechnical engineering (Netherlands: Delft University of Technology).
Winterwerp J. C., Kranenburg C. (1997). Erosion of fluid mud layers. II: Experiments and model validation. J. Hydraulic Eng. 123 (6), 512–519. doi: 10.1061/(ASCE)0733-9429(1997)123:6(512
Wolanski E., Drew E., Abel K. M., O'Brien J. (1988). Tidal jets, nutrient upwelling and their influence on the productivity of the alga Halimeda in the Ribbon Reefs, Great Barrier Reef. Estuarine Coast. Shelf Sci. 26, 169–201. doi: 10.1016/0272-7714(88)90049-2
Wolanski E., Gibbs R. J., Mazda Y., Mehta A., King B. (1992). The role of turbulence in the settling of mud flocs. J. Coast. Res. 8 (1), 35–46. doi: 10.1016/S0272-7714(05)80026-5
Wright L. D., Friedrichs C. T. (2006). Gravity-driven sediment transport on continental shelves: A status report. Continent. Shelf Res. 26, 2092–2107. doi: 10.1016/j.csr.2006.07.008
Wright L. D., Friedrichs C. T., Kim S. C., Scully M. E. (2001). Effects of ambient currents and waves on gravity-driven sediment transport on continental shelves. Mar. Geol. 175, 25–45. doi: 10.1016/S0025-3227(01)00140-2
Wu H., Wang Y. P., Gao S., Xing F., Tang J., Chen D. (2022). Fluid mud dynamics in a tide-dominated estuary: A case study from the Yangtze River. Continent. Shelf Res. 232, 104623. doi: 10.1016/j.csr.2021.104623
Wu H., Tang J., Li W., Xing F., Yang H., Zhang F., et al. (2023). Fluid mud induced by periodic tidal advection and fine-grained sediment settling in the yangtze estuary. Front. Mar. Sci. 10. doi: 10.3389/fmars.2023.1323692
Xing F., Wang Y. P., Wang H. V. (2012). Tidal hydrodynamics and fine-grained sediment transport on the radial sand ridge system in the southern Yellow Sea. Mar. geol. 291, 192–210. doi: 10.1016/j.margeo.2011.06.006
Xiong J., Wang Y. P., Gao S., Du J., Yang Y., Tang J., et al. (2018). On estimation of coastal wave parameters and wave-induced shear stresses. Limnol. Oceanogr.: Methods 16, 594–606. doi: 10.1002/lom3.10271
Xiong J., Wang X. H., Wang Y. P., Chen J., Shi B., Gao J., et al. (2017). Mechanisms of maintaining high suspended sediment concentration over tide-dominated offshore shoals in the southern Yellow Sea. Estuarine Coast. Shelf Sci. 191, 221–233. doi: 10.1016/j.ecss.2017.04.023
Xu C., Chen Y., Pan Y., Yu L. (2020). The effects of flocculation on the entrainment of fluid mud layer. Estuarine Coast. Shelf Sci. 240, 106784. doi: 10.1016/j.ecss.2020.106784
Yang L. J., Qi W. G., Li Y., Gao F. P. (2023). Wave-current coupling effects on the variation modes of pore pressure response in a sandy seabed: physical modeling and explicit approximations. J. Geophys. Res.: Oceans 128, e2022JC019158. doi: 10.1029/2022JC019158
Yang Y., Wang Y. P., Gao S., Wang X. H., Shi B. W., Zhou L., et al. (2016). Sediment resuspension in tidally dominated coastal environments: new insights into the threshold for initial movement. Ocean Dynam. 66, 401–417. doi: 10.1007/s10236-016-0930-6
Yang W. C. (1982). Surf zone properties and on/offshore sediment transport (University of Delaware).
Yu Q., Peng Y., Du Z., Wang L., Wang Y., Gao S. (2024). Movement of sediments across a gently sloping muddy coast: Wave‐and current‐supported gravity flows. Earth Surf. Process. Landforms 49, 1590–1605. doi: 10.1002/esp.5788
Yu Q., Wang Y., Shi B., Wang Y. P., Gao S. (2017). Physical and sedimentary processes on the tidal flat of central Jiangsu Coast, China: Headland induced tidal eddies and benthic fluid mud layers. Continent. Shelf Res. 133, 26–36. doi: 10.1016/j.csr.2016.12.015
Zhang Q., Gong Z., Zhang C., Jin C., Li H. (2014). “Near-bed Velocity Profile and Friction Characteristic of Tide-induced Bottom Boundary Layers on the Mudflats of Jiangsu coast, China,” in The Eleventh ISOPE Pacific/Asia Offshore Mechanics Symposium (Shanghai, China: ISOPE).
Zhang S., Jia Y., Wang Z., Wen M., Lu F., Zhang Y., et al. (2018). Wave flume experiments on the contribution of seabed fluidization to sediment resuspension. Acta Oceanol. Sin. 37, 80–87. doi: 10.1007/s13131-018-1143-2
Zhang J., Jiang Q., Jeng D., Zhang C., Chen X., Wang L. (2020). Experimental study on mechanism of wave-induced liquefaction of sand-clay seabed. J. Mar. Sci. Eng. 8, 66. doi: 10.3390/jmse8020066
Zhang H., Lu Y., Liu X., Li X., Wang Z., Ji C., et al. (2023). Morphology and origin of liquefaction-related sediment failures on the Yellow River subaqueous delta. Mar. Petrol. Geol. 153, 106262. doi: 10.1016/j.marpetgeo.2023.106262
Zhang R. S. (1992). Suspended sediment transport processes on tidal mud flat in Jiangsu Province, China. Estuarine Coast. Shelf Sci. 35 (3), 225–233. doi: 10.1016/S0272-7714(05)80045-9
Keywords: fluid mud, liquefaction, buoyancy-friction model, intertidal flat, Jiangsu coast, gravity flows
Citation: Li M, Chen D, Wu H, Tang J, Zhang Y, Luo F, Gou F, Gong X and Wang YP (2024) In-situ observations of wave- and current-supported fluid mud dynamics on a hyperturbid macrotidal mudflat. Front. Mar. Sci. 11:1459899. doi: 10.3389/fmars.2024.1459899
Received: 05 July 2024; Accepted: 29 July 2024;
Published: 22 August 2024.
Edited by:
Li Li, Zhejiang University, ChinaCopyright © 2024 Li, Chen, Wu, Tang, Zhang, Luo, Gou, Gong and Wang. This is an open-access article distributed under the terms of the Creative Commons Attribution License (CC BY). The use, distribution or reproduction in other forums is permitted, provided the original author(s) and the copyright owner(s) are credited and that the original publication in this journal is cited, in accordance with accepted academic practice. No use, distribution or reproduction is permitted which does not comply with these terms.
*Correspondence: Ya Ping Wang, eXB3YW5nQG5qdS5lZHUuY24=; Hao Wu, aGFvd3UuZXN4QGZveG1haWwuY29t