- 1School of Hydraulic Engineering, Ludong University of China, Yantai, China
- 2Institute of Coastal Research, Ludong University of China, Yantai, China
- 3Yantai Kekan Marine Technology Co., Ltd., Yantai, China
- 4College of Transportation Engineering, Dalian Maritime University of China, Dalian, China
Laizhou Bay’s coastline has undergone multiple alterations due to human activities such as land reclamation and port construction. These changes in the coastline have led to modifications in the bay’s hydrodynamic conditions, which, in turn, can impact the marine environment and potentially result in a decline in biodiversity. To date, there has been no comprehensive study focusing on the coastline changes and hydrodynamic variations in Laizhou Bay. Therefore, this study utilizes coastline and water depth data from four time points—1990, 2003, 2013, and 2023—to establish a two-dimensional tidal current model of Laizhou Bay using Delft3D. Based on the good agreement between the simulated tidal current results and the observed data, this study further investigates the changes in tidal prism and water exchange in Laizhou Bay. The results indicate that tidal currents dominate the bay, with significant influences of topographic changes on the velocity and direction of tidal flows. The Eulerian residual current velocity is substantially lower than the tidal current velocity. Both tidal and residual currents play a role in controlling the distribution of materials within Laizhou Bay. Over the past three decades (1990-2023), the tidal prism in Laizhou Bay has shown a downward trend, with the tidal prism during spring, intermediate, and neap tides in 2023 reduced by 2.03%, 6.36%, and 10.19%, respectively, compared to 1990. The water exchange capacity has also weakened, with the half-exchange time being 71 days in 1990, increasing to 73 days in 2003 and 81 days in 2013, and showing a slight increase of 1 day in 2023 compared to 2013. Thus, changes in the coastline and water depth of Laizhou Bay can alter its hydrodynamic conditions, significantly impacting the tidal prism and water exchange, leading to a decrease in tidal prism and exchange rate, an increase in the water exchange period, a slower dispersion rate of pollutants, and a reduced water environmental carrying capacity. This research provides a scientific reference for protecting the marine environment and coastal management in Laizhou Bay.
1 Introduction
Bays, as crucial geographical units at the interface between the ocean and land, play a significant role in human maritime development activities (Lu et al., 2022). With rapid economic growth, the intensity of marine economic construction has increased, leading to numerous land reclamation projects along coastal regions, which in turn alter the morphology of coastlines (Zhao and Sun, 2013). Influenced by human activities and natural factors, the hydrological characteristics of bays also change accordingly (Tian et al., 2023). Scholars both domestically and internationally have conducted extensive research on various typical bays around the world. Benoa Bay is located at the southern tip of Bali. Wisha et al. (2018) studied the response of the bay’s flow field to changes in the coastline by developing a hydrodynamic model spanning from 1995 to 2016. Jakarta Bay, located in the northwest of Java Island and characterized as a shallow bay, Ihsan (2020) used wind, tidal, depth, and coastline data to establish a hydrodynamic model, simulating changes in hydrodynamics before and after bay infilling. Rusdiansyah et al. (2018) investigated the prospective impacts of a giant sea wall on the tidal dynamics, currents, and residual currents of Jakarta Bay. Sanmen Bay, located in Zhejiang, China. Huang et al. (2019) established a Delft3D-based numerical model with Sanmen Bay as the research subject, comparing changes in tidal prism and water exchange before and after land reclamation in the bay. Tongzhou Bay, situated in Jiangsu, China, Chen et al. (2023) utilized the MIKE21 hydrodynamic model to analyze the impact of human activities on the tidal fields and tidal prism of Tongzhou Bay. This study selects Laizhou Bay as the research subject to explore the impact of coastline and water depth changes on the hydrodynamic environment within the bay.
Laizhou Bay, is one of the three major bays of the Bohai Sea, in China (Xu Y. et al., 2021). Since the onset of the 21st century, intensive coastal resource development has led to significant changes in the coastline of Laizhou Bay (Deng et al., 2016). The transformation of the bay’s coastline has primarily occurred in the southwestern region and can be categorized into two phases. The first phase dates back to the 1970s when human activities gradually began, with salt fields and aquaculture embankments promoting economic development while altering the coastline’s morphology (Xu et al., 2023). The second phase occurred in the 1990s with the construction of major projects such as ports and docks, further altering the coastline, with Weifang and Guangli ports being particularly representative. The study of the hydrological characteristics of the bay can not only grasp the changing trend of the bay environment but also play a key role in maintaining the ecological balance of the sea area and giving full play to the self-purification mechanism of the ocean (Wang et al., 2009). Laizhou Bay Bay (Wang et al., 2021) is a typical semi-enclosed bay with a unique geographical location, and frequent coastal human activities, and is also often affected by natural disasters such as sea ice and cold surge tides. Thus, research on Laizhou Bay is of representative significance, and many scholars have conducted extensive studies using it as a research subject. Liu et al. (2020) utilized GIS and remote sensing technologies to determine that the dynamic changes in the coastline of Laizhou Bay were primarily caused by natural factors and human activities, with natural factors having a lesser impact. Huang et al. (2015) employed the MIKE31 model with four different coastline datasets to establish a hydrodynamic model for the Bohai Sea, analyzing and explaining the impact of coastline changes on the tidal system of the Bohai Sea. Jiang et al. (2015) simulated the impact of land reclamation projects constructed between 2003 and 2013 on the hydrodynamic environment of Laizhou Bay. Yu et al. (2022) studied the effects of marine development activities on the tidal prism and water exchange rates of Laizhou Bay using MIKE21 HD software.
Previous studies have mostly utilized coastline data from two characteristic years or data before and after engineering constructions to analyze the impact of coastline changes by comparing hydrodynamic variations. However, there are fewer studies on long-term timescales. Building on previous research, this study considers additional influencing factors, such as changes in underwater topography. Furthermore, prior studies rarely focused on coastline changes near the Yellow River estuary, where river course shifts and sediment deposition also affect the hydrodynamic environment of Laizhou Bay. Therefore, this study uses coastline and depth data from four different years between 1990 and 2023 to establish a hydrodynamic model. By incorporating tidal currents and Eulerian residual currents, we explore the impact of coastline changes and depth variations on tidal prism and water exchange in the bay, which has significant reference value for future coastal development, utilization, and protection.
2 Data and methods
2.1 Overview of the region
Due to its unique geographical location, abundant coastal resources, and the dense distribution of ports and salt fields, Laizhou Bay has significantly contributed to the economic development of surrounding cities (Gao et al., 2020). It also hosts multiple nature reserves and marine protected areas, making it a region of substantial ecological value and economic importance (Hou et al., 2016). The coastal mudflats of Laizhou Bay are extensive, and the water depths within the bay are relatively uniform. The deepest waters, reaching up to 22 m, are found near the high angle of Qiumu Island in the northeastern part of the bay, while most areas within the bay have depths of less than 10 m (Xu et al., 2013). Laizhou Bay is subject to a temperate monsoon climate, with significant variations in wind speed and direction throughout the year; the annual average wind speed is approximately 4 m/s, with September having the lowest wind speeds, averaging about 3 m/s, and April the highest, reaching average speeds of 5 m/s (Xu et al., 2023). The waves in Laizhou Bay are primarily wind-generated, characterized by rapid development and swift dissipation (Pelling et al., 2013; Gao et al., 2014). The tidal currents of Laizhou Bay are semi-diurnal, with Diaolongzui acting as the boundary line. To the west of this line, the tidal flow exhibits a regular semidiurnal pattern, while to the east, it is irregular (Zhu et al., 2018; Yang and Chui, 2017).
2.2 Coastline and water depth data
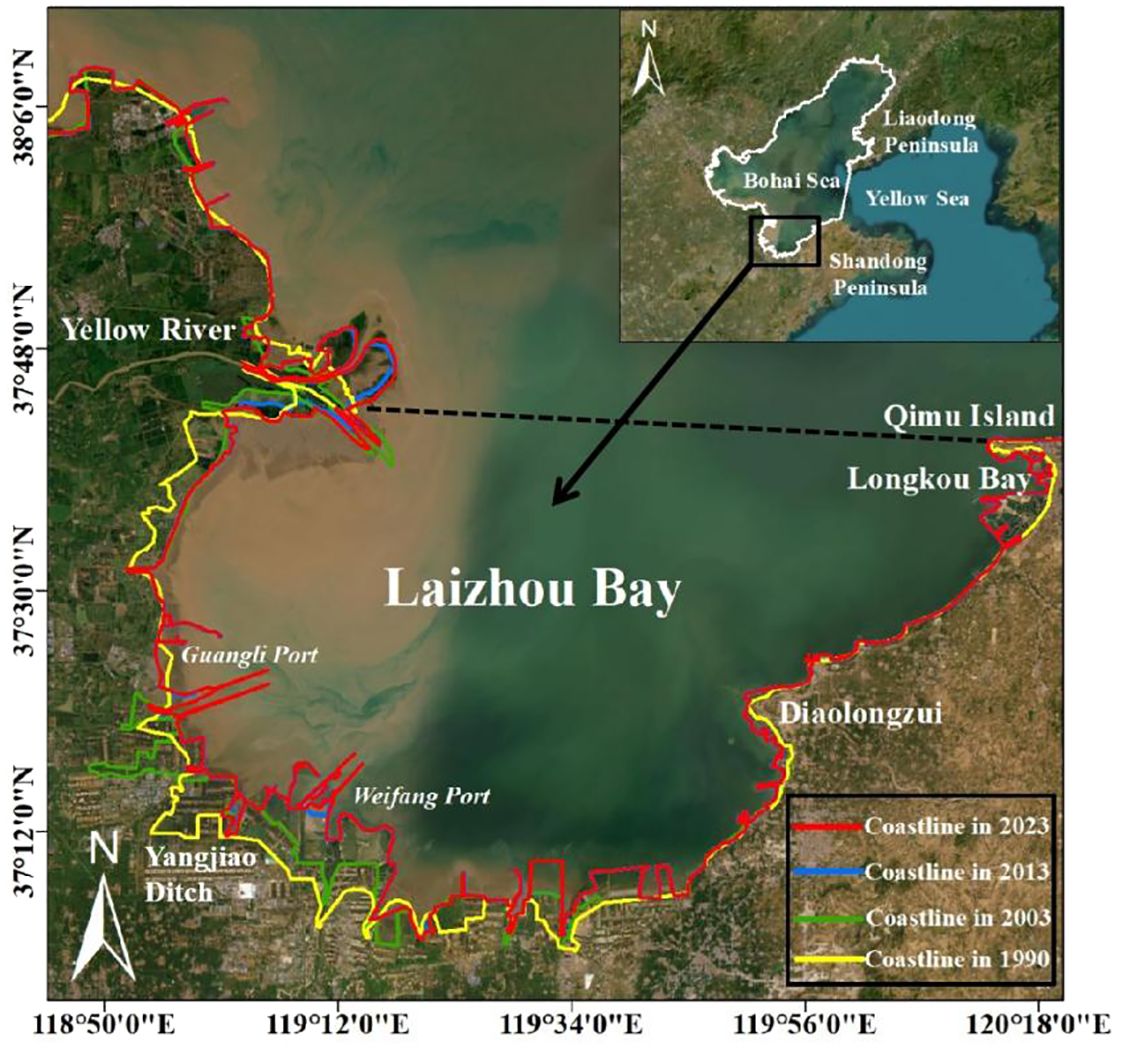
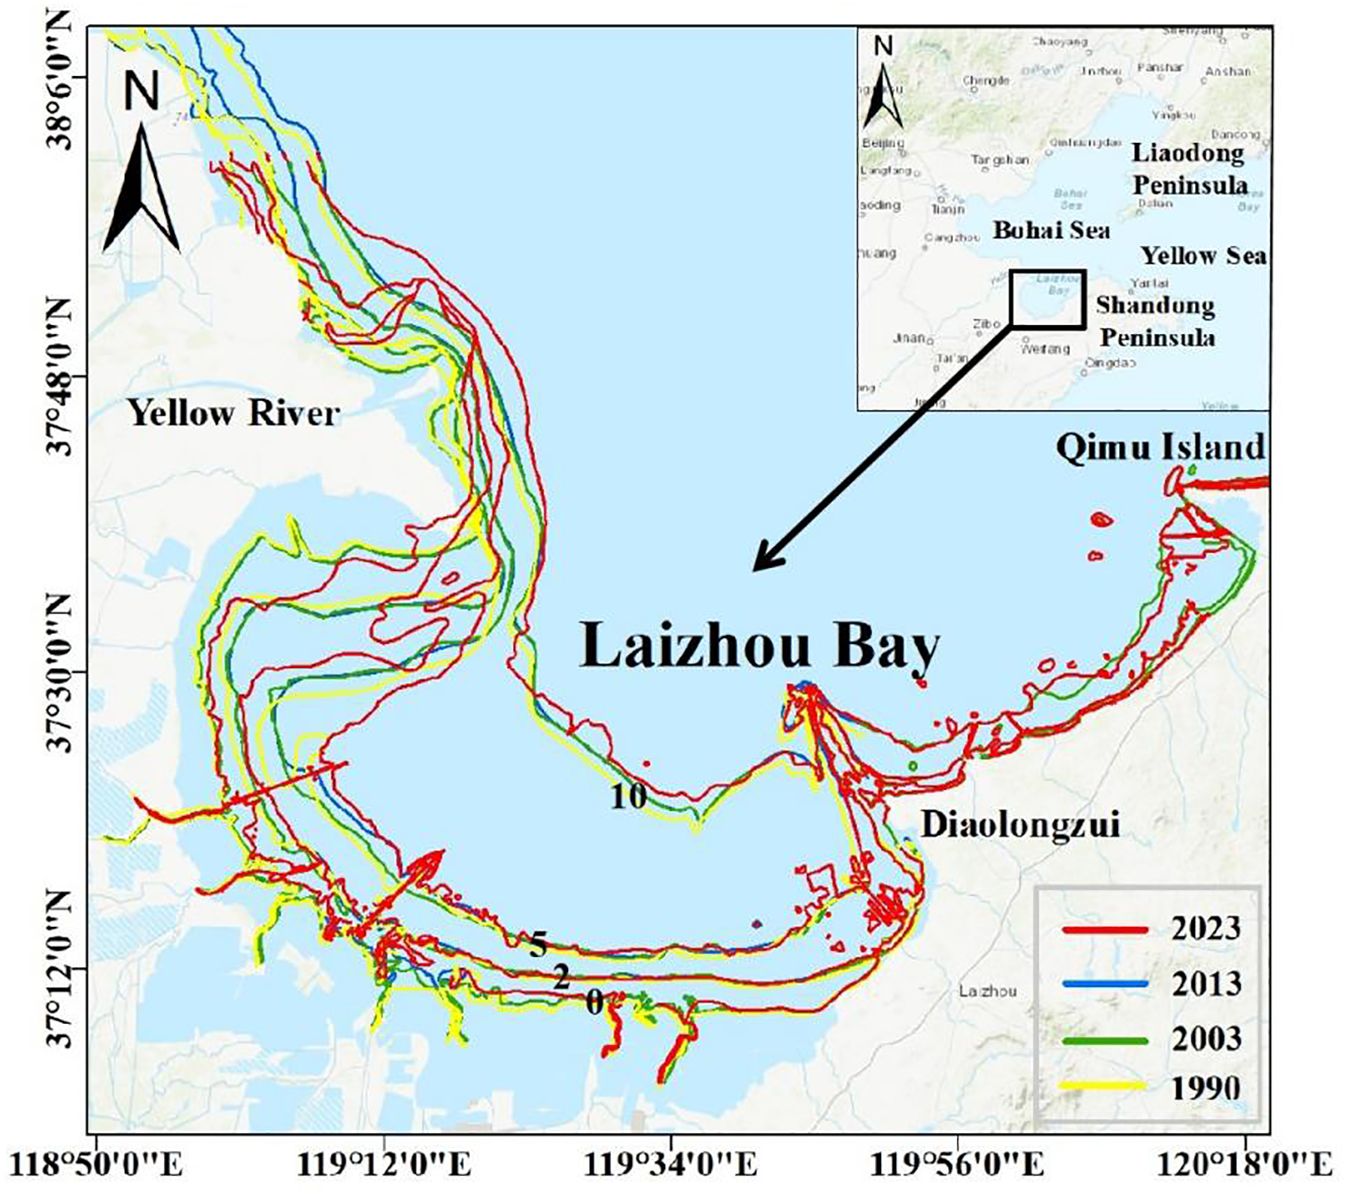
Coastline data for Laizhou Bay are obtained from Landsat TM/OLI_TIRS satellite remote sensing imagery, coastline changes are primarily concentrated in the southwest, with smaller changes elsewhere, with the geographic location and variations in the coastline across different years illustrated in Figure 1. Water depth data are sourced from two primary databases: the large-scale ETOPO global water depth dataset and the more localized China coastal nautical charts. In the modeling process, all water depths are standardized to mean sea level to ensure consistency and accuracy in hydrodynamic simulations. Based on the digitized nautical chart depths, the 0m, 2m, 5m, and 10m isobaths of the Laizhou Bay area are plotted as shown in Figure 2. Isobaths are important indicators of underwater topography. Influenced by sediment deposition and erosion from the Yellow River, the isobaths near the Yellow River Delta show the most significant changes, with notable changes also occurring in the southwest of Laizhou Bay, gradually advancing seaward over time.
The coastline and water depth data for the four characteristic years are divided into three groups and compared in pairs, revealing the changes in coastline and water depth at each stage. This provides a clear basis for the analysis and discussion of subsequent simulation results. As shown in Figure 3A, from 1990 to 2003, large-scale land reclamation in the southwest of Laizhou Bay altered the coastline, reducing the bay’s area. The reclamation primarily occurred in shallow water areas, having little impact on the isobaths. Due to the artificial diversion of the Yellow River in 1996, the estuary extended northeastward, while the southeast gradually eroded and retreated, leading to significant changes in the isobaths in this area. As shown in Figure 3B, from 2003 to 2013, the combined effects of land reclamation and port construction caused significant changes in the coastline of southwest Laizhou Bay, pushing the coastline seaward. The construction of Weifang Port encroached on the 0m and 2m isobaths, with minimal changes to the remaining isobaths. As shown in Figure 3C, from 2013 to 2023, coastline changes were primarily driven by port construction, with the new breakwaters at Weifang Port and Guangli Port extending seaward. The breakwater heads extended to the 5m isobath, and the isobaths overall advanced seaward.
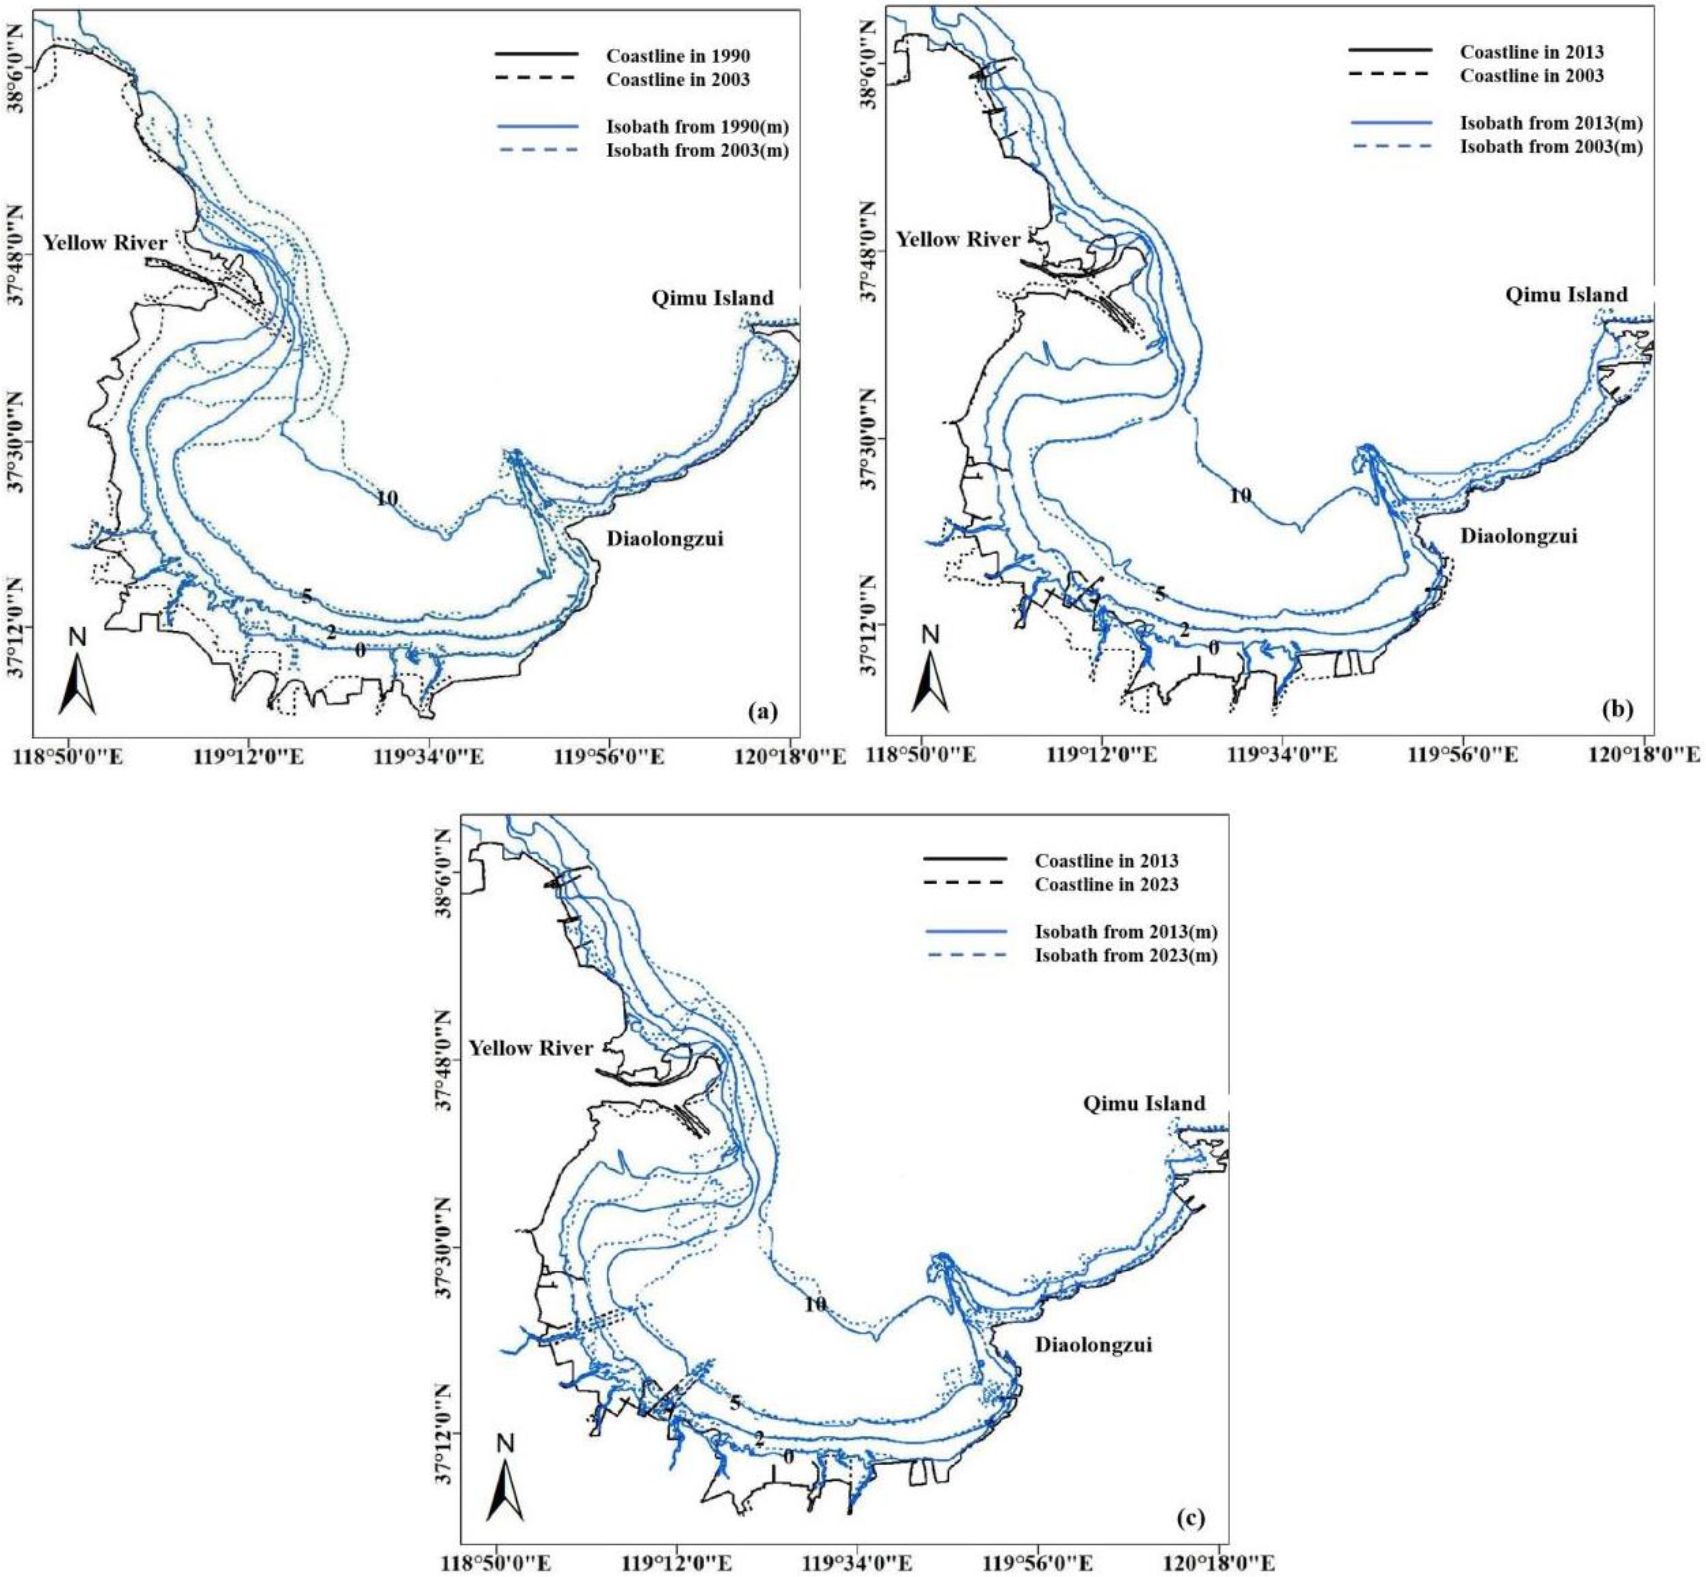
Figure 3. Comparison of coastline and water depth changes in different years. (A) Comparison of coastline and isobath changes between 1990 and 2003. (B) Comparison of coastline and isobath changes between 2003 and 2013. (C) Comparison of coastline and isobath changes between 2013 and 2023.
3 Model setting and verification
3.1 Model description
Delft3D is a suite of hydrodynamic modeling software developed by Delft University in the Netherlands (Delft Hydraulic, 2010). It is used to simulate water flow, wave dynamics, sediment transport, and water quality changes. It enables simulation of complex hydrological and hydrodynamic processes. The software comprises several modules, including the hydrodynamic module (FLOW), wave module (WAVE), sediment module (SED), water quality module (WAQ), ecological module (ECO), particle tracking module (PART), and bed morphological module (MOR). It is widely applied in fields such as flood forecasting for rivers and estuaries, marine engineering planning and environmental assessment for coastal areas, and the design and maintenance of ports and waterways.
3.2 Governing equation
This study utilizes the Delft3D-Flow module to establish a two-dimensional convection-diffusion numerical model for bay water exchange. The computations employ the following equations: the continuity equation, the momentum equation, and the mass transport equation.
1. The continuity equation:
2. The momentum equation:
3. The mass transport equation:
where is the water level, d is the water depth. The variables u, v, w represent the velocity components in the , , and σ directions. Q is the volume of water per unit area that changes due to drainage, evaporation, or precipitation. f is the Coriolis force coefficient. and represent the momentum sources or sinks in the ξ and η directions. and represent the turbulent momentum fluxes in the and directions. is the reference density, is the water density. is the vertical eddy viscosity coefficient. and are the horizontal and vertical diffusion coefficients. The variable C represent salinity (S), temperature (T), or the concentration of conservative substances. is the first-order degradation coefficient. is the source or sink terms. is the Prandtl-Schmidt number. and are the hydrostatic pressure gradients in the ξ and η directions, calculated as follows:
In Equations 5, 6, the first term on the right side represents the surface gradient term, also known as the barotropic term; the second term is the density gradient term, which includes the baroclinic term and corrections for vertical grid deformation due to topographical changes.
3.3 Model setting
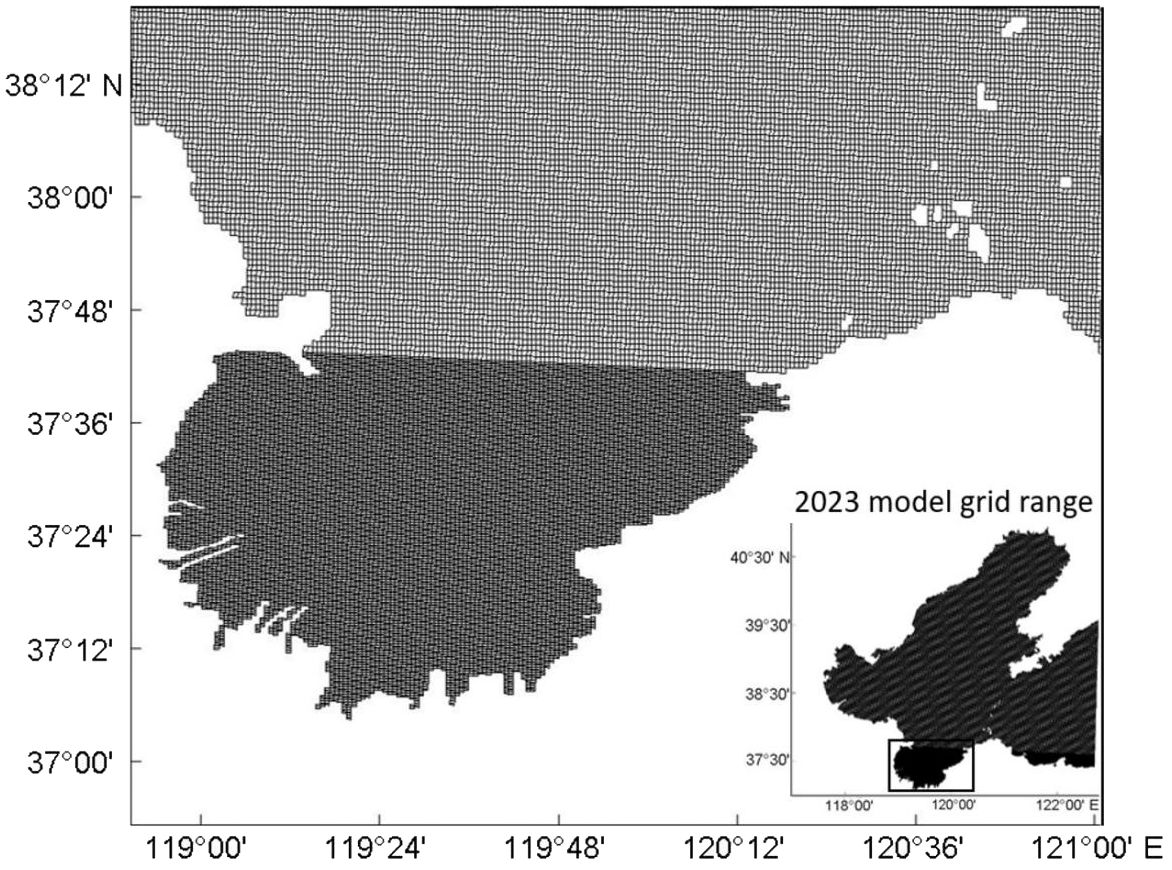
The study area, spans from 37.4°N to 40.58°N and from 117.31°E to 122.34°E. Using varying coastlines and water depths, hydrodynamic numerical models are developed for the years 1990, 2003, 2013, and 2023. The computational grid for the study area is generated using the Grid module of the Delft3D software, which employs a locally refined orthogonal curvilinear mesh to divide the research area, particularly intensifying the grid in the area south of the line from the Yellow River mouth to Longkou. The average grid scale in the refined area is set at 300 meters, and the time step is fixed at 2 minutes. The seawater density is assumed to be 1000 kg/m³, with gravity parameterized at 9.8 m/s².
The model employs a cold start approach for computation, where the water level and flow velocities at all grid points within the computational area are initialized to zero, that is:
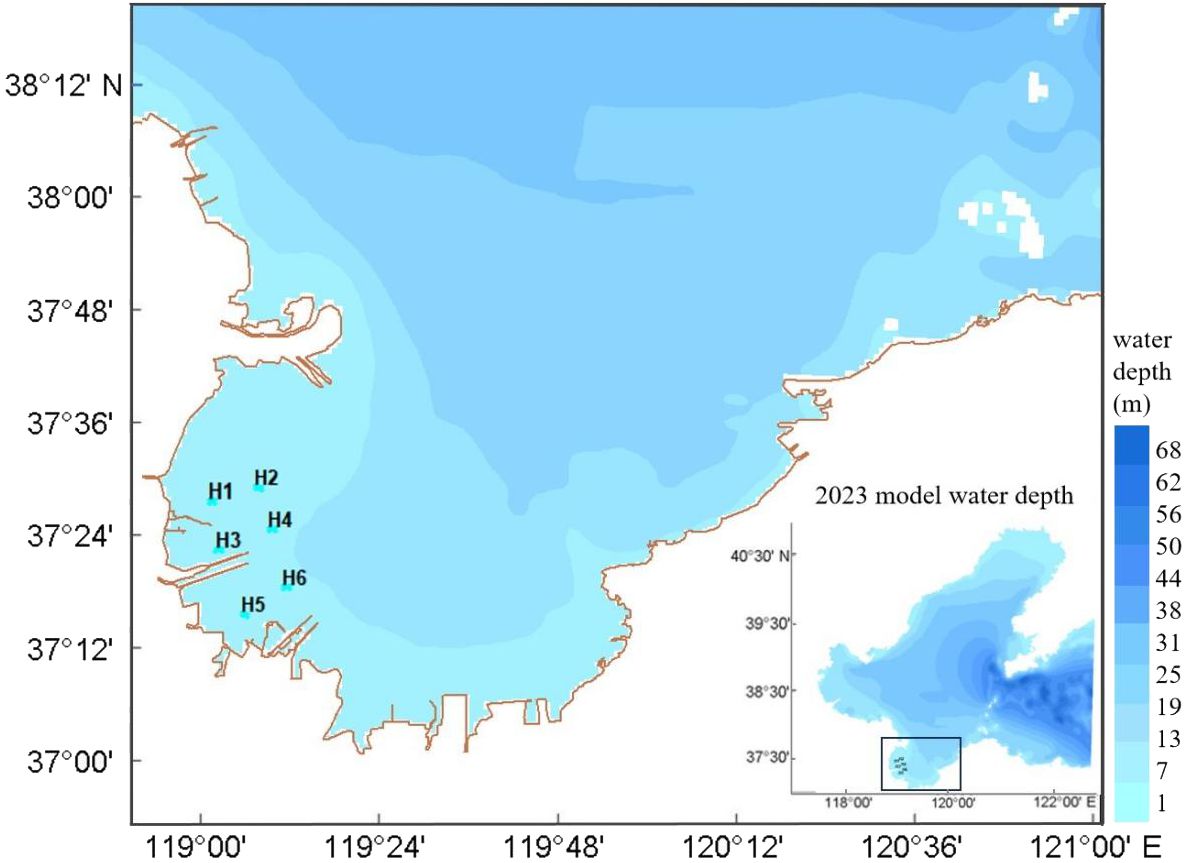
The open boundary of the model is driven by water level, and the water level value is predicted by assimilating the harmonic constants of each component Tide obtained from the satellite altimeter data by TMD (Tide Model Driver). A total of eight sub-tides M2、S2、N2、K2、K1、O1、P1、Q1 were used in this calculation. The grid layout of the study is shown in Figure 4.
3.4 Model verification
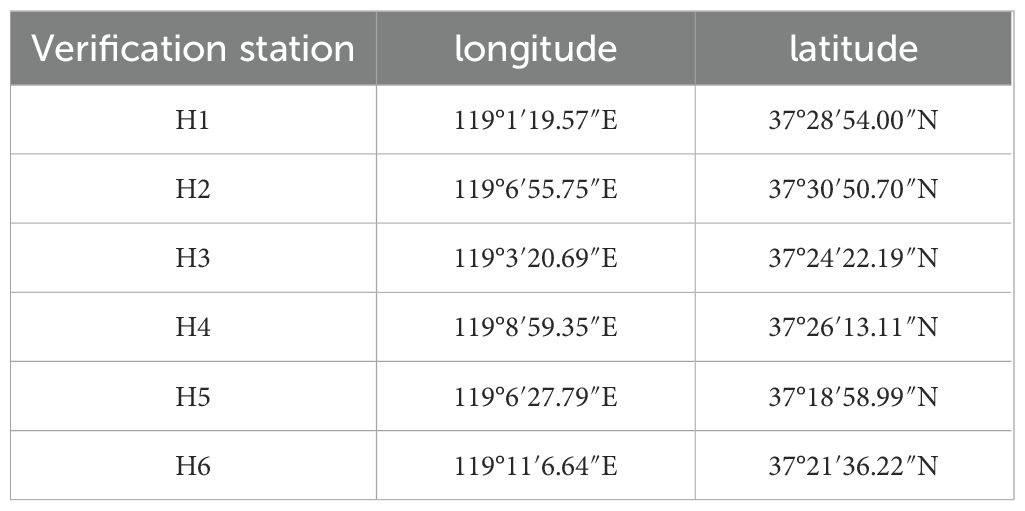
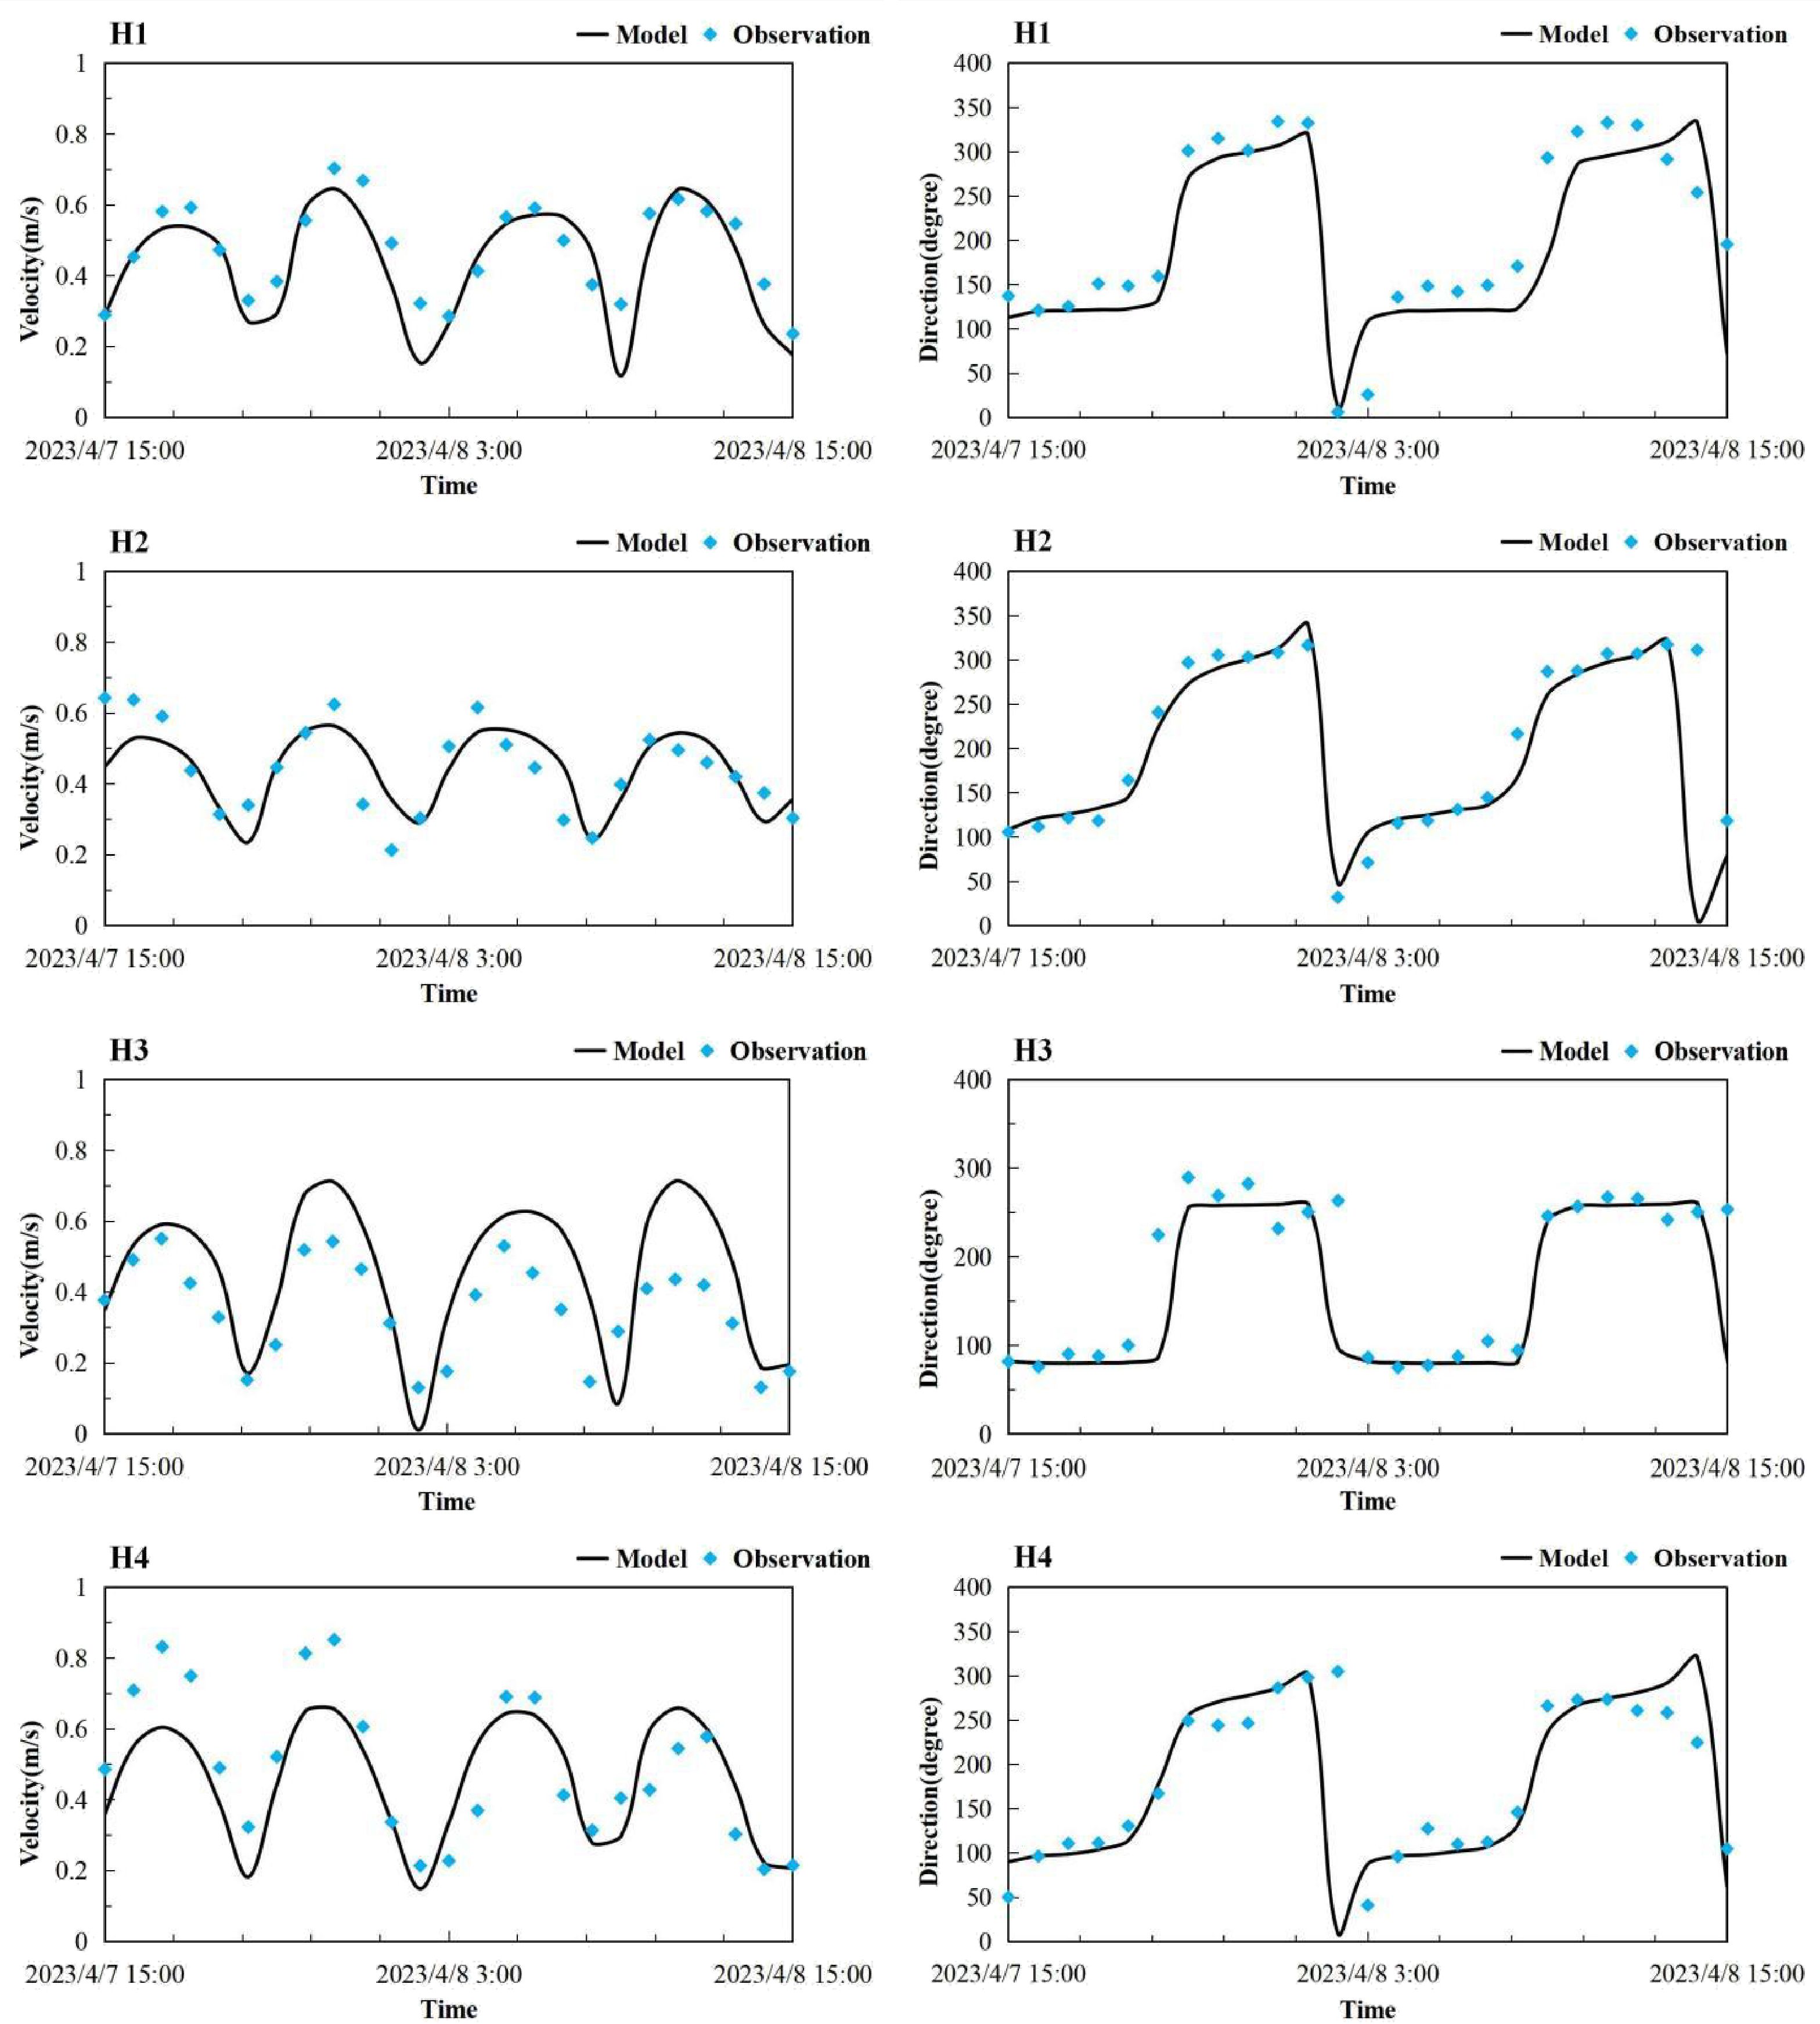
The flow velocity and direction verification data are the spring tide data of stations H1, H2, H3 and H4 in the sea area near Kenli District, Dongying City from 15:00 on April 7 to 15:00 on April 8, 2023. Meanwhile, the tide level verification of stations H3 and H4 has been carried out. The simulation time of the current and water level are from March 15 to April 15, 2023, and the model is stabilized 10d in advance to verify the stabilized flow direction and water level. The specific longitude and latitude of the verification points are shown in Table 1, Figure 5. Compared to the measured data with the simulated data, the verification results are shown in Figures 6, 7.
It can be seen from the water level verification results in Figure 6 that the simulated values of the two observation stations agree well with the measured values, indicating that the model can simulate the change in water level in Laizhou Bay. It can be seen from the flow velocity and direction verification results in Figure 7 that the numerical verification results of the flow direction of each observation station are good and the trend is relatively consistent. Except for the slight deviation between the simulated flow velocity value of station H2 and the measured data, the simulated values and their variation rules of the other stations agree well with the measured values. The verification results show that the model can well simulate the tidal flow process and change characteristics of Laizhou Bay, which can meet the needs of this study.
4 Results and discussion
4.1 Characteristic analysis of tidal flow field
During the spring tide periods in Laizhou Bay, comparative analyses of the flow fields were conducted across four different years under varying conditions of coastline and water depth, with results illustrated in Figure 8. The overall motion trends of the flow fields are consistent across the years: during the flood tide, seawater flows into the bottom of Laizhou Bay from the northeast (NE) to the southwest (SW); during the ebb tide, water flows out of the bay from the southwest to the northeast. Near the coast, the tidal current speeds are relatively low, mostly below 0.3 m/s. In contrast, the flow speeds in the center of the bay are higher, ranging from 0.3 to 0.8 m/s. The highest speeds, exceeding 1 m/s, occur south of the Yellow River estuary.The flow directions during the flood and ebb tides, as indicated in the figure, suggest that the topography significantly constrains the flow directions. Due to the geographical restrictions, the tidal currents within Laizhou Bay exhibit reciprocating flow characteristics. Despite the complexity of the spatial distribution of tidal currents, a definite pattern can still be discerned. Near the Yellow River estuary, there is a strong current area. Moving inward towards Laizhou Bay from this region, the flow velocity gradually decreases, transitioning into a weak current area near Longkou Bay and Yangjiao Ditch. During flood tides, the differences in flow velocity between different years are not significant. However, during ebb tides, there are noticeable differences. Due to significant changes in the coastline near the Yellow River Delta, the flow velocity in Laizhou Bay increased significantly from 1990 to 2003 and gradually decreased after 2003. The flow velocity affects the outward transport of sediment and pollutants within the bay. Sediment deposition can alter water depth and topography, while difficulty in pollutant dispersion can change water quality, thereby impacting the bay’s water exchange capacity.
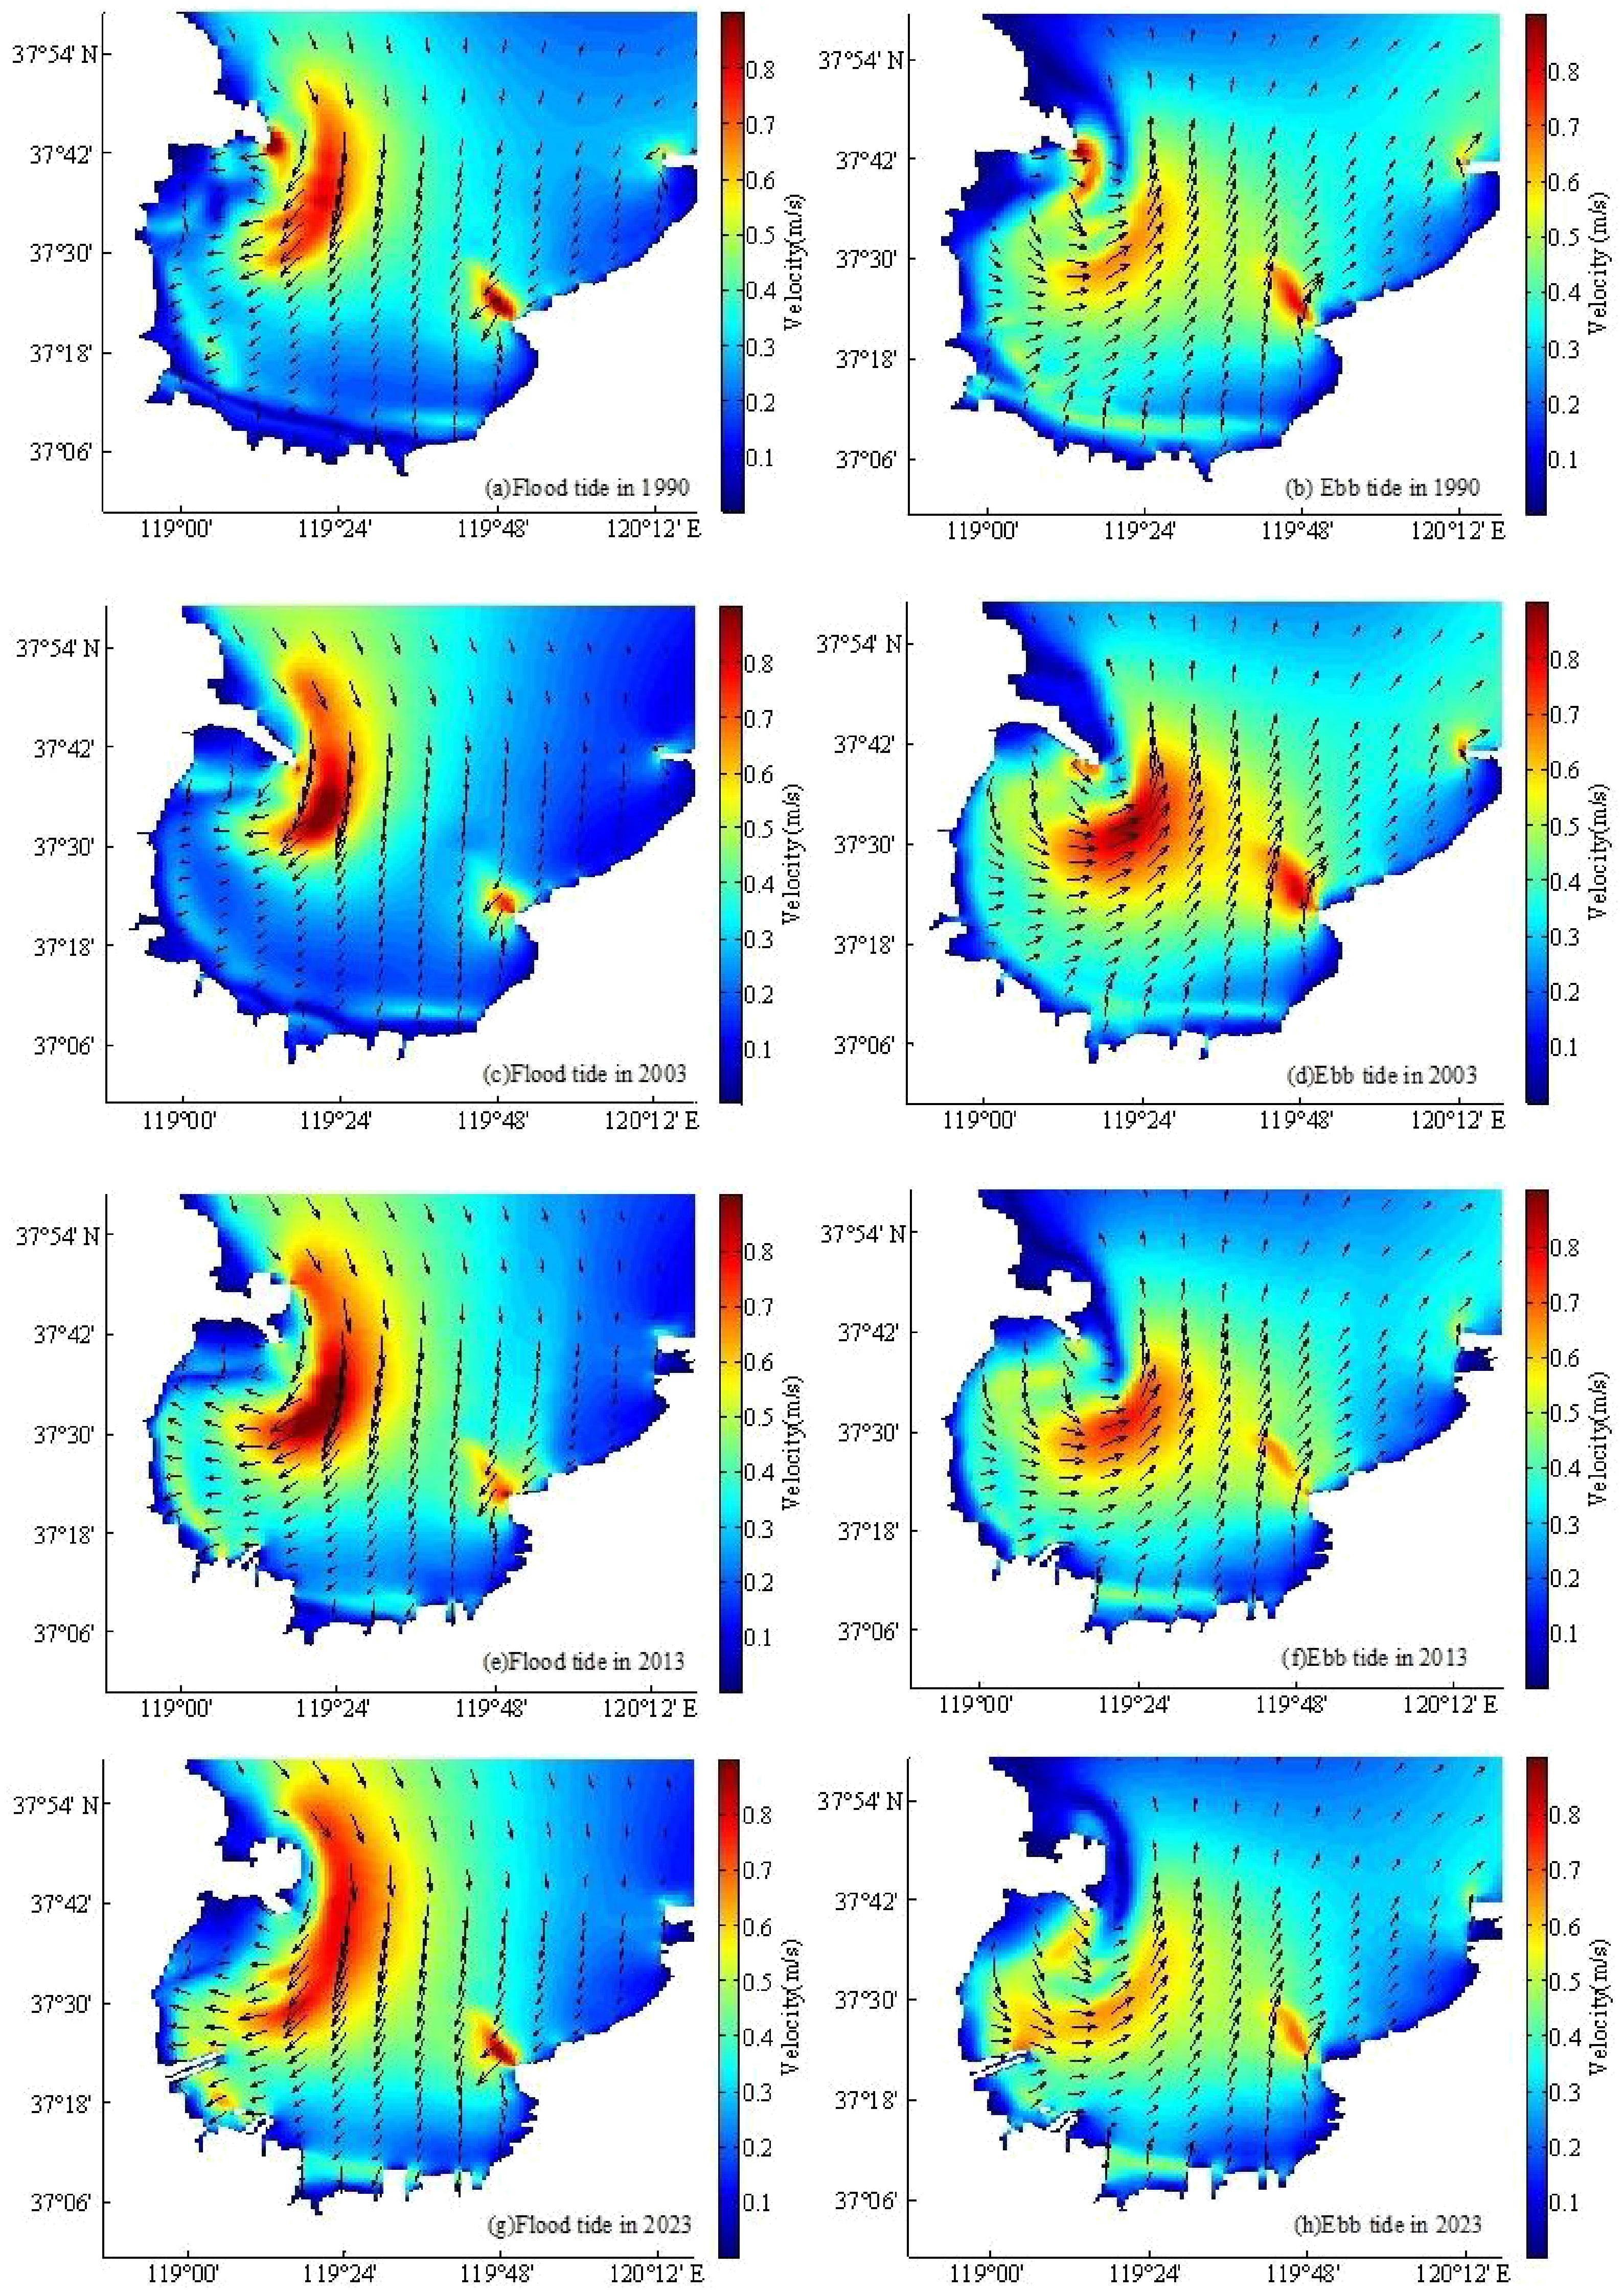
Figure 8. Flow velocity and direction during high and low tides from 1990 to 2023. (A) Velocity and direction during the flood tide in 1990. (B) Velocity and direction during the ebb tide in 1990. (C) Velocity and direction during the flood tide in 2003. (D) Velocity and direction during the ebb tide in 2003. (E) Velocity and direction during the flood tide in 2013. (F) Velocity and direction during the ebb tide in 2013. (G) Velocity and direction during the flood tide in 2023. (H) Velocity and direction during the ebb tide in 2023.
4.2 Eulerian residual current field
In the study of dynamical theory, Eulerian velocities are typically employed to compute residual currents (Wang et al., 2014). Eulerian tidal-induced residual current velocity refers to the average velocity of tidal currents at a specific spatial point within a tidal cycle, representing the mean migratory trend of the fluid at that location. Due to the influence of lateral coastlines and bottom friction in shallow seas, a portion of the periodic energy is transformed into non-periodic energy, closely linking the magnitude of the residual current to the terrain and coastline configurations (Chu et al., 2022). The Eulerian tidal-induced residual current in marine environments can be straightforwardly defined as the Eulerian mean velocity, which is decomposed into components along the x and y axes of the Cartesian coordinate system. The computation formula is as follows:
where UE and VE are the velocity in the x and y directions.N=nT/dT,where n is the number of computing cycles taken,T is the tidal cycle,dT is the time step of the numerical simulation.ui and vi are the velocity in the x and y directions for each time step calculated for the model.By synthesizing UE and VE, the Euler residual flow field is obtained.
Based on the tidal flow field characteristics of Laizhou Bay and the calculations from Equations 10, 11, the surface Eulerian residual current field for Laizhou Bay is depicted in Figure 9, representing a tidal-induced residual current. The distribution characteristics of the Eulerian residual currents in different years in Laizhou Bay are similar, generally directed off coast, with an overall orientation towards the northeast. Near the southern side of the Yellow River mouth, the direction is southeast, and the overall flow speed is relatively low, with an average of 8 cm/s, which is significantly less than the tidal flow speed in the bay. Consequently, tidal flows dominate in Laizhou Bay with minor tidal-induced residual currents. Near coast areas experience higher flow speeds, with the highest velocities occurring near the southern side of the Yellow River Estuary and around Diaolongzui, reaching up to 16 cm/s. Therefore, changes in terrain and coastline have a significant impact on the residual currents. In addition to the significant differences in flow speed, another distinct difference between Eulerian residual currents and tidal currents is observed; Eulerian residual currents are notably higher in near coast areas compared to the central area, whereas tidal currents exhibit the opposite distribution. The distribution of the residual current field is similar to the pattern of water exchange between the bay and the open sea. Tidal currents and residual currents to some extent control the distribution of materials within Laizhou Bay.
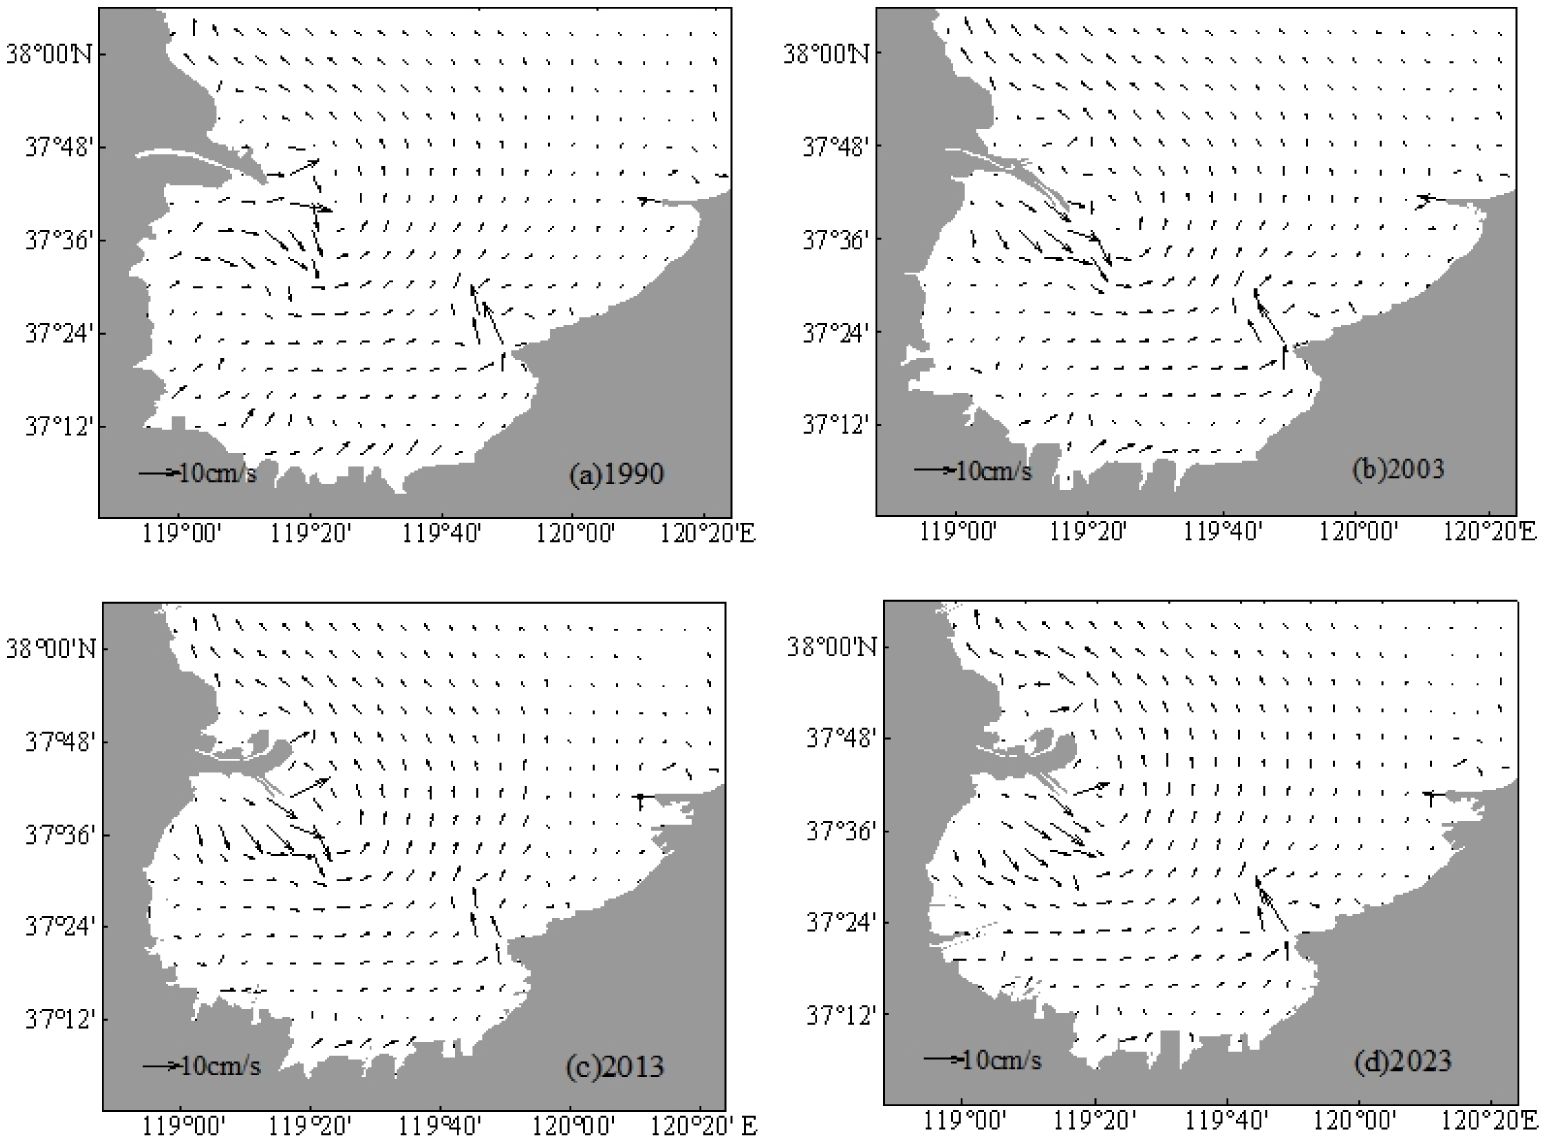
Figure 9. Eulerian residual current field on the surface of Laizhou Bay in different years. (A) Eulerian residual currents in 1990. (B) Eulerian residual currents in 2003. (C) Eulerian residual currents in 2013. (D) Eulerian residual currents in 2023.
4.3 Tidal prism
4.3.1 Tidal prism calculation
Tidal prism refers to the total volume of seawater that a bay can accommodate during a single tidal cycle, and is a crucial hydrological indicator for assessing the development potential of bays (Kuo and Neilson, 1988). Through tidal prism, one can evaluate the water exchange capacity of a bay, reflecting its ability to maintain ecological balance. This parameter is essential for understanding the extent of exchange between the bay and the open sea, the transport and dispersion of pollutants, and the maintenance of port channels (Li et al., 2014). Tidal prism acts as a critical factor limiting the self-purification capacity of the bay, its environmental capacity, and the expansion of port navigation channels, playing a vital role in ensuring the health of the bay’s ecological environment (Zhang et al., 2023). Furthermore, changes in tidal conditions can trigger a dynamic imbalance between hydrodynamic conditions and the morphology of the bay, leading to adjustments in the tidal channels of the bay, which in turn affects the natural lifespan of the bay (Chadwick and Largier, 1999). Such dynamics highlight the interconnectedness of physical, ecological, and anthropogenic factors within coastal systems. Understanding these relationships is pivotal for effective coastal management and the design of interventions that aim to enhance the sustainability and resilience of marine environments.
The formula for calculating tidal prism is:
where P is the tidal prism, S1 and S2 are the high- and low-water surface areas,H1 and H2 are the high- and low-water level.
In the finite volume method, to achieve accurate results, the concept of the tidal prism is applied to each grid cell. The formula is extended as follows:
where P is the tidal prism, Si is the area of the i grid,H1i and H2i are the high- and low-water level of the i grid,n is the total number of grids in the selected sea area.
4.3.2 Tidal prism variation
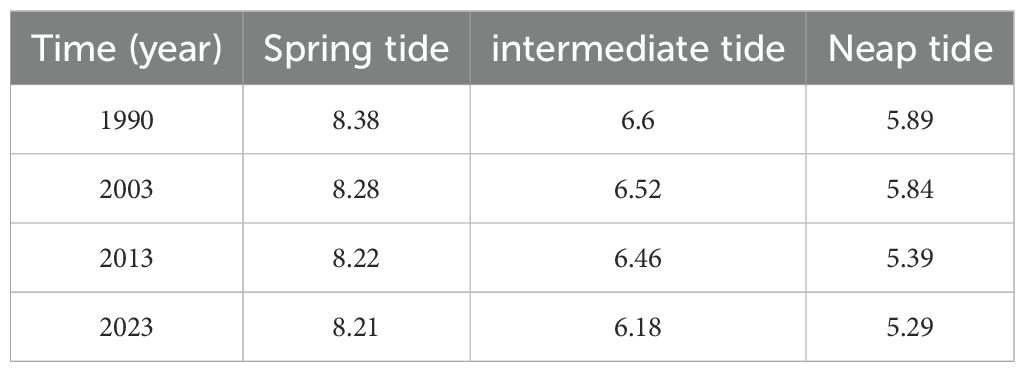
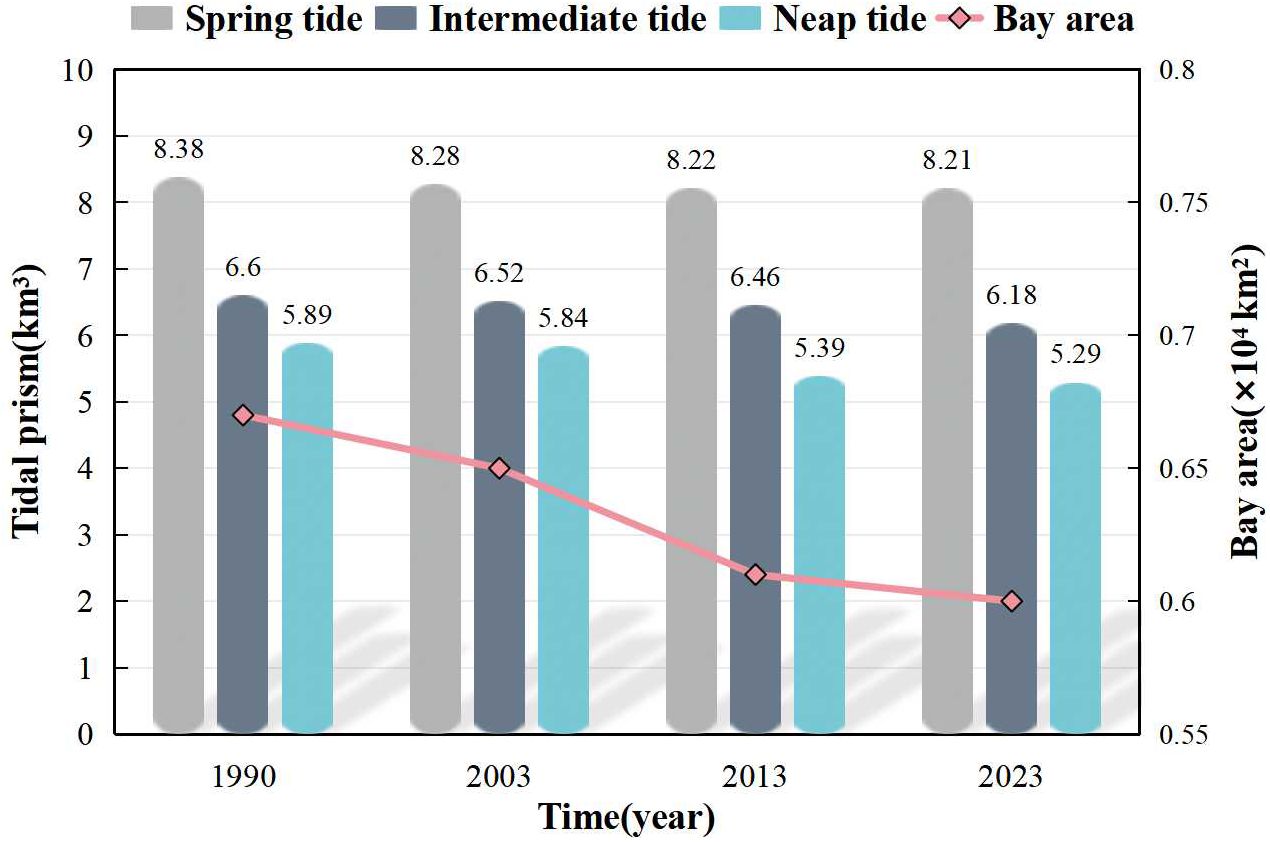
This paper calculates the tidal prism of Laizhou Bay during the spring, neap, and low tides for four different years, with results presented in Table 2, Figure 10. The calculations reveal a gradual decline in the tidal prism of Laizhou Bay over the past 30 years. From 1990 to 2013, the reduction was significant, while the difference between 2013 and 2023 was smaller. Taking the spring tide as an example, there was a 1.91% decrease from 1990 to 2013 and only a 0.12% difference between 2013 and 2023. Compared to 1990, the tidal prism during the spring, intermediate, and neap tide in Laizhou Bay have decreased by 2.03%, 6.36%, and 10.19%, respectively. The primary reason for this reduction is the extensive land reclamation development that has occupied a significant portion of the bay, diminishing its capacity to accommodate seawater. In 1990, the area of Laizhou Bay was 0.67×10⁴km2, which decreased to 0.60×10⁴km2 by 2023. The reduction from 2013 to 2023 was relatively small. Comparing the bay area and tidal prism, it can be concluded that they are positively correlated, and the reduction in bay area due to the coastline advancing seaward is the main factor leading to the decrease in tidal prism. Additionally, marine engineering constructions, particularly at Guangli Port and Weifang Port, have impacted the hydrodynamic environment of Laizhou Bay, resulting in a reduced tidal range and consequently lower tidal prism. The variation in tidal prism is associated with the ebb and flow dynamics of the tidal channel. It also significantly affects the maintenance of the port area channel and may disrupt the dynamic equilibrium between the overall morphology of the bay and the hydrodynamic conditions within it. In addition, changes in tidal prism also affect water exchange. The greater the tidal prism, the stronger the exchange capacity between the bay’s water and the open sea, which in turn impacts the water quality of the bay.
4.4 Water exchange
4.4.1 Water exchange calculation
The water exchange rate is a metric used to assess the degree of seawater replacement between the interior of a bay and the open sea (Xu C. et al., 2021). Assume that at the initial moment, a dissolved conservative pollutant uniformly exists within the bay with a concentration set at 1, while outside the bay, the concentration of the pollutant is 0. Over time, due to convection and diffusion, the concentrations of pollutants inside and outside the bay will display different distribution characteristics due to water exchange (Wang et al., 2009). The method for calculating this indicator is as follows (Wang et al., 2013): Taking Laizhou Bay as an example, assume the concentrations inside and outside the bay are 1 and 0. Influenced by water flows, the bay’s waters continuously exchange with the open sea, causing the substance within the bay to be carried outwards by the tide. The half-exchange period is defined as the time necessary for the total quantity of the substance within the bay to decrease to 50% of its initial value (Xie et al., 2013).
The formula for calculating the water exchange rate of the bay is:
where W is the water exchange rate,n is the number of grids occupied by the area inside the bay, Ci is the conserved substance concentration of the i grid;Hi is the immediate depth of the i grid,Ai is the area of the i grid.
4.4.2 Water exchange variation
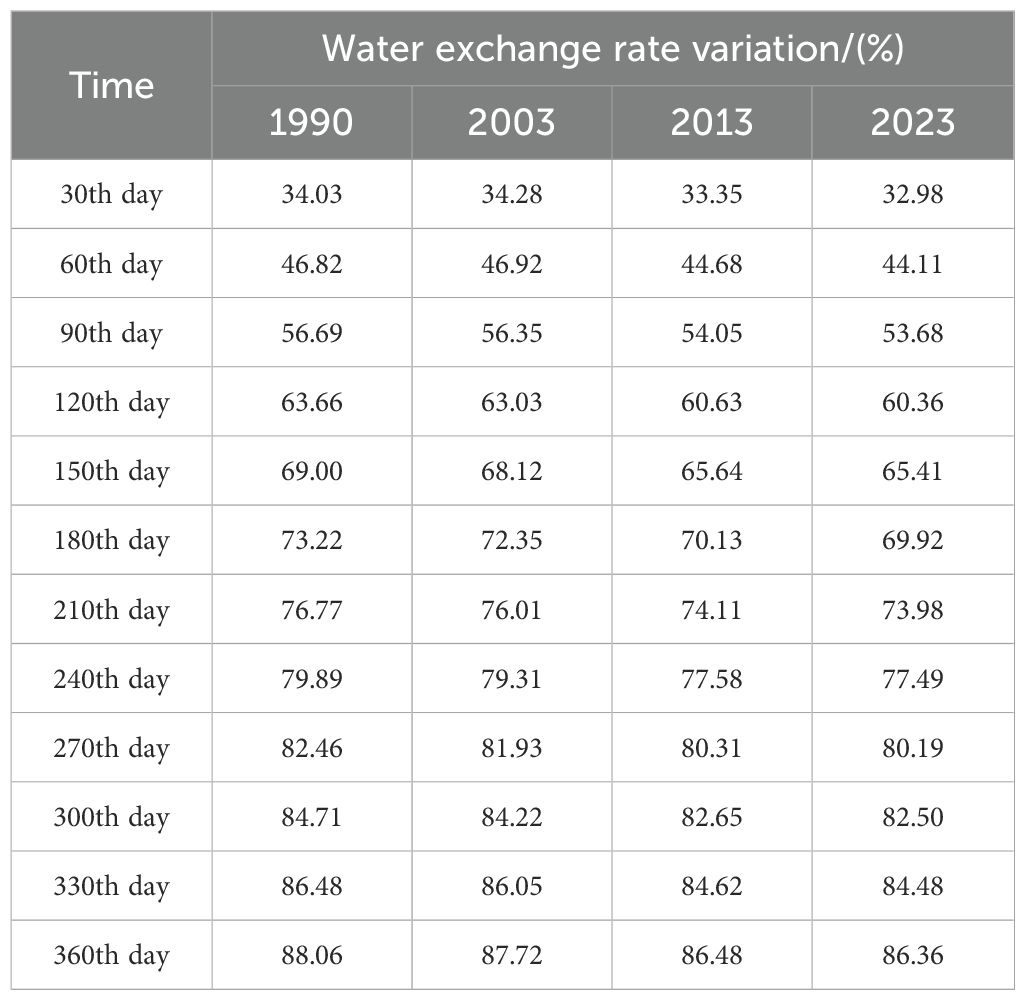
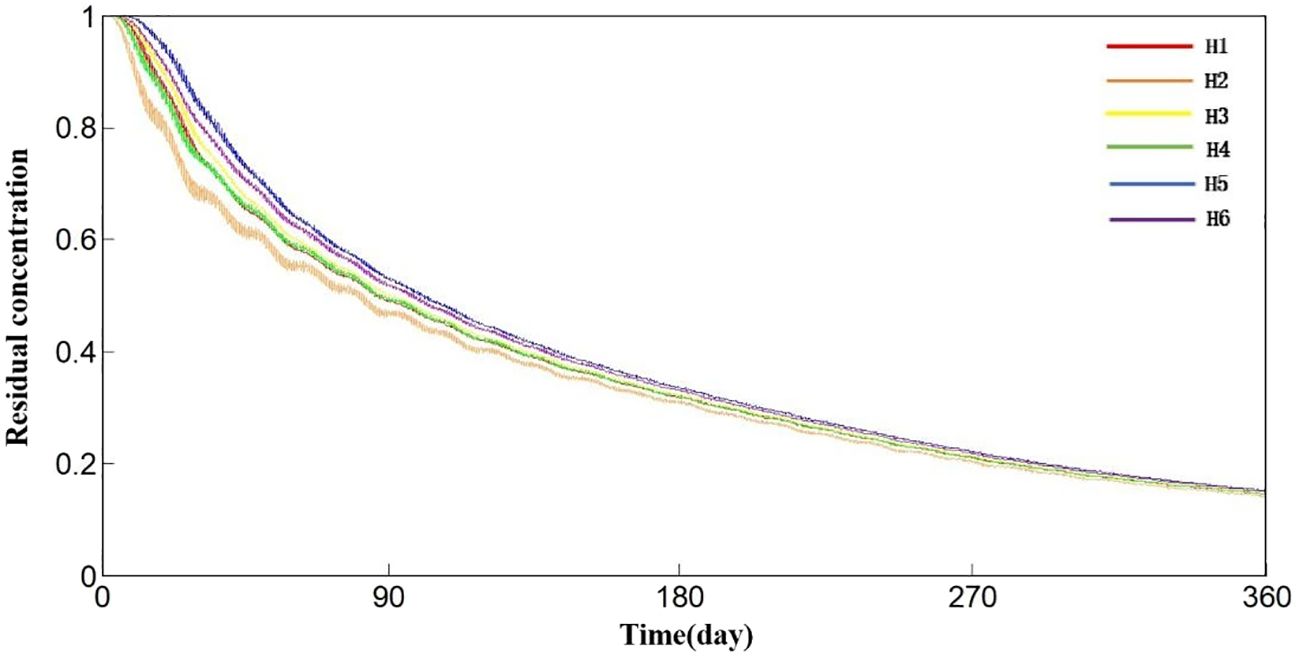
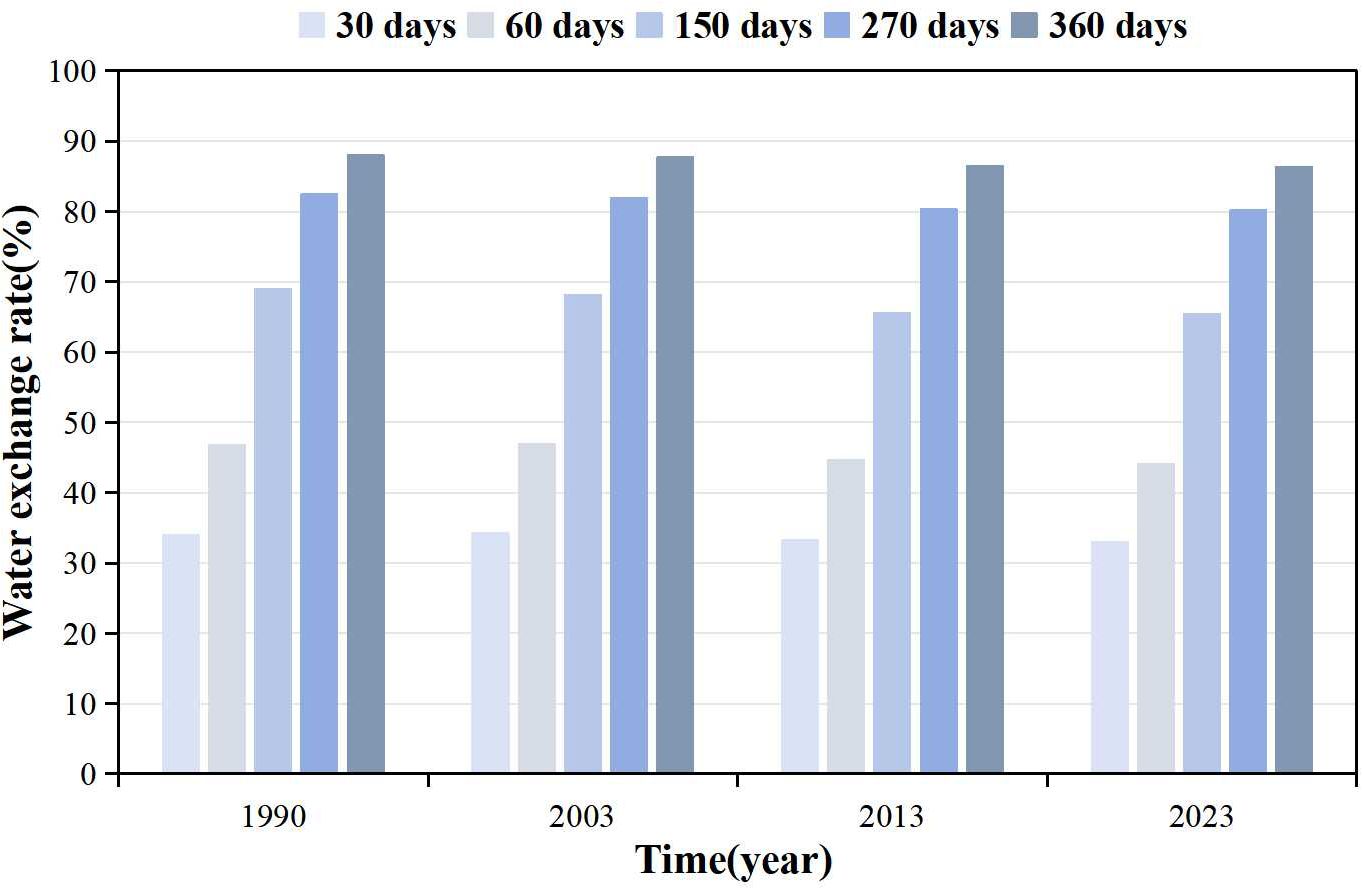
This paper simulates the distribution of pollutant diffusion in Laizhou Bay across four different years, with pollutant concentrations within the bay varying due to convection and diffusion effects. Table 3 shows the changes in water exchange rates in Laizhou Bay over the same period. Figure 11 shows the variation in pollutant concentration at stations H1-H6 over 360 days. The figure illustrates that the pollutant concentration at the observation points decreases continuously from an initial value of 1. The fluctuations are caused by the ongoing exchange of water between the bay and the open sea. After 360 days, the concentration at all observation points decreases to below 0.2, indicating a strong water exchange capacity near these points. Figure 12 presents the water exchange rates for four different years over 30, 60, 150, 270, and 360 days. The water exchange rates for the first 30 days are roughly the same for all years. Significant differences start to appear from day 60, with half of the exchange completed between days 60 and 90. The water exchange rate was the fastest in 1990, with the rate in 2003 being similar to that of 1990. By 2013, there were noticeable changes, and the changes between 2013 and 2023 were relatively small. Figures 13, 14 show the distribution of pollutant diffusion in Laizhou Bay on days 120 and 210, revealing a similar pattern of change. Within the same period, the concentration of materials in Laizhou Bay shows an increasing trend, with the most significant changes occurring between 2003 and 2013. This indicates that over the past 30 years, the exchange time of seawater inside and outside Laizhou Bay has increased, making it more difficult for pollutants to diffuse and resulting in a decrease in water exchange capacity.
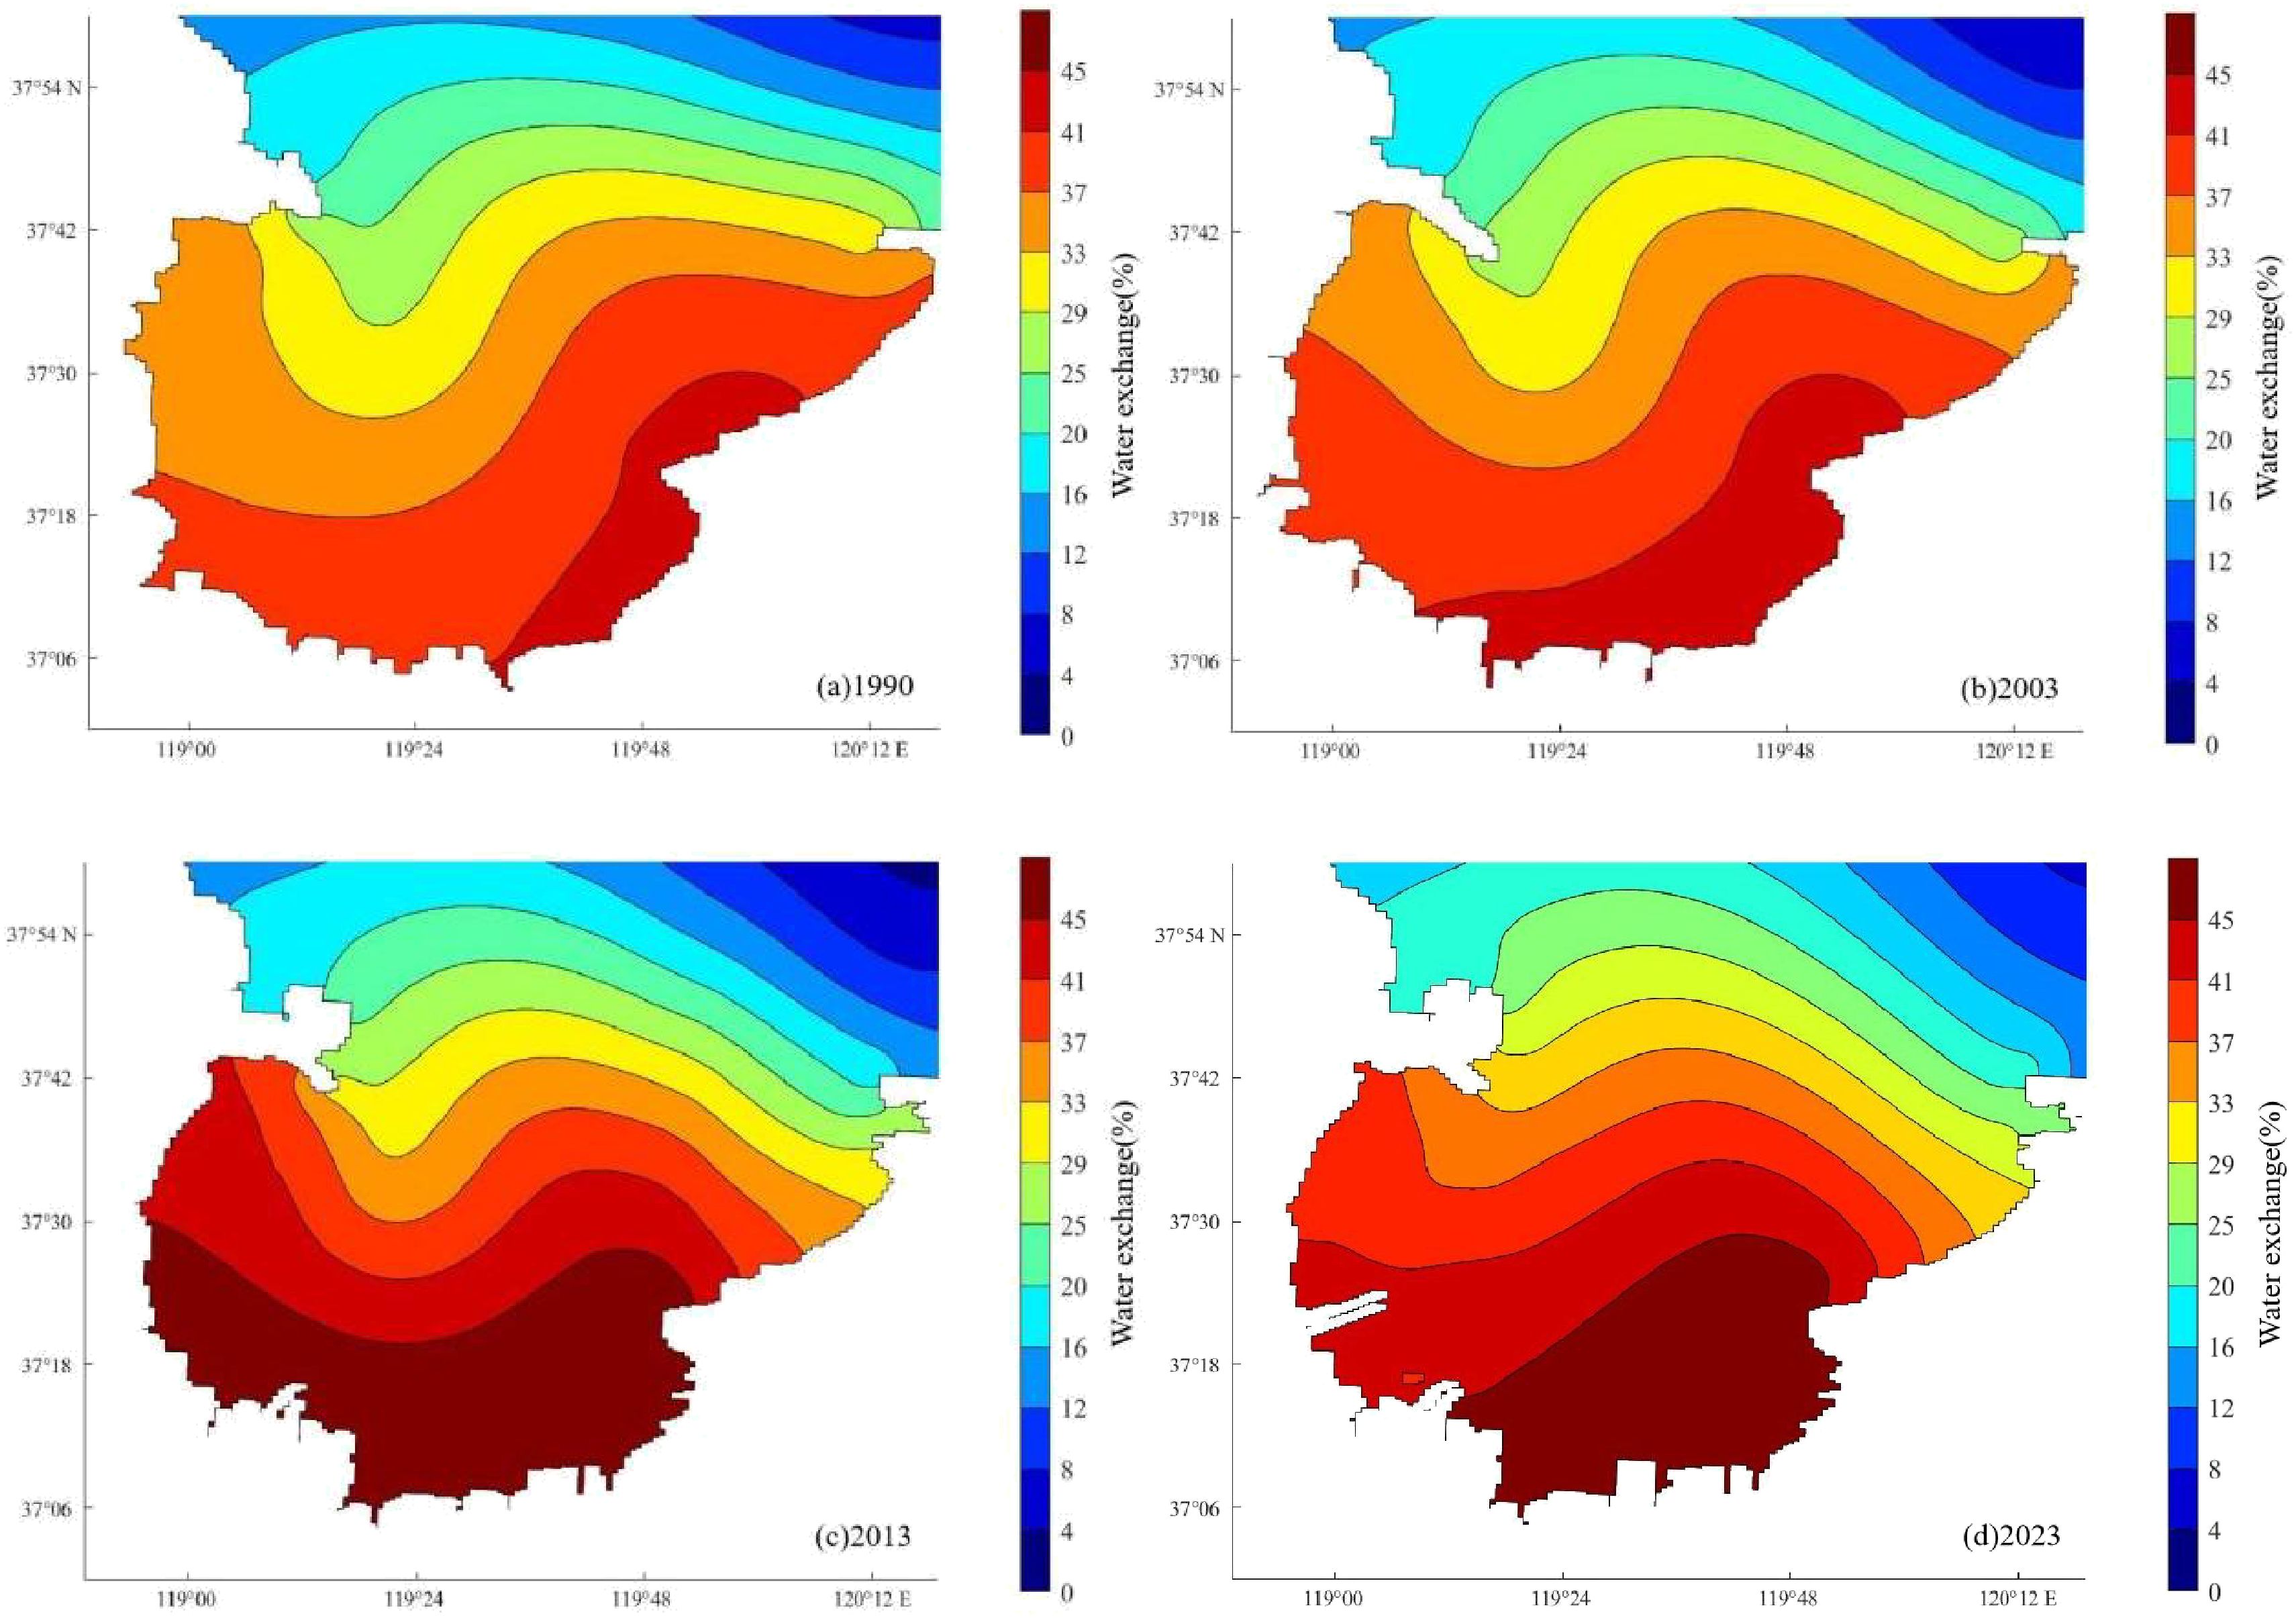
Figure 13. Water exchange rate in Laizhou Bay on the 120th day. (A) Water exchange rate on the 120th day in 1990. (B) Water exchange rate on the 120th day in 2003. (C) Water exchange rate on the 120th day in 2013. (D) Water exchange rate on the 120th day in 2023.
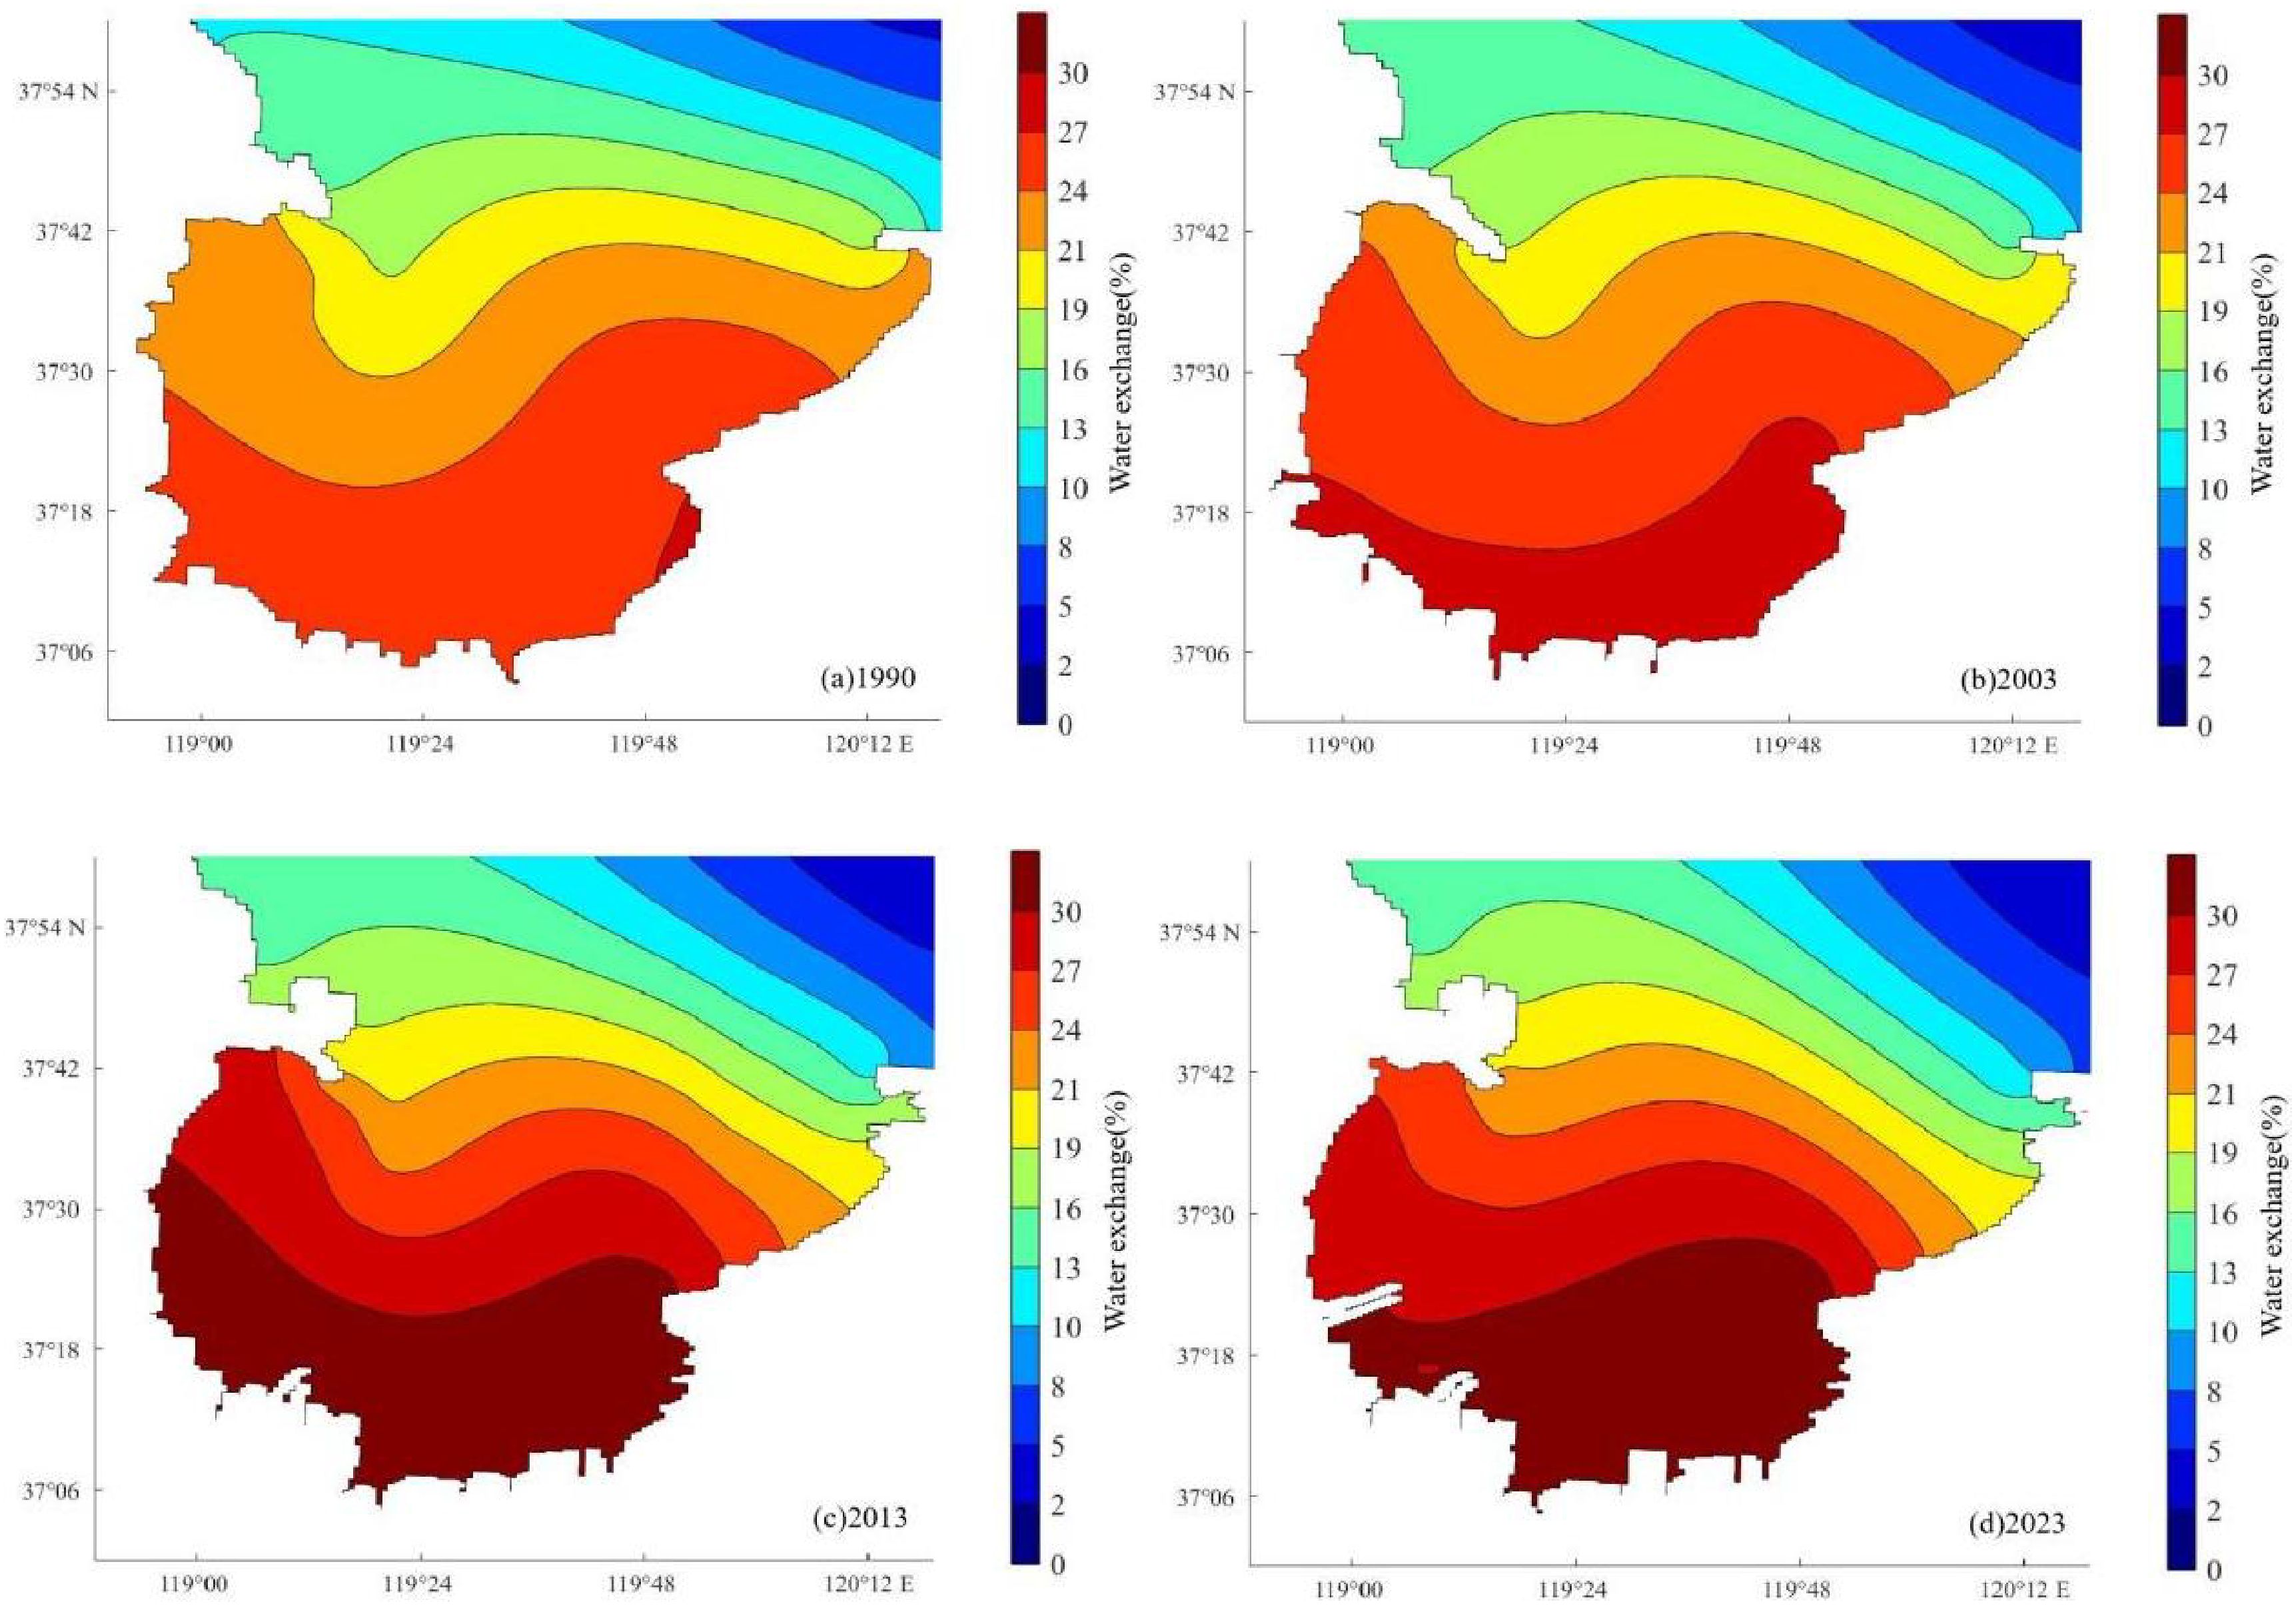
Figure 14. Water exchange rate in Laizhou Bay on the 210th day. (A) Water exchange rate on the 210th day in 1990. (B) Water exchange rate on the 210th day in 2003. (C) Water exchange rate on the 210th day in 2013. (D) Water exchange rate on the 210th day in 2023.
The half-exchange time of the water body in Laizhou Bay reflects the overall rate of water exchange within the bay (Park et al., 2011). Calculations show that the half-exchange time in 1990 was 71 days, in 2003 it was 73 days, in 2013 it increased to 81 days, and in 2023 it was only slightly delayed by one day compared to 2013. The primary reason is that changes in the coastline and water depth in Laizhou Bay have altered the hydrodynamic environment within the bay. From 1990 to 2003, land reclamation projects pushed the coastline seaward, reducing the sea area and tidal prism, which decreased the bay’s capacity to accommodate water and weakened the exchange capacity between the bay and the open sea. This led to an increased semi-exchange period and reduced water exchange ability. Since the land reclamation was mainly concentrated in shallow areas and did not encroach upon the 0m isodepth, changes in water depth were minimal, with more significant changes occurring in the lower Yellow River estuary region. From 2003 to 2013, new ports were constructed on top of extensive land reclamation. The protruding piers of these ports extended into the sea, forming semi-enclosed water areas and obstructing coastal water flow. This led to difficulties in pollutant dispersion near the ports, increased concentrations, and reduced water exchange ability. Significant changes in the 0m and 2m isodepths were observed in the southwestern part of Laizhou Bay. From 2013 to 2023, land reclamation activities were reduced, and coastline changes were mainly due to port construction, with ports extending into the sea up to the 5m isodepth. The reduction in water exchange rate was relatively small, indicating that port construction had a minor impact on the overall water exchange in Laizhou Bay.
4.5 Discussion
In recent years, the intensity of various marine development activities such as land reclamation and port construction along the coast of Laizhou Bay has continuously increased, leading to changes in the coastline and water depths of the bay, and consequently altering the hydrodynamic environment of the area (Xiong et al, 2021). The execution of various human activities alters the morphology of the bay, weakens its characteristics, and brings a series of adverse effects on the resources and environment of Laizhou Bay, making the study of changes in the bay’s hydrodynamic environment essential. Building on previous research, this study comprehensively considers factors such as shoreline changes, underwater topography variations, and hydrodynamic changes to conduct an in-depth investigation of tidal prism and water exchange in Laizhou Bay. The results are consistent with those of Wu et al. (2023) and Shi et al. (2011), showing that shoreline changes have reduced the bay’s area, leading to a decrease in tidal prism and, consequently, a reduction in water exchange capability.
Wang et al. (2014) investigated the influence of varying water depth and coastline configurations on the position of the M2 amphidromic point offshore of the Yellow River Estuary. Their findings indicate a significant impact of these factors on tidal dynamics in the region. In this study, a comparative analysis of tidal currents under different coastline and water depth conditions similarly reveals that changes in the coastline of the Yellow River Estuary lead to notable variations in current velocities in the adjacent waters. These alterations influence the exchange of water between Laizhou Bay and the open sea, thereby affecting the rate of water exchange. Ying et al. (2018), through their examination of tidal prism and water exchange variations in Yueqing Bay over different years, concluded that the reduction in bay area closely parallels the rate of reduction in tidal prism, a conclusion that aligns with the findings of this study.
Han et al. (2024) concluded that land reclamation projects in Sanmen Bay affect the outward transport of materials within the bay, with the reduction in bay area due to reclamation significantly decreasing water exchange capacity. However, the results of this study show that extensive land reclamation in Laizhou Bay from 1990 to 2003 led to noticeable coastline changes, but only a slight decrease in water exchange rate. This is because changes in the Yellow River Delta’s topography caused significant increases in flood and ebb current speeds in the western part of Laizhou Bay’s entrance, enhancing the inflow of external sea water and the outflow of bay water, thereby increasing the water exchange rate. This counteracts the reduction in water exchange rate due to the decrease in bay area, resulting in no significant change in water exchange. Lv et al. (2017) investigated the impacts of marine engineering on the hydrodynamics of Laizhou Bay in 2000 and 2014 and found that the impact on water exchange was relatively minor. However, this study observed a significant decrease in water exchange rate in Laizhou Bay from 2003 to 2013, primarily due to the changes in coastline near the Yellow River estuary. Compared to 2003, the ebb current speed in 2013 was significantly reduced, which hindered the outward dispersion of pollutants and decreased the water exchange rate. Compared to 2013, the coastline changes in Laizhou Bay by 2023 were mainly due to port construction, with little change in water exchange and tidal prism. However, there were significant changes in water depth, indicating that water depth changes do not have a decisive impact on the bay’s hydrodynamic environment, and coastline changes are the dominant factor affecting tidal prism and water exchange.
This paper employs models from four different years to calculate environmental factors for the same period, allowing a comparison of simulation results that demonstrate the response of these factors to changes in coastline and water depth. However, the scope of this study is broad, considering only the overall changes in the coastline of Laizhou Bay without incorporating other coastal factors, such as suspended kelp farming and the arrangement of artificial islands. Zeng et al. (2015) utilized actual ocean current data to estimate water exchange between Sanggou Bay and the Yellow Sea, finding that suspended kelp cultivation could change the tidal prism of the bay, thereby influencing water exchange, though its impact on tidal prism was minimal. Liu et al. (2018) concluded that strategically arranged islands could effectively enhance the flow speed between island groups, thereby providing favorable conditions for water exchange in the region. Additionally, runoff from the Yellow River and other rivers also affects Laizhou Bay. Wu et al. (2023) constructed hydrodynamic models with and without Yellow River runoff to compare the effects of runoff presence on bay water exchange, finding that Yellow River runoff can shorten the residence time of tracers in parts of Laizhou Bay. Future research will consider more influencing factors and establish a more comprehensive model to study the impact of changes in the coastline and water depth of Laizhou Bay on its tidal prism and water exchange.
5 Conclusions
To understand the impact of changes in coastline and water depth on the tidal prism and water exchange in Laizhou Bay, this paper selected four characteristic years: 1990, 2003, 2013, and 2023. Based on remote sensing image data, the changes in the length of Laizhou Bay’s coastline, the degree of development and utilization, and variations in water depth were analyzed and compared. Using the Delft3D software, hydrodynamic numerical models for these four characteristic years of Laizhou Bay were established. The simulation results at various observation sites showed good agreement with the actual measurements, which allowed further investigation into the changes in the tidal currents and residual flows in Laizhou Bay, as well as the impact of changes in the coastline and water depth on the tidal prism and water exchange of the marine area. The conclusion is as follows:
1. Under different coastline and water depth conditions, the velocity distribution pattern of the tidal current field remains the same overall, characterized by lower velocities near the coast, higher in the middle, and the highest on the southern side of the Yellow River estuary. The differences between the years are only numerical. The maximum flow speeds during flood and ebb tides occur downstream of the Yellow River estuary, where changes in topography significantly affect the speed and direction of tidal currents. The velocity of the Eulerian residual flow is much lower than that of the tidal currents, suggesting that the hydrodynamics of Laizhou Bay are dominated by tidal currents. Unlike the tidal currents, the residual flow shows greater velocities near the coast than in the middle, with similar distribution patterns across different years. The distribution of residual current fields resembles the pattern of water exchange between the bay and the open sea. Tidal currents and residual currents both play a role in controlling the distribution of materials within Laizhou Bay to some extent.
2. Over the past 30 years (1990-2023), the tidal prism in Laizhou Bay has exhibited varying degrees of change annually, showing an overall decreasing trend. Compared to 1990, the tidal prism of spring, mid, and neap tides in 2023 decreased by 2.03%, 6.36%, and 10.19%, respectively. The reduction in sea area is the primary reason for the decrease in tidal prism in Laizhou Bay, as extensive land reclamation and development have occupied marine space, reducing the bay’s capacity to accommodate seawater. Additionally, marine engineering projects primarily around Guangli and Weifang ports have impacted the hydrodynamic environment of Laizhou Bay, leading to a reduction in tidal range and, consequently, a decrease in tidal prism.
3. The water exchange capacity of Laizhou Bay has also shown a declining trend. The half-exchange time effectively reflects the water exchange capacity of the marine area. Calculations show that the half-exchange time in Laizhou Bay was 71 days in 1990, 73 days in 2003, 81 days in 2013, and in 2023, it was only slightly higher than in 2013, increasing by just one day. The primary reason is that changes in the coastline and water depth have altered the hydrodynamic environment within the bay. The reduction in tidal prism decreases the level of exchange between the bay and the open sea, as well as the transmission and diffusion of pollutants, weakening the bay’s self-cleansing ability and thus affecting the rate of water exchange.
Changes in coastline and water depth have had a notable impact on the hydrodynamic environment of Laizhou Bay, including its tidal currents, tidal prism, and water exchange. These changes, in turn, affect the bay’s capacity to assimilate pollutants, reduce the water environment’s capacity, and even impact the socio-economic development of the coastal areas. This study provides a rational evaluation of the hydrodynamic environment and its effects in Laizhou Bay, offering scientific references for the rational use of tidal flats and bay resources, as well as for the development and protection of the bay.
Data availability statement
The raw data supporting the conclusions of this article will be made available by the authors, without undue reservation.
Author contributions
JS: Conceptualization, Data curation, Formal analysis, Software, Supervision, Validation, Writing – original draft, Writing – review & editing. LP: Data curation, Formal analysis, Supervision, Validation, Writing – original draft, Writing – review & editing. XZ: Data curation, Formal analysis, Supervision, Validation, Writing – original draft, Writing – review & editing. ZL: Data curation, Formal analysis, Supervision, Validation, Writing – original draft, Writing – review & editing. HS: Writing – review & editing, Funding acquisition, Resources, Visualization. CZ: Writing – review & editing, Funding acquisition, Resources, Visualization. ZY: Writing – review & editing, Funding acquisition, Resources, Visualization.
Funding
The author(s) declare financial support was received for the research, authorship, and/or publication of this article. This research was funded by the Research Grant (42476163, 42330406) from the Natural Science Foundation of China (NSFC) and Yantai Science and Technology Innovation Project (2023JCYJ097,2023JCYJ094).
Conflict of interest
Author HS was employed by the company Yantai Kekan Marine Technology Co., Ltd.
The remaining authors declare that the research was conducted in the absence of any commercial or financial relationships that could be construed as a potential conflict of interest.
Publisher’s note
All claims expressed in this article are solely those of the authors and do not necessarily represent those of their affiliated organizations, or those of the publisher, the editors and the reviewers. Any product that may be evaluated in this article, or claim that may be made by its manufacturer, is not guaranteed or endorsed by the publisher.
References
Chadwick D. B., Largier J. L. (1999). The influence of tidal range on the exchange between San Diego Bay and the ocean. J. Geophysical Research: Oceans 104, 29885–29899. doi: 10.1029/1999JC900166
Chen F., Zhou G. H., Kong J. (2023). Anthropogenic influences on the hydrodynamic and tidal discharge in tongzhou bay, nantong, China. J. Physics: Conf. Series. 2486, 012042. doi: 10.1088/1742-6596/2486/1/012042
Chu N., Yao P., Ou S. Y., Wang H., Yang H., Yang Q. S., et al. (2022). Response of tidal dynamics to successive land reclamation in the Lingding Bay over the last century. Coast. Eng. 173, 104095. doi: 10.1016/j.coastaleng.2022.104095
Deng J., Harff J., Li Y., et al. (2016). Morphodynamics at the coastal zone in the Laizhou Bay, Bohai Sea. J. Coast. Res. 74), 59–69. doi: 10.2112/SI74-006.1
Gao G. D., Wang X. H., Bao X. W., et al. (2014). Land reclamation and its impact on tidal dynamics in Jiaozhou Bay, Qingdao, China. Estuarine Coast. Shelf Sci. 151, 285–294. doi: 10.1016/j.ecss.2014.07.017
Gao M., Hou G., Dang X., Huang X. (2020). Sediment distribution characteristics and environment evolution within 100 years in western Laizhou Bay, Bohai Sea, China. China Geology 3 (3), 445–454. doi: 10.31035/cg2020036
Han H., Gao F., Ding D., Ma L. (2024). Influence of reclamation project on tidal volume and water exchange in Sanmen Bay. Mar. Geology Front. 40 (5), 40–50. doi: 10.16028/i.1009-2722.2022.237
Hou X. Y., Wu T., Hou W., Chen Q., Wang Y. D., Yu L. J., et al. (2016). Characteristics of coastline changes in mainland China since the early 1940s. Sci. China Earth Sci. 59, 1791–1802. doi: 10.1007/s11430-016-5317-5
Huang P. Y., Hu H., Zhang M. (2019). Cumulative effect of the perennial reclamation projects on water exchange in Sanmen Bay[C]//IOP Conference Series: Earth and Environmental Science. IOP Publishing 344 (1), 012156. doi: 10.1088/1755-1315/344/1/012156
Huang J., Xu J., Gao S., Zhang W., Liu A. (2015). Analysis of influence on the Bohai Sea tidal system induced by coastline modification. J. Coast. Res. 73, 359–363. doi: 10.2112/SI73-063.1
Ihsan Y. N. (2020). Marine macro debris transport based on hydrodynamic model before and after reclamation in Jakarta Bay, Indonesia. Malaysian J. Appl. Sci. 5, 100–111. doi: 10.37231/myjas.2020.5.2.241
Jiang S. H., Zhu L. H., Hu R. J., Zhang W., Liu A. (2015). The hydrodynamic response to reclamation in Laizhou Bay. Periodical Ocean Univ. China 45 (10), 74–80. doi: 10.16441/j.cnki.hdxb.20140264
Kuo A. Y., Neilson B. J. (1988). A modified tidal prism model for water quality in small coastal embayments. Water Sci. Technol. 20, 133–142. doi: 10.2166/wst.1988.0197
Li P., Li G., Qiao L., Chen X. E., Shi J. H., Gao F., et al. (2014). Modeling the tidal dynamic changes induced by the bridge in Jiaozhou Bay, Qingdao, China. Continental Shelf Res. 84, 43–53. doi: 10.1016/j.csr.2014.05.006
Liu C., Chang J., Chen M., et al. (2020). Dynamic monitoring and its influencing factors analysis of coastline in the Laizhou Bay since 1985. J. Coast. Res. 105, 18–22. doi: 10.2112/JCR-SI105-004.1
Liu T., Liu Y., Hou Z. (2018). “Numerical study on influence of water exchange for artificial island group,” in IOP conference series: earth and environmental science, vol. 171. (Shanghai, China: IOP Publishing), 012016. doi: 10.1088/1755-1315/171/1/012016
Lu J., Zhang Y., Lv X., et al. (2022). The temporal evolution of coastlines in the Bohai Sea and its impact on hydrodynamics. Remote Sens. 14, 5549. doi: 10.3390/rs14215549
Lv T., Su B., Wang J. Y., Jin Y., He X., Yu H. M., et al. (2017). The hydrodynamic environment variability of Laizhou bay response to the marine engineering. Mar. Environ. Sci. 36 (04), 571–577. doi: 10.13634/j.cnki.mes20170414
Park S. E., Lee W. C., Hong S. J., et al. (2011). Variation in residence time and water exchange rate by release time of pollutants over a tidal cycle in Masan Bay. J. Korean Soc. Mar. Environ. Energy 14, 249–256. doi: 10.7846/JKOSMEE.2011.14.4.249
Pelling H. E., Uehara K., Green J. A. M., et al. (2013). The impact of rapid coastline changes and sea level rise on the tides in the Bohai Sea, China. J. Geophysical Research: Oceans 118, 3462–3472. doi: 10.1002/jgrc.20258
Rusdiansyah A., Tang Y., He Z., et al. (2018). The impacts of the large-scale hydraulic structures on tidal dynamics in open-type bay: numerical study in Jakarta Bay. Ocean Dynamics 68, 1141–1154. doi: 10.1007/s10236-018-1183-3
Shi J., Li G., Wang P., et al. (2011). Anthropogenic influences on the tidal prism and water exchanges in Jiaozhou Bay, Qingdao, China. J. Coast. Res. 27, 57–72. doi: 10.2112/JCOASTRES-D-09-00011.1
Tian Z. H., Shi J. H., Liu Y. Y., Wang W., Liu C. H., Li F. F., et al. (2023). Response of sea water exchange processes to monsoons in jiaozhou bay, China. Sustainability 15(21):15198. doi: 10.3390/su152115198
Wang K., Guo N., Wang N. B., et al. (2013). Water exchange simulation and application of conservative track prediction model of water quality in Liaodong Bay. Fisheries Sci. (Dalian) 32 (8), 475–481. doi: api.semanticscholar.org/Corpus
Wang M., Han M., Hui H., et al. (2021). Effects of human activities in the coastal zone of Laizhou Bay. Ecol. Chem. Eng. S 28, 219–227. doi: 10.2478/eces-2021-0016
Wang Y. H., Tang L. Q., Wang C. H., et al. (2014). Combined effects of channel dredging, land reclamation and long-range jetties upon the long-term evolution of channel-shoal system in Qinzhou bay, SW China. Ocean Eng. 91, 340–349. doi: 10.1016/j.oceaneng.2014.09.024
Wang Y. G., Wei Z. X., Fang G. H., et al. (2014). A numerical study on the effect of changes in water depth and coastlineon M2 tidal component near the Yellow River estuary. Adv. Mar. Sci. 32 (02), 141–147. doi: api.semanticscholar.org/Corpus
Wang Y., Wu D., Lin X., Zheng P. (2009). “Numerical study on the time of water exchange and the variation of pollutants’ concentration in Bohai bay under the effect of M2 constituent,” in 2009 3rd international conference on bioinformatics and biomedical engineering (Beijing, China: IEEE), 1–5. doi: 10.1109/ICBBE.2009.5163137
Wisha U. J., Al Tanto T., Pranowo W. S., et al. (2018). Current movement in Benoa Bay water, Bali, Indonesia: Pattern of tidal current changes simulated for the condition before, during, and after reclamation. Regional Stud. Mar. Sci. 18, 177–187. doi: 10.1016/j.rsma.2017.10.006
Wu Z., Zhou C., Wang P., et al. (2023). Responses of tidal dynamic and water exchange capacity to coastline change in the Bohai Sea, China. Front. Mar. Sci. 10, 1118795. doi: 10.3389/fmars.2023.1118795
Xie M. X., Yao S., Liu Y. Q., et al. (2013). Environmental assessment of the water exchange ability of shuidong bay, China based on numerical simulations. Advanced Materials Res. 726, 1006–1011. doi: 10.4028/www.scientific.net/AMR.726-731
Xiong J., Shen J., Qin Q., et al. (2021). Water exchange and its relationships with external forcings and residence time in Chesapeake Bay. J. Mar. Syst. 215, 103497. doi: 10.1016/j.jmarsys.2020.103497
Xu Y., Gao H., Wei X., Zhu J. (2021). The effects of reclamation activity and Yellow River runoff on coastline and area of the Laizhou Bay, China. J. Ocean Univ. China 20, 729–739. doi: 10.1007/s11802-021-4746-8
Xu Y. K., Wang Y. T., Hu S., Zhu Y. L., Zuo J. C., Zeng J. N., et al. (2023). Study on the impact of the coastline changes on hydrodynamics in xiangshan bay. Appl. Sci. 13 (14), 8071. doi: 10.3390/app13148071
Xu H., Wang G., Huang Z., Su Y. Q., Bai Y. C., Zhang J. B., et al. (2023). Hydrodynamic interactions between tide and runoff in the Luanhe Estuary in Bohai Sea, China: From aquaculture reclamation to restoration. Ocean Coast. Manage. 239, 106586. doi: 10.1016/j.ocecoaman.2023.106586
Xu J., Zhang Z., Zuo L., Wen Q., Liu B. (2013). “Temporal and spatial analysis of coastline changes in the Bohai rim based on RS and GIS,” in 2013 the international conference on remote sensing, environment and transportation engineering (RSETE 2013) (Atlantis Press), 731–734. doi: 10.2991/rsete.2013.177
Xu C., Zhou C., Ma K., Wang P., Yue X. (2021). Response of water environment to land reclamation in jiaozhou bay, China over the last 150 years. Front. Mar. Sci. 8, 750288. doi: 10.3389/fmars.2021.750288
Yang Y., Chui T. F. M. (2017). Hydrodynamic and transport responses to land reclamation in different areas of semi-enclosed subtropical bay. Continental Shelf Res. 143, 54–66. doi: 10.1016/j.csr.2017.06.008
Ying C., Li R., Li X., et al. (2018). Anthropogenic influences on the tidal prism and water exchange in Yueqing Bay, Zhejiang, China. J. Coast. Res. 85), 961–965. doi: 10.2112/SI85-193.1
Yu X. X., Wang Z. J., Leng X., Liu D. L., Yang X. N., Zhang Q. C., et al. (2022). Effects of mariculture on hydrodynamic conditions in Laizhou Bay. Periodical Ocean Univ. China 52 (8), 132–139. doi: 10.16441/j.cnki.hdxb.20220082
Zeng D., Huang D., Qiao X., et al. (2015). Effect of suspended kelp culture on water exchange as estimated by in situ current measurement in Sanggou Bay, China. J. Mar. Syst. 149, 14–24. doi: 10.1016/j.jmarsys.2015.04.002
Zhang H. X., Shen Y. M., Tang J., et al. (2023). Numerical investigation of successive land reclamation effects on hydrodynamics and water quality in Bohai Bay. Ocean Eng. 268, 113483. doi: 10.1016/j.oceaneng.2022.113483
Zhao X., Sun Q. (2013). Influence of reclamation on hydrodynamic environment in Bohai Bay. Advanced Materials Res. 726, 3262–3265. doi: 10.4028/www.scientific.net/AMR.726-731
Keywords: Delft3D, Laizhou Bay, tidal prism, water exchange, coastline change
Citation: Sun J, Peng L, Zhu X, Li Z, Shi H, Zhan C and You Z (2024) The effects of changes in the coastline and water depth on tidal prism and water exchange of the Laizhou Bay, China. Front. Mar. Sci. 11:1459482. doi: 10.3389/fmars.2024.1459482
Received: 04 July 2024; Accepted: 01 October 2024;
Published: 23 October 2024.
Edited by:
Meilin Wu, Chinese Academy of Sciences (CAS), ChinaReviewed by:
Jinhai Zheng, Hohai University, ChinaZhifeng Wang, Ocean University of China, China
Daquan Guo, Kaust, Saudi Arabia
Copyright © 2024 Sun, Peng, Zhu, Li, Shi, Zhan and You. This is an open-access article distributed under the terms of the Creative Commons Attribution License (CC BY). The use, distribution or reproduction in other forums is permitted, provided the original author(s) and the copyright owner(s) are credited and that the original publication in this journal is cited, in accordance with accepted academic practice. No use, distribution or reproduction is permitted which does not comply with these terms.
*Correspondence: Hongyuan Shi, aHlzaGlAbGR1LmVkdS5jbg==; Chao Zhan, emhhbmNoYW8wMjI2QDE2My5jb20=
 Jiwei Sun
 Lihong Peng1
 Zikang Li
 Hongyuan Shi