 Qianhang Sun
 Jiangnan Li
 Chunhe Zhou2
 Kun Lei
95% of researchers rate our articles as excellent or good
Learn more about the work of our research integrity team to safeguard the quality of each article we publish.
Find out more
ORIGINAL RESEARCH article
Front. Mar. Sci. , 16 September 2024
Sec. Marine Ecosystem Ecology
Volume 11 - 2024 | https://doi.org/10.3389/fmars.2024.1459186
This article is part of the Research Topic Biological Invasions in Aquatic Ecosystems: Detection, Assessment and Countermeasures View all 12 articles
The characterization of variations in riverine microbiota that stem from contaminant sources and transport modes is important for understanding biogeochemical processes. However, the association between complex anthropogenic nitrogen pollution and bacteria has not been extensively investigated owing to the difficulties faced while determining the distribution of nitrogen contaminants in watersheds. Here, we employed the Nitrogen and Oxygen Stable Isotope Tools alongside microbiological analysis to explore microbial characteristics and their responses to complex nitrogen pollution patterns. Significant changes in microbial communities were observed in watersheds with different complex nitrogen pollution sources migrating. Complex nitrogen sources were closely associated with microbiota. The main sources of nitrogen pollution in the dry season watershed were Manurc and Sewage (M&S, 54.2%). M&S exhibited reduced microbial diversity, high number of denitrification groups, and increased nitrogen cycling compared with others. However, Soil Nitrogen sources (SN, 59.3%) in the watershed during the wet season were the main contributors of nitrogen in the watershed. Eluviation allows SN to increased microbial community similarity, in addition to facilitating microbial immobilization processes. Overall, this study expands our knowledge regarding microbial biogeochemistry in catchments and beyond by linking specific nitrogen pollution scenarios to microorganisms.
The influence of human activities on environmental quality is intensifying markedly. Notably, wastewater from industrial, agricultural, aquacultural, and domestic sources contributes to substantial discharges of nitrogenous compounds into aquatic ecosystems. This surge in nitrogen levels is exacerbating pollution across these environments (Lawniczak et al., 2016). To mitigate nutrient and nitrogen pollution in surface waters, numerous countries, such as China, member states of the European Union, and the United States, have implemented specific water quality regulations (EC, 1997; GB3838-2002, 2002; USEPA, 2015). In river ecosystems, nitrate pollution can lead to eutrophication and algal blooms, which diminish oxygen availability for aquatic life. This reduction in oxygen levels adversely impacts water quality, and disrupts food sources and habitats for numerous aquatic organisms (Diaz, 2001; Fenech et al., 2012). Microorganisms play a crucial role in riverine nitrogen cycle networks, contributing to essential processes such as nitrogen fixation, nitrification, denitrification, and anaerobic ammonia oxidation (Kuypers et al., 2018). Nitrate pollution impacts the microbial community by introducing nutrients and wastewater-derived microorganisms, as well as by altering habitat characteristics (Guo et al., 2019). Nitrate pollution in rivers has emerged as a significant global environmental issue, garnering widespread attention from society and researchers worldwide (Xue et al., 2009). Furthermore, the impacts of nitrate sources and transport on stream microbial communities and their functions remain under-researched. There is a pressing need to better characterize these microbes and elucidate their responses to various sources of nitrogen pollution.
Nitrogen in rivers primarily accumulates in four forms: organic nitrogen, ammonia nitrogen, nitrite nitrogen, and nitrate nitrogen (Tobari et al., 2010). Nitrate, noted for its high solubility and stability in surface water, constitutes the primary form of nitrogen-containing pollutants in these waters (Zhao et al., 2020). Differences in nitrate nitrogen isotope values (δ15N) have been observed among various sources. Additionally, the nitrate nitrogen-oxygen double isotope signatures (δ15N-NO3− and δ18O-NO3−) are employed to pinpoint the principal sources of NO3− in surface water (Xing and Liu, 2016; Xing et al., 2010; Xing and Liu, 2012; Zhang et al., 2018). For instance, researchers have utilized nitrate stable isotopes to determine that domestic wastewater is a significant source of nitrate pollution in an agricultural watershed (Cao et al., 2022). Similarly, Mayer et al. (2002) used NO3− double stable isotopes to determine possible sources of NO3− in 16 watersheds in the United States (Mayer et al., 2002), and Johannsen et al. (2008) determined the isotopic composition of nitrate in five German rivers flowing into the North Sea (Johannsen et al., 2008). Because the isotopic components of NO3− from different sources overlap and isotopic fractionation can blur the initial distinction between isotopic compositions, there are still some challenges in accurately estimating the relative contributions of different NO3− sources (Yi et al., 2020). The MixSIAR model employs the Markov Chain Monte Carlo (MCMC) algorithm, providing a more effective approach to addressing uncertainty issues compared to the IsoSource and mass-balance mixing models. This includes handling complexities such as seasonal variations in isotopes, isotope fractionation, and contributions from multiple sources (Deutsch et al., 2006; Guo et al., 2020; Nie et al., 2012).
Bacterial communities in rivers may react to rapid environmental changes, including physical stressors like water flow and temperature fluctuations, as well as chemical stressors such as nutrient levels (Besemer et al., 2012). The transport of nitrate can be categorized based on its sources: non-point sources, such as agricultural cultivation, and point sources, including domestic and industrial discharges. Additionally, soil leaching is recognized as a significant source of nitrate in rivers (Wu and Chen, 2013). Wastewater treatment plants (WWTP) serve as a point source of nitrate pollution, and WWTP effluent can account for a significant percentage of the flow in receiving waters. A recent analysis of current conditions in the United States showed that WWTP effluent accounted for more than 50 percent of stream flow in more than 900 receiving systems at the point of discharge (Rice and Westerhoff, 2017). Besides, China discharges more than 60 billion m3 municipal wastewater per year, of which more than 90% is treated through WWTPs (Tong et al., 2020). The proportion of effluent from wastewater treatment plants (WWTPs) relative to the total flow in receiving waters frequently alters the bacterial diversity within these streams (Price et al., 2018). Moreover, agricultural activities during the irrigation season significantly contribute to nitrate pollution (Mosley and Fleming., 2010). However, the impacts of nitrate pollution from agricultural sources on the structure and function of riverine microbial communities remain poorly understood and require further clarification.
In the present study, we quantitatively apportion the sources of NO3− contamination in the Oujiang River watershed in East China across two hydrological seasons (wet and dry) using an integrated approach. This method combines nitrate dual stable isotope signatures, hydrogeochemical parameters, land use patterns, and the MixSIAR model. Additionally, we employed 16S rRNA gene sequencing to analyze alterations in the community structure and function of microbial communities, focusing on the impacts of various pollution sources. We specifically aimed to (1) explore the spatiotemporal variations of nitrogen concentrations in different forms; (2) identify the NO3− contamination sources with the hydrogeochemical parameters and land use patterns by using multivariate statistical approaches, assess the relative contributions of potential NO3− sources to Oujiang River watershed surface water by using the MixSIAR model; and (3) to determine the characteristics of prokaryotic microorganisms and their responses to different source of nitrate pollution.
The Oujiang River is located in the south of Zhejiang Province, China. The basin ranges from 118°45′E – 121°00′E and 27°28′N – 28°48′N in China with drainage area of 18,100 km2, mainly including the Lishui City and Wenzhou City. The main river has a length 388 km and an elevation drop of 1.3 km. The average annual flow at the estuary is approximately 612 m3/s. The main tributaries of the Oujiang River are distributed in the form of dendrites. The area is dominated by in industrial and agricultural land, and urban settlements. In addition, as an important water source and sewage discharge channel in the area, it plays a pivotal role in economic development and people’s lives. In recent years, the continuous development of the economy and the acceleration of industrialization have brought more and more serious water pollution to the Oujiang River.
Water samples were collected from free-flowing reaches (FFRs) between January 13–20, 2021 and June 10–17, 2021. A total of 26 surface water samples were collected in the whole basin of the Oujiang River, including 18 from the main stream and 8 from the main tributaries (Figure 1).
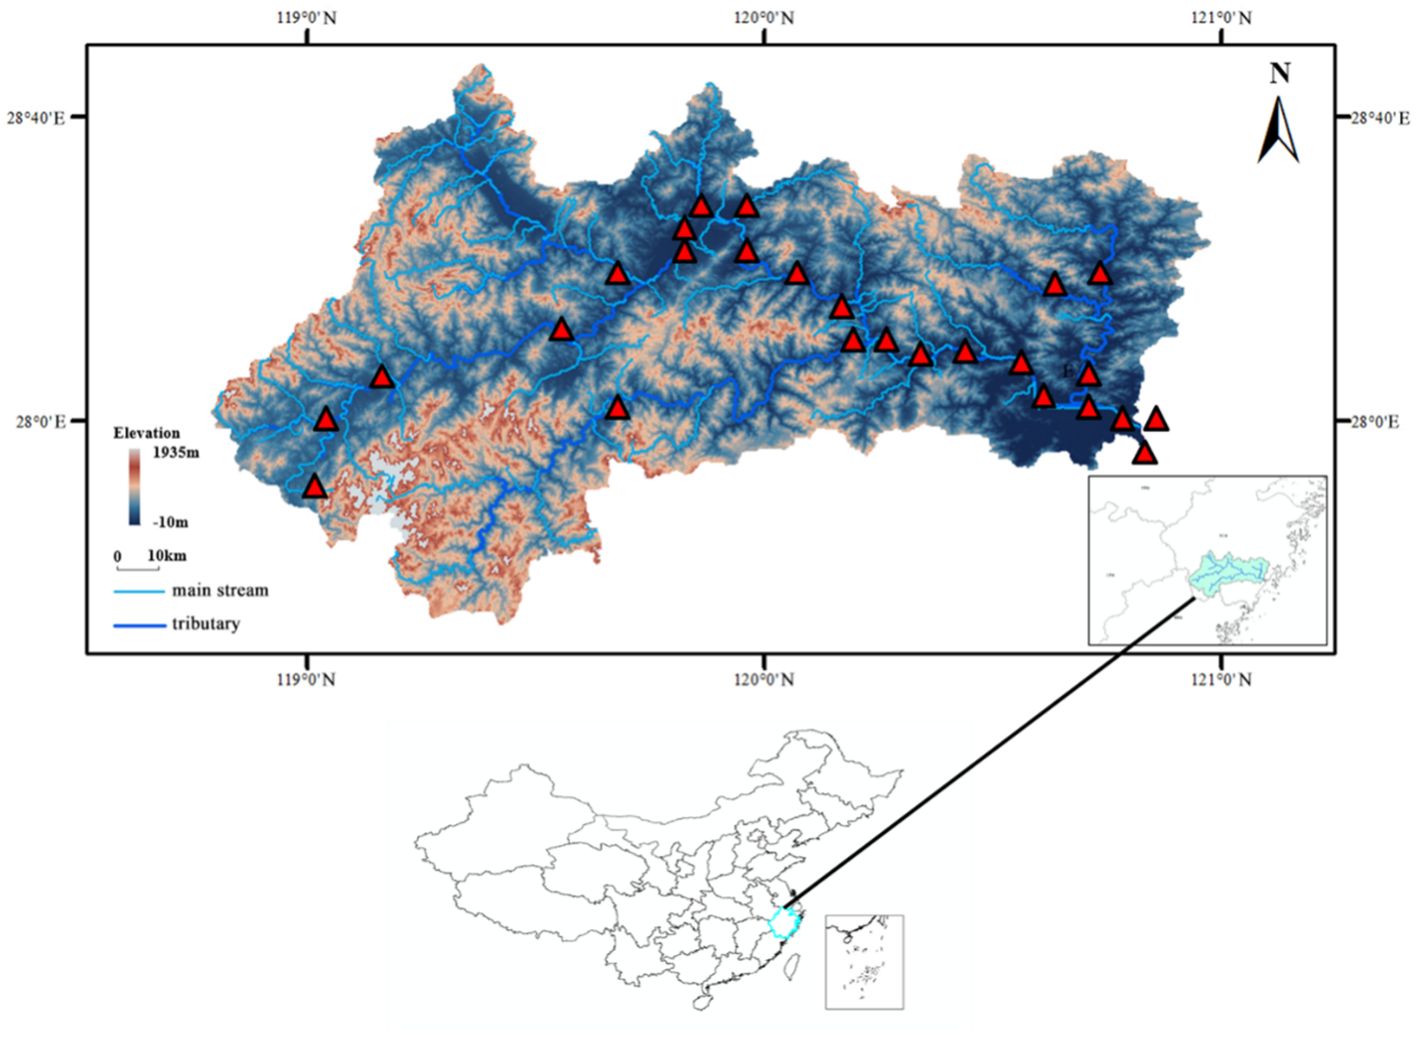
Figure 1. Location of the sampling sites in the Oujiang River Basin, China. There were 26 sampling sites in the study region, covering 8 tributaries of the Oujiang River.
The pH, water temperature (T, ˚C), electrical conductivity (EC), dissolved oxygen (DO), and oxidation-reduction potential (ORP/Eh, mV) were measured in situ using a multiparameter portable meter (HACH40d, USA) supplied by Hach Company (Loveland, CO, USA). All water samples were collected at 0.5 m below the water surface using two polyethylene bottles and preserved at 4˚C. They were then taken back to the laboratory and analyzed within 24 hours. Concentrations of chloride (Cl−), nitrate (NO3−), nitrite (NO2−), and ammonium (NH4+) were analyzed using ionchromatography (Dionex ICS-600). The δ15N-NO3− and δ18O-NO3− values were obtained using the denitrifier method, by which NO3− was converted into nitrous oxide by Pseudomonas aureofaciens, and then detected using an isotope ratio mass spectrometer (IRMS,Isoprime100, Cheadle, UK) after concentration and purification by the trace gas system (Liu et al., 2018).
The nitrogen and oxygen isotopic analysis followed (McIlvin and Altabet, 2005) by the chemical conversion of nitrate and nitrite to nitrous oxide. International standards (USGS-32 and USGS-34) were applied to calibrate “blank” samples. The stable isotopic rates were expressed in parts per thousand (‰) relative to N2 in the atmosphere and Vienna Standard Mean Ocean Water for δ15N and δ18O, respectively:
In Equation 1, δsample is the stable isotope ratio in the samples. Rsample and Rstandard are the ratios of 15N/14N or 18O/16O in the samples and the standards, respectively. Sample analysis had an average precision of ± 0.2‰ for δ15N and ± 0.5‰ for δ18O, respectively (Ji et al., 2017).
In this study, the SIAR mixing model was applied to estimate proportional contributions of NO3− sources to river water samples. The model is also applicable when multiple pollution sources exist simultaneously, and the uncertainty of the data is taken into account. By defining J isotopes of K sources and N mixtures, the equations were as follows (Parnell et al., 2010).
In Equation 2, Xij is the isotope value j of the water sample i (i = 1, 2, 3…N; j = 1,2,3…J); Pk is the proportional contribution of source k, which is calculated using SIAR; Sjk is the isotope value j of source k (k = 1, 2, 3…K) and followed a normal distribution with mean μjk and standard deviation ω2jk; Cjk is the fractionation factor for isotope j on source k and followed a normal distribution with mean λjk and standard deviation τ2jk; and ϵij is the residual error for isotope value j in mixed sample and followed a normal distribution with mean = 0 and standard deviation σ2.
In the MCMC mixing model, the isotope values of water samples were used as the “consumers”, and the “sources” profiles consisted of the average and standard deviation of each potential source obtained from the references (Supplementary Table S1). The fractionation factor was used as “corrections”. MCMC mixing model was run by using the SIAR package (Katzenberg and Waters-Rist, 2018), with a burn-in of 40,000 iterations; the model was run 400,000 times.
To estimate the contributions of NO3− sources in the Oujiang River, we used 4 potential sources of NO3−: atmospheric deposition (AD), nitrogen from soil (SON), nitrogen fertilizer (NF), and manure and sewage (M&S) were applied as specific isotope values in this study. As shown in (Supplementary Table S1), firstly, soil samples are mainly composed of organic nitrogen. The mean δ15N value was 5.0 ± 1.5‰ for SON, which was in the reported ranges summarized (Tobari et al., 2010). Then, Tobari measured the δ15N of synthetic fertilizers when studying several rivers located in the Loess Plateau. The δ15N range of ammonium bicarbonate/urea/ammonium sulfate was 0.3 ± 3.0‰. Finally, the mean δ15N value of M&S was 11.3 ± 0.2‰ (Zhang et al., 2018). Because denitrification was not identified in NO3− of surface water as described in “Results and discussion,” Cjk was set as zero (Tobari et al., 2010).
The CTAB/SDS method was used to extract the total genome DNA in samples. DNA concentration and purity were monitored on 1% agarose gels. According to the concentration, DNA was diluted to 1ng/µL with sterile water. The V3-V4 region of the microbial 16S rRNA gene was amplified by using the universal primers 341F (5′-CCT AYG GGR BGC ASC AG-3′) and 806R (5′-GGA CTA CNN GGG TAT CTA AT-3′). Mix an equal volume of 1X loading buffer (contained SYB green) with PCR products and perform electrophoresis on 2% agarose gel for DNA detection. The PCR products were mixed inequal proportions, and then Qiagen Gel Extraction Kit (Qiagen, Germany) was used to purify the mixed PCR products. Following manufacturer’s recommendations, sequencing libraries were generated with NEBNext® Ultra™ IIDNA Library Prep Kit (Cat No. E7645). The library quality was evaluated on the Qubit@ 2.0 Fluorometer (Thermo Scientific) and Agilent Bioanalyzer 2100 system. Finally, the library was sequenced on an Illumina NovaSeq platform and 250 bp paired-end reads were generated.
The 16S rRNA gene sequence data were processed by using two pipe-lines, LotuS (Hildebrand et al., 2014) and QIIME v1.9.1 as described previously. In brief, the paired-end reads were quality trimmed, merged, and clustered into operational taxonomic units (OTUs) with a threshold of ≥ 97% similarity. The reads of each OTU were classified using the Ribosomal Database Project classifier (80% confidence) based on the SILVA database v132. Quantitative analysis was performed using thespecies sequence abundance data from each sampling site. We calculated a diversity and b diversity using the ‘vegan’ package (v 2.6-4) in R. Linear discriminant analysis and effect size (LEfSe) analysis were performed using LEfSe software. Network analysis (MENA) was conducted using Spearman correlations of log-transformed OTU abundances. A threshold for the network was determined using the random matrix theory (RMT)-based method, which automatically defines the threshold (http://ieg4.rccc.ou.edu). FAPROTAX is mainly used for predicting functional profiles of biogeochemical cycling processes (especially the cycling of carbon, hydrogen, nitrogen, phosphorus, sulfur and other elements) in environmental samples.
All sequences were classified into 67 phyla (Supplementary Figure S1), The Mantel test indicated that the TN concentration in water (R = 0.35, p = 0.003) was the most significant factor correlated with microbiota composition. Co-occurrence Network results also showed that the N concentration in water was the most relevant factor (R2 = 0.61, p = 0.002) for microbiota compositions (Figure 2). In addition, nitrate and ammonia were associated substantially with microbial populations. These results confirmed the hypothesis that nitrogen concentration in the Oujiang River is a primary factor influencing the structure of microbial communities. Therefore, further investigation into the specific responses of microorganisms under various patterns of nitrogen pollution is warranted.
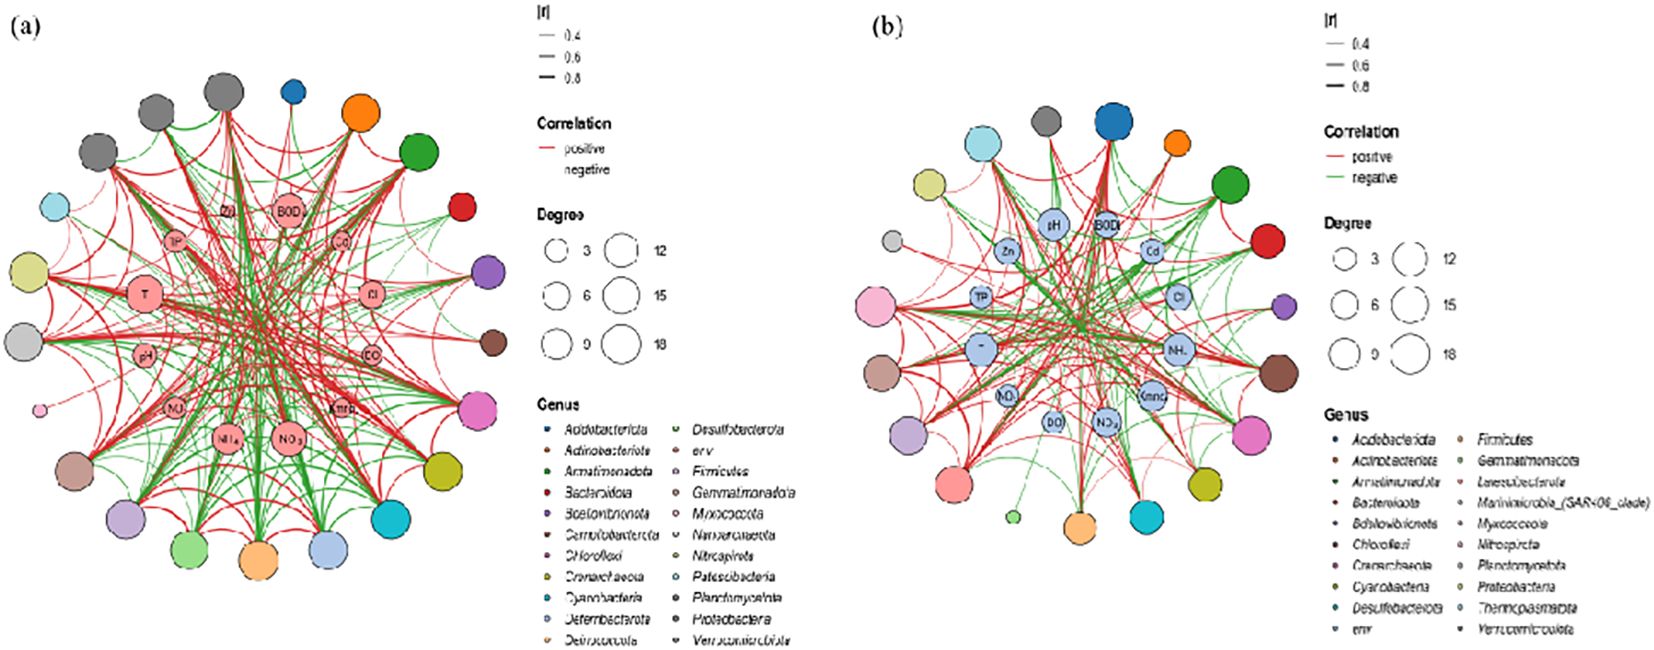
Figure 2. Network diagram of the correlation between microorganisms and environmental factors: (A) the dry season; (B) the wet season.
A summary of water quality variables measured at the 26 sampling sites in dry/wet season of the Oujiang River (Supplementary Figure S2). In dry season, NO3−-N concentrations of samples collected in the water body ranged from 0.30 to 1.99 mg·L−1, with an average concentration of 0.96 mg·L−1, the concentration of NO2−-N is from 0.01 to 0.14 mg·L−1, with an average of 0.03 mg·L−1, and the concentration of NH4+-N ranges from 0.04 to 1.06 mg·L−1, with an average value of 0.28 mg·L−1. In wet season, NO3−-N concentrations of samples collected in the water body ranged from 0.32 to 3.31 mg·L−1, with an average concentration of 1.67 mg·L−1, the concentration of NO2−-N is from 0.01 to 0.03 mg·L−1, with an average of 0.02 mg·L−1, and the concentration of NH4+-N ranges from 0.02 to 0.72 mg·L−1, with an average value of 0.16 mg·L−1. The concentration of NO3−-N in water in wet season was higher than that in dry season. In general, NO3−-N accounted for the highest concentration of inorganic nitrogen (Supplementary Figure S3) and was the main pollutant, followed by NH4+-N and then NO2−-N.
The DO concentrations of the basin averaged at 10.9 ± 0.96 mg·L−1 in dry season, and at 10.9 ± 0.96 mg·L−1 in wet season, suggesting oxidation environment. People studied the behavior of the nitrification system during consecutive changes in DO values (Ruiz et al., 2003). The results showed that DO had no influence on nitrite accumulation at values of 2.7–5.7 mg·L−1.
Elevated riverine Cl− concentrations are derived from fertilizer, manure and wastewater discharge, etc. It can often serve as an indicator of different pollutant sources, due to Cl− which has good stability (Kellman and Hillaire-Marcel, 1998; Mengis et al., 1999). The concentration of Cl− is from 14.40 to 46.50 mg·L−1, with an average of 28.74 mg·L−1 in dry season. The concentration of Cl− is from 10.03 to 23.54 mg·L−1, with an average of 13.88 mg·L−1 in wet season. Most samples show low NO3−/Cl− ratio (< 0.1) and high Cl− concentration. It indicates that domestic sewage and livestock manure are one of the main possible sources of nitrate (Yue et al., 2017). The NO3−/Cl− ratio in wet season is higher than that in dry season, the ratio of influence of agricultural non-point source fertilizer is higher in irrigation season (Pei et al., 2022).
The application of NO3− stable isotope technology for identifying the sources of NO3− in riverine environments relies on the inherent stability of NO3−-N once it enters the aquatic system. During the migration and transformation of nitrogen in aquatic environments, a series of biochemical processes including nitrification, denitrification, nitrogen fixation, mineralization, and volatilization lead to nitrogen isotope fractionation. This fractionation significantly influences the isotopic composition of both nitrate nitrogen and oxygen. Notably, processes such as mineralization and nitrogen fixation typically exhibit less pronounced isotopic fractionation (Jin et al., 2021). The process of ammonia volatilization is governed by pH levels. At a pH of approximately 9.3, NH4+ in aqueous solutions is converted to NH3. When the pH is below 9.3, ammonia nitrogen remains in its ionic state (Kendall, 1998). In the study area, the pH value at each sampling point was below 9.3, indicating that the effect of ammonia volatilization on nitrate isotope composition was negligible. Nitrification, the oxidation of NH4+ to NO3−, plays a pivotal role in the nitrogen cycle and serves as a crucial mechanism for replenishing NO3− in the natural environment. Theoretically, during nitrification, two-thirds of the oxygen atoms should originate from water, while the remaining one-third should come from atmospheric O2 (Bottcher et al., 1990). From this, the following formula can be obtained:
The theoretical value of δ18O-O2 in the atmosphere is 23.5‰, δ18O-H2O is usually between −25‰~4‰. According to Equation 3, if nitrification occurs process occurs, δ18O-NO3− values should range from −8.33‰ to 10.5‰ (Pei et al., 2022). The δ18O-NO3− values in both dry and wet seasons were within the range, so the conversion process of nitrate in the Oujiang River Basin is mainly nitrification (Figure 3). In addition, the effect of isotope fractionation can be ignored when the nitration reaction is complete.
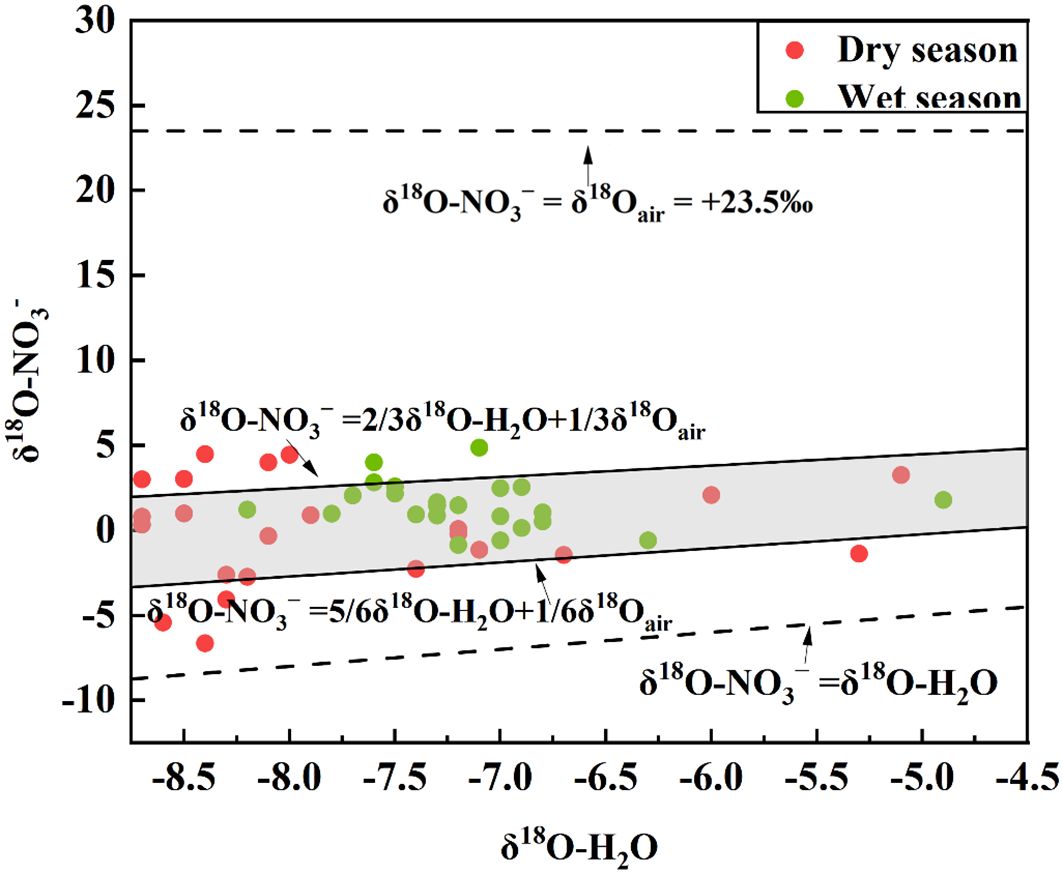
Figure 3. The shaded region in the plot represents the area corresponding to nitrification, comparing the δ18O values of water (H2O) and nitrate (NO3−).
Denitrification refers to the reduction process of NO3− to nitrogen (N2) and nitrous oxide (N2O) under anaerobic conditions, which can effectively reduce the degree of NO3−pollution in water (Brandes and Devol, 1997). Some relevant studies have suggested that denitrification causes a correlation between δ15N and δ18O in the ratio of 1.3 to 2 in the aquatic system. Oujiang River basin samples were basically not in this range, in addition, OU11 samples has denitrification process in the water body due to the interception effect of gates and dams. In addition, denitrifying enzyme requires O2 concentration lower than 0.2 mg/L (Yue et al., 2014). The average DO value in the Oujiang River basin was 10.9 mg/L in the dry water season and 10.1 mg/L in the wet water season. Therefore, the fractionation effect of denitrification on isotope production is not considered, and the fractionation factor Cjk in Equation 3 is set to 0.
In the Oujiang River basin, the δ15N-NO3− and δ18O-NO3− ranged from 2.17‰ – 23.09‰ and −6.64‰ – 9‰, respectively, during the wet season, and were slightly higher during the dry season (δ15N-NO3−,0.56‰ – 10.1‰; δ18O-NO3−, −0.86‰ – 9.87‰). The results showed that exogenous nitrate inputs in the Oujiang River Basin were mainly FN (Nitrogen Fertilizer), SN (Soil Nitrogen) and M&S (Manure&Sewage) (Figure 4).
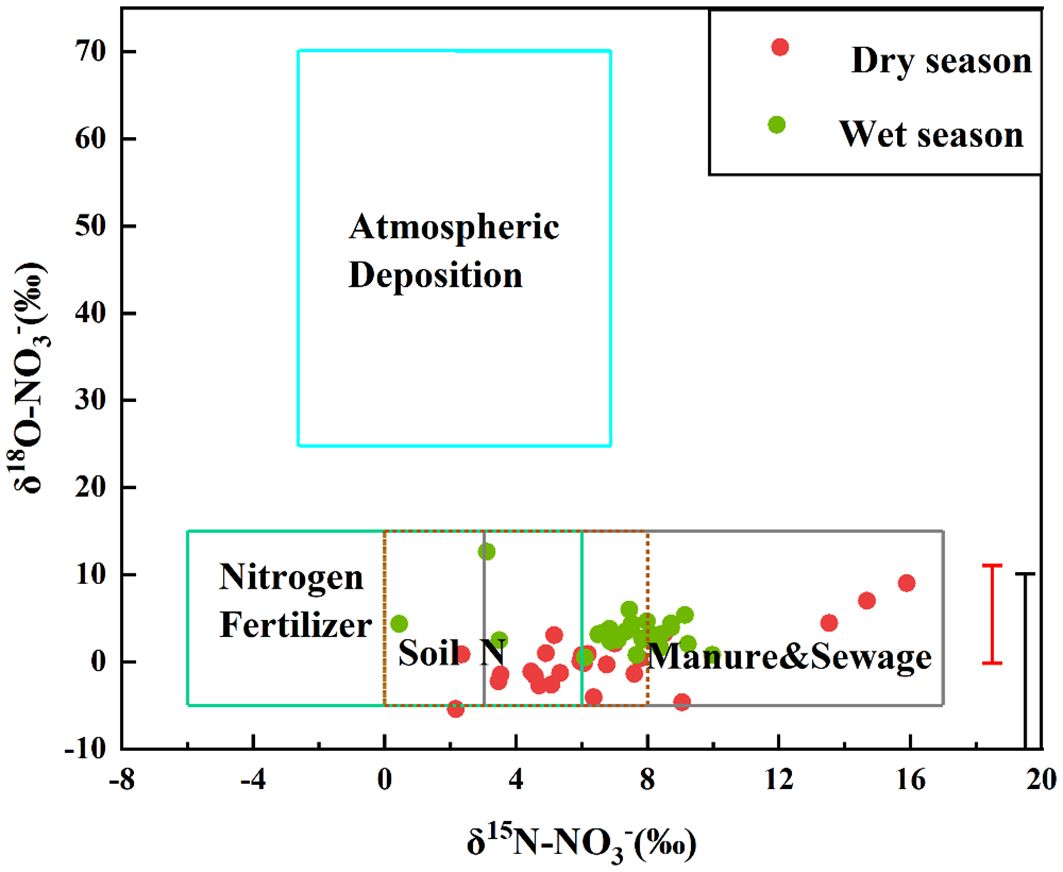
Figure 4. Plot of δ15N-NO3− versus δ18O-NO3−.
The classic dual isotope bi-plot approach facilitated tracing the dominant sources affecting NO3− concentrations in the river system. The typical δ15N value of NO3− in precipitation ranged from −3 to +7‰ (Xu et al., 2014). NH4+ fertilizer and NO3− fertilizer were commonly used synthetic fertilizers, which were produced by atmospheric N2 fixation; thus, the δ15N value of these fertilizers was similar, ranging from −6 to +6‰ (Kendall, 1998). The δ15N-NO3− deposited through soil nitrogen exhibited a large variation, with values ranging from 0 to +8‰ (Kendall, 1998). The NO3–N derived from M&S generally had a high δ15N value ranging from +3 to +17‰ (Xu et al., 2014). For δ18O, NO3− in precipitation and NO3− fertilizer had the typical value ranging from +25 to +70‰ and +17 to +25‰, respectively (Kendall, 1998; Amberger and Schmidt 1987), while the δ18O-NO3− values sourced from microbial nitrification of NH4+ fertilizer, N soil and M&S often vary from −5 to +15‰ (Kendall, 1998; Mayer et al., 2001).
Figure 4 illustrates that the δ15N- NO3− and δ18O- NO3− values for the majority of water samples fall within the typical range observed for manure and sewage, soil nitrogen, and nitrogen fertilizer. This suggests that these three sources are the primary contributors to NO3− levels in the Oujiang River Basin. This finding corroborates the conclusions from the analysis presented in section 3.2.1. Notably, the isotopic signatures of some samples overlap with those of the three primary nitrate sources. Comparative analysis between the wet and dry seasons reveals that the contribution of soil nitrogen as a nitrate source is more significant during the wet season. This difference is likely due to increased precipitation, which enhances soil leaching and the subsequent transport of nitrate into the river. As a result, the prominence of soil nitrogen as a source of nitrate in the Oujiang River Basin escalates during the wet season.
The results of the MixSIAR simulation showed that the contribution of M&S to nitrate in the basin was 54.2% during the dry season, which was significantly higher than during the abundant water season (21.6%). This difference may be an amplification effect due to low flows during dry seasons (Ongley et al., 2010). In addition, SN was the main source of exogenous nitrate in the Oujiang River basin during the abundant water season, contributing 59.3%, which was slightly higher than during the dry water season (36.1%) (Figure 5). Precipitation is high during seasons of abundance, and previous studies have shown that precipitation may lead to intensive leaching of AF (Atmospheric Deposition) and SN, resulting in their high contribution to nitrate pollution in receiving waters (Jiang et al., 2021). There is a consistent relationship between land use types and water chemistry indicators, as evidenced by the MixSIAR model calculations (Supplementary Figure S4).
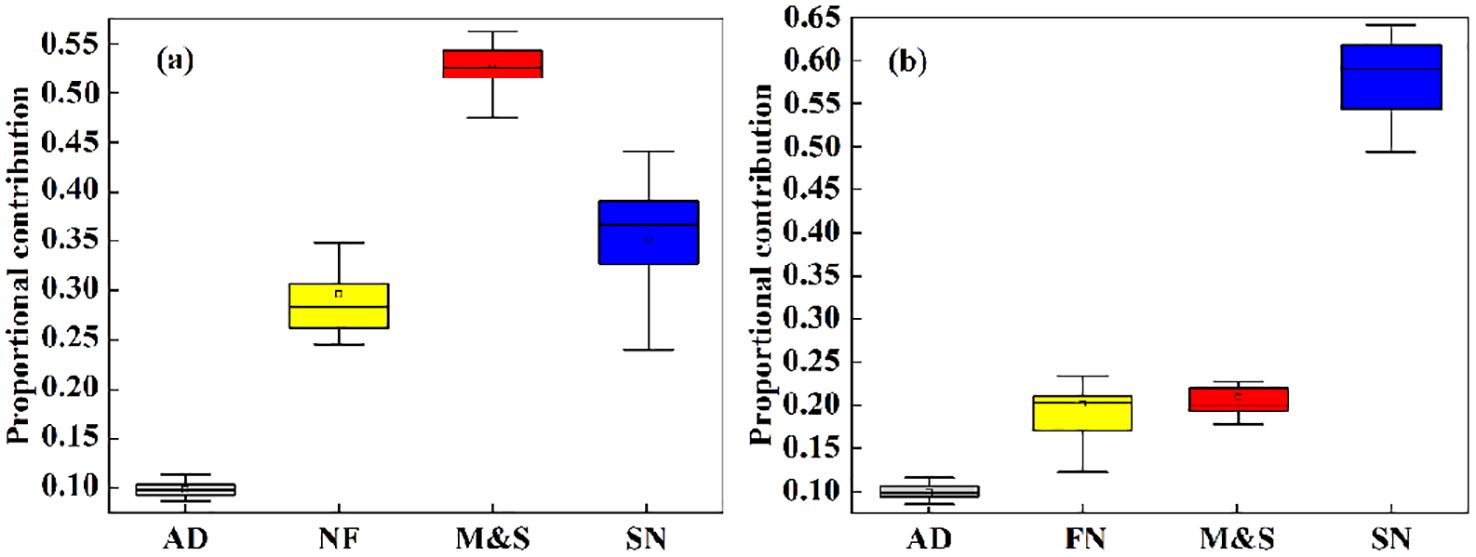
Figure 5. The proportional contributions of each pollution source are depicted in boxplots, illustrating the 5th, 95th, mode, and mean values for both (A) the dry season and (B) the wet season.
Based on the contribution of nitrogen sources (greater than 50%) from the two seasons simulated by the MixSIAR model (Supplementary Figure S5), the sampling sites were categorized into three groups: SN, FN, and M&S. The samples from SN, FN, and M&S clustered into three distinct groups, thereby confirming the hypothesis that basins with different contaminant transport modes support distinct microbial communities.
The microbiota of M&S exhibited significantly higher species richness (p = 0.041; Wilcoxon rank-sum tests) (Figure 6A) and community diversity (p = 0.020; Wilcoxon rank-sum tests) (Figure 6B) than those of FN and SN, indicating increased within-habitat diversity. FN and SN demonstrated a higher number of microbial species than M&S. This may be due to the following: (1) the presence of hazardous substances in the effluents of M&S, such as halogenated organics and antibiotics, possibly prevent the propagation of certain microbes in the receiving rivers (Zhang et al., 2020) and (2) M&S source-influenced regions, excessive nitrogen levels may help homogenize the microbial communities, engendering the loss of majority of the species and substitution with less expanding species, thereby reducing biodiversity (Monchamp et al., 2018). Our findings indicated that the microbial community in M&S exhibit reduced microbial population size and diversity, thereby potentially favoring certain functional groups and causing biotic homogenization (Drury et al., 2013; Lu et al., 2014). The results of the community distance analysis revealed (Supplementary Figure S7) that microbial community distances generally increased with the rising contribution of nitrogen sources, accompanied by a decrease in similarity. Interestingly, during seasons of abundant water, a notable pattern emerged: microbial communities displayed decreasing community distances and increasing similarity as the contribution of soil nitrogen increased.
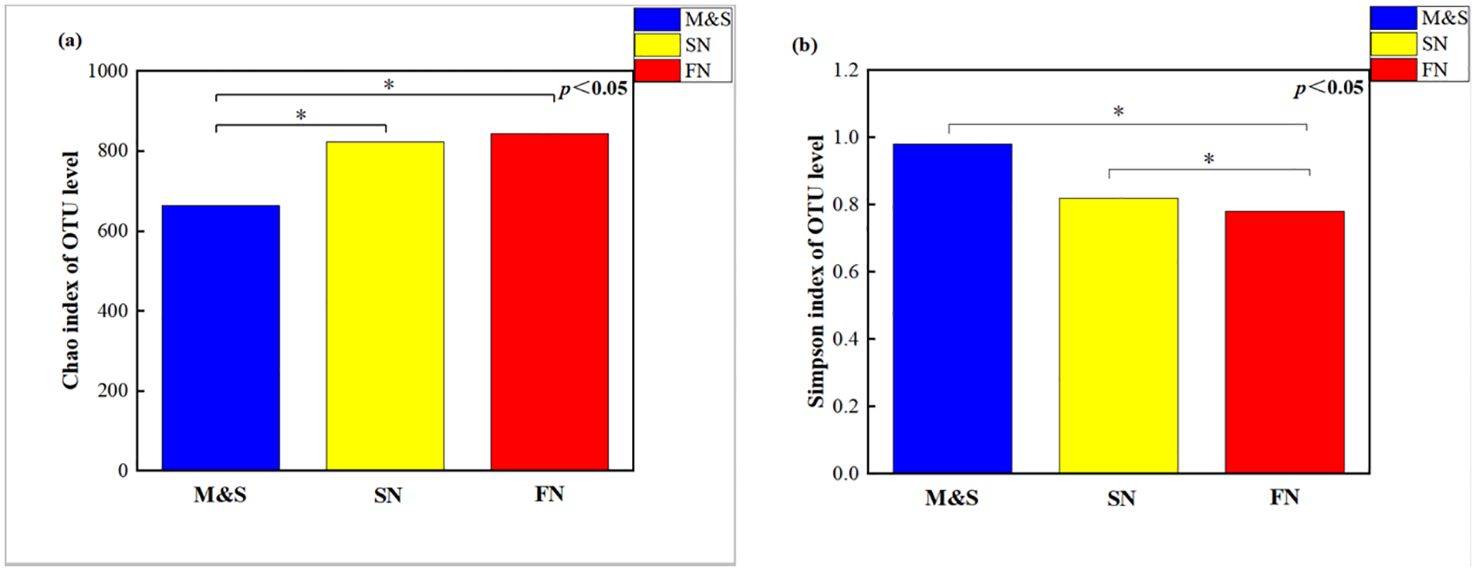
Figure 6. Wilcoxon rank-sum tests for the (A) Chao index and (B) Simpson index for the M&S group, the SN group, and the FN group.
In the indicator species analysis, distinct indicator species were identified for each of the two water seasons across the SN, FN, and M&S groupings, as shown in Figure 7. During the dry season, the M&S group exhibited higher indicator values compared to the FN and SN groups. Conversely, during the wet season, the FN group displayed larger indicator values than the other two groups. This variation may be attributed to the relatively high discharge of domestic wastewater in winter when river volumes are low and it is not the agricultural irrigation season. Conversely, in summer, agricultural activity peaks, leading to increased use of fertilizers and enhanced runoff from rainwater scouring, which carries more paddy water into the river (Li et al., 2023). Higher effluent concentrations correlated with a decrease in hgcI_clade abundance, while simultaneously matching the patterns of genes associated with nitrogen cycling pathways, such as denitrification and nitrogen fixation, as detailed by (Ruprecht et al., 2021). Within the SN group, Chryseobacterium is identified as a pivotal taxon in woodland soil microbial communities, playing a significant role in the decomposition of apoplastic materials (Zheng et al., 2021). Additionally, Leptospira bacteria within the FN group serve as important indicator flora for the rice field root system, effectively signaling the agricultural contribution to nitrate nitrogen levels (Zheng et al., 2021). The findings from the indicator flora analysis offer significant research value for future efforts in tracing nitrogen pollution.
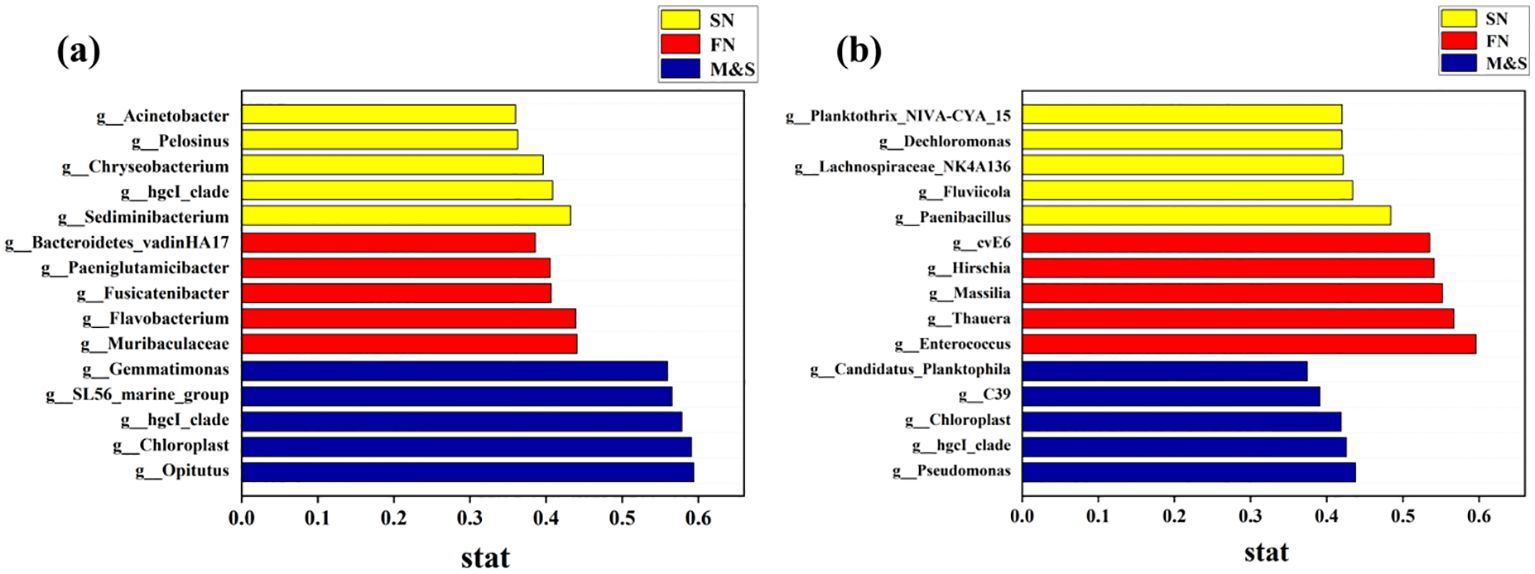
Figure 7. Indicator species for the (A) dry season and (B) wet season for the M&S group, the SN group, and the FN group.
In the dry season, significantly higher levels of predicted functions involved in nitrate reduction (p< 0.05), nitrate respiration (p< 0.1), and nitrogen respiration (p< 0.1), as determined by the Kruskal-Wallis test, were observed in the M&S group compared to other groups (Figure 8). These findings align with previous analyses indicating that M&S sources can accelerate nitrogen transformation in rivers. This effect is likely due to the fact that sewage from point sources undergoes various wastewater treatment processes before being discharged into the river, thereby creating unique microenvironments that foster the aggregation of nitrogen-related taxa (Potgieter, 2019). Additionally, anaerobic microbes were found to be more abundant in M&S than in FN and SN, suggesting that these locations are ideal for anaerobic denitrification processes. In contrast, during the wet season, chemical nitrogen fertilizers are necessary throughout the growth seasons of crops to achieve sufficient yields. However, the nitrogen use efficiency for cereals has fallen to approximately 34% (Food and Agriculture Organization, 2022), with the remaining approximately 56% of nitrogen fertilizer lost to land and water systems (Guo et al., 2023). Consequently, FN and SN are associated with increased nitrogen fixation and nitrification processes in the water column (Li et al., 2020). Nonetheless, field data revealed no significant differences in dissolved oxygen (DO) levels between M&S, FN, and SN.
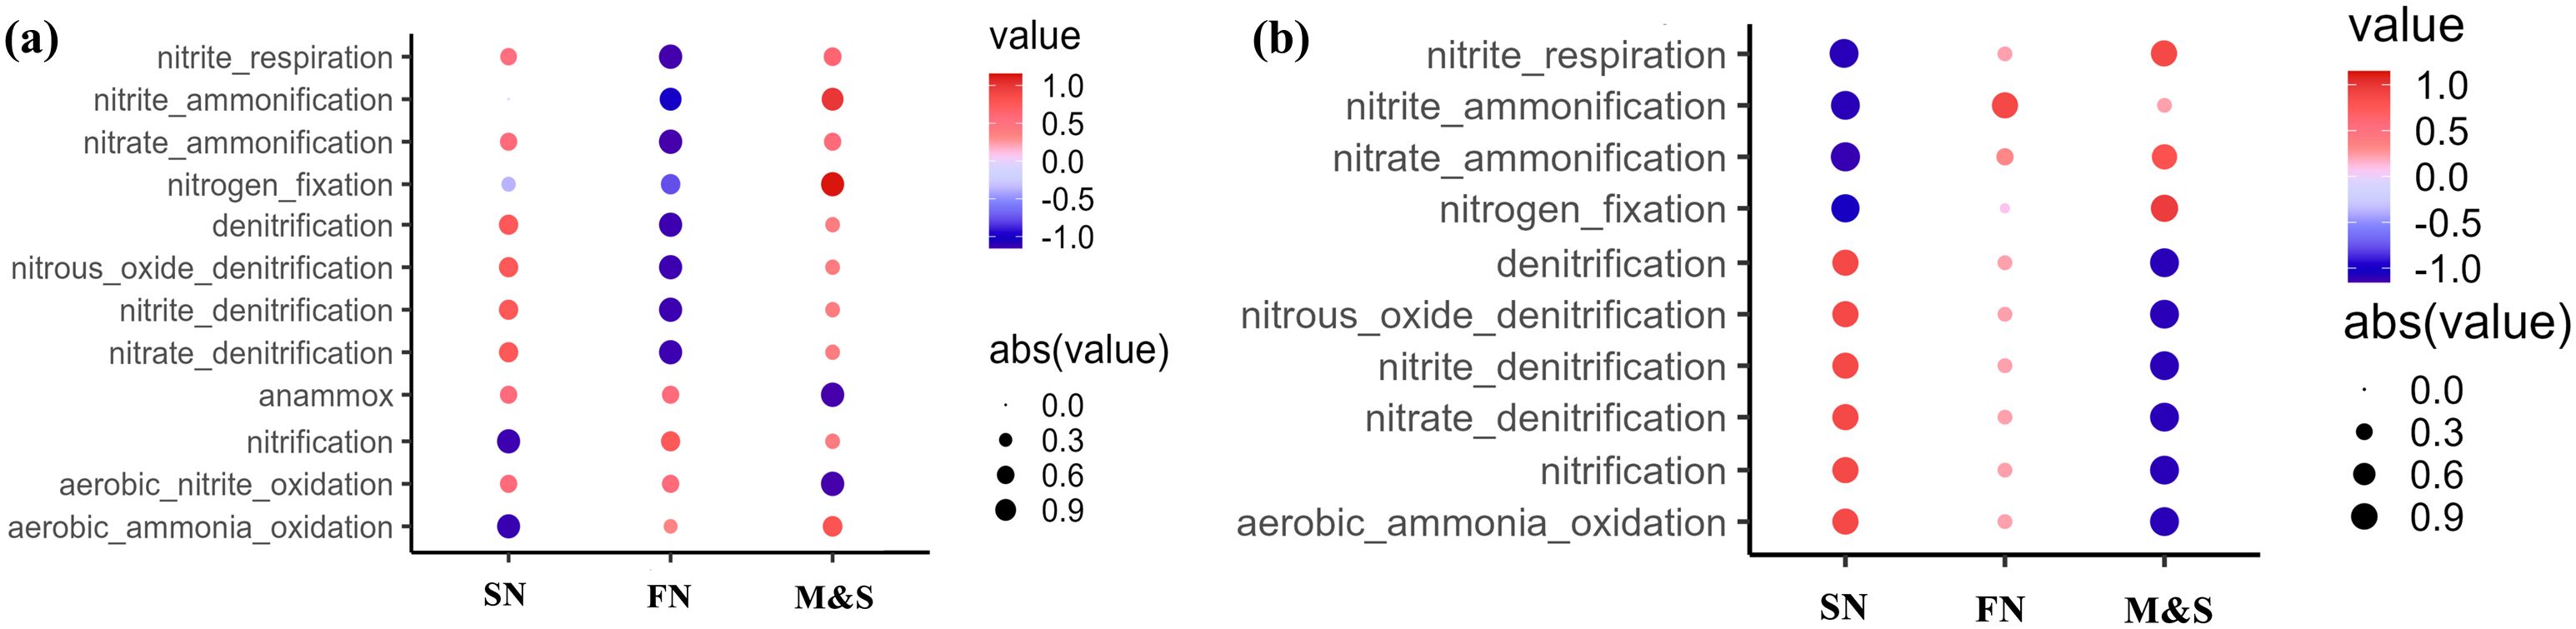
Figure 8. Indicator species for the (A) dry season and (B) wet season for the M&S group, the SN group, and the FN group.
This study investigates the relationship between bacteria and complex nitrogen pollution sources in the water column of a watershed affected by terrestrial nitrogen inputs, an area that has been relatively underexplored. It addresses the challenges associated with identifying and tracking nitrogen pollution sources. Using nitrogen and oxygen stable isotope techniques alongside microbiological analyses, the study examines microbial characteristics and their responses to diverse nitrogen pollution patterns. The primary nitrogen sources in the watershed are soil nitrogen, agricultural inputs, and domestic sources, each with varying contributions across different seasons: M&S (54.2%) predominates during the dry season, while SN (59.3%) is more significant during periods of high water flow. The study reveals significant shifts in microbial communities in response to different nitrogen sources. Specifically, regions influenced by M&S showed reduced microbial diversity, elevated denitrification rates, and enhanced nitrogen cycling compared to other areas. Conversely, SN and FN sources were associated with increased nitrogen fixation and nitrification processes in streams. Overall, this study enhances our understanding of microbial ecological dynamics in watersheds affected by nitrogen pollution, extending beyond specific local contexts.
The original contributions presented in the study are publicly available. This data can be found here: FigShare, https://figshare.com/articles/dataset/RawData/26964880.
QS: Writing – original draft, Writing – review & editing. WJ: Writing – original draft, Writing – review & editing. JL: Data curation, Formal analysis, Writing – review & editing. CZ: Software, Writing – review & editing. KL: Funding acquisition, Software, Writing – review & editing.
The author(s) declare financial support was received for the research, authorship, and/or publication of this article. Lishui Ecological and Environmental Monitoring Center of Zhejiang Province. Lishui City Key R&D Program Projects.(2023zdyf03).
The authors declare the research was conducted in the absence of any commercial or financial relationships that could be construed as a potential conflict of interest.
All claims expressed in this article are solely those of the authors and do not necessarily represent those of their affiliated organizations, or those of the publisher, the editors and the reviewers. Any product that may be evaluated in this article, or claim that may be made by its manufacturer, is not guaranteed or endorsed by the publisher.
The Supplementary Material for this article can be found online at: https://www.frontiersin.org/articles/10.3389/fmars.2024.1459186/full#supplementary-material
Besemer K., Peter H., Logue J. B., Langenheder S., Lindstrom E. S., Tranvik L. J., et al. (2012). Unraveling assembly of stream biofilm communities. ISME J. 6, 1459–1468. doi: 10.1038/ismej.2011.205
Bottcher J., Strebel O., Voerkelius S., Schmidt H. L. (1990). Using isotope fractionation of nitrate nitrogen and nitrate oxygen for evaluation of microbial denitrification in a sandy aquifer. J. Hydrology 114, 413–424. doi: 10.1016/0022-1694(90)90068-9
Brandes J. A., Devol A. H. (1997). Isotopic fractionation of oxygen and nitrogen in coastal marine sediments. Geochimica Et Cosmochimica Acta 61, 1793–1801. doi: 10.1016/S0016-7037(97)00041-0
Cao M., Hu A., Gad M., Adyari B., Qin D., Zhang L., et al. (2022). Domestic wastewater causes nitrate pollution in an agricultural watershed, China. Sci. Total Environ. 823, 153680. doi: 10.1016/j.scitotenv.2022.153680
Deutsch B., Mewes M., Liskow I., Voss M. (2006). Quantification ofdiffuse nitrate inputs into a small river system using stable isotopes of oxygen and nitrogen in nitrate. Org. Geochem 37, 1333–1342. doi: 10.1016/j.orggeochem.2006.04.012
Diaz R. J. (2001). Overview of hypoxia around the world. J. Environ. Qual 30, 275–281. doi: 10.2134/jeq2001.302275x
Drury B., Rosi-Marshall E., Kelly J. J. (2013). Wastewater treatment effluent reduces the abundance and diversity of benthic bacterial communities in urban and suburban rivers. Appl. Environ. Microbiol. 79, 1897–1905. doi: 10.1128/AEM.03527-12
EC (1997). Report of the Commission to the Council: The Implementation of Council Directive 91/676/EEC concerning the Protection of Waters against Pollution Caused by Nitrates from Agricultural Sources. Brussels, 01.10.1997 COM(97) 473 final.
Fenech C., Rock L., Nolan K., Tobin J., Morrissey A. (2012). The potential for a suite of isotope and chemical markers to differentiate sources of nitrate contamination: a review. Water Res. 46, 2023–2041. doi: 10.1016/j.watres.2012.01.044
GB3838-2002 (2002). “State environmental protection administratio,” in Environmental Quality Standard of Surface Water of China (GB3838-2002: Ministry of Ecology and Environment the People's Republic of China).
Guo K., Yang J., Yu N., Luo L., Wang E. (2023). Biological nitrogen fixation in cereal crops:Progress,strategies,and perspectives. Plant Commun. 4(2), 100499. doi: 10.1016/j.xplc.2022.100499
Guo X. P., Yang Y., Niu Z. S., Lu D. P., Zhu C. H., Feng J. N., et al. (2019). Characteristics of microbial community indicate anthropogenic impact on the sediments along the Yangtze Estuary and its coastal area, China. Sci. Total Environ. 648, 306–314. doi: 10.1016/j.scitotenv.2018.08.162
Guo Z., Yan C., Wang Z., Xu F., Yang F. (2020). Quantitative identification of nitrate sources in a coastal peri-urban watershed using hydrogeochemical indicators and dual isotopes together with the statistical approaches. Chemosphere 243, 125364. doi: 10.1016/j.chemosphere.2019.125364
Ji X., Xie R., Hao Y., Lu J. (2017). Quantitative identification of nitrate pollution sources and uncertainty analysis based on dual isotope approach in an agricultural watershed. Environ. pollut. 229, 586–594. doi: 10.1016/j.envpol.2017.06.100
Jiang H., Zhang Q. Q., Liu W. J., Zhang J. Y., Pan K., Zhao T., et al. (2021). Isotopic compositions reveal the driving forces of high nitrate level in an urban river: Implications for pollution control. J. Cleaner Production 298, 126693. doi: 10.1016/j.jclepro.2021.126693
Jin Z.-F., Hu J., Wu A.-J., Li G.-Y., Zhang W.-L., Li F.-L. (2021). Identify the nitrate sources in different land use areas based on multiple isotopes. Huan jing ke xue= Huanjing kexue 42, 1696–1705. doi: 10.13227/j.hjkx.202009094
Johannsen A., Dähnke K., Emeis K. (2008). Isotopic composition of nitrate in five German rivers discharging into the North Sea. Organic Geochemistry 39, 1678–1689. doi: 10.1016/j.orggeochem.2008.03.004
Katzenberg M. A., Waters-Rist A. L. (2018). Stable isotope analysis. Biol. Anthropol. Hum.Skelet., 467–504. doi: 10.1002/9781119151647
Kellman L., Hillaire-Marcel C. (1998). Nitrate cycling in streams: using natural abundances of NO3–delta N-15 to measure in-situ denitrification. Biogeochemistry 43, 273–292. doi: 10.1023/A:1006036706522
Kendall C. (1998). “Tracing nitrogen sources and cycling in catchments,” in Isotope Tracers in Catchment Hydrology. Eds. Kendall C., McDonnell J. J. (Elsevier BV, Amsterdam), 519–576.
Kuypers M. M. M., Marchant H. K., Kartal B. (2018). The microbial nitrogen-cycling network. Nat. Rev. Microbiol. 16, 263–276. doi: 10.1038/nrmicro.2018.9
Lawniczak A. E., Zbierska J., Nowak B., Achtenberg K., Grzeskowiak A., Kanas K. (2016). Impact of agriculture and land use on nitrate contamination in groundwater and running waters in central-west Poland. Environ. Monit Assess. 188, 172. doi: 10.1007/s10661-016-5167-9
Li W. C., Xu W., Yin G. F., Zhang X. L., Zhang Z. H., Xi B., et al. (2023). Critical processes and major factors that drive nitrogen transport from farmland to surface water bodies. Front. Agric. Sci. Eng. 10, 541–552. doi: 10.15302/J-FASE-2023518
Li Z. L., Zeng Z. Q., Tian D. S., Wang J. S., Fu Z., Zhang F. Y., et al. (2020). Global patterns and controlling factors of soil nitrification rate. Global Change Biol. 26, 4147–4157. doi: 10.1111/gcb.15119
Liu J., Shen Z., Yan T., Yang Y. (2018). Source identification and impact of landscape pattern on riverine nitrogen pollution in a typical urbanized watershed, Beijing, China. Sci. Total Environ. 628–629, 1296–1307. doi: 10.1016/j.scitotenv.2018.02.161
Lu H. J., Chandran K., Stensel D. (2014). Microbial ecology of denitrification in biological wastewater treatment. Water Res. 64, 237–254. doi: 10.1016/j.watres.2014.06.042
Mayer B., Boyer E. W., Goodale C., Jaworski N. A., Van Breemen N., Howarth R. W., et al. (2002). Sources of nitrate in rivers draining sixteen watersheds in the northeastern U.S.: isotopic constraints. Biogeochemistry 57–58, 171–197. doi: 10.1023/A:1015744002496
McIlvin M. R., Altabet M. A. (2005). Chemical conversion of nitrate and nitrite to nitrous oxide for nitrogen and oxygen isotopic analysis in freshwater and seawater. Analytical Chem. 77, 5589–5595. doi: 10.1021/ac050528s
Mengis M., Schiff S. L., Harris M., English M. C., Aravena R., Elgood R. J., et al. (1999). Multiple geochemical and isotopic approaches for assessing ground water NO3- elimination in a riparian zone. Ground Water 37, 448–457. doi: 10.1111/j.1745-6584.1999.tb01124.x
Monchamp M. E., Spaak P., Domaizon I., Dubois N., Bouffard D., Pomati F. (2018). Homogenization of lake cyanobacterial communities over a century of climate change and eutrophication. Nat. Ecol. Evol. 2, 317–31+. doi: 10.1038/s41559-017-0407-0
Mosley L. M., Fleming. N. (2010). Pollutant loads returned to the lower Murray river from flood-irrigated agriculture. Water Air Soil pollut. 211, 475–487. doi: 10.1007/s11270-009-0316-1
Nie Y. P., Chen H. S., Wang K. L., Yang J. (2012). Water source utilization by woody plants growing on dolomite outcrops and nearby soils during dry seasons in karst region of Southwest China. J. Hydrol 420–421, 264–274. doi: 10.1016/j.jhydrol.2011.12.011
Ongley E. D., Xiaolan Z., Tao Y. (2010). Current status of agricultural and rural non-point source Pollution assessment in China. Environ. pollut. 158, 1159–1168. doi: 10.1016/j.envpol.2009.10.047
Parnell A. C., Inger R., Bearhop S., Al J. (2010). Source portioning using stable isotopes: coping with too much variation. PloS One 5(1), e9672. doi: 10.1371/journal.pone.0009672
Pei D., Xie L., Xu B., He F., Wang L., Tang D., et al. (2022). Analysis of nitrate sources in the Qingshui River of the Yellow River with nitrogen and oxygen isotope technique. China Environ. Sci. 42, 4115–4121.
Price J. R., Ledford S. H., Ryan M. O., Toran L., Sales C. M. (2018). Wastewater treatment plant effluent introduces recoverable shifts in microbial community composition in receiving streams. Sci. Total Environ. 613-614, 1104–1116. doi: 10.1016/j.scitotenv.2017.09.162
Rice J., Westerhoff P. (2017). High levels of endocrine pollutants in US streams during low flow due to insufficient wastewater dilution. Nat. Geosci. 10, 587–591. doi: 10.1038/ngeo2984
Ruiz G., Jeison D., Chamy R. (2003). Nitrification with high nitrite accumulation for the treatment of wastewater with high ammonia concentration. Water Res. 37, 1371–1377. doi: 10.1016/S0043-1354(02)00475-X
Ruprecht J. E., Birrer S. C., Dafforn K. A., Mitrovic S. M., Crane S. L., Johnston E. L., et al. (2021). Wastewater effluents cause microbial community shifts and change trophic status. Water Res. 200, 117206. doi: 10.1016/j.watres.2021.117206
Tobari Y., Koba K., Fukushima K., Tokuchi N., Ohte N., Tateno R., et al. (2010). Contribution of atmospheric nitrate to stream-water nitrate in Japanese coniferous forests revealed by the oxygen isotope ratio of nitrate. Rapid Commun. Mass Spectrom 24, 1281–1286. doi: 10.1002/rcm.4498
Tong Y., Wang M., Penuelas J., Liu X., Paerl H. W., Elser J. J., et al. (2020). Improvement in municipal wastewater treatment alters lake nitrogen to phosphorus ratios in populated regions. Proc. Natl. Acad. Sci. U.S.A. 117, 11566–11572. doi: 10.1073/pnas.1920759117
USEPA (2015). Preventing Eutrophication: Scientific Support for Dual Nutrient Criteria, Vol. Epa820-S-15-001. 1–6.
Wu Y., Chen J. (2013). Investigating the effects of point source and nonpoint source pollution on the water quality of the East River (Dongjiang) in South China. Ecol. Indic. 32, 294–304. doi: 10.1016/j.ecolind.2013.04.002
Xing M., Liu W. (2012). Variations in the concentration and isotopic composition of nitrate nitrogen in wet deposition and their relation with meteorological conditions in Xi’an city, Northwest China. Appl. Geochem 27, 831–840. doi: 10.1016/j.apgeochem.2012.01.003
Xing M., Liu W. (2016). Using dual isotopes to identify sources and transformations of nitrogen in water catchments with different land uses, Loess Plateau of China. Environ. Sci. pollut. Res. Int. 23, 388–401. doi: 10.1007/s11356-015-5268-y
Xing M., Liu W. G., Hu J. (2010). Using nitrate isotope to trace the nitrogen pollution in Chanhe and Laohe river. Huan Jing Ke Xue 31, 2305–2310.
Xu Z. W., Zhang X. Y., Yu G. R., Sun X. M., Wen X. F. (2014). Review of dual stable isotope technique for nitrate source identification in surface- and groundwater in China. Huan Jing Ke Xue 35, 3230–3238.
Xue D., Botte J., De Baets B., Accoe F., Nestler A., Taylor P., et al. (2009). Present limitations and future prospects of stable isotope methods for nitrate source identification in surface- and groundwater. Water Res. 43, 1159–1170. doi: 10.1016/j.watres.2008.12.048
Yi Q., Zhang Y., Xie K., Chen Q., Zheng F., Tonina D., et al. (2020). Tracking nitrogen pollution sources in plain watersheds by combining high-frequency water quality monitoring with tracing dual nitrate isotopes. J. Hydrol 581, 124439. doi: 10.1016/j.jhydrol.2019.124439
Yue F. J., Li S. L., Liu C. Q., Zhao Z. Q., Ding H. (2017). Tracing nitrate sources with dual isotopes and long term monitoring of nitrogen species in the Yellow River, China. Sci. Rep. 7, 8537. doi: 10.1038/s41598-017-08756-7
Yue F. J., Liu C. Q., Li S. L., Zhao Z. Q., Liu X. L., Ding H., et al. (2014). Analysis of δ15N and δ18O to identify nitrate sources and transformations in Songhua River, Northeast China. J. Hydrology 519, 329–339. doi: 10.1016/j.jhydrol.2014.07.026
Zhang Y., Shi P., Li F., Wei A., Song J., Ma J. (2018). Quantification of nitrate sources and fates in rivers in an irrigated agricultural area using environmental isotopes and a Bayesian isotope mixing model. Chemosphere 208, 493–501. doi: 10.1016/j.chemosphere.2018.05.164
Zhang L., Zhong M. M., Li X. C., Lu W. X., Li J. (2020). River bacterial community structure and co-occurrence patterns under the influence of different domestic sewage types. J. Environ. Manage. 266, 110590. doi: 10.1016/j.jenvman.2020.110590
Zhao Y., D J., Wang F. (2020). Sources of nitrogen pollution in upstream of Fenhe River reservoir based on the nitrogen and oxygen stable isotope. J. Chem., 1–8. doi: 10.1155/2020/6574210
Keywords: riverine microbiota variations, complex anthropogenic nitrogen pollution, nitrogen and oxygen stable isotope, nitrogen source analysis, microbial community responses
Citation: Sun Q, Li J, Zhou C, Jiang W and Lei K (2024) The influence of river basin nitrogen pollution sources and their transport on microbial community structure. Front. Mar. Sci. 11:1459186. doi: 10.3389/fmars.2024.1459186
Received: 03 July 2024; Accepted: 21 August 2024;
Published: 16 September 2024.
Edited by:
Chenhong Li, Shanghai Ocean University, ChinaReviewed by:
Gaoliang Yuan, Xinyang Agriculture and Forestry University, ChinaCopyright © 2024 Sun, Li, Zhou, Jiang and Lei. This is an open-access article distributed under the terms of the Creative Commons Attribution License (CC BY). The use, distribution or reproduction in other forums is permitted, provided the original author(s) and the copyright owner(s) are credited and that the original publication in this journal is cited, in accordance with accepted academic practice. No use, distribution or reproduction is permitted which does not comply with these terms.
*Correspondence: Weijun Jiang, MTk5MDU3ODAzMDNAMTYzLmNvbQ==; Kun Lei, bGVpa3VuMTk3M2NyYWVzQDE2My5jb20=
†These authors have contributed equally to this work
Disclaimer: All claims expressed in this article are solely those of the authors and do not necessarily represent those of their affiliated organizations, or those of the publisher, the editors and the reviewers. Any product that may be evaluated in this article or claim that may be made by its manufacturer is not guaranteed or endorsed by the publisher.
Research integrity at Frontiers
Learn more about the work of our research integrity team to safeguard the quality of each article we publish.