 Alexandra Coello-Camba
 Susana Agustí
- Red Sea Research Center, King Abdullah University of Science and Technology (KAUST), Thuwal, Saudi Arabia
The picocyanobacteria genera Prochlorococcus and Synechococcus play a significant role globally, dominating the primary production in warm and oligotrophic tropical and subtropical areas, which represent the largest oceanic ecosystem. Genomic studies have revealed high microdiversity within these genera. It is anticipated that ocean warming may cause decreased biodiversity in marine tropical areas, as increasing temperatures may lead to the development of a new thermal niche in these regions. Thus, our study aimed to characterize the microdiversity of picocyanobacteria in the Red Sea, one of the warmest oligotrophic seas on the planet, which is experiencing warming at a rate that exceeds the global average. We identified picocyanobacteria microdiversity in the open waters of the Eastern Red Sea basin, where seawater temperatures ranged from 22.2 to 32.4°C throughout the water column (from surface to 160 m depth). Both Prochlorococcus and Synechococcus populations were characterized to deep taxonomic levels, applying amplicon sequencing targeting the petB gene, revealing up to 15 different (sub)clades. Synechococcus dominated the basin, representing an average of 68.8% of the total reads assigned to both cyanobacteria. The subclade Synechococcus IIa and Prochlorococcus clade HLII were ubiquitous in the water column of the Eastern Red Sea basin, representing 73% and 56% of the Synechococcus and Prochlorococcus assigned reads, respectively. Maximum cyanobacteria richness was observed at approximately 27.5°C, declining at higher and lower temperatures (polynomial fit, R2 = 0.2, p<0.0001). Synechococcus IIa dominated in the warmest surface waters (>30°C) of the Red Sea, displacing other (sub)clades to more saline and nutrient-poor waters, thereby reducing community diversity (polynomial fit, R2 = 0.77, p<0.0001). Our study contributes to identifying changes in picocyanobacterial diversity when exposed to temperatures exceeding current oceanic thermal limits, through the analysis of Red Sea communities already inhabiting such higher-temperature niches.
1 Introduction
Oligotrophic areas of the oceans represent >40% of the ocean’s surface, and in them, pico-sized phytoplankton is responsible for up to 80%-90% of the primary production (Agawin et al., 2000; Uitz et al., 2010). This extensive surface area is however dominated by two cyanobacterial genera, Prochlorococcus and Synechococcus, which are described to exhibit high microdiversity within their populations (e.g., Scanlan et al., 2009; Mazard et al., 2012). Different environmental factors shape the microdiversity structure of marine environments, including stratification and mixing processes (Post et al., 2011), nutrient inputs (Spatharis et al., 2007), or salinity (Busseni et al., 2020). Seawater temperature also specifically shapes the diversity of oceanic taxa, which typically peaks in warmer waters (Tittensor et al., 2010; Ibarbalz et al., 2019; Righetti et al., 2019). For cyanobacteria, studies in the Atlantic and Pacific Oceans reported that high seawater temperatures lead to increased Prochlorococcus and Synechococcus richness indices, respectively (Jameson et al., 2010; Xia et al., 2019). However, in a warming ocean scenario, projected increases in seawater temperatures are expected to alter the composition of phytoplankton communities. Specifically, warming projections are expected to have a detrimental effect on communities inhabiting tropical oceans, where rising temperatures may cause sharp declines in phytoplankton diversities. This reduction in diversity would be caused by the proximity of the thermal optima of tropical phytoplankton taxa to current mean temperatures, and the negative skewness of their thermal tolerance curves, leading to sharp declines in growth rate when subjected to relatively small increases in temperature (Thomas et al., 2012).
Among the world’s marine environments, the Red Sea stands out for its characteristically high surface water temperatures, often exceeding 30°C and even surpassing the local historical record of 33°C (Rasul et al., 2015; Chaidez et al., 2017). The main basin is permanently stratified by its strong thermocline, thus limiting the nutrient input from deeper waters toward the oligotrophic shallow waters (Weikert, 1987; Longhurst, 1998). Therefore, this basin is generally considered an oligotrophic system despite a seasonal inflow of nutrient-rich Indian Ocean intermediate water through the Bab-el Mandab Strait at its southernmost limit. In the Red Sea, Synechococcus abundances outnumber those of Prochlorococcus (Veldhuis and Kraay, 1993; Al-Otaibi et al., 2020; Coello-Camba and Agustí, 2021), thriving in the warm and well-illuminated superficial waters, especially in the southern waters that are characterized by high temperatures (> 30°C) and low salinity (Coello-Camba and Agustí, 2021). In contrast, Prochlorococcus thrives in deeper layers mainly towards the Central (Coello-Camba and Agustí, 2021) and North Red Sea (Veldhuis and Kraay, 1993). Previous studies have reported a high abundance of Synechococcus clade II and Prochlorococcus HLII in the Gulf of Aqaba (Fuller et al., 2003, 2005; Penno et al., 2006; Post et al., 2011), both of which commonly occur in high-temperature and low-nutrient waters (Kent et al., 2018). However, given the steep mean warming rate described for this basin (0.17 ± 0.07°C per decade, Chaidez et al., 2017) exceeding the global ocean rate, alterations in the diversity of inhabiting cyanobacterial communities are expected. As part of the tropical ocean, these key communities in the Red Sea may already be subjected to decreased diversities, therefore compromising the productivity of this ecosystem (Thomas et al., 2012).
In this study, we characterize the picocyanobacterial communities of the Red Sea by identifying their clade composition, and evaluating various environmental parameters to assess the relationships between clade and subclade distributions and environmental gradients. We calculate cyanobacteria microdiversity indices to examine their variability in response to environmental changes, particularly focusing on Red Sea seawater temperature, which surpasses the maximum surface temperature of tropical oceans by over 2°C. This way, our primary goal is to analyze the temperature-related patterns of picocyanobacterial diversity in one of the warmest marine ecosystems on Earth, where current temperatures closely approximate the projections of thermal niche distributions in the future ocean.
2 Materials and methods
2.1 Sampling
Five different cruises were performed onboard RV Thuwal (Threats, Dust, and CCF-1 cruises) and RV Al-Azizi (CCF-2 and 3) from October 2016 to March 2018 (Figure 1; Supplementary Table S1), covering a transect from 17.09 to 27.6°N.
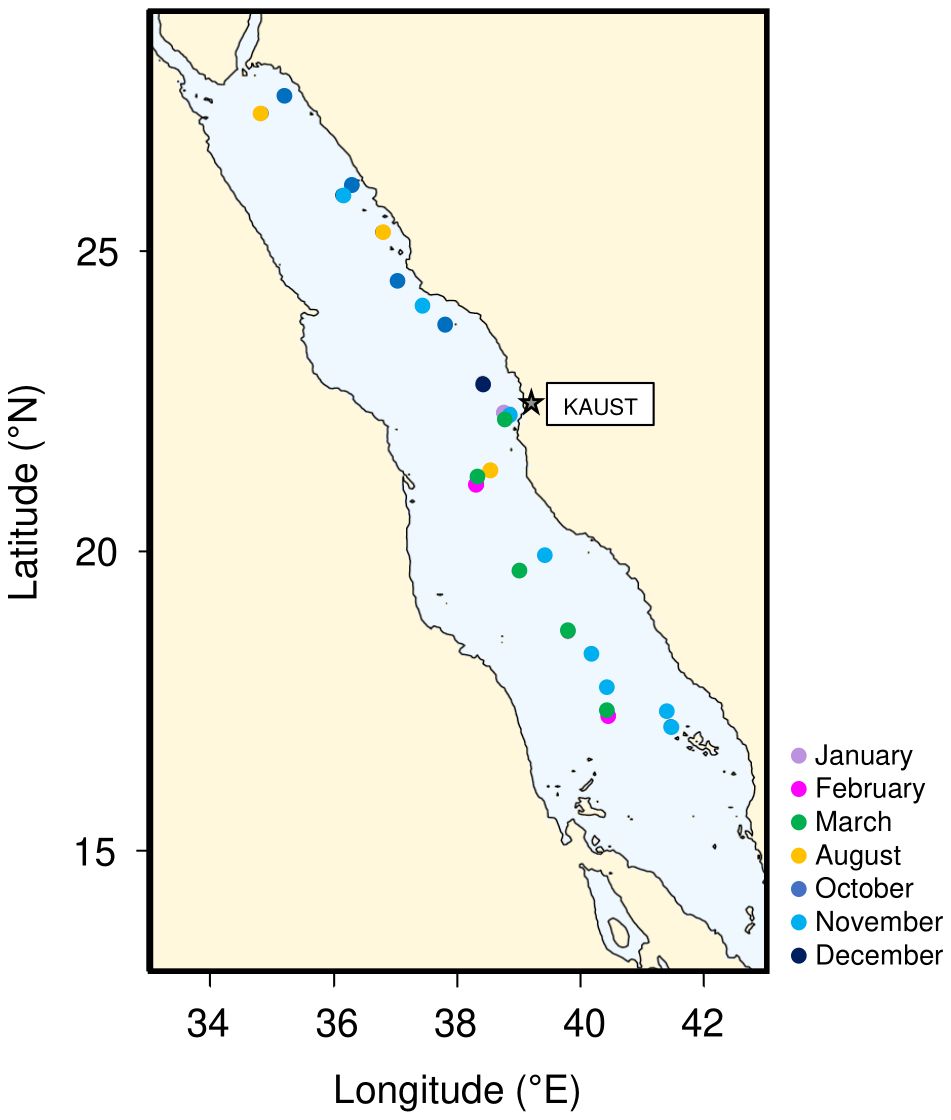
Figure 1. Map showing the distribution of the 28 sampling stations along the Red Sea basin, coloured based on the sampling month.
At each station, seawater samples were taken from four depths, distributed from the surface (3-5 m) to a maximum of 160 m, including the deep chlorophyll a maximum (DCM). Depending on the vessel, an Idronaut (Ocean Seven 305 Plus) or Sea-Bird (SBE 911 plus)CTD profiler was used to measure the seawater temperature and salinity in situ.
Integrated photosynthetically active radiation (PAR, 400–700 nm) and ultraviolet B radiation (UVB, 305 nm) were recorded with a BIC Compact or a PUV-2500 Profiling UV Radiometer (Biospherical Instruments, San Diego, USA), which were deployed at each station at solar noon avoiding shading from the vessel. The diffuse attenuation coefficients (Kd) were estimated as the slopes of the linear regression of the natural logarithm of instantaneous down-welling irradiance (µmol m-2 s-1) vs. depth (m).
To measure nutrient concentrations (NO3 and PO4), approximately 15-mL seawater samples were kept frozen until analyzed on land using a Segmented Flow Analyzer (SEAL Analytical).
At every sampling location and depth, 300-mL samples were filtered using Whatman GF/F filters to measure chlorophyll a (Chl a) concentrations, following the fluorometric method described by Parsons et al. (1984). Briefly, 7 mL of 90% acetone was added to the filter and kept refrigerated in the dark for 24 h to extract the pigment. After incubation, we performed sensitive chlorophyll-a measurements considering its specific fluorescence excitation and emission wavelengths using a calibrated Trilogy laboratory fluorometer (Turner Designs, Inc.).
To perform cyanobacteria cell counts, we took approximately 1 mL of seawater at each depth. Immediately after sampling, we identified and determined cell abundances using a CyFlow® Space flow cytometer equipped with a blue laser beam (488 nm) coupled with a CyFlow® autoloading station to facilitate sample loading and processing. The procedures used to analyze these samples are described by Coello-Camba and Agustí (2021).
2.2 DNA extraction, PCR amplification, and sequencing
For DNA analyses, a minimum of 8 L of seawater was obtained from each station and depth. Immediately after sampling, the water samples were filtered through 3 µm and collected on 0.2 µm Isopore™ membrane filters (142 mm) using a Millipore Masterflex peristaltic pump. The 0.2 µm filters were kept carefully folded in 15 mL plastic tubes and immediately frozen at -80 °C.
DNA was extracted using the DNeasy® PowerWater® DNA Extraction kit (MoBio Laboratories, Inc., Carlsbad, CA). The petB gene was selected as a target to assess the microdiversity within Prochlorococcus and Synechococcus communities, using a petB primer set specifically developed and adapted for this purpose (Coello-Camba et al., 2023). PCR amplicons were purified, processed and sequenced by Illumina MiSeq at the KAUST CORELab facilities, following the steps described in Coello-Camba et al. (2023).
2.3 Sequence processing
Raw sequences were processed, analyzed, and filtered using the QIIME 1.9.1 software (Caporaso et al., 2010). Primer sequences were removed using cutadapt (Martin, 2011), and forward and reverse sequences were assembled with PEAR (Zhang et al., 2013) prior to quality filtering. Filtered sequences were then dereplicated with VSEARCH (Rognes et al., 2016), and clustered based on a 94% similarity, as determined by computing within-group distances using Mega 7.0.26 (Tamura et al., 2007). After excluding singletons and chimeras, sequences were classified with MOTHUR (Schloss et al., 2009) against a reference database (Coello-Camba et al., 2023).
2.4 Data analysis
After testing for normal distribution with the D’Agostino-Pearson normality test, we estimated the Spearman correlations between log-transformed environmental data and (sub)clade read proportions using GraphPad Prism® 7.0a.
Principal component analysis (PCA) was conducted on log-transformed parameters (except for temperature, salinity, latitude, and depth values) using JMP® Pro 12.1.0 to determine the relationships between environmental factors and the distribution of the different Synechococcus and Prochlorococcus (sub)clades.
Diversity indices, including richness and Shannon index (H’), were calculated for Synechococcus and Prochlorococcus populations together. The Shannon diversity index was calculated using the alpha_diversity.py script in QIIME.
Additionally, a Bray-Curtis distance matrix was calculated as a beta diversity measurement with vegdist using the vegan package in R (version 3.4.3). Data was previously rarefied to 40,000 sequences per sample and log-transformed. Given that %PAR and %UVB values were not available for all of our samples, these two parameters were excluded from the beta diversity calculations. A multivariate permutational analysis was also conducted to test the significance of the correlation between each environmental variable and the distance matrix with adonis. A Mantel test (999 iterations, Spearman correlation) was conducted on the community Bray-Curtis matrix and a Euclidean distance matrix between environmental parameters. Additionally, we selected the Euclidean set of environmental variables that better define the distance matrix using bioenv.
The petB sequences obtained here from Red Sea samples are deposited at NCBI under BioProject number PRJNA748390.
3 Results
3.1 Cyanobacteria abundance and environmental conditions
During our study along the Red Sea basin, covering a transect of approximately 10 latitudinal degrees (Figure 1), the seawater temperatures averaged (± SE) 27.1 ± 2.6°C, varying between 22.2 and 32.4°C and exhibiting a negative correlation with latitude and depth (Supplementary Figure S1; Supplementary Table S2). Salinity ranged from 37.6 to 40.5 psu, with a mean value of 39.4 ± 0.08 psu. Unlike temperature, salinity was positively correlated with latitude and depth (Supplementary Figure S1; Supplementary Table S2). Moreover, 50% of the incident photosynthetically active radiation (PAR) reached an average (± SE) depth of 11.4 ± 2.3 m, whereas 10% and 1% of the PAR reached 38.1 ± 1.7 m depth and 76.7 ± 1.9 m, respectively. For UVB, 50% of the incident radiation reached an average depth of 3.9 ± 2.8 m, whereas 10% of UVB reached 9.2 ± 3.4 m, and 1% UVB reached 16.3 ± 3.2 m (Supplementary Figure S1). Chlorophyll a concentration averaged (± SE) 0.34 ± 0.02 µg L-1, with a maximum of 1.04 µg L-1 and minimum of 0.01 µg L-1 (Supplementary Figure S1). Regarding nutrient concentrations, PO4 and NO3 mean concentrations (± SE) were 0.17 ± 0.04 µM and 1.89 ± 0.27 µM, respectively (Supplementary Figure S1).
Picocyanobacteria cell abundances determined via flow cytometry averaged (± SE) 1.19·104 ± 2.19·103 cells mL-1 for Synechococcus and 7.25·103 ± 1.16·103 cells mL-1 for Prochlorococcus. The cell abundance of Synechococcus increased towards the south and in surface waters (Supplementary Figure S1; Supplementary Table S2), showing a positive correlation with temperature, %PAR, and %UVB, and a negative correlation with salinity. The correlations between Prochlorococcus cell abundance and environmental parameters exhibited opposite trends to those observed for Synechococcus but did not vary significantly with latitude (Supplementary Figure S1; Supplementary Table S2). Synechococcus and Prochlorococcus concentrations were negatively correlated with each other but were positively correlated with chlorophyll a concentration (Supplementary Table S2).
3.2 Synechococcus and Prochlorococcus clades, subclades, and community composition distribution
DNA sequences from 105 samples were processed, and a total of 11,319,755 petB reads were obtained; 76.7% of these reads were clustered and assigned to specific Prochlorococcus or Synechococcus taxa, leaving a total of 456 OTUs classified into (sub)clades. The proportion of reads assigned to Prochlorococcus and Synechococcus populations each correlated with the proportion of the respective cell abundances determined with flow cytometry (Spearman’s r=0.33, Supplementary Figure S2).
We identified a total of 10 clades: 3 Prochlorococcus clades (HLI, HLII, and LLI), and 7 Synechococcus clades, including CRD1, EnvA, II, III, VII, IX, and WPC1. Synechococcus clades II and III were further classified into several subclades (IIa, IIb, IIc, IIe, IIf, IIIa, and IIIb; Figure 2, Supplementary Figure S3). Our analysis also detected the presence of sequences belonging to Prochlorococcus or Synechococcus genera that could not be further identified and were therefore reported as “unclassified.” However, a BLAST search in the NCBI database (https://blast.ncbi.nlm.nih.gov/Blast.cgi) revealed that most of the unclassified Prochlorococcus sequences were closely related to low-light adapted branches, with approximately 66% of these reads showing percent identities with LLI clades ranging from 79% to 88%.
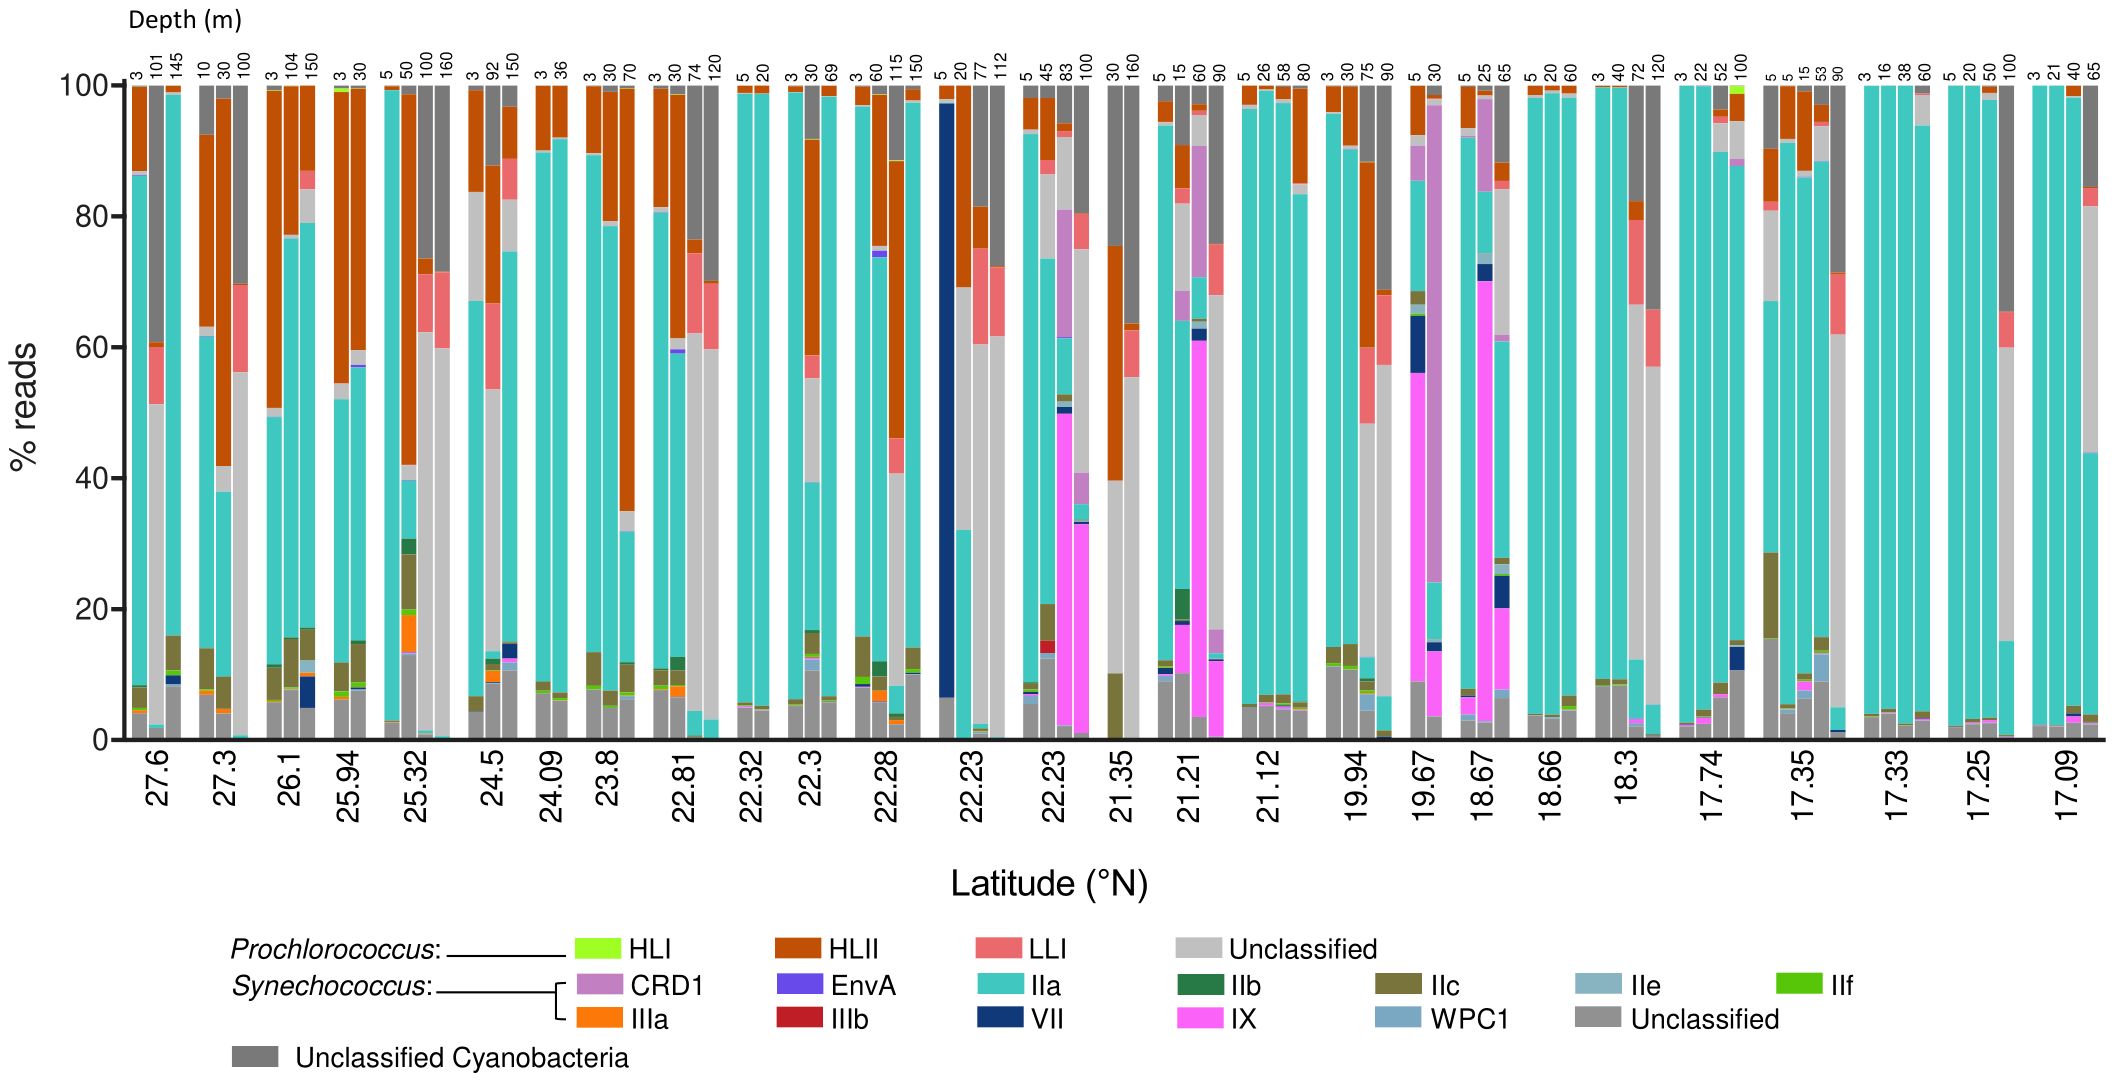
Figure 2. Stacked plots of the proportion of reads assigned to Prochlorococcus and Synechococcus (sub)clades organized by station and depth, from north to south. Samples taken at 22.23 °N were taken at the same station during two different cruises and are therefore represented separately.
The most abundant subclade was Synechococcus IIa, with an average proportion (± SE) of 62.49 ± 3.8% of the total reads assigned to both genera (Figure 2). The proportion of subclade IIa showed great variability, from being almost absent in some samples (minimum proportion of 0.04% of total cyanobacteria reads), to dominating the population with more than 99% of the total reads (Figure 2). Synechococcus clades CRD1, IX, and IIc exhibited average values of 2.02 ± 0.96%, 4.69 ± 1.63%, and 2.4 ± 0.39% of total assigned reads respectively (Figure 2), reaching maximum concentrations above 70% for CRD1 and IX, and above 20% for IIc in some samples. The remaining Synechococcus groups identified were less represented in the community, with average proportions below 1% of the total cyanobacterial reads. Among these groups, subclade IIIb was the least abundant, being present in only two samples, and was therefore excluded from downstream analyses. The proportion of the most abundant subclade Synechococcus IIa decreased with latitude and depth, with negative correlations with salinity and positive correlations with temperature and solar radiation (Table 1; Figure 3). This subclade was positively correlated with Chl a concentration and Synechococcus cell abundance and negatively correlated with Prochlorococcus cell abundance (Table 1). The proportion of Synechococcus IIb reads increased with latitude, salinity, and Prochlorococcus cell abundance, and decreased with nutrient concentrations (Table 1; Figure 3). For subclade IIc, the proportions increased with latitude and %UVB and decreased with PO4 concentration (Table 1; Figure 3). No significant trends were observed for Synechococcus IIe (Table 1; Figure 3). For IIf, the proportion of reads did not vary with latitude but decreased with depth, being positively correlated with %PAR and %UVB radiation and negatively correlated with PO4 concentrations (Table 1; Figure 3). The proportion of Synechococcus IIIa increased with latitude, salinity, and Prochlorococcus cell abundances, and decreased with nutrient concentrations (Table 1; Figure 3). Clade IX was positively correlated with PO4 concentration and Synechococcus cell abundances but decreased with latitude and salinity (Table 1; Figure 3). Clade VII only showed significant correlations with temperature (negative) and nitrate (positive) (Table 1; Figure 3). Synechococcus EnvA exhibited a positive correlation with latitude and a negative correlation with depth and PO4 concentration (Table 1; Figure 3). For Synechococcus CRD1 and WPC1, we did not observe any significant trends associated with the parameters measured herein (Table 1; Figure 3). The samples obtained from 0 to 50 m deep in the southern area (17.09-23.8 °N), where the temperature exceeded 30 °C, were dominated by Synechococcus IIa, accounting for an average of 85.6 ± 6% of the total assigned reads. The saltiest waters in the North (≥ 40 psu) were also dominated by this subclade (48.6 ± 5% on average).
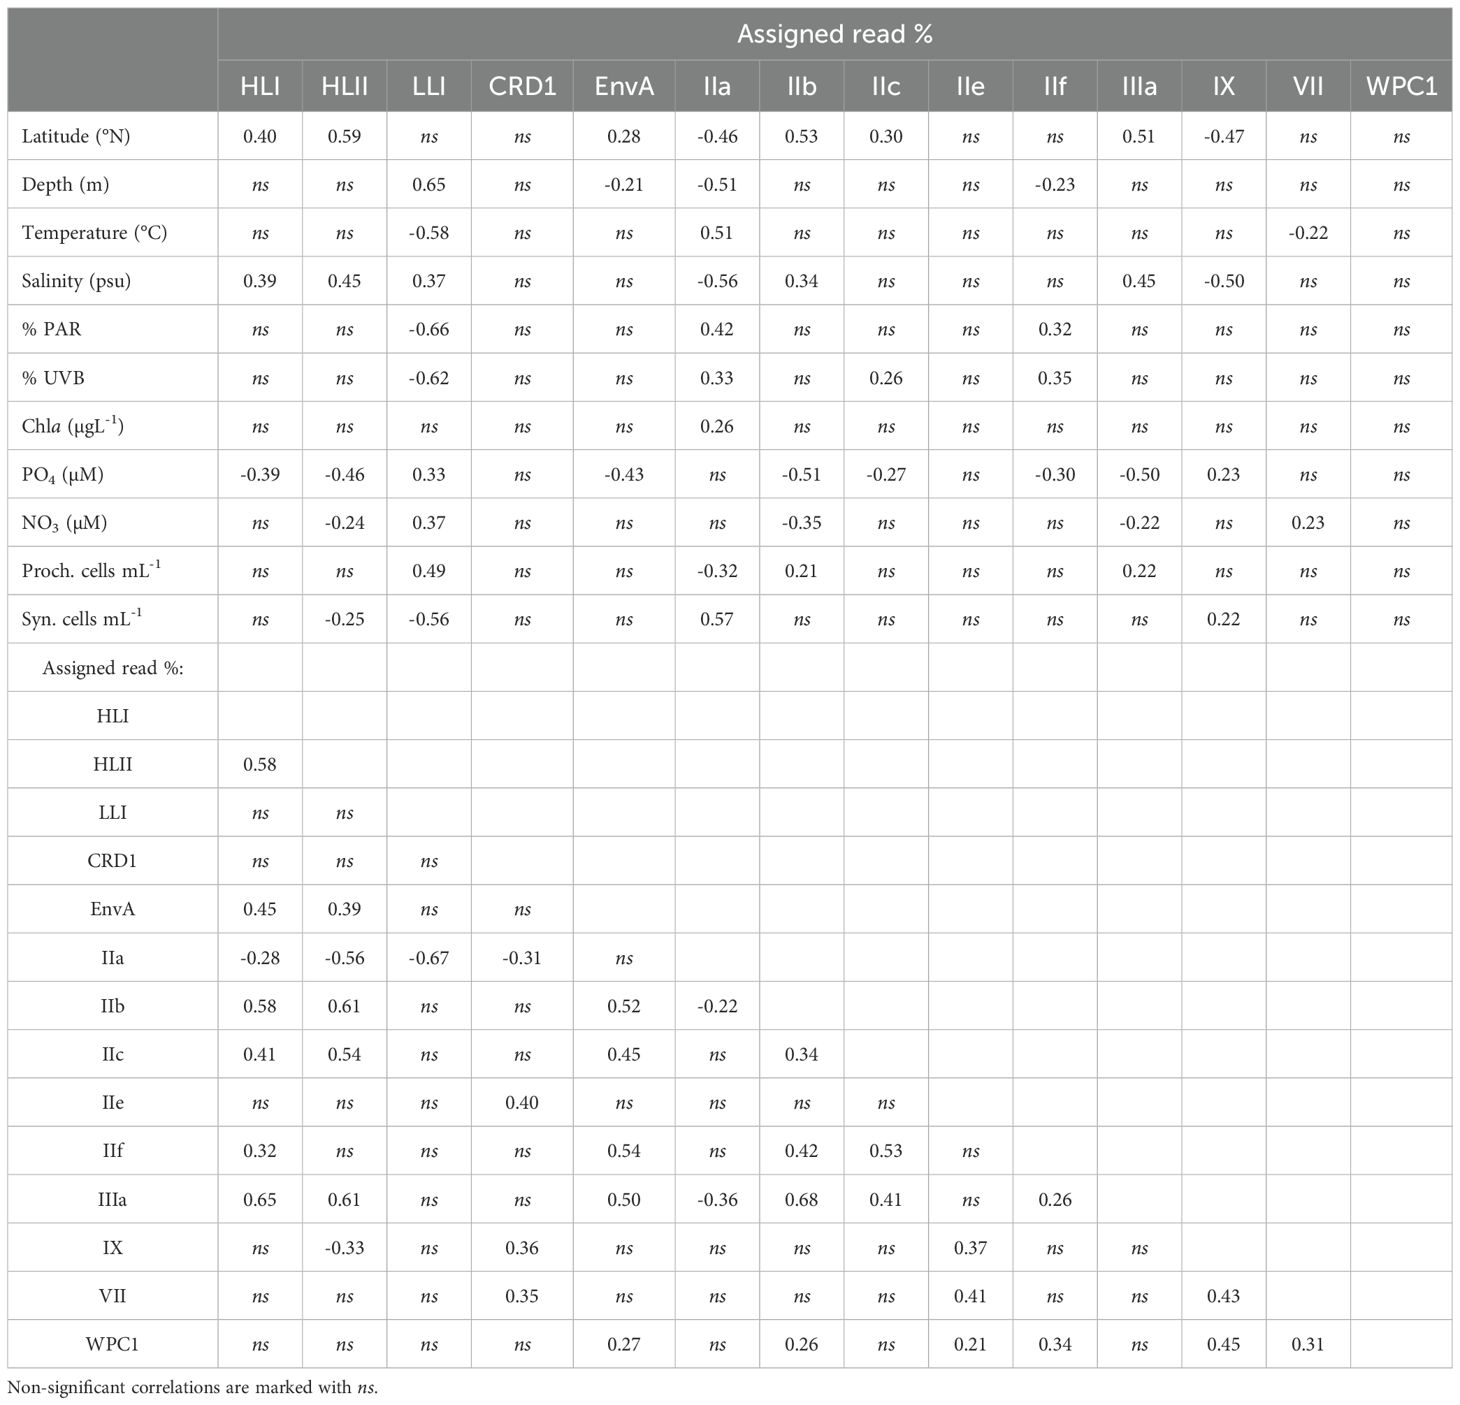
Table 1. Spearman correlations (p < 0.05) between location, environmental parameters, Prochlorococcus and Synechococcus cell abundances, and read % for each (sub)clade observed.
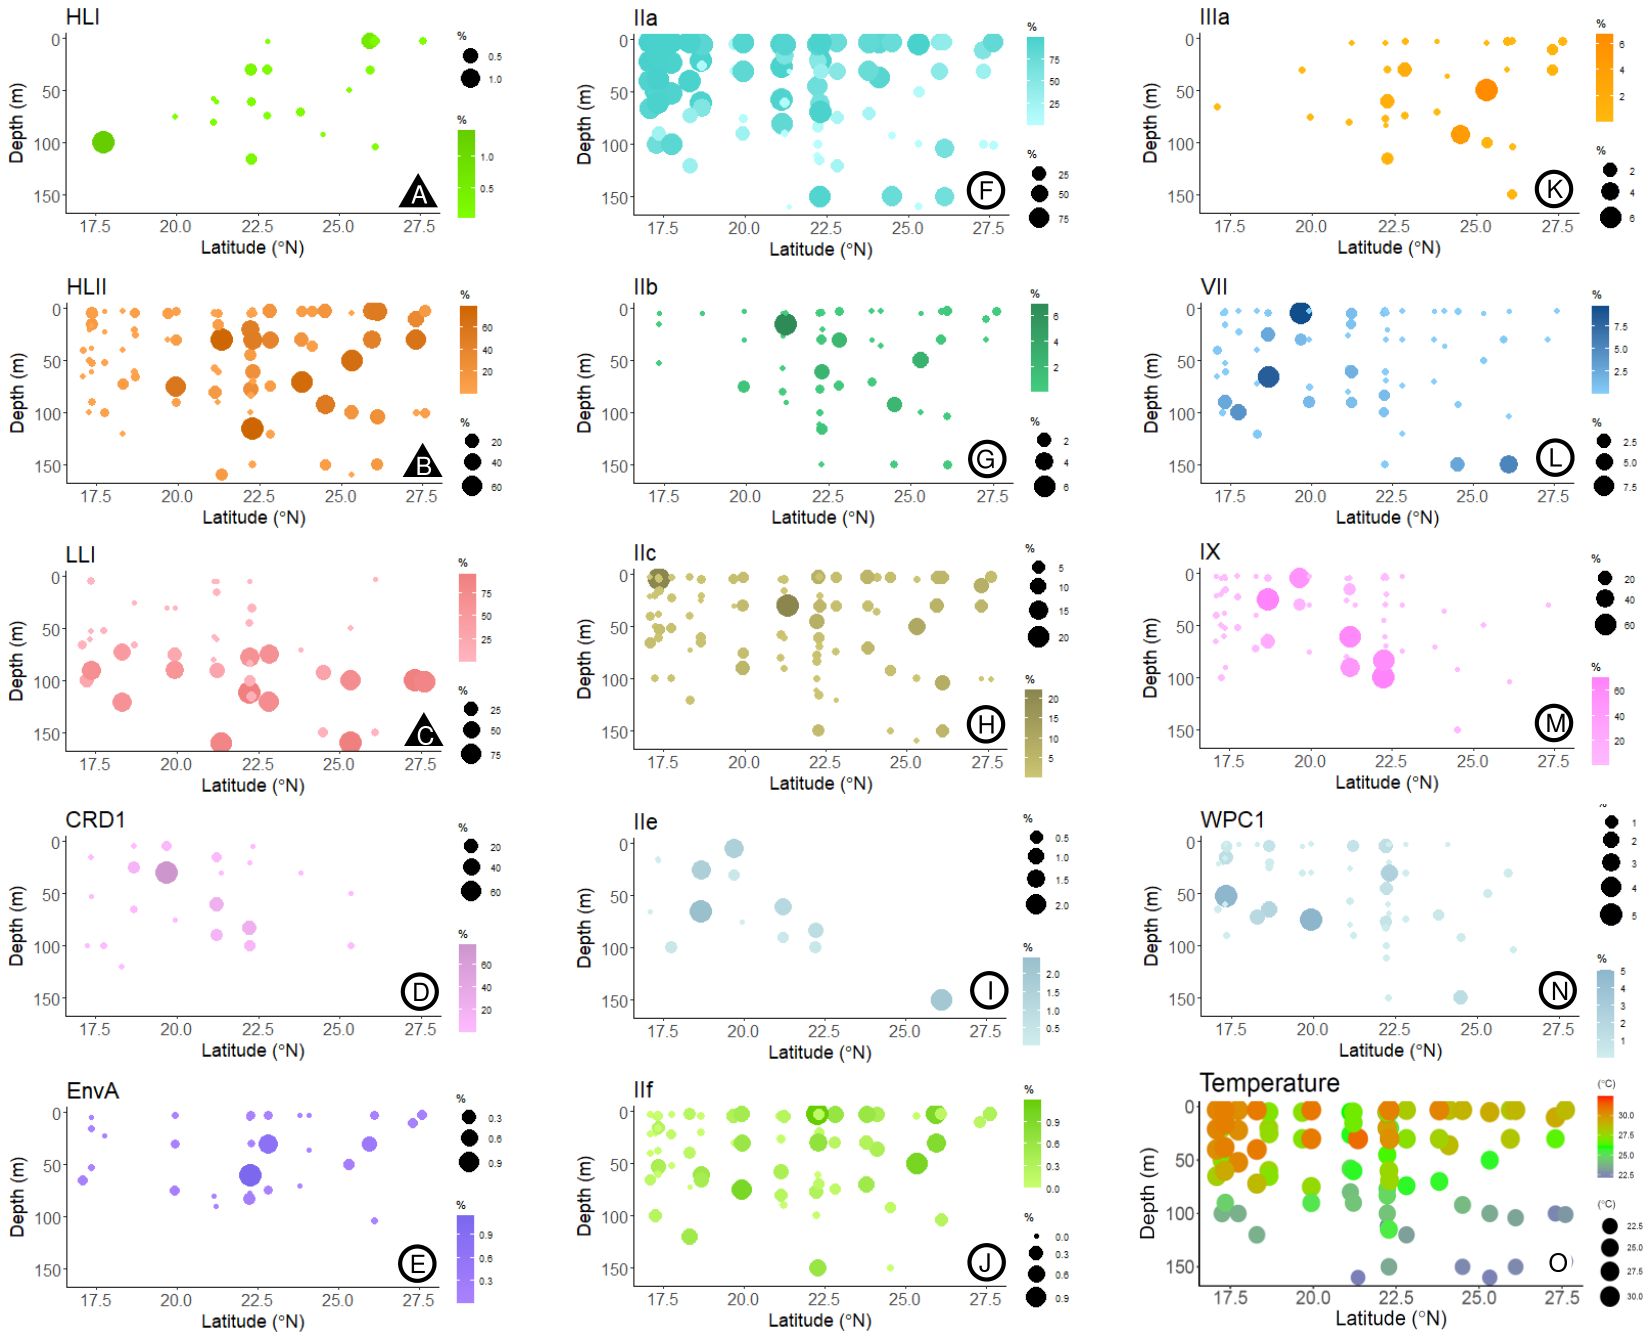
Figure 3. Bubble plots of the % reads corresponding to the different (sub)clades identified, relative to total Prochlorococcus and Synechococcus reads, according to latitude and depth. Plots marked with (▲, plots A–C) represent Prochlorococcus and (○, plots D–N) Synechococcus subclades. In plot O, the temperatures measured at the different sampling depths and stations are represented.
For Prochlorococcus, clades HLII and LLI accounted for 13.6 ± 2.1% and 12.8 ± 2.8% (Mean ± SE) of total reads assigned to both genera, respectively, with clade HLII presented in all but one of the samples examined. Whereas HLI was the least abundant Prochlorococcus group with a mean of 0.04 ± 0.02% of total assigned reads (Figure 2). The proportions of total reads assigned to Prochlorococcus HLI and HLII increased significantly with latitude but were largely unaffected by depth (Table 1; Figure 3). Further, the proportions of both groups increased with salinity and decreased with PO4 concentrations, and HLII also decreased with NO3 concentrations (Table 1). Interestingly, the proportion of reads assigned to Prochlorococcus LLI did not vary with latitude, but increased with depth, salinity, and nutrients, and decreased with temperature and both %PAR and %UVB radiations (Table 1; Figure 3). Both HLII and LLI were negatively correlated with Synechococcus cell concentrations, and LLI correlated positively with Prochlorococcus cell concentrations (Table 1).
Prochlorococcus HLI, HLII, and Synechococcus EnvA, IIb, IIc, IIf, and IIIa correlated positively with each other (except IIf with HLII) (Table 1). Prochlorococcus LLI only exhibited a single significant negative correlation with Synechococcus IIa (Table 1). The proportion of the abundant Synechococcus IIa was negatively correlated with the three identified Prochlorococcus groups and with Synechococcus CRD1, IIb, and IIIa (Table 1). Synechococcus CRD1, IIe, IX, and VII correlated positively with each other, and clade IX also correlated negatively with HLII (Table 2). Synechococcus WPC1 correlated positively with EnvA, IIb, IIe, IIf, IX, and VII (Table 1).
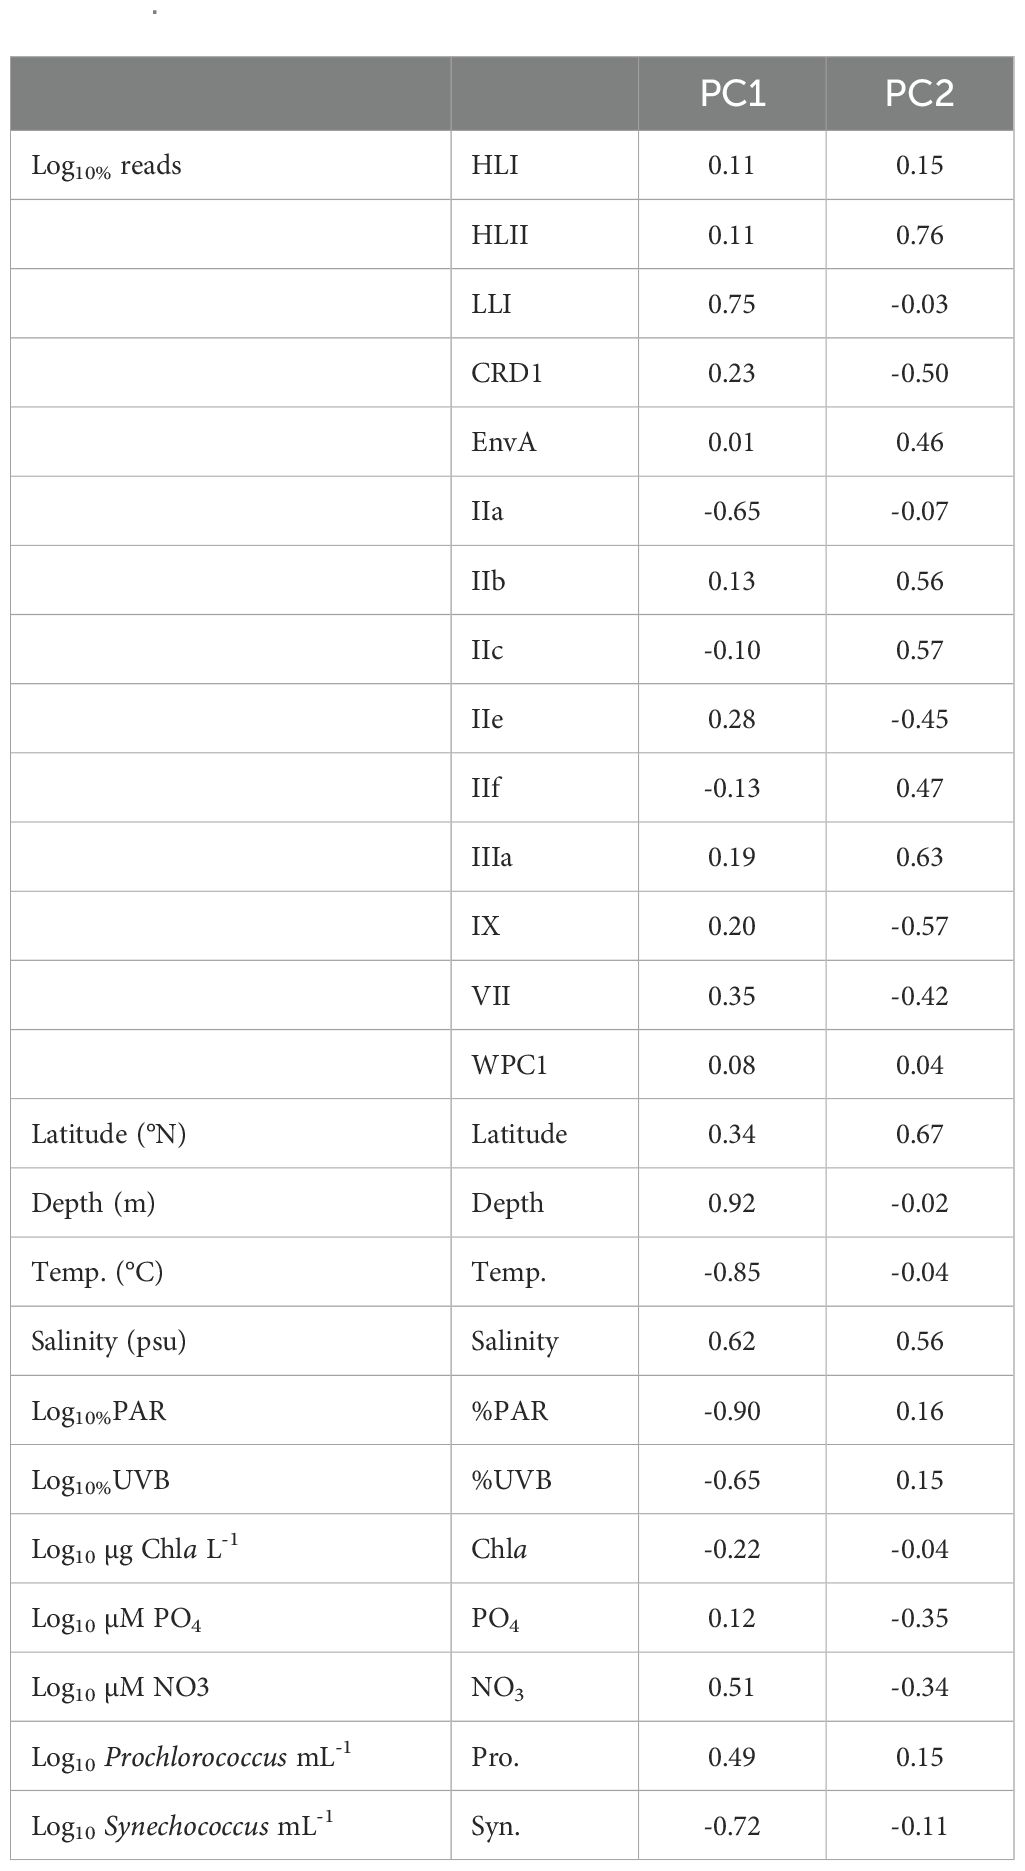
Table 2. Loading values for each component of the PCA plot in Figure 4.
A principal component analysis (PCA) elucidated strong correlations between depth, %PAR, temperature, salinity, %UVB, and NO3 concentration on the proportion of reads assigned to Prochlorococcus LLI and Synechococcus IIa (Figure 4; Table 2). The proportion of Prochlorococcus LLI reads increased significantly in samples collected from deeper, colder, and less illuminated waters under higher salinity and nitrate concentrations, whereas Synechococcus IIa exhibited the opposite response to these factors (Figure 4; Table 2). Furthermore, cell concentrations were also significantly correlated with the proportion of reads of both groups, with LLI being positively correlated with Prochlorococcus cell abundance and negatively correlated with Synechococcus cell abundance. For Synechococcus IIa, the correlations with cell abundances exhibited the opposite trend (Figure 4; Table 2). Latitude and salinity affected most of the read proportions assigned to other groups, with both parameters exhibiting a positive correlation with Prochlorococcus HLII and Synechococcus EnvA, IIb, IIc, IIf, and IIIa, and a negative correlation with Synechococcus CRD1, IIe, and IX (Figure 4; Table 2). Nutrient concentrations had a less pronounced effect on clade relative abundances than latitude and salinity, albeit with an opposite sign (Figure 4; Table 2). Further, we did not identify clear trends for Prochlorococcus HLI and Synechococcus VII and WPC1 read proportions (Figure 4; Table 2).
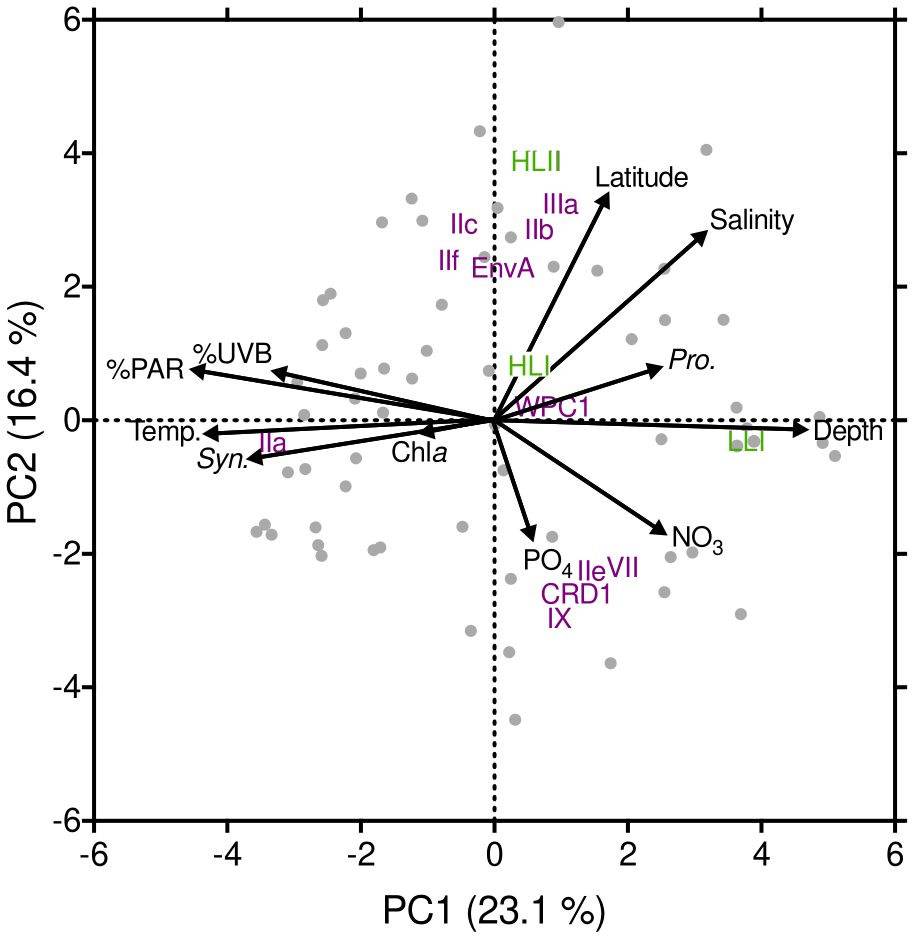
Figure 4. Principal component analysis (PCA) plot including clade % (Prochlorococcus in green; Synechococcus in purple), the main environmental variables measured throughout our study, as well as latitude, depth, and cyanobacteria cell concentrations.
3.3 Diversity indices
The (sub)clade richness and Shannon index for each sample were determined as indicators of alpha diversity. The average (± SE) (sub)clade richness estimated from our samples was 9 ± 0.3 (sub)clades per sample. The lowest richness value was observed in a sample taken at 160 m depth, in a central Red Sea station, where only 3 groups were identified, including Prochlorococcus HLI and HLII and a small proportion of Synechococcus IIa. The maximum richness value was 14, also observed in the DCM of the central Red Sea where all the Prochlorococcus and Synechococcus (sub)clades identified in this study were observed. Cyanobacteria richness reached a maximum value at 27.1°C (polynomial fit, R2 = 0.2, p < 0.0001, Figure 5 plot A); the richness of Synechococcus clades alone reached a maximum value at a similar temperature (27.3°C), whereas no significant trends were found when considering only Prochlorococcus. Richness did not show any significant correlation with salinity but did exhibit significant, albeit weak, negative relationships with phosphate (p = 0.006) and nitrate (p = 0.04). With regards to cell abundances, we observed a maximum richness value at Synechococcus concentrations of approximately 2300 cells mL-1 (polynomial fit, R2 = 0.32, p < 0.0001, Figure 5 plot B). Richness decreased linearly with increasing LLI proportion in the samples (slope = -0.04, p < 0.0001) and increased significantly with the proportions of EnvA (slope = 4.04, p = 0.01), IIf (slope = 3.77, p < 0.0001), WPC1 (slope = 0.89, p = 0.001), and IIIa (slope = 0.64, p = 0.02).
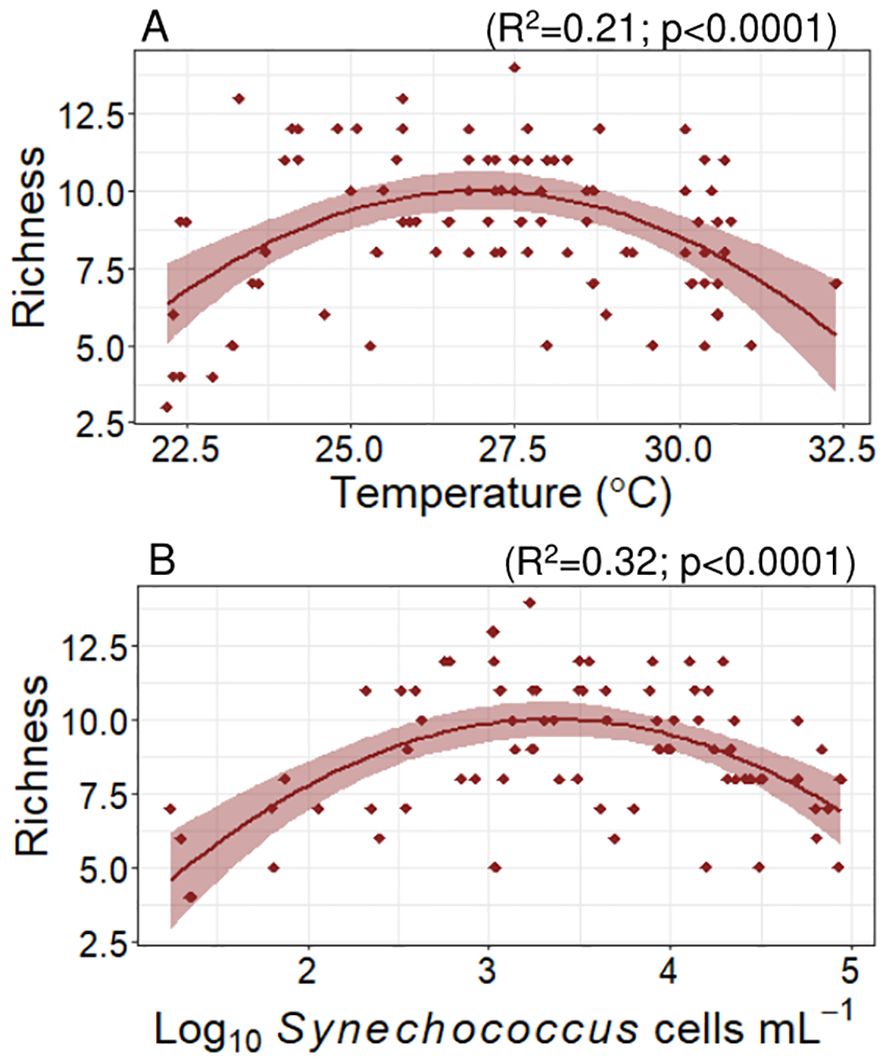
Figure 5. Variation of cyanobacteria richness with temperature (A) and Synechococcus abundance (B).
Shannon’s index averaged 0.58 ± 0.04 and varied between 0.02 and 1.43. This diversity index reached maximum values with latitude at 24.2°N (polynomial fit, R2 = 0.12, p = 0.001). The Shannon index increased linearly with salinity (slope = 0.2 ± 0.05, R2 = 0.13, p = 0.0002) and did not show any significant correlation with nutrients concentrations. This index showed a polynomial relationship with Synechococcus abundance, showing maximum values at Synechococcus concentrations close to 600 cells mL-1 (polynomial fit, R2 = 0.46, p < 0.0001, Figure 6 plot A). Considering the proportion of Synechococcus IIa in the samples, the Shannon index reached its maximum at a 40% Synechococcus IIa proportion (polynomial fit, R2 = 0.77, p < 0.0001, Figure 6 plot B), showing a sharp decrease at lower and higher proportions. For Prochlorococcus clades, the maximum Shannon indices were observed at proportions of 45% Prochlorococcus HLII (R2 = 0.35, p = 0.0001, Figure 6 plot C) and 42% LLI (R2 = 0.22, p = 0.0001). We did not observe any significant correlations between the Shannon index and other detected (sub)clades.
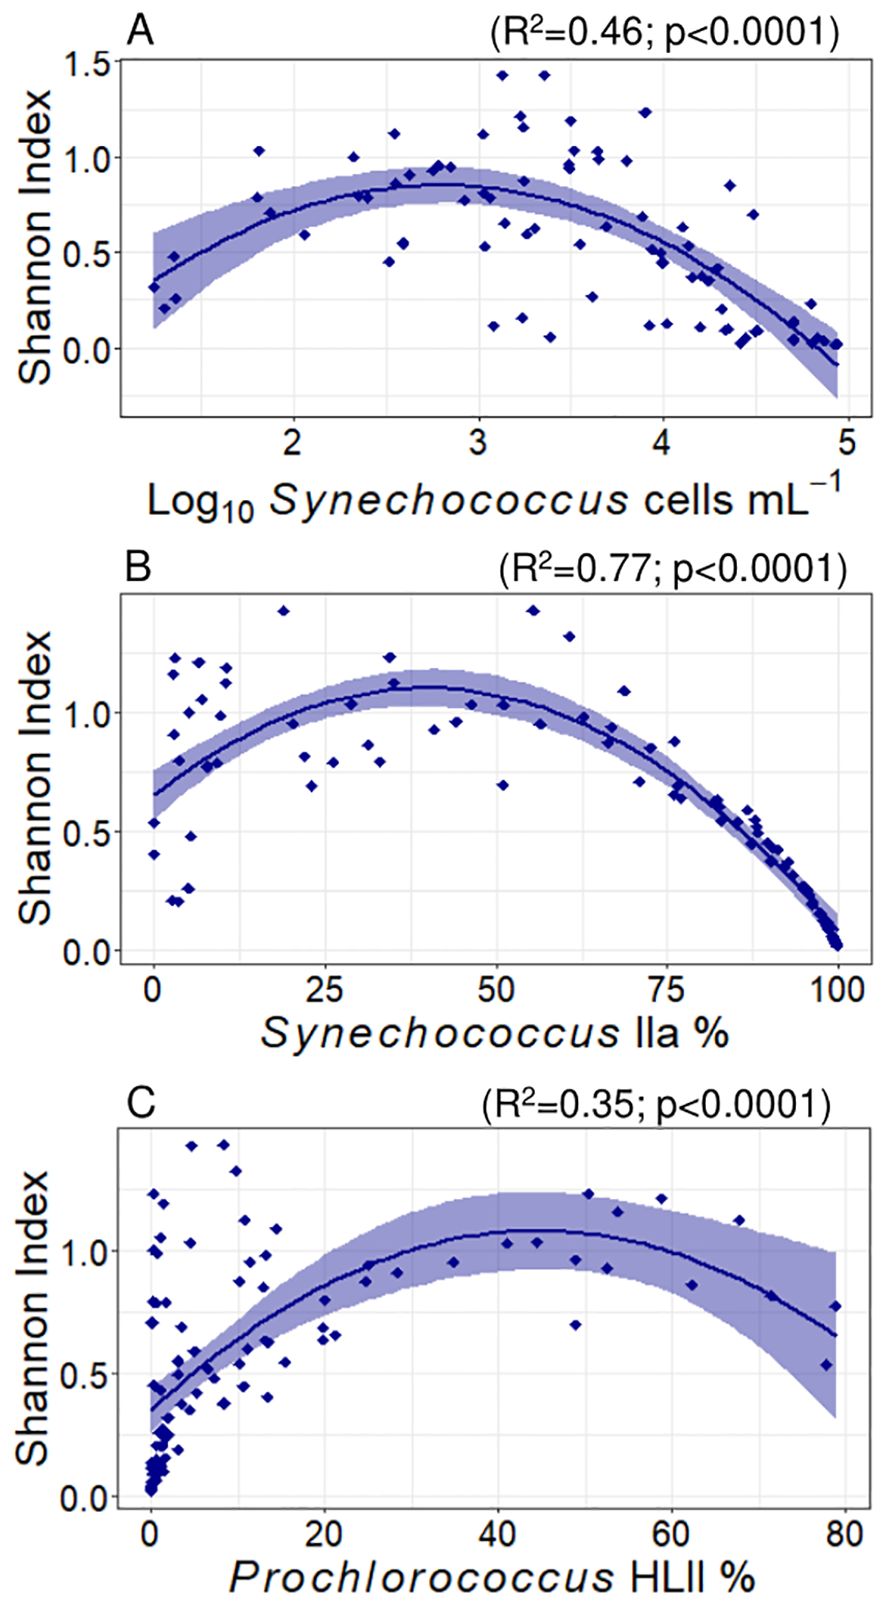
Figure 6. Variation of Shannon’s index with Synechococcus abundance (A), and read proportions of Synechococcus IIa (B) and Prochlorococcus HLII (C). The lines represent adjusted polynomial functions and the shaded areas represent the standard error. The R2 and p values for each fit are represented in the plots.
Next, a Bray-Curtis dissimilarity matrix was calculated to determine the inter-sample diversity (beta diversity). The results of the Mantel test confirmed that there was a significant relationship between the dissimilarity and the Euclidean environmental matrices (r = 0.34, p = 0.001), indicating that the changes in cyanobacterial community composition were modulated by the environment. According to the results of our bioenv test, the set of environmental variables that best explained the dissimilarity matrix were temperature, salinity, and nitrate concentrations (r = 0.36). Adonis analyses were then conducted to test which individual variables correlated best with the changes in community assemblages observed herein. Our results indicated that depth (explaining 19.1% of the variation), temperature (15.4%), salinity (15.0%), latitude (11.8%), and Synechococcus cell abundances (11%) had the strongest effect on the lineage composition between samples, followed by nutrients (PO4: 4.8%, NO3: 7.5%) and Prochlorococcus abundances (6.6%). Further, using a pairwise adonis function, we identified significant differences between the beta-diversities of samples obtained from the southern basin (< 19°N) and samples from the rest of the basin (F Model = 10.28, R2 = 0.11, p = 0.001).
4 Discussion
Our genetic analyses of Red Sea samples elucidated the presence of up to 15 different Synechococcus and Prochlorococcus (sub)clades, with a predominance of Prochlorococcus HLII and Synechococcus subclade IIa, ubiquitous in the photic layer of the Eastern basin, both typical of high-temperature, low-macronutrient, and iron-sufficient waters (Kent et al., 2018). Our findings indicated that clade distribution was strongly influenced by environmental gradients in the Red Sea basin, picocyanobacterial richness showing a bimodal distribution with temperature, showing maximum at 27.3°C, decreasing at lower and higher temperatures. The warmest waters (≥ 30 °C) were dominated by Synechococcus IIa, the most abundant group in the entire basin, and its increasing dominance resulted in a notable decrease in community diversity. For the deepest samples analyzed, we observed an increase in unclassified Prochlorococcus reads below the DCM layer, as observed by Shibl et al. (2016).
We assigned Prochlorococcus reads to 3 different clades, similar to the clade richness obtained targeting the internal transcribed spacer region (ITS) in surface waters of the North Pacific (Choi et al., 2011, 2013; Larkin et al., 2016), but less than those found in other oligotrophic areas (Huang et al., 2012; Shibl et al., 2014; Affe et al., 2018). In the Red Sea, Shibl et al. (2014) identified up to 8 different Prochlorococcus clades, mostly dominated by HLII. Prochlorococcus HLII was ubiquitous and the most abundant Prochlorococcus clade found in our study, which was also consistent with previous studies in the region (West et al., 2001; Fuller et al., 2005; Penno et al., 2006; Ngugi et al., 2012; Shibl et al., 2014; 2016). We found lower abundances of Prochlorococcus HLI, and LLI, as observed for the Gulf of Aqaba in the Northern Red Sea (West et al., 2001; Fuller et al., 2005). Prochlorococcus clades were distributed down the water column following a vertical partition, where Prochlorococcus HLII dominated closer to the surface and was present along the water column. A similar result was reported by Shibl et al. (2014) for the Red Sea, highlighting the predominance of HLII even below 200 m deep. Prochlorococcus LLI showed increased proportions below 70 m depths, where PAR was approximately < 1%, matching the niche distribution of Prochlorococcus cell abundances in the Red Sea, characterized by low illuminated and colder waters under higher salinities and nutrient concentrations (Coello-Camba and Agustí, 2021). Seawater temperature (Martiny et al., 2006, 2009) and salinity (Larkin et al., 2016) have been defined as important determinants of the relative abundance of Prochlorococcus HL ecotypes in oceans. Prochlorococcus HLII exhibited a positive correlation with increasing latitude and salinity, with HLI being absent from the southernmost and more superficial samples. The shift from clade HLII to clade HLI towards higher latitudes and colder waters observed here was consistent with the similar distribution of these clades reported elsewhere (Johnson et al., 2006; Zwirglmaier et al., 2008; Huang et al., 2012).
There are few studies documenting the clades composition of Synechococcus in the Red Sea. In our investigation, we determined the presence of 7 Synechococcus clades, in line with the 8 and 10 Synechococcus clades identified by Post et al. (2011) and Fuller et al. (2003), respectively, in the Gulf of Aqaba (Northern Red Sea). We observed that Synechococcus clade II was both ubiquitous and predominant across the Eastern Red Sea basin. Notably, our study encompassed a broader geographical area and water column than previous research on both Prochlorococcus and Synechococcus populations of the Red Sea, further reinforcing the overwhelming dominance of Synechococcus clade II in these waters. Clade II was also found to thrive in surface waters of the Indian Ocean (Farrant et al., 2016) and tropical and subtropical areas of the Pacific gyres (Xia et al., 2019), the California Current (Toledo and Palenik, 2003), and the northern part of the Arabian Sea (Fuller et al., 2006). Zwirglmaier et al. (2008) demonstrated that this clade was associated with warm waters ranging from 22°C to 28 °C in the Moroccan Atlantic, whereas other clades either possessed a wider temperature tolerance range or were restricted to cooler waters. In addition to this clade, we identified several Synechococcus clades, including clades III, VII, and IX, which had been previously detected in the Gulf of Aqaba in the northern Red Sea (Fuller et al., 2003, 2005; Penno et al., 2006). We also identified the presence of clades WPC1, EnvA, and CRD1 in the Red Sea, described elsewhere (Saito et al., 2005; Choi and Noh, 2009; Mazard et al., 2012).
The distribution of the predominant Synechococcus IIa exhibited a positive correlation with both %PAR and %UVB, significantly increasing in warmer, well-illuminated waters characterized by low salinity and nitrate concentrations. However, this subclade was particularly favored by the warmest conditions (>30°C), being temperature the primary factor influencing its abundance in our study, while other Synechococcus II subclades showed minimal response. In the Eastern Red Sea basin, picophytoplankton populations are strongly influenced by temperature, which stands out as the predominant environmental factor shaping their distribution (Coello-Camba and Agustí, 2021). Furthermore, the distribution of cyanobacteria is influenced by competitive interactions among different populations, which play a significant role in defining and partitioning their realized niches. The realized niche of Synechococcus in the Red Sea is centered around 30°C, with this cyanobacterium dominating the picophytoplankton community in warmer waters (Coello-Camba and Agustí, 2021). Specifically, our results indicate that these warmer waters are predominantly inhabited by subclade IIa.
Temperature affects metabolic processes, with higher temperatures increasing the rate of metabolic reactions and therefore controlling ecological processes at all levels of organization (Brown et al., 2004). Temperature has also been defined as a fundamental factor that enhances the diversity of marine taxa in general (Tittensor et al., 2010), and phytoplankton groups in particular (Ibarbalz et al., 2019; Righetti et al., 2019; Busseni et al., 2020) explaining more than two-thirds of the global variations in phytoplankton richness (Righetti et al., 2019). Cyanobacterial richness increased with increasing temperature as is described in global models but the high temperatures that characterize the Red Sea (Chaidez et al., 2017) have gradually decreased the richness of the native cyanobacterial communities, and have led to the overwhelming predominance of Synechococcus subclade IIa. These temperatures exceed the highest ocean temperatures reported in global phytoplankton diversity studies by >1.5 – 2°C (Ibarbalz et al., 2019; Righetti et al., 2019) and may be characteristic of the predicted new “thermal niches” that may experience tropical species with ocean warming (Thomas et al., 2012).
It has been hypothesized that bacterial communities consist of a core community of abundant groups that are responsible for most biogeochemical functions (e.g., carbon fixing or nitrogen cycling) and a group of rare members that provide a background of genomic potential (Höfle et al., 2008; Galand et al., 2009; Pedrós-Alió, 2012). Based on the arbitrary relative abundance cut-off value of 1% that is widely used to discriminate between abundant and rare groups (Galand et al., 2009; Pedrós-Alió, 2012; Vergin et al., 2013), only 6 of the (sub)clades detected in our study can be considered abundant, including Prochlorococcus HLII, LLI, and Synechococcus IIa, IIc, IX, and CRD1. Among the less abundant (sub)clades identified herein, we observed a significant contribution of Synechococcus EnvA, IIf, IIIa, and WPC1 to the richness values. The rare members of a microbial community contribute significantly to its richness and biodiversity (Pedrós-Alió, 2012; Lynch and Neufeld, 2015), maintaining the balance and function of ecosystems by enhancing the metabolic and genetic potential of the community (e.g., Jousset et al., 2017). These groups may also play a role as a “seed bank,” offering a pool of genetic resources that may act as a “safety net” for the community under changing conditions (Vergin et al., 2013; Jousset et al., 2017). Our results indicated that the relative proportions of the rare groups sporadically surpassed the 1% cut-off value, but never in samples taken at temperatures above 30°C, where Synechococcus IIa is overwhelmingly predominant and displaces Prochlorococcus and less abundant subclades from the community. We also observed a slowdown in the increasing trend of cyanobacterial diversity at the warmest range of the tested temperatures, reaching a maximum richness value at 27.1°C, and decreasing at higher temperatures, as Synechcoccus IIa becomes overwhelmingly predominant and reaches average proportions of 86.5% at temperatures above 30°C.
Overall, the range of Shannon indices (0.02-1.43) observed in our study matched the values observed in picocyanobacteria communities from different sites. Choi et al. (2011) reported low Shannon indices (averaging approximately 0.08) in surface cyanobacterial populations that inhabited warm (29-30.9°C) oligotrophic open ocean stations in the tropical Pacific Ocean and were dominated by Prochlorococcus HLII. However, as conditions changed towards colder and more nutrient-rich coasts, Synechococcus populations grew and diversified, leading to peaks in Shannon indices (up to approximately 1.8). The decreased Shannon index observed in our study reflects the Synechococcus IIa increased predominance in the population, thus leading to an overall decrease in (sub)clade diversity as well as to lower equity in the relative abundances of the (sub)clades represented.
We observed a positive correlation between salinity and Shannon diversity, also detected for Synechococcus populations in coastal waters near Hong Kong (Xia et al., 2017). In contrast, nutrient concentrations did not affect the alpha diversity values. Previous observations indicate that nutrient inputs can have different effects on the diversity of phytoplankton communities, either by stimulating the growth of several groups or decreasing diversity due to the dominance of a single blooming species (Spatharis et al., 2007). A previous mesocosm experiment in Red Sea waters determined that the Synechococcus community diversity did not vary during a bloom triggered by nutrient inputs, where, in agreement with our results, clade IIa dominated the community before and immediately after the event, before being decimated by virus infection (Coello-Camba et al., 2020).
Temperature has been defined as a relevant factor in explaining and predicting the global patterns of species richness across major marine groups, ranging from zooplankton to marine mammals (Tittensor et al., 2010). Surface seawater temperature (SST) was found to be the only statistically significant predictor (including primary productivity, oxygen stress and temporal stability) explaining diversity (Tittensor et al., 2010), supporting the kinetic energy hypothesis, which implies that higher metabolic rates or relaxed thermal constraints promote diversity. For phytoplankton groups in particular, Ibarbalz et al. (2019) found that SST was strongly and positively associated with diversity patterns of marine plankton groups across the oceans, explaining overall more than two-thirds of the global variations in phytoplankton richness (Righetti et al., 2019). In a transect through the North Pacific, Xia et al. (2019) observed an increase in the species richness of surface Synechococcus assemblages in response to water temperature, which coincided with a shift in the predominant clade from Synechococcus I in the coldest waters to clade CRD1 in the warmest areas. This is particularly noticeable in the warmest areas where Synechococcus reaches its highest abundance (Coello-Camba and Agustí, 2021). Different studies highlighted the relevance of temperature in driving marine diversity, suggesting that changes in the temperature of the ocean due to warming may have strong consequences for the distribution of marine biodiversity (Ibarbalz et al., 2019; Busseni et al., 2020), including picocyanobacterial taxa, as found in our study.
Therefore, our findings provide important insights into the major environmental factors that shape the diversity of cyanobacterial communities in the Red Sea, as well as the preponderant influence of temperature on (sub)clade distributions and dominance. The highest temperatures led to decreased population diversity as Synechococcus IIa thrived at the expense of displacing other (sub)clades. Using the Red Sea as a gauge for the future global ocean, we could therefore expect thriving Synechococcus populations with decreased microdiversity, posing a potential threat to the metabolic and genetic capabilities of the planktonic community in a high-temperature scenario.
Data availability statement
The datasets presented in this study can be found in online repositories. The names of the repository/repositories and accession number(s) can be found below: https://www.ncbi.nlm.nih.gov/, PRJNA748390.
Author contributions
AC-C: Formal analysis, Investigation, Writing – original draft, Writing – review & editing. SA: Conceptualization, Investigation, Writing – original draft, Writing – review & editing.
Funding
The author(s) declare financial support was received for the research, authorship, and/or publication of this article. This research was supported by King Abdullah University of Science and Technology through baseline funding BAS/1/1072-01-01 to SA and FCC/1/1973-21-01.
Acknowledgments
We thank the technical personnel of the Coastal and Marine Resources Core Laboratory (CMOR) and the RV Thuwal and RV Al-Azizi crews for their assistance during sampling. We also thank Dr. R. Díaz-Rúa for his invaluable contributions to our primer design, DNA extraction, and sequencing procedures.
Conflict of interest
The authors declare that the research was conducted in the absence of any commercial or financial relationships that could be construed as a potential conflict of interest.
The author(s) declared that they were an editorial board member of Frontiers, at the time of submission. This had no impact on the peer review process and the final decision.
Publisher’s note
All claims expressed in this article are solely those of the authors and do not necessarily represent those of their affiliated organizations, or those of the publisher, the editors and the reviewers. Any product that may be evaluated in this article, or claim that may be made by its manufacturer, is not guaranteed or endorsed by the publisher.
Supplementary material
The Supplementary Material for this article can be found online at: https://www.frontiersin.org/articles/10.3389/fmars.2024.1456799/full#supplementary-material
References
Affe H. M. J., Rigonato J., Nunes J. M. C., Menezes M. (2018). Metagenomic analysis of cyanobacteria in an oligotrophic tropical estuary, South Atlantic. Front. Microbiol. 9. doi: 10.3389/fmicb.2018.01393
Agawin N. S., Duarte C. M., Agustí S. (2000). Nutrient and temperature control of the contribution of picoplankton to phytoplankton biomass and production. Limnol. Oceanogr. 45, 591–600. doi: 10.4319/lo.2000.45.3.0591
Al-Otaibi N., Huete-Stauffer T. M., Calleja M., Irigoien X., Morán X. A. G. (2020). Seasonal variability and vertical distribution of autotrophic and heterotrophic picoplankton in the Central Red Sea. PeerJ 8, e8612. doi: 10.7717/peerj.8612
Brown J. H., Gillooly J. F., Allen A. P., Savage V. M., West G. B. (2004). Toward a metabolic theory of ecology. Ecology 85, 1771–1789. doi: 10.1890/03-9000
Busseni G., Caputi L., Piredda R., Fremont P., Mele B. H., Campese L., et al. (2020). Large scale patterns of marine diatom richness: Drivers and trends in a changing ocean. Global Ecol. Biogeogr. 00, 1–14. doi: 10.1111/geb.13161
Caporaso J. G., Kuczynski J., Stombaugh J., Bittinger K., Bushman F. D., Costello E. K., et al. (2010). QIIME allows analysis of high-throughput community sequencing data. Nat. Methods 7, 335. doi: 10.1038/nmeth.f.303
Chaidez V., Dreano D., Agusti S., Duarte C. M., Hoteit I. (2017). Decadal trends in Red Sea maximum surface temperature. Sci. Rep. 7, 1–8. doi: 10.1038/s41598-017-08146-z
Choi D. H., Noh J. H. (2009). Phylogenetic diversity of Synechococcus strains isolated from the East China Sea and the East Sea. FEMS Microbiol. Ecol. 69, 439–448. doi: 10.1111/j.1574-6941.2009.00729.x
Choi D. H., Noh J. H., Hahm M. S., Lee C. M. (2011). Picocyanobacterial abundances and diversity in surface water of the northwestern Pacific Ocean. Ocean. Sci. J. 46, 265–271. doi: 10.1007/s12601-011-0020-0
Choi D. H., Noh J. H., Shim J. S. (2013). Seasonal changes in picocyanobacterial diversity as revealed by pyrosequencing in temperate waters of the East China Sea and the East Sea. Aquat. Microb. Ecol. 7, 75–90. doi: 10.3354/ame01669
Coello-Camba A., Agustí S. (2021). Picophytoplankton niche partitioning in the warmest oligotrophic sea. Front. Mar. Sci. 8. doi: 10.3389/fmars.2021.651877
Coello-Camba A., Diaz-Rua R., Duarte C. M., Irigoien X., Pearman J. K., Alam I., et al. (2020). Picocyanobacteria community and cyanophage infection responses to nutrient enrichment in a mesocosms experiment in oligotrophic waters. Front. Microbiol. 11. doi: 10.3389/fmicb.2020.01153
Coello-Camba A., Diaz-Rua R., Agustí S. (2023). Design and use of a new primer pair for the characterization of the cyanobacteria Synechococcus and Prochlorococcus communities targeting petB gene through metabarcoding approaches. MethodsX. 11, 102444. doi: 10.1016/j.mex.2023.102444
Farrant G. K., Doré H., Cornejo-Castillo F. M., Partensky F., Ratin M., Ostrowski M., et al. (2016). Delineating ecologically significant taxonomic units from global patterns of marine picocyanobacteria. P. Nat. A. Sci. 113, E3365–E3374. doi: 10.1073/pnas.1524865113
Fuller N. J., Marie D., Partensky F., Vaulot D., Post A. F., Scanlan D. J. (2003). Clade-specific 16S ribosomal DNA oligonucleotides reveal the predominance of a single marine Synechococcus clade throughout a stratified water column in the Red Sea. Appl. Environ. Microbiol. 69, 2430–2443. doi: 10.1128/AEM.69.5.2430-2443.2003
Fuller N. J., Tarran G. A., Yallop M., Orcutt K. M., Scanlan D. J. (2006). Molecular analysis of picocyanobacterial community structure along an Arabian Sea transect reveals distinct spatial separation of lineages. Limnol. Oceanogr. 51, 2515–2526. doi: 10.4319/lo.2006.51.6.2515
Fuller N. J., West N. J., Marie D., Yallop M., Rivlin T., Post A. F., et al. (2005). Dynamics of community structure and phosphate status of picocyanobacterial populations in the Gulf of Aqaba, Red Sea. Limnol. Oceanogr. 50, 363–375. doi: 10.4319/lo.2005.50.1.0363
Galand P. E., Casamayor E. O., Kirchman D. L., Lovejoy C. (2009). Ecology of the rare microbial biosphere of the Arctic Ocean. P. Nat. A. Sci. 106, 22427–22432. doi: 10.1073/pnas.0908284106
Höfle M. G., Kirchman D., Christen R., Brettar I. (2008). Molecular diversity of bacterioplankton: link to a predictive biogeochemistry of pelagic ecosystems. Aquat. Microb. Ecol. 53, 39–58. doi: 10.3354/ame01227
Huang S., Wilhelm S. W., Harvey H. R., Taylor K., Jiao N., Chen F. (2012). Novel lineages of Prochlorococcus and Synechococcus in the global oceans. ISME. J. 6, 285–297. doi: 10.1038/ismej.2011.106
Ibarbalz F. M., Henry N., Brandaõ M. C., Martini S., Busseni G., Byrne H., et al. (2019). Global trends in marine plankton diversity across kingdoms of life. Cell 179, 1084–1097. doi: 10.1016/j.cell.2019.10.008
Jameson E., Joint I., Mann N. H., Mühling M. (2010). Detailed analysis of the microdiversity of Prochlorococcus populations along a North-South Atlantic Ocean transect. Environ. Microbiol. 12, 156–171. doi: 10.1111/j.1462-2920.2009.02057.x
Johnson Z. I., Zinser E. R., Coe A., McNulty N. P., Woodward E. M. S., Chisholm S. W. (2006). Niche partitioning among Prochlorococcus ecotypes along ocean-scale environmental gradients. Science 311, 1737–1740. doi: 10.1126/science.1118052
Jousset A., Bienhold C., Chatzinotas A., Gallien L., Gobet A., Kurm V., et al. (2017). Where less may be more: how the rare biosphere pulls ecosystems strings. ISME. J. 11, 853–862. doi: 10.1038/ismej.2016.174
Kent A. G., Baer S. E., Mouginot C., Huang J. S., Larkin A. A., Lomas M. W., et al. (2018). Parallel phylogeography of prochlorococcus and synechococcus. ISME. J. 13, 430–441. doi: 10.1038/s41396-018-0287-6
Larkin A. A., Blinebry S. K., Howes C., Lin Y., Loftus S. E., Schmaus C. A., et al. (2016). Niche partitioning and biogeography of high light adapted Prochlorococcus across taxonomic ranks in the North Pacific. ISME. J. 10, 1555–1567. doi: 10.1038/ismej.2015.244
Lynch M. D. J., Neufeld J. D. (2015). Ecology and exploration of the rare biosphere. Nat. Rev.: Microbiol. 13, 217–229. doi: 10.1038/nrmicro3400
Martin M. (2011). Cutadapt removes adapter sequences from high-throughput sequencing reads. EMBnet. J. 17, 10–12. doi: 10.14806/ej.17.1.200
Martiny A. C., Coleman M. L., Chisholm S. W. (2006). Phosphate acquisition genes in Prochlorococcus ecotypes: evidence for genome-wide adaptation. PNAS 103, 12552–12557. doi: 10.1073/pnas.0601301103
Martiny A. C., Tai A. P., Veneziano D., Primeau F., Chisholm S. W. (2009). Taxonomic resolution, ecotypes and the biogeography of Prochlorococcus. Environ. Microbiol. 11, 823–832. doi: 10.1111/j.1462-2920.2008.01803.x
Mazard S., Ostrowski M., Partensky F., Scanlan D. J. (2012). Multi-locus sequence analysis, taxonomic resolution and biogeography of marine Synechococcus. Environ. Microbiol. 14, 372–386. doi: 10.1111/j.1462-2920.2011.02514.x
Ngugi D. K., Antunes A., Brune A., Stingl U. (2012). Biogeography of pelagic bacterioplankton across an antagonistic temperature-salinity gradient in the Red Sea. Mol. Ecol. 21, 388–405. doi: 10.1111/j.1365-294X.2011.05378.x
Parsons T. R., Maita Y., Lalli C. M. (1984). A manual of chemical and biological methods for seawater analysis (New York: Pergamon).
Pedrós-Alió C. (2012). The rare bacterial biosphere. Annu. Rev. Mar. Sci. 4, 449–466. doi: 10.1146/annurev-marine-120710-100948
Penno S., Lindell D., Post A. F. (2006). Diversity of Synechococcus and Prochlorococcus populations determined from DNA sequences of the N-regulatory gene ntcA. Environ. Microbiol. 8, 1200–1121. doi: 10.1111/j.1462-2920.2006.01010.x
Post A. F., Penno S., Zandbank K., Paytan A., Huse S. M., Welch D. M. (2011). Long term seasonal dynamics of Synechococcus population structure in the Gulf of Aqaba, Northern Red Sea. Front. Microbiol. 2. doi: 10.3389/fmicb.2011.00131
Rasul N. M., Stewart C., Nawab Z. A. (2015). “Introduction to the Red Sea: its origin, structure, and environment,” in The Red Sea: the formation, morphology, oceanography and environment of a young ocean basin. Eds. Rasul N. M., Stewart I. C. (Heidelberg: Springer), 1–28.
Righetti D., Vogt M., Gruber N., Psomas A., Zimmermann N. E. (2019). Global pattern of phytoplankton diversity driven by temperature and environmental variability. Sci. Adv. 5, eaau6253. doi: 10.1126/sciadv.aau6253
Rognes T., Flouri T., Nichols B., Quince C., Mahé F. (2016). VSEARCH: a versatile open source tool for metagenomics. PeerJ 4, e2584. doi: 10.7717/peerj.2584
Saito M. A., Rocap G., Moffett J. W. (2005). Production of cobalt binding ligands in a Synechococcus feature at the Costa Rica upwelling dome. Limnol. Oceanogr. 50, 279–290. doi: 10.4319/lo.2005.50.1.0279
Scanlan D. J., Ostrowski M., Mazard S., Dufresne A., Garczarek L., Hess W. R., et al. (2009). Ecological genomics of marine picocyanobacteria. Microbiol. Mol. Biol. Rev. 73, 249–299. doi: 10.1128/MMBR.00035-08
Schloss P. D., Westcott S. L., Ryabin T., Hall J. R., Hartmann M., Hollister E. B., et al. (2009). Introducing mothur: Open-source, platform-independent, community-supported software for describing and comparing microbial communities. Appl. Environ. Microbiol. 75, 7537–7541. doi: 10.1128/AEM.01541-09
Shibl A. A., Haroon M. F., Ngugi D. K., Thompson L. R., Stingl U. (2016). Distribution of Prochlorococcus ecotypes in the Red Sea basin based on analyses of rpoC1 sequences. Front. Mar. Sci. 3. doi: 10.3389/fmars.2016.00104
Shibl A. A., Thompson L. R., Ngugi D. K., Stingl U. (2014). Distribution and diversity of Prochlorococcus ecotypes in the Red Sea. FEMS Microbiol. Lett. 356, 118–126. doi: 10.1111/1574-6968.12490
Spatharis S., Tsirtsis G., Danielidis D. B., Do Chi T., Mouillot D. (2007). Effects of pulsed nutrient inputs on phytoplankton assemblage structure and blooms in an enclosed coastal area. Estuar. Coast. Shelf. Sci. 73, 807–815. doi: 10.1016/j.ecss.2007.03.016
Tamura K., Dudley J., Nei M., Kumar S. (2007). MEGA4: Molecular Evolutionary Genetics Analysis (MEGA) software version 4.0. Mol. Biol. Evol. 24, 1596–1599. doi: 10.1093/molbev/msm092
Thomas M. K., Kremer C. T., Klausmeier C. A., Litchman E. (2012). A global pattern of thermal adaptation in marine phytoplankton. Science 338, 1085–1088. doi: 10.1126/science.1224836
Tittensor D. P., Mora C., Jetz W., Lotze H. K., Ricard D., Berghe E. V., et al. (2010). Global patterns and predictors of marine biodiversity across taxa. Nature 466, 1098. doi: 10.1038/nature09329
Toledo G., Palenik B. (2003). A Synechococcus serotype is found preferentially in surface marine waters. Limnol. Oceanogr. 48, 1744–1755. doi: 10.4319/lo.2003.48.5.1744
Uitz J., Claustre H., Gentili B., Stramski D. (2010). Phytoplankton class-specific primary production in the world’s oceans: Seasonal and interannual variability from satellite observations. Global Biogeochem. Cycles. 24, GB3016. doi: 10.1029/2009GB003680
Veldhuis M. J. W., Kraay G. W. (1993). Cell abundance and fluorescence of picoplankton in relation to growth irradiance and nitrogen availability in the Red Sea. Neth. J. Sea. Res. 31, 135–145. doi: 10.1016/0077-7579(93)90003-B
Vergin K. L., Done B., Carlson C. A., Giovannoni S. J. (2013). Spatiotemporal distributions of rare bacterioplankton populations indicate adaptive strategies in the oligotrophic ocean. Aquat. Microb. Ecol. 71, 1–13. doi: 10.3354/ame01661
Weikert H. (1987). “Plankton and the pelagic environment,” in Key Environments-Red Sea. International Union for Conservation of Nature and Natural Resources. IV Series. Eds. Edwards A. J., Head S. M. (Oxford: Pergamon Press), 90–111.
West N. J., Schönhuber W. A., Fuller N. J., Amann R. I., Rippka R., Post A. F., et al. (2001). Closely related Prochlorococcus genotypes show remarkably different depth distributions in two oceanic regions as revealed by in situ hybridization using 16S rRNA-targeted oligonucleotides. Microbiology 147, 1731–1744. doi: 10.1099/00221287-147-7-1731
Xia X., Cheung S., Endo H., Suzuki K., Liu H. (2019). Latitudinal and vertical variation of Synechococcus assemblage composition along 170° W transect from the South Pacific to the Arctic Ocean. Microb. Ecol. 77, 333–342. doi: 10.1007/s00248-018-1308-8
Xia X., Guo W., Tan S., Liu H. (2017). Synechococcus assemblages across the salinity gradient in a salt wedge estuary. Front. Microbiol. 8. doi: 10.3389/fmicb.2017.01254
Zhang J., Kobert K., Flouri T., Stamatakis A. (2013). PEAR: a fast and accurate Illumina Paired-End reAd mergeR. Bioinformatics 30, 614–620. doi: 10.1093/bioinformatics/btt593
Keywords: picocyanobacteria, Prochlorococcus HLII, Synechococcus IIa, microdiversity, warming, Red Sea, temperature
Citation: Coello-Camba A and Agustí S (2024) Seawater temperature drives the diversity of key cyanobacteria (Synechococcus and Prochlorococcus) in a warming sea. Front. Mar. Sci. 11:1456799. doi: 10.3389/fmars.2024.1456799
Received: 29 June 2024; Accepted: 27 August 2024;
Published: 17 September 2024.
Edited by:
Aurea Maria Ciotti, University of São Paulo, BrazilCopyright © 2024 Coello-Camba and Agustí. This is an open-access article distributed under the terms of the Creative Commons Attribution License (CC BY). The use, distribution or reproduction in other forums is permitted, provided the original author(s) and the copyright owner(s) are credited and that the original publication in this journal is cited, in accordance with accepted academic practice. No use, distribution or reproduction is permitted which does not comply with these terms.
*Correspondence: Alexandra Coello-Camba, YWNvZWxsb2NhbWJhQGdtYWlsLmNvbQ==