 Jack Lloyd
 Kaijun Lu
 Zhanfei Liu
- Marine Science Institute, The University of Texas at Austin, Port Aransas, TX, United States
Polycyclic aromatic hydrocarbons (PAHs) are among the most widespread organic contaminants in the environment, and anthropogenic activities can produce PAHs through a variety of pyrogenic or petrogenic means. Knowing the concentrations and sources of PAHs helps evaluate ecosystem health and manage natural resources. In this study, 16 US Environmental Protection Agency priority PAHs were analyzed in water and sediment samples collected from September 2021 to September 2023 in four bay systems along the south and central Texas coast, which are a hotpot of crude oil transportation in the United States. Our results indicated that the total concentration of PAHs ranged from 1.9 to 8.3 ng/mL in surface waters (< 0.5 m) and from 520 to 1257 ng/g in surface sediments (top 5 cm). Grain size analysis revealed that the sediment was dominated by silt (4 - 63 μm), followed by clay (< 4 μm) and sand (> 63 μm) fractions. Both organic carbon and clay content were shown to play a significant role in controlling the PAH content in sediments. Diagnostic ratios indicated that PAHs were primarily sourced via pyrolytic processes, such as the combustion of fossil fuels. Additional sampling at Port Bay, a shallow, secondary bay in the Mission-Aransas National Estuarine Research Reserve, implicated a strong role of resuspension in the distribution and composition of PAHs in the bay systems studied. Overall, these data offer insights into the concentration levels and sources of PAHs in this key region housing oil production and transportation in the United States.
1 Introduction
Polycyclic aromatic hydrocarbons (PAHs) are a major class of contaminants that enter the marine environment through a variety of anthropogenic and natural means, such as oil spills, natural fires, and the combustion of fossil fuels by vehicles and boats (Bianchi and Canuel, 2011; Eisler, 1987; Kennish, 2002), although the production from natural sources is low compared to those from anthropogenic sources (Nikolaou et al., 2009). Among the most widespread organic contaminants in the marine environment (Sun et al., 2021), PAHs are known for their carcinogenic, mutagenic, and teratogenic properties (Gonzalez-Gaya et al., 2019; Kumar et al., 2021), and 16 PAHs have been included in the US Environmental Protection Agency’s (EPA) list of priority pollutants (Keith, 2015). Given their hydrophobic nature, PAHs generally rapidly sorb onto particles in the water column before deposition into sediments, and this strong adsorption of PAHs to sediment particles can result in accumulation and long preservation times in the environment (Tolosa et al., 2004).
Concentrations of PAHs in sediments are considered to be influenced by grain size and organic matter content of the sediment. Sediment organic matter (OM) has been observed to play a major role in sorbing PAHs, particularly when the OM contents are greater than 0.1% (Johnson et al., 2001). Furthermore, various studies have suggested that the types of organic matter in sediments, such as terrestrial vs marine or fresh vs aged, impact sediment PAH concentrations (Oen et al., 2006; Yang et al., 2011; Wang et al., 2014). The role of sediment grain size in controlling PAH concentrations is still under debate, or may depend on specific environments. For example, Wang et al. (2001) found that the highest concentrations of PAHs in Boston Harbor sediments were associated with large size (> 250 µm) fractions, while relatively few PAHs were present in the fine silt and clay fractions (< 62 µm). In contrast, Evans et al. (1990) found that PAHs were associated with both coarse (> 125 µm) and fine (≤ 63 µm) sediment fractions.
The coastal region of south and central Texas houses abundant petrochemical industries which involve the production, refinement, and transportation of crude oil and liquified natural gas. In 2023 alone, 126.1 million tons of crude oil and 16.3 million tons of liquefied natural gas were transported across Corpus Christi Bay in south Texas (Acosta, 2024). Furthermore, in the Mission-Aransas National Estuarine Research Reserve (NERR), 649 oil and gas wells have been drilled to date, and 40 of these wells remain active (Evans et al., 2012). Intensive petroleum-related activities may be responsible for the accumulation of significant amounts of PAHs in the environment due to unintentional leaks, nonpoint contaminations, and fuel combustion. Considering that PAHs account for 10-15% of hydrocarbons in crude oil (Vane et al., 2007; Barata et al., 2005), and the importance of south and central Texas to a variety of economic activities (Evans et al., 2012; West et al., 2023; Borland and Jones, 2020), it is crucial to understand the distribution of PAHs and the controlling environmental factors in this region. Studies have documented sporadic sediment aromatic hydrocarbon concentrations in the NERR and Corpus Christi Bay, respectively (Liu et al., 2011; Carr et al., 2000), yet to the best of our knowledge, no studies have systematically documented the total petroleum hydrocarbons in the water and sediment of the bays and estuaries along the entire south and central Texas coast. Therefore, it is important to gain the baseline petroleum hydrocarbon data to assess the current state of petroleum hydrocarbon pollution in this region, as well as to be prepared for the response and evaluation of a potential oil spill in the future.
Given the petroleum and shipping activities of the region, we hypothesized that PAH concentrations would be greatest in areas in which these activities are relatively greater, such as Corpus Christi and Matagorda Bays. The Port of Corpus Christi is the third largest port in total revenue tonnage in the United States, and the largest crude oil export gateway in the nation. In Matagorda Bay, the Calhoun Port Authority moved more than 11.8 million tons of cargo in 2015 alone, and this cargo consisted primarily of petrochemicals, crude oil, condensate, bauxite and alumina (Texas Department of Transportation, 2020). Accordingly, this project aimed to (1) quantify the PAHs in sediments and waters of the Mission-Aransas National Estuarine Research Reserve (NERR), Corpus Christi Bay, San Antonio Bay, and Matagorda Bay, and (2) interrogate sources of the PAHs and environmental factors that control their abundances in the environment.
2 Methods
2.1 Study sites
Sampling for this project occurred at twenty-nine sites, seven of which were in Corpus Christi Bay, five in the Mission-Aransas NERR, five in San Antonio Bay, and twelve in Matagorda Bay (Figure 1; Table 1). Sampling encompassed regions of south Texas (Corpus Christi Bay and the Mission-Aransas NERR) and central Texas (San Antonio and Matagorda Bays). Samples were taken at all sites from September 2021 to August 2022, and additional samples were taken from San Antonio and Matagorda Bays in September 2023. The goal was to have enough spatial coverage so that the data are representative of the whole bay or estuary to a certain degree. Furthermore, opportunistic sampling was taken at eight sites in Port Bay, a very shallow (< 1 m) secondary bay to Copano Bay in the Mission-Aransas NERR, in December 2022 and November 2023 (Supplementary Figure 1).
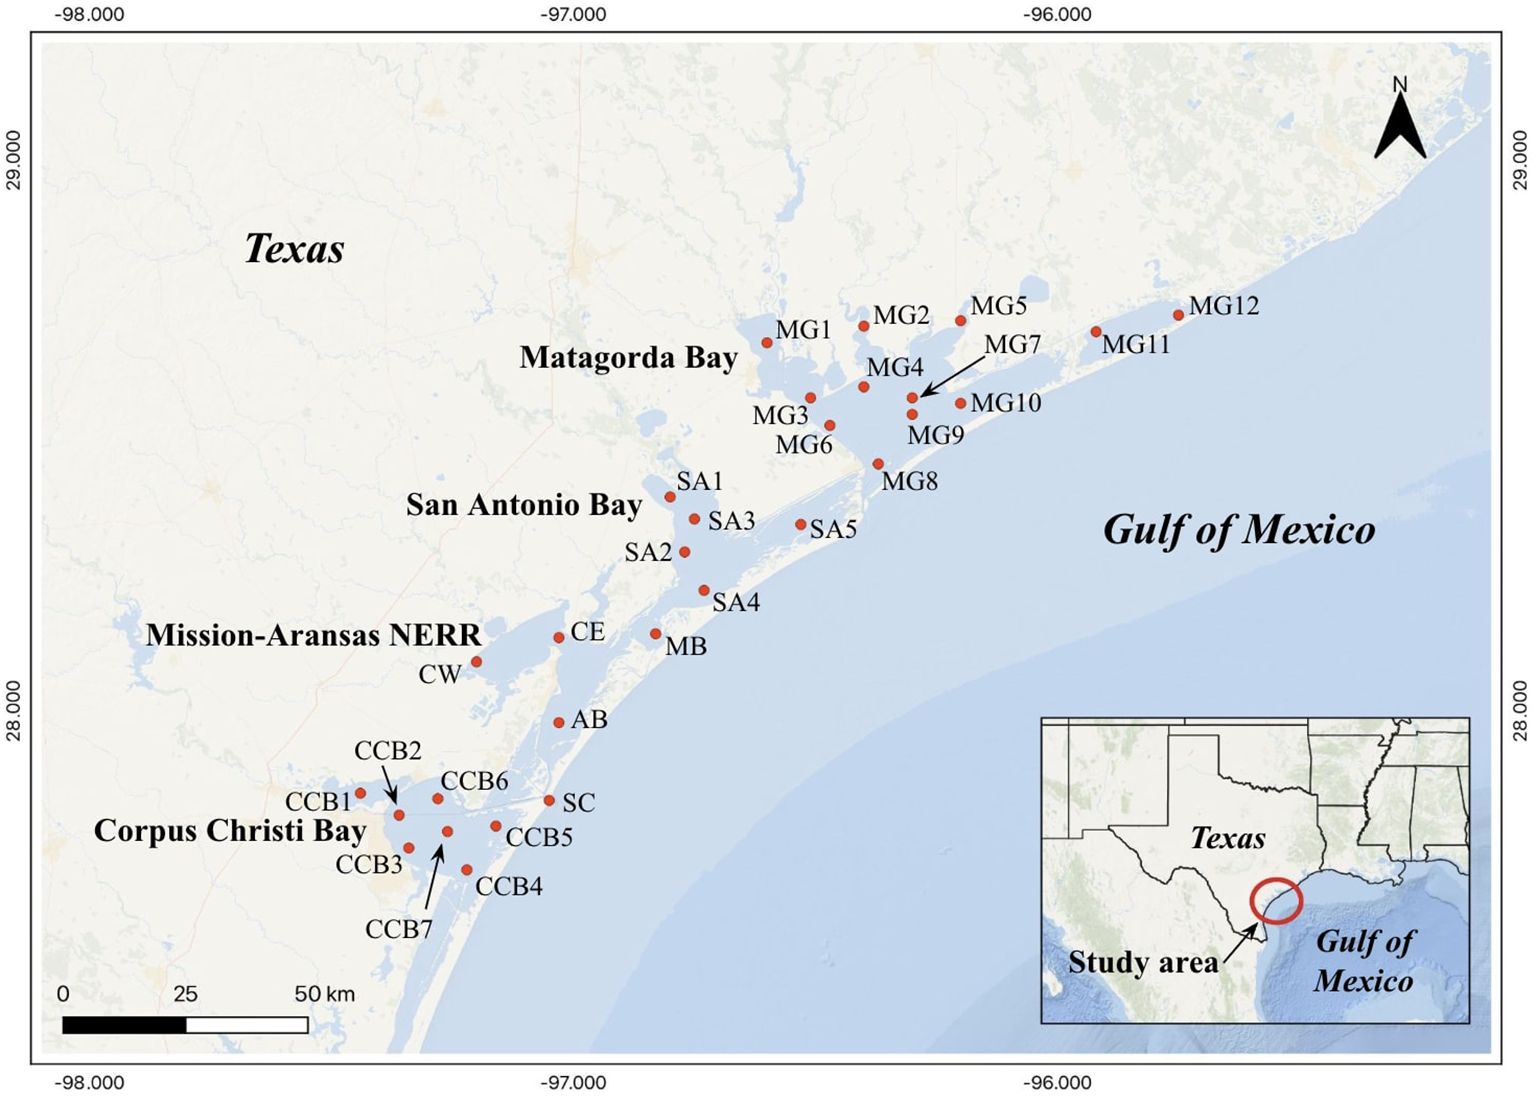
Figure 1. Locations of sampling sites, as shown by red points on the map.
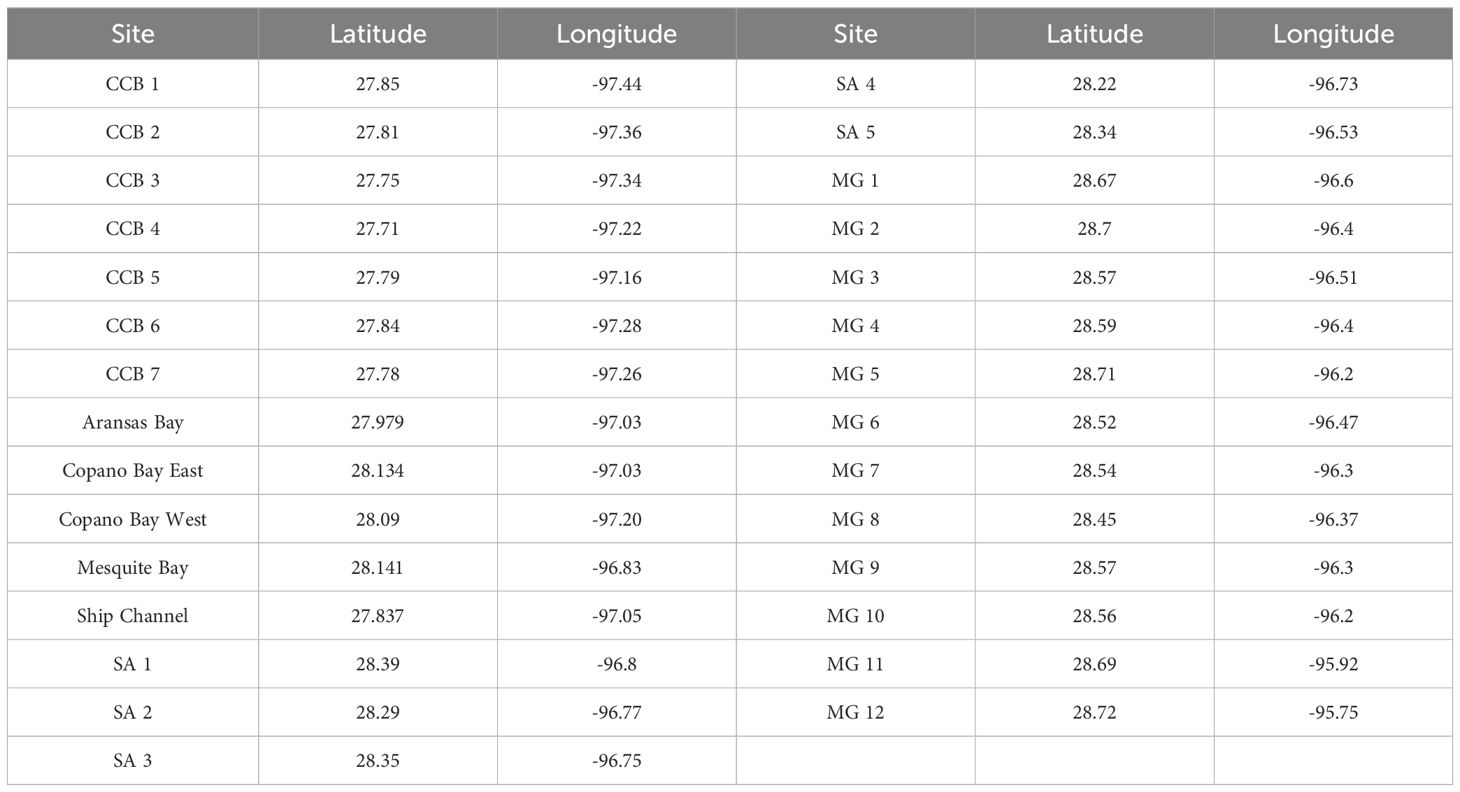
Table 1. Geographic coordinates of sampling sites.
2.2 Sampling
At each sampling site, water and sediment samples were collected while on a small research vessel according to Wang et al. (2014). Briefly, at each site two sediment cores were collected using a home-made corer, with similar principles but a simpler version of the “HYPOX” corer (Gardner et al., 2009). The top five centimeters of surface sediment were sectioned on deck at each sampling site, and sediment samples were placed on ice and transferred to the lab before being subdivided and frozen at -20 °C immediately after the same-day cruise. Duplicate four-liter water samples of surface water were collected in amber glass jars at each site, then acidified to a pH of 2 upon returning to the lab. Environmental parameters such as salinity, pH, temperature, dissolved oxygen, and water depth were recorded by a YSI-Sonde at each site. One-liter water samples were collected in Matagorda Bay for PAH analysis as a preliminary test in 2021, but the concentrations of PAHs were too low to be detected. Therefore, four liters of water samples were collected for all other bays.
2.3 Grain size analysis
Sediment grain size was measured according to the methods of Xu et al. (2014). Briefly, sediment samples were analyzed using a Beckman Coulter laser diffraction particle size analyzer (Model LS 13 320). About 20 mL of deionized water was added to ~1 g of freeze-dried sediments in a beaker and samples were soaked for 24 h. Then the samples were treated on a Vortex Mixer for 5 min and transferred to a 1 phi (φ; 2000 mm) sieve to remove any particles (e.g., shell fragments) coarser than 2000 mm. Neither acid nor hydrogen peroxide was used to remove carbonate or organic matter in this analysis. When samples were loaded to the chamber of the laser analyzer, sonication was turned on to ensure complete disaggregation. This laser analyzer had a detection range of 0.02 – 2000 mm and produced grain size data in 1/8 phi resolution. Mean grain size, standard deviation, skewness, and kurtosis were calculated using the methods from Folk (1980).
Samples from each site were categorized into sand (> 63 μm; φ < 4), silt (4 – 63 μm; φ is 4–8) and clay (< 4 μm; φ > 8) based on weight percentages. Mud discussed in this study is the summation of silt and clay. The phi (φ) scale was defined as φ = -log2(grain diameter in mm), according to the Udden-Wentworth phi classification (Brown and McLachlan, 2010).
2.4 Organic carbon analysis
Organic carbon in sediments was analyzed according to the methods of Liu and Xue (2020) and Hedges and Stern (1984). Briefly, surface sediments (~2 g) were placed on GF/F filters and acid fumigated (HCl) for 48 h to remove inorganic carbon. Approximately 5 mg of the acidified sediment from each site was wrapped in a tin capsule, and measured using a Thermo FLASH 2000 CHN Elemental Analyzer coupled with a Thermo Delta V Plus isotope ratio mass spectrometer. Precision for the C content was within 5%, and for δ13C within 0.2‰.
2.5 Total suspended solids analysis
Samples for the analysis of total suspended solids (TSS) were collected during the November 2023 trip in Port Bay, and were measured following the U.S. Environmental Protection Agency (EPA) method 160.2 (EPA, 1999). Briefly, pre-combusted 47 mm 0.7 μm GF/F filters were dried and weighed prior to filtration. Two hundred mL of surface water was filtered for each filter. The filters were then dried in an oven at 103 °C until constant weights were reached (for at least one hour; weight loss is less than 0.5 mg).
2.6 Extraction of PAHs
Sixteen priority PAHs listed by the US Environmental Protection Agency (EPA) were analyzed: naphthalene (Nap), acenaphthylene (Acy), acenaphthene (Ace), fluorene (Fl), phenanthrene (Phe), anthracene (An), fluoranthene (Flu), pyrene (Pyr), benz[a]anthracene (BaA), chrysene (Chr), benzo[b]fluoranthene (BbF), benzo[k]fluoranthene (BkF), benzo[a]pyrene (BaP), indeno[1,2,3-cd]pyrene (IP), dibenz[a,h]anthracene (DBA), and benzo[ghi]perylene (BgP). Quantification of PAH concentrations was based on a comparison to a standard curve created by a standard mixture of 16 US EPA-priority PAHs. Deuterated Phe (Phe-d10) was spiked into each sample as the surrogate standard prior to extraction to calculate the recovery rate.
Extraction of PAHs from sediment sample extraction was modified after Wang et al. (2012). Freeze-dried sediment samples were placed through an Accelerated Solvent Extractor (ASE-350 from DIONEX, USA) using a mixture of acetone and dichloromethane (1:1 v/v). Phe-d10 was added to approximately 5 g of each sample to a final concentration of 1 ppm Phe-d10, assuming a final extraction volume of 2 mL. A blank was made containing the same amount of surrogate standard, but no sediment sample. The extraction cells were heated to 100 °C until the pressure of 10 MPa was reached. The static time was 5 minutes, the flush volume was 60%, and the purge time was 90 s. The final volume of the extract was approximately 30 – 40 mL. The collected solution was then cleaned and reduced to 2 mL by blowing nitrogen (N2) gas in order to evaporate the acetone and dichloromethane. These samples were then placed into vials and preserved in a freezer at -20 °C until gas chromatography-mass spectrometry (GC-MS) analysis.
PAHs in water samples (including particle-bound suspended PAHs) were extracted using solid phase extraction according to the method described by Biotage. Briefly, 4 L of water were collected and acidified with 3 mL of 12N HCl to a pH of 2. Forty mL of methanol was added to each sample to facilitate the extraction process. Prior to the extraction, the Isolute TPH columns (Biotage) were primed with 150 mL of methanol and 100 mL of pH ~2 H2O. The acidified samples were then run through the activated columns at a flow rate of 30 mL/min. After 3 L of samples had been extracted, 100 mL of acetone and 200 mL of pH ~2 H2O were added to each sample, and the sample bottles were shaken and swirled before continuing with the extraction. This step is to minimize the residual TPHs adsorbed to the wall of the sampling bottle. The samples in the column were then eluted with four rounds of 5 mL of hexane per cartridge. The eluted solution was cleaned and concentrated to 5 mL via blowing with N2 gas, and stored in a freezer until further analysis.
2.7 PAHs analysis
PAHs were analyzed by gas chromatography-mass spectrometry (GC-MS, Shimadzu QP2010 plus). The GC was equipped with an SH-RXi-5Sil MS capillary column (30 m × 0.25 mm i.d., film thickness 0.25 µm), with helium (He) as the carrier gas at 2 mL/min flow, using selective ion monitoring (SIM) mode. The scan ions ranged from an m/z of 127 to 279. The oven temperature was held at 40 °C for 1 min, increased to 240 °C at a rate of 10 °C/min, increased to 280 °C at a rate of 4 °C/min and held for 10 min, and increased to 300 °C at a rate of 10 °C/min and held for 5 min. The temperatures of the injector and detector were both 250 °C. The injection volume was 1 µL in a split mode (1:10).
2.8 Quality assurance/quality control
All analyses were conducted on duplicate samples. One deuterated PAH (Phe-d10) was used as a surrogate during the extraction for recovery calculation. The average recovery rates of the surrogate for both water and sediment samples 108.7 ± 19.0%. Method blanks were analyzed by the same procedure as the samples to determine any background contamination, and the background contamination was negligible. The instrument detection limit (IDL), which represents the lowest level that the instrument can detect, was ca. 0.01 μg/mL (given a threshold of 2, and the average signal to noise ratio at 0.1 μg/mL PAH standard is at least 20). Since the concentration factor for water samples was 800 (i.e., concentrate from 4 L samples to 5 mL), and 2.5 for sediment samples (i.e., concentrate from 5 g to 2 mL), the method detection limit (MDL) was calculated as ca. 0.0125 ng/mL for water samples and ca. 4 ng/g for sediment samples.
2.9 Statistical analyses
Statistical analyses, including analysis of variance (one-way ANOVA) and Principal Component Analysis (PCA) were conducted in Excel and R-Studio (Version 4.2.2), respectively. PAH sources were evaluated through isomer ratios of An/(An + Phe), Flu/(Flu + Pyr), BaA/(BaA + Chr), and IP/(IP + BgP) (Yunker et al., 2002). Figures were generated using DataGraph (Version 5.1.1).
3 Results and discussion
3.1 Sediment characterization
Sediments from all sites were composed primarily of > 50% mud (i.e., silt and clay), and among all size fractions silt was the most abundant on average (46.2%), followed by clay (39.0%), then sand (14.8%) (Figure 2). Among the different bays and grain size fractions, the percent clay fraction was higher in the NERR than San Antonio Bay (one-way ANOVA, p = 0.02), and the percent silt fraction was lower in Corpus Christi Bay than San Antonio Bay (p = 0.01), as well as in Matagorda Bay compared to San Antonio Bay (p = 5 x 10⁻³).
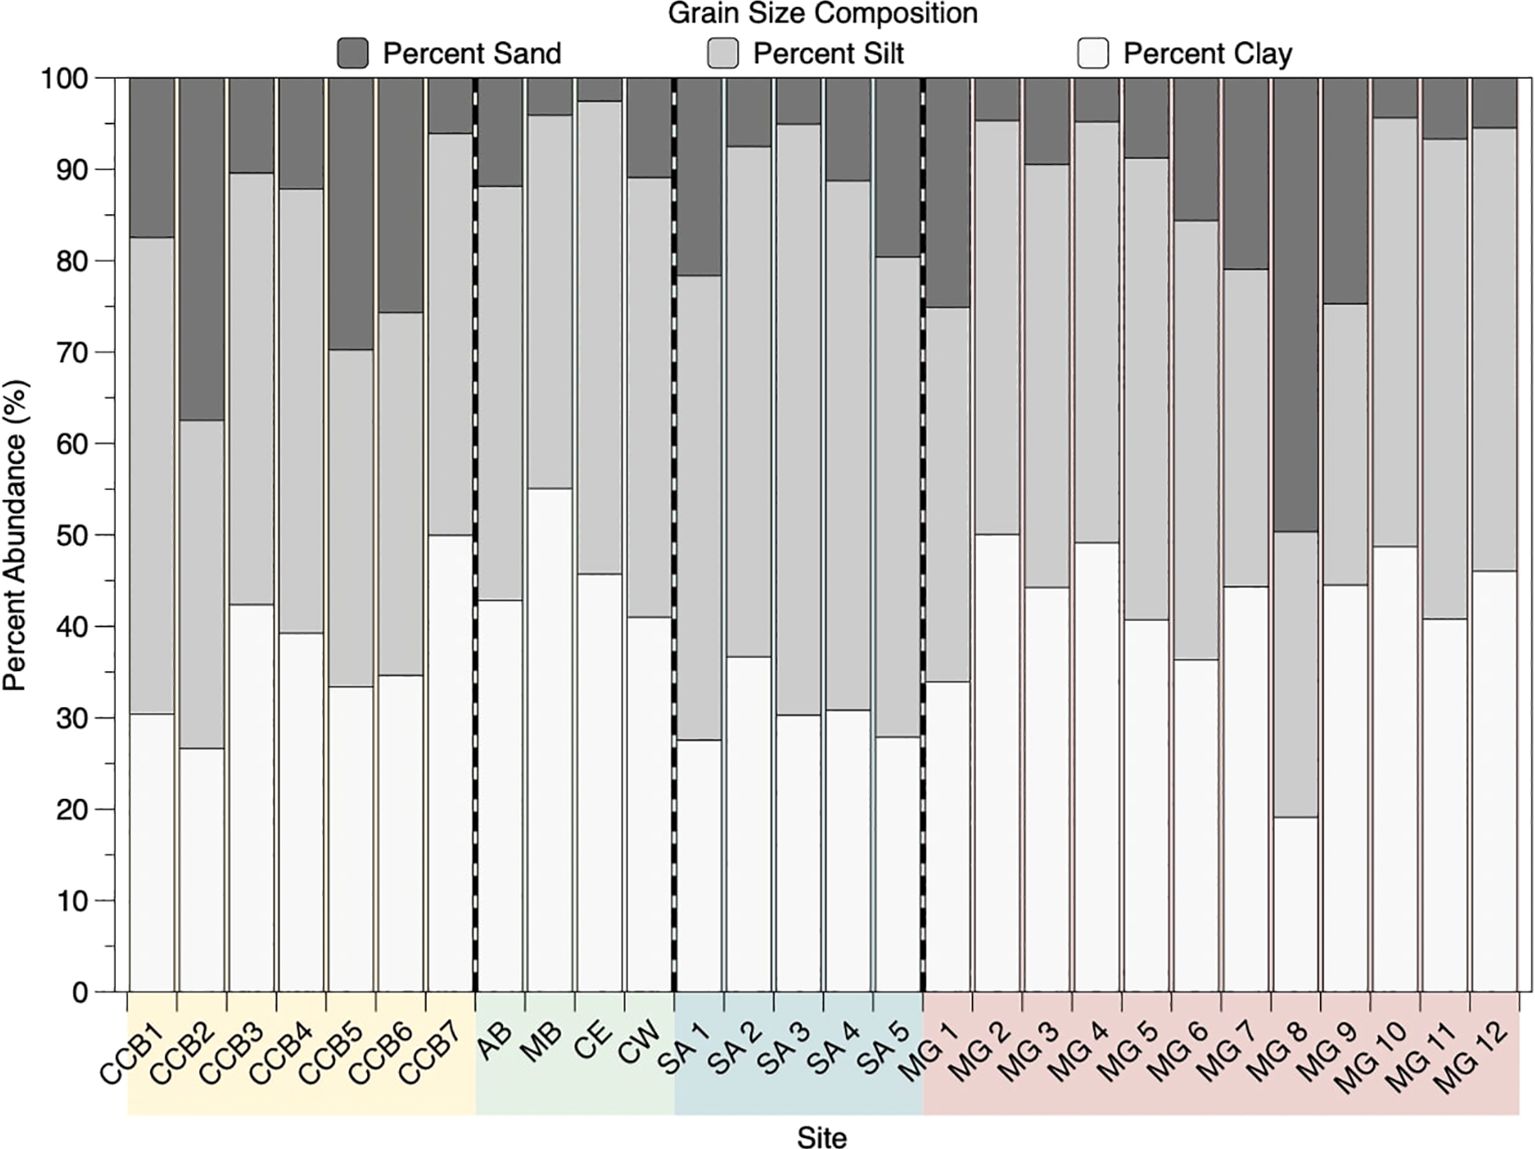
Figure 2. Percent abundance of grain size fraction at each site. Size fractions are as follows: sand (> 63µm; φ < 4), silt (4-63µm; φ is 4–8), and clay (< 4 µm; φ > 8). The bay system each site belongs to is represented by color along the x-axis: Yellow = Corpus Christi Bay; Green = NERR; Blue = San Antonio Bay; Red = Matagorda Bay.
Furthermore, grain size was correlated with organic carbon content. TOC contents in all sediments ranged from 0.02% to 1.03%, and atomic C/N ratios of sedimentary OM ranged from 5.22 to 8.61. The positive relationship between TOC and clay contents (Figure 3; p = 0.02), indicated that soil organic matter (SOM) was more enriched in sediments with higher clay fractions, as fine clay particles have a higher specific surface area to sorb sedimentary organic matter (Liu et al., 2013).
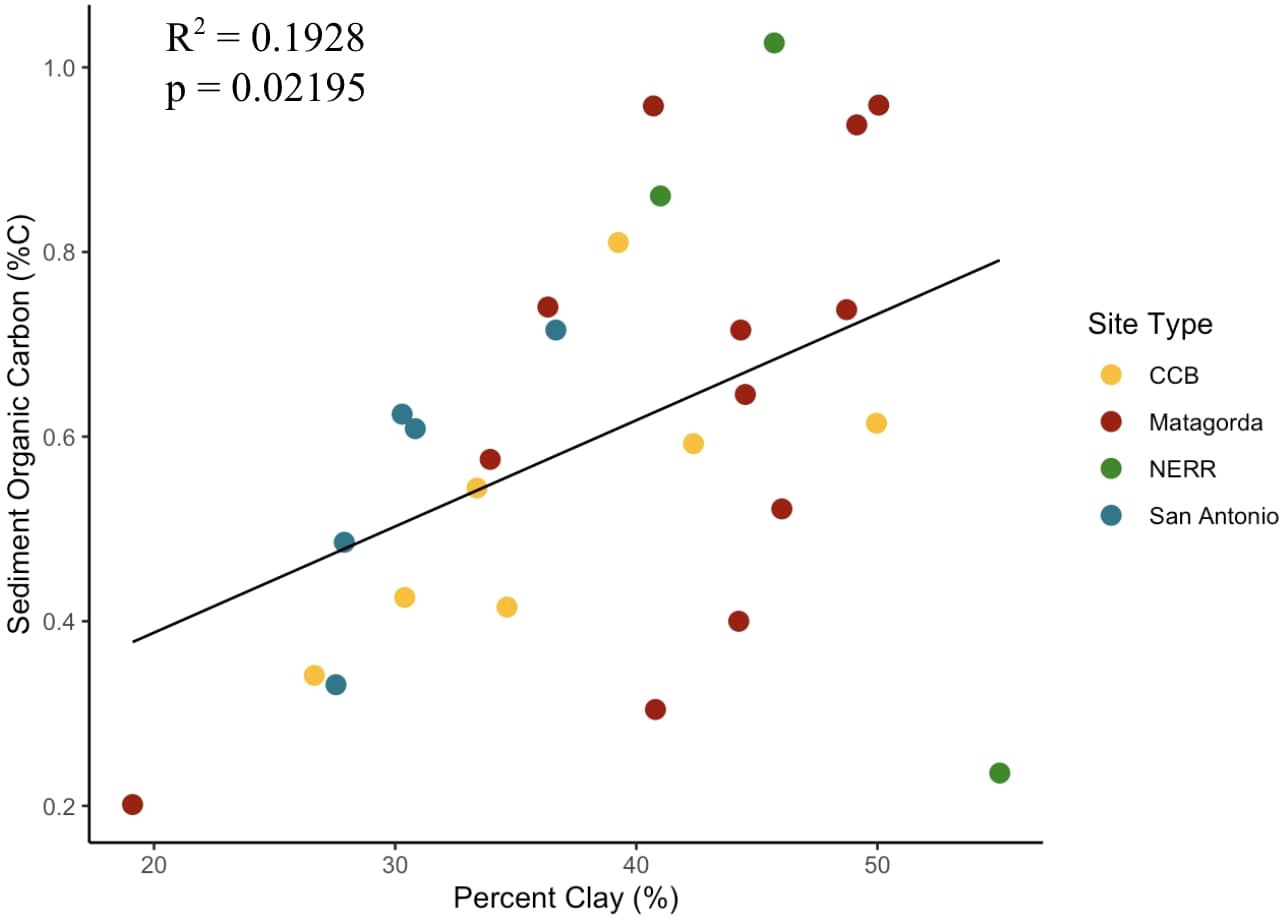
Figure 3. Relationship between sediment percent clay content and sediment organic carbon content.
3.2 Characterization of PAHs present in water and sediment samples
3.2.1 Water samples
The measured PAHs and their respective concentrations are listed in Supplementary Table 1. As shown in Figure 4, the total concentration of PAHs in surface waters of all sites ranged from 1.9 to 8.3 ng/mL. Specifically, PAH concentrations ranged from 3.8 to 8.3 ng/mL in Corpus Christi Bay surface waters, and ranged from 3.7 to 6.9 ng/mL in NERR waters. The highest PAH concentrations occurred at stations CCB1 (8.3 ng/mL) and AB (6.9 ng/mL), respectively. In 2023, surface water PAH concentrations in San Antonio and Matagorda Bays ranged from 2.1 to 2.6 ng/mL and 1.9 to 2.7 ng/mL, respectively. Total PAH concentrations in Corpus Christi Bay surface waters were higher than those in Matagorda Bay (ANOVA, p < 0.01) and San Antonio Bay (ANOVA, p < 0.01), and NERR concentrations were higher than those in Matagorda Bay (ANOVA, p < 0.05). These concentrations are similar to those reported in England and Wales (0.0–10.7 ng/mL; Law et al., 1997) and Malaysia (6.1 ± 0.43–46 ± 0.42 ng/mL; Nasher et al., 2013), and are greater than those reported in Haizhou Bay, China (0.0124–0.0403 ng/mL, Shi et al., 2022), the Northwest Pacific and Arctic Ocean (0.034–0.338 ng/mL, Fu et al., 2023), and Lagos Lagoon, Nigeria (8.90–13.30 ng/mL; Benson et al., 2014). All 16 US EPA priority PAHs were found in water samples. Compositionally, high molecular weight (HMW) PAHs, or those with 4-6 rings, accounted for more than 80% of the PAHs at all stations in Corpus Christi Bay and the NERR, and more than 50% of the PAHs at all stations in San Antonio and Matagorda Bay, except for Station MG 6 in Matagorda Bay.
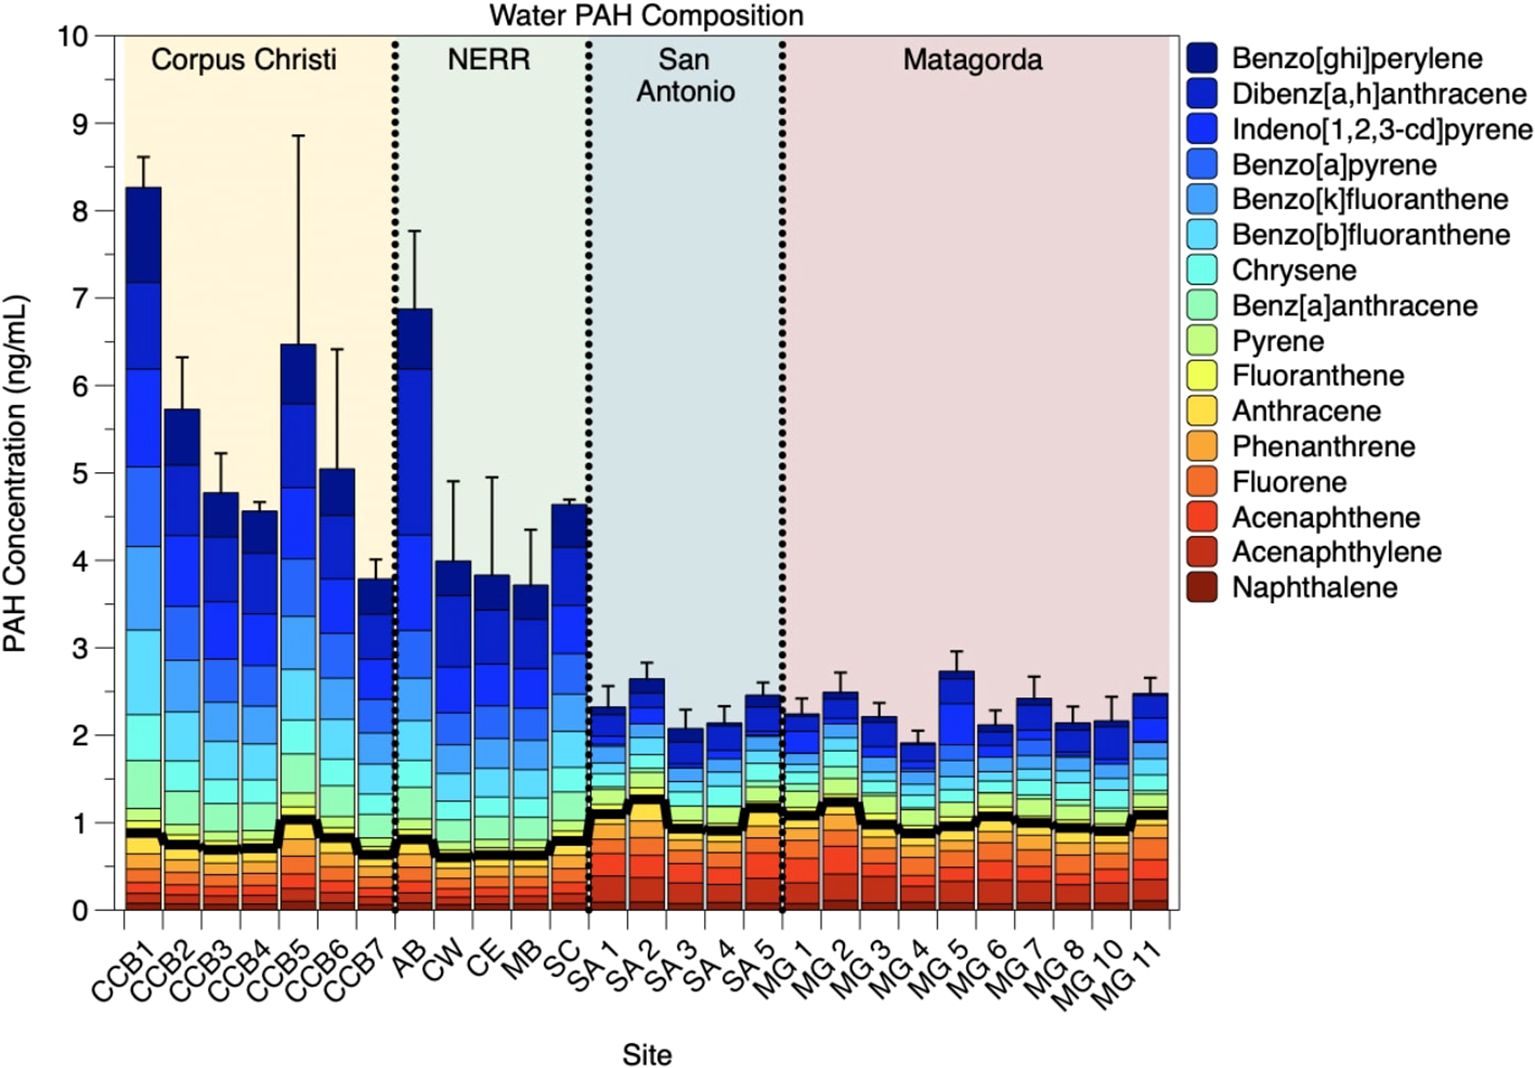
Figure 4. Concentrations of 16 US EPA priority polycyclic aromatic hydrocarbons in surface water samples (ng/mL). The dark black line indicates the separation between high molecular weight and low molecular weight PAHs.
3.2.2 Sediment samples
The concentrations of PAHs in surface sediments were relatively high. In surface sediments of all stations, concentrations of total PAHs ranged from 519.9 to 1257.1 ng/g (dry weight sediment; Supplementary Table 2; Figure 5). The highest total PAH concentration in sediments were found at stations CCB7 and CE (1257.1 ng/g and 1132.9 ng/g, respectively). The total PAH concentration at the Aransas Bay station was the highest with 2169.7 ng/g, but this value was removed as an outlier based on the Grubbs’ test. In Corpus Christi Bay sediments, PAH concentrations ranged from 556.1 to 1257.1 ng/g. In the Mission-Aransas NERR, PAH concentrations ranged from 838.1 to 1132.9 ng/g. In San Antonio and Matagorda Bays in 2022, PAH concentrations ranged from 626.1 to 802.8 ng/g and 519.9 to 963.8 ng/g, respectively. An ANOVA analysis indicated that there were no significant differences in total PAH concentrations across the different bays (p > 0.05). The concentrations of PAHs are in the range of those found in the top sediment layers in India (302.6 to 728.2 ng/g, Kurwadkar et al., 2022), China (103.6-5872 ng/g, Lang et al., 2015), and Taiwan (15-907 ng/g, Jiang et al., 2009). All 16 US EPA priority PAHs were found in sediment samples. Compositionally, high molecular weight PAHs accounted for more than 80% of the PAHs in sediments at all stations.
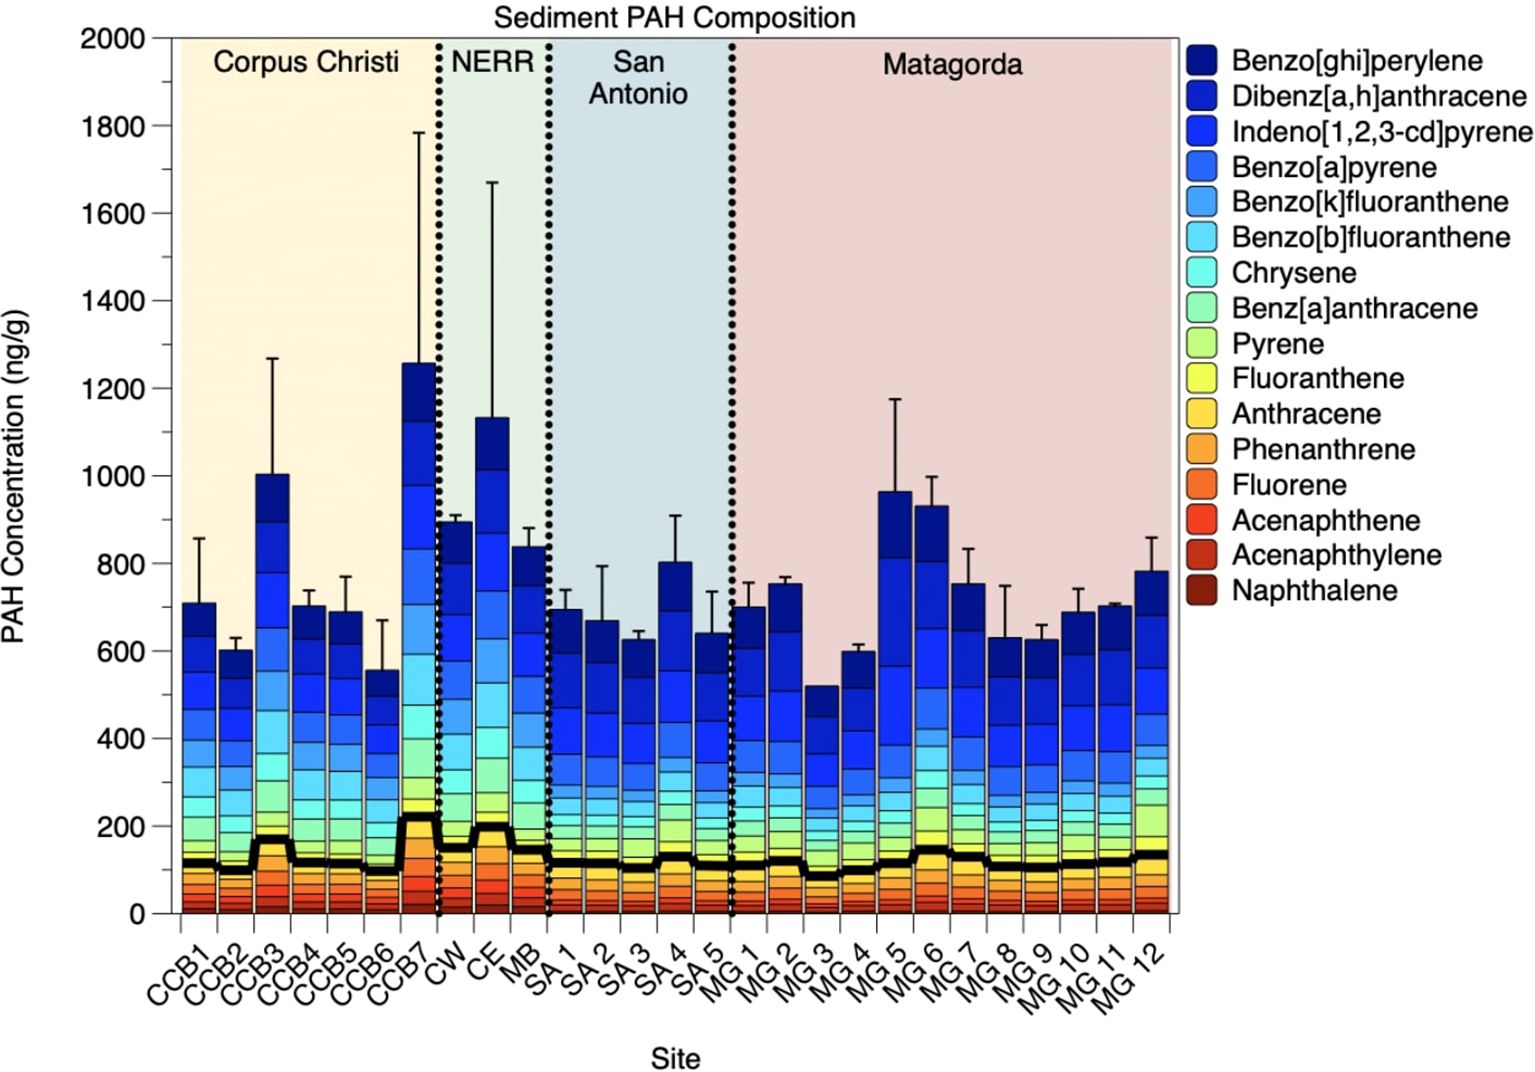
Figure 5. Concentrations of 16 US EPA priority polycyclic aromatic hydrocarbons in surface sediment samples (ng/g). The dark black line indicates the separation between high molecular weight and low molecular weight PAHs.
Furthermore, observed sediment PAH concentrations were generally greater than those previously recorded in the same region. Liu et al. (2011) found that the total concentration of the 16 US EPA priority PAHs in surface sediments (0-5 cm) in the Mission-Aransas NERR ranged from 90.7-180.7 ng/g, with concentrations highest in Aransas Bay and lowest in Mesquite Channel. In this study, sediment PAH concentrations in the NERR were elevated compared to those observed by Liu et al., suggesting the impact of increased shipping and activity in the region. Carr et al. (2000) found that the total concentration of 44 PAHs in surface sediments (0-8 ± 2 cm) of Corpus Christi Bay ranged from 7.0-59670.9 ng/g. However, when considering only the 16 PAHs analyzed in this study, total concentrations ranged from 4.9-47587.0 ng/g. This large range is due to a single sample from a stormwater outfall site that is an order of magnitude higher than the next highest sample at 6626.2 ng/g (all 44 PAHs) or 5103.0 ng/g (all 16 US EPA PAHs), respectively. In our study, total PAH concentrations in Corpus Christi Bay were 788.57 ng/g on average, and 2325.5 ng/g (all 44 PAHs) or 1824.6 ng/g (all 16 US EPA PAHs) according to Carr et al. (2000). This appeared decrease in average total PAH concentration may be explained by the fact that sediment samples in Carr et al. were taken primarily from 36 sites predisposed to have elevated PAH concentrations, such as stormwater outfalls, spoil islands, ship channels, oil-field produced water discharges, thermal effluent, refinery-processed water effluent, industrial sites, wastewater effluents, and sites identified with high mercury levels in past surveys (Carr et al., 2000). Our choice of sampling sites did not take this approach and were instead selected at random in order to gain a characteristic spatial understanding of PAH concentrations in the Bay.
3.3 Factors controlling concentrations of PAHs
The total PAH concentrations were positively correlated with total organic carbon (TOC) (p < 0.05, Figure 6) and the clay grain size fraction (p < 0.05) and negatively with the sand fraction (p < 0.05) (Supplementary Figure 2). Given that TOC was also significantly positively correlated with grain size (Supplementary Figure 3), particularly the clay fraction (Figure 3), it is likely that the higher specific surface area of clay particles allows for more organic matter to adsorb to. Once established within the sedimentary matrix, sedimentary OM can act as a natural heterogeneous polymer with which PAHs can interact more favorably (Chiou et al., 1998). The dominance of HMW PAHs in both sediment and water samples, on the other hand, may be due to the different chemical properties of the various PAHs. Specifically, low molecular weight (LMW) PAHs, like naphthalene, acenaphthene, and acenaphthylene, are more water soluble, volatile, and biodegradable than higher molecular weight ones, and therefore may be more accessible to degradation, volatilization, or transportation, such that they were no longer detected in the sediment samples (Simpson et al., 2005).
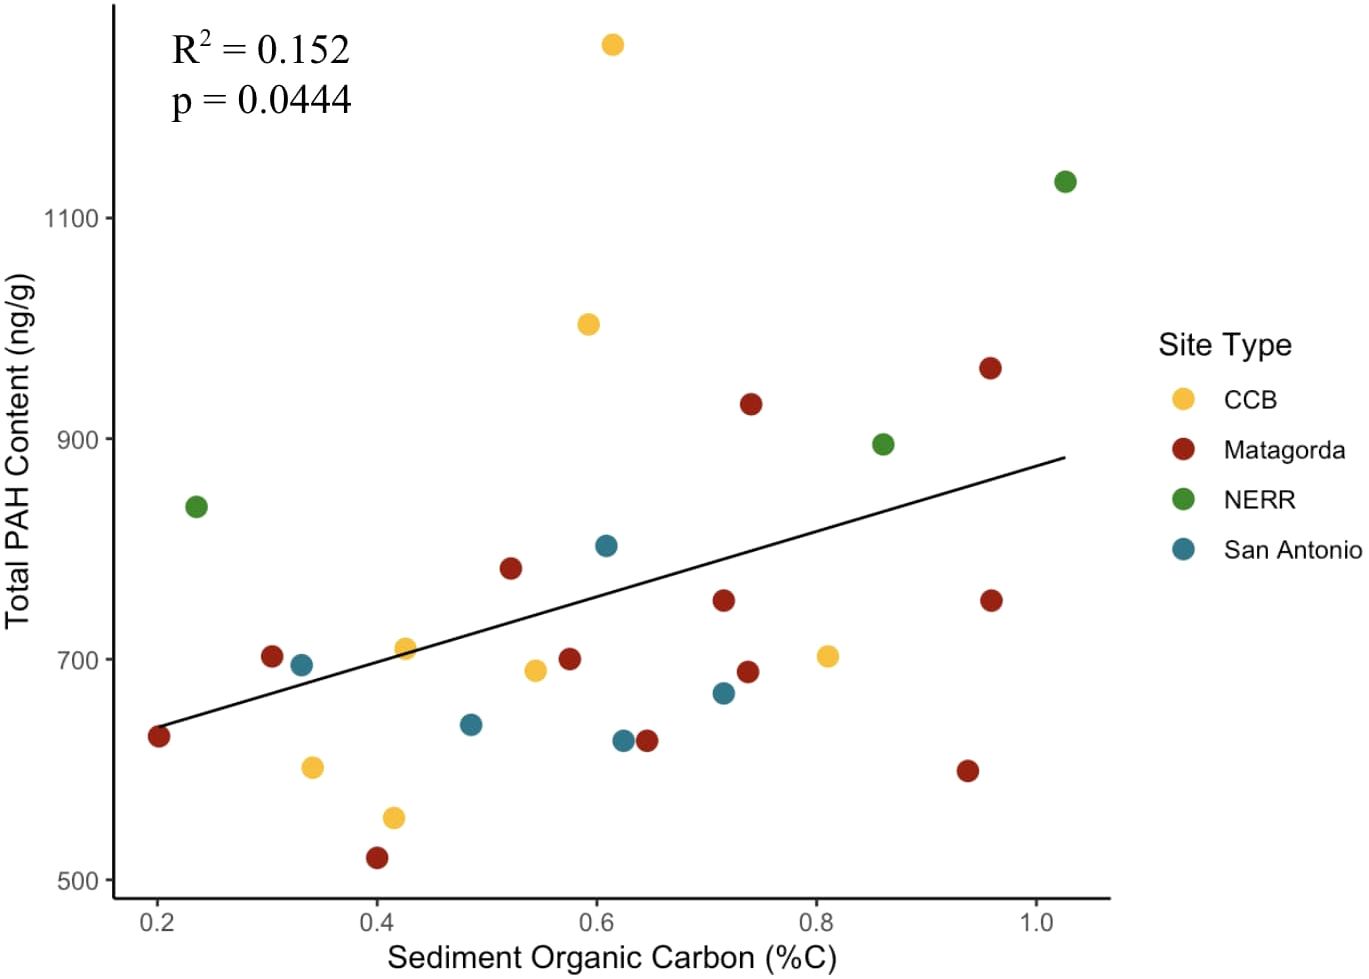
Figure 6. Relationship between sediment organic carbon content and sediment total PAH content (ng/g).
3.4 Potential sources
The following two ratios of selected PAH isomers were used to help differentiate contamination sources: anthracene/anthracene + phenanthrene (An/(An + Phe)) and fluorene/fluorene + pyrene (Flu/(Flu + Pyr)). These ratios have been used in conjunction in order to infer potential sources of PAHs, such as those that are produced preferentially during combustion (anthracene, fluoranthene) to PAHs that occur preferentially in petroleum (phenanthrene, pyrene) (Peters et al., 2005; Davis et al., 2019). The An/(An + Phe) ratio distinguishes between petrogenic and pyrogenic sources, as values < 0.1 indicate petrogenic sources and values > 0.1 indicate pyrogenic sources (Yunker et al., 2002). Additionally, the Flu/(Flu + Pyr) ratio is used to infer petroleum, petroleum combustion, and biomass combustion sources, as values < 0.4 indicate petroleum, values between 0.4 and 0.5 indicate petroleum combustion, and values > 0.5 indicate the combustion of coal and biomass (Yunker et al., 2002).
For water samples, An/(An + Phe) ratios of all samples indicated a source derived from the incomplete combustion of fossil fuels, while Flu/(Flu + Pyr) ratios indicated an additional oil source for most San Antonio and Matagorda Bay sites (Figure 7A). All sediment samples alluded to a predominant pyrolytic source, as indicated by An/(An + Phe) ratios > 0.1 and Flu/(Flu + Pyr) between 0.4 and 0.5 (Figure 7B). However, Flu/(Flu + Pyr) values of < 0.4 for sites SA 3, MG 3, MG 4, and MG 12 are indicative of an additional petroleum source, either through non-point sources of oil spills such as leakage from boats or atmospheric deposition (Blumer and Youngblood, 1975). While the exact pyrolytic source of PAHs in sampled sediments is unclear, incomplete combustion of fossil fuels caused by shipping activities may be a major contributor. For example, large volumes of ship traffic, with a major fraction of oil tankers, enter the Port of Corpus Christi in Corpus Christi Bay and the Calhoun Port Authority in Matagorda Bay. This then raises the question that, if given this shipping activity, why were Flu/(Flu + Pyr) ratios < 0.4, indicative of crude oil, not found for south Texas CCB and NERR sites, but found for central Texas San Antonio and Matagorda sites? One potential explanation may be that Flu/(Flu + Pyr) ratios below 0.5 are also indicative of gasoline, diesel, fuel oil, and crude oil combustion, as well as emissions from cars and diesel trucks (Yunker et al., 2002). Accordingly, this would once again confirm a predominant pyrogenic signal in our samples and is consistent with the results of the An/(An + Phe) ratios.
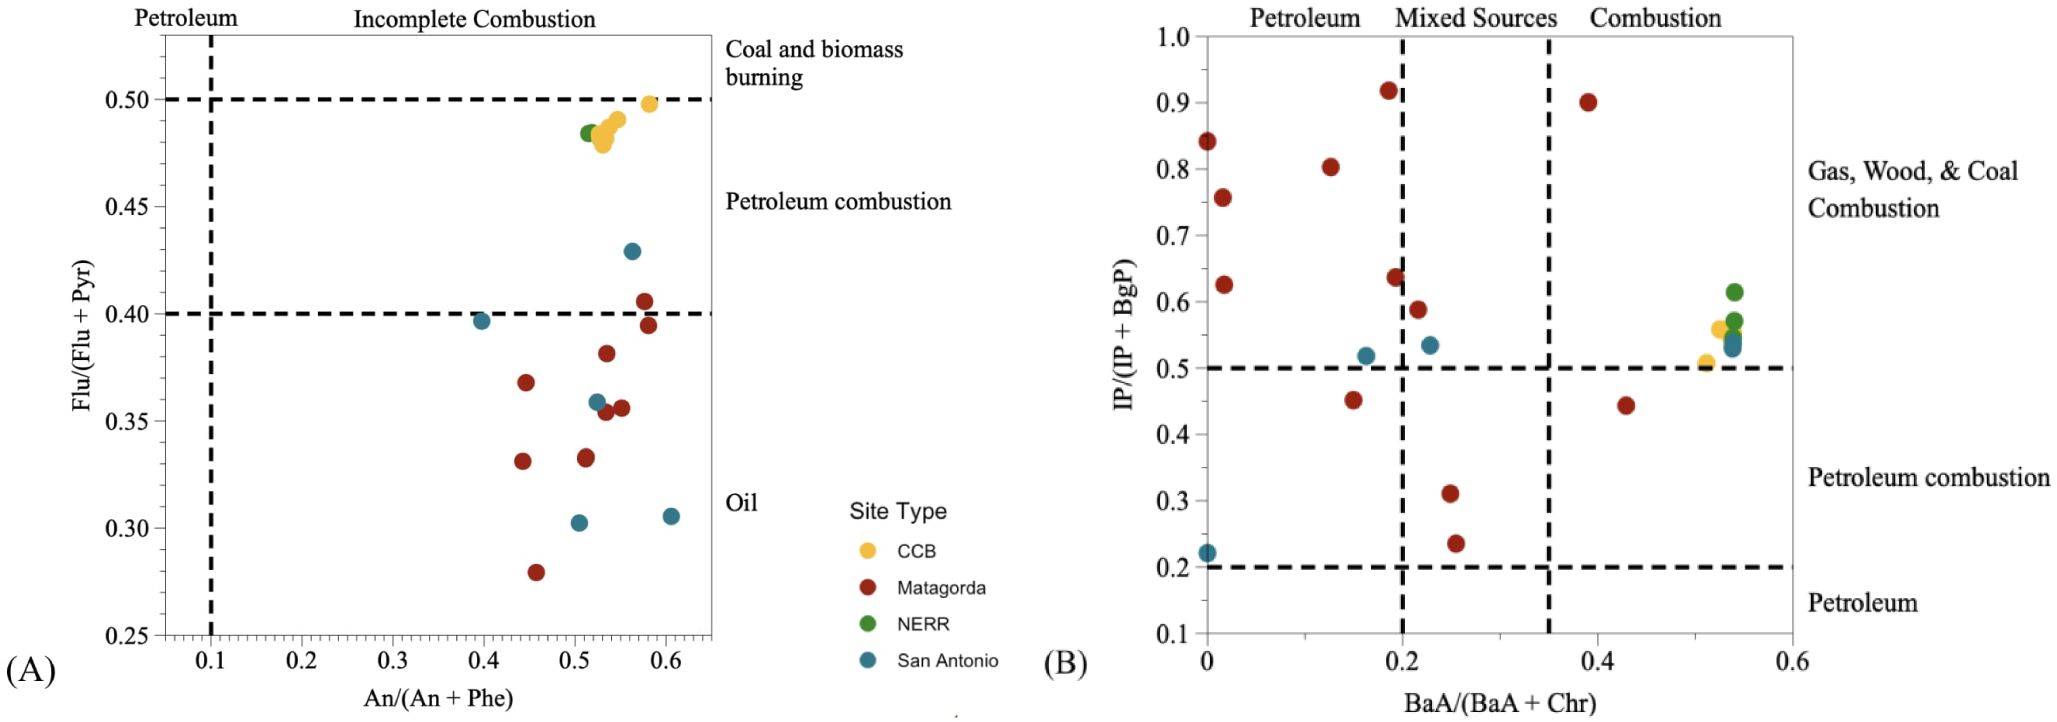
Figure 7. Diagnostic ratios of (A) An/(An + Phe) and Flu/(Flu + Pyr), and (B) BaA/(BaA + Chr) and IP/(IP + BgP) distinguishing potential sources of surface water PAHs.
Additionally, BaA/(BaA + Chr) and IP/(IP + BgP) ratios were used to corroborate the sources indicated by the Flu/(Flu + Pyr) and An/(An + Phe) ratios. BaA/(BaA + Chr) ratios delineate between petrogenic and pyrogenic sources, where ratios < 0.2 indicate petroleum, ratios from 0.2–0.35 indicate a mixture of petrogenic and pyrogenic sources, and ratios > 0.35 indicate pyrogenic sources (Davis et al., 2019). IP/(IP + BgP) ratios distinguish between petroleum, petroleum combustion, and combustion of wood, grass, and/or coal combustion. Values < 0.2 indicate petroleum, values between 0.2–0.5 indicate petroleum combustion, and values > 0.5 indicate wood, grass, and/or coal combustion (Yunker et al., 2002). For water samples (Figure 8A), BaA/(BaA + Chr) ratios indicated both pyrogenic and mixed pyrogenic/petrogenic sources. Corpus Christi and NERR sites demonstrated a predominant pyrogenic source as shown by values > 0.5 at all sites, whereas San Antonio and Matagorda Bay sites indicated a dominant petrogenic signal, with a component of mixed petrogenic/pyrogenic sources. This is consistent with our Flu/(Flu + Pyr) ratios in particular, which indicated both pyrogenic and petrogenic sources. Like the An/(An + Phe) ratios, water IP/(IP + BgP) ratios indicated a consistent pyrogenic signal, although these ratios were indicative of wood, grass, and/or coal combustion, suggesting an additional source of PAHs in surface waters.
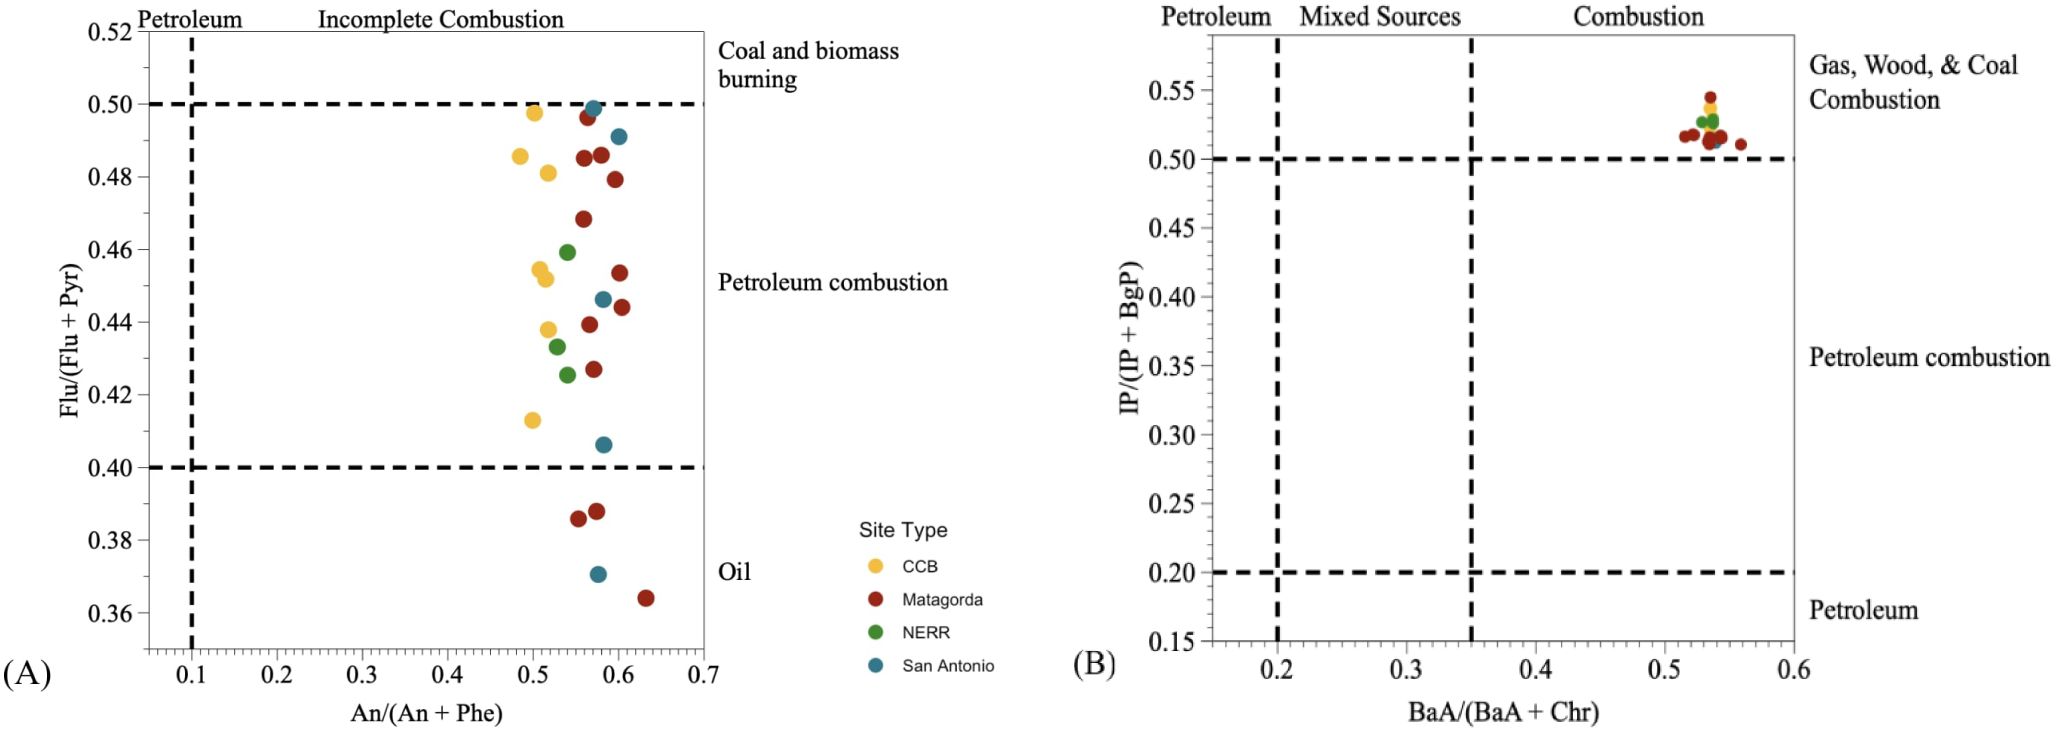
Figure 8. Diagnostic ratios of (A) An/(An + Phe) and Flu/(Flu + Pyr), and (B) BaA/(BaA + Chr) and IP/(IP + BgP) distinguishing potential sources of surface sediment PAHs.
For sediment samples (Figure 8B), BaA/(BaA + Chr) ratios for all sites were > 0.35, indicative of a predominant pyrogenic source. Dickhut et al. (2000) indicate that ratio values of 0.53 ± 0.06, 1.11 ± 0.06, and 0.79 ± 0.13 align with petroleum emissions, coal/coke, and wood burning processes, respectively, and given that the average value was 0.54 ± 0.01, it is likely that petroleum combustion is a major source of the PAHs observed in the sediments of our study sites, and is consistent with the sediment An/(An + Phe) ratios. It has further been suggested that BaA/(BaA + Chr) values > 0.35 are accompanied by Flu/(Flu + Pyr) values > 0.4 for urban locations (Yunker et al., 2002), and given that Flu/(Flu + Pyr) values were > 0.4 for almost all sites, it provides further evidence for the efficacy of these ratios in determining source appropriations. IP/(IP + BgP) ratios indicated a consistent pyrogenic signal, although these ratios were again indicative of wood, grass, and/or coal combustion, suggesting an additional source of PAHs in surface sediments. However, it is necessary to indicate that isomeric ratios must be used with caution when determining PAH sources, since they may evolve with time or with the distance from emission sources (Katsoyiannis and Breivik, 2014).
3.5 PAH compositions
Principal component analysis (PCA) is a statistical method used to distinguish compositional patterns among environmental samples, particularly when many chemical parameters exist. Here, we applied a PCA of mole percentages of PAH concentrations at each site. For the water samples, PC1 explained 76.8% of the variance, while PC2 explained 6.9%. Specifically, compositions of HMW PAHs, including indeno[1,2,3-cd]pyrene, dibenz[a,h]anthracene, benzo[a]pyrene, benz[a]anthracene, benzo[ghi]perylene, benzo[k]fluoranthene, and benzo[b]fluoranthene are closely associated with PC 1, with negative scores on PC 1 representing relatively greater compositions of HMW PAHs. Furthermore, compositions of LMW PAHs, including acenaphthene, acenaphthylene, anthracene, and naphthalene are also associated with PC 1, with positive scores on PC 1 representing relatively greater compositions of LMW PAHs. Samples formed two distinct groups, as San Antonio and Matagorda Bay waters were well separated along PC1 from Corpus Christi Bay and NERR waters (Figure 9). San Antonio and Matagorda Bays were dominated by a mixture of HMW and LMW PAHs whereas Corpus Christi Bay and NERR waters were dominated exclusively by HMW PAHs.

Figure 9. PCA of water PAHs.
For sediment samples, PC1 explained 65.7% of the variance, while PC2 explained 20.6% (Figure 10). PCA loadings were separated in a similar manner to those of the water samples, as San Antonio and Matagorda Bay waters were well separated from Corpus Christi Bay and NERR waters across PC1. San Antonio and Matagorda Bay sediments are generally associated with HMW PAHs, whereas Corpus Christi Bay and NERR sediments are associated with a mixture of LMW and HMW PAHs. Specifically, compositions of HMW PAHs, including dibenz[a,h]anthracene, indeno[1,2,3-cd]perylene, benzo[ghi]perylene, pyrene, and fluoranthene are associated with negative values of PC1, whereas compositions of HMW PAHs such as benzo[k]fluoranthene, benzo[b]fluoranthene, benz[a]anthracene, and chrysene, as well as LMW PAHs such as naphthalene and acenaphthene are associated with positive values of PC1. Although Matagorda Bay experiences some ship traffic thanks to Matagorda Harbor and the Port Calhoun authority, the level of activity is dwarfed by that of the Port of Corpus Christi in Corpus Christi Bay, which is one of the busiest ports in the United States and serves as an important port for the transportation of oil from the Gulf of Mexico, explaining the correlation with LMW PAHs in sediment samples of these sites.
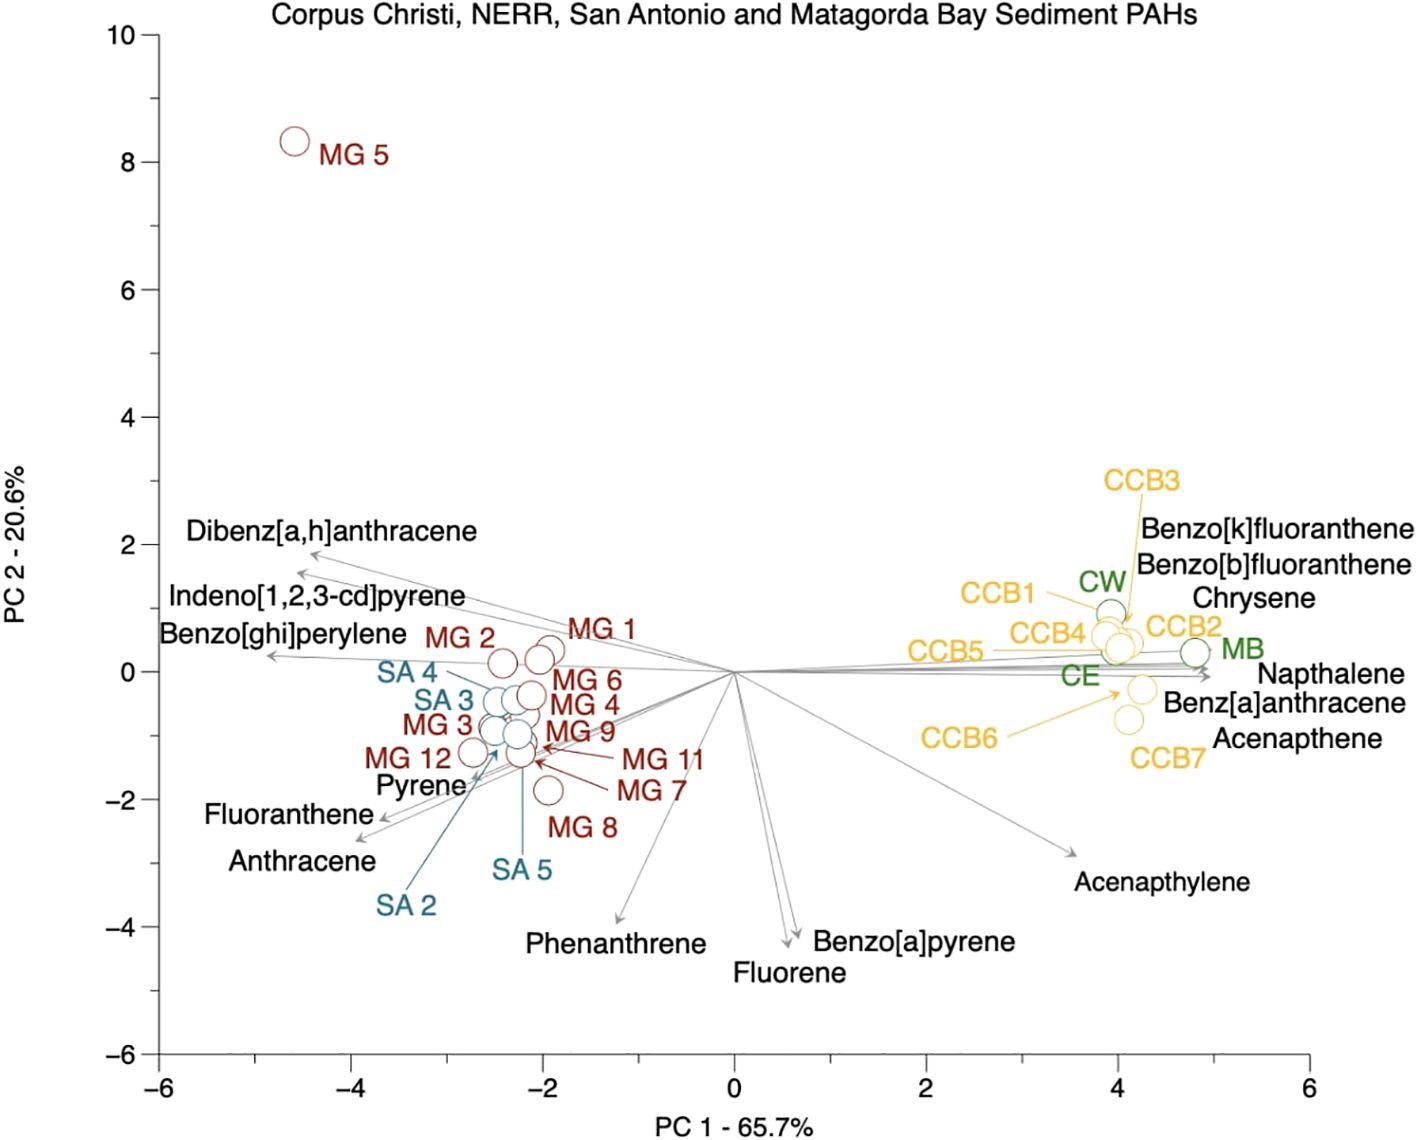
Figure 10. PCA of sediment PAHs.
3.6 Port Bay addendum: other effects from sediments on PAH content
In addition to organic carbon content and grain size, sediments may further exert an influence on the distribution of PAHs in both sediment and water through effects such as resuspension, which is a quite common phenomenon in shallow systems. This is exemplified by an additional sampling trip taken in Port Bay (Supplementary Figure 1; Supplementary Table 3), an extremely shallow water system (< 1 m; occasionally less than 30 cm) near Rockport, Texas, and secondary bay to Copano Bay in the Mission-Aransas NERR. Sampling for PAH analysis was undertaken in December 2022, and additional samples for nutrients and total suspended solids (TSS) were taken in November 2023. This shallow system offers an ideal study area to examine how resuspension affects the distribution of PAHs between sediment and water column. Port Bay was not included in the statistical analyses of the other bay systems studied as its uniquely shallow conditions hindered understanding of trends and relationships among different sites, particularly when using PCA.
For surface water samples, concentrations of PAHs ranged from 11.3 ng/mL at Site 7 to 21.2 ng/mL at Site 2 (Supplementary Figure 4). These concentrations were greater than all surface water PAHs concentrations in Corpus Christi Bay, NERR, San Antonio Bay, and Matagorda Bay sites. Concentrations of PAHs in Port Bay surface sediments ranged from 93.1 ng/g dried sediment at Site 2 to 378.7 ng/g at Site 3 (Supplementary Figure 5), which were lower than sediment PAH concentrations in all other bays. For both water and sediment samples, An/(An + Phe) ratios indicated a combustion source, while Fl/(Fl + Pyr) ratios indicated a predominant source of coal and biomass burning in water samples and petroleum combustion in sediment samples (Supplementary Figures 6A, B), consistent with results from other bays and estuaries in this work. Furthermore, for sediments, BaA/(BaA + Chr) ratios once again indicated a combustion source, while IP/(IP + BgP) ratios indicated an additional source of gas, wood, and coal combustion (Supplementary Figure 7). In addition to PAH concentrations, sediment grain size was measured in Port Bay sediments. Sediments were dominated by silt and clay fractions at 39.15% and 35.76%, respectively, while sand made up 25.09% (Supplementary Figure 8). Unlike the other bays sampled, sediment grain size was not correlated to organic carbon content.
Although the total concentration of PAHs in Port Bay sediments was only slightly lower than those in the other bays in this study, there was a drastic difference between the composition of PAHs. LMW fractions dominated PAHs in Port Bay sediment, accounting for 50 – 79% of total PAHs. Anthracene was the dominant PAH, ranging from 20.4 ng/g in Site 2 to 131.9 ng/g in Site 3, followed by phenanthrene, fluoranthene, and pyrene (Supplementary Figure 5). On the other hand, fluoranthene and pyrene were the only detectable HMW PAHs. Other 5 – 6 ring PAHs, such as benzo[b]fluoranthene, benzo[k]fluoranthene, benzo[a]pyrene, and indeno[1,2,3-cd]pyrene, were all below the detection limit in Port Bay sediments. HMW PAHs generally have a higher proportion in sediments than LMW PAHs due to their higher hydrophobicity. In our study, HMW PAHs represented up to 80% of total concentrations in the sediments of Corpus Christi Bay, the NERR, San Antonio Bay, and Matagorda Bay, with 5 – 6 ring PAHs representing over 60% of total PAHs. The observed low proportion of HMW PAHs suggests an additional removal process of HMW PAHs in the Port Bay region.
In December of 2022, weather conditions in Port Bay were quite windy, and the resuspension was strong, which could have led to the remobilization of HMW PAHs from the surface sediment to the water column. Wind speeds on December 6th and 8th, 2022, ranged from 12.87-17.7 km/h, and from 11.3–20.9 km/h on November 14th, 2023 (NCEI, 2024; https://www.ncei.noaa.gov/cdo-web/datatools/lcd; NOAA, 2024; www.ndbc.noaa.gov/). Total suspended solids (TSS) measurements taken on November 14th, 2023 ranged from 63.1 ± 0.9 mg/L at Site 3 to 104.4 ± 2.0 at Site 6 (Supplementary Table 4). HMW PAHs are less soluble and more hydrophobic than LMW PAHs, and therefore may be preferentially adsorbed to fine clay minerals (Wang et al., 2016). Strong resuspension due to the shallow water depth in Port Bay, consequently, may lead to high turbidity, as evidenced by the high levels of TSS, and thus high levels of HMW PAHs in water samples. This could also explain the low levels of PAHs, and particularly HMW PAHs, in the sediments.
Like in Port Bay, high concentrations of HMW PAHs in surface waters at other sites may be due to the relatively shallow water depth in each of the bays sampled. For example, average water depth of Corpus Christi Bay is 3 - 4 m, and ca. 2 m in both San Antonio and Matagorda Bays (Solis, 1999; Moseley and Copeland, 1971). In the Mission-Aransas NERR, Copano Bay water depths reach 0.6–2.7 m, but nearly 75% of the bay has a depth of 2.1 m (Troiani et al., 2011; Douglas, 2022). Previous studies have shown that resuspension could lead to an increase in the concentrations of total PAHs (e.g., Bancon-Montigny et al., 2019; Feng et al., 2008, 2007; Latimer et al., 1999; Yang et al., 2008, etc.), with a preferential release of HMW PAHs (Guigue et al., 2017). HMW PAHs not only represented up to 80% of total concentrations in the sediments of Corpus Christi Bay, the NERR, San Antonio Bay, and Matagorda Bay, they also represented up to 50% of total concentrations in surface waters in San Antonio and Matagorda Bays, and up to 80% in the waters of Corpus Christi Bay and the NERR. Wind activity has been demonstrated to have a significant effect on the resuspension of sediment-associated PAHs, and given the shallow depth of these bays, the potential for wind-driven resuspension of the sediments is likely, which may explain the high concentration of HMW PAHs in the water column.
Wind along the Texas coast is predominantly from the southeast for the majority of the year and particularly throughout the spring and summer, and is complemented by predominant northerlies in the fall and winter (Reisinger et al., 2017). On each of the dates sampled (July 8th, 2022 for the NERR; August 5th, 2022 for Corpus Christi Bay; August 9-13th, September 17th, and November 3rd, 2021, for San Antonio and Matagorda Bay sediment samples and September 6-8th, 2023 for San Antonio and Matagorda Bay water samples), wind speeds were 16.1–32.2 km/h, 14.5–24.1 km/h, 8.1–32.2 km/h, and 8.0–19.3 km/h, respectively (NCEI, 2024; https://www.ncei.noaa.gov/cdo-web/datatools/lcd; NOAA, 2024, https://www.ndbc.noaa.gov/), and may have been strong enough to impart sufficient bed shear stress for resuspension given the shallow water depths of the bays (Reisinger et al., 2017). Consequently, fine grained sediment may have been resuspended into the water column and been responsible for the high HMW content found in surface water samples.
4 Conclusion
Through analyses of water and sediment samples taken from estuaries along the Texas coast, we provided baseline data of PAH distributions and concentrations and investigated factors controlling their concentrations and compositions. Our study showed that the total concentration of US EPA PAHs ranged from 1.9 to 8.3 ng/mL in surface waters and from 519.9 to 1257.1 ng/g in sediments. This level of surface water PAHs is somewhat elevated in regard to other sites worldwide, while sediment PAH concentrations are similar to those previously reported in India, China, and Taiwan. Diagnostic ratios showed that PAHs in surface waters and surface sediments were primarily pyrogenic. Sediment grain size in this region was dominated by silt, followed by clay and sand, and both organic carbon and clay content were shown to play a role in controlling PAH content. Resuspension was also shown to play a role in controlling the composition of PAHs, especially HMW PAHs, in the water column.
Data availability statement
The raw data supporting the conclusions of this article will be made available by the authors, without undue reservation.
Author contributions
JL: Writing – review & editing, Writing – original draft. KL: Writing – review & editing, Writing – original draft. ZL: Writing – review & editing, Writing – original draft.
Funding
The author(s) declare financial support was received for the research, authorship, and/or publication of this article. This work was supported by the Texas General Land Office (No. 22-005-006-D095) and Coastal Bend Bays & Estuaries Program (No. 2332).
Acknowledgments
We thank Xiangtao Jiang, Johanna Wang, Maggie Monroe, and Kylee Hutchinson for their help in collecting sediment and water samples, Jianhong Xue for her aid in sample analysis, Kevin Xu for his help with grain size analysis, and Ryan Hyladniuk and Patricia Garlough for their help with organic carbon and carbon isotope analysis.
Conflict of interest
The authors declare that the research was conducted in the absence of any commercial or financial relationships that could be construed as a potential conflict of interest.
Publisher’s note
All claims expressed in this article are solely those of the authors and do not necessarily represent those of their affiliated organizations, or those of the publisher, the editors and the reviewers. Any product that may be evaluated in this article, or claim that may be made by its manufacturer, is not guaranteed or endorsed by the publisher.
Supplementary material
The Supplementary Material for this article can be found online at: https://www.frontiersin.org/articles/10.3389/fmars.2024.1456717/full#supplementary-material
References
Acosta T. (2024). Port of Corpus Christi Customers Moved Record Tonnage through Waterway in 2023, Surpassing 200m Tons for First Time - Port of Corpus Christi (Corpus Christi, TX: Port of Corpus Christi). Available at: https://portofcc.com/port-of-corpus-christi-customers-movedrecord-tonnage-through-waterway-in-2023-surpassing-200m-tons-for-first-time.
Bancon-Montigny C., Gonzalez C., Delpoux S., Avenzac M., Spinelli S., Mhadhbi T., et al. (2019). Seasonal changes of chemical contamination in coastal waters during sediment resuspension. Chemosphere 235, 651–661. doi: 10.1016/j.chemosphere.2019.06.213
Barata C., Calbet A., Saiz E., Ortiz L., Bayona J. M. (2005). Predicting single and mixture toxicity of petrogenic polycyclic aromatic hydrocarbons to the copepod oithona davisae. Environ. Toxicol. Chemistry: Int. J. 24, 2992–2999, 11. doi: 10.1897/05-189R.1
Benson N. U., Essien J. P., Asuquo F. E., Eritobor A. L. (2014). Occurrence and distribution of polycyclic aromatic hydrocarbons in surface microlayer and subsurface seawater of lagos lagoon, Nigeria. Environ. Monit. Assess. 186, 5519–5529. doi: 10.1007/s10661-014-3800-z
Bianchi T. S., Canuel E. A. (2011). Chemical biomarkers in aquatic ecosystems. (Princeton, N. J.: Princeton University Press).
Blumer M., Youngblood W. (1975). Polycyclic aromatic hydrocarbons in soils and recent sediments. Science 188.4183, 53–55. doi: 10.1126/science.188.4183.53
Borland L., Jones C. (2020). “Matagorda bay economic and ecological resources report chapter 2,” in Open bay habitat resources, texas comptroller’s natural resources program. (Austin, TX: Texas Comptroller’s Natural Resources Program). Available at: https://storymaps.arcgis.com/stories/c4a0671cdf0c47e583221a37dc499746.
Brown A. C., McLachlan A. (2010). The ecology of sandy shores (Amsterdam, NL; London, UK: Elsevier).
Carr R., Montagna P. A., Biedenbach J. M., Kalke K., Kennicutt M. C., Hooten R., et al. (2000). Impact of storm-water outfalls on sediment quality in corpus christi bay, texas, USA. Environ. Toxicol. Chemistry: Int. J. 19.3, 561–574. doi: 10.1897/1551-5028(2000)019<0561:IOSWOO>2.3.CO;2
Chiou C. T., McGroddy S. E., Kile D. E. (1998). Partition characteristics of polycyclic aromatic hydrocarbons on soils and sediments. Environ. Sci. Technol. 32.2, 264–269. doi: 10.1021/es970614c
Davis E., Walker T. R., Adams M., Willis R., Norris G. A., Henry R. C. (2019). Source apportionment of polycyclic aromatic hydrocarbons (PAHs) in small craft harbor (SCH) surficial sediments in nova scotia, Canada. Sci. Total Environ. 691, 528–537. doi: 10.1016/j.scitotenv.2019.07.114
Dickhut R. M., Canuel E. A., Gustafson K. E., Liu K., Arzayus K. M., Walker S. E., et al. (2000). Automotive sources of carcinogenic polycyclic aromatic hydrocarbons associated with particulate matter in the chesapeake bay region. Environ. Sci. Technol. 34.21, 4635–4640. doi: 10.1021/es000971e
Douglas S. V. (2022). Extreme climate events influence particulate organic matter quality, quantity, and composition in the Mission-Aransas Estuary. Diss. (Port Aransas, TX: Marine Science Institute, The University of Texas at Austin).
Eisler R. (1987). “Polycyclic aromatic hydrocarbon hazards to fish, wildlife, and invertebrates: A synoptic review. No.11” (Laurel, MD: U.S. Fish and Wildlife Service, U.S. Department of the Interior).
EPA (1999). Total Suspended Solids (TSS) EPA Method 160.2 (Gravimetric, Dried at 103-105˚C) (New York, N. Y.: Environmental Protection Agency). Available at: https://www.uvm.edu/bwrl/lab_docs/protocols/106.2_TSS_by_gravimetry_(EPA_1971).pdf.
Evans K. M., Gill R. A., Robotham P. W. J. (1990). The PAH and organic content of sediment particle size fractions. Water Air Soil pollut. 51, 13–31. doi: 10.1007/BF00211500
Evans A., Madden K., Palmer S. (2012). The ecology and sociology of the mission-aransas estuary: an estuarine and watershed profile. (Port Aransas, TX: Mission-Aransas National Estuarine Research Reserve).
Feng J., Yang Z. F., Niu J. F., Shen Z. Y. (2007). Remobilization of polycyclic aromatic hydrocarbons during the resuspension of yangtze river sediments using a particle entrainment simulator. Environ. pollut. 149.2, 193–200. doi: 10.1016/j.envpol.2007.01.001
Feng J., Shen Z. Y., Niu J. F., Yang. Z. F. (2008). The role of sediment resuspension duration in release of PAHs. Chin. Sci. Bull. 53.18, 2777–2782. doi: 10.1007/s11434-008-0389-z
Fu J., Zhang H., Li R., Shi T., Gao H., Jin S., et al. (2023). Occurrence, spatial patterns, air-seawater exchange, and atmospheric deposition of polycyclic aromatic hydrocarbons (PAHs) from the northwest pacific to arctic ocean. Mar. Environ. Res. 183, 105793. doi: 10.1016/j.marenvres.2022.105793
Gardner W. S., McCarthy M. J., Carini S. A., Souza A. C., Lijun H., McNeal K. S., et al. (2009). Collection of intact sediment cores with overlying water to study nitrogen-and oxygen-dynamics in regions with seasonal hypoxia. Continental Shelf Res. 29.18, 2207–2213. doi: 10.1016/j.csr.2009.08.012
González-Gaya Belén, Martinez-Valera A., Vila-Costa M., Casal P., Cerro-Gálvez E., Berrojalbiz N., et al. (2019). Biodegradation as an important sink of aromatic hydrocarbons in the oceans. Nat. Geosci. 12.2, 119–125. doi: 10.1038/s41561-018-0285-3
Guigue C., Tedetti M., Dang D. H., Mullot J. U., Garnier C., Goutx M. (2017). Remobilization of polycyclic aromatic hydrocarbons and organic matter in seawater during sediment resuspension experiments from a polluted coastal environment: insights from toulon bay (France). Environ. pollut. 229, 627–638. doi: 10.1016/j.envpol.2017.06.090
Hedges J. I., Stern J. H. (1984). Carbon and nitrogen determinations of carbonate-containing solids. Limnology Oceanography 29.3, 657–663. doi: 10.4319/lo.1984.29.3.0657
Jiang J.-J., Lee C.-L., Fang M.-D., Liu J. T. (2009). Polycyclic aromatic hydrocarbons in coastal sediments of southwest Taiwan: an appraisal of diagnostic ratios in source recognition. Mar. pollut. Bull. 58.5, 752–760. doi: 10.1016/j.marpolbul.2008.12.017
Johnson M. D., Huang W., Weber W. J. (2001). A distributed reactivity model for sorption by soils and sediments. 13. Simulated diagenesis of natural sediment organic matter and its impact on sorption/desorption equilibria. Environ. Sci. Technol. 35.8, 1680–1687. doi: 10.1021/es001390s
Katsoyiannis A., Breivik K. (2014). Model-based evaluation of the use of polycyclic aromatic hydrocarbons molecular diagnostic ratios as a source identification tool. Environ. pollut. 184, 488–494. doi: 10.1016/j.envpol.2013.09.028
Keith L. H. (2015). The source of US EPA's sixteen PAH priority pollutants. Polycyclic Aromatic Compounds 35.2-4, 147–160. doi: 10.1080/10406638.2014.892886
Kennish M. J. (2002). Environmental threats and environmental future of estuaries. Environ. Conserv. 29.1, 78–107. doi: 10.1017/S0376892902000061
Kumar M., Bolan N. S., Hoang S. A., Sawarkar A. D., Jasemizad T., Gao B., et al. (2021). Remediation of soils and sediments polluted with polycyclic aromatic hydrocarbons: to immobilize, mobilize, or degrade? J. Hazardous Materials 420, 126534. doi: 10.1016/j.jhazmat.2021.126534
Kurwadkar S., Sethi S. S., Mishra P., Ambade B. (2022). Unregulated discharge of wastewater in the mahanadi river basin: risk evaluation due to occurrence of polycyclic aromatic hydrocarbon in surface water and sediments. Mar. pollut. Bull. 179, 113686. doi: 10.1016/j.marpolbul.2022.113686
Lang S.-C., Hursthouse A., Mayer P., Kötke D., Hand I., Schulz-Bull D., et al. (2015). Equilibrium passive sampling as a tool to study polycyclic aromatic hydrocarbons in baltic sea sediment pore-water systems. Mar. pollut. Bull. 101.1, 296–303. doi: 10.1016/j.marpolbul.2015.10.069
Latimer J. S., Davis W. R., Keith D. J. (1999). Mobilization of PAHs and PCBs from in-place contaminated marine sediments during simulated resuspension events. Estuarine Coast. Shelf Sci. 49.4, 577–595. doi: 10.1006/ecss.1999.0516
Law R. J., Dawes V. J., Woodhead R. J., Matthiessen P. (1997). Polycyclic aromatic hydrocarbons (PAH) in seawater around england and wales. Mar. pollut. Bull. 34.5, 306–322. doi: 10.1016/S0025-326X(96)00096-3
Liu Z., Breecker D., Mayer L. M., Zhong J. (2013). Composition of size-fractioned sedimentary organic matter in coastal environments is affected by difference in physical forcing strength. Organic Geochemistry 60, 20–32. doi: 10.1016/j.orggeochem.2013.04.009
Liu Z., Wang Z., Liu J. (2011). The distribution of polycyclic aromatic hydrocarbons in surface sediments within the Mission-Aransas National Estuarine Research Reserve, Texas (Port Aransas, TX: Marine Science Institute, The University of Texas).
Liu Z., Xue J. (2020). The lability and source of particulate organic matter in the northern Gulf of Mexico hypoxic zone. J. Geophysical Research: Biogeosciences 125.9, e2020JG005653. doi: 10.1029/2020JG005653
Moseley F. N., Copeland B. J. (1971). Ecology of Cox Bay, Texas. Final Rep. before Power Plant operation 1971. (Corpus Christi, TX: Central Power and Light Company).
Nasher E., Heng L. Y., Zakaria Z., Surif S. (2013). Concentrations and sources of polycyclic aromatic hydrocarbons in the seawater around langkawi island, Malaysia. J. Chem. 2013.1, 1–10. doi: 10.1155/2013/975781
National Centers for Environmental Information (NCEI) (2024). “Climate Data Online Data Tools.” Data Tools. Climate Data Online (CDO). National Climatic Data Center (NCDC), U.S. Department of Commerce and National Oceanic and Atmospheric Administration. Available online at: https://www.ncei.noaa.gov/cdo-web/datatools (Accessed June 28, 2024).
National Oceanic and Atmospheric Administration (NOAA) (2024). “National Data Buoy Center, US Department of Commerce, National Oceanic and Atmospheric Administration Available online at: https://www.ndbc.noaa.gov/ (Accessed June 28, 2024).
Nikolaou A., Kostopoulou M., Lofrano G., Meric S. 2009 Determination of PAHs in marine sediments: analytical methods and environmental concerns. Global NEST: Int. J. 11.4, 391–405.
Oen A. M. P., Cornelissen G., Gijs D. (2006). Breedveld. Relation between PAH and black carbon contents in size fractions of norwegian harbor sediments. Environ. Pollut. 141.2, 370–380. doi: 10.1016/j.envpol.2005.08.033
Peters K. E., Walters C. C., Moldowan J.M. (2005). The Biomarker Guide. (Cambridge, UK; New York, N. Y.: Cambridge University Press).
Reisinger A., Gibeaut J. C., Phillippe E., Tissot P. E. (2017). Estuarine suspended sediment dynamics: observations derived from over a decade of satellite data. Front. Mar. Sci. 4, 2335. doi: 10.3389/fmars.2017.00233
Shi W., Xu M., Liu Q., Xie S. (2022). Polycyclic aromatic hydrocarbons in seawater, surface sediment, and marine organisms of haizhou bay in yellow sea, China: distribution, source apportionment, and health risk assessment. Mar. pollut. Bull. 174, 113280. doi: 10.1016/j.marpolbul.2021.113280
Simpson M. J., Chefetz B., Deshmukh A. P., Hatcher P. G. (2005). Comparison of polycyclic aromatic hydrocarbon distributions and sedimentary organic matter characteristics in contaminated, coastal sediments from pensacola bay, florida. Mar. Environ. Res. 59.2, 139–163. doi: 10.1016/j.marenvres.2003.09.003
Solis R. S. (1999). Hydrography, mixing characteristics, and residence times of Gulf of Mexico estuaries. Biogeochemistry Gulf Mexico Estuaries. (New York, N.Y.: John Wiley & Sons, Inc.), 29–61.
Sun K., Song Y., He F., Jing M., Tang J., Liu R. (2021). A review of human and animals exposure to polycyclic aromatic hydrocarbons: health risk and adverse effects, photo-induced toxicity and regulating effect of microplastics. Sci. Total Environ. 773, 145403. doi: 10.1016/j.scitotenv.2021.145403
Texas Department of Transportation (2020). Texas port profiles. Available online at: https://ftp.dot.state.tx.us/pub/txdot-info/mrt/port-profiles.pdf (Accessed June 28, 2024).
Tolosa I., de Mora S., Sheikholeslami M. R., Villeneuve J. P., Bartocci J., Cattini C. (2004). Aliphatic and aromatic hydrocarbons in coastal caspian sea sediments. Mar. Pollut. Bull. 48.1-2, 44–60. doi: 10.1016/S0025-326X(03)00255-8
Troiani B. T., Simms A. R., Dellapenna T., Piper E., Yokoyama Y. (2011). The importance of sea-level and climate change, including changing wind energy, on the evolution of a coastal estuary: Copano Bay, Texas. Mar. Geology 280.1-4, 1–19. doi: 10.1016/j.margeo.2010.10.003
Vane C. H., Harrison I., Kim A. W. (2007). Polycyclic aromatic hydrocarbons (PAHs) and polychlorinated biphenyls (PCBs) in sediments from the mersey estuary, UK. Sci. Total Environ. 374.1, 112–126. doi: 10.1016/j.scitotenv.2006.12.036
Wang Y., Tian Z., Zhu H., Cheng H., Kang M., Luo C., et al. (2012). Polycyclic aromatic hydrocarbons (PAHs) in soils and vegetation near an e-waste recycling site in south China: concentration, distribution, source, and risk assessment. Sci. Total Environ. 439, 187–193. doi: 10.1016/j.scitotenv.2012.08.018
Wang Z., Liu Z., Xu K., Mayer L. M., Zhang Z., Kolker A. S., et al. (2014). Concentrations and sources of polycyclic aromatic hydrocarbons in surface coastal sediments of the northern Gulf of Mexico. Geochemical Trans. 15, 1–12. doi: 10.1186/1467-4866-15-2
Wang Z., Liu Z., Liu M., Xu K., Mayer L. M. (2016). The impact of drying on structure of sedimentary organic matter in wetlands: probing with native and amended polycyclic aromatic hydrocarbons. Sci. Total Environ. 568, 42–515. doi: 10.1016/j.scitotenv.2016.05.184
Wang X.-C., Zhang Y.-X., Chen R. F. (2001). Distribution and partitioning of polycyclic aromatic hydrocarbons (PAHs) in different size fractions in sediments from boston harbor, United States. Mar. pollut. Bull. 42.11, 1139–1149. doi: 10.1016/S0025-326X(01)00129-1
West A., Wetz M., Beseres Pollack J., Berger A. (2023). San antonio bay ecosystem health report card 2023 (Issuu, Harte Research Institute for Gulf of Mexico Studies, Texas A&M University - Corus Christi). Available at: https://www.sabaypartnership.org/manager/wp-content/uploads/SA-BayHarte-Reportcard-2023-05.pdf.
Xu K., Sanger D., Riekerk G., Crowe S., Van Dolah R. F., Wren P. A., et al. (2014). Seabed texture and composition changes offshore of port royal sound, south carolina before and after the dredging for beach nourishment. Estuarine Coast. Shelf Sci. 149, 57–67. doi: 10.1016/j.ecss.2014.07.012
Yang Z., Feng J., Niu J., Shen Z. (2008). Release of polycyclic aromatic hydrocarbons from yangtze river sediment cores during periods of simulated resuspension. Environ. Pollut. 155.2, 366–374. doi: 10.1016/j.envpol.2007.11.007
Yang Y., Zhang N., Xue M., Lu S. T., Tao S. (2011). Effects of soil organic matter on the development of the microbial polycyclic aromatic hydrocarbons (PAHs) degradation potentials. Environ. Pollut. 159.2, 591–595. doi: 10.1016/j.envpol.2010.10.003
Keywords: polycyclic aromatic hydrocarbons (PAHs), grain size, resuspension, coastal sediments, Texas Gulf coast
Citation: Lloyd J, Lu K and Liu Z (2024) Investigating concentrations and sources of polycyclic aromatic hydrocarbons in South and Central Texas bays and estuaries along the Gulf of Mexico, USA. Front. Mar. Sci. 11:1456717. doi: 10.3389/fmars.2024.1456717
Received: 01 July 2024; Accepted: 23 August 2024;
Published: 03 October 2024.
Edited by:
Xiutang Yuan, Chinese Academy of Sciences (CAS), ChinaCopyright © 2024 Lloyd, Lu and Liu. This is an open-access article distributed under the terms of the Creative Commons Attribution License (CC BY). The use, distribution or reproduction in other forums is permitted, provided the original author(s) and the copyright owner(s) are credited and that the original publication in this journal is cited, in accordance with accepted academic practice. No use, distribution or reproduction is permitted which does not comply with these terms.
*Correspondence: Zhanfei Liu, emhhbmZlaS5saXVAdXRleGFzLmVkdQ==