- 1Key Laboratory of Marine Mineral Resources, Ministry of Natural Resources, Guangzhou Marine Geological Survey, China Geological Survey, Guangzhou, China
- 2National Engineering Research Center for Gas Hydrate Exploration and Development, Guangzhou, China
- 3Southern Marine Science and Engineering Guangdong Laboratory (Guangzhou), Guangzhou, China
- 4School of Earth Sciences and Engineering, Sun Yat-Sen University, Zhuhai, China
The abundance of specific hydrocarbon-oxidizing bacteria (MV value) in surface soil is closely linked to the concentration of thermogenic light hydrocarbons found in the underlying layers. The identification of these bacteria using specific detection techniques offers unique insights into microbiological anomalies associated with oil and gas, underscoring the significance of delineating microbiological geochemical anomalies in the exploration process. Accurate determination of the anomaly range is crucial for forecasting potential oil and gas reservoirs. In this study, a variety of fractal and geological statistical methods were employed to analyze microbiological geochemical data from the Taiwan Strait Basin. The multifractal approach allows for the simultaneous assessment of spatial autocorrelation and singularity in geochemical fields, with the fractal distribution reflecting the localized enrichment and depletion patterns of microbiological geochemical elements in rocks and other substrates. Geological statistical methods, such as the variation function, enable the assessment of spatial autocorrelation in geochemical and geophysical fields. The results indicate that microbiological anomalies in the Jiulongjiang Depression are mainly concentrated in the southwestern part of the study area, with some anomalies also observed in the central region. Conversely, microbiological anomalies in the Jinjiang Depression are predominantly located in the southern portion of the study area. Microbiological anomalies in the study area (Jinjiang Depression and Jiulongjiang Depression) exhibit a northeast-southwest strip distribution, aligning with the trend of the depressions and faults, suggesting that faults could influence the distribution of oil and gas resources in the region. Based on microbiological statistical analyses, the Jiulongjiang Depression shows better potential for oil and gas prospects compared to the Jinjiang Depression, guiding future research efforts in the Jiulongjiang Depression.
1 Introduction
In exploration geology, interpolating spatial data is often necessary to represent the variation of a certain field from point source data to a surface. Different geophysical and geochemical fields are the result of the superposition of various geological processes. To highlight certain components while suppressing others, it is often necessary to process these superimposed fields, such as by filtering (Cheng, 1999, 2007). In most cases, a sliding weighted average is applied to the data within a local range, and the quality of interpolation and filtering directly affects the results of anomaly delineation (Cao and Cheng, 2012). Commonly used interpolation methods in scientific research include Inverse Distance Weighting (IDW), Kriging, and Spline Fitting (Sadeghi, 2023), which are generally used to reflect a certain trend or to obtain average estimation results for parameter estimation, where the local variations and local structural characteristics of the field values are not important (Agterberg, 2012; Afzal et al., 2016).
The Concentration-Area (C-A) fractal model is widely utilized in exploration geochemistry and environmental geochemistry (Cheng et al., 1996; Fyzollahhi et al., 2018). It has also been applied in the exploration of oil and gas resources and submarine resources. For example, Xie et al. (2007) used the C-A method to delineate hydrocarbon anomalies (Xie et al., 2007), and Zhang et al. (2006) used the C-A method to investigate the fractal distribution characteristics of cobalt crust resources in the Pacific (Zhang et al., 2006).
The S-A multifractal filtering technique solves the problem of complex background and overlapping anomaly decomposition in mineral exploration (Zuo et al., 2013). This method has the function of suppressing the influence of changing background and highlighting local anomalies. Previous studies have used the C-A fractal method to determine the geochemical baseline values required by Italian Environmental Law No. 471. By using the S-A method and multifractal interpolation MIDW technique, the geochemical pollution areas have been successfully delineated. These multifractal methods can avoid the local anomalies in the data from being smoothed, making the delineation of geochemical background more reliable. It also proves that the use of low-density geochemical sampling is successful (Cicchella et al., 2005; Albanese et al., 2007).
In 1994, Cheng et al. introduced the “density-area” (D-A) fractal model to quantify the anisotropic self-similarity between density and area. This model is linked to power-law distributions but differs from a simple frequency distribution. Expanding the C-A concept into the frequency domain led to the development of the “spectral density-area” (S-A) fractal model for multifractal fields. The S-A model not only assesses the generalized self-similarity of spatiotemporal complex patterns but also serves as a fractal filtering technique based on various generalized self-similarities, enabling the differentiation between anomalies and background patterns. The C-A and S-A models have found widespread application in decomposing and identifying geochemical and geophysical anomalies (Sadeghi, 2021a, b; Yousefi and Carranza, 2015; Zadmehr and Shahrokhi, 2019).
Singularity analysis methods have been widely applied in the fields of solid mineral resources and marine mineral resources(Zhang et al., 2022). They primarily analyze anomalous zones in a research area based on the magnitude of singular values. For instance, when the singular value is less than 2, the corresponding area may indicate enrichment of a chemical element; when the singular value is greater than 2, the corresponding area may indicate its depletion; and when the singular value is close to 2, it may suggest that a certain element in the study area has not been significantly affected by mineralization processes. Singular value analysis methods are typically used to represent the release of significant energy within a small spatial-temporal range (Cheng, 2006).
The Taiwan Strait Basin, situated in the southeastern part of the Eurasian Plate, extends across the Taiwan Strait and the western foothills of Taiwan. It is a composite basin formed by further extension on the basis of inherited Cretaceous rifting during the Paleogene, and later transformed into a foreland basin under the influence of foreland tectonics. The sedimentary center of the basin gradually shifted eastward with time, undergoing two transformations into a foreland basin in the late Oligocene and the Miocene, with a total area of approximately 40,790 km2. Oil and gas exploration in the Taiwan Strait commenced in the late 20th century. Numerous oil companies and research institutions have since employed a variety of techniques, including gravity, magnetic, electrical, seismic, and geochemical methods, yielding substantial exploration findings. The research mainly focuses on the tectonic and sedimentary evolution of the Taiwan Strait, with less emphasis on anomaly delineation from a data perspective to guide mineral exploration analysis (Zhang et al., 2019a).
In this study, the primary research objectives are to delineate the range of microbial geochemical anomalies, understand their underlying causes, and assess the potential for oil and gas presence. We introduce a comprehensive spatial statistical and multifractal processing approach to emphasize the local variability and spatial structural characteristics of these anomalies. This methodology not only accounts for the spatial correlation and variability of field values but also effectively quantifies the local singularity of the field (Cheng, 2023; Xie et al., 2007). The approach is applied to microbiogeochemical data from the Taiwan Strait Basin to identify zones of microbial anomalies and evaluate the oil and gas potential of local geological structures.
2 Study area
The Taiwan Strait Basin is a Cenozoic continental margin rift basin that formed in an intra-plate extensional setting and was later affected by foreland basins. It consists of four depressions (Jinjiang, Hsinchu, Jiulongjiang, Taichung) and two uplifts (Pengbei, Miaoli), with fault systems-oriented NE, NW, and near SN (see Figure 1).
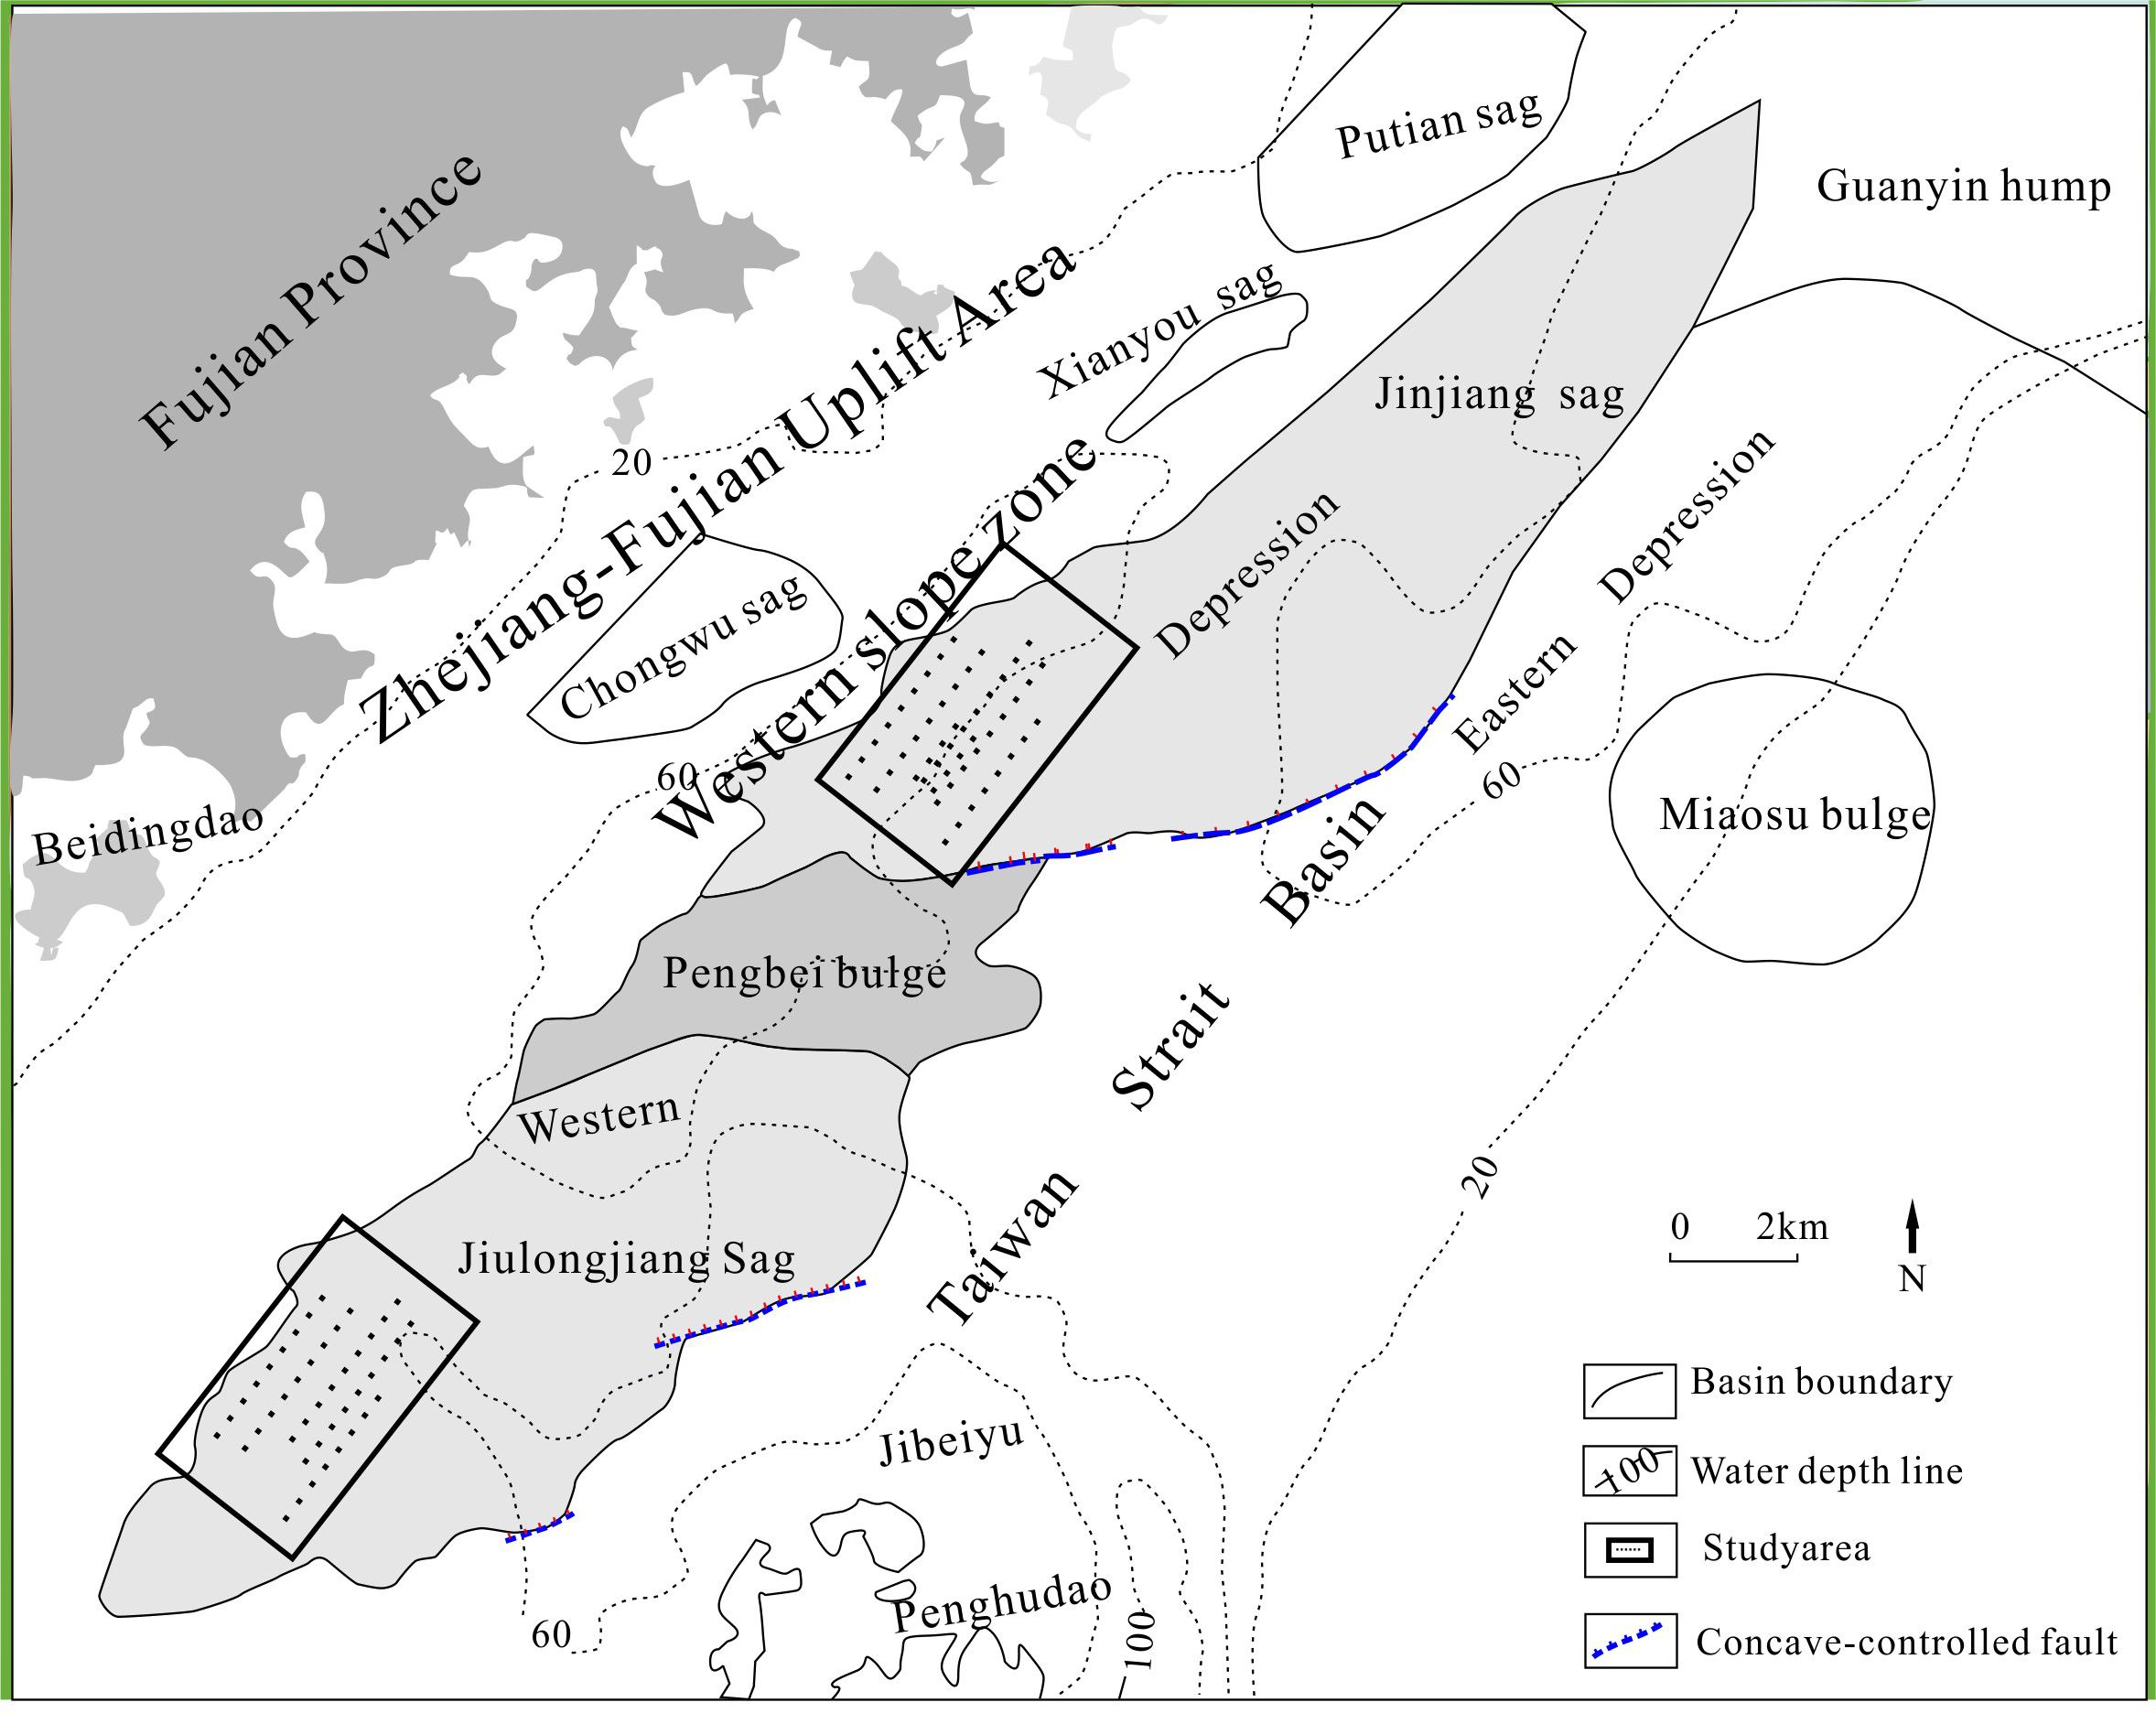
Figure 1. Geologic background map of the Taiwan Strait Basin. Adapted from Unsupervised Machine Learning-Based Singularity Models: A Case Study of the Taiwan Strait Basin, by Yan Zhang, Li Zhang, Zhenyu Lei, Fan Xiao, Yongzhang Zhou, Jing Zhao, and Xing Qian, licensed CC-BY-4.0.
The Jinjiang Depression is a narrow and elongated half-graben with eastward faulting and westward uplift. The thickness of the strata increases from west to east, with sediment mainly sourced from the west side of the Min-Zhe Uplift and transported eastward. The sediment near the source on the west side is coarser, while the sediment near the depositional center on the east side is finer. Therefore, the better reservoir rocks are expected to be on the west side, while the source rocks for oil generation are on the east side (Zhang et al., 2019a).
Based on the analysis of the basin’s evolution and sedimentary patterns, shale deposits from the Paleogene period, including lake and fan-delta sediments, are found. These shale deposits are expected to be rich in organic matter due to the semi-closed environment, making them favorable for oil generation. The deep depression area on the eastern margin of the basin is the oil generation center. Preliminary geochemical maturity simulations indicate that the Paleogene source rocks in the central part of the basin entered the mature stage in the Eocene, and the generated oil and gas can be accumulated in the sand layers of the Paleogene, with shale as the main cap rock. Therefore, the Paleogene is the most prospective layer for oil and gas accumulation in this basin. Although the lower part of the Eocene is mainly shale, the thin sand layers within it may also contain oil and gas reserves (Weng et al., 2012; Zhang et al., 2019b).
It is generally believed that the Jinjiang Depression and Jiulongjiang Depression have similar petroleum geological conditions. In the central part of the Jiulongjiang Depression, lacustrine deposits from the Eocene/Oligocene contain shale with an organic carbon content of 3-4%, S2 reaching 10-15mgHC/gRock, and Tmax of 432-438°C, indicating excellent source rocks. The Paleogene strata in the Jinjiang Depression may also contain good-quality lacustrine source rocks. Based on seismic facies analysis, the Eocene strata are interpreted as delta plain to delta front environments, which may also contain source rocks of fair to good quality. In summary, the petroleum system in the Jinjiang Depression is mainly associated with the sedimentary system during the basin-rifting period. It is a medium oil and gas generating system with vertical migration as the main mechanism and good sealing capacity. The Paleogene source rocks in the oil-generating center entered the oil window and reached maturity during the Eocene, and are currently in the mature to highly mature stage. Oil and gas migration is primarily vertical, mainly along faults, and accumulates in fault closures. Some may also be trapped by unconformities or lithofacies changes. The reservoir rocks may include Eocene channel sands, delta plains or delta fronts, and Paleogene fan deltas. In addition, stacked coarse-grained sediments due to fault collapse near the eastern boundary of the basin may also serve as reservoir rocks. The Eocene shale is regionally a good cap rock. Due to limited oil and gas migration distance, the highest oil and gas potential is expected in the oil-generating area and its vicinity, where self-sourced or lower-sourced upper-reservoir type oilfields are likely to be found. Their distribution should be within the oil-generating area and adjacent regions (Liu et al., 2006; Weng et al., 2012).
3 Materials and methods
3.1 Microbial geochemical data
The samples utilized in this research were gathered and examined as a component of the oil and gas microbial detection project in the western Taiwan Strait Basin. A total of 255 microbial samples were collected within the study area, with a minimum sampling interval of 1×2 km and a maximum of 4×4 km. The collection depth for the oil and gas microbial detection in the seabed sediment soil samples was 20 cm. Following freezing and storage, the samples were transported to the laboratory for analysis. The procedural steps for oil and gas microbial detection comprised weighing, dilution, constant temperature cultivation, and enumeration. The procedural steps for determining the MV value of marine sediment samples are as follows:
(1) Weighing: Use an electronic balance (Shanghai Jinghai, YP202N) to weigh 25 g of marine sediment samples.
(2) Dilution: 25g of the sample was diluted in 100mL of diluent. The diluted mixture was then inoculated in a ratio of diluent to culture medium of 1:4. Gradient dilution was performed using a pipette (large volume, 100-1000μL), with each dilution step maintaining a ratio of 1:4 between inoculated culture medium and sterile culture medium. A growth indicator was added to the culture medium, and the final gradient dilution concentration was determined based on preliminary experimental results. Three parallel samples were set up.
(3) Incubation: All inoculated culture media were placed in an incubator (Shanghai Boxun, SPX-250B-Z) for cultivation. The growth of specific microorganisms was observed by monitoring changes in the culture media. The criteria for determination were as follows: no change in the growth indicator of culture media without specific microorganisms (negative), while culture media with specific microorganisms showed changes in the growth indicator, such as turbidity and the formation of a surface biofilm (positive).
(4) Enumeration: Based on the number of positive culture media from the same sample series and parallel samples, the MV value of the test sample was calculated using the computer program MV Calculator.
Quality control measures adopted for microbial testing mainly include process control measures, which are as follows:
(1) Positive controls, negative controls, and blank controls were set up for the culture media, reagents, etc. used in the tests, and the tests passed the quality control.
(2) Important instruments and equipment used in the tests, as well as the testing environment, were controlled. The pipette was calibrated before each use, and the temperature and humidity of the cultivation and environment were within the acceptable range.
(3) The personnel responsible for key testing steps were qualified individuals with years of experience in microbial testing. The reading and other critical positions were performed by a single tester to minimize errors.
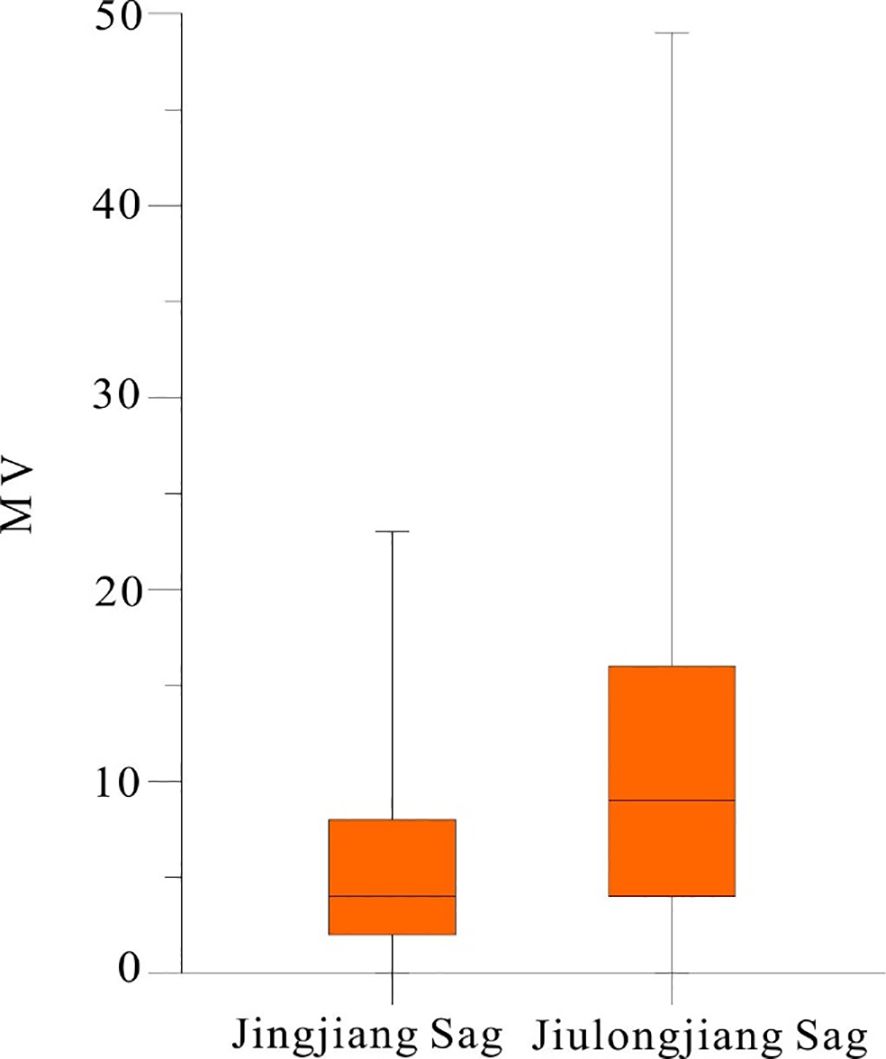
Because the hydrocarbon source rocks of the Jiulongjiang Depression have higher maturity than those of the Jinjiang Depression, resulting in more hydrocarbon sources in the Jiulongjiang Depression than in the Jinjiang Depression, the amount of polymerized hydrocarbons in the Jiulongjiang Depression is much higher than that of the Jinjiang Depression, which is 2.8738×10⁸ t and 0.8289×10⁸ t, respectively (Liu et al., 2006). The microbial data statistics also show that the average MV value of the Jiulongjiang depression study area is 12.74, while that of the Jinjiang depression is 7.25. Therefore, it indicates that the light hydrocarbon microseepage in the Jiulongjiang depression work area of the Taiwan Strait Basin is stronger than that in the Jinjiang depression, which further corroborates the results of the previous research.
Microbial hydrocarbon detection technology is a mature and effective method for detecting hydrocarbons. It can identify exclusive hydrocarbon-oxidizing bacteria in submarine sediments that rely solely on light hydrocarbons as a carbon source (food) (Zhang et al., 2019b). By observing changes in the abundance of these bacteria in samples, the potential enrichment of hydrocarbons can be effectively determined, allowing for the differentiation of hydrocarbon-enriched and non-enriched areas within a study area. By integrating geological, geochemical, and geophysical research, the distribution and properties of underground oil and gas reservoirs indicated by microbial anomalies can be accurately assessed, providing a preliminary evaluation of the oil and gas exploration prospects in the study area. In this study, microbial geochemical hydrocarbon detection technology was utilized to identify exclusive hydrocarbon-oxidizing bacteria (butane-oxidizing bacteria) in seafloor surface sediments within the study area. The research aimed to investigate the microbial background and anomalous distribution characteristics.
3.2 Methodology
3.2.1 Spatial correlation and spatial statistical analysis
Spatial statistics is a development based on traditional statistics, which introduces statistical methods into spatial relationships. For example, geostatistical methods incorporate spatial self-similarity or variability into traditional statistical estimation and interpolation. This spatial autocorrelation relationship can reflect certain spatial patterns, their changing rules, and variability information (Cheng, 1999). Although traditional statistical methods can sometimes be used to describe spatial structures and variations, the process itself does not involve spatial information. In recent years, spatial statistical methods have been widely applied in the processing of geochemical and geophysical data, and traditional geological statistical methods and techniques such as filtering have played a positive role in anomaly identification (Carranza, 2008, 2009). The variability function is commonly used to measure the statistical correlation and variability of variables within a certain distance (Cheng, 2001).
Among them, γ(x,h) is a function of location and distance. It measures the average difference in field values between two points with a distance interval of h, and this difference is inversely correlated with spatial autocorrelation. This variability index can only measure the symmetric variability and correlation of variables at a certain scale h. The distance h can be a vector distance, so the variability function can have directionality (Herzfeld, 1993). This variability function can be used for multi-directional and multi-scale structural analysis. The Kriging method is a spatial interpolation method based on the variability function (Journel and Huijbregts, 1978), essentially a moving weighted average method. Since the Kriging method performs weighted averaging based on spatial variability, it inevitably smooths the data. This method is effective for tasks such as reserve calculation or parameter estimation. However, for anomaly identification, the suppression and obliteration of local change information often lead to the loss of useful information (Cheng, 2001).
3.2.2 Local singularity and multifractal methods
Through the discussion of spatial statistics and correlation, it is found that the correlation index cannot reflect the enrichment or depletion patterns of elements. Singularity measures the variation of field values with the size of the measurement range (Cheng, 2018). Taking a uniform rock sample as an example, the average content of elements in the rock is relatively independent of the size of the sample (Lark et al., 2018). Despite the sample size, the average content analyzed remains consistent, which may be perceived as normal or non-singular. Nevertheless, this assumption is flawed as the element content in rocks is typically non-uniform. Therefore, the analyzed element content is influenced by the sample size, leading to varying average analysis values. This phenomenon is known as singularity (Cheng, 2023; Wang et al., 2017; Xiao et al., 2012).
Self-similarity refers to the preservation of similarity in the field when the measurement scale changes. From the perspective of multifractals, multiple geological processes often generate self-similar fields. Self-similar fields and self-similarity are not the same. Self-correlation has statistical significance, while self-similarity has geometric spatial properties. Self-similarity can be expressed using an exponential function (Cheng et al., 1994):
where μ(ϵ) represents a quantity or field based on the scale ϵ, such as the average surface metal content within an ϵ×ϵ range. The exponential function has the advantage that changing the scale of the variable does not affect the type of the function. α is the singularity index, which determines the variation of the exponential relationship. If the average density of elements is used instead of the surface metal content, the equation can be rewritten as (Cheng et al., 1994):
When the singularity index is equal to 2, the average density is independent of the size of the measurement range. When the singularity index is greater than 2, ρ(ϵ) decreases as ϵ decreases. If ϵ is very small, ρ(ϵ) tends to 0. When the singularity index is less than 2, ρ(ϵ) increases as ϵ decreases.
If ϵ is very small, ρ(ϵ) exhibits high or extreme values. In terms of the average density distribution of geochemical elements, the singularity index equals 2 reflects the average non-singular background distribution. The background distribution usually represents the majority of the study area. However, when the singularity index is greater than 2 or less than 2, it respectively reflects anomalies in the element content related to local geological factors, such as depletion or enrichment (Zuo and Wang, 2015; Zuo et al., 2013).
4 Results and discussion
4.1 Spatial distribution of microorganism
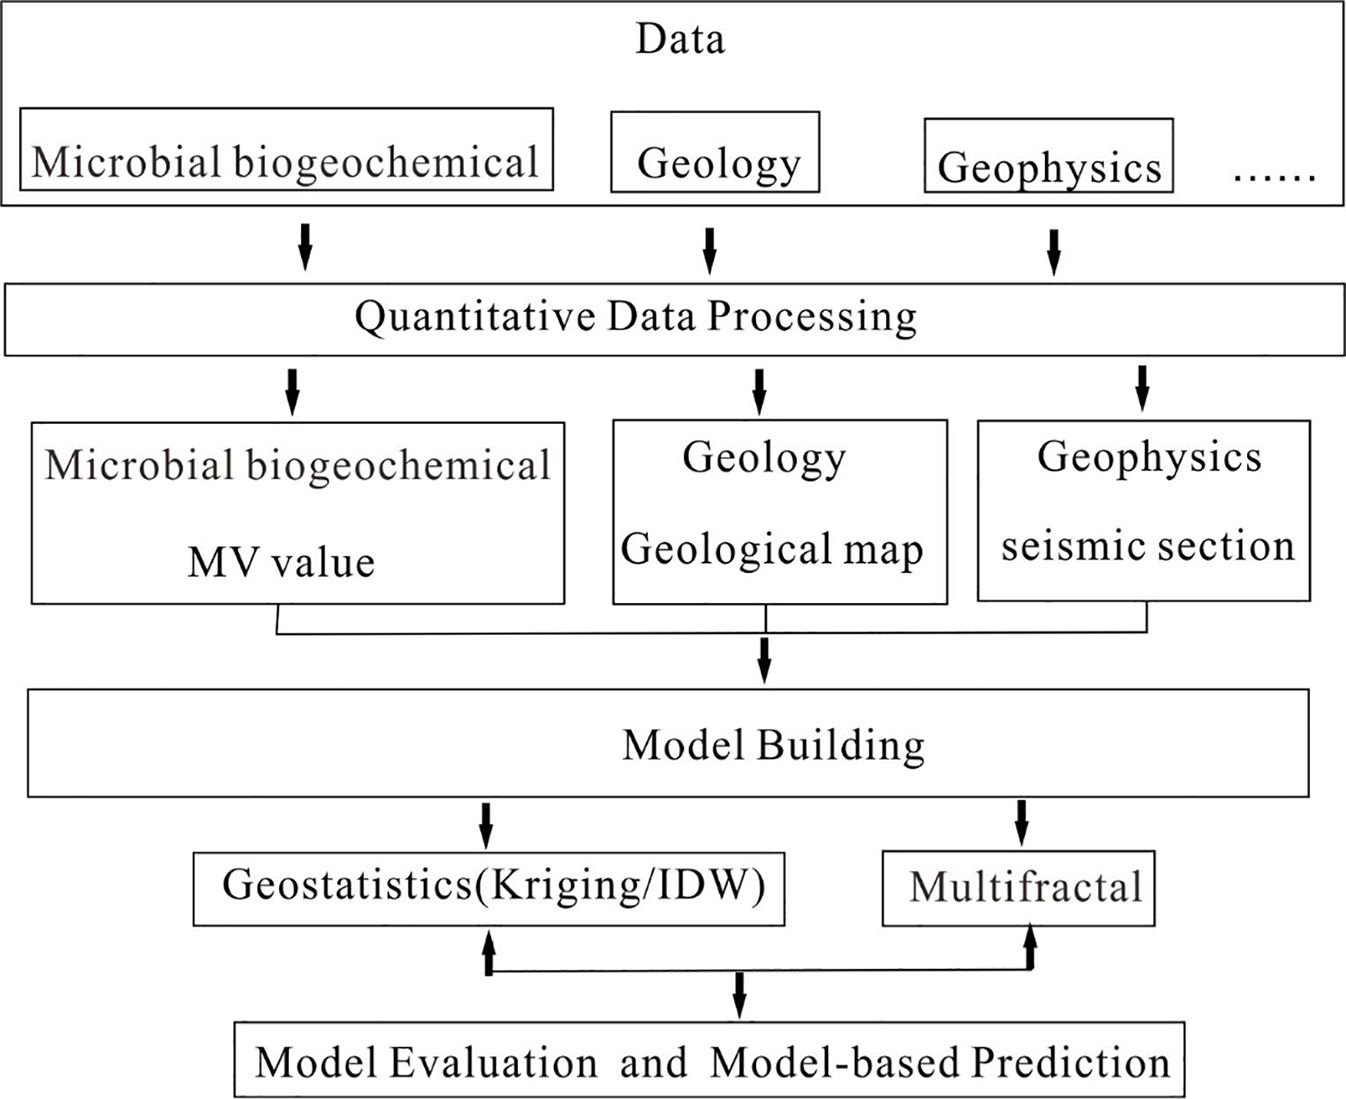
Figure 2 is a flowchart of the full text. The results of this study indicate that the microbial geochemical elements in the study area do not strictly follow a log-normal distribution (Figure 3), with many points deviating from the log-normal line. The frequency distribution of concentration values has a thicker and longer high-value tail than the log-normal distribution, suggesting that the concentration of microbial geochemical elements may follow a fractal statistical distribution.
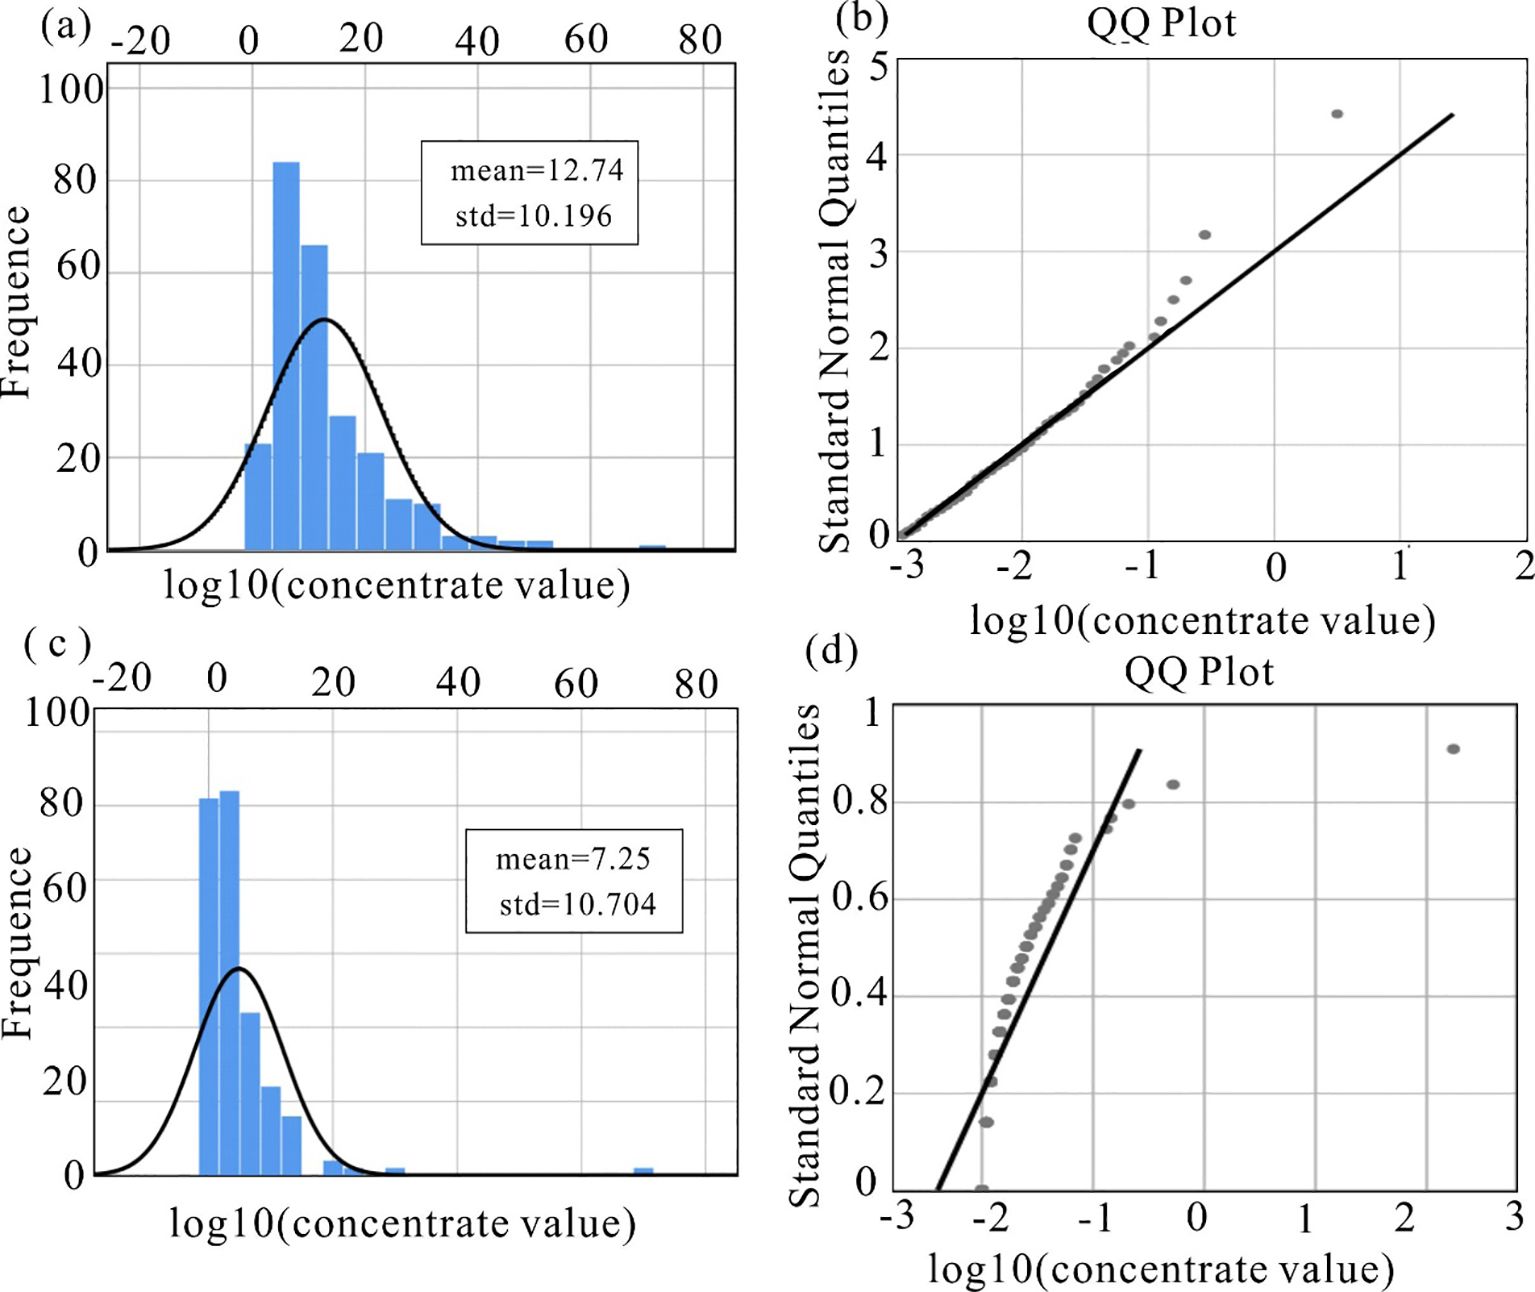
Figure 3. Histograms of (A) log-transformed MV1 and (C) log-transformed MV2. Q–Q plots of (B) log-transformed MV1 and (D) log-transformed MV2.
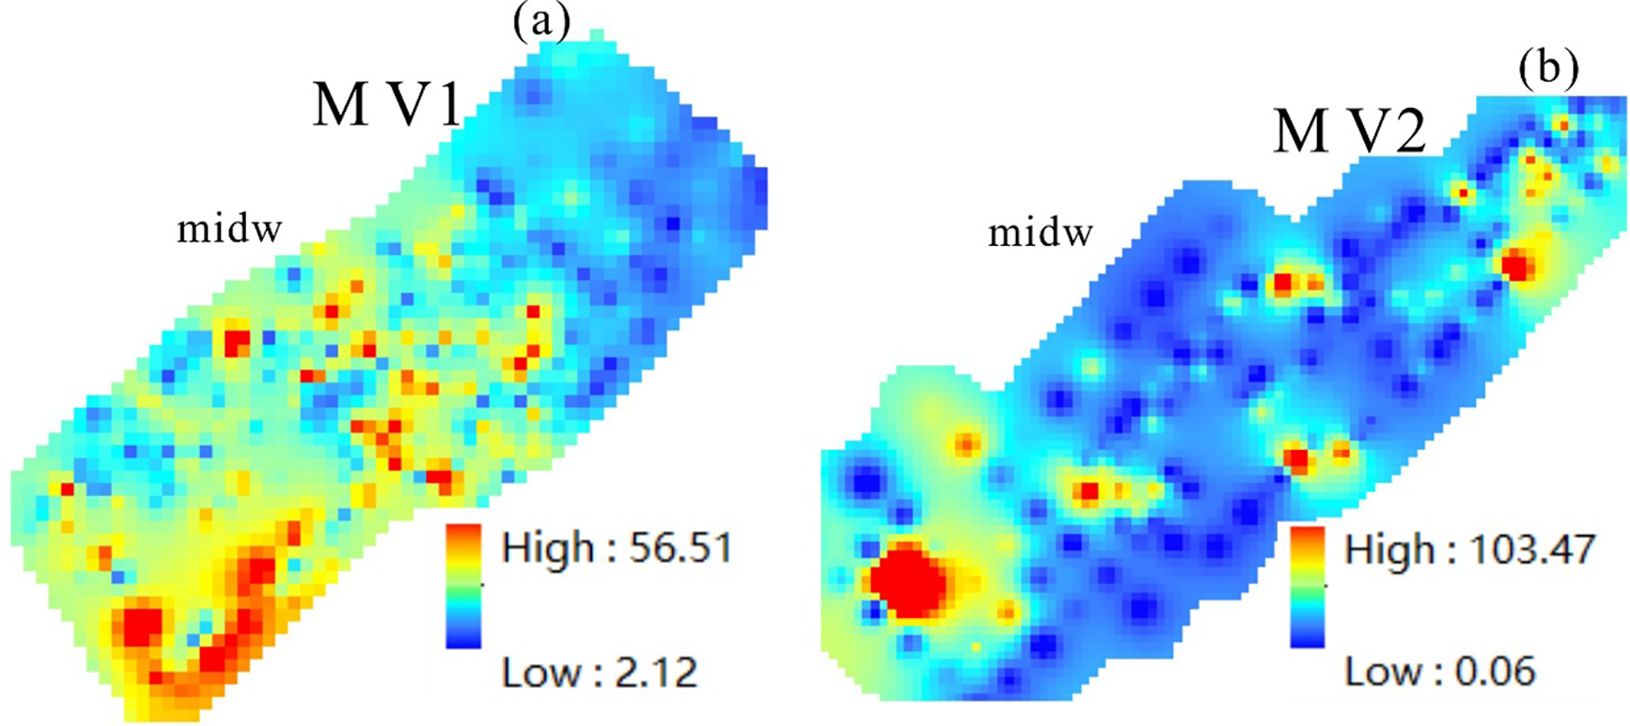
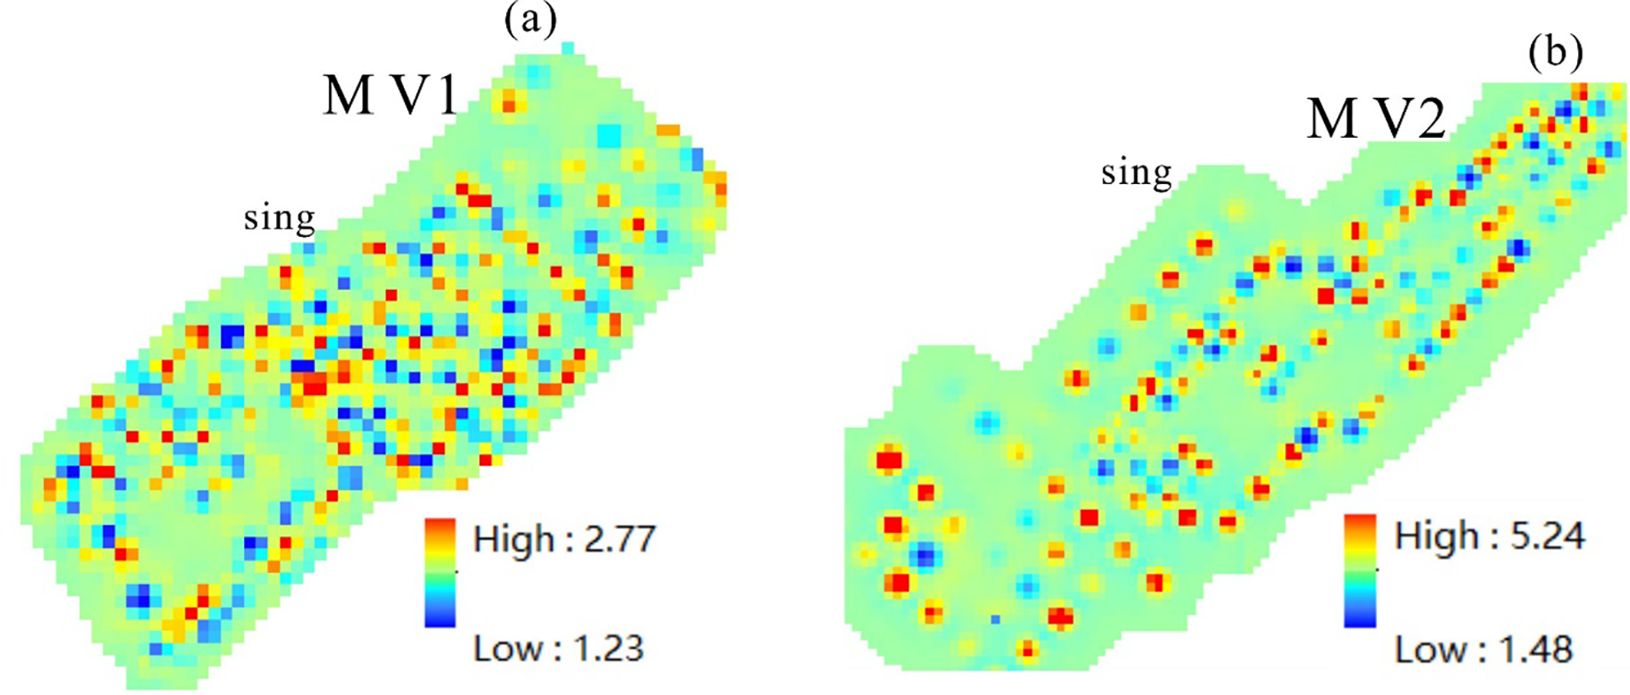
Moreover, from a microbiological statistical perspective, the average MV value in the Jiulongjiang depression is significantly higher than that in the Jinjiang depression (see Figure 4 Box plot), indicating a more pronounced light hydrocarbon microleakage intensity in the former. The Jiulongjiang depression shows relatively promising oil and gas prospects. The results of IDW and Kriging (refer to Figures 5, 6) reveal that microbial anomalies in the Jiulongjiang Depression are predominantly located in the southwest section of the study area, with some anomalies also observed in the central region. Conversely, in the Jinjiang Depression, microbial anomalies are mainly concentrated in the southern part of the study area. The microbial anomalies within the study area (Jinjiang Depression and Jiulongjiang Depression) demonstrate a belt-like distribution running northeast-southwest, aligning with the trend of the depressions and faults. This indicates that faults within the study area may influence the distribution of oil and gas resources. The study area is situated on the western gentle slope of a semi-graben rift basin. It is postulated that the sources of the Jinjiang Depression and Jiulongjiang Depression are derived from the Zhe-min uplift on the western side. This uplift likely facilitated the deposition of channel and delta sediments during the Paleocene-Eocene period, potentially leading to the development of lithologic traps (Weng et al., 2012). Consequently, the microbial anomalies observed in the study area may be associated with various trap types such as lithologic, stratigraphic, and buried hill traps.

Figure 5. Microbial anomaly result map of Jiulongjiang depression (the left is idw calculation result, the right is Kriging result).
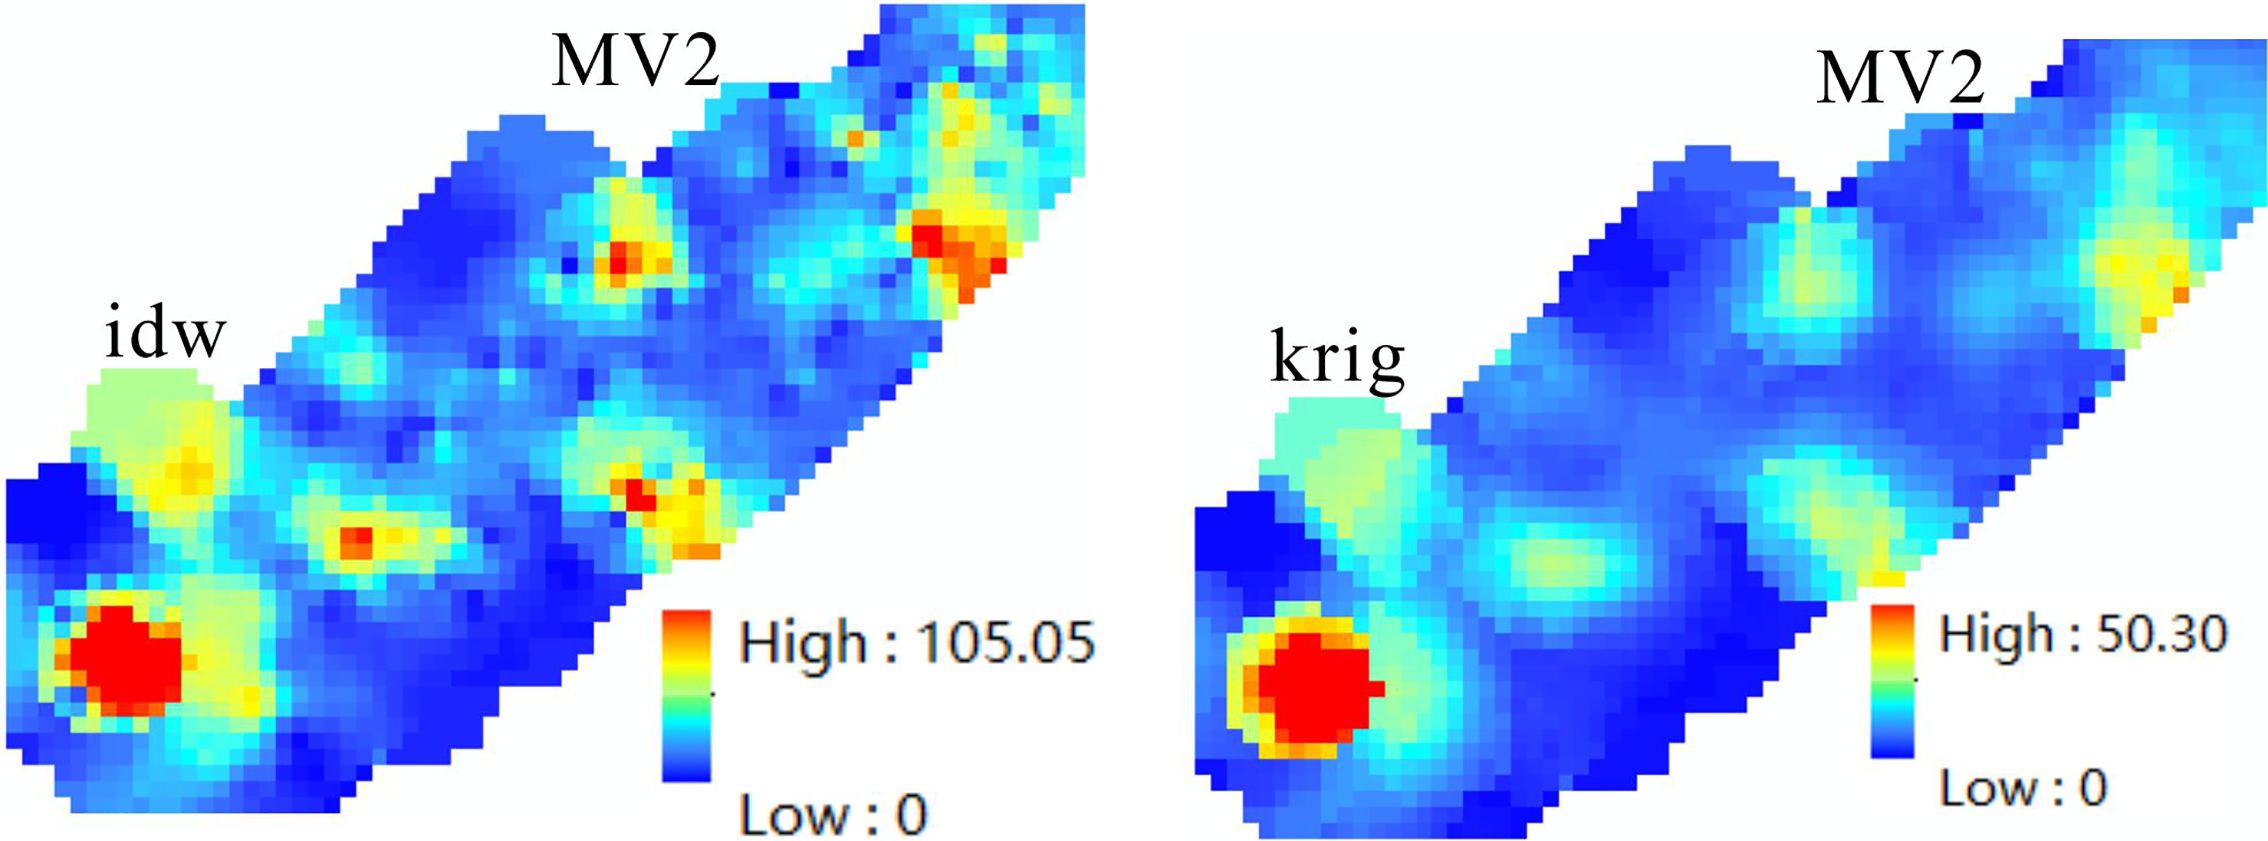
Figure 6. Microbial anomaly result map of Jinjiang depression (the left is idw calculation result, the right is Kriging result).
The primary anomaly zone within the Jinjiang Depression is delineated by two faults oriented in the NNW-NEE direction. This configuration may have created a conduit for sediment transport and deposition. The western provenance could have given rise to river, delta, and other sedimentary facies in this region. Moreover, this area is proximal to the boundary fault of the hydrocarbon generation center in the study area, facilitating the migration of oil and gas to shallower depths and the formation of lithostratigraphic oil and gas reservoirs.
4.2 Analysis and identification of microbial biogeochemical anomalies
Before applying the multifractal method, the local singularity index is calculated firstly, the singularity index is shown in Figure 7, and the result of multifractal interpolation is shown in Figure 8, in order to compare the results of the multifractal method with the Kriging method, the results of the multifractal method and the Kriging method are done as a ratio, and the result of the ratio is shown in Figure 9, and the result of the ratio shows that, the lot with the high ratio is the lot with singularity. That is, compared with the Kriging method, the application of the multifractal method can enhance the information of mineralization-rich lots.
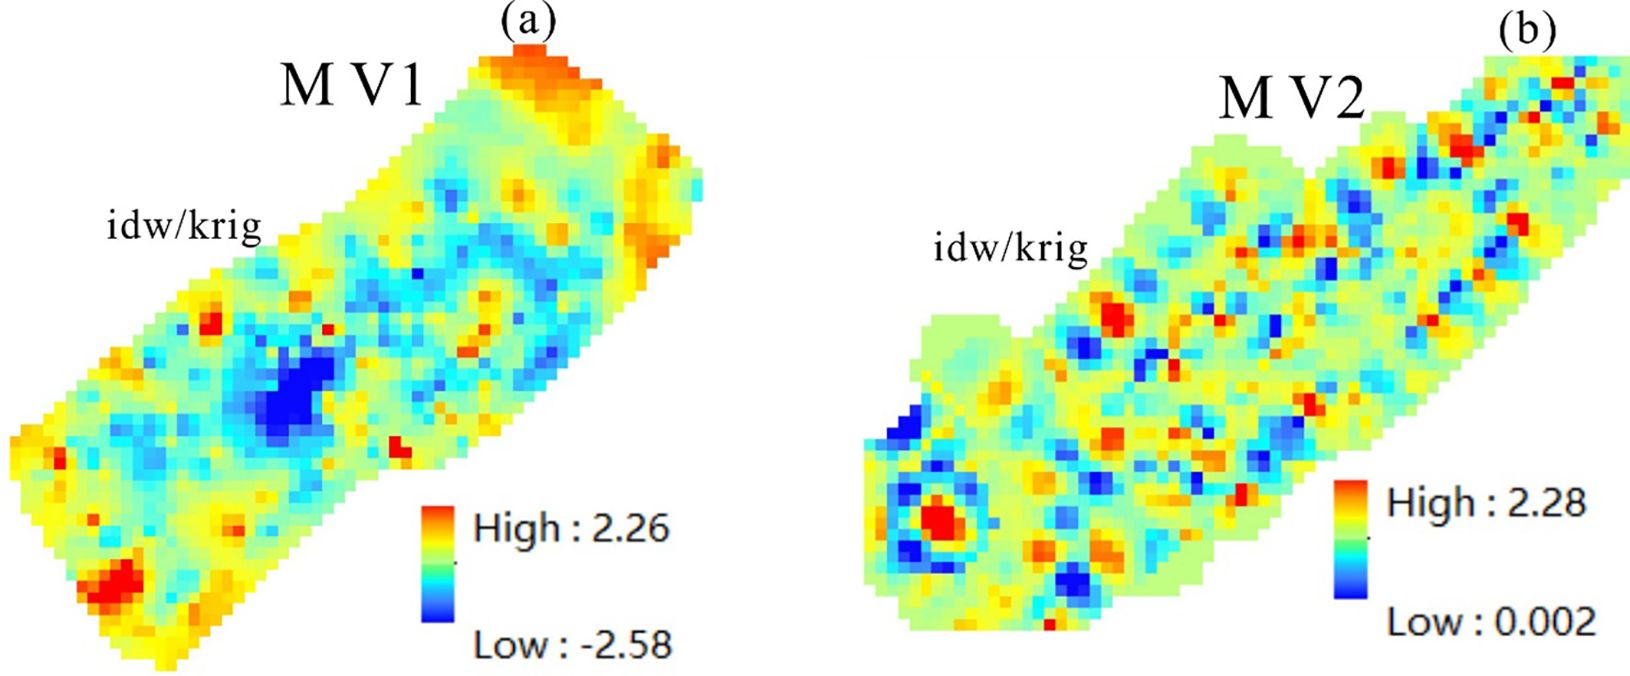
Figure 7. Ratios of results obtained by multifractal interpolation with results obtained by Kriging (A is MV1 and B is MV2).
MV1: The fractal dimension equation of the microbial anomalies in the Jiulong River Depression is obtained using the C-A fractal model and the least squares method.
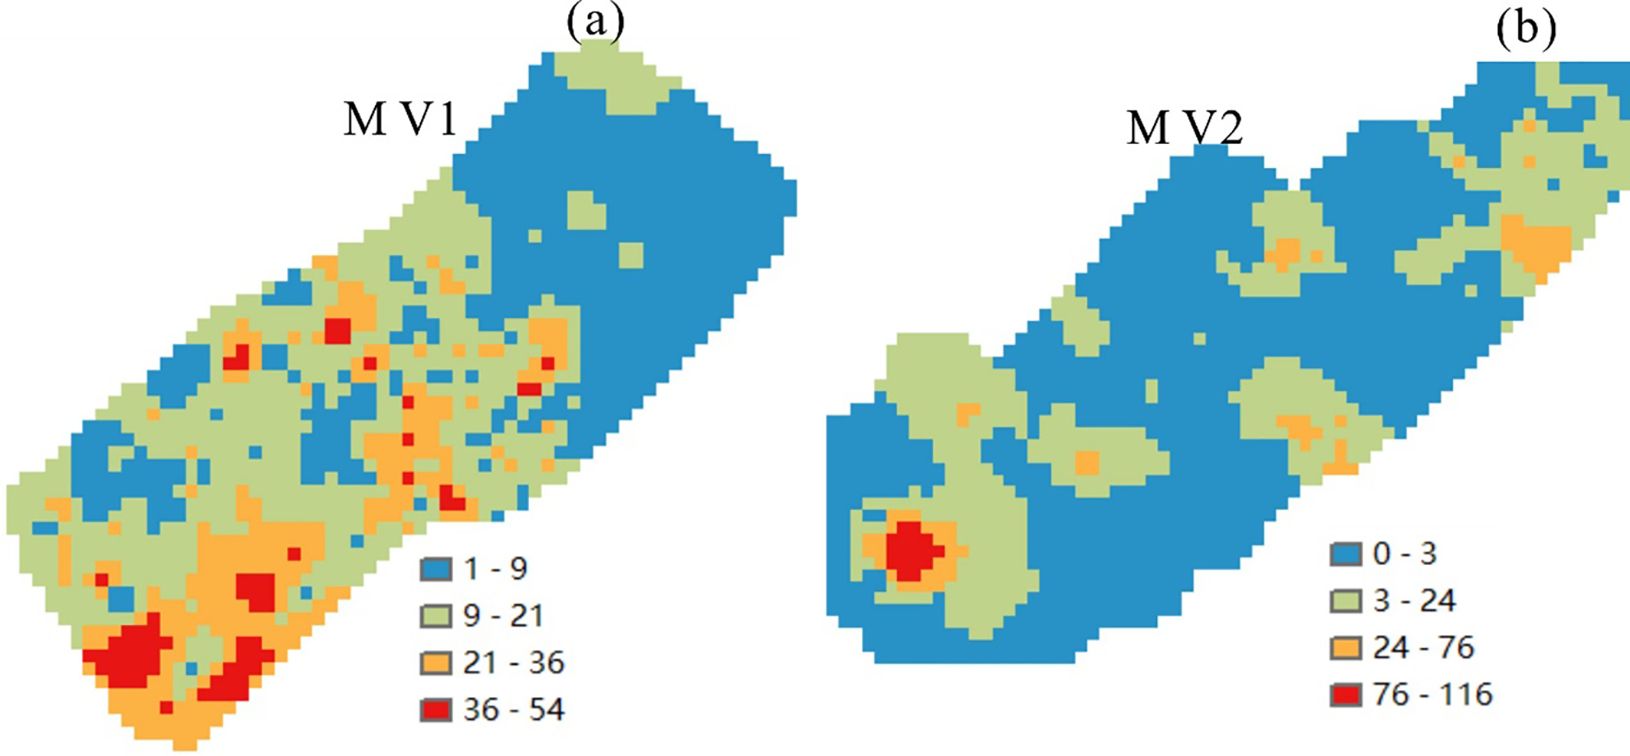
Based on the boundary points determined by the C-A fractal model, the microbial anomaly map is classified and displayed. From the analysis results (Figures 10A, 11), it can be seen that the microbial anomalies in the Jiujing Depression are mainly distributed in the southwest part of the working area, with some anomalies also present in the central part of the working area. In the Jinjiang Depression, the microbial anomalies are mainly distributed in the southern part of the working area.

Figure 11. C-A plot showing cumulative area versus tin concentration value, base of logarithms is e.
MV2: The fractal dimension equation of the microbial anomalies in the Jinjiang Depression is obtained using the C-A fractal model and the least squares method (Figures 10B, 11).
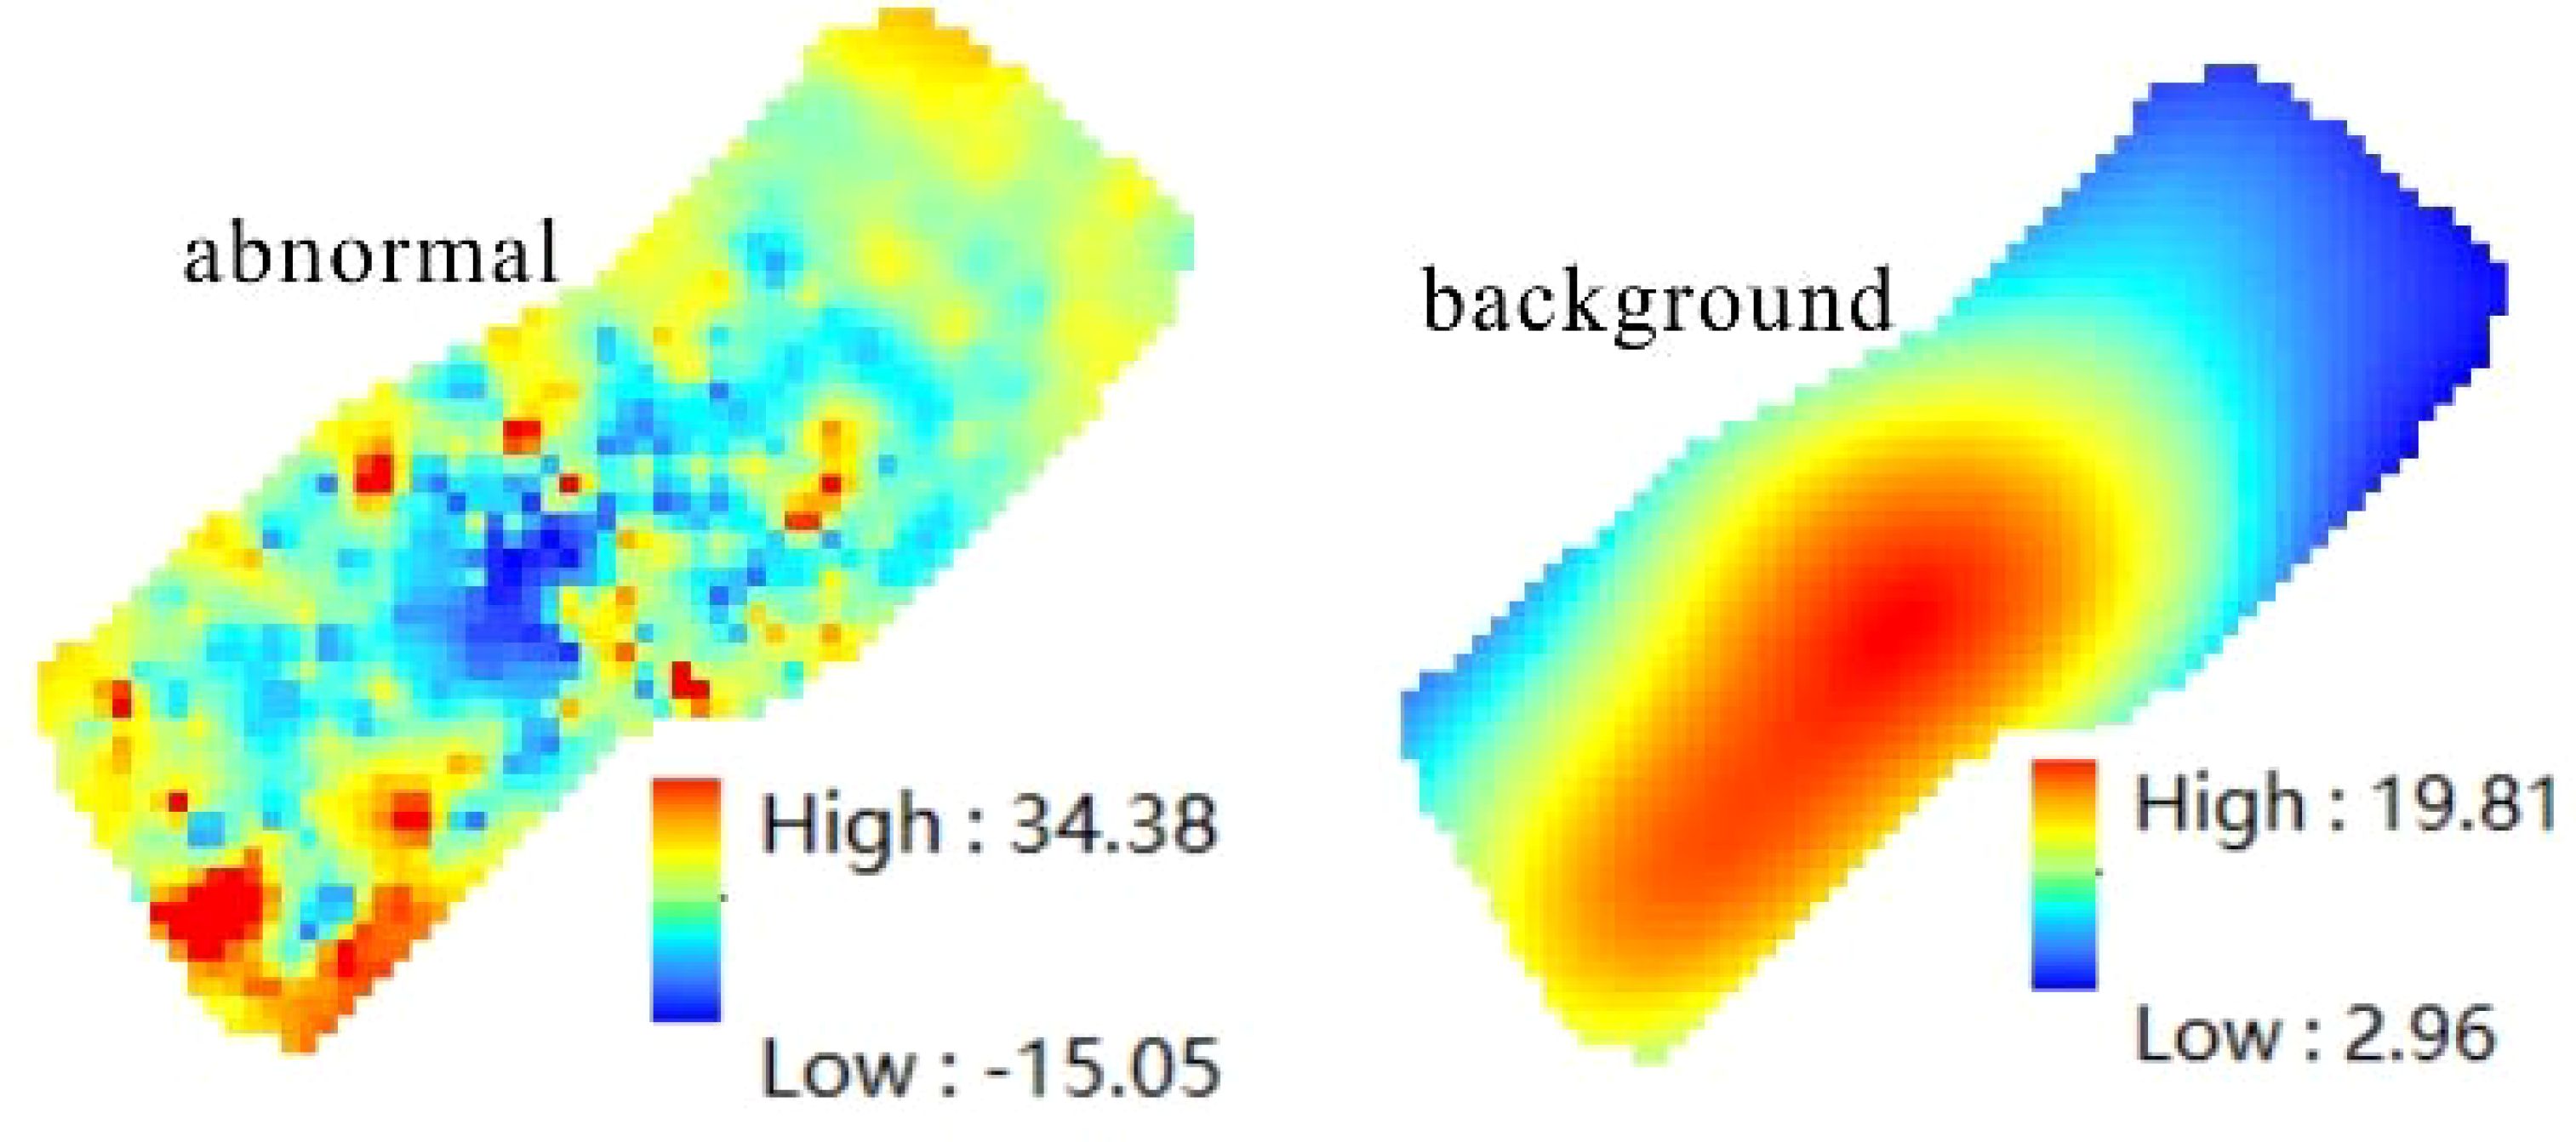
Furthermore, by using the S-A separation to distinguish between the background and anomalies (Figure 12), it is found that the microbial anomalies in the working area (Jinjiang Depression and Jiulongjiang Depression) exhibit a northeast-southwest belt-like distribution, which is consistent with the trend of the depressions and faults. This suggests that the faults in the working area may have a certain control on the distribution of oil and gas in the area.
The anomalies identified in the text were overlaid and analyzed in conjunction with previous research findings. It was found that the microbial anomalies in the working areas (Jinjiang Depression and Jiulongjiang Depression) exhibit a northeast-southwest oriented strip distribution, consistent with the trend of the depressions. There is an enhanced trend of microbial anomalies from the slope towards the depression, with a gradual increase in light hydrocarbon micro-leakage intensity, indicating a better oil and gas prospect towards the depression. Additionally, the microbial anomaly zones correspond well with certain local structures, suggesting that these local structures may have good oil and gas prospects. Other microbial anomalies may be related to various types of traps in the working area, such as lithology, stratigraphy, and ancient buried hills.
5 Conclusions
Previous studies on geochemical anomalies have predominantly utilized multivariate geostatistical methods to differentiate between local anomalies and regional backgrounds. Various statistical methods have been compared with the fractal approach introduced by Cheng Qiuming. The C-A and S-A methods have proven effective in separating anomalies and backgrounds by taking into account spatial correlation, geometric shape, and scale invariance.
This research integrates traditional geological statistics with multifractal techniques to identify microbial geochemical anomalies. Using the microbial geochemistry of the Taiwan Strait Basin as a case study, the unique characteristics of microbial geochemical data in the region are investigated. The multifractal method not only assesses the spatial statistical properties of the field but also describes the singularity patterns of local anomalies. In the analysis of microbial geochemical fields, local singularity often indicates the enrichment or depletion patterns of microbial geochemical elements. By combining spatial information with local singularity indices using the multifractal method, microbial geochemical anomaly data can be emphasized. In the Jinjiang Depression, microbial anomalies are primarily concentrated in the southwest and central parts of the study area. These anomalies exhibit a belt-like distribution running northeast-southwest, aligning with the trend of the depression and fault lines, suggesting that faults may influence the distribution of oil and gas in the region.
Data availability statement
The original contributions presented in the study are included in the article/supplementary material. Further inquiries can be directed to the corresponding authors.
Author contributions
YZ: Visualization, Supervision, Project administration, Investigation, Funding acquisition, Data curation, Writing – review & editing, Writing – original draft, Validation, Software, Resources, Methodology, Formal analysis, Conceptualization. LZ: Writing – review & editing, Supervision. ZL: Writing – review & editing, Validation, Resources. FX: Writing – review & editing, Validation, Methodology. YZZ: Writing – review & editing, Validation, Methodology. JZ: Writing – review & editing, Resources. XQ: Writing – review & editing, Resources.
Funding
The author(s) declare financial support was received for the research, authorship, and/or publication of this article. This study was supported by the National Science Foundation of China (42130408), by a project of the China Geological Survey (DD20240088, GZH2012005511, DD20230067), by the National Science Foundation of China (42072324) and by the National Key Research and Development Program of China (No. 2021YFC2800901).
Acknowledgments
The research was supported and assisted by the Taiwan Straits Project Team.
Conflict of interest
The authors declare that the research was conducted in the absence of any commercial or financial relationships that could be construed as a potential conflict of interest.
Publisher’s note
All claims expressed in this article are solely those of the authors and do not necessarily represent those of their affiliated organizations, or those of the publisher, the editors and the reviewers. Any product that may be evaluated in this article, or claim that may be made by its manufacturer, is not guaranteed or endorsed by the publisher.
References
Afzal P., Mirzaei M., Yousefi M., Adib A., Khalajmasoumi M., Zia Zarifi A., et al. (2016). Delineation of geochemical anomalies based on stream sediment data utilizing fractal modeling and staged factor analysis. J. Afr. Earth Sci. 119, 139–149. doi: 10.1016/j.jafrearsci.2016.03.009
Agterberg F. P. (2012). Multifractals and geostatistics. J. Geochem. Explor. 122, 113–122. doi: 10.1016/j.gexplo.2012.04.001
Albanese S., De Vivo B., Lima A., Cicchella D. (2007). Geochemical background and baseline values of toxic elements in stream sediments of Campania Region (Italy). J. Geochem. Explor. 93, 21–34. doi: 10.1016/j.gexplo.2006.07.006
Cao L., Cheng Q. M. (2012). Quantification of anisotropic scale invariance of geochemical anomalies associated with Sn-Cu mineralization in Gejiu, Yunan Province, China. J. Geochem. Explor. 122, 47–54. doi: 10.1016/j.gexplo.2012.08.001
Carranza E. J. M. (2008). “Geochemical anomaly and mineral prospectivity mapping in GIS,” in Handbook of Exploration and Environmental Geochemistry (Elsevier, Amsterdam), 11.
Carranza E. J. M. (2009). “Geochemical anomaly and mineral prospectivity mapping in GIS,” in Handbook of exploration and environmental geochemistry, vol. 11. (Elsevier, Amsterdam).
Cheng Q. M. (1999). “Multifractal interpolation,” in Proceedings of the Fifth Annual Conference of the International Association for Mathematical Geology. Eds. Lippard S. J., Naess A., Sinding- Larsen R.(Trondheim, Norway), 245250. [s.n.].
Cheng Q. M. (2001). Multifractal and geostatistic methods for characterizing local structure and singularity properties of exploration geochemical anomalies. Earth Science-J. China Univ. Geosci. 26, 161–166.
Cheng Q. M. (2006). GIS based fractal/multifractal anomaly analysis for modeling and prediction of mineralization and mineral deposits. In: Harris, J., ed., GIS applications in earth sciences. Geological Association of Canada Special Book, 289–300.
Cheng Q. M. (2007). Mapping singularities with stream sediment geochemical data for prediction of undiscovered mineral deposits in Gejiu, Yunnan Province, China. Ore. Geol. Rev. 32, 314–324. doi: 10.1016/j.oregeorev.2006.10.002
Cheng Q. M. (2018). Singularity analysis of magmatic flare-ups caused by India – Asia collisions. J. Geochem. Explor. 189, 25–31. doi: 10.1016/j.gexplo.2017.08.012
Cheng Q. M. (2023). Singularity of lithosphere mass density over the mid-ocean ridges and implication on floor depth and heat flow. Geosci. Front. 14, 101591. doi: 10.1016/j.gsf.2023.101591
Cheng Q. M., Agterberg F. P., Ballantyne S. B. (1994). The separation of geochemical anomalies from background by fractal methods. J. Geochem. Explor. 51, 109–130. doi: 10.1016/0375-6742(94)90013-2
Cheng Q. M., Agterberg F. P., Bonham-Carter G. F. (1996). A spatial analysis method for geochemical anomaly separtation. J. Geochem. Explor. 56, 183–195. doi: 10.1016/s0375-6742(96)00035-0
Cicchella D., De Vivo B., Lima A. (2005). Background and baseline concentration values of elements harmful to human health in the volcanic soils of the metropolitan and provincial areas of Napoli (Italy). Geochem.: Explor. Environ. Anal. 5, 29–40. doi: 10.1144/1467-7873/03-042
Fyzollahhi N., Torshizian H., Afzal P., Jafari M. R. (2018). Determination of lithium prospects using fractal modeling and staged factor analysis in Torud region, NE Iran. J. Geochem. Explor. 189, 2–10. doi: 10.1016/j.gexplo.2017.09.017
Herzfeld U. C. (1993). A method for seafloor classification using directional variogram, demonstrated for data from the western flank of the Mid-Atlantic Ridge. Mathe. Geol. 25, 901924. doi: 10.1007/bf00891050
Lark R., Patton M., Ander E., Reay D. (2018). The singularity index for soil geochemical variables, and a mixture model for its interpretation. Geoderma 323, 83–106. doi: 10.1016/j.geoderma.2018.02.032
Liu Z., Wang Y., Deng A., Gao H. (2006). Petroleum geological characteristics and petroleum system of Taiwan Strait Basin. Pet. Geol. Exp. 28, 523–528.
Sadeghi B. (2021a). “Concentration-area plot,” in Encyclopedia of Mathematical Geosciences, Encyclopedia of Earth Sciences Series. Eds. Sagar, Daya B., Cheng Q., McKinley J., Agterberg F. (Springer, Cham).
Sadeghi B. (2021b). Concentration-concentration fractal modelling: a novel insight for correlation between variables in response to changes in the underlying controlling geological-geochemical processes. Ore. Geol. Rev. 128, 103875. doi: 10.1016/j.oregeorev.2020.103875
Sadeghi B. (2023). “Variogram,” in Encyclopedia of Mathematical Geosciences. Encyclopedia of Earth Sciences Series. Eds. Daya Sagar B., Cheng Q., McKinley J., Agterberg F. (Springer, Cham.), 1609–1613.
Wang W. L., Cheng Q. M., Zhang S. Y., Zhao J. (2017). Anisotropic singularity: a novel way to characterize controlling effects of geological processes on mineralization. J. Geochem. Explor. 189, 32–41. doi: 10.1016/j.gexplo.2017.07.019
Weng R., Tian J., Chen B. (2012). Petroleum System and Hydrocarbon Potential of the Nanjido Basin. Conference Papers. 85–94.
Xiao F., Chen J. G., Zhang Z. Y., Wang C. B., Wu G. M., Agterberg F. P. (2012). Singularity mapping and spatially weighted principal component analysis to identify geochemical anomalies associated with Ag and Pb-Zn polymetallic mineralization in Northwest Zhejiang, China. J. Geochem. Explor. 122, 90–100. doi: 10.1016/j.gexplo.2012.04.010
Xie S. Y., Cheng Q., Chen G., Chen Z. J., Bao Z. Y. (2007). Application of local singularity in prospecting potential oil/gas targets. Nonlin. Processes Geophys., 14, 285–292, 2007 www.nonlin-processesgeophys.net/14/285/2007/
Yousefi M., Carranza E. J. M. (2015). Prediction-area (P-A) plot and C-A fractal analysis to classify and evaluate evidential maps for mineral prospectivity modeling. Comput. Geosci. 79, 69–81. doi: 10.1016/j.cageo.2015.03.007
Zadmehr F., Shahrokhi S. V. (2019). Separation of geochemical anomalies by concentration-area and concentration-number methods in the Saqez 1:100,000 sheet, Kurdistan. Iranian. J. Earth Sci. 11, 196–204.
Zhang L., Lei Z., Xu H., Shuai Q., Luo S., Qian X. (2019a). Sedimentary features and geological conditions for hydrocarbon generation and accumulation in Taixi Basin. Oil Gas. Geol. 40, 152–161.
Zhang Y., Liu S. Q., Zhang L., Zhou Y. Z., Liang J. Q., Lu J. A., et al. (2022). Application of singularity theory to the distribution of heavy metals in surface sediments of the zhongsha islands. J. Mar. Sci. Eng. 10, 1697. doi: 10.3390/jmse10111697
Zhang L., Xu G. Q., Lin Z. (2019b). Stratigraphic and sedimentary evolution of the northern continental slope of the South China sea and the Taiwan strait, geological publishing house 12, 137–139.
Zhang W. Y., Zhang F. Y., Yang K. H., et al. (2006). Fractal research on quantity of Cobalt-rich crust resources distributed on seamount topography in the Pacific. Acta Sedimentol. Sin. 24, 705–713.
Zuo R., Wang J. (2015). Fractal/multifractal modeling of geochemical data: a review. J. Geochem. Explor. 164, (33–41). doi: 10.1016/j.gexplo.2015.04.010
Keywords: Taiwan Strait Basin, microbiological geochemistry, singularity, spatial autocorrelation, multifractals
Citation: Zhang Y, Zhang L, Lei Z, Xiao F, Zhou Y, Zhao J and Qian X (2024) Analysis of spatial structure and singularity of microbial biogeochemical anomalies in the Taiwan Strait Basin. Front. Mar. Sci. 11:1450243. doi: 10.3389/fmars.2024.1450243
Received: 17 June 2024; Accepted: 16 September 2024;
Published: 07 October 2024.
Edited by:
Frits Agterberg, Canadian Natural Resources, CanadaReviewed by:
Behnam Sadeghi, Commonwealth Scientific and Industrial Research Organisation (CSIRO), AustraliaEric Grunsky, University of Waterloo, Canada
Copyright © 2024 Zhang, Zhang, Lei, Xiao, Zhou, Zhao and Qian. This is an open-access article distributed under the terms of the Creative Commons Attribution License (CC BY). The use, distribution or reproduction in other forums is permitted, provided the original author(s) and the copyright owner(s) are credited and that the original publication in this journal is cited, in accordance with accepted academic practice. No use, distribution or reproduction is permitted which does not comply with these terms.
*Correspondence: Yan Zhang, emhhbmdfeWFuMTExN0AxNjMuY29t; Li Zhang, emhhbmdsaWdtZ3NAcXEuY29t
 Yan Zhang
 Li Zhang1*
 Fan Xiao