- 1Departamento de Biología Marina, Universidad Católica del Norte, Coquimbo, Chile
- 2Centro de Ecología y Manejo Sustentable de Islas Oceánicas (ESMOI), Departamento de Biología Marina, Universidad Católica del Norte, Coquimbo, Chile
- 3Centro de Estudios Avanzados en Zonas Áridas (CEAZA), La Serena, Chile
- 4Climat, Environment, Couplages et Incertitudes (CECI), Université de Toulouse, CNRS, Cerfacs, Toulouse, France
The Humboldt Archipelago (HAp), located off north-central Chile (~28° - 33° S) is one of the most productive marine zones of the Humboldt Current System (HCS). This area lies within a permanent upwelling zone, characterized by two upwelling centers, 100 km apart, that define the Coquimbo Bays System (CBS). The resulting increase in primary productivity and larval retention are mentioned as the main factors that explain the high biodiversity. However, how these upwelling centers interact remains unclear due to the interplay of various physical features such as the general circulation, the meso- and submeso-scale structures (e.g., eddies), and remote and local forcings (e.g., winds, topography) that affect larval transport in the HAp. In this study, we focus on the role played by geostrophic and Ekman currents in controlling the retention (and dispersion) of particles in these centers based on the analyses of satellite data and hydrodynamic model outputs. Lagrangian models are in particular carried out to document particles’ transport during selected oceanic conditions corresponding to whether Ekman transport or geostrophic recirculation prevails or are debilitated. The latitudinal variation of the Ekman transport reveals two maxima at each upwelling center with differences in spatial extent but not in intensity. Mean zonal geostrophic current occurs in alternating flow at each upwelling center. Results of the Lagrangian experiments highlight the importance of the cross-shore geostrophic flow on larval transport, where an increased transport of particles to the north and northwest occurs at the southern upwelling center, while the northern upwelling center (where HAp is located) received particles from the south and retained particles released in the same area, which is related to the cyclonic geostrophic recirculation and lower Ekman transport. Particle retention increased with depth and under the relaxation and downwelling scenarios revealing the importance of wind alternation for larval retention. The CBS could act as an upwelling shadow in the south and an upwelling trap in the north where the onshore flow of geostrophic current could enhance larval retention and recruitment over longer periods when compared with the Ekman transport timescale.
1 Introduction
The Humboldt Current System (HCS) is one of the eastern boundary upwelling systems (EBUS), located along the west coast of South America (Carr and Kearns, 2003; Largier, 2019). There, exists a productive and diverse environment known as The Humboldt Archipelago (HAp) (Thiel et al., 2007; Gaymer et al., 2008) which includes islands, islets, bays, and promontories between 29° and 29.6° S. There, physical, chemical, and biological processes take place that sustain a biodiversity hotspot which is in the worldwide interest of conservation due to several species of birds and marine mammals that inhabit this system and are threatened by anthropogenic activities (Gaymer et al., 2008).
The HAp has had great notoriety for its high productivity attributable to the two upwelling centers, which are often referred to as one primary (Punta Lengua de Vaca) and one secondary (Punta de Choros), based mainly on the latitudinal extent of the low sea surface temperature plume (Acuña et al., 1989; Strub et al., 1998; Thiel et al., 2007). An interesting feature occurring at the headlands is the upwelling filaments that could transport particles further west during active upwelling events (Marín and Delgado, 2007) favoring drift at the surface. However, bays adjacent to the headlands could be exempt from this dynamic, named “upwelling shadow” and “upwelling trap” bays (Largier, 2019), in which retention and recruitment are increased at surface layers. In other zones, recruitment and retention increase when the wind (and therefore Ekman transport) decreases, in which calm winds not only prevent them from drifting but also offer an “optimal environmental window” in terms of turbulence of the water column necessary for prey encounter and vertical aggregations (Botsford et al., 2003; Ayón et al., 2008; Fontana et al., 2016).
In the Coquimbo Bays System (CBS), upwelling favorable winds, associated with the southeast Pacific anticyclone, are present all year round (Strub et al., 1998; Shaffer et al., 1999), alternating between active upwelling (which is more intense during spring) with relaxation periods which has led to being recognized as a permanent upwelling zone (Acuña et al., 1989; Thiel et al., 2007). In this region, as in other eastern boundary systems, wind stress induces upwelling from coastal divergence (Ekman transport) and cyclonic wind stress curl (Ekman pumping) caused by the wind drop-off near the coast (Bravo et al., 2016; Astudillo et al., 2017; Jacox et al., 2018). Due to the mid-to-high latitude extra-tropical storm activity, the upwelling favorable winds in this region are highly variable at synoptic to intraseasonal timescales, particularly in austral winter (Renault et al., 2012).
Along with the Ekman transport (derived from wind stress), cross-shore geostrophic flow (derived from horizontal pressure gradient) can also alter coastal upwelling and Ekman transport (Jacox et al., 2018). This so-called geostrophic compensation has been observed (through models) in other upwelling systems where the upwelling could be reduced by half due to the onshore geostrophic flow (Marchesiello and Estrade, 2010; Alory et al., 2021). Non-linear oceanic dynamics are also at play in coastal upwelling (Gruber et al., 2011), which can modulate the circulation induced by Ekman dynamics. In this regard, it has been observed quasi-zonal striations of geostrophic flow in the Humboldt Current System (25° - 40° S) when a decade or more years of sea level anomaly data are averaged (Belmadani et al., 2017). These striations are indeed alternating bands of eastward/westward flow every 2°-5° of latitude, which are related to mesoscale eddies activity (Capet et al., 2013; Belmadani et al., 2017).
Recently, Buchan et al. (2024), analyzing the spatial distribution of fin and blue whales and their prey in the HAp proposed that geostrophic recirculation could increase zooplankton aggregations that support their feeding ground. However, such a component of the circulation is subject to a large variability due to stub to mesoscale activity, which calls for further investigation. The differences in time scales between geostrophic and ageostrophic flows, and their effect on larval transport are difficult to address (Prants, 2022), particularly with direct measurements, which means a high cost to sustain a monitoring system with oceanographic instruments (Leis et al., 2011). In this regard, satellite observations provide valuable information for oceanographic variability, but have limitations near the coast mainly because of the land-sea contrast, producing a “blind zone” in the final product (Dohan and Maximenko, 2010; Capet et al., 2013). Here we use a modeling approach that allows combining Eulerian and Lagrangian perspectives and overcomes some of the limitations of the observational studies. In particular, the model will be used as a data set in which different scenarios can be selected, taking “typical” situations from Ekman transport (i.e., active upwelling and relaxation) and geostrophic recirculation (i.e., cyclonic and anticyclonic gyres) in the CBS.
2 Methods
2.1 Study area
The domain of the study area ranges from 27.5° to 33.5° S (north-central Chile). The Coquimbo Bays System (CBS) is located between 29.20° - 30.35° S and is flanked by two headlands that are upwelling centers: to the south the Punta Lengua de Vaca headland (30.35° S) and to the north the Punta de Choros headland (29.20° S). The Humboldt Archipelago (HAp) is located between 29.0° - 29.6° S which is in the northern part of the CBS plus Chañaral de Aceituno (Figure 1).
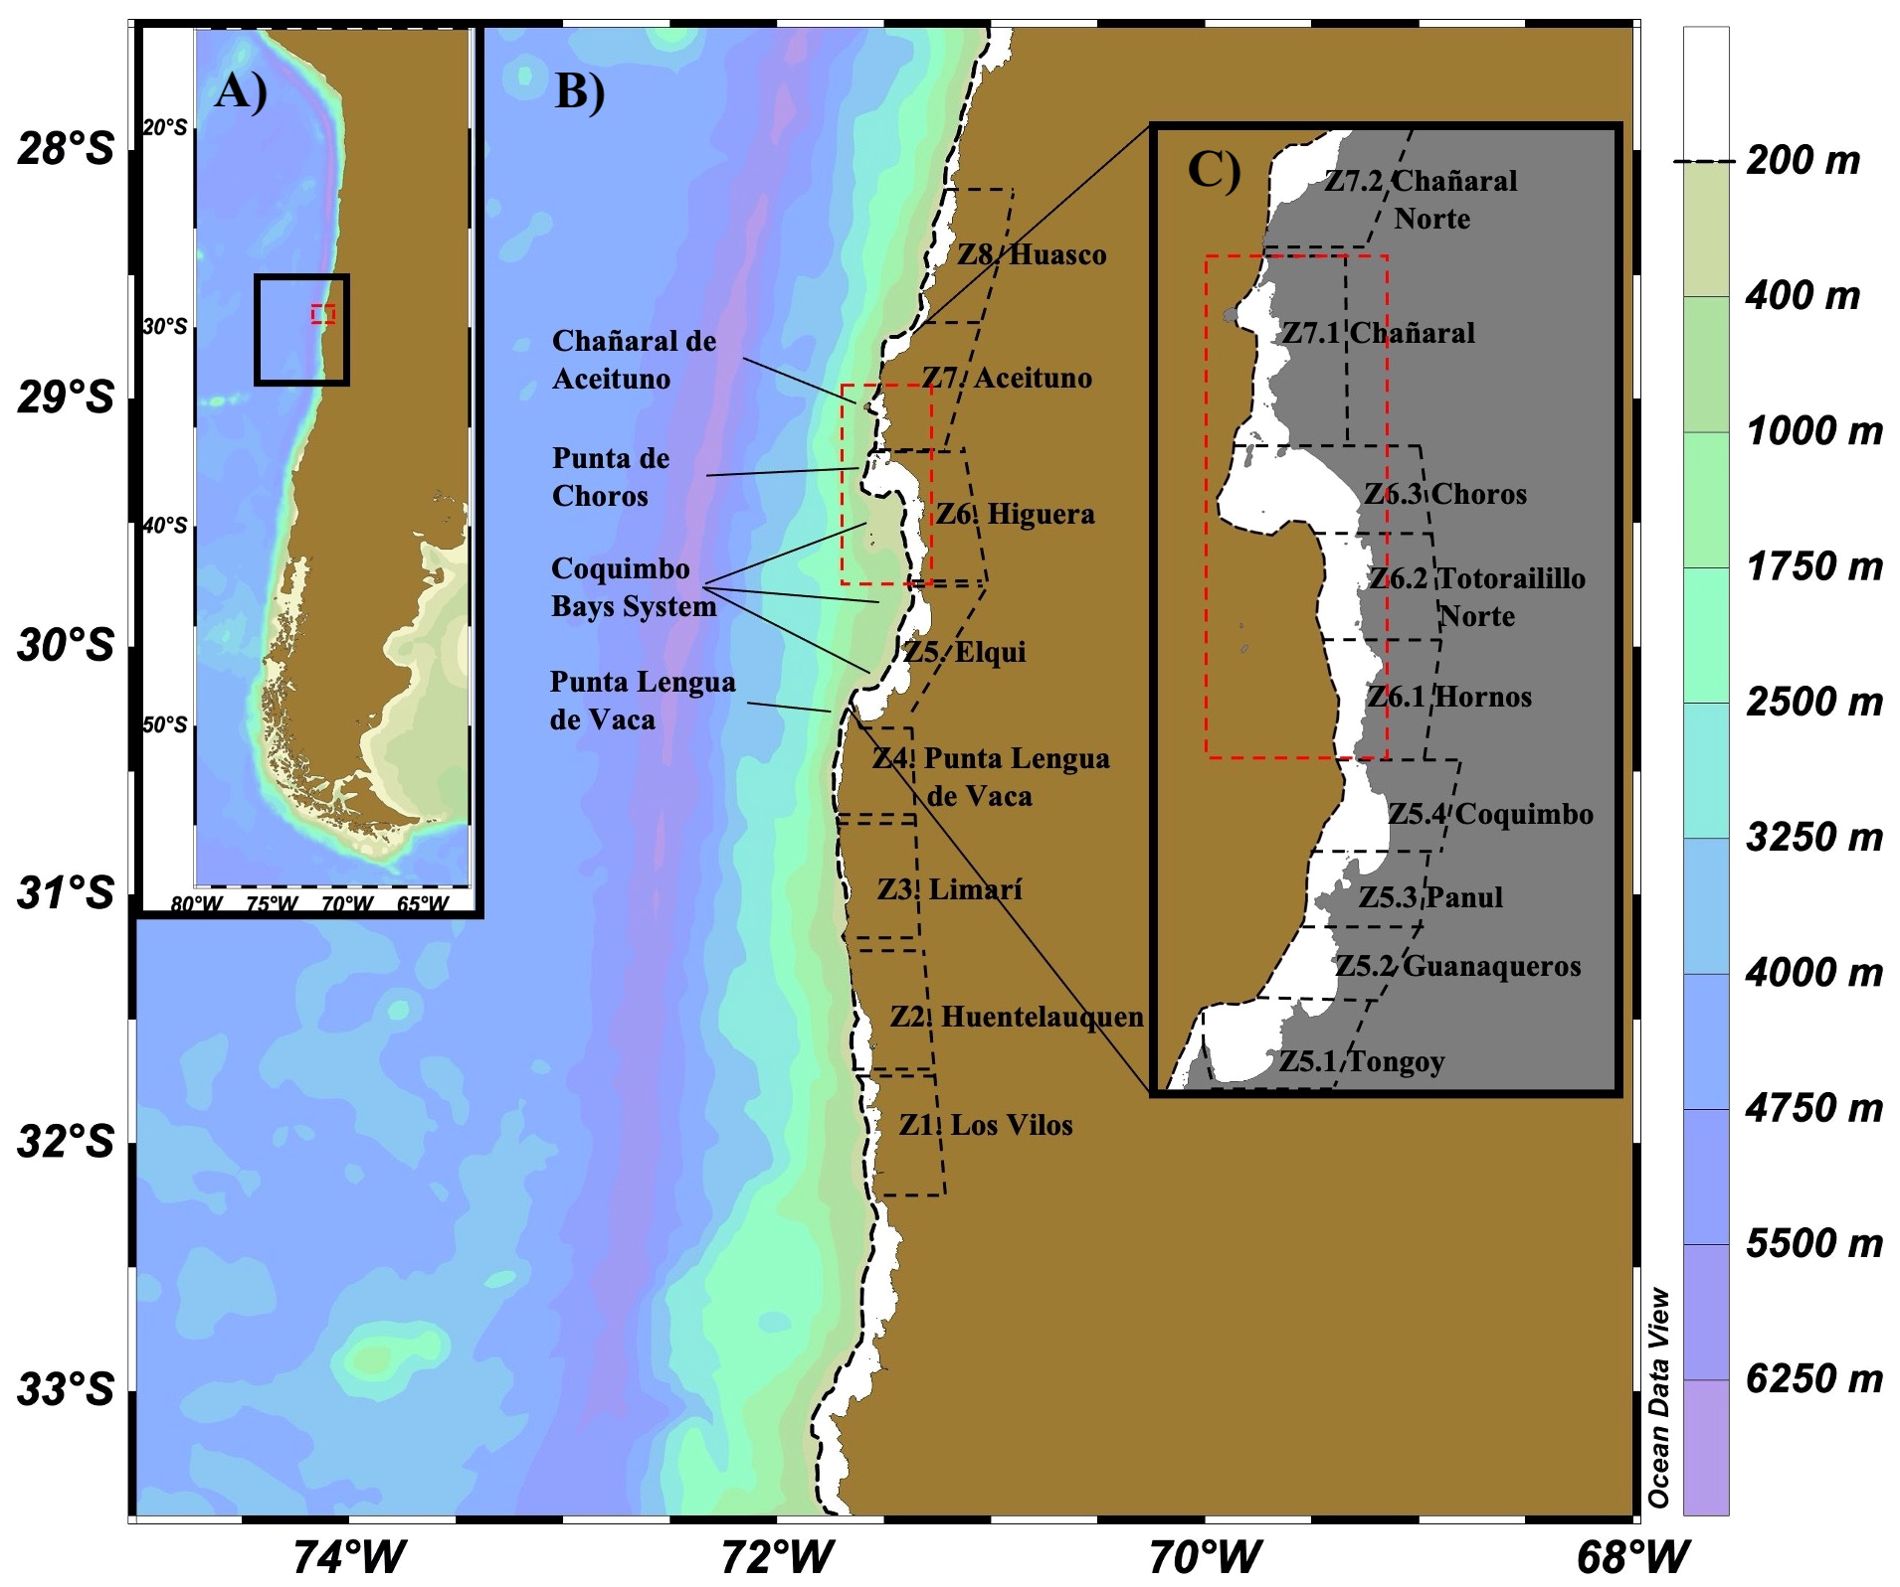
Figure 1. (A) Location of north-central Chile (small map to the left). (B) The hydrodynamical model domain with the release/destination zones (Z1 – Z8) for the Lagrangian Experiments (main map). (C) Zoom in to the Coquimbo Bays System (CBS) and the Humboldt Archipelago (HAp, red dashed polygon) with release/destination sub-zones (see methods).
2.2 Satellite data
Hourly horizontal wind speed (10 m above surface and 0.25° of horizontal resolution) analyzed in this study were taken from ERA 5 reanalysis (Hersbach et al., 2023), for the period 2001-2011 (see Ramajo et al. (2022), for validation against meteorological data in the zone). The altimeter-derived geostrophic currents from AVISO (Archiving, Validation, and Interpretation of Satellite Oceanographic data) with daily temporal resolution and 0.25° of horizontal resolution (Copernicus Climate Change Service, and Climate Data Store, 2018) were used to explore geostrophic gyres in the study area.
Wind stress was derived from ERA 5 wind field following Gill (1982) formula and a non-linear wind drag coefficient based on Large and Pond (1981), modified for low wind speeds (Trenberth et al., 1990). To compute the Ekman transport only meridional wind stress was considered following Kämpf and Chapman (2016) as , where is the average seawater density and is the Coriolis parameter.
Altimeter satellite data was used to validate model mesoscale structures and to explore geostrophic dynamics in the study area and the presence of striations in the region following Belmadani et al. (2017).
2.3 Models
The hydrodynamic model used is the Coastal and Regional Community Model (CROCO, https://croco-ocean.org) built on ROMS_AGRIF (Regional Ocean Model System_Adaptive Grid Refinement in Fortran, Shchepetkin and McWilliams, 2005) and configured for north-central Chile from 27.5° to 33.5° S and 70° to 75° W (Figure 1). The temporal coverage ranges from 1 January 2001 to 31 December 2011 with daily temporal resolution, 1/36° (~3 km) of horizontal and 50 terrain-following vertical levels with higher resolution at surface. Lateral boundary conditions come from MERCATOR GLORYS12V1 reanalysis with 0.08° (~9 km) resolution (daily). Atmospheric forcings are from daily means of ERA5 (Hersbach et al., 2023), with 0.25° (~27 km) resolution. The bottom topography is from the General Bathymetric Chart of the Oceans (GEBCO Bathymetric Compilation Group, 2022), with 15 arcsec (~400 m) resolution. The model ran with a timestep of 150 s, with two spin-up years and averaged results were stored every 24 hours of simulation. Some validation of the simulation is provided in the Appendix (Supplementary Figures 1-3). The mean meridional and zonal simulated currents are reasonably realistic compared to observations (Supplementary Figure 2). An analysis of the mean pattern of the simulated currents in the cross-section of the CBS going from Punta Lengua de Vaca to Punta de Choros (Supplementary Figure 4), and the zonal currents variability based on an Empirical Orthogonal Functions (EOF) analysis, were carried out (Supplementary Figure 5). Noteworthy that the model outputs represent opposing flows in the CBS in the mean zonal component (cyclonic recirculation) and the first mode of EOF shows an alternance of this recirculation.
A Lagrangian tool (Ichthyop v.3.3.6, Lett et al., 2008) was coupled to the hydrodynamic model to simulate particle transport. Simulated particles are characterized by their position (latitude, longitude, depth) in the 3D circulation field of the hydrodynamical model in which they move following a Runge-Kutta 4th-order advection scheme. The Ichthyop model has been previously used on the Chilean coast, as an individual-based model for fish species (i.e., Soto-Mendoza et al., 2012; Flores et al., 2020), and crustacean species (i.e., Yannicelli et al., 2012; Meerhoff et al., 2018), and others invertebrates (i.e., Garavelli et al., 2016; Blanco et al., 2019).
2.4 Scenarios criteria
Typical situations from Ekman transport and geostrophic recirculation were defined to perform Lagrangian experiments by releasing virtual particles. Time series of daily averaged Ekman transport (Figure 2) and zonal geostrophic currents (Figure 3), located at Punta Lengua de Vaca and Chañaral de Aceituno were used for the selection of the events. Thresholds were defined based on the variance (σ2) and the maximum and minimum values of each series, to ensure distinction between scenarios.
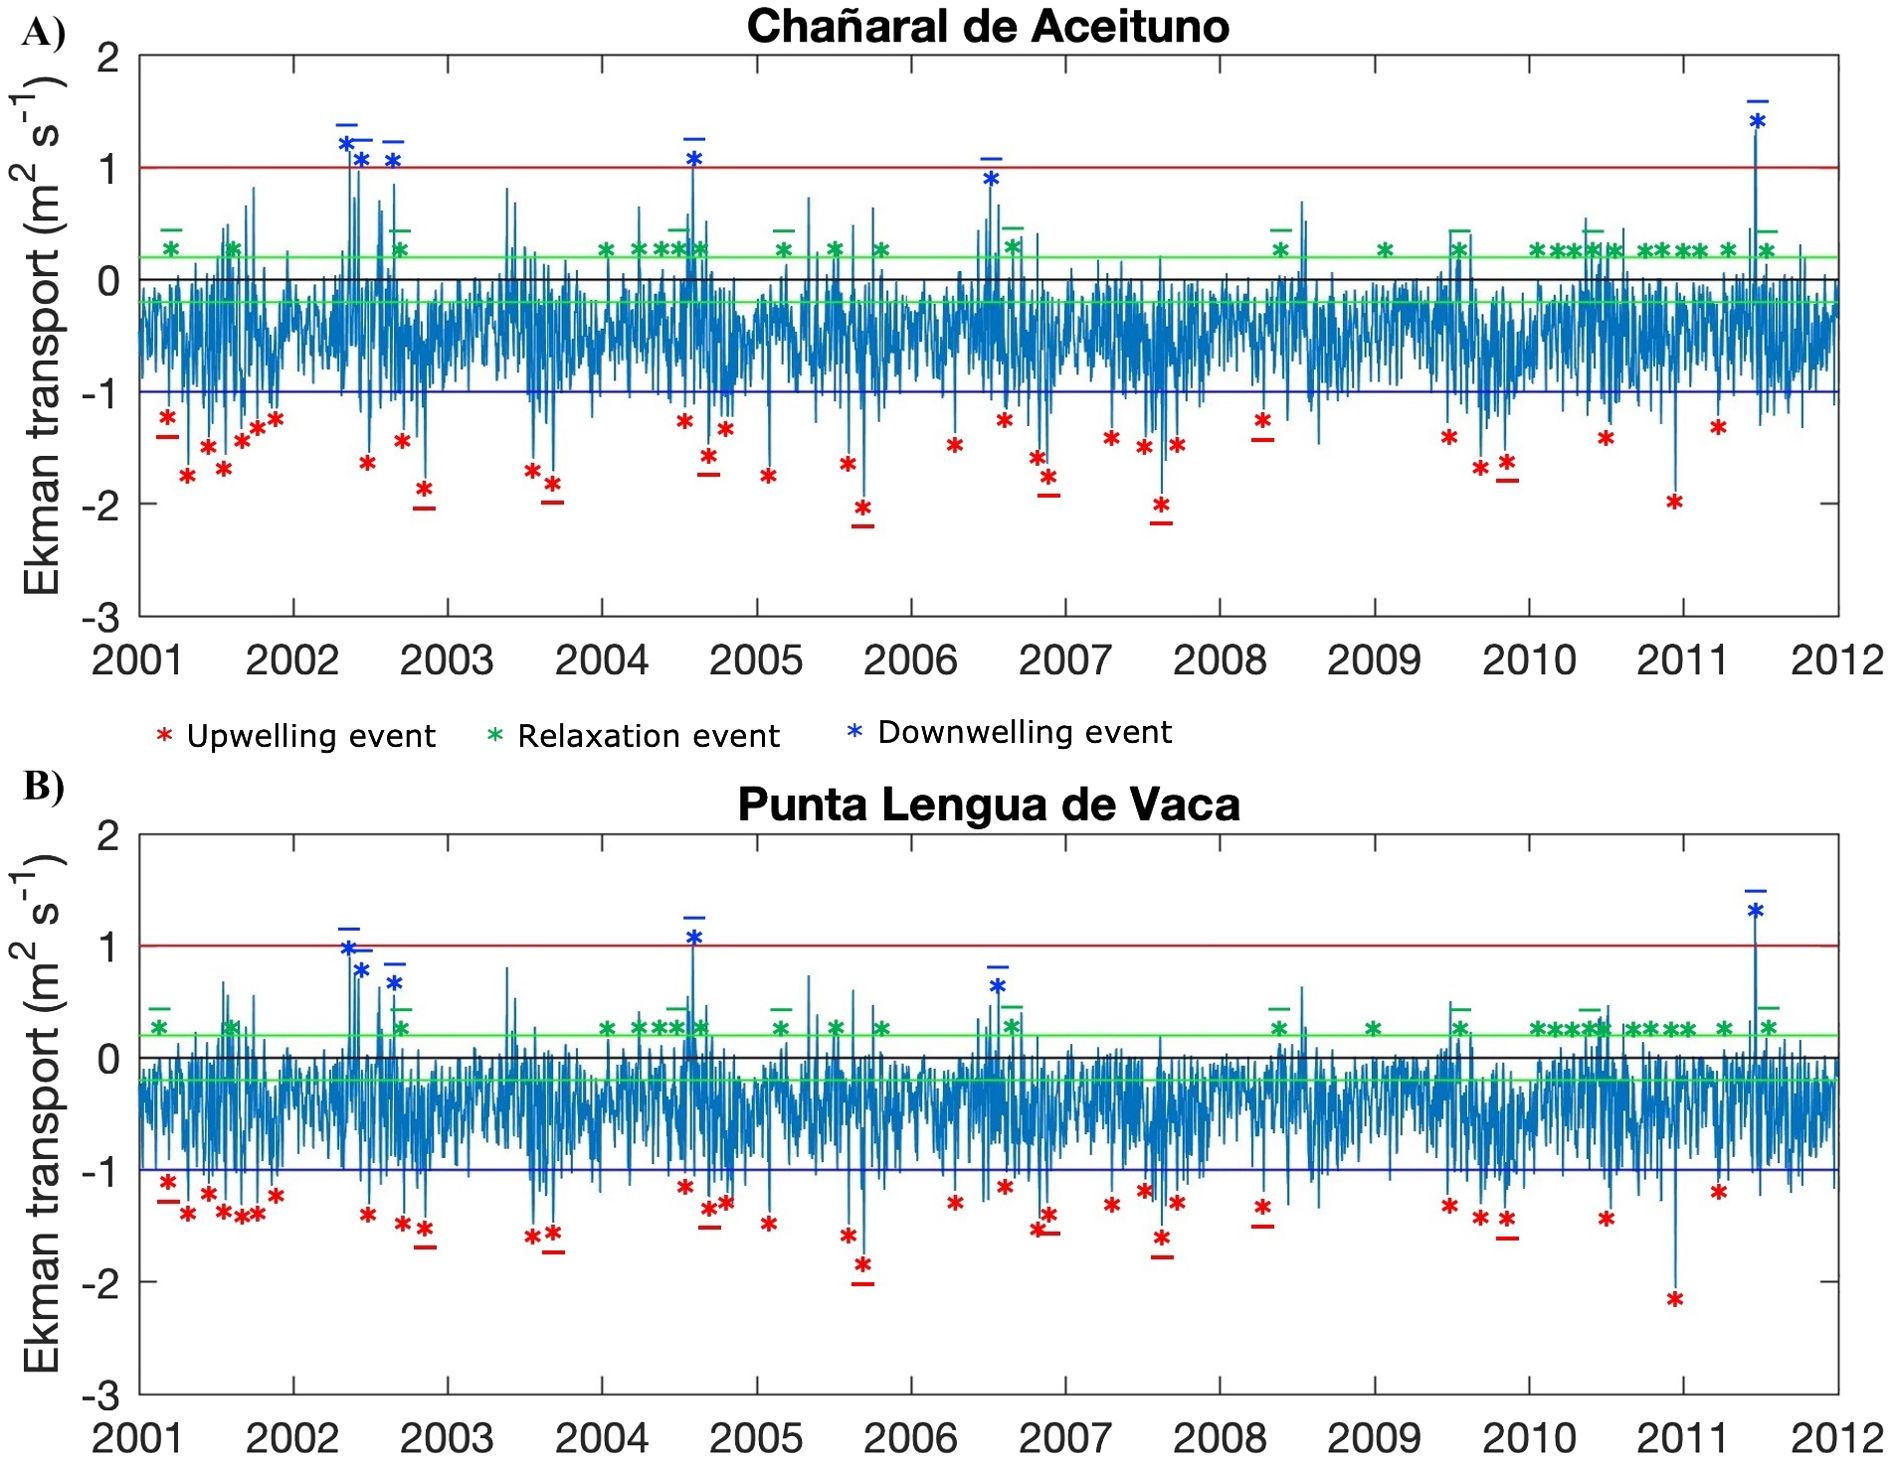
Figure 2. The Ekman transport time series (m2 s-1) for both headlands: (A) Chañaral de Aceituno and (B) Punta Lengua de Vaca. The horizontal red, green, and blue lines mark the threshold for the upwelling, relaxation, and downwelling scenario criteria. Underlined asterisks ( * ) are the events used in the Lagrangian model. (see methods).
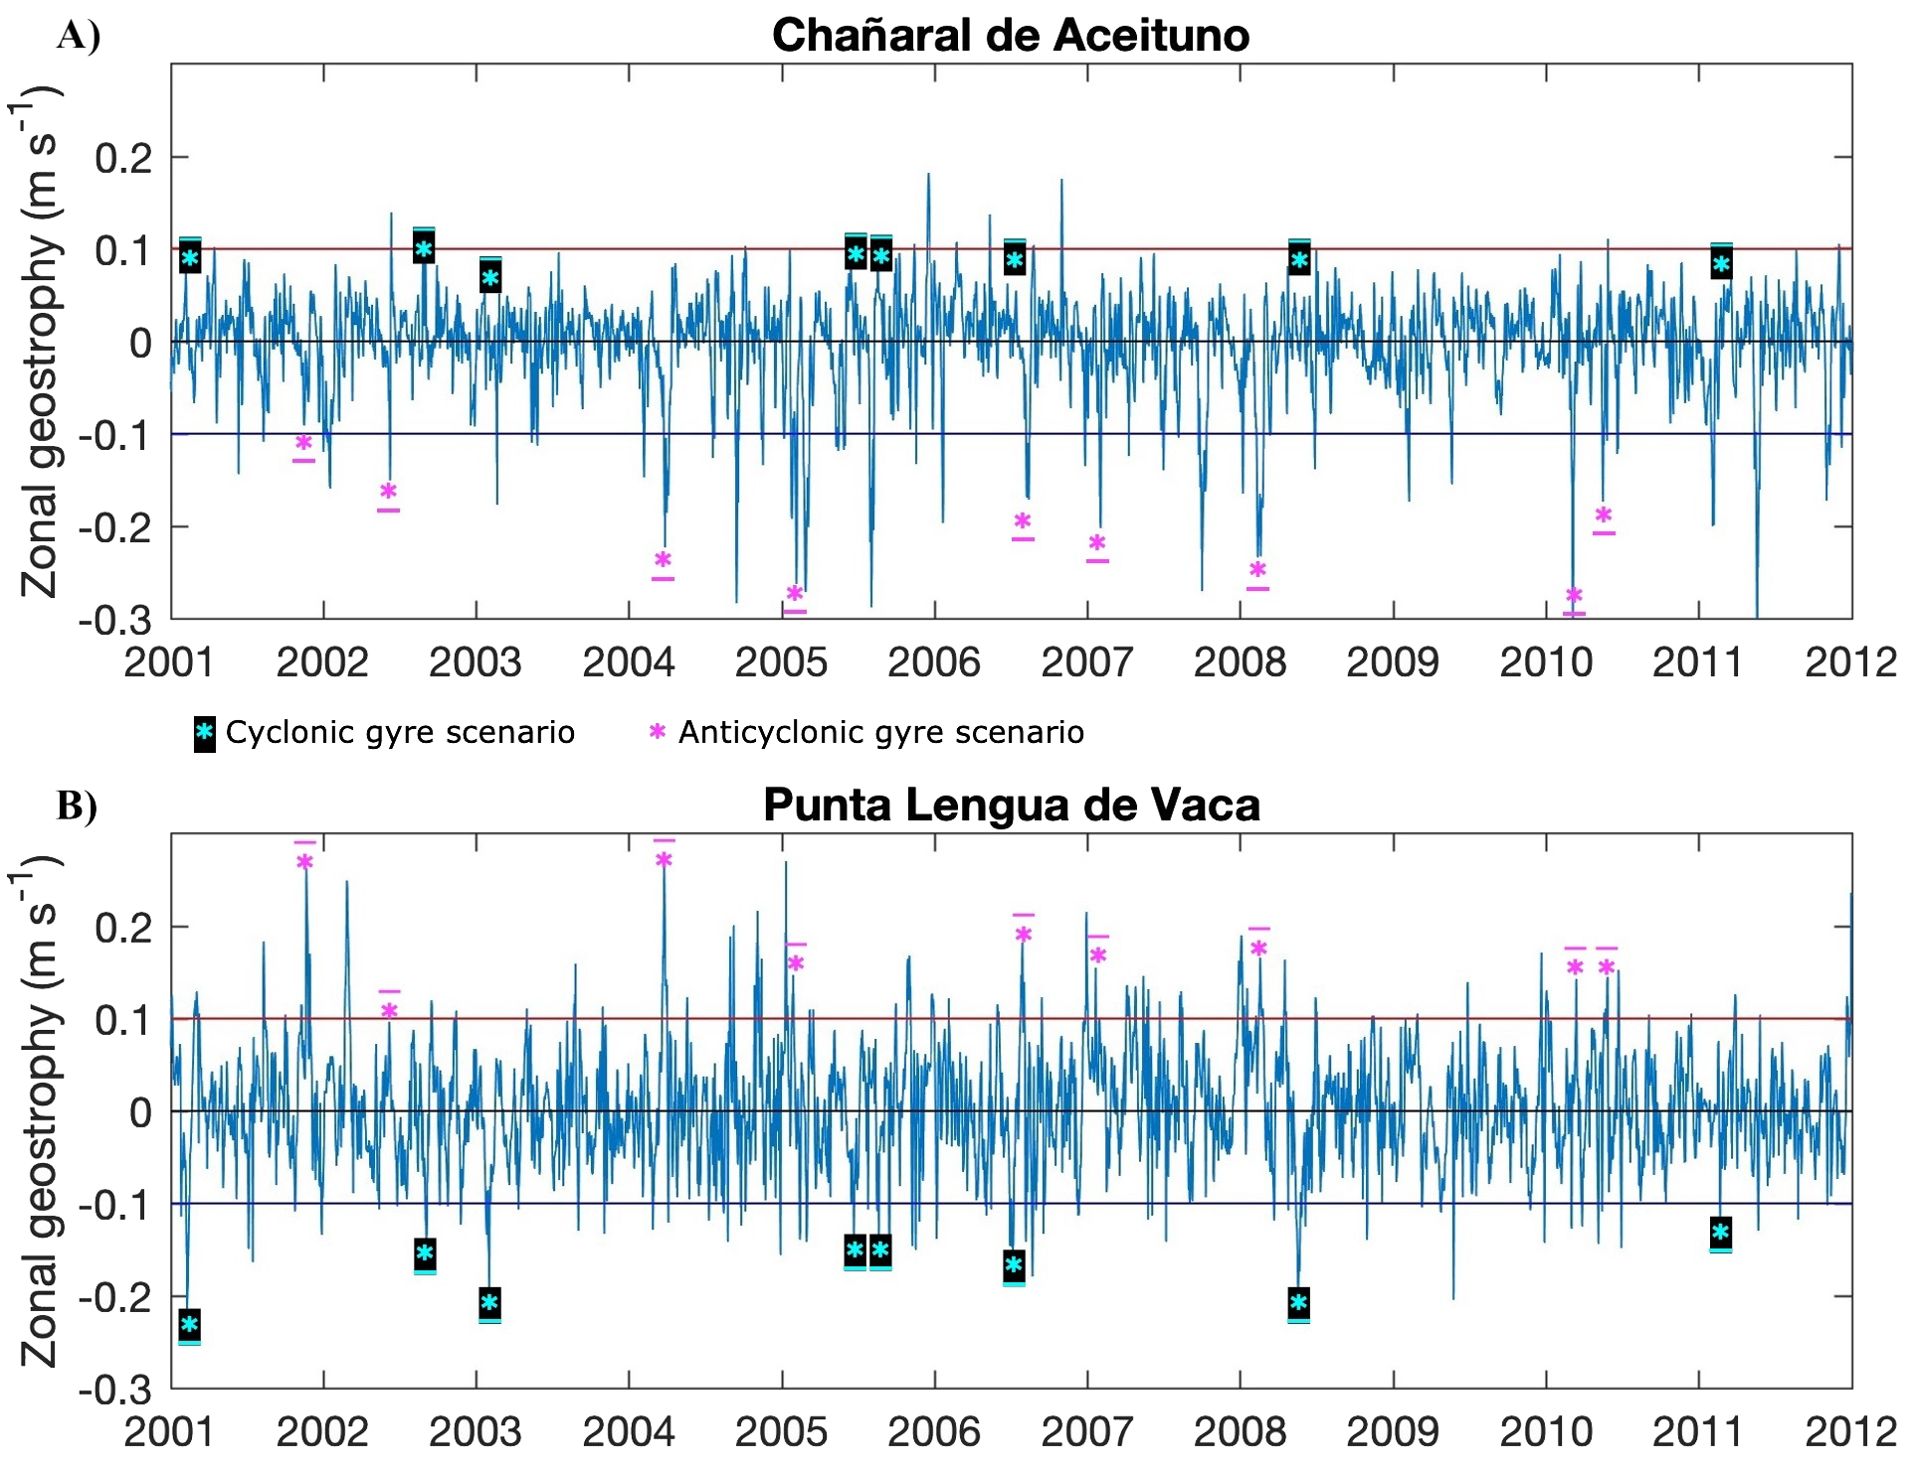
Figure 3. The zonal geostrophy time series (m s-1) for both headlands: (A) Chañaral de Aceituno and (B) Punta Lengua de Vaca. The horizontal red and blue lines mark the threshold for the cyclonic and anticyclonic scenarios criteria. Underlined asterisk ( * ) marks the events used in the Lagrangian model.
In the Ekman transport time series, three different scenarios were defined: a) strong upwelling (offshore Ekman transport) when values pass below the threshold (-3*σ) of -1 (m2 s-1), b) upwelling relaxation (near zero Ekman transport, ±0.06*σ) when values range between -0.02 and 0.02 (m2 s-1), and c) downwelling (onshore Ekman transport) when values pass above the threshold of (+3*σ) 1 (m2 s-1) (Figure 2).
In the zonal geostrophic current time series, two scenarios were defined by setting thresholds (±1.75*σ) in each time series of 0.1 and -0.1 (m s-1) (Figure 3) and recording periods where the zonal flow was opposite at each location (i.e., onshore zonal geostrophic current at Chañaral de Aceituno and offshore zonal geostrophic current at Punta Lengua de Vaca at the same period) resulting in d) cyclonic gyre scenario and e) anticyclonic gyre scenario.
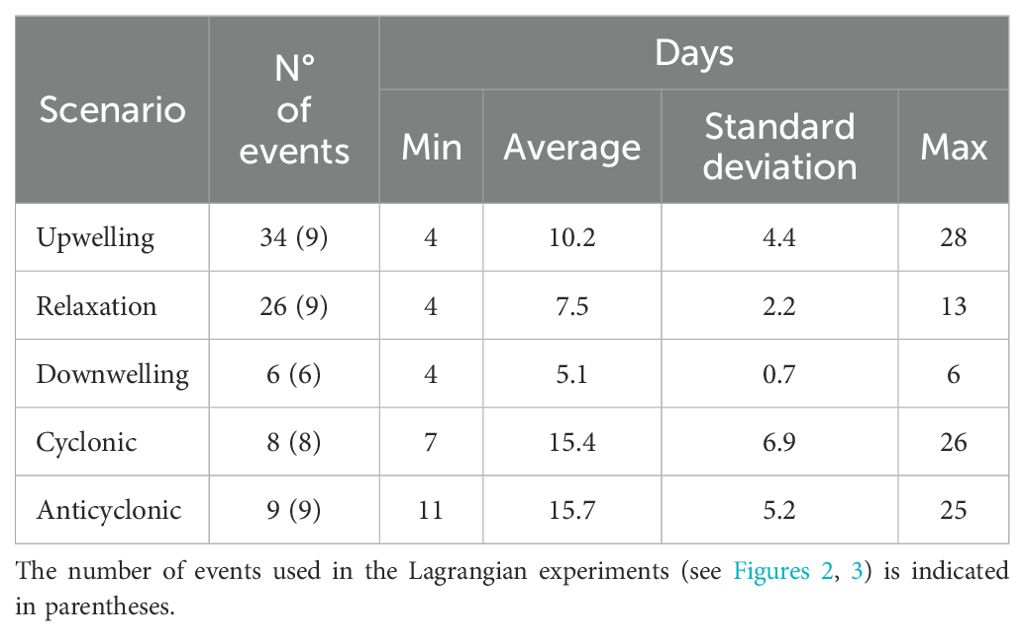
Another criterion applied to the five scenarios (the three from Ekman transport and the two from geostrophic recirculation) was the duration of the event (Table 1), which had to be greater than four days. Brief events of less than four days were not considered for this study.
2.5 Lagrangian experiments
2.5.1 Release/destination zones and number of particles
Eight release zones (Z1 – Z8) were defined along the coast of north-central Chile (27.5° - 33.5° S), each with about ~50 km of coastline and delimited by the 200 m isobath (Figure 1). In each zone a total of 10,000 (ten thousand) particles were released (meaning 80,000 particles were released into the domain per experiment). The Z5 release zone was subdivided into four sub-zones (Z5.1 – Z5.4) of ~ 10 – 14 km of coastline, releasing 2,500 particles in each sub-zone (to complete 10,000 in the total of particles from Z5). The Z6 was subdivided into three sub-zones (Z6.1 – Z6.3) of ~ 15 – 19 km of coastline, releasing 3,334 in Z6.1 and 3,333 in Z6.2 and Z6.3 (to complete 10,000 in the total of particles from Z6). The Z7 was subdivided into two sub-zones (Z7.1 and Z7.2) of ~25 km of coastline, releasing 5,000 particles in each sub-zone (to complete 10,000 in the total of particles from Z7). Each release zone was also defined as a destination zone where particles were counted at the end of the transport duration (e.g., recruited particles).
2.5.2 Transport duration and scenarios for the experiments
The transport duration was established according to the period of the different events per scenarios (Table 1). All particles were released at three fixed depths of 5, 40, and 100 m and followed a Runge-Kutta 4th-order advection scheme. The experiments were performed separately for each event: nine for upwelling, relaxation, and anticyclonic experiments, eight for cyclonic experiments, and six for downwelling experiments (Figures 2, 3, underlined asterisks). The particles move passively during the transport period conditioned to the oceanographic dynamics of each event per scenario, then from the fifth day of transport, the Lagrangian model starts recording their presence in each destination zone. At the end of the sixth day of transport, the median of distance of particles from their release point, the number of recruited particles, and the number of particles retained were calculated and averaged among the experiments of the same scenario.
Trajectories of particles were also computed for a few selected representative events per scenario that promote horizontal advection or favor retention at each depth.
3 Results
3.1 Oceanographic conditions
Wind analysis for the period 2001-2011, shows two peaks of wind stress at the headlands (Figure 2) and the related Ekman transport in which the southern upwelling center appears more meridionally extended (from ~31° to ~30° S) and with seasonal variability (stronger during spring, weaker during winter) than the northern upwelling center which is bounded to ~29° S and less seasonal variability (Figure 4). In the other hand, it is observed an onshore decay in wind intensity, known as the wind drop-off with latitudinal variability associated with the topography and shape of the coastline, being more spatially extended inside the CBS and north of 29.5°S and minimum at the headlands and south of 30.5°S.
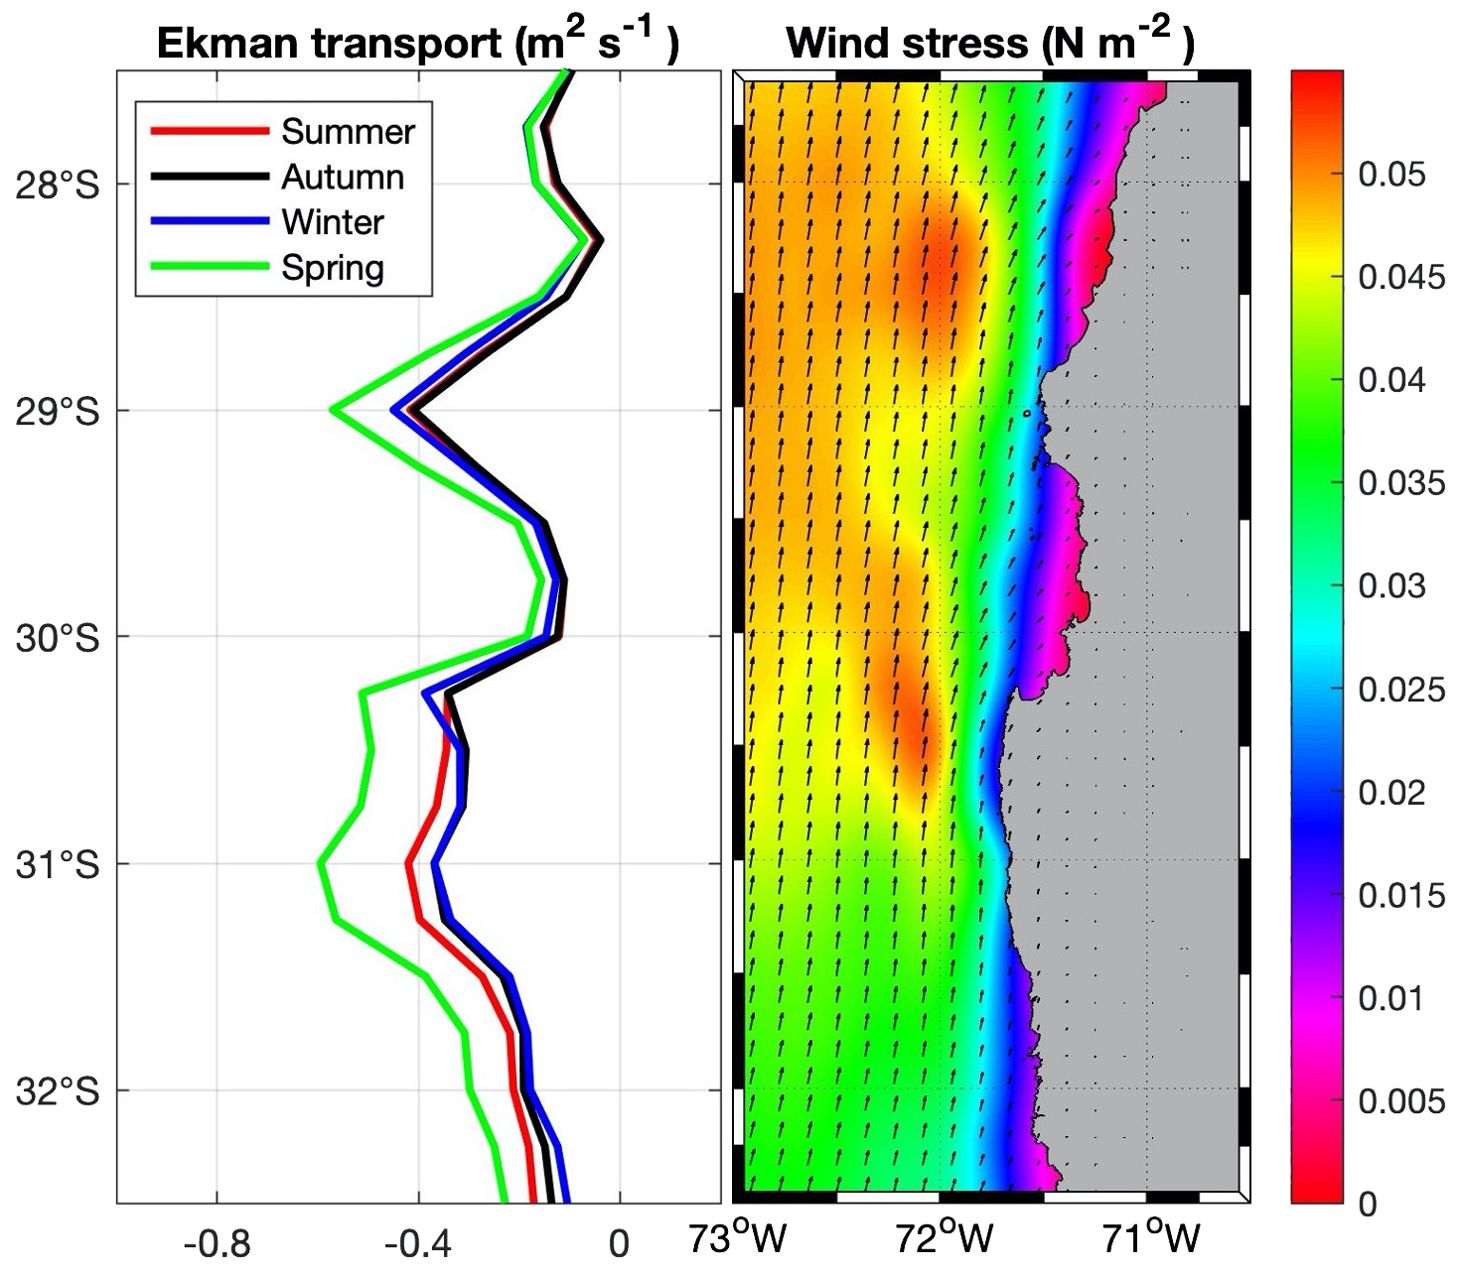
Figure 4. Left panel, seasonal mean of the Ekman transport (m2 s-1). Right panel, mean wind stress (N m-2). Both panels are for the period 2001-2011 from ERA 5 reanalysis of horizontal wind velocities.
The mean geostrophic zonal currents for the period 2000-2011 from AVISO product, shows some alternating zonal bands with positive zonal geostrophic component (onshore) at ~32° S, negative zonal geostrophic component (offshore) at ~30° S (Punta Lengua de Vaca) and positive zonal geostrophic component at ~28.5° (Chañaral de Aceituno to the north. Figure 5). We do not expect that the mean geostrophic zonal current of the model matches that of the AVISO product because the model simulates intrinsic variability not constrained by the atmospheric and boundary forcings. However, the regional model can account realistically for the main characteristics of these striations as noted in previous studies (Belmadani et al., 2017). Noteworthy an onshore zonal geostrophic band in the northern part of the study domain is observed in both the satellite data and model output.
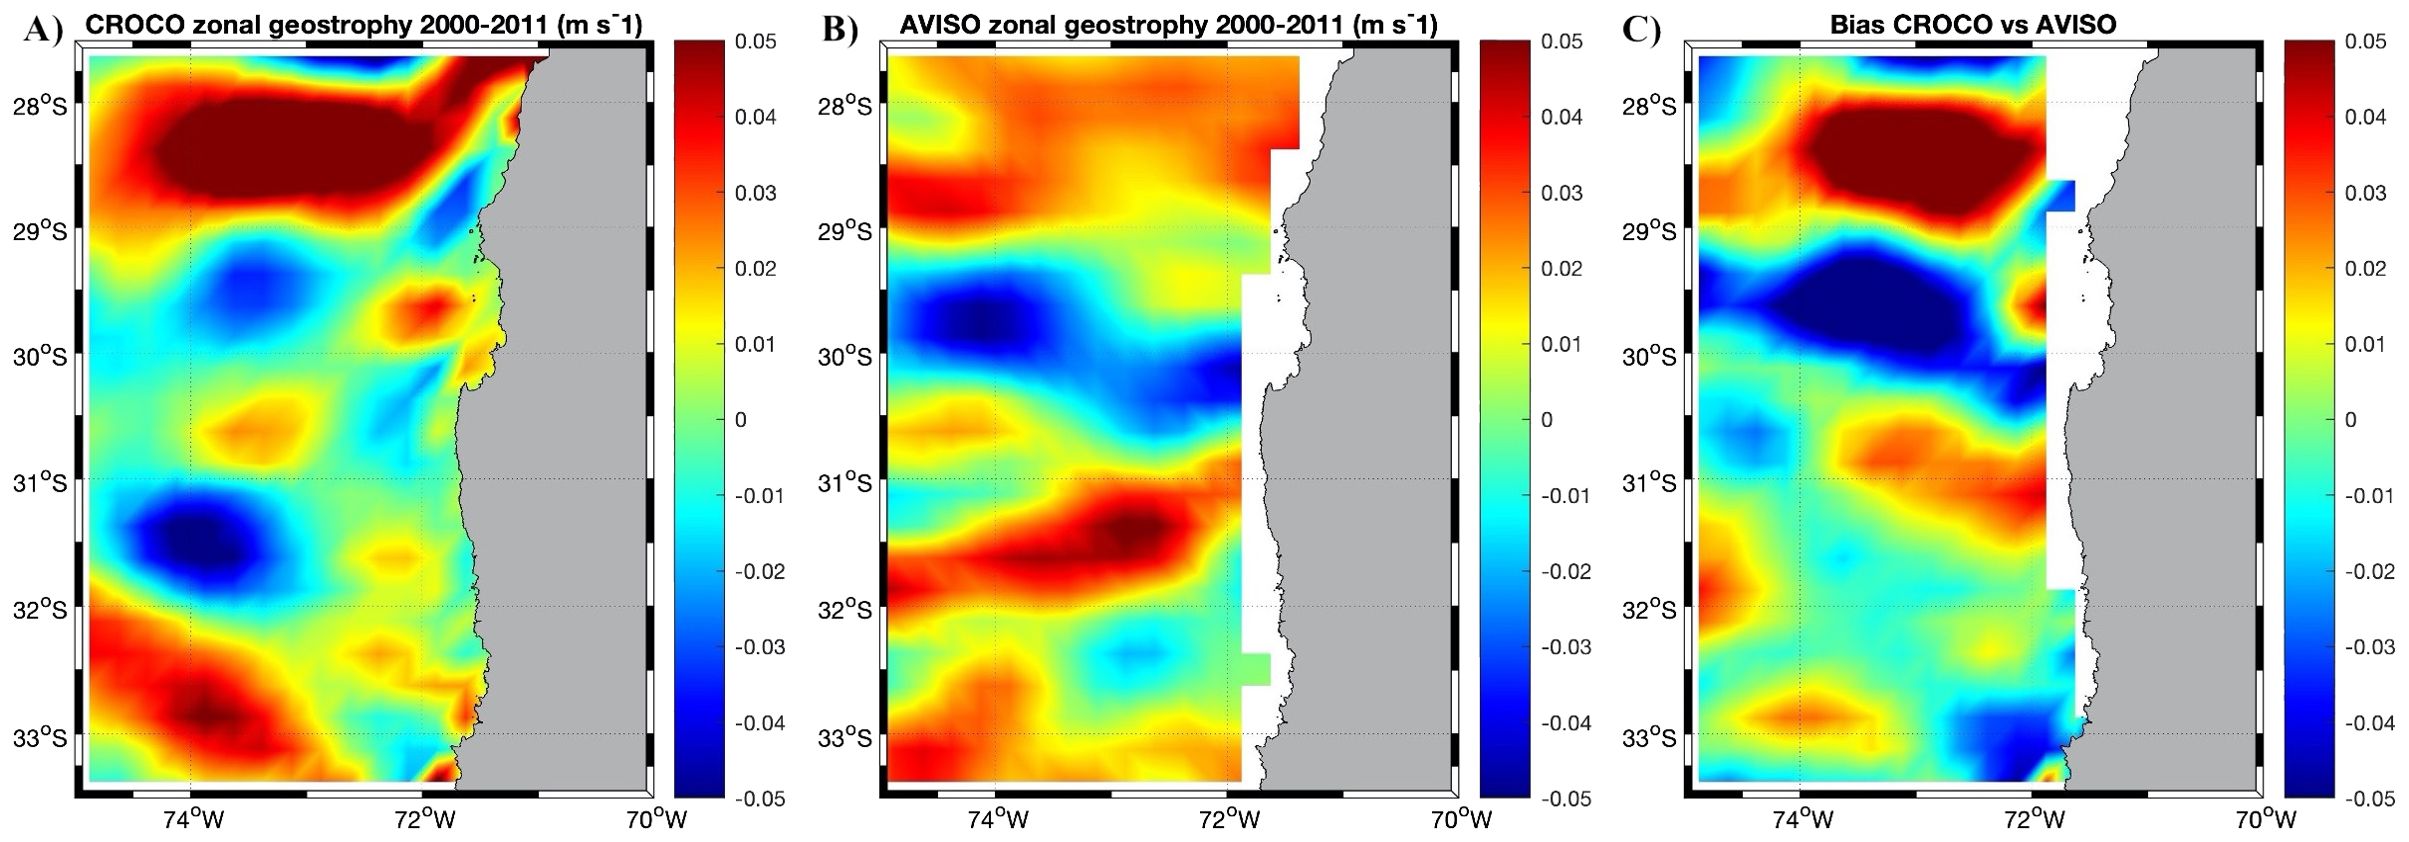
Figure 5. Mean zonal geostrophic current (m s-1) from altimetry of (from left to right) (A) the CROCO model, (B) AVISO product, and (C) the difference between the model and satellite data, for the period of 2000-2011. Note that we do not expect that the zonal geostrophy of CROCO matches exactly with the AVISO product.
Altogether, the Ekman transport and the geostrophic currents account for different regimes for each upwelling center, where the northern upwelling center could be limited by the onshore geostrophic flow, while, the southern upwelling center (which is more spatially extended) could be enhanced by the offshore geostrophic flow. Between the headlands, inside the CBS, occurs the more extended wind drop-off of the study domain (~45 km), where less Ekman transport (from coastal divergence) is reported.
3.2 Scenarios
In the temporal coverage of the hydrodynamic model (2001-2011), the time series of Ekman transport varied simultaneously at both headlands, however, the three scenarios differed in occurrence and duration (Table 1). The average duration of upwelling, relaxation period, and downwelling events were 10, 7, and 5 days respectively. Upwelling events were more frequent (34 events) and of longer duration during spring meanwhile downwelling events were very few and ephemeral (periods less than six days and mainly during the winter season). Only six events in the eleven years analyzed fulfilled the downwelling criteria defined in this study (Table 1). The zonal geostrophic time series had high variability in which some inverse correlation was expected between the headlands. Only eight and nine events between the years 2001-2011 were found with the cyclonic and anticyclonic geostrophic recirculation criteria respectively. The averaged events duration of cyclonic and anticyclonic scenarios was 15.4 and 15.7 days respectively. In both geostrophic scenarios, an onshore geostrophic flow in the northern part of the study area (~28° S, near Huasco, Supplementary Figure 6) was registered which agrees with both satellite and model-averaged geostrophic field.
3.3 Lagrangian experiments
Figure 6 displays the distance traveled by particles from their origin on the fifth day of transport. It indicates that the distances were dissimilar between scenarios, zones, and depths. For surface particles (5 m depth), the maximum distance was in the headlands (upwelling centers, Z4 and Z7) but in different scenarios: in the southern upwelling center (Punta Lengua de Vaca) the maximum distance takes place during the relaxation period meanwhile in the northern upwelling center (Chañaral de Aceituno) it is during the active upwelling event (Figure 6A). Inside the CBS the particles traveled further from their origin during active upwelling and during the anticyclonic gyre scenario and the minimum distances were during the relaxation and downwelling event (Figure 6A). For the 40 m depth (Figure 6B), the scenarios of relaxation and cyclonic gyre had the maximum distances traveled by particles and the scenario of active upwelling had the minimum distances. For the 100 m depth, during the cyclonic gyre scenario, the particles moved further from their origin and, conversely, in the anticyclonic scenario, had the minimum distances (Figure 6C).
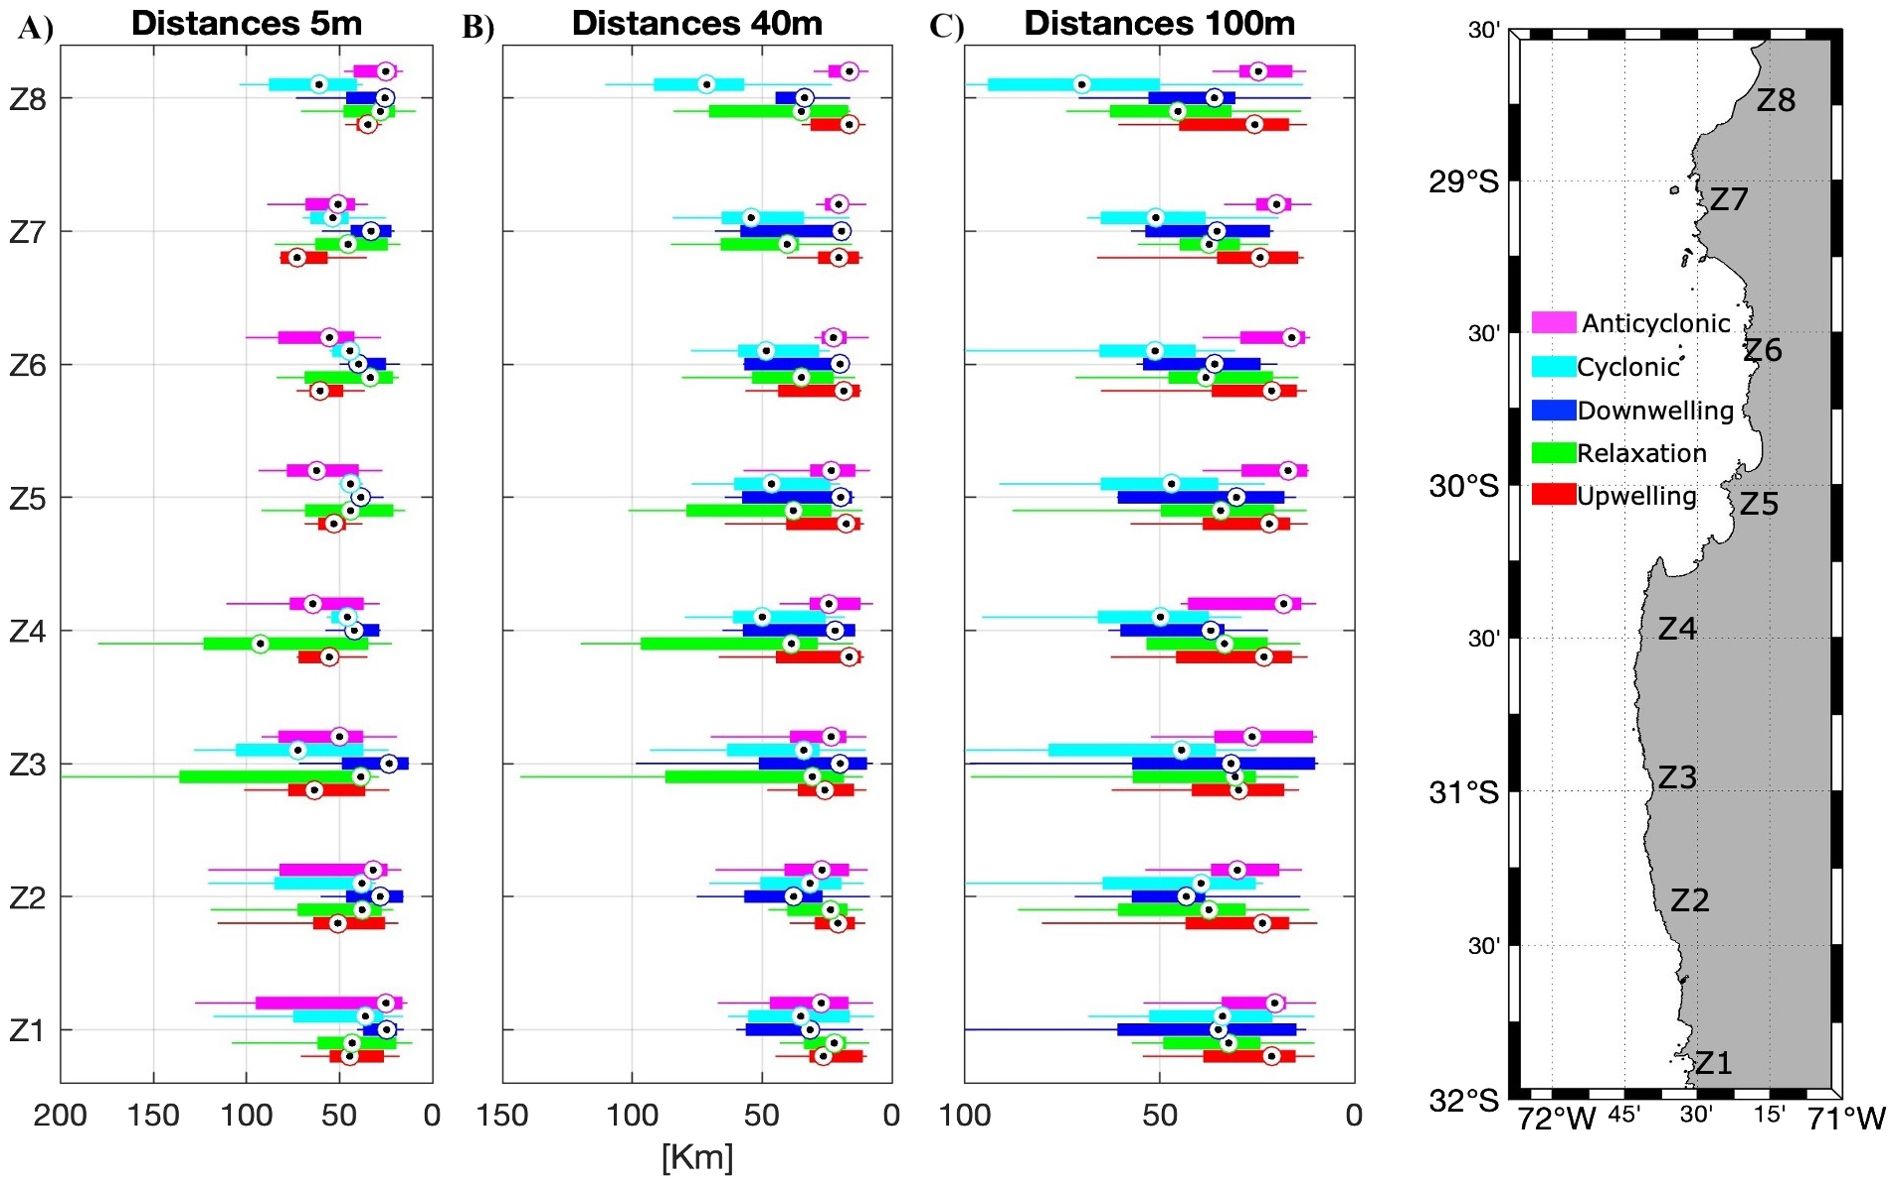
Figure 6. Boxplots of the median distances (km) traveled by particles on the fifth day of transport, for the different zones (n=8, with grouped subzones), scenarios, and depths: (A) 5 m, (B) 40 m and (C) 100 m. Number of scenarios averaged: Upwelling, Relaxation, and Anticyclonic scenarios n=9, Cyclonic scenarios n=8, Downwelling scenarios n=6.
Retention time (residence time) also varied between scenarios, zones, and depth. At the surface, the median retention time was similar in the zones to the south of Punta Lengua de Vaca (Z1 – Z4) and increased in the CBS (Z5, Z6), being the relaxation period with the longest retention time (Figure 7A). At 40 m depth, retention time increased, especially in the anticyclonic scenario to the south of Punta Lengua de Vaca and in the CBS during the upwelling and relaxation period (Figure 7B). Conversely, at 100 m depth retention time decreased, except in the anticyclonic scenario which had the longest retention time among all scenarios and depths in the Higuera zone (Z6, Figure 7C).
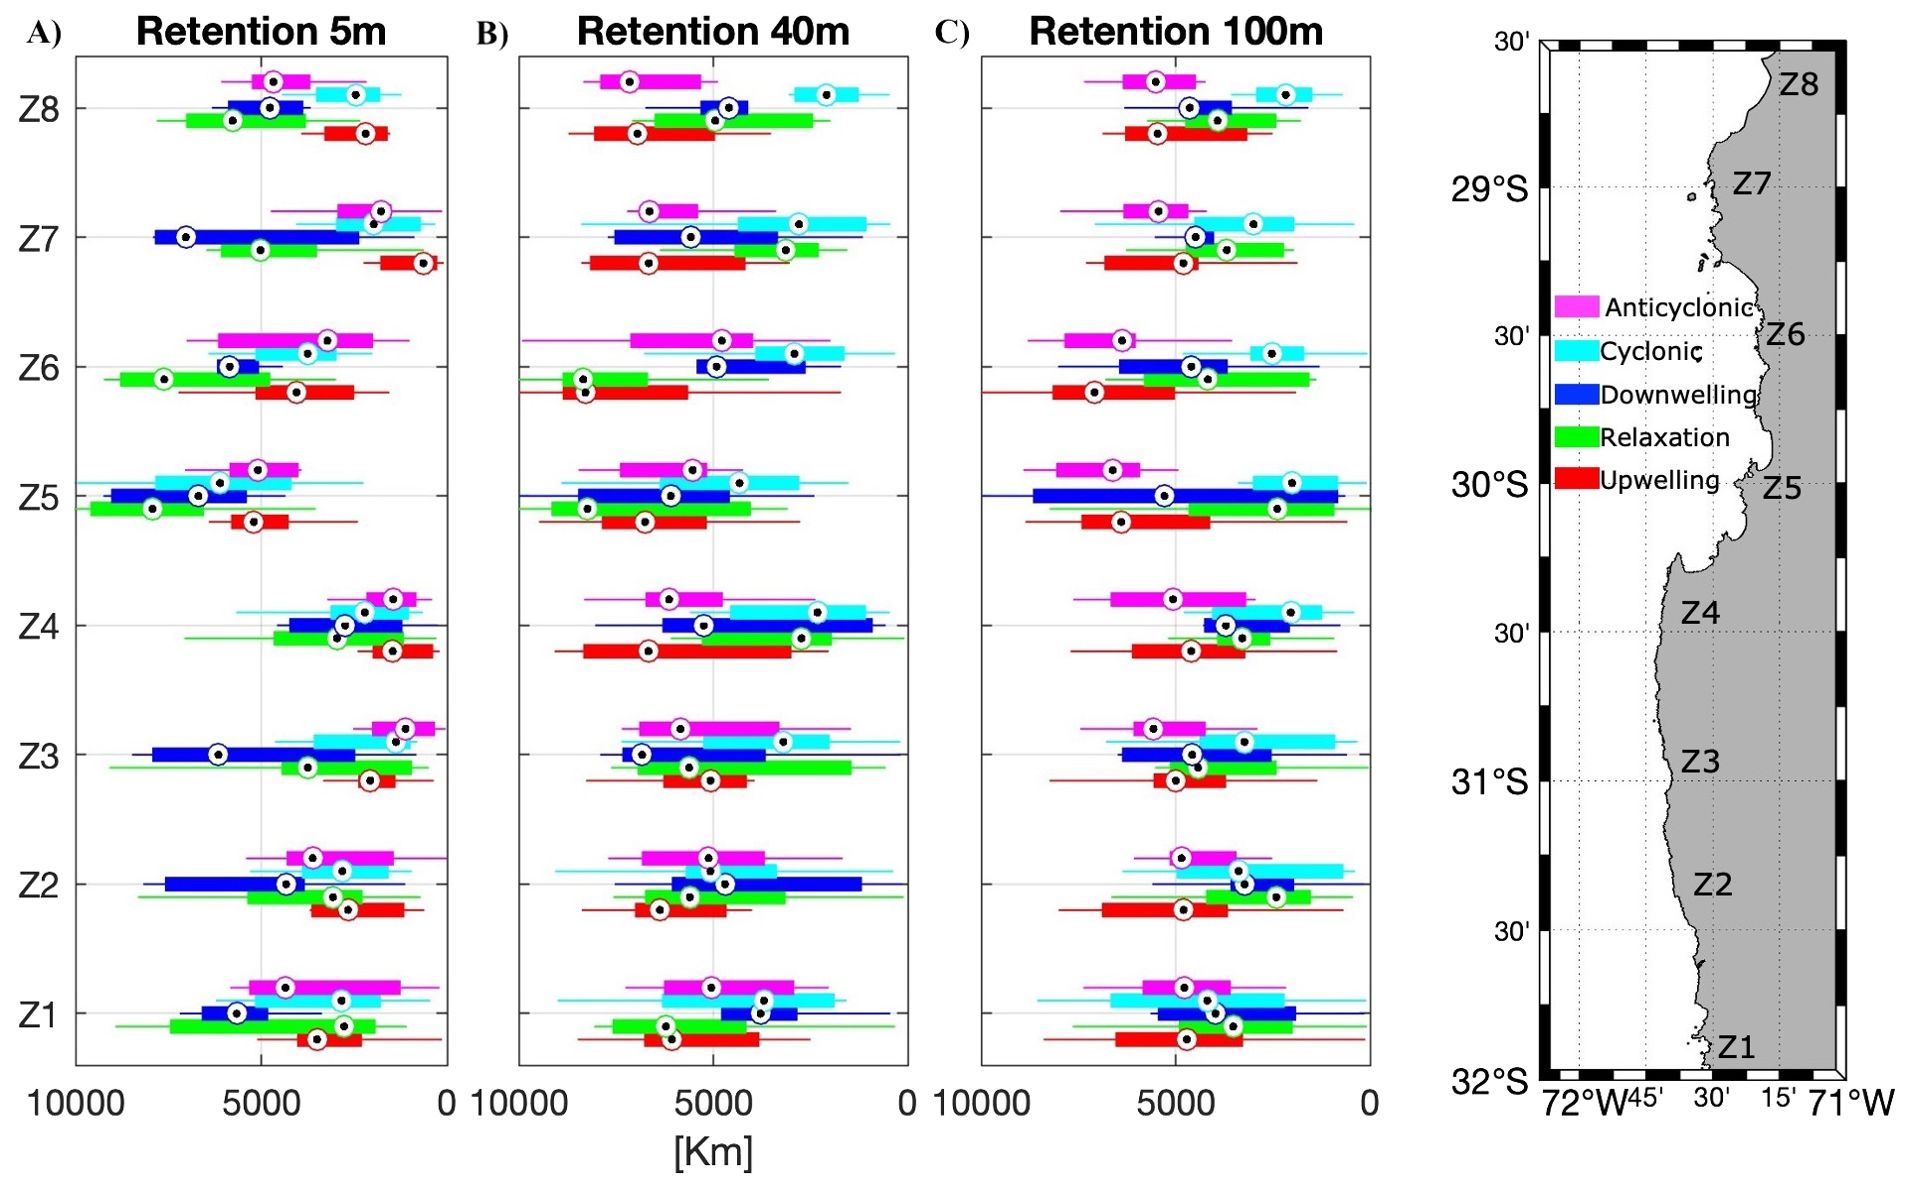
Figure 7. Boxplots of the number of days that particles remain in the origin zone for the different zones (n=8, with sub-zones grouped), scenarios, and depths: (A) 5 m, (B) 40 m and (C) 100 m. Number of scenarios averaged: Upwelling, Relaxation, and Anticyclonic scenarios n=9, Cyclonic scenarios n=8, Downwelling scenarios n=6.
Recruited particles were greater inside the CBS and the HAp at the different depths but not in all scenarios analyzed (Figure 8). Below surface recruited particles were greater in the cyclonic recirculation scenario (Figures 8B, C). The number of particles retained, on the other hand, was variable inside the CBS, with the minimum values in the upwelling centers (Z4 and Z7) at the surface (Figure 9A), but increased for 40 and 100 m depth. The retention was greater during downwelling and relaxation period at the surface (Figure 9A). In general, the retention was greater inside the CBS, especially in Tongoy Bay (Z5.1) during relaxation periods at the surface and 40m (Figure 9B) and during upwelling at 100 m depth (Figure 9C).
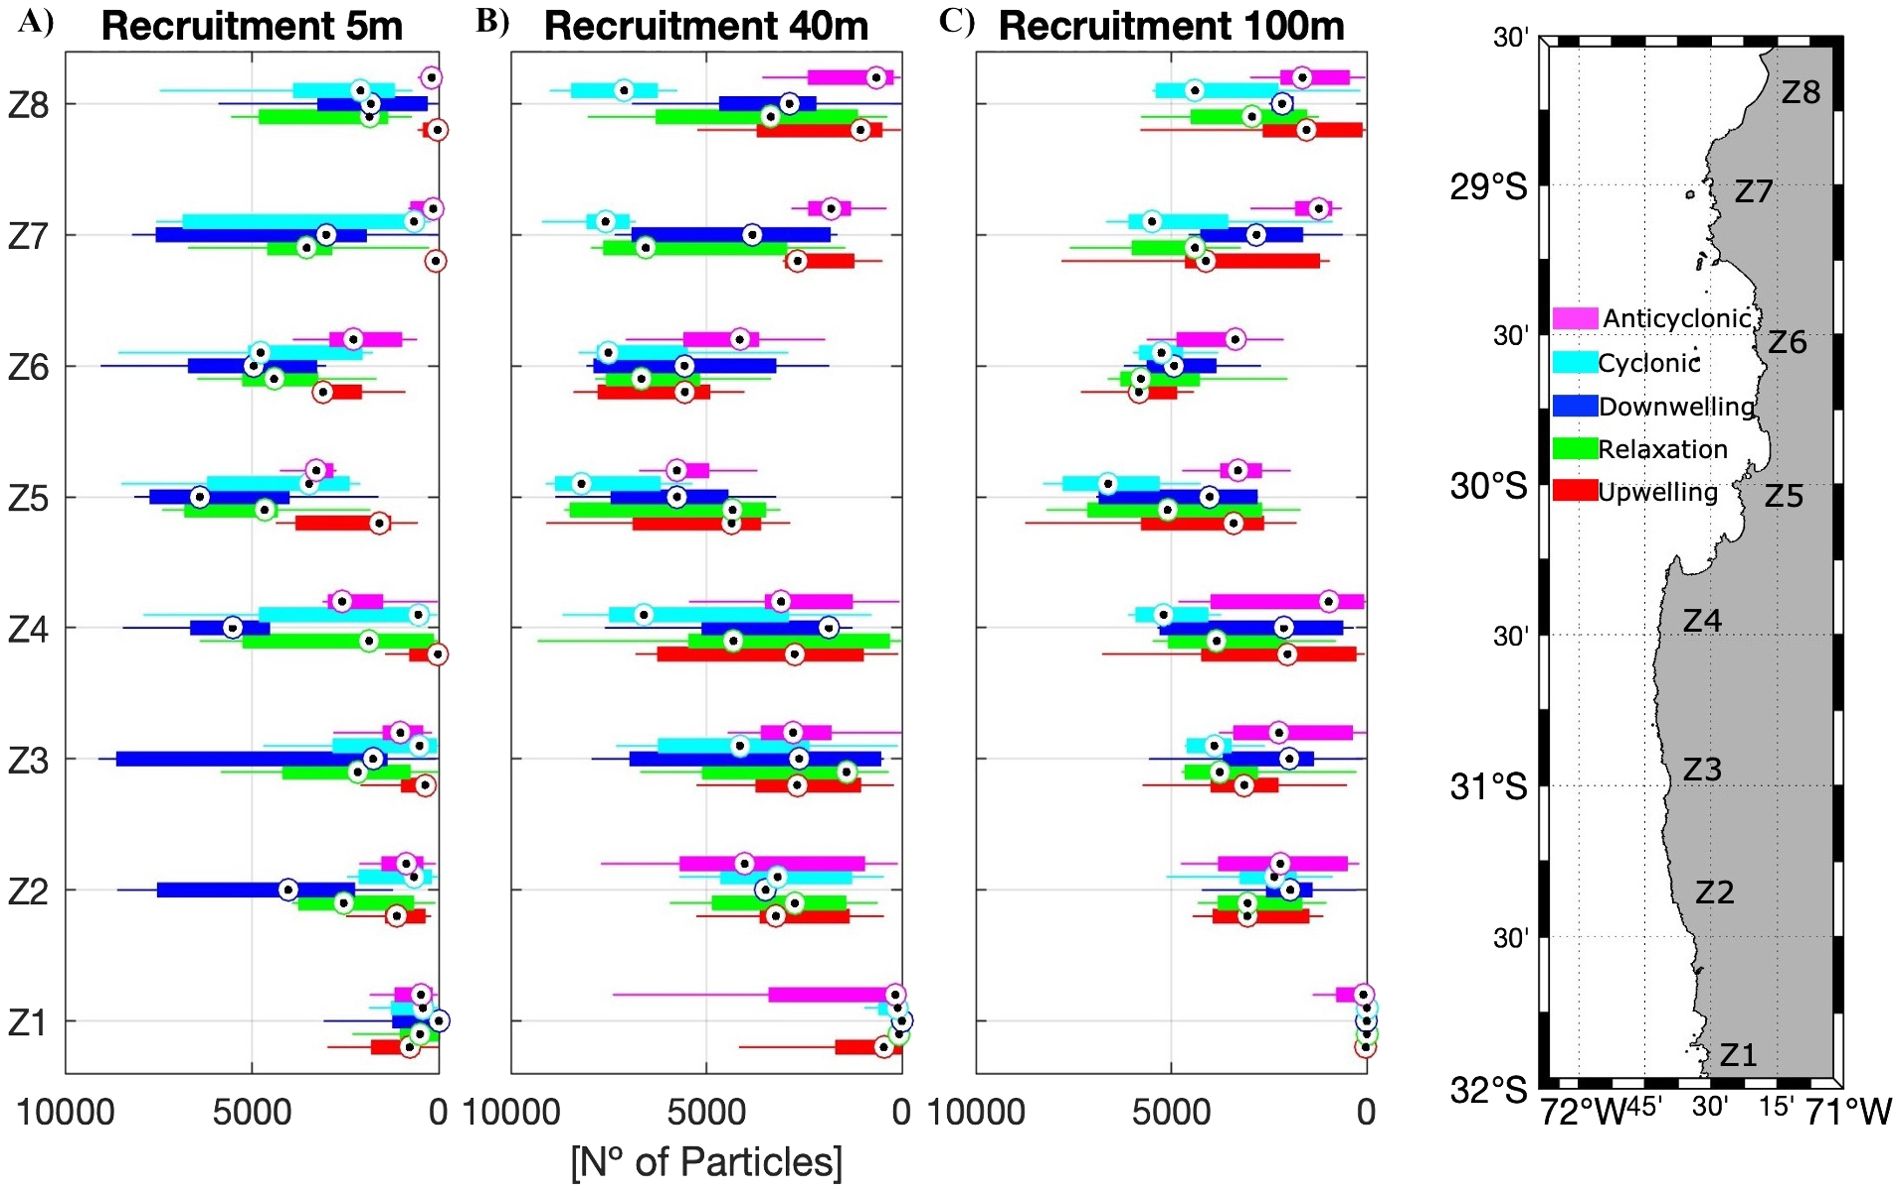
Figure 8. Boxplots of the number of particles recruited, that is particles arriving in a destination zone different from the zone of origin (recruitment without self-recruitment), for the different zones (n=8, with grouped subzones grouped), scenarios, and depths: (A) 5 m, (B) 40 m and (C) 100 m. Number of scenarios averaged: Upwelling, Relaxation, and Anticyclonic scenarios n=9, Cyclonic scenarios n=8, Downwelling scenarios n=6.
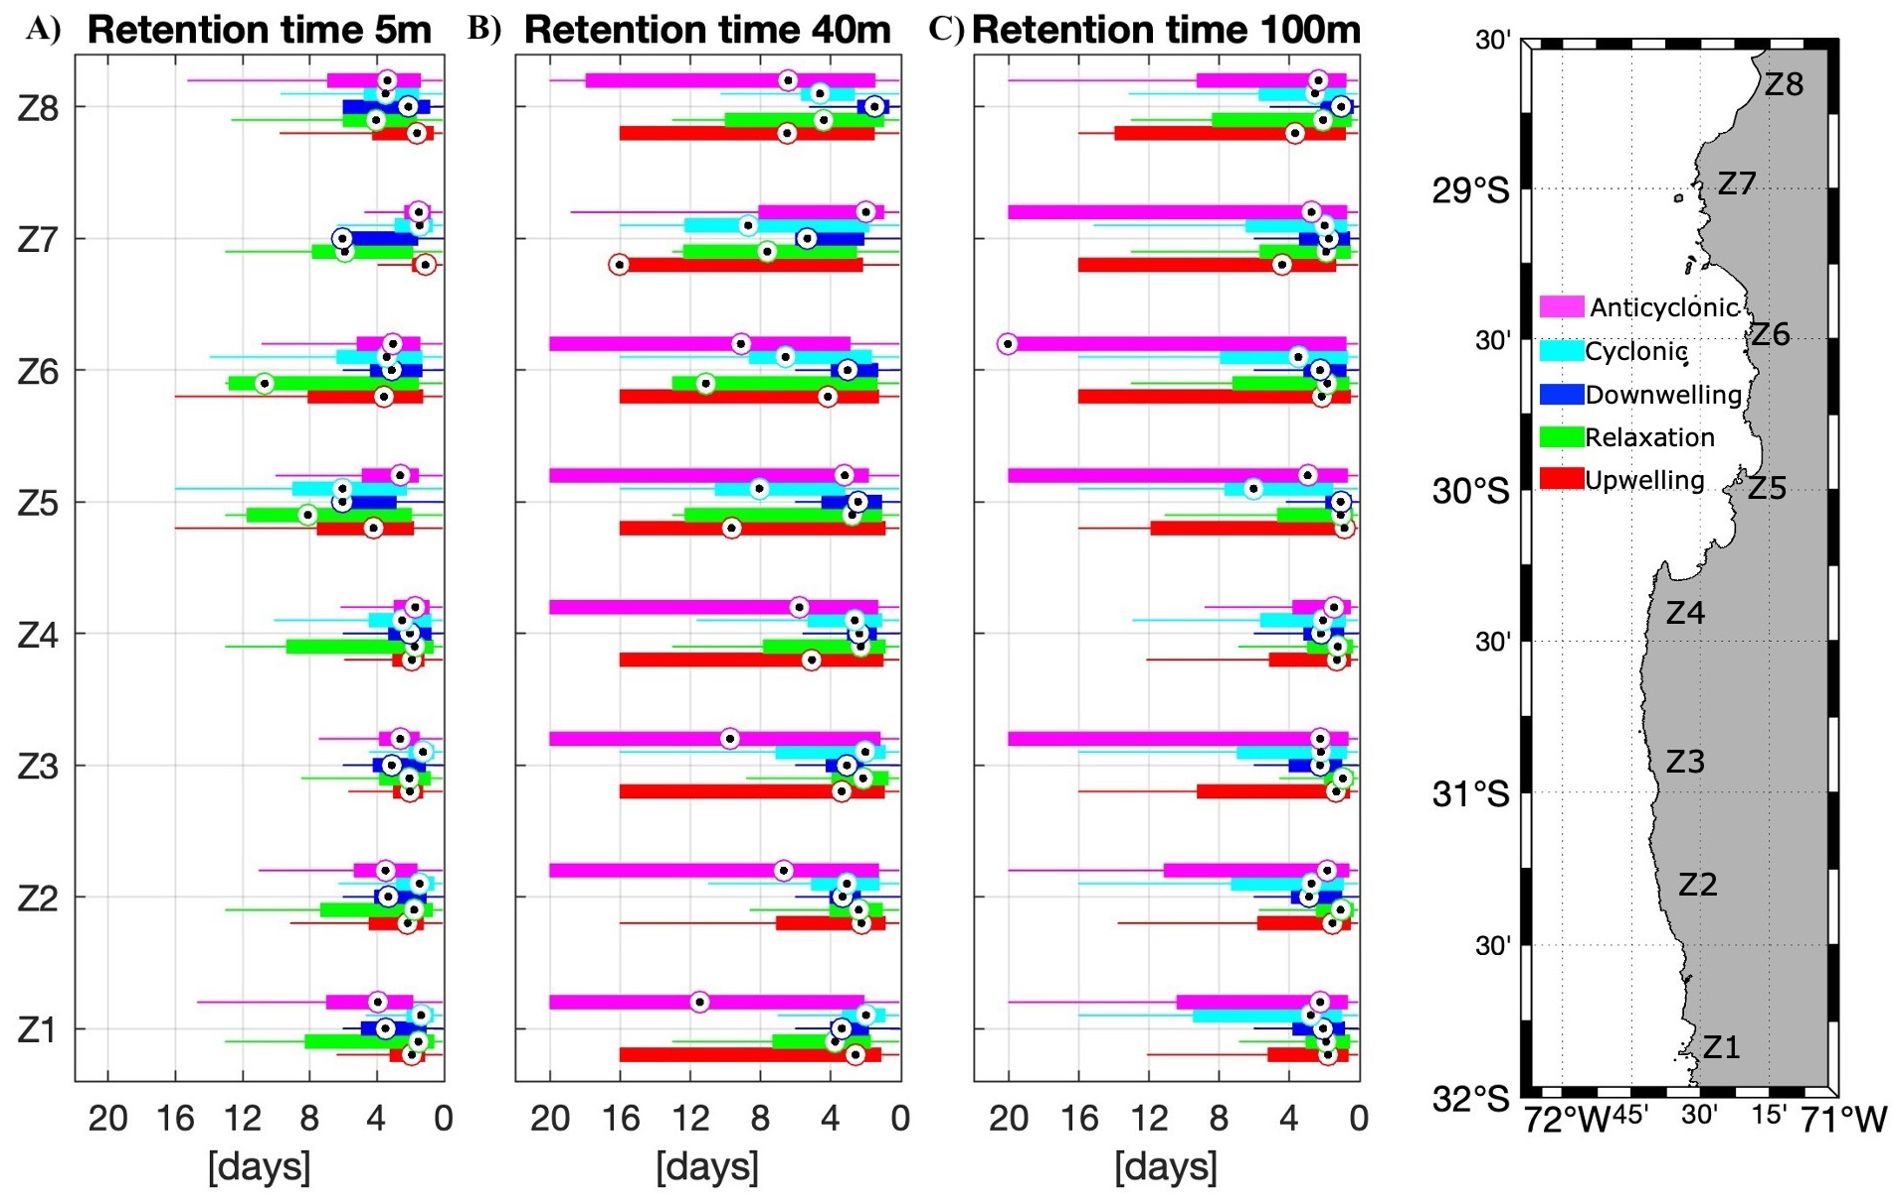
Figure 9. Boxplots of the number of particles retained for the different zones (n=8, with grouped subzones), scenarios (n=5), and depths (n=3): (A) 5 m, (B) 40 m and (C) 100 m. Number of scenarios averaged: Upwelling, Relaxation, and Anticyclonic scenarios n=9, Cyclonic scenarios n=8, Downwelling scenarios n=6.
Particle trajectories are shown for selected events per scenario (for the entire transport period of each event), where the events that are representative of promoting particle advection at different depths are active upwelling, anticyclonic recirculation, and cyclonic recirculation at 5, 40, and 100 m depth respectively (Figure 10). Meanwhile the events/scenario that are representative to favor the retention and recruitment of particles at different depths are relaxation period, active upwelling, and anticyclonic recirculation at 5, 40, and 100 m depth respectively (Figure 11).
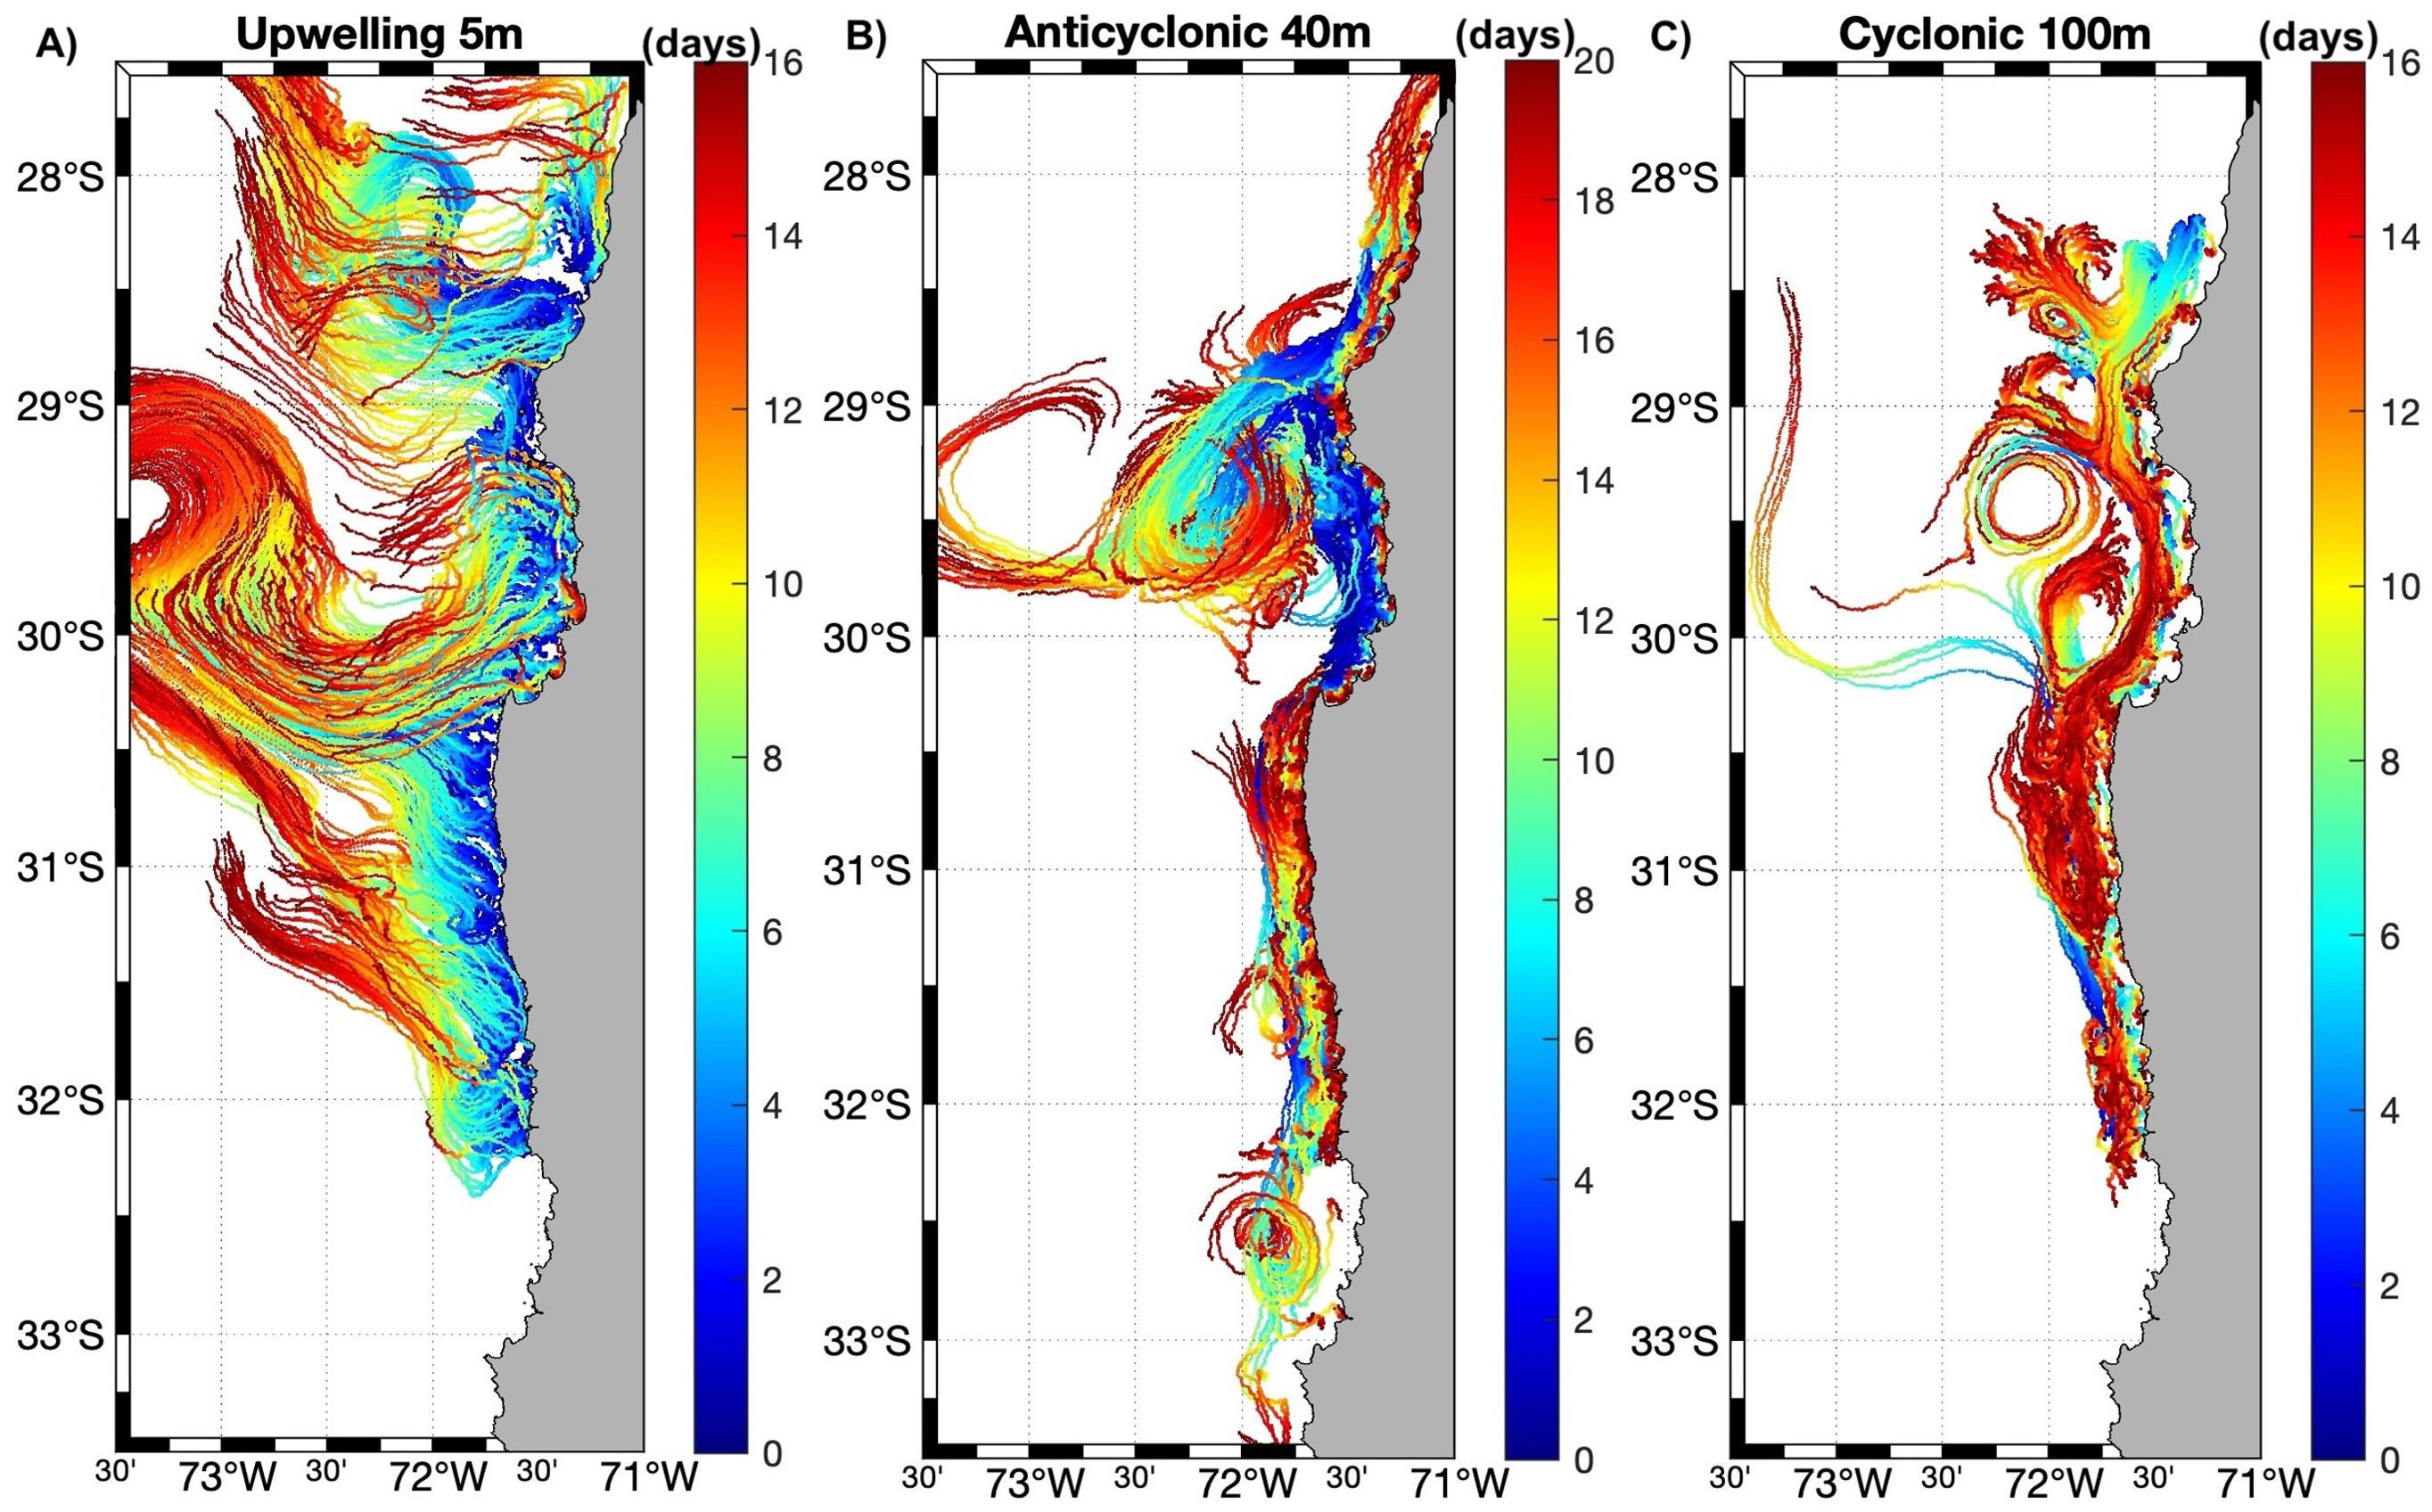
Figure 10. Particle trajectories from selected events promoting horizontal advection. Note the different time scales (days) of each panel: (A) 5 m, (B) 40 m and (C) 100 m. For better visualization, two orders of magnitude were subtracted from the number of particles released in each zone (i.e., 10,000 particles released = 100 particles plotted).
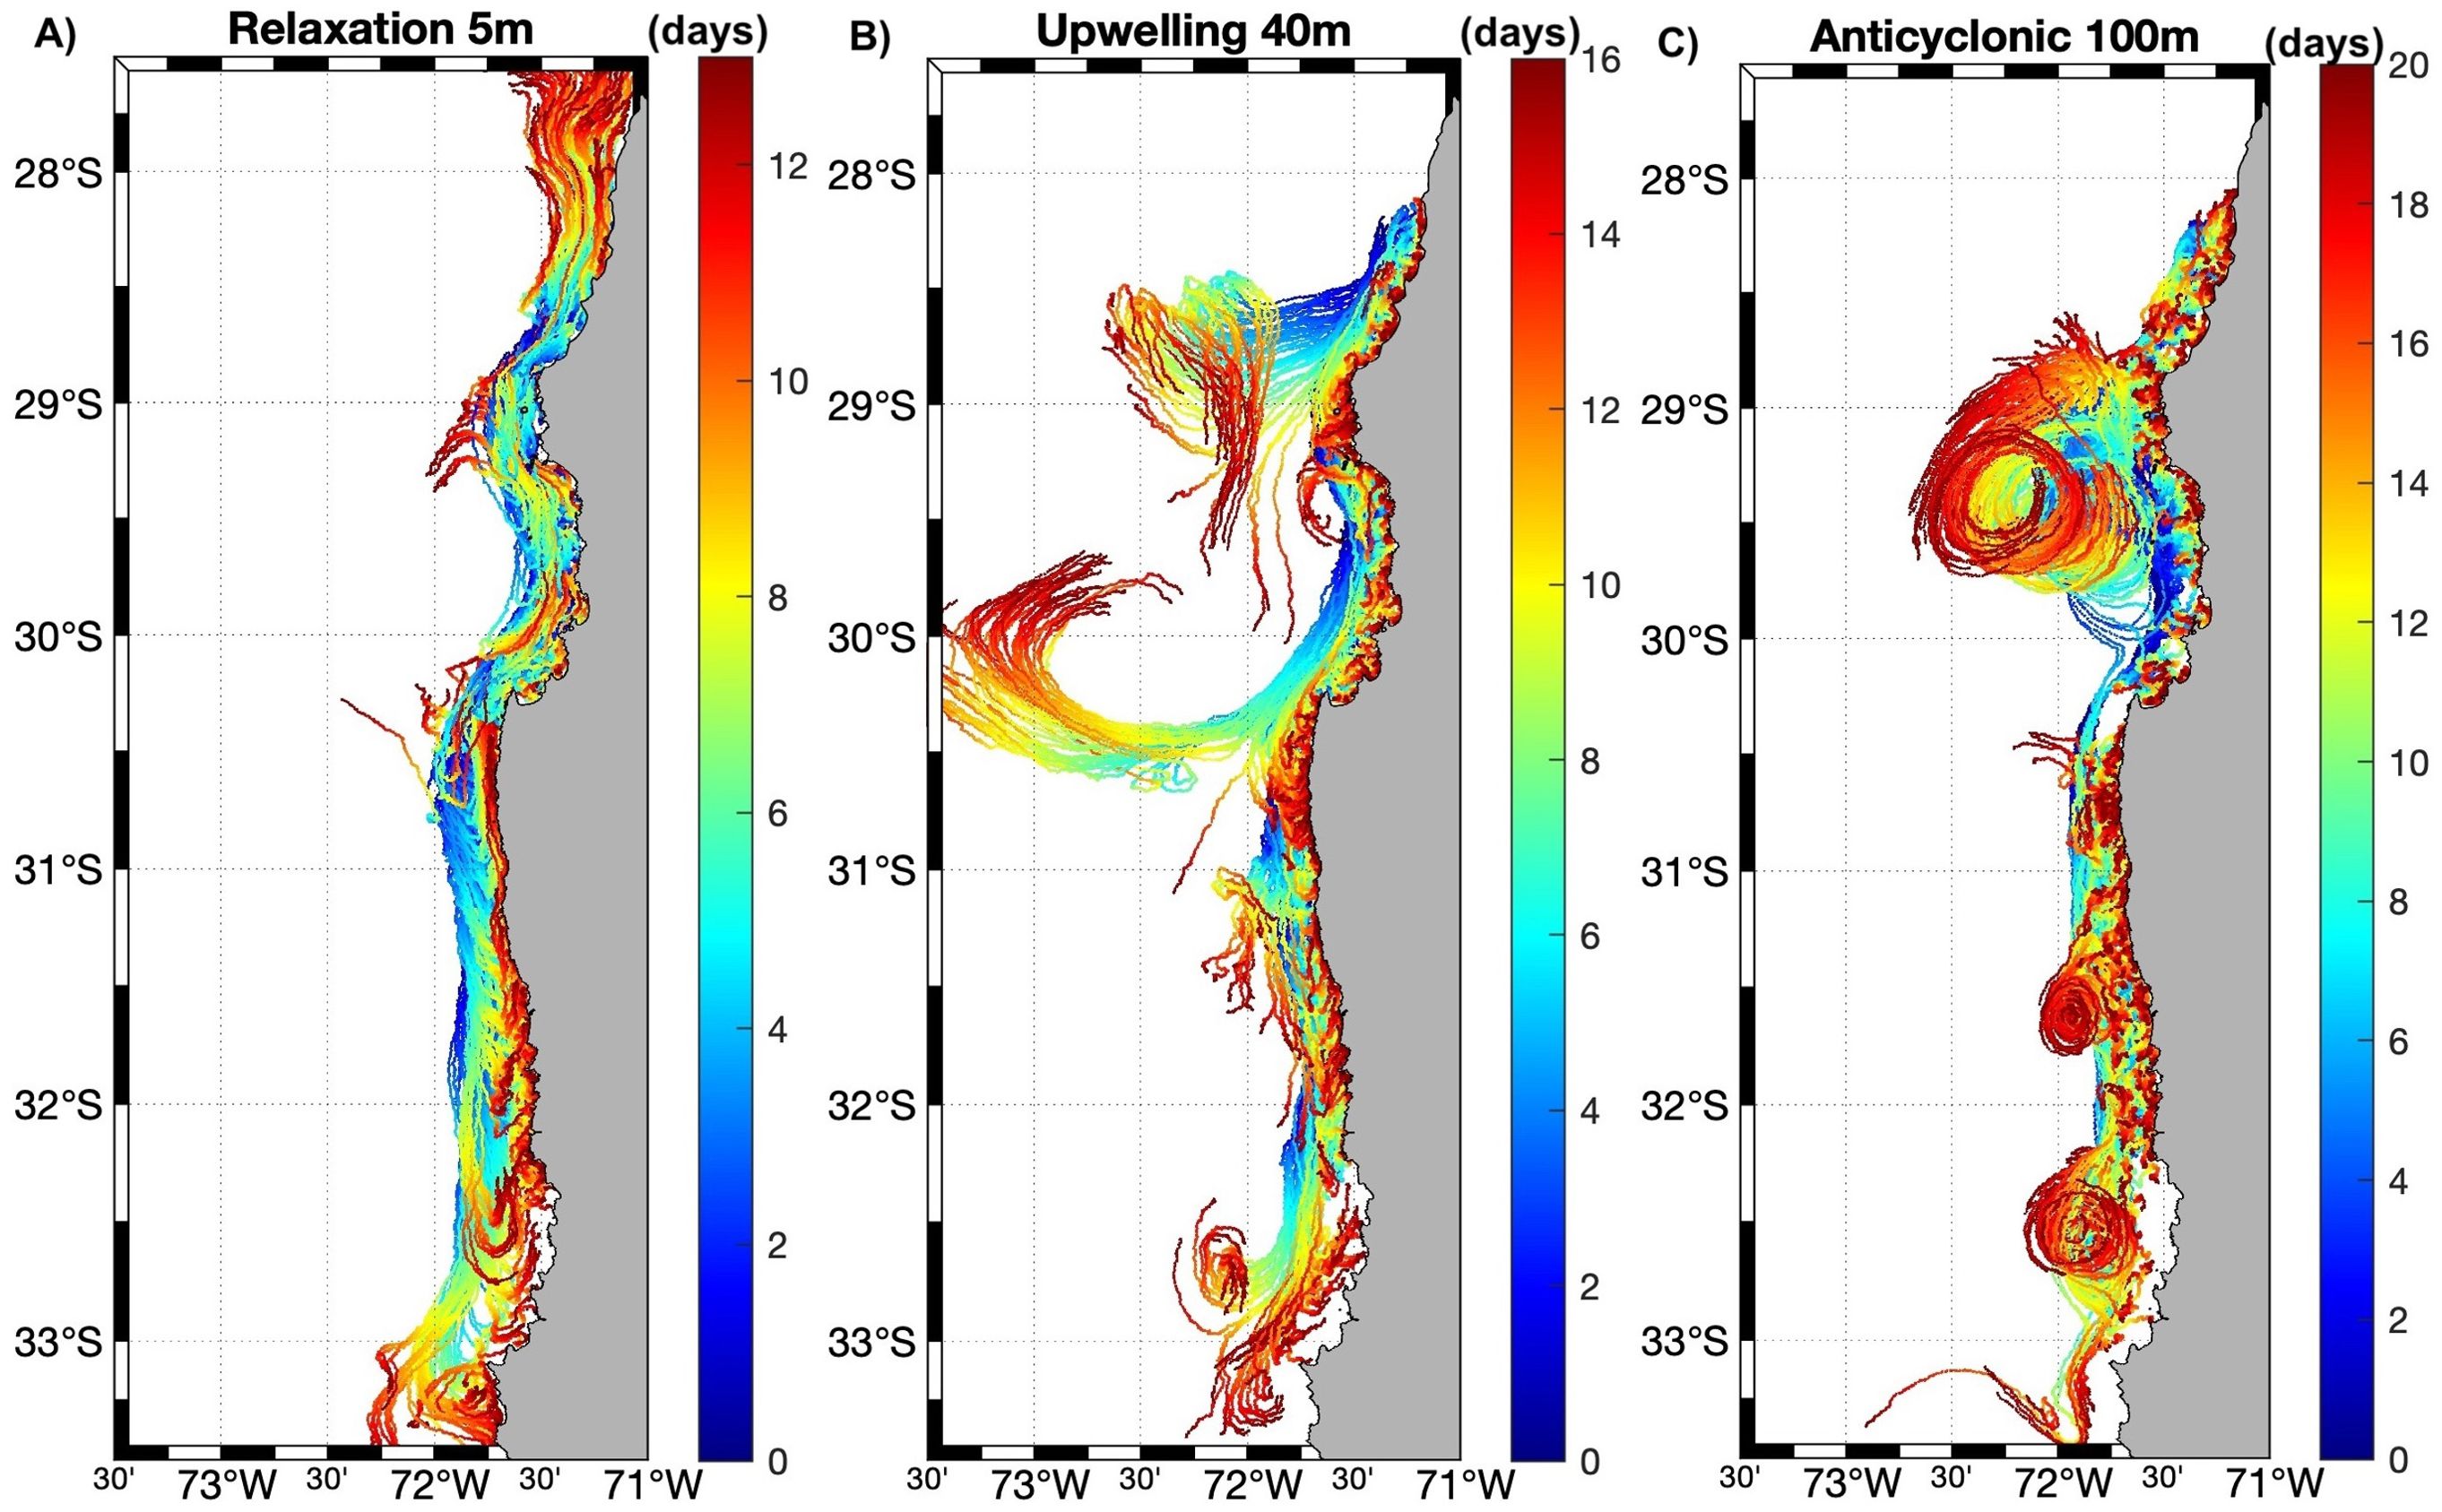
Figure 11. Particle trajectories from selected events favoring retention and recruitment. Note the different time scales (days) of each panel: (A) 5 m, (B) 40 m and (C) 100 m. For better visualization, two orders of magnitude were subtracted from the number of particles released in each zone (i.e., 10,000 particles released = 100 particles plotted).
4 Discussion
This manuscript addresses the Ekman transport and the geostrophic recirculation in a permanent upwelling zone of the Humboldt Current System through Lagrangian experiments, by following virtual particles in the 3D hydrodynamical field under different scenarios of oceanographic variability described for the zone.
In this study, as in others (Marín and Delgado, 2007; Bravo et al., 2016; Artal et al., 2019), based on wind stress, Ekman transport, and Lagrangian experiments, it has been observed that the intensity of the upwelling at the headlands (Punta Lengua de Vaca and Chañaral de Aceituno) is near the same, but the meridional extension is greater in Punta Lengua de Vaca to the south (~30.3° to 31.3° S), compared to the north headland that is centered at 29.0° S (Figure 4), meaning that more particles would be affected by the offshore Ekman transport at the southern upwelling center. At the headlands, the particles were transported further (to the north and northwest) during active upwelling events (Figures 6A, 10A), which is related to the upwelling filaments (Marín and Delgado, 2007) favoring drift at the surface. Conversely, Tongoy Bay (Z5.1, Figure 1) to the south and Choros Bay (Z6.3, Figure 1) to the north, due to the orientation of the bay’s headlands concerning the upwelling winds and the dominant flow during upwelling, act as an “upwelling shadow” and “upwelling trap” bays respectively, in which a warm surface layer develops with a strong thermocline and high concentration of phytoplankton would be expected (Largier, 2019) and where increased retention and recruitment at surface layers were reported in the Lagrangian experiments (Figures 8, 9). In the rest of the bays of the CBS and the HAp, recruitment and retention increase in the relaxation period (compared to active upwelling and downwelling conditions) at the surface (Figure 11A), revealing the importance of this synoptical physical variation of winds (“optimal environmental window”, Ayón et al., 2008; Fontana et al., 2016) for the CBS and the HAp productivity. Consequently, upwelling bays can retain and concentrate locally released planktonic larvae, as well as recruit those released remotely even with poleward flow during relaxation events (Largier, 2019). Below the surface layers the velocity of the currents decreases, where the influence of the winds is less and the flow changes direction to the south (Silva and Neshybat, 1979; Strub et al., 1998; Silva et al., 2009) resulting in less advection of particles with depth, except during downwelling conditions, where the surface flow is also poleward enhancing particle dispersion with depth (Figure 6C).
The Ekman transport scenario defined in this study was not as spatially variable as the geostrophic currents, whose scenario was forced to be similar to the zonal striations reported in previous studies (Davis et al., 2014; Belmadani et al., 2017), which resulted in a cyclonic and an anticyclonic gyre off the CBS (the geostrophic recirculation). Although some geostrophy is inherent to Ekman transport (i.e., coastal jet), our goal was to determine if the geostrophic recirculation contributes to the high productivity in the HAp, where the onshore flow of geostrophic current could enhance larval retention in longer periods when compared with Ekman transport timescale. Particularly, the cyclonic geostrophic recirculation, where the northern component is onshore, which results from the alongshore sea surface height gradient due to the action of upwelling winds (Jacox et al., 2018) and where the southern component is offshore as a result of flows that separate from coastal promontories and provide an offshore contribution to geostrophic transport affected by the coastal geometry (Marchesiello and Estrade, 2010; Davis et al., 2014; Jacox et al., 2018). So, on the one hand, it has been reported that the onshore geostrophic flow limits the Ekman transport at the surface layers (Marchesiello and Estrade, 2010), and on the other hand, the offshore geostrophic flow enhances the Ekman transport (Marchesiello and Estrade, 2010; Rossi et al., 2013) which makes the HAp a unique environment in which it obtains all the benefits of upwelling (greater primary productivity) and not the main disadvantages for planktonic larvae such as the increased loss by advection outside of the nursery areas (Mackas et al., 2006; Pineda et al., 2007). Buchan et al. (2024) provided evidence of zooplankton aggregations related to the onshore geostrophic flow in the Chañaral de Aceituno zone (Z7.1, Figure 1), inferring that the geostrophic recirculation may have greater responsibility in sustaining the high biological productivity in the HAp. Our results support this premise, beyond the contribution of upwelling centers to the productivity, the geostrophic recirculation, and particularly the onshore flow in the north headland allows the arrival of particles from the south and the permanence of particles in this area. These cross-shore geostrophic flows in EBUS regions are currently being considered in the climate change projections as a key factor controlling transport, beyond winds intensification in upwelling trends (Bograd et al., 2022; Jing et al., 2023).
Due to model resolution (~3 km horizontal resolution), this study does not include the effect of the small islands of the HAp and there are no submarine canyons because of the smoothed bathymetry, in which, an increase in retention and recruitment would be expected with the addition of these topographic features. Despite the resolution limitation of the models used in this study, this kind of approach has proven to be useful for testing complex hypotheses spatially and temporally (Leis et al., 2011; Ospina-Alvarez et al., 2018; Flores et al., 2020). While hydrodynamic and Lagrangian models must be validated against in-situ observations, they can also highlight gaps in knowledge needed to better understand the interactions between physical mechanisms and biological behaviors that influence recruitment and retention (Cowen and Sponaugle, 2009). Further studies that consider biological properties (e.g., buoyancy, vertical migration), as in individual-based models (IBMs), should also explore other physical mechanisms that were not addressed here, and that could be related to the high biodiversity in coastal zones, such as the cross-shore winds, wind curl (Ekman pumping), and coastal trapped waves.
5 Conclusions
Our approach from a Lagrangian perspective, reveals the importance of the cross-shore geostrophic flow on larval transport in a permanent upwelling zone, in which the onshore component not only limits the upwelling but also allows particles to concentrate. The main findings of this study can be summarized as:
● Alternating zonal bands (‘striations’) occur at the two upwelling centers, with an offshore zonal component at the southern headland and an onshore zonal component at the northern headland.
● The intensity of Ekman transport at each upwelling center is near the same, but the southern upwelling center is more spatially extended, with almost one degree of latitude of coastline (~110 km). It exports particles to the north and north-west, aided by the offshore geostrophic flow.
● Ekman transport at the northern upwelling center is more localized (centered at 29°S) and could be limited by the onshore geostrophic flow, favoring retention and recruitment of passive particles in the HAp.
Including geostrophic dynamics in the description of upwelling systems, can give us better insights into these productive ecosystems where the nutrient distribution and plankton transport sustain the higher trophic levels (bottom-up control) and therefore its biodiversity.
Data availability statement
The raw data supporting the conclusions of this article will be made available by the authors, without undue reservation.
Author contributions
EF: Conceptualization, Formal analysis, Funding acquisition, Investigation, Methodology, Writing – original draft, Writing – review & editing, Data curation. MR: Conceptualization, Formal analysis, Funding acquisition, Investigation, Writing – original draft, Writing – review & editing. BD: Funding acquisition, Validation, Writing – review & editing, Formal analysis, Investigation. OA: Formal analysis, Investigation, Methodology, Validation, Writing – review & editing. LG: Validation, Writing – review & editing.
Funding
The author(s) declare financial support was received for the research, authorship, and/or publication of this article. This work was funded by the Chilean National Agency for Research and Development, ANID FONDECYT Postdoctoral Project No. 3210528. EF and MR acknowledge ANID-ATE220044 Anillo BiodUCCT. LG, OA, MR, and BD also acknowledge support from ANID (Concurso de Fortalecimiento al Desarrollo Científico de Centros Regionales 2020-R20F0008-CEAZA). BD was also supported by the EU H2020 FutureMares project (Theme LC-CLA-06-2019, Grant agreement No. 869300) and ANID (Anillo Eclipse ACT210071 and Centro de Investigación Oceanográfica en el Pacífico Sur-Oriental COPAS COASTAL FB210021).
Conflict of interest
The authors declare that the research was conducted in the absence of any commercial or financial relationships that could be construed as a potential conflict of interest.
Publisher’s note
All claims expressed in this article are solely those of the authors and do not necessarily represent those of their affiliated organizations, or those of the publisher, the editors and the reviewers. Any product that may be evaluated in this article, or claim that may be made by its manufacturer, is not guaranteed or endorsed by the publisher.
Supplementary material
The Supplementary Material for this article can be found online at: https://www.frontiersin.org/articles/10.3389/fmars.2024.1449369/full#supplementary-material
References
Acuña E., Moraga J., Uribe E. (1989). “La zona de Coquimbo: Un sistema nerítico de surgencia de alta productividad,” in Revista Pacífico Sur, Perú, 9–13. Available at: https://www.researchgate.net/publication/284045845.
Alory G., Da-Allada C. Y., Djakouré S., Dadou I., Jouanno J., Loemba D. P. (2021). Coastal upwelling limitation by onshore geostrophic flow in the gulf of Guinea around the Niger river plume. Front. Mar. Sci. 7. doi: 10.3389/fmars.2020.607216
Artal O., Sepúlveda H. H., Mery D., Pieringer C. (2019). Detecting and characterizing upwelling filaments in a numerical ocean model. Comput. Geosci 122, 25–34. doi: 10.1016/j.cageo.2018.10.005
Astudillo O., Dewitte B., Mallet M., Frappart F., Rutllant J. A., Ramos M., et al. (2017). Surface winds off Peru-Chile: Observing closer to the coast from radar altimetry. Remote Sens Environ. 191, 179–196. doi: 10.1016/j.rse.2017.01.010
Ayón P., Criales-Hernandez M. I., Schwamborn R., Hirche H. J. (2008). Zooplankton research off Peru: A review. Prog. Oceanogr 79, 238–255. doi: 10.1016/j.pocean.2008.10.020
Belmadani A., Concha E., Donoso D., Chaigneau A., Colas F., Maximenko N., et al. (2017). Striations and preferred eddy tracks triggered by topographic steering of the background flow in the eastern South Pacific. J. Geophys Res. Oceans 122, 2847–2870. doi: 10.1002/2016JC012348
Blanco M., Ospina-Álvarez A., Navarrete S. A., Fernández M. (2019). Influence of larval traits on dispersal and connectivity patterns of two exploited marine invertebrates in central Chile. Mar. Ecol. Prog. Ser. 43–64. doi: 10.3354/meps12870
Bograd S. J., Jacox M. G., Hazen E. L., Lovecchio E., Montes I., Buil M. P., et al. (2022). Climate change impacts on eastern boundary upwelling systems. Ann Rev Mar Sci. 15, 303–328. doi: 10.1146/annurev-marine-032122
Botsford L. W., Lawrence C. A., Dever E. P., Hastings A., Largier J. (2003). Wind strength and biological productivity in upwelling systems: An idealized study., in. Fisheries Oceanography. 12, 245–259. doi: 10.1046/j.1365-2419.2003.00265.x
Bravo L., Ramos M., Astudillo O., Dewitte B., Goubanova K. (2016). Seasonal variability of the Ekman transport and pumping in the upwelling system off central-northern Chile (~30° S) based on a high-resolution atmospheric regional model (WRF). Ocean Sci. 12, 1049–1065. doi: 10.5194/os-12-1049-2016
Buchan S. J., Ramos M., Oyanadel J., Santos-Carvallo M., Bedriñana-Romano L., Valladares M., et al. (2024). Understanding the oceanographic dynamics of the Isla Chañaral baleen whale feeding ground, (Humboldt Archipelago, Northern Chile) to extend habitat protection. Front. Mar. Sci. 10. doi: 10.3389/fmars.2023.1208262
Capet X., Colas F., Mcwilliams J. C., Penven P., Marchesiello P. (2013). “Eddies in eastern boundary subtropical upwelling systems,” in Ocean Modeling in an Eddying Regime (Washington,D.C.: Wiley Blackwell), 131–147. doi: 10.1029/177GM10
Carr M. E., Kearns E. J. (2003). Production regimes in four Eastern Boundary Current systems. Deep Sea Res. Top. Stud. Oceanogr 50, 3199–3221. doi: 10.1016/j.dsr2.2003.07.015
Copernicus Climate Change Service, and Climate Data Store (2018). Sea level gridded data from satellite observations for the global ocean from 1993 to present. Copernicus Climate Change Service (C3S) Climate Data Store (CDS). doi: 10.24381/cds.4c328c78
Cowen R. K., Sponaugle S. (2009). Larval dispersal and marine population connectivity. Ann. Rev. Mar. Sci. 1, 443–466. doi: 10.1146/annurev.marine.010908.163757
Davis A., Di Lorenzo E., Luo H., Belmadani A., Maximenko N., Melnichenko O., et al. (2014). Mechanisms for the emergence of ocean striations in the North Pacific. Geophys Res. Lett. 41, 948–953. doi: 10.1002/2013GL057956
Dohan K., Maximenko N. (2010). Monitoring ocean currents with satellite sensors. Source: Oceanography 23, 94–103. doi: 10.2307/24860865
Flores E. A., Parada C., Castro L. R., Narváez D. A., Sepúlveda H. H. (2020). Connectivity in early life stages of the southern hake, Merluccius australis, in northern Chilean Patagonia. J. Mar. Syst. 212. doi: 10.1016/j.jmarsys.2020.103452
Fontana R. E., Elliott M. L., Largier J. L., Jahncke J. (2016). Temporal variation in copepod abundance and composition in a strong, persistent coastal upwelling zone. Prog. Oceanogr 142, 1–16. doi: 10.1016/j.pocean.2016.01.004
Garavelli L., Colas F., Verley P., Kaplan D. M., Yannicelli B., Lett C. (2016). Influence of biological factors on connectivity patterns for Concholepas concholepas (loco) in Chile. PloS One 11, 1–22. doi: 10.1371/journal.pone.0146418
Gaymer C. F., Rojas Nazar U., Squeo F. A., Luna-Jorquera G., Cortés A., Arancio G., et al. (2008). “AMCP-MU Isla Grande de Atacama: Flora y Fauna marina y terrestre,” in Libro Rojo de la Flora Nativa y de los Sitios Prioritarios para su Conservación: Región de Atacama. Eds. Squeo F. A., Arancio G., Gutiérrez J. R. (Universidad de la Serena, La Serena, Chile), 223–249. Available at: https://www.researchgate.net/publication/289512940.
GEBCO Bathymetric Compilation Group 2022. (2022). The GEBCO_2022 Grid - a continuous terrain model of the global oceans and land. NERC EDS British Oceanographic Data Centre NOC. doi: 10.5285/e0f0bb80-ab44-2739-e053-6c86abc0289c
Gruber N., Lachkar Z., Frenzel H., Marchesiello P., Münnich M., McWilliams J. C., et al. (2011). Eddy-induced reduction of biological production in eastern boundary upwelling systems. Nat. Geosci 4, 787–792. doi: 10.1038/ngeo1273
Hersbach H., Berrisford P., Biavati G., Horányi A., Muñoz Sabater J., Nicolas J., et al. (2023). ERA5 hourly data on single levels from 1940 to present. Copernicus Climate Change Service (C3S) Climate Data Store (CDS). doi: 10.24381/cds.adbb2d47
Jacox M. G., Edwards C. A., Hazen E. L., Bograd S. J. (2018). Coastal upwelling revisited: ekman, bakun, and improved upwelling indices for the U.S. West coast. J. Geophys Res. Oceans 123, 7332–7350. doi: 10.1029/2018JC014187
Jing Z., Wang S., Wu L., Wang H., Zhou S., Sun B., et al. (2023). Geostrophic flows control future changes of oceanic eastern boundary upwelling. Nat. Clim Chang 13, 148–154. doi: 10.1038/s41558-022-01588-y
Kämpf J., Chapman P. (2016). Upwelling Systems of the World (Cham: Springer International Publishing). doi: 10.1007/978-3-319-42524-5
Large W. G., Pond S. (1981). Open ocean momentum flux measurements in moderate to strong winds. J Phys Oceanogr 11, 324–336.
Largier J. L. (2019). Upwelling bays: how coastal upwelling controls circulation, habitat, and productivity in bays. Ann Rev Mar Sci. 12, 415–447. doi: 10.1146/annurev-marine-010419
Leis J. M., Van Herwerden L., Patterson H. M. (2011). “Estimating connectivity in marine fish populations: what works best?,” in Oceanography and Marine Biology: An Annual Review. Eds. Gibson R. N., Atkinson R. J. A., Gordon J. D. M., Smith I. P., Hughes D. J. (CRC Press, Hoboken, New Jersey), 193–234.
Lett C., Verley P., Mullon C., Parada C., Brochier T., Penven P., et al. (2008). A Lagrangian tool for modelling ichthyoplankton dynamics. Environ. Model. Software 23, 1210–1214. doi: 10.1016/j.envsoft.2008.02.005
Mackas D. L., Strub P. T., Thomas A., Montecino V. (2006). “Eastern ocean boundaries pan-regional overview,” in The Seas, Volume 14A: The Global Coastal Ocean. Eds. Robinson A. R., Brink K. (Harvard University Press, Cambridge, Massachusetts), 21–60.
Marchesiello P., Estrade P. (2010). Upwelling limitation by onshore geostrophic flow. J. Mar. Res. 68, 37–62. doi: 10.1357/002224010793079004
Marín V. H., Delgado L. E. (2007). Lagrangian observations of surface coastal flows North of 30{ring operator} S in the Humboldt Current system. Cont Shelf Res. 27, 731–743. doi: 10.1016/j.csr.2006.11.014
Meerhoff E., Yannicelli B., Dewitte B., Díaz-Cabrera E., Vega-Retter C., Ramos M., et al. (2018). Asymmetric connectivity of the lobster Panulirus pascuensis in remote islands of the southern Pacific: importance for its management and conservation. Bull. Mar. Sci. 94, 753–774. doi: 10.5343/bms.2017.1114
Ospina-Alvarez A., Weidberg N., Aiken C. M., Navarrete S. A. (2018). Larval transport in the upwelling ecosystem of central Chile: The effects of vertical migration, developmental time and coastal topography on recruitment. Prog. Oceanogr 168, 82–99. doi: 10.1016/j.pocean.2018.09.016
Pineda J., Hare J. A., Sponaugle S. (2007). Larval transport and dispersal in the coastal ocean and consequences for population connectivity. Oceanography 20, 22–39. doi: 10.5670/oceanog.2007.27
Prants S. V. (2022). Marine life at Lagrangian fronts. Prog. Oceanogr 204. doi: 10.1016/j.pocean.2022.102790
Ramajo L., Sola-Hidalgo C., Valladares M., Astudillo O., Inostroza J. (2022). Size matters: Physiological sensitivity of the scallop Argopecten purpuratus to seasonal cooling and deoxygenation upwelling-driven events. Front. Mar. Sci. 9. doi: 10.3389/fmars.2022.992319
Renault L., Dewitte B., Marchesiello P., Illig S., Echevin V., Cambon G., et al. (2012). Upwelling response to atmospheric coastal jets off central Chile: A modeling study of the October 2000 event. J. Geophys Res. Oceans 117, 1–21. doi: 10.1029/2011JC007446
Rossi V., Feng M., Pattiaratchi C., Roughan M., Waite A. M. (2013). On the factors influencing the development of sporadic upwelling in the Leeuwin Current system. J. Geophys Res. Oceans 118, 3608–3621. doi: 10.1002/jgrc.20242
Shaffer G., Hormazabal S., Pizarro O., Salinas S. (1999). Seasonal and interannual variability of currents and temperature off central Chile. J. Geophys Res. Oceans 104, 29951–29961. doi: 10.1029/1999jc900253
Shchepetkin A. F., McWilliams J. C. (2005). The regional oceanic modeling system (ROMS): A split-explicit, free-surface, topography-following-coordinate oceanic model. Ocean Model. (Oxf) 9, 347–404. doi: 10.1016/j.ocemod.2004.08.002
Silva N., Neshybat S. (1979). On the southernmost extension of the Peru-Chile Undercurrent. Deep-Sea Research 26A, 1387–1393.
Silva N., Rojas N., Fedele A. (2009). Water masses in the Humboldt Current System: Properties, distribution, and the nitrate deficit as a chemical water mass tracer for Equatorial Subsurface Water off Chile. Deep Sea Res. Part II: Topical Stud. Oceanography 56, 1004–1020. doi: 10.1016/j.dsr2.2008.12.013
Soto-Mendoza S., Parada C., Castro L., Colas F., Schneider W. (2012). Modeling transport and survival of anchoveta eggs and yolk-sac larvae in the coastal zone off central-southern Chile: Assessing spatial and temporal spawning parameters. Prog. Oceanogr 92–95, 178–191. doi: 10.1016/j.pocean.2011.07.001
Strub P. T., Mesías J. M., Montecino V., Rutllant J., Salinas S. (1998). “Coastal ocean circulation off western south america,” in The Sea. Eds. Robinson A. R., Brink K. H. (Hoboken,N.J.: John Wiley & Sons, Inc), 273–313.
Thiel M., Macaya E. C., Acuña E., Arntz W. E., Bastias H., Brokordt K., et al. (2007). The Humboldt Current System of Northern and Central Chile Oceanographic Processes, Ecological Interactions and Socioeconomic Feedback. Oceanography and Marine Biology: An Annual Review 45, 195–344.
Trenberth K. E., Large W. G., Olson J. G. (1990). The mean annual cycle in global ocean wind stress. J. Phys. Oceanogr 20, 1742–1760. doi: 10.1175/1520-0485(1990)020<1742:TMACIG>2.0.CO;2
Yannicelli B., Castro L., Parada C., Schneider W., Colas F., Donoso D. (2012). Distribution of Pleuroncodes monodon larvae over the continental shelf of south-central Chile: Field and modeling evidence for partial local retention and transport. Prog. Oceanogr 92–95, 206–227. doi: 10.1016/j.pocean.2011.07.005
Keywords: upwelling centers, geostrophic currents, Ekman transport, particle transport, hydrodynamic model, Lagrangian model
Citation: Flores EA, Ramos M, Dewitte B, Astudillo O and Glasner L (2024) On the role of onshore geostrophic flow on larval retention in a permanent upwelling zone along north-central Chile. Front. Mar. Sci. 11:1449369. doi: 10.3389/fmars.2024.1449369
Received: 14 June 2024; Accepted: 01 October 2024;
Published: 30 October 2024.
Edited by:
Andrea Cucco, National Research Council (CNR), ItalyReviewed by:
David Alberto Salas Salas De León, National Autonomous University of Mexico, MexicoYoshikazu Sasai, Japan Agency for Marine-Earth Science and Technology (JAMSTEC), Japan
Copyright © 2024 Flores, Ramos, Dewitte, Astudillo and Glasner. This is an open-access article distributed under the terms of the Creative Commons Attribution License (CC BY). The use, distribution or reproduction in other forums is permitted, provided the original author(s) and the copyright owner(s) are credited and that the original publication in this journal is cited, in accordance with accepted academic practice. No use, distribution or reproduction is permitted which does not comply with these terms.
*Correspondence: Eduardo A. Flores, ZWR1YXJkby5mbG9yZXNAdWNuLmNs
 Eduardo A. Flores
 Marcel Ramos
 Boris Dewitte
 Orlando Astudillo
 Lucas Glasner