 Hannah Sharpe1*
 Daria Gallardi2
 Helen Gurney-Smith1
 Thomas Guyondet3
 Christopher W. McKindsey4
 Anaïs Lacoursière-Roussel1*†
- 1St. Andrews Biological Station, Fisheries and Oceans Canada, St. Andrews, NB, Canada
- 2Northwest Atlantic Fisheries Centre, Fisheries and Oceans Canada, St. John’s, NL, Canada
- 3Gulf Fisheries Centre, Fisheries and Oceans Canada, Moncton, NB, Canada
- 4Maurice-Lamontagne Institute, Fisheries and Oceans Canada, Mont-Joli, QC, Canada
Introduction: Bivalve aquaculture has direct and indirect effects on plankton communities, which are highly sensitive to short-term (seasonal, interannual) and long-term climate changes, although how these dynamics alter aquaculture ecosystem interactions is poorly understood.
Methods: We investigate seasonal patterns in plankton abundance and community structure spanning several size fractions from 0.2 µm up to 5 mm, in a deep aquaculture embayment in northeast Newfoundland, Canada.
Results: Using flow cytometry and FlowCam imaging, we observed a clear seasonal relationship between fraction sizes driven by water column stratification (freshwater input, nutrient availability, light availability, water temperature). Plankton abundance decreased proportionally with increasing size fraction, aligning with size spectra theory. Within the bay, greater mesozooplankton abundance, and a greater relative abundance of copepods, was observed closest to the aquaculture lease. No significant spatial effect was observed for phytoplankton composition.
Discussion: While the months of August to October showed statistically similar plankton composition and size distribution slopes (i.e., food chain efficiency) and could be used for interannual variability comparisons of plankton composition, sampling for longer periods could capture long-term phenological shifts in plankton abundance and composition. Conclusions provide guidance on optimal sampling to monitor and assess aquaculture pathways of effects.
1 Introduction
Global production of mussels has increased ~ 5% per year since 1950 to a total of about 2M tons in 2022 (FAO Fisheries and Aquaculture Department, 2022). Critical knowledge gaps exist for the interactions between shellfish aquaculture and pelagic food webs given the influence and interactions of multiple factors, including culture density, natural plankton abundance, local hydrodynamics and seasonality (e.g., Trottet et al., 2008; Filgueira et al., 2021). Understanding aquaculture ecosystem interactions and their contribution to ecosystem functioning is critical to refine and expand predictive models that can help operate within carrying capacity limits and avoid their collapse to a state where the role and functions of plankton would be suppressed by cultured bivalve dominance (Gibbs, 2004).
Phytoplankton and bacteria form the base of the pelagic aquatic food web for both the natural ecosystem and cultured bivalves, by uptaking dissolved carbon to create particulate organic carbon, i.e. energy for grazers. Zooplankton subsequently act as the link for energy and mass transfer from these smaller communities to higher pelagic trophic levels (Lindeman, 1942; Kiørboe, 2009; Hulot et al., 2014). Shifts in their abundance and community composition can thus affect fisheries resources, nutrients/carbon/oxygen cycles, and ecosystem functioning (e.g., Azam et al., 1983; Legendre and Rassoulzadegan, 1995; Cranford et al., 2011; Degerman et al., 2018; Lombard et al., 2019). Size distribution analysis describes the rate at which abundance and/or biomass of pelagic organisms changes with increasing body size and is determined by the efficiency of energy transfer from prey to predator and the relationship between body sizes (Trebilco et al., 2013; Blanchard et al., 2017; Hatton et al., 2021). The “height” of the size spectrum (i.e., intercept) reflects the productivity of the ecosystem (Jennings, 2012). In typical marine environments, the log-transformed slope is not affected by primary production levels and is theoretically considered to be around −1 for datasets using abundance and zero for datasets using biomass (Trebilco et al., 2013). The slope has a higher likelihood of being skewed in coastal ecosystems with strong grazing pressures and benthic-pelagic coupling, where pelagic food webs may be altered by the benthos (Jennings, 2012). Long-term bay-scale plankton data in shellfish aquaculture sites are essential to understand how bivalve aquaculture potentially impacts fisheries resources and how these interactions may vary under future climate conditions. Globally, phytoplankton biomass is projected to alter bloom timing and generally decline (Cooley et al., 2022), reducing biomass flow to higher trophic levels (du Pontavice et al., 2021). In the North Atlantic, climate change is projected to also alter plankton species distribution poleward, with longitudinal shifts related to ocean circulation and surface conditions (Barton et al., 2016). Increased temperatures and altered salinities have already been observed to increase harmful algal blooms in the North Atlantic (Gobler et al., 2017) and in other Atlantic Canadian provinces (Boivin-Rioux et al., 2021, 2022) with implications for marine species and human health.
Plankton communities are typically used as ecosystem indicators because they have a short life cycle and are highly sensitive to local environmental conditions, making them reflective of both short-term (e.g., seasonal, interannual) and longer-term climate variation (Levasseur et al., 1984; Arrigo et al., 1999; Thomas et al., 2010; Rodrigues et al., 2019; Gao et al., 2022; Finnis et al., 2023). In aquaculture sites, “top-down” control on bacteria, phytoplankton, and zooplankton communities has been observed due to filtration and ingestion, although a consensus has not been reached as to whether these effects cause an overall increase or decrease of plankton abundance and how this might vary seasonally (Norén et al., 1999; Lehane and Davenport, 2002, 2006; Maar et al., 2008; Trottet et al., 2008; Sonier et al., 2016). Plankton filtration by shellfish is known to vary temporally and may be affected by factors such as tides, life stage, population density, food availability/quality, water temperature, and current speed (Silva et al., 2019; Lin et al., 2016). Bivalves can also cause “bottom-up” control on plankton communities at a bay-scale by decreasing nutrient availability through consumption and storage (Newell, 2004) and increase nutrient availability through direct dissolved excretion and indirectly through particulate excretion, which can be remineralized by bacteria and subsequently utilized by phytoplankton (Grant et al., 1995; Dame, 1996). In the long-term, nutrient alteration and energy redirection towards the microbial loop can ultimately limit energy transfer to higher pelagic trophic levels (Rodhouse and Roden, 1987; Horsted et al., 1988; Hulot et al., 2020). This may be reflected in shifts in bacteria abundance and composition, i.e. bacterial cells with low or high nucleic acid content (LNA and HNA, respectively). LNA bacterial cells have small, streamlined genomes and limited genetics, which causes lower metabolic rates and less capability to utilize dissolved organic carbon and are thus more common in nutrient-limited environments whereas HNA cells thrive in environments with high levels of nutrients and organic matter (Servais et al., 2003; Longnecker et al., 2005; Hu et al., 2020).
Bivalve aquaculture has been reported to shift phytoplankton community composition towards faster growing species (e.g., diatoms as opposed to dinoflagellates; Prins et al., 1995; Ward and Shumway, 2004; Jiang et al., 2016, 2022) due to preferential particle ingestion, the depletion of their major competitors and predators, and increasing the depth of light penetration in the water column due to seston depletion (Schröder et al., 2014). Additionally, bivalve retention efficiency during filtration increases with increasing particle size (Ward and Shumway, 2004). For example, Sonier et al. (2016) reported that blue mussels (Mytilus edulis) have a retention efficiency of 20% ± 2% for picophytoplankton and 60% ± 3.5% for nanophytoplankton. As a general consensus, M. edulis has a 100% retention efficiency for particles larger than 4 µm (Møhlenberg and Riisgård, 1978; Riisgård, 1988), although this may vary seasonally with availability of trophic resources (Strohmeier et al., 2012).Therefore, phytoplankton community structure can shift towards smaller size fractions due to bivalve aquaculture predation (Courties et al., 1994; Vaquer et al., 1996; Souchu et al., 2001; Wetz et al., 2002; Cranford et al., 2008, 2011; Jiang et al., 2016, 2022). The overall contribution of bacteria to bivalve diets is unclear because bacteria may be ingested as free-living cells, aggregates, or attached to other seston, as in flocs (e.g. Ho et al., 2022). It has been suggested that 20 to 30% of bacteria exist within aggregates exceeding 5 µm in size (Wangersky, 1977; Sorokin, 1981), which should theoretically be retained efficiently. Bacteria can therefore be an important part of bivalve diets when the availability of phytoplankton and other foods is low, although their relative contribution and variation between ecosystems and seasons have not been defined (Stuart et al., 1982; Seiderer and Newell, 1985; Langdon and Newell, 1990; Gallardi et al., 2017). Although nano- to micro-sized plankton (> 4 μm) are generally considered the preferred food source for blue mussels, studies have shown that they can ingest mesozooplankton up to 6 mm in length, which are excreted as pseudofeces, rather than digested, and removed from the pelagic food web (Davenport et al., 2000; Lehane and Davenport, 2002).
In an aquaculture monitoring context, the effects of seasonality on shellfish aquaculture ecosystem interactions are poorly understood, but are important considerations to detect interannual plankton change, informing the direction, magnitude and drivers of change, and linking key ecosystem drivers to observed change (Lavaud et al., 2020; Guyondet et al., 2022; Brito et al., 2023). Seasonality is a major factor in variation of marine environmental conditions (e.g., water temperature, terrestrial freshwater and nutrient input, sea ice cover, water column stratification, and light availability), directly influencing phytoplankton community composition and abundance. Seasonal patterns of microbial communities in the water column may also directly impact their own population fitness and biogeochemical processes (Kondo et al., 2012; Sevellec et al., 2019). Additionally, meroplankton (i.e., aquatic organisms with both planktonic and benthic stages – often larval stages of larger organisms) may exhibit seasonal and inter-annual variation in shifts from planktonic to benthic forms (Selifonova, 2012; Michelsen et al., 2017) with potentially important consequences for interactions with shellfish aquaculture and competition for phytoplankton (Byron et al., 2011).
To better inform aquaculture ecosystem interactions, the present study investigates seasonal patterns in the abundance and community structure of several plankton fraction sizes, from 0.2 µm (bacteria and picophytoplankton) up to 5 mm (mesozooplankton), near a blue mussel aquaculture lease on the northeast coast of Newfoundland, Canada. Monthly sampling was conducted from June 2021 to July 2022 to characterize plankton succession and identify optimal sampling periods for interannual comparisons and inform monitoring and interpretation of long-term shellfish aquaculture ecosystem impacts. To our knowledge, this is the first study characterizing the seasonal succession of plankton spanning five orders of magnitude in size, in a shellfish aquaculture embayment. This work is part of the federal Canadian Aquaculture Monitoring Program (AMP) which, in part, informs policy and decision-making through assessments of the impacts of shellfish aquaculture on ecosystems.
2 Materials and methods
2.1 Plankton terminology
In this paper, bacteria refers to heterotrophic marine bacterioplankton 0.2 to 1.0 μm in size, picophytoplankton (PPP) refers to autotrophic cells 0.2 to 2.0 μm in size and nanophytoplankton (NPP) comprises autotrophic cells 2.0 to 20 μm in size. For the purpose of this study, PPP and NPP are further classified into the following functional groups: eukaryotes, phycocyanin-containing cyanobacteria (pico- and nano-PC), and phycoerythrin-containing cyanobacteria (pico- and nano-PE). The presence of phycocyanin pigments is an indicator of freshwater cyanobacterium (Poniedziałek et al., 2017) while phycoerythrin pigments are an indicator of the marine cyanobacterium Prochlorococcus and Synechococcus, the two most abundant oxygenic phototrophs on Earth (Mella-Flores et al., 2012). Microplankton comprises autotrophic and heterotrophic cells 20 to 250 μm in size, although due to sampling and laboratory procedures, data are presented for two microplankton size fractions: 30 to 73 μm (Micro30-73) and 73 to 250 μm (Micro73-250). Here, mesozooplankton comprises zooplankton 250 μm to 5 mm in size, with the exception of Chaetognatha spp. which were the only taxa identified that exceeded this limit.
2.2 Regional setting
South Arm is the southernmost inlet (20 to 50 m depth, 1 to 2 km width, 15 km length) of New Bay, a large and deep embayment (up to 440 m depth and 4 km width) connected to Notre Dame Bay and the Atlantic Ocean on the northeast coast of Newfoundland, Canada (Figure 1). The area experiences generally weak seasonal currents (Gallardi, 2016) and a small tidal range (0.27 to 1.18 m; Canadian Hydrographic Service, Leading Tickle, 01087), but is nevertheless a hydrodynamically complex system. A sill of less than 30 m separates the inner basin from the main channel, possibly promoting internal waves, internal mixing, and material resuspension (Gallardi, 2016). It is a seasonally stratified two-layer system driven by freshwater input from local ice melt and other seasonal influences from outside the bay, as there is no significant riverine input (Gallardi, 2016). In the fall, wind-driven mixing from storms and strong wind events promote mixing of the layers, thus deepening the seasonal pycnocline.

Figure 1. Location of sampling stations (Inner, Mid, Outer) in relation to the shellfish aquaculture lease area in (A) South Arm (49.34°N, 55.32°W) in (B) northeast Newfoundland, Canada.
On the northeast coast of Newfoundland, Canada, blue mussel (Mytilus edulis) aquaculture farming has been an economically important industry for more than 40 years and is expanding through the region. South Arm holds two large blue mussel leases totaling 2.80 km2, which cover 24.8% of the bay area (Finnis et al., 2023; Land Use Details (gov.nl.ca)). Blue mussels are cultured using a traditional longline system suspended at approximately 5 m below the surface, with a 5 m sock length, sitting 5 to 10 m below surface. Here, mussels may be harvested throughout the year at a market size of 50 to 75 mm (Gallardi, 2016).
2.3 Sampling design
Samples were collected at three stations: Inner (49.34655°N, 55.3311°W), Mid (49.35183°N, 55.3235°W), and Outer (49.35983°N, 55.3107°W), creating a linear gradient from the aquaculture lease area to the outer section of the bay (Figure 1). From June 2021 to July 2022, samples were collected each month excluding January 2022, due to weather conditions. At each station, a conductivity/temperature/depth monitor (CTD; Sea-Bird Electronic (SBE) instruments, model 19plus V2, Sea-Bird Scientific, WA, United States) equipped with a fluorometer and turbidity meter (ECO-FL-NTU WET Labs, Sea-Bird Scientific, WA, United States) was deployed at a constant descending and ascending speed of 0.5–1 m s–1 from surface to 3–5 m above seafloor to record temperature, salinity, and oxygen saturation. The CTD profiles (Unpublished data to be made publicly available by D. Gallardi) were processed using SBE data analysis software, following the recommended procedure as described in Donnet et al. (2018); the processed data resulted in one value for each meter of water depth.
2.4 Sample collection
Water samples (n = 114) for the analysis of bacteria, PPP, and NPP were collected using a 5L Niskin bottle from three depths, referred throughout as surface, mid, and deep. Surface samples were collected 6 m below the surface to include the same layer of water where the mussels were positioned. Mid samples were collected at the approximate chlorophyll maxima, determined using fluorescence (proxy for chlorophyll a) values from the CTD casts. Notably, in August 2021, the Inner and Mid stations showed two fluorescence peaks during CTD profiles, therefore the surface sample captured the first peak and the mid sample captured the second peak. Additionally, in November 2021, the fluorescence peak at the Mid station was at 5 to 6 m below surface, therefore the surface sample captured the peak, while the mid sample was collected at the middle point between the surface and deep samples. Deep samples were collected 4 m above the seafloor, to be as close to the bottom as possible without the effect of resuspension. Immediately upon sample collection, two 4.5 mL subsamples were well mixed with 20 µL glutaraldehyde Grade 1 (Sigma; 0.1% final concentration) in cryovials and incubated at ambient temperature in the dark for 15 minutes. The subsamples were then placed on ice while in the field and subsequently stored at −80°C until analysis at the Institut des Sciences de la Mer de l’Université du Québec à Rimouski (Canada).
Two vertical tows were sampled at each station (30 µm and 250 µm net mesh) from 2 m above the seafloor to the surface at an ascending speed of 1 m s–1. Immediately upon retrieval, all samples were preserved with 40% formaldehyde (final concentration 4% w/v formalin). The water volume filtered through the net was calculated using the depth of the water column and the net area, which was subsequently used for abundance calculations. 38 samples were collected using the 30 µm net, and 35 samples were collected using the 250 µm net.
2.5 Flow cytometry
Subsamples for heterotrophic bacteria enumeration were stained with SYBR Green I (Invitrogen) following Belzile et al. (2008). Bacteria (and archaea, collectively referred to here as bacteria) were counted with a CytoFLEX flow cytometer (Beckman Coulter) using the blue laser (488 nm). Green fluorescence of nucleic acid-bound SYBR Green I was measured at 525 nm (525/40 nm BP). The cytograms obtained were analyzed using CytExpert v2.3 software and the same regions of the side scatter vs. green fluorescence plots were ascribed LNA and HNA bacterial cells for the whole dataset.
Subsamples for < 20 µm autotroph abundances (PPP and NPP) were analyzed using a CytoFLEX flow cytometer (Beckman Coulter) fitted with a blue (488 nm) and a red laser (638 nm). Using the blue laser (forward scatter, side scatter) orange fluorescence from phycoerythrin (582/42 nm BP) and red fluorescence from chlorophyll (690/50 nm BP) were measured. The red laser was used to excite the red fluorescence of phycocyanin (660/20 nm BP). Polystyrene microspheres of 2 µm diameter (Fluoresbrite YG, Polysciences) were added to each sample as an internal standard. Pico- (0.2 to 2 µm) and nano-autotrophs (2 to 20 µm) were discriminated based on a forward scatter calibration using algal cultures. Notably, nano-sized autotrophs containing phycoerythrin or phycocyanin were ascribed to nano-cyanobacteria, but could also have been cryptophytes or rhodophytes (Kirk, 1994).
2.6 FlowCam imaging
Samples collected with the 30 µm mesh net were split into four subsamples using a Folsom plankton splitter and separated into Micro30-73 and Micro73-250 size fractions. Subsamples were subsequently rinsed into 50 mL of 0.2% Triton-x and de-clumped using a magnetic stirrer. A 1 mL subsample of each size fraction was entirely image-processed using a flow imaging microscopy system, FlowCam Micro (Yokogawa Fluid Imaging Technologies, Inc.), using a 10× objective lens for Micro30-73 and a 4× objective lens for Micro73-250. All images were cleaned (i.e., removing images of debris, bubbles, fragments, etc.), and classified into functional groups by experienced taxonomists using the two-dimensional black and white digital images in VisualSpreadsheet version 4.18.5 (Yokogawa Fluid Imaging Technologies, Inc. 2020, n.d.). Following the recommendations of Owen et al. (2022), S1 provides the information required to reproduce the results using FlowCam Micro technology.
Samples collected with the 250 µm mesh net were split into four subsamples using a Folsom plankton splitter and separated into 250 µm to 2 mm and 2 to 5 mm size fractions. Subsamples were subsequently rinsed into 400 mL of 0.2% Triton-x and de-clumped using a magnetic stirrer. One subsample was entirely image processed using a flow imaging microscopy system, FlowCam Macro (Yokogawa Fluid Imaging Technologies, Inc.), using a 2 mm flow cell for the smaller size fraction and a 5 mm flow cell for the larger size fraction. Chaetognatha spp. were the only specimens identified that exceeded 5 mm (body length up to 28 mm, 210 specimens counted in total) and were thus removed and measured manually. VisualSpreadsheet version 4.18.5 was used (Yokogawa Fluid Imaging Technologies, Inc. 2020, n.d.) and images of objects < 250 µm in length removed using a pre-set filter. A fraction of the images was randomly selected for analyses, cleaned (i.e., removing images of debris, bubbles, fragments, etc.), classified at the highest taxonomy level as possible by experienced taxonomists using the two-dimensional black and white digital images in VisualSpreadsheet. From 344 to 1902 (average 1345 ± 411) images of zooplankton specimens were identified by taxonomists, constituting 29 to 100% of total zooplankton images (7 to 25% of the full sample). Important information required to reproduce the results involving FlowCam Macro technology, as well as a complete list of the confirmed zooplankton taxa, are detailed by Finnis et al. (2023).
2.7 Statistical analysis
The relationship between plankton abundance and environmental conditions was evaluated with water temperature and salinity as predictor variables for bacteria, PPP, and NPP abundance using simple and multiple linear regressions, as previously reported in northwestern regions (e.g., Morán et al., 2010; Sugie et al., 2020). All dependent variables were log-transformed to normalize data distribution. Both regression analyses were conducted to discern their individual and combined relationship to plankton abundance. Pearson correlation coefficients were used to test environmental covariates for collinearity. Only data (water temperature, salinity, plankton abundances) collected from the surface and mid depths were used for regression analysis to reduce the effect of water depth.
Two-dimensional non-metric multidimensional scaling (NMDS) ordinations (Borg and Groenen, 2005) were used to graphically display seasonal patterns in plankton community composition to show variation in plankton community composition (taxa and abundance). Permutational multivariate analysis of variance (PERMANOVA) was used (number of permutations = 9999) to evaluate variation in plankton communities over time. Month and station were tested for all size fractions, while water depth was also tested for bacteria, PPP, and NPP. When significant, pairwise comparisons were used to identify which groups contributed most to the variation. Pairwise comparisons of months were done for bacteria and PPP-NPP, but could not be done for micro- or meso-plankton due to insufficient statistical power (i.e., not enough unique permutations as 100 unique permutations are needed to obtain a statistically significant p-value of 0.01). NMDS ordinations and PERMANOVAs were constructed using a Bray-Curtis dissimilarity matrix of square root transformed abundance data. All analyses were done using the vegan package in R (Oksanen et al., 2022); the metaMDS function was used for NMDS ordinations, and the adonis2 function was used for PERMANOVAs. Using the pairwiseAdonis package (Arbizu, 2017), the pairwise.adonis2 function was used for pairwise comparisons. Similarity percentage analysis (SIMPER) was used to identify the mesozooplankton taxa that contributed most to the dissimilarities between significant groups, using the SIMPER function from the vegan package (Oksanen et al., 2022). The permutation p-value represents the probability of getting a larger or equal average contribution based on 999 random permutations of input data.
The seasonal and spatial relationship between plankton abundance and size fraction was evaluated using linear regressions of log10-transformed values. Since plankton size is quantified as size fractions during flow cytometry, rather than the size of each cell, the median value of each size fraction was used for bacteria, PPP, and NPP. As in Lombard et al. (2019), the mean Equivalent Spherical Diameter (ESD) was used for samples analyzed with the Micro- and Macro-FlowCams; both referred to as “body size” for simplicity during analysis. Statistical analyses were not conducted for months and stations where abundance data of one or more size fraction was not available. Intercepts and slopes of the log-transformed size-abundance distribution were calculated for each station as proxies for productivity and energy transfer efficiency, respectively. Ecological pyramids were constructed as an alternate portrayal of the same information as size distribution slopes, showing the average of the three stations to highlight seasonality.
3 Results
3.1 Structure of the water column
From June 2021 to July 2022, monthly CTD casts showed a seasonally stratified water column from April to November (Figure 2). Temperature averaged 2.72 ± 0.13°C (min = 2.59°C, max = 3.14°C) throughout the water column from December to May. From June to November, temperature ranged −0.32 to 7.44°C at the deep layer and 1.86 to 18.06°C at the mid and surface depths, with the highest temperature recorded in August. Salinity was fairly uniform throughout the water column from December to March, but showed a distinct halocline from April to November, ranging 30.09 to 32.14 PSU at the surface and 31.22 to 32.56 PSU near the seafloor. Oxygen saturation ranged 86.19 to 106.84% at the surface and mid depths, while a steady decrease from 99.01 to 21.47% was observed near bottom at the Inner and Mid stations from March to November, then returning to high values (93.06 to 93.28%) when the water column mixed. Fluorescence values ranged 0.08 to 3.7 µg L−1 throughout the annual cycle, with the exception of March, which peaked at 7.63 µg L−1.

Figure 2. CTD cast data reporting (A) water temperature, (B) salinity, (C) oxygen saturation, and (D) fluorescence (proxy for chl a) from June 2021 to July 2022. Color represents the depth measurement at which the water samples were collected and shape represents the sampling station.
3.2 Plankton abundance
Plankton abundance decreased with increasing size fraction (Figure 3). Bacteria ranged from 2×10¹¹ to 2×10¹² individuals m–3, while PPP and NPP ranged 1×10⁷ to 1×10¹¹ individuals m–3 and 2×10⁷ to 2×10¹⁰ individuals m–3, respectively. Overall, bacteria, PPP and NPP abundances were higher in the surface and mid samples than in the deep samples. Micro30-73 ranged from 1×10² to 1×10⁵ individuals m–3 while Micro73-250 ranged from 2×101 to 1×10³ individuals m–3 and mesozooplankton ranged 3×10² to 3×10³ individuals m–3.
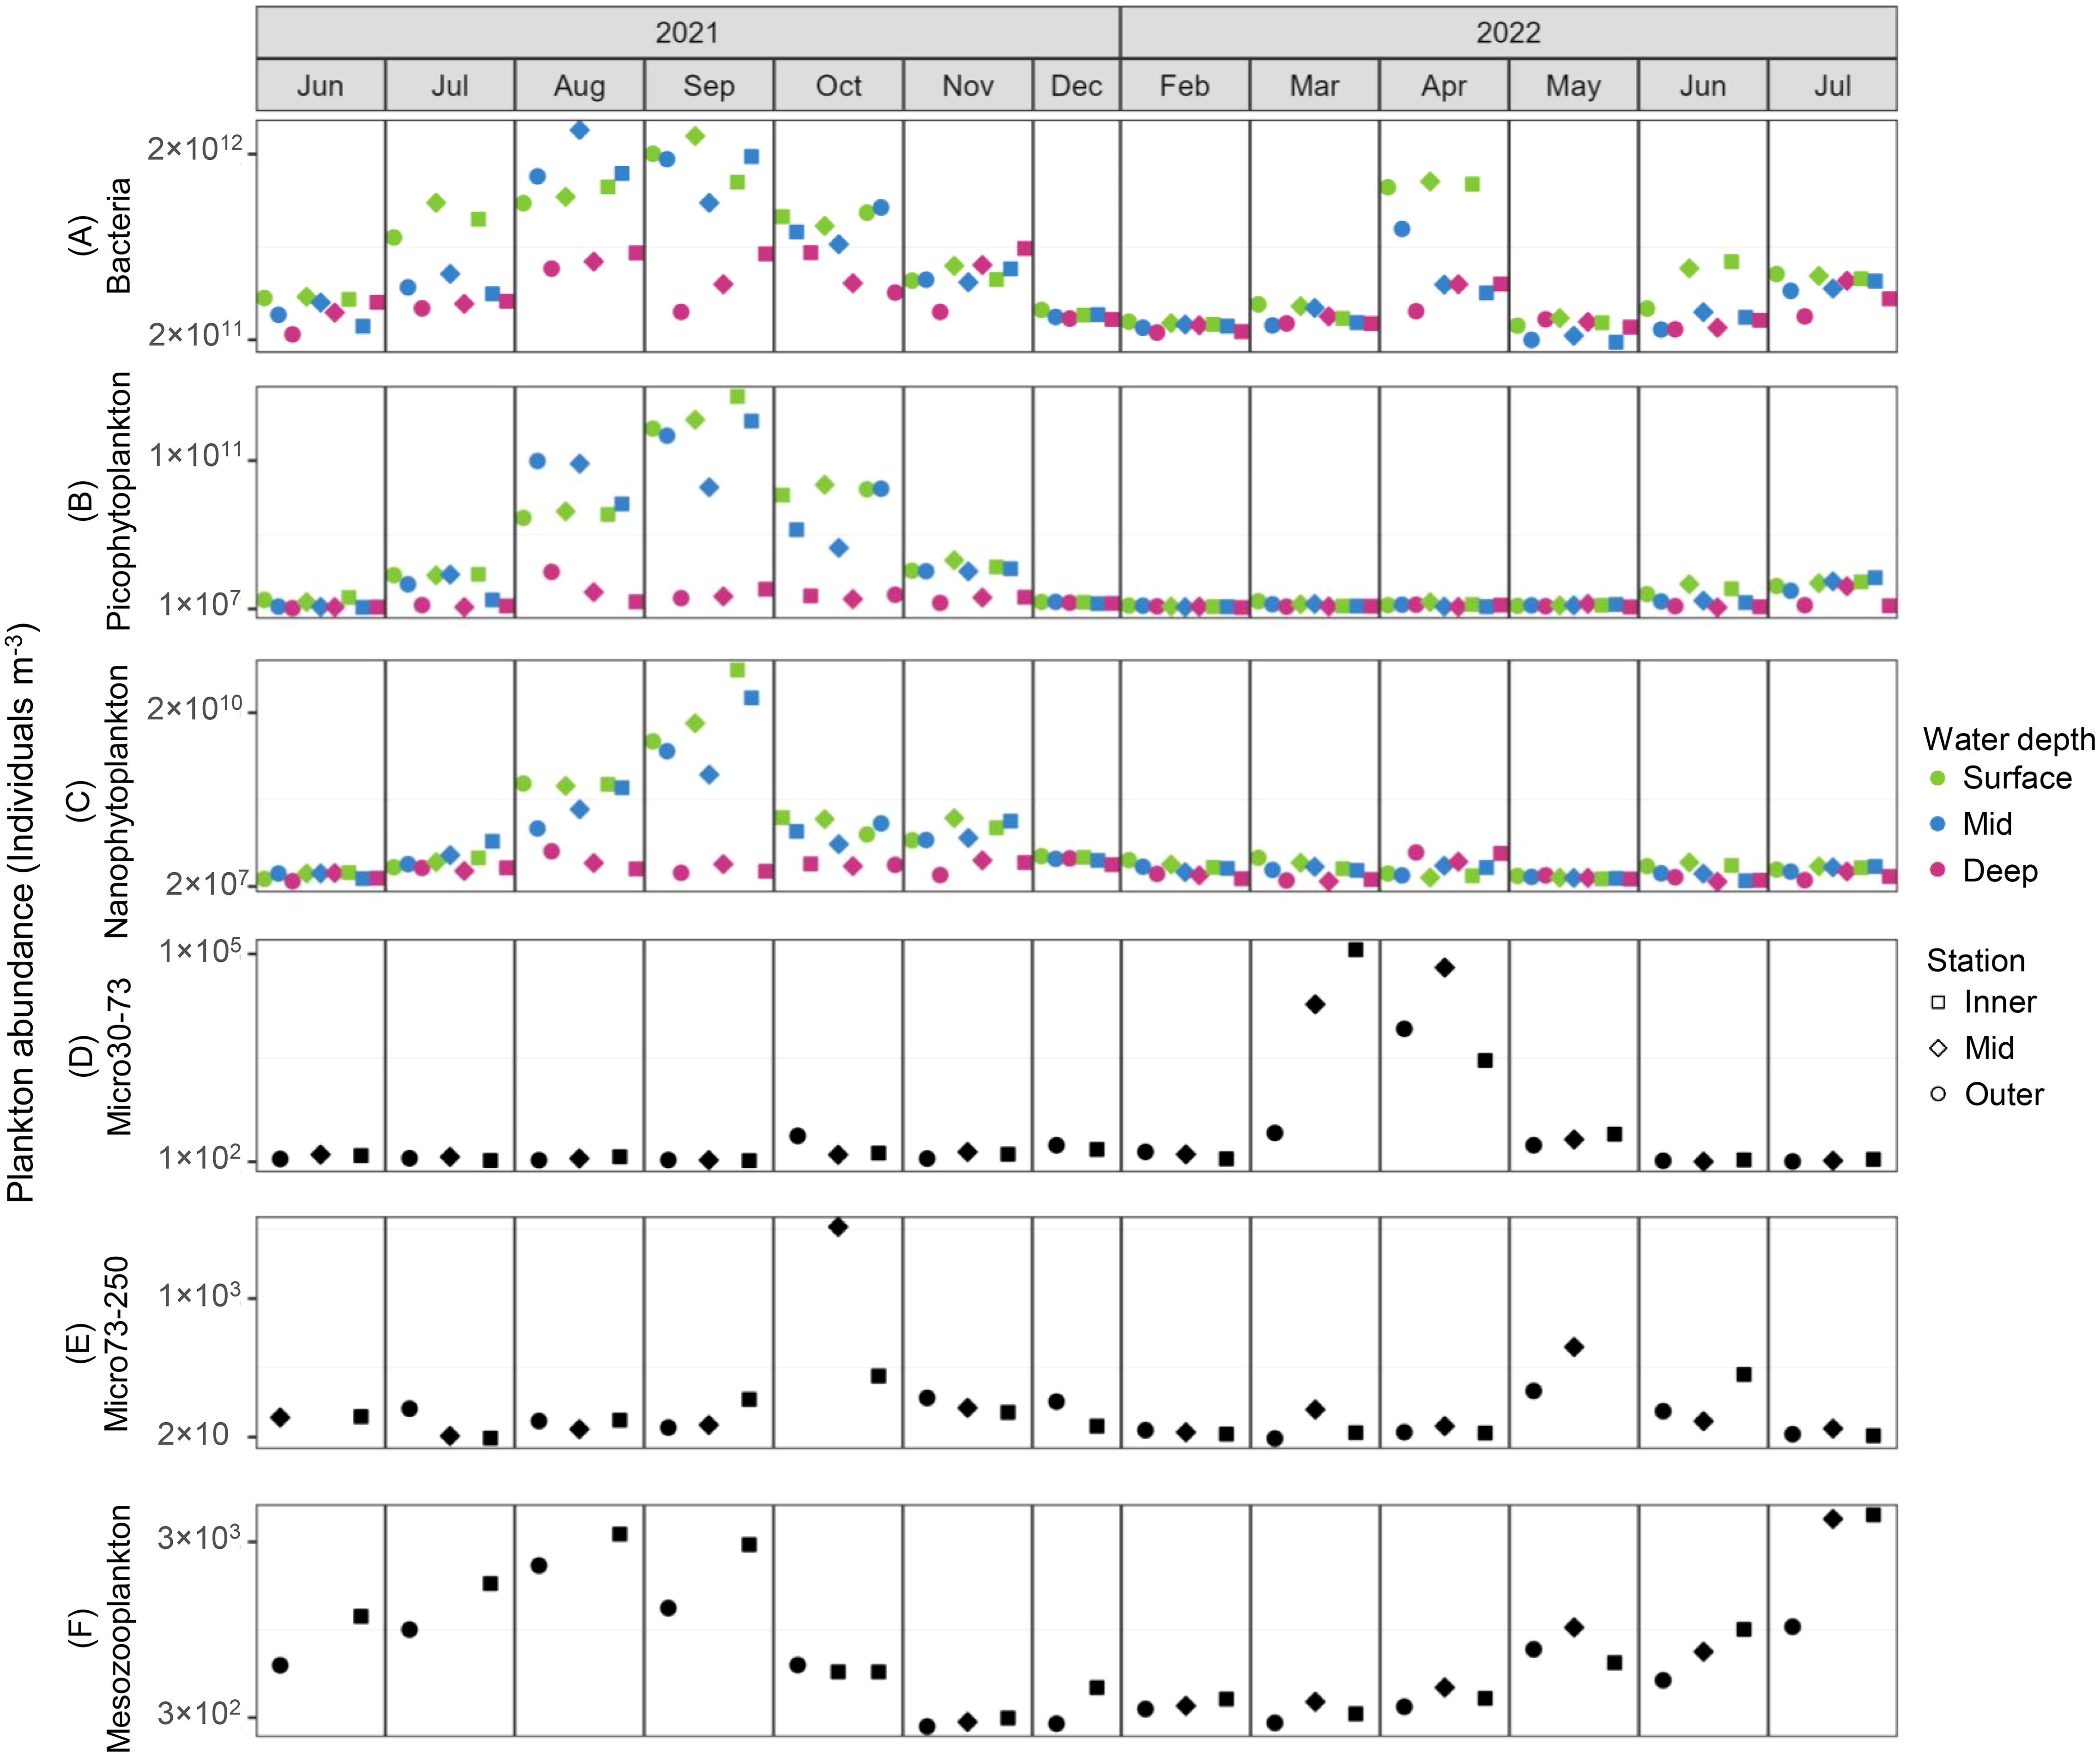
Figure 3. Abundance (individuals m−3) of (A) heterotrophic bacteria (0.2 to 1 µm), (B) picophytoplankton (0.2 to 2 µm), (C) nanophytoplankton (2 to 20 µm), (D) microplankton (30 to 73 µm), (E) microplankton (73 to 250 µm), and (F) mesozooplankton (250 µm to 5 mm) from June 2021 to July 2022. Color represents the depth at which water samples were taken for (A–C), while samples in (D–F) were collected using vertical tows and span the entire water column. Shape represents the sampling station.
Monthly plankton abundances showed a clear seasonal trend for all fraction sizes (Figure 3). Micro30-73 had a spring bloom in March and April of 2022, in addition to elevated abundances of surface bacteria in April, followed by increased abundance of Micro73-250 in May and June. Mesozooplankton abundances, which began increasing in May and steadily increased through September, were consistently higher at the Inner station from June to September. Bacteria had a second peak in August and September, followed by peaks in PPP and NPP. We then observed a peak in Micro73-250 in October.
As indicated by simple linear regression analysis (Figure 4; Table 1), abundances of bacteria, PPP, and NPP were positively correlated with water temperature (R2 = 0.51 to 0.83, p < 0.0001) and negatively correlated with salinity (R2 = 0.27 to 0.56, p < 0.0001). Multiple linear regression analysis (Table 1) indicated that the inclusion of both temperature and salinity resulted in a marginally more powerful model compared to simple linear regressions for bacteria and PPP abundance, PPP, however temperature alone was the best predictor of NPP abundance. Notably, the multiple linear regression model may be influenced by the correlation between temperature and salinity (Pearson correlation coefficient = −0.65, p <0.0001).
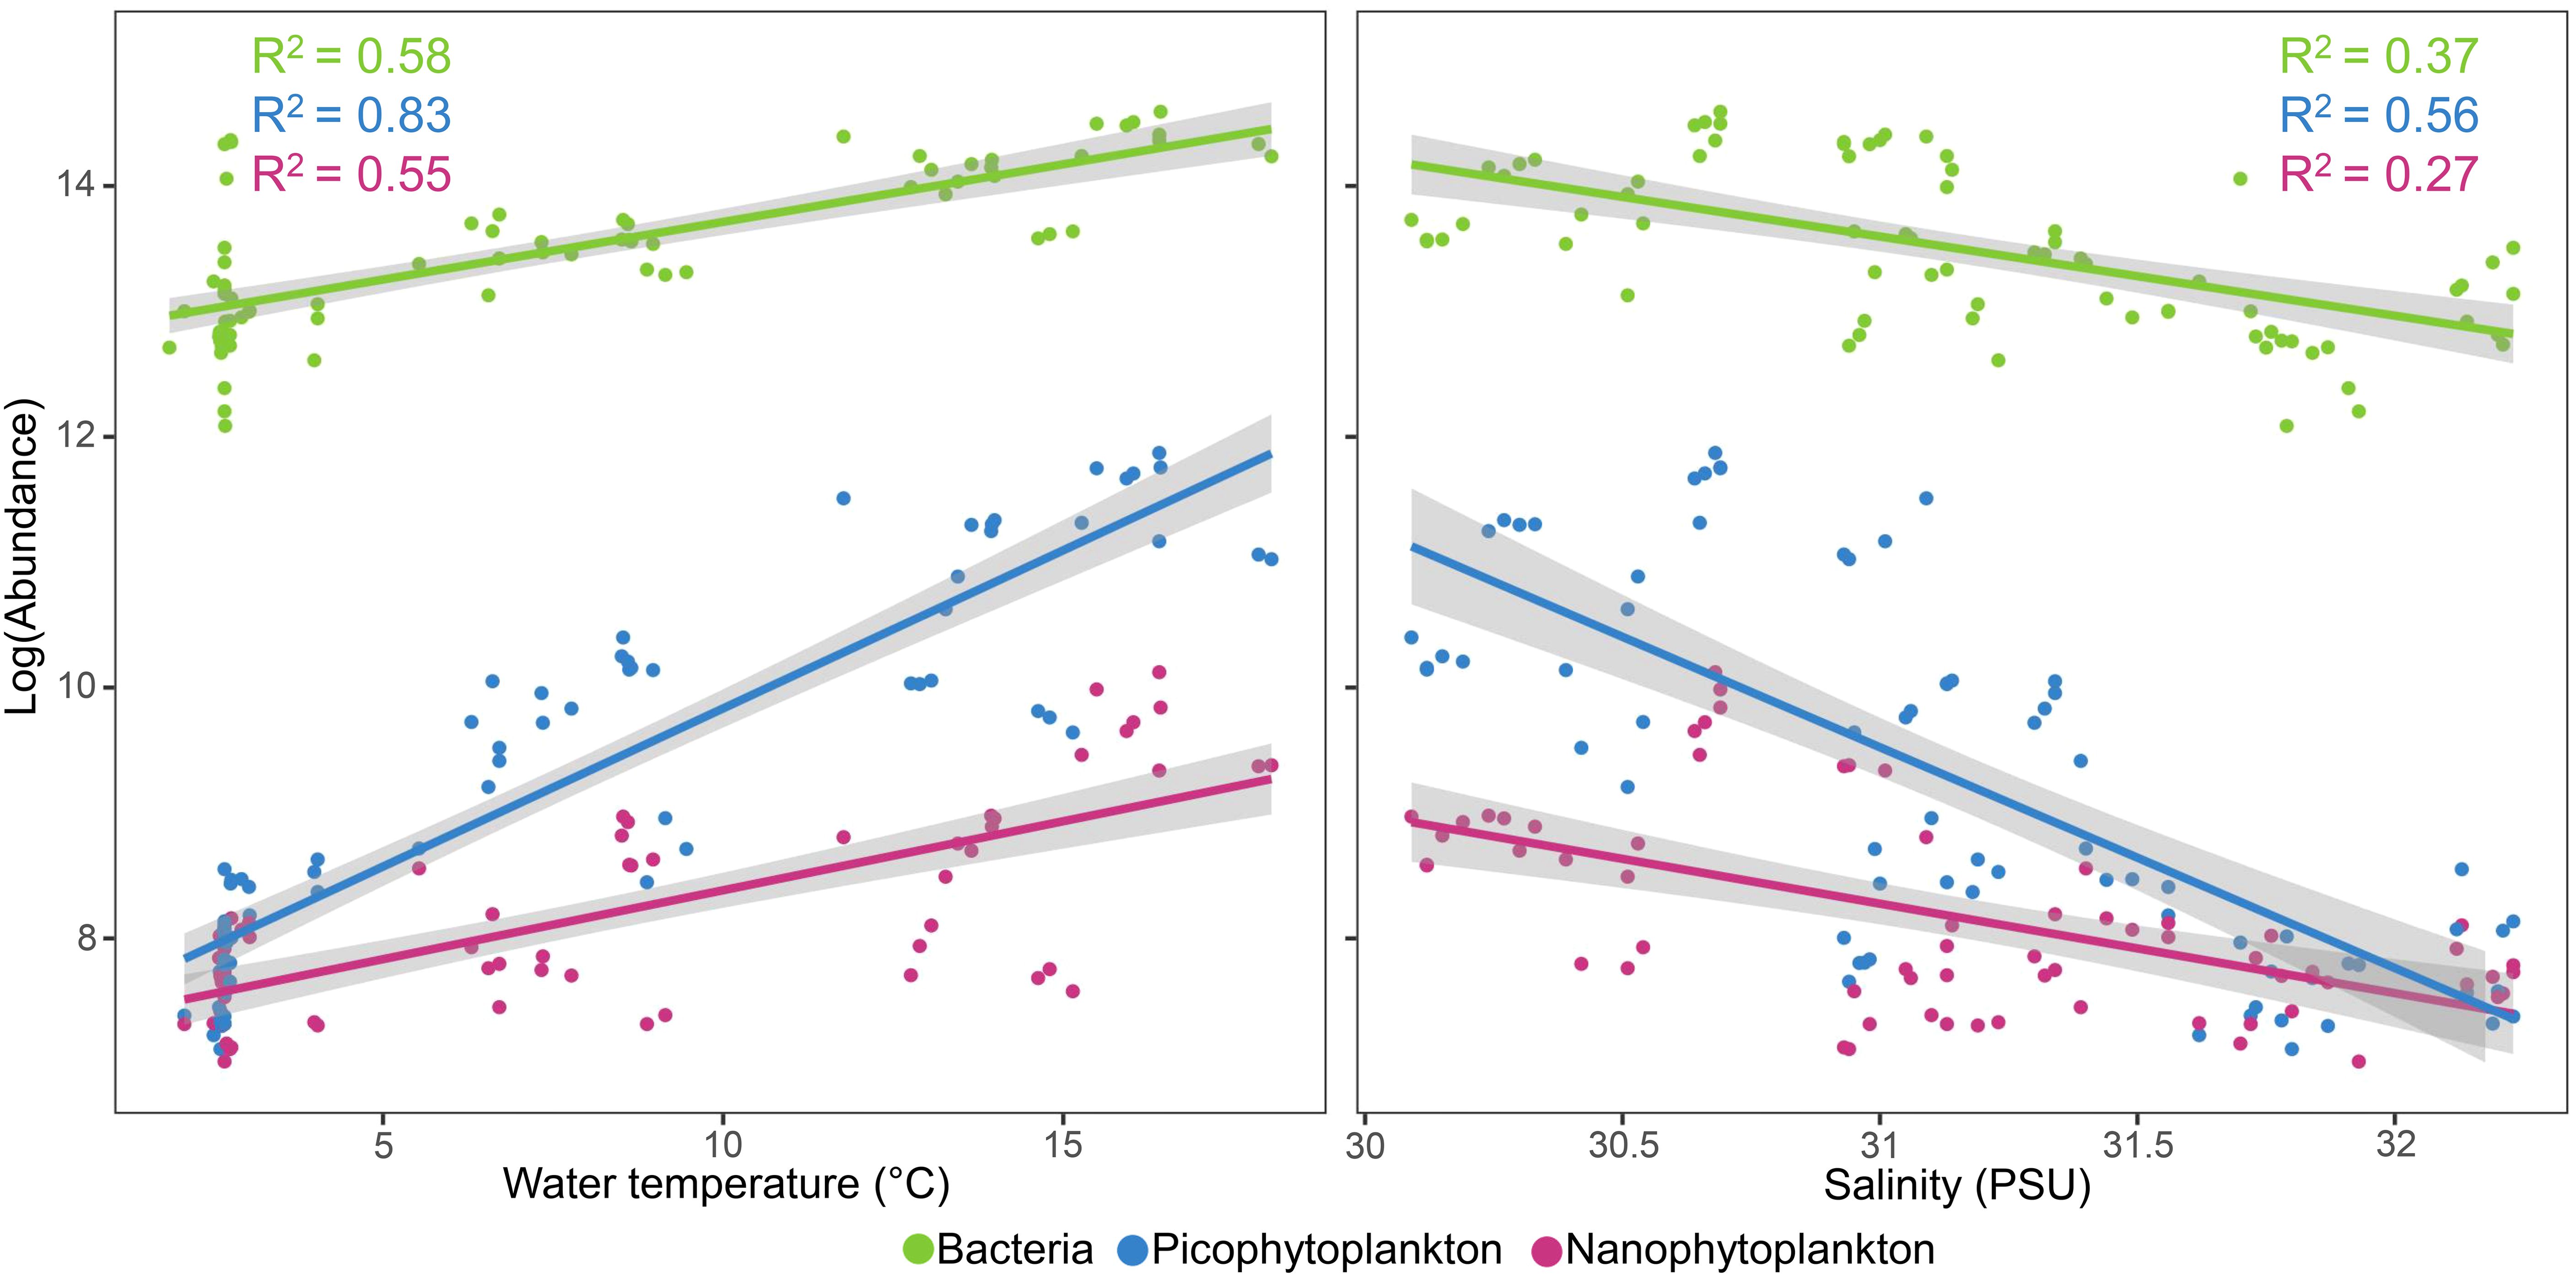
Figure 4. Linear regression of water temperature and salinity as predictors of bacteria, pico- and nano-phytoplankton abundance (cells mL−3) using data collected from surface and mid depths.
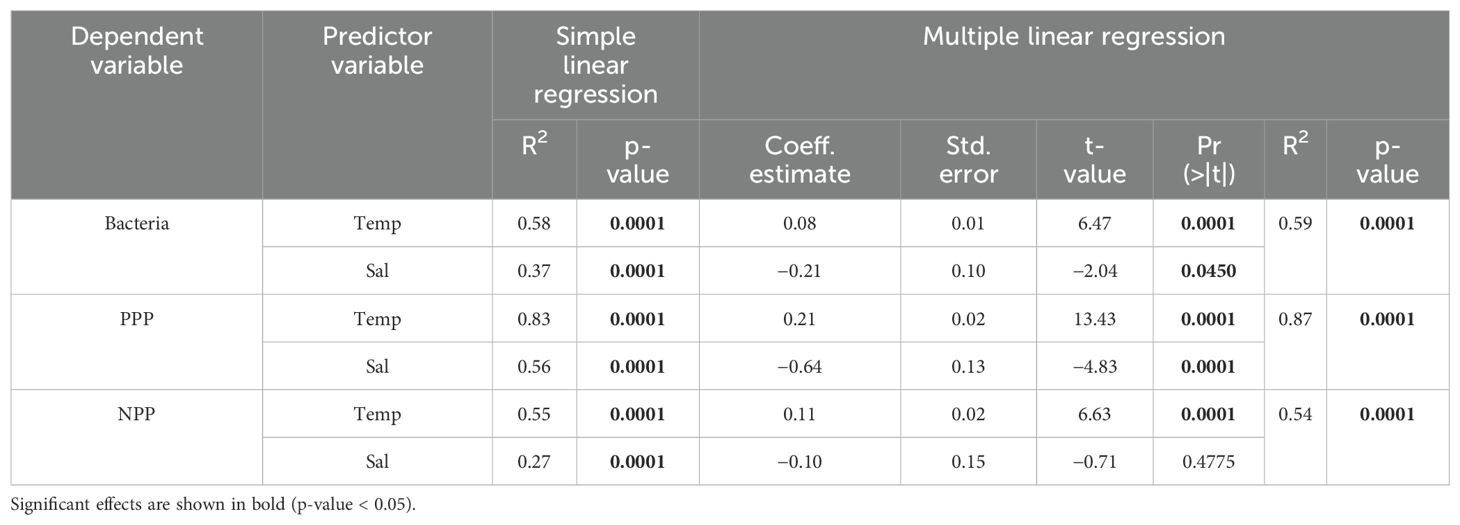
Table 1. Simple and multiple linear regression statistics of water temperature and salinity as predictors of bacteria, pico- and nano-phytoplankton (PPP and NPP) abundance (cells mL−3) using data collected from surface and mid depths.
3.3 Plankton community composition
There was significant variation in plankton composition across all size fractions between sampling months (Table 2). Pairwise comparisons indicated that bacteria and PPP-NPP did not differ significantly between years (June 2021–2022 and July 2021–2022; Figure 5). Additionally, the composition of both bacteria and PPP-NPP did not differ significantly between August and October. Bacteria and PPP-NPP composition differed significantly between water depths (Table 2) with pairwise comparisons revealing that bacteria composition only differed significantly between the surface and deep samples (Pseudo-F = 14.264, R2 = 0.162, p = 0.0003), while PPP-NPP composition differed significantly between surface and deep (Pseudo-F = 18.931, R2 = 0.204, p = 0.0001) and between mid and deep samples (Pseudo-F = 10.762, R2 = 0.127, p = 0.0002). Station effect was evaluated on all size fractions, but was only significant for mesozooplankton (Pseudo-F = 4.919, R2 = 0.026, p = 0.0082) with no statistically significant pairwise comparisons. SIMPER analysis identified that the highest overall average dissimilarity was observed between the Outer and Mid stations (Av. dissim. = 45.07%, Table 3). Dissimilarity between Mid and the other two stations was mainly driven by the cladoceran Evadne spp., the copepod Acartia spp., and the tunicate Fritillaria spp. The average dissimilarity between the Outer and Inner stations (43.60%) was mainly driven by copepods (Acartia spp., Temora spp., Pseudocalanus spp.) and the cladoceran Evadne spp. (Table 3).
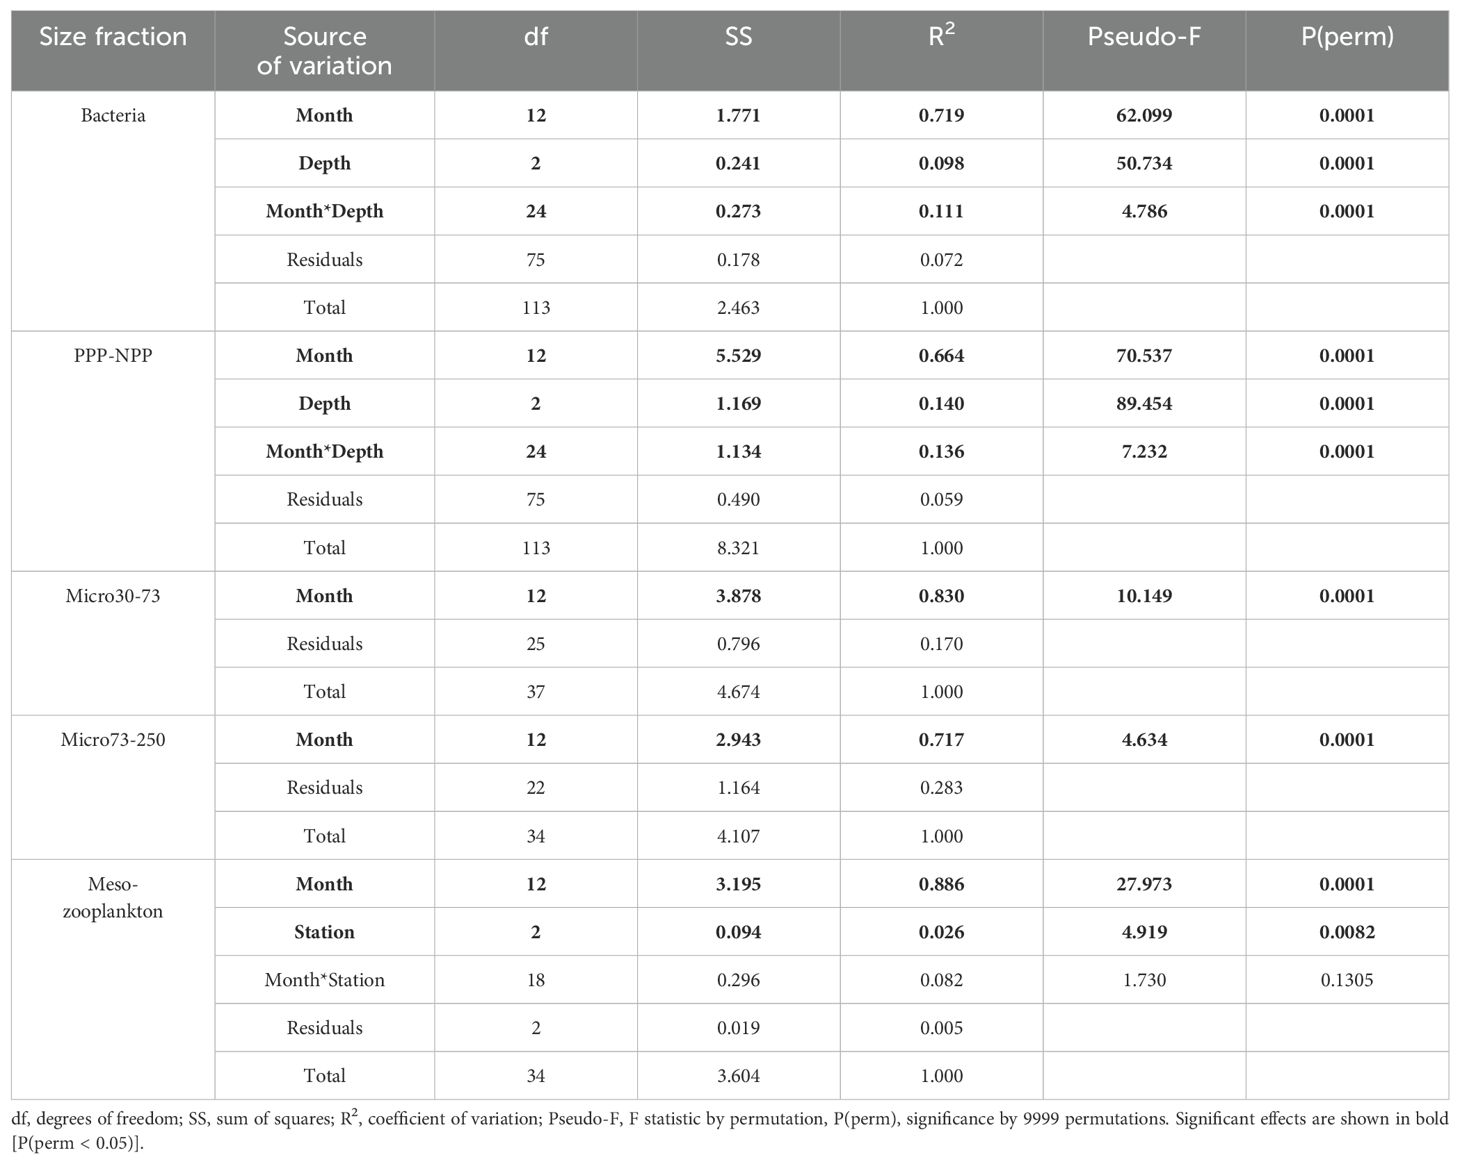
Table 2. Summary of statistically significant permutational multivariate analysis of variance (PERMANOVA) results based on a Bray-Curtis dissimilarity matrix of square root transformed plankton abundances for South Arm from June 2021 to July 2022.
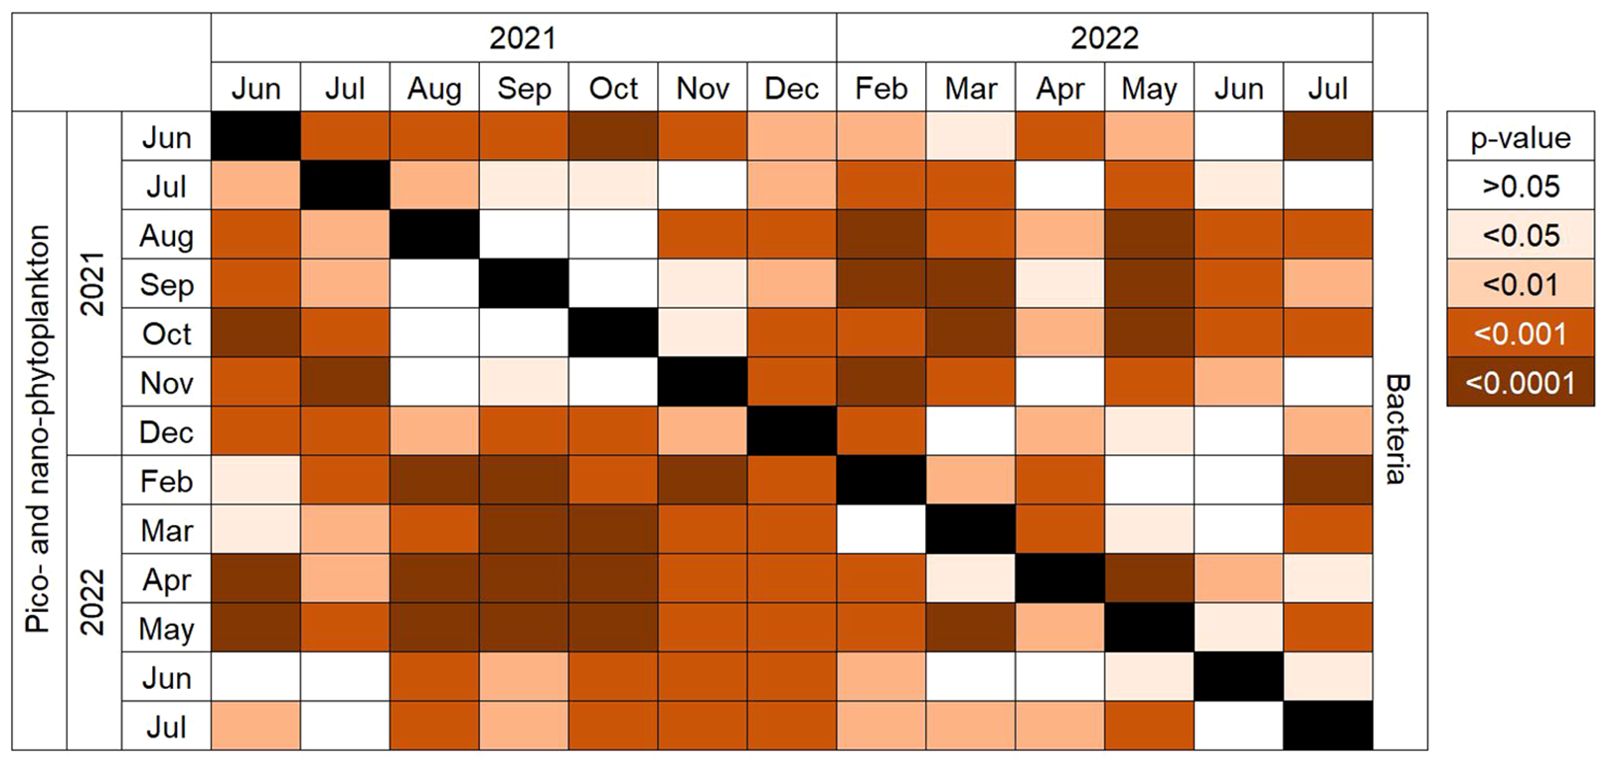
Figure 5. Pairwise comparisons of months from the PERMANOVA for bacteria (above diagonal) and PPP and NPP (below diagonal). Color indicates statistical significance.
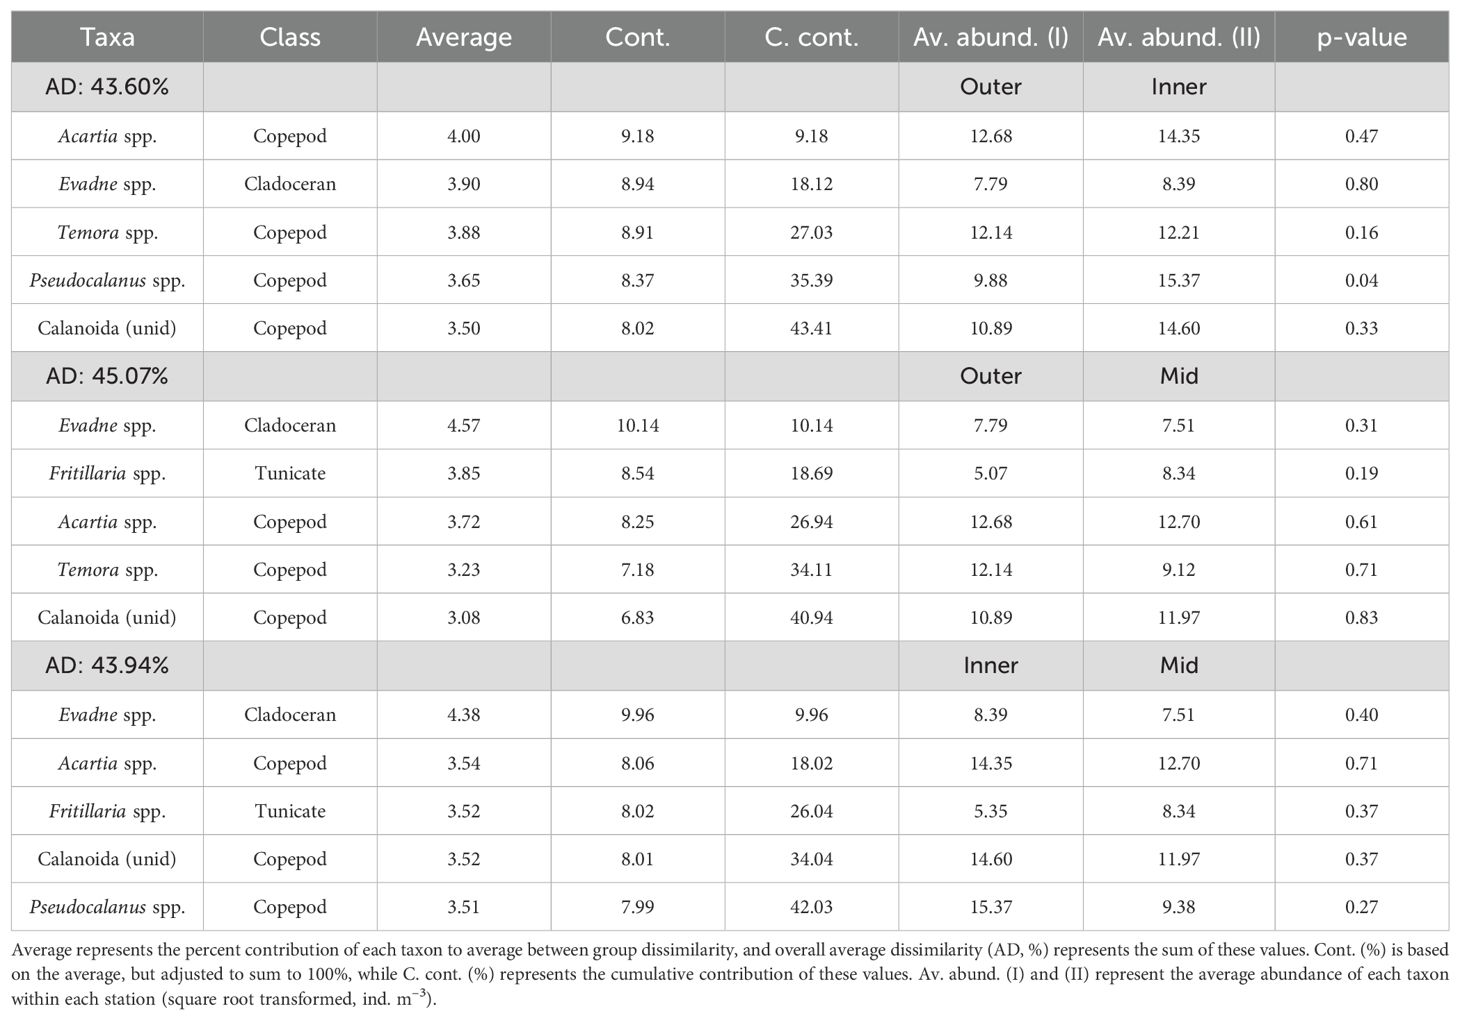
Table 3. Similarity percentage (SIMPER) analysis indicating the five mesozooplankton taxa that contribute most to the average Bray-Curtis dissimilarities between stations.
PPP-NPP community composition exhibited a clear seasonal pattern throughout the water column (Figure 6) with slightly lower % PPP (of total < 20 µm phytoplankton) in the deep samples (33 to 90%) compared to the surface and mid samples (40 to 95%). When the water column was well-mixed (December to March), community composition was characterized by significant contributions of pico- and nano-eukaryotes, picoPC, and picoPE. During April and May, when influxes of freshwater created a strong pycnocline, an increase in the relative abundance of picoPC, an indicator of freshwater cyanobacterium, was observed. Increased relative abundance of picoeukaryotes was subsequently observed in June and July of both sampling years (2021 and 2022). August to November exhibited the highest absolute abundances of PPP and NPP, and were dominated by picoPE, an indicator for the marine cyanobacterium Prochlorococcus and Synechococcus.
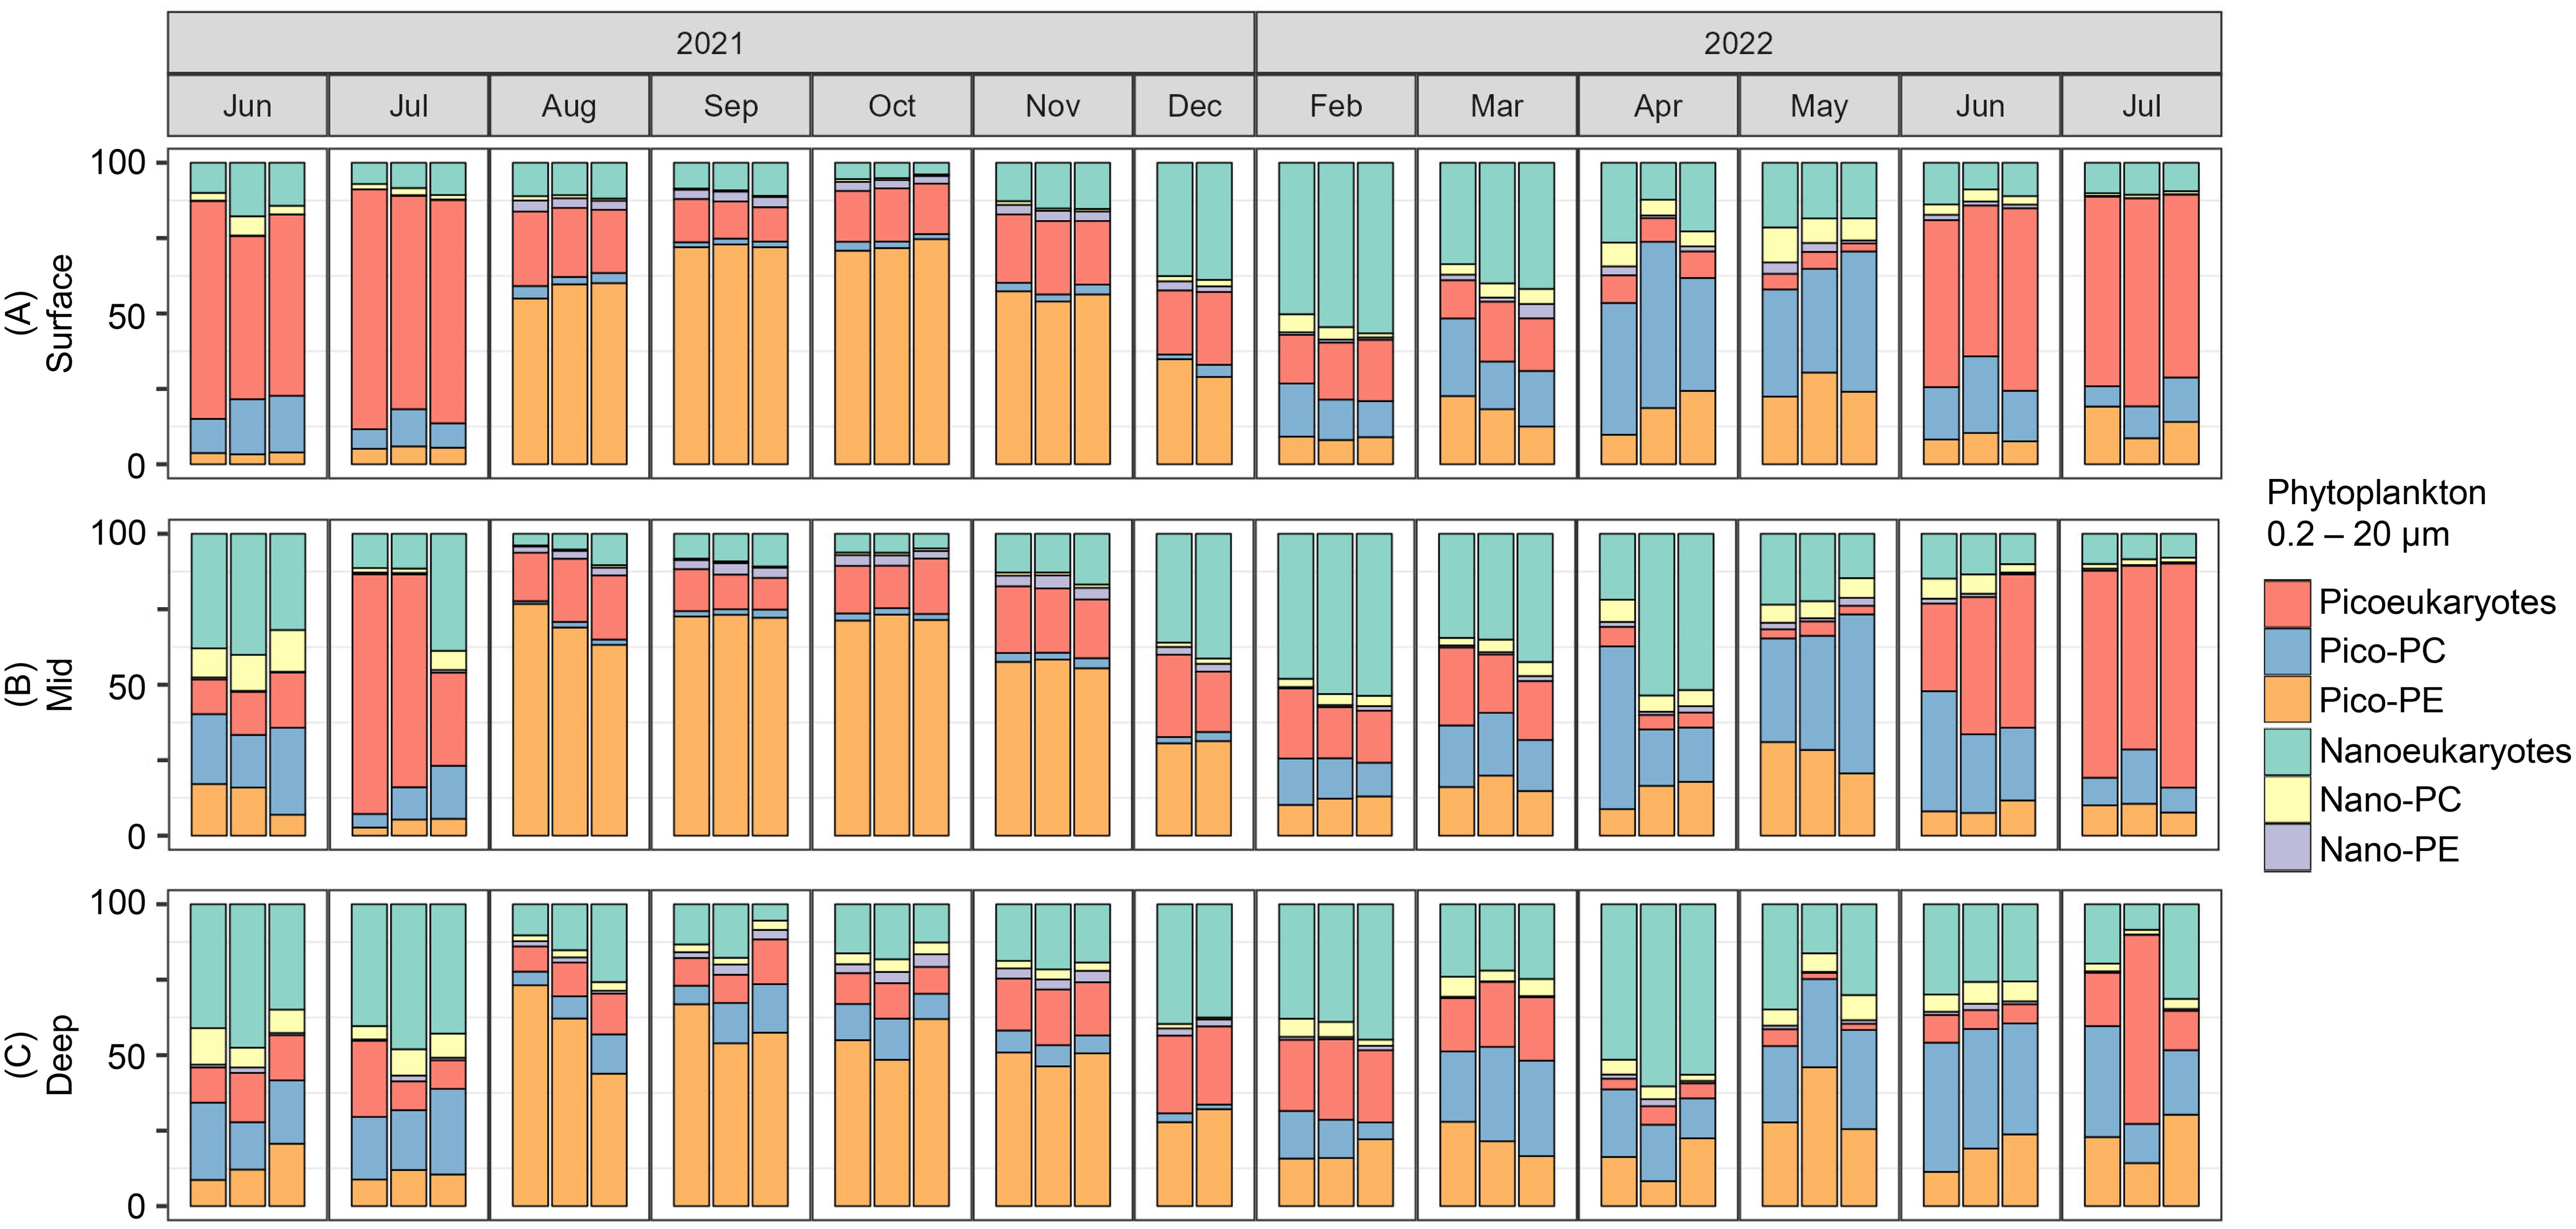
Figure 6. Stacked bar charts showing the relative abundance (%) of pico- (0.2 to 2 µm) and nano- (2 to 20 µm) sized eukaryotes, PC-containing cyanobacteria, and PE-containing cyanobacteria for (A) surface, (B) mid, and (C) deep water samples from June 2021 to July 2022. Within each sampling month, samples are shown in order from the Outer station to the Inner station.
Seasonal patterns were also observed for larger fraction sizes. Excluding unidentified phytoplankton, Micro30-73 was dominated by diatoms throughout the annual cycle, with the exception of July, which showed higher contributions from ciliates and dinoflagellates (Figure 7A). The contribution of dinoflagellates was negligible from December to May. Micro73-250 was dominated by dinoflagellates from June to November 2021, and by diatoms from December 2021 to June 2022 (Figure 7B). Mesozooplankton samples (Figures 7C, D), which were identified to a much lower taxonomic level, comprised 47 taxa and were dominated by copepods (Acartia spp., Calanoida (unid.), Oithona spp., Pseudocalanus spp., Temora spp.), cladocerans (Evadne spp., Podon/Pleopsis spp.), and appendicularian tunicates (Fritillaria spp.). Although the samples were largely dominated by copepods year-round, a clear seasonal shift in composition was observed, with an increased contribution from tunicates in April and May and cladocerans in July, August, and October. Additionally, some months were dominated by a single taxa (e.g., Acartia spp. in September and October, Temora spp. in November and December, Fritillaria spp. in April and May).
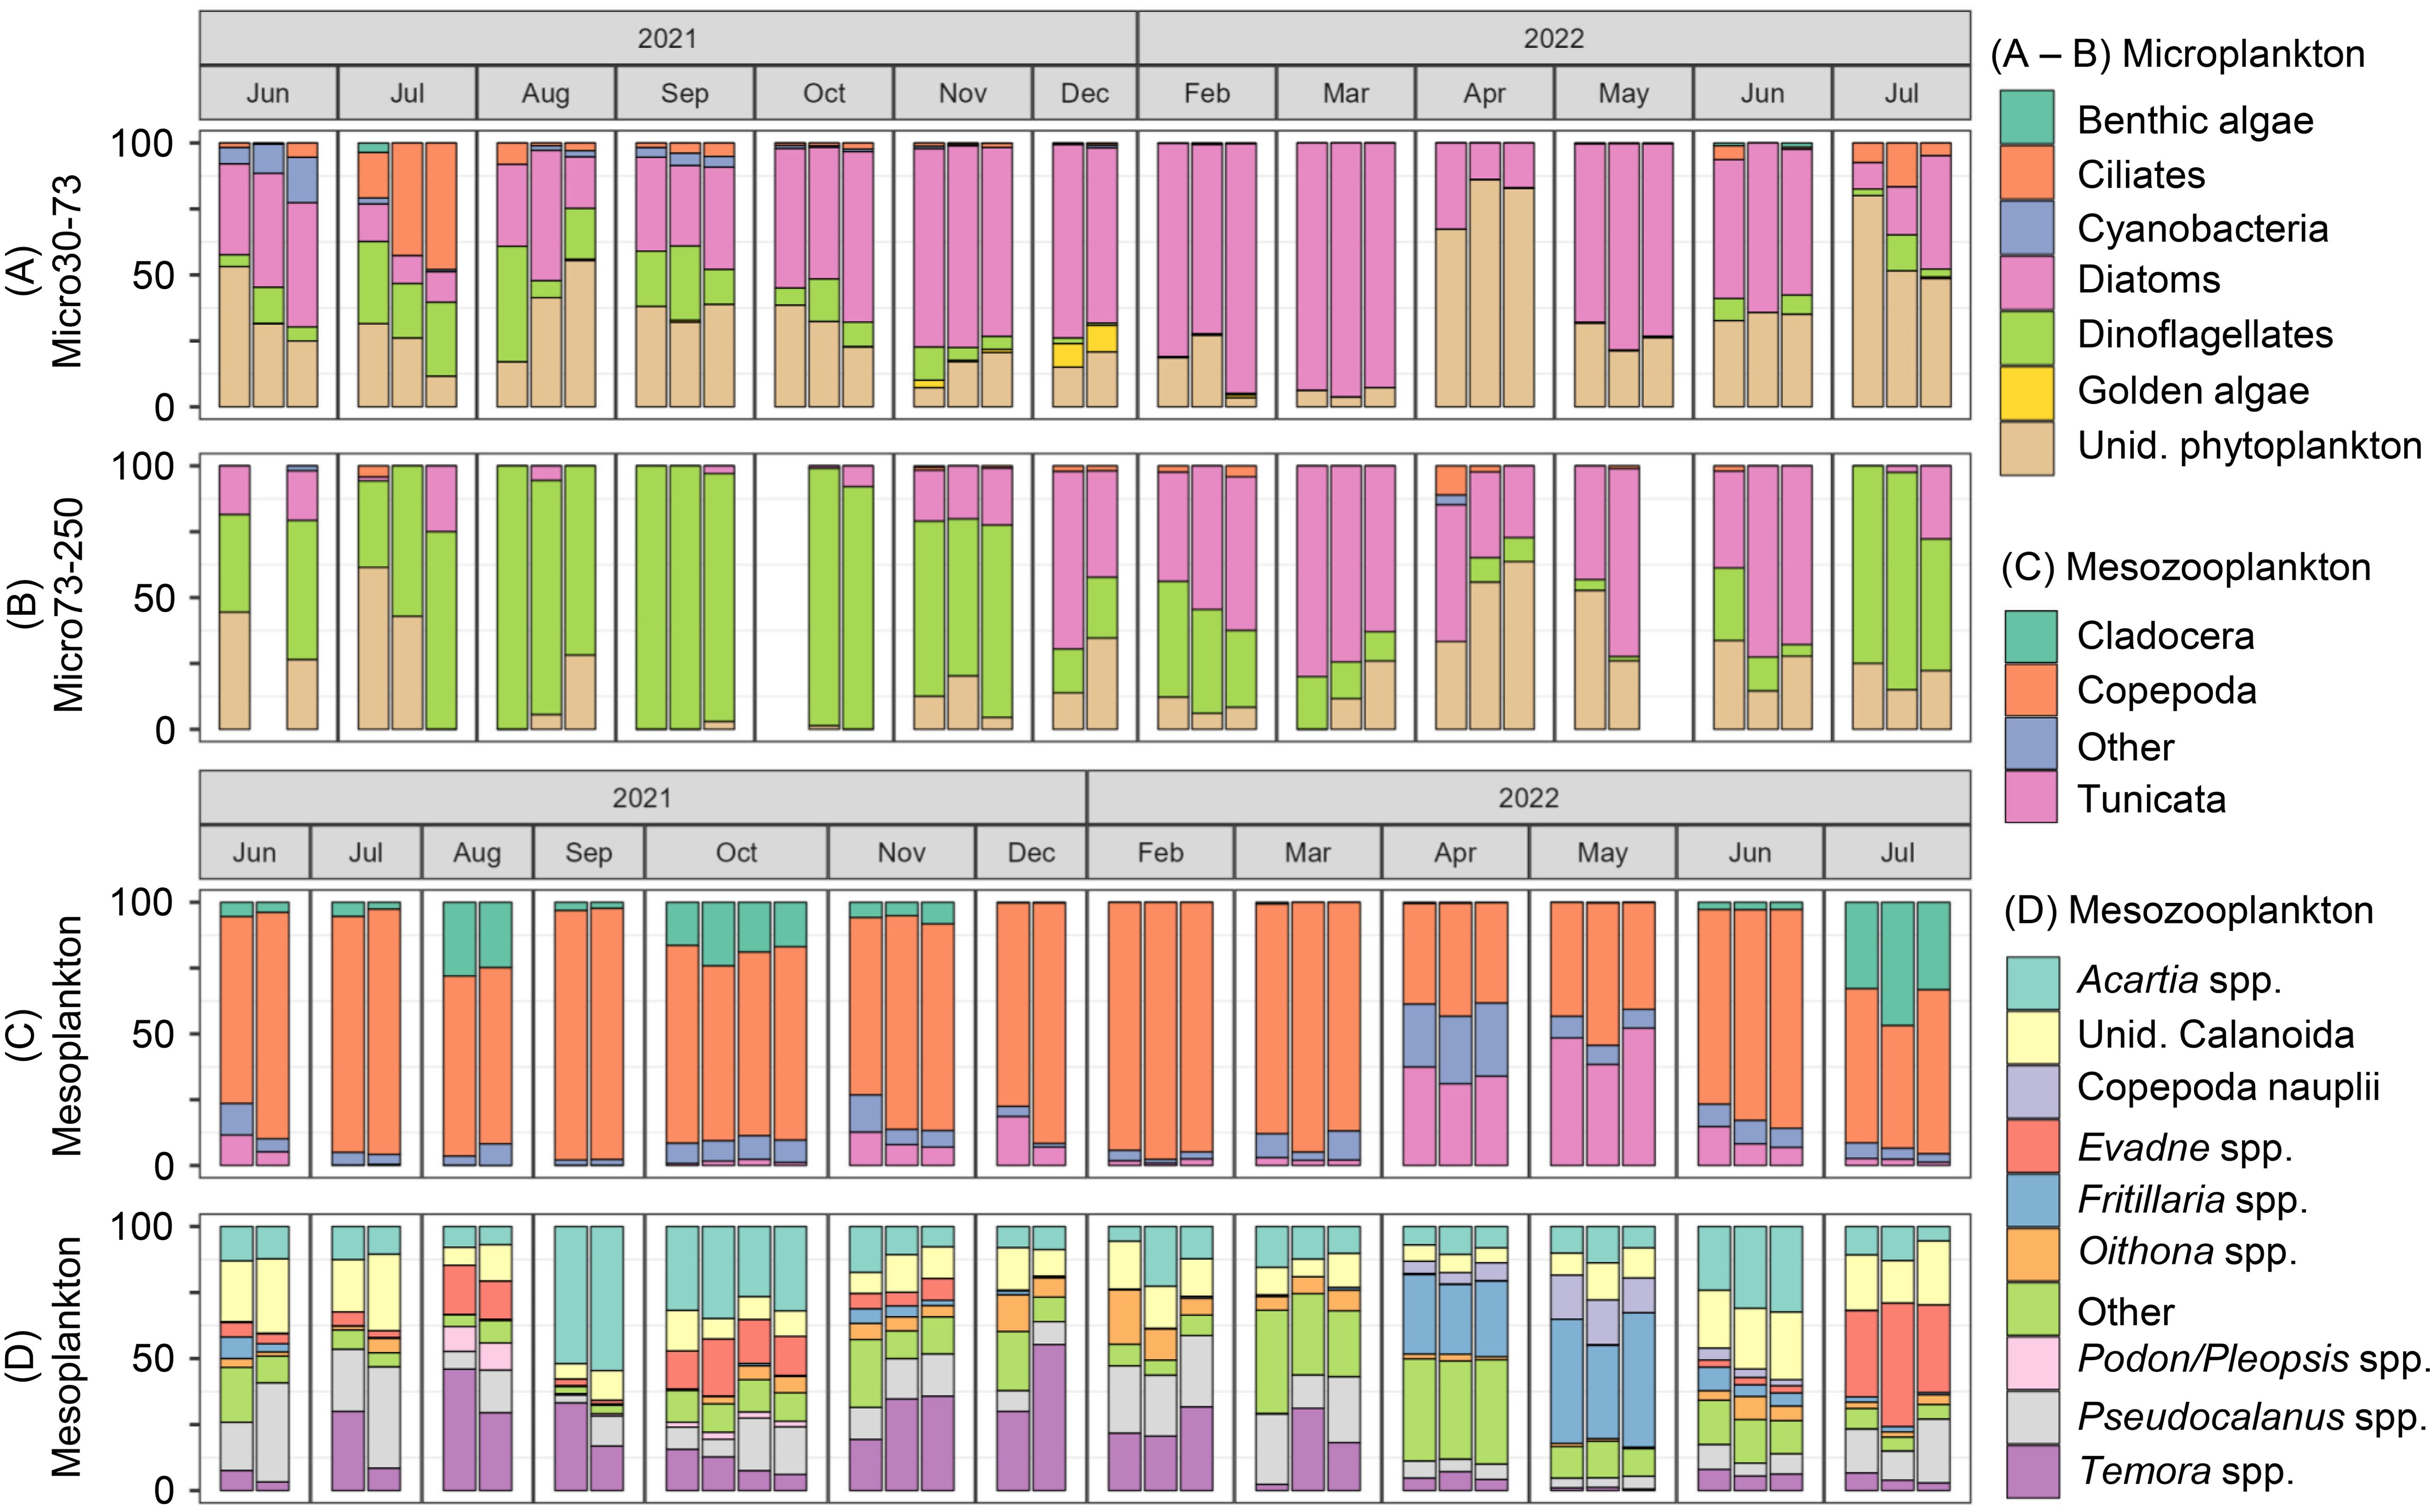
Figure 7. Relative abundance bar charts showing the composition of (A) microplankton (30 to 73 µm), (B) microplankton (73 to 250 µm), and (C, D) mesozooplankton (250 µm to 5 mm) of vertical tows samples from June 2021 to July 2022. Within each sampling month, samples are shown in order from the Outer station to the Inner station. For mesozooplankton, (C) shows the broad groupings of Cladocera, Copepoda, Tunicata, and other, while (D) shows the top nine most common taxa with the remaining taxa grouped into an “Other” category.
NMDS ordinations of bacteria composition (i.e., LNA and HNA) showed general seasonal groupings, with the months of August, September, and October plotting together (Figures 8A–C). PPP-NPP composition showed a clear cyclical monthly progression for surface and mid samples (Figures 8D, E) with more pronounced changes from November to December and from July to August. PPP-NPP composition in deep samples did not show a cyclical pattern, but rather showed a high degree of overlap between months, with August to November grouped together (Figure 8F). Microplankton composition showed general grouping by month with some dispersion (Figures 8G, H), whereas mesozooplankton composition showed a clear monthly clockwise progression with more pronounced changes from March to April, from May to June, and from July to August (Figure 8I).
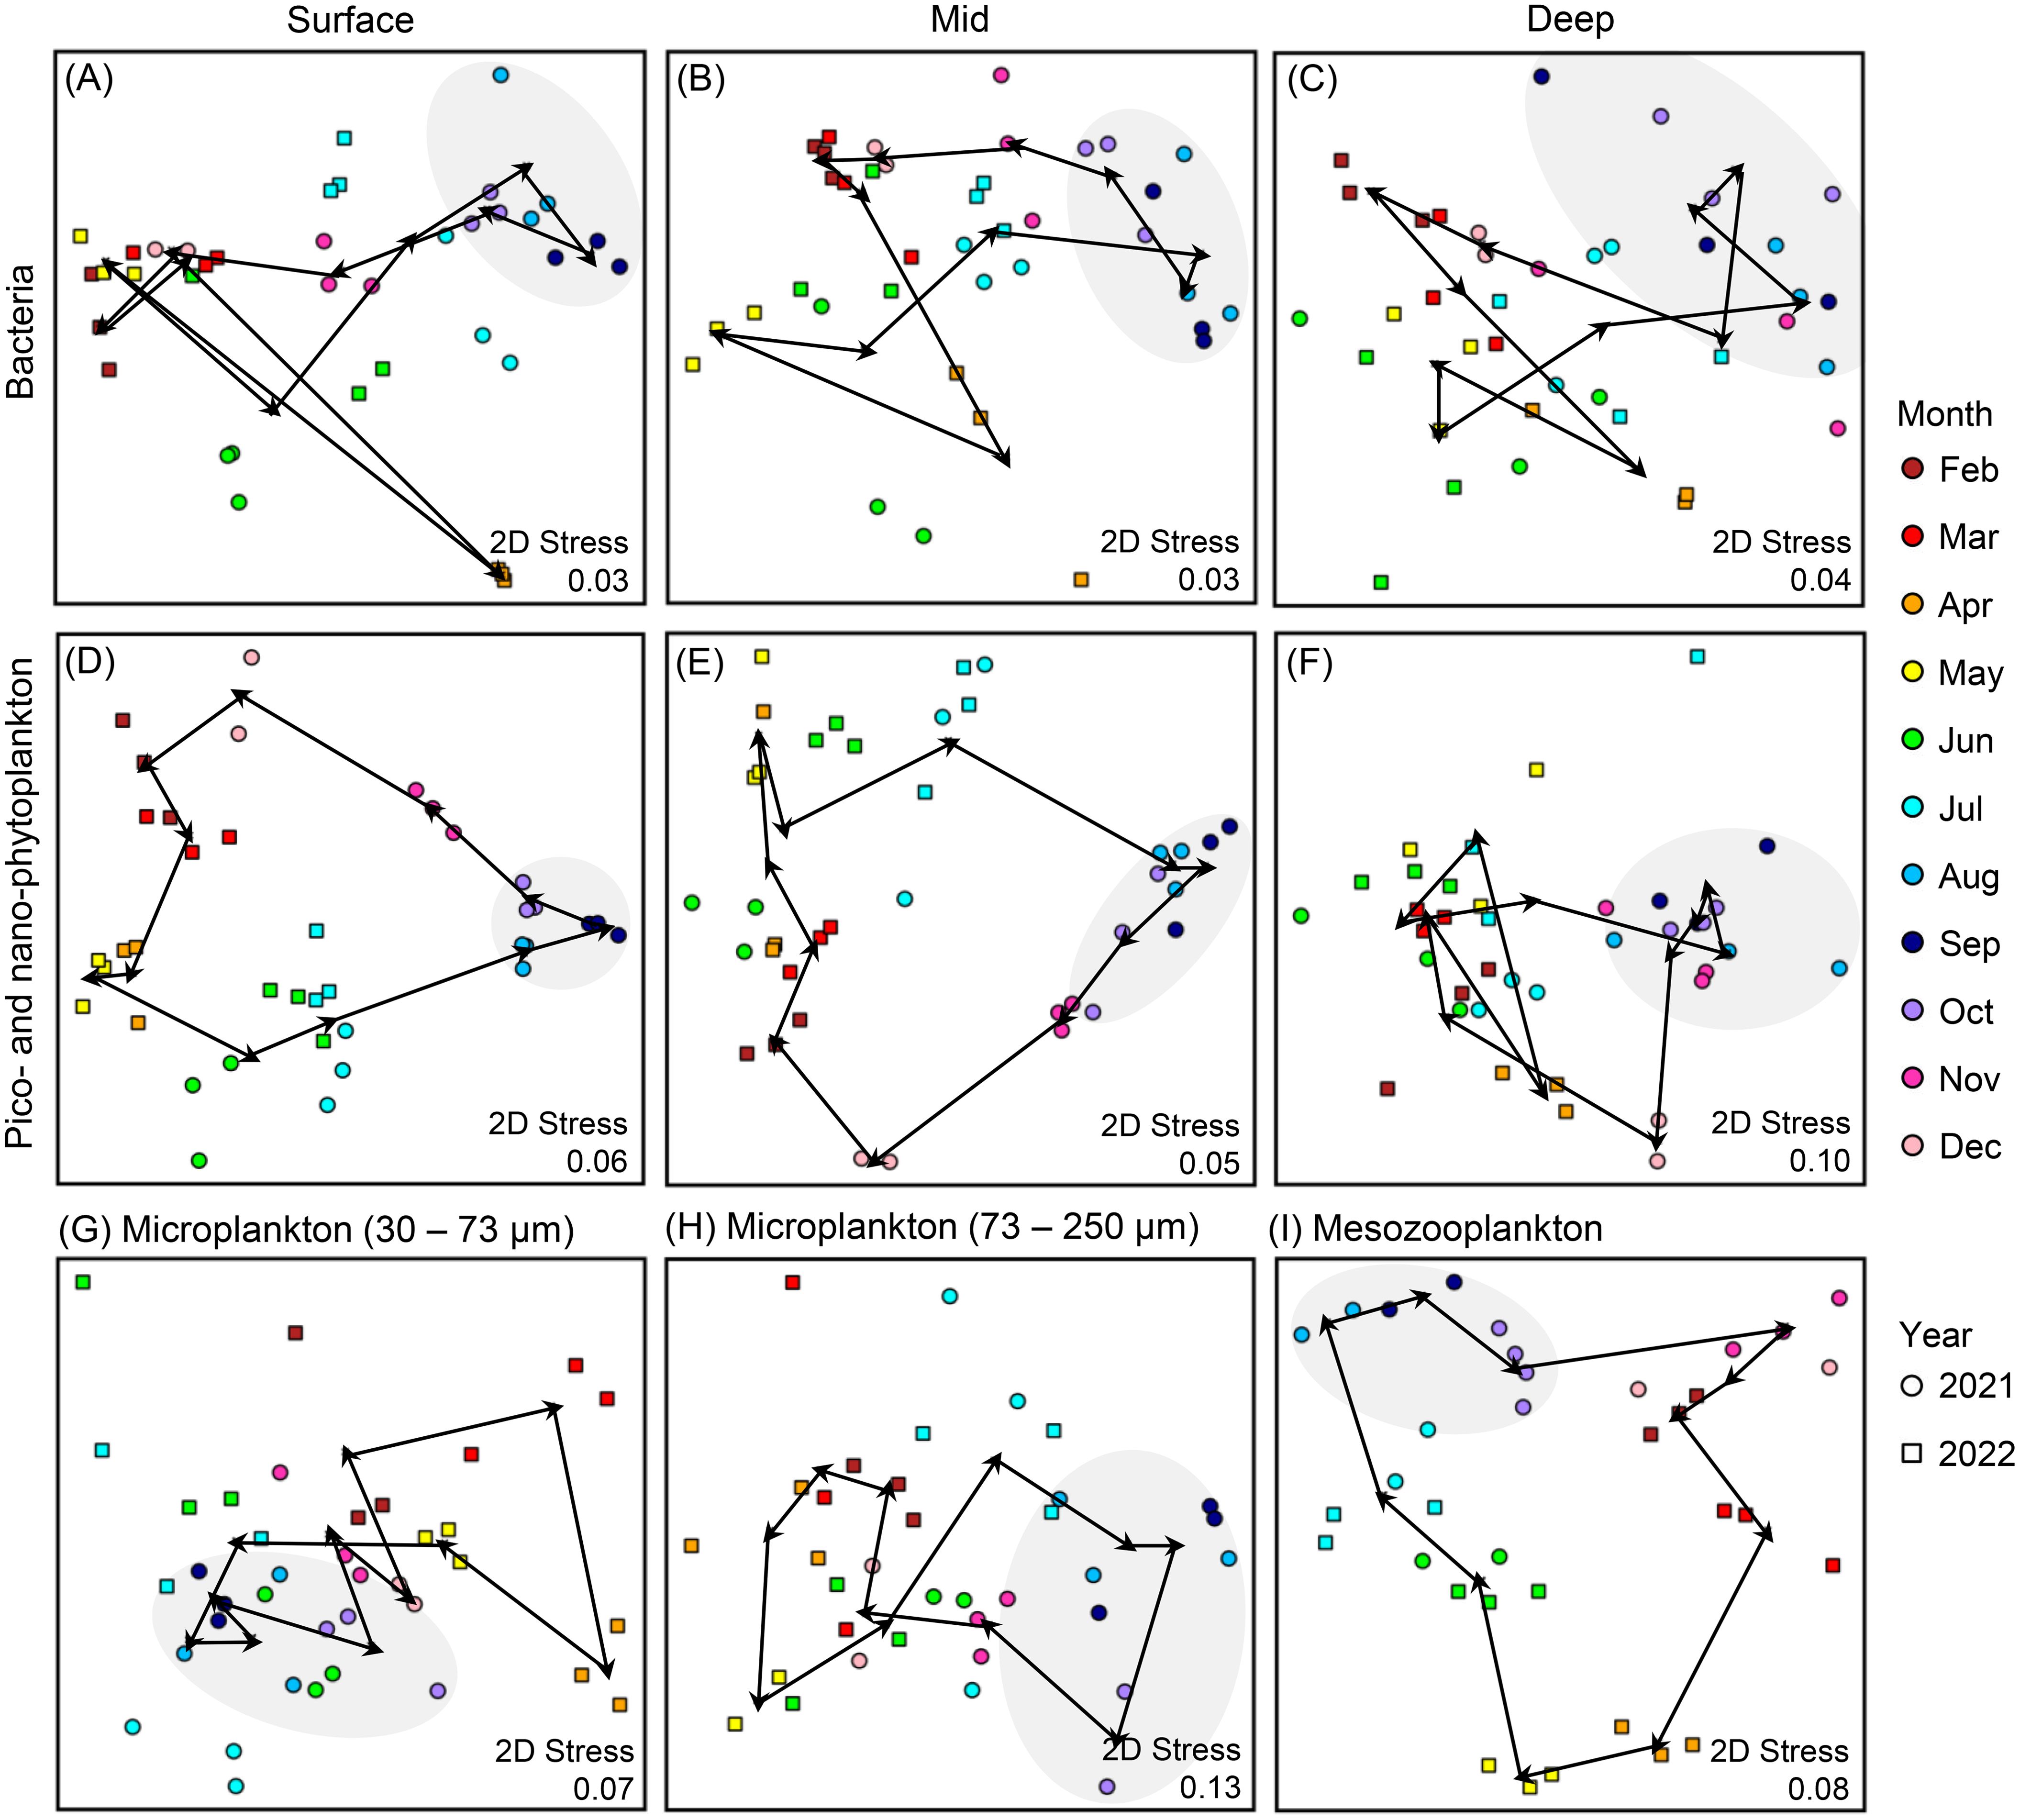
Figure 8. Two-dimensional non-metric multidimensional scaling ordination (NMDS) showing variation in (A–C) bacteria, (D–F) pico- and nano-phytoplankton, (G, H) microplankton, and (I) mesozooplankton. Colors represent sampling month, shape represents sampling year, arrows show monthly progression. The months of August, September, and October are highlighted with gray shading.
3.4 Size distribution
The slope of the linear relationship between log10-transformed plankton abundance and body size, an indicator of food chain efficiency, ranged −3.4 to −2.8 and the intercept, an indicator of ecosystem productivity, ranged 10.1 to 11.5 (Figure 9). With the exception of July 2021, the slope was steeper or equal at the Outer station, indicating a less efficient energy transfer compared to the Inner and Mid stations. Variation between stations was mostly observed at the largest fraction sizes. All fraction sizes followed size spectra theory except where mesozooplankton abundance was higher than Micro73-250 from February to September.
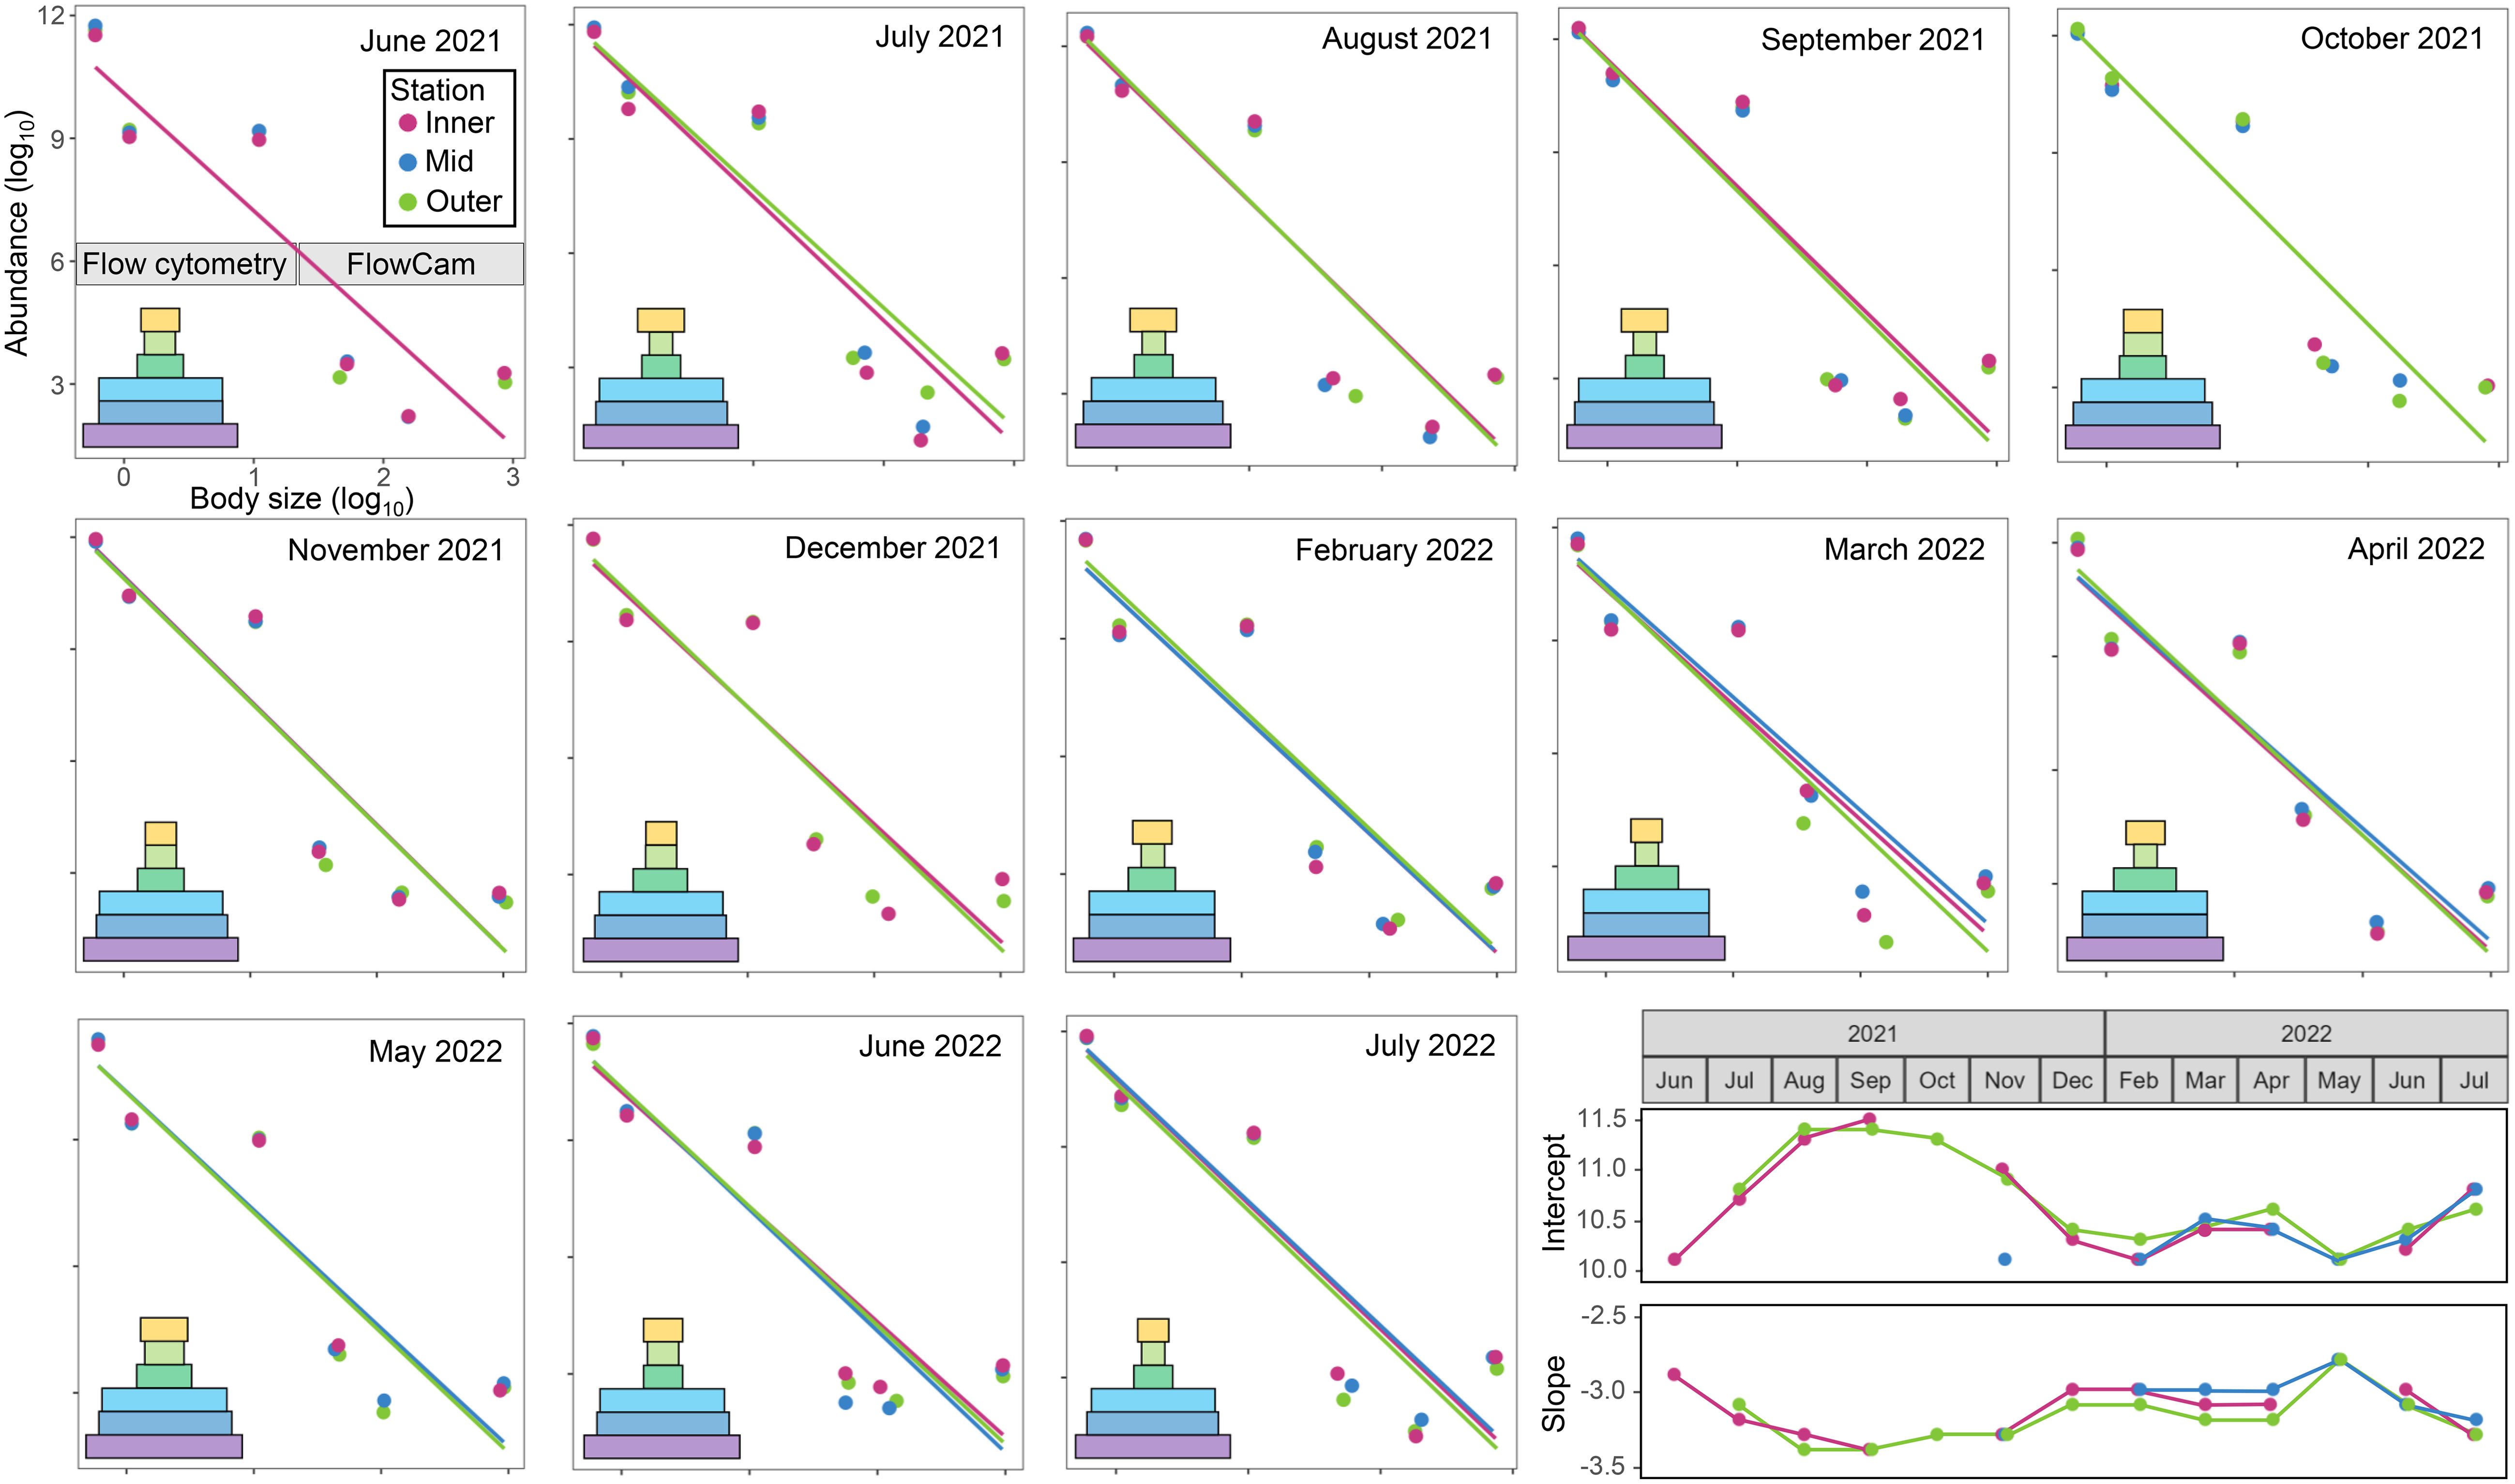
Figure 9. Size distribution represented by the relationship between plankton abundance (log10; individuals m–3) and body size per size fraction (log10; µm). Ecological pyramids are shown with width representing relative abundance of each size fraction: bacteria (purple), pico- and nano-phytoplankton (dark and light blue, respectively), microplankton (30 to 73 µm in dark green and 73 to 250 µm in light green) and mesozooplankton (yellow).
4 Discussion
Clear seasonal relationships were observed between plankton size fractions, from bacteria to mesozooplankton, driven by seasonal variation in water column stratification (freshwater input, nutrient availability, light availability, water temperature). Decreased plankton abundance with increasing size fraction was observed, aligning with size spectra theory. Results show that energy transfer efficiency was weakest at the Outer station (furthest from the lease area) throughout the year. Mesozooplankton abundance was greatest closest to the aquaculture lease, but no significant spatial effect was observed for phytoplankton abundance.
4.1 Plankton seasonality
Three successive seasonal phytoplankton blooms were observed in South Arm. Each bloom was characterized by a distinct plankton size fraction and community composition, and occurred in different seasons. Diatoms (30 to 73 µm) characterized the spring bloom, whereas cyanobacteria (picoPE; 0.2 to 2 µm) and nanoeukaryotes (2 to 20 µm) characterized the summer bloom and dinoflagellates (73 to 250 µm) characterized the fall bloom. This may be attributed to phytoplankton of different sizes with differing critical growth dependencies for inorganic nutrients (Ward et al., 2017). Smaller phytoplankton cells are capable of thriving in environments with lower inorganic nutrient availability due to their higher surface area to volume ratio, which allows for increased nutrient acquisition (Malone, 1980; Chisholm, 1992). Therefore, in the early spring when inorganic nutrients were abundant, phytoplankton biomass was characterized by larger cells (in this case, 30 to 73 µm diatoms), whereas small cells (0.2 to 20 µm cyanobacteria and eukaryotes) became more abundant when nutrients were depleted in late summer (Agawin et al., 2000; Tremblay et al., 2009). The October bloom of dinoflagellates was almost entirely composed of dinoflagellates of the genus Tripos, which utilize both autotrophic and heterotrophic feeding mechanisms (Lapeyra Martin et al., 2022), thereby suggesting grazing of the smallest plankton size fractions at this time.
Mesozooplankton abundance began increasing in May, following the spring diatom bloom, and steadily increased through the summer and fall. Mesozooplankton abundance declined in October, mirroring trends in bacteria, PPP, and NPP, suggesting that organic nutrient availability (i.e., smaller plankton) act as a driver for mesozooplankton seasonality. Although zooplankton communities have not previously been documented in South Arm, our data suggest a delayed zooplankton abundance peak in 2021, and likely 2022, compared to previous studies conducted in nearby areas (Penney et al., 2001; Stacey, 2003; Maillet et al., 2022). The 2021 mesozooplankton abundance peak occurred concurrently with the summer pico- and nano-phytoplankton blooms, which were characterized by cyanobacteria (picoPE). Zooplankton consumption of cyanobacteria is typically considered less efficient than that of eukaryotic phytoplankton due to their smaller size (Boyce et al., 2010; Kiørboe, 2011; Boyd et al., 2014; Schmidt et al., 2020). Generally, tunicates have been considered as the only marine metazoan plankton to efficiently feed on picoplankton due to the morphology of their filter-feeding mechanisms (Deibel and Powell, 1987; Sommer et al., 2002; Katechakis et al., 2002). However, several recent molecular studies have shown that cyanobacteria can be a main food source for other pelagic grazers, including crustaceans (see Novotny et al., 2023 and references therein). Here, results with concurrent elevated levels of cyanobacteria and mesozooplankton during summer suggest that cyanobacteria may constitute an important part of mesozooplankton diet, particularly copepods, which were the dominant mesozooplankton observed during the 2021 summer bloom in South Arm.
4.1.1 Water column stratification
Most shellfish aquaculture in Canada occurs in embayments with strong seasonality, although little is known about how this impacts spatio-temporal plankton distributions and interactions with cultured shellfish (Filgueira et al., 2016). The strong positive correlation between temperature and phytoplankton abundance observed here is likely reflective of the seasonal covariance of water temperature and light availability (Edwards et al., 2016), as light availability is one of the most important variables controlling phytoplankton growth in subarctic marine systems (e.g., Therriault and Levasseur, 1985; Matsumoto et al., 2014). In the context of this study, salinity acts as an indicator of freshwater input, which is likely the main source of inorganic nutrients in South Arm during the stratified period (April to November). The strong negative correlation between salinity and phytoplankton abundance observed here likely indicates that water column stratification and inorganic nutrient availability are important drivers of phytoplankton seasonality. Spring bloom formation, and subsequent increased zooplankton abundance, in the Newfoundland shelf region have been linked to post-winter ocean re-stratification (Cyr et al., 2023), with bloom timing observed in this study matching those in the Newfoundland shelf region (Cyr et al., 2023).
The 2021–2023 period is the warmest on record for sea surface temperatures in the Newfoundland region (Cyr and Bélanger, 2024), with the Newfoundland shelf showing decadal oscillations between warm water periods typified by earlier spring blooms and cooler periods with later blooms. Although inshore coastal dynamics may result in slightly different patterns, these climatic fluctuations are generally reflected in South Arm, as seen in 2014 when particularly cold winter conditions caused ice cover and a later and smaller spring bloom (Gallardi et al., 2017). Preliminary analysis of data collected during 2022 indicate that the spring bloom in South Arm appeared to have normal timing and intensity (Gallardi et al., unpublished data). Weakening of the Labrador Sea convection is projected by the end of the 21st century, potentially reducing fall phytoplankton production with subsequent implications for regional spring blooms (Balaguru et al., 2018). Greater overall freshwater input is expected due to more frequent precipitation events, storms, sea ice melt (IPCC, 2021) and accelerated freshening of the Labrador Current (Zhang et al., 2021). This will not only directly affect salinity, but also increase nutrient availability from terrestrial runoff (Fong et al., 2020), potentially shifting the timing and strength of seasonal water column stratification.
4.2 Spatial distribution
In South Arm, station did not have a significant effect on phytoplankton composition. The homogeneous phytoplankton spatial pattern may be due to high phytoplankton turnover rates and redistribution by water movement as a result of the strong hydrodynamic regime and size of South Arm (20 to 50 m depth, 1 to 2 km width, 15 km length, and 2 km between the Inner and Outer stations) which is considered a large and deep system compared to other Canadian aquaculture embayments (Finnis et al., 2023). In contrast, the station did have a significant effect on mesozooplankton composition. Additionally, mesozooplankton abundance was consistently higher near the lease from June to September due to a greater abundance of copepods. This is in contrast to studies that have observed decreased zooplankton abundance due to bivalve aquaculture at small (Lehane and Davenport, 2006; Granados et al., 2017) and larger (Lam-Hoai and Rougier, 2001; Maar et al., 2008) spatial scales. This spatial trend could be attributed to several reasons related to habitat preference or proliferation. The ability of copepods to move towards preferential feedings regions (Jiang and Osborn, 2004) may cause them to move towards leases due to greater food availability as a result of positive bottom-up feedback from bivalve excretion enhancing local bacterial nutrient remineralization and primary production (Trottet et al., 2008). Additionally, copepods may prefer to move away from stressful regions (Titelman and Kiørboe, 2003) to avoid bivalve grazing by congregating adjacent to mussel leases. Notably, different hydrodynamic conditions due to the sill located between the Mid and Outer stations may have caused slightly weaker stratification, or stronger mixing, and differences in freshwater and nutrient input, which may also affect mesozooplankton variation between stations.
4.3 Food web interactions
Quantifying short- and long-term ecosystem changes within shellfish aquaculture embayments requires a better understanding of seasonal plankton patterns that reflect shellfish diet. Gallardi et al. (2017) reported that the biochemical profile of cultured blue mussels in South Arm indicated high concentrations of diatom markers (EPA) in the spring and high concentrations of fatty acid markers for dinoflagellates (DHA) in the fall. Our observations were consistent with Gallardi et al. (2017), as smaller microplankton (30 to 73 µm) were generally dominated by diatoms year-round (average 51% diatoms, 9% dinoflagellates) with elevated relative abundance in summer by dinoflagellates (average 26% diatoms, 19% dinoflagellates from July to September). Additionally, larger microplankton (73 to 250 µm) exhibited two distinct community structures: from December to June dominated by diatoms and from June to November dominated by dinoflagellates. These results suggest that bay-scale seasonal plankton patterns are likely reflective of the diets of nearby cultured mussels.
Size distribution data suggest that food chain efficiency was similar across stations in summer and early fall, whereas winter and spring data showed variation with a less efficient food chain at the Outer station. The efficiency of energy transfer from primary producers to higher trophic levels is dependent on the length of the food chain, i.e. the number of trophic links. There are typically three (phytoplankton – crustacean zooplankton – fish) to six (phytoplankton – heterotrophic nanoflagellates – ciliates – crustacean zooplankton – carnivorous zooplankton – fish) trophic links between primary producers and fish (Sommer and Stibor, 2002). Shifts towards smaller phytoplankton size fractions can therefore increase the number of trophic links and decrease energy transfer efficiency, having marine ecosystem effects with notable importance for fish populations (Ryther, 1969; Eddy et al., 2021). Shellfish aquaculture may impact food chain length and redirect energy to alternate zooplankton types by altering absolute abundance and plankton community composition (e.g., to gelatinous zooplankton rather than to copepods, Rodhouse and Roden, 1987; Horsted et al., 1988; Lehane and Davenport, 2006; Hulot et al., 2020). Aquaculture infrastructure may also increase biofouling, particularly numbers of tunicates (McKindsey et al., 2007), which have a large filtration capacity and may decrease food availability and redirect energy flow away from crustacean zooplankton (Sommer and Stibor, 2002; Petersen, 2007).
Our results show that variation in food chain efficiency was driven by mesozooplankton abundance rather than smaller size fractions (Figure 9). Importantly, our data do not allow the direct evaluation of food chain length, but rather act as a proxy for energy transfer efficiency. Our data provide slopes ranging from −3.5 to −2.9 where the x-axis represents body size expressed as length, a unidimensional measurement. These results, when expressed as a three-dimensional measure of size such as volume or weight, would range approximately −1.13 to −0.93, which are comparable to those typically observed (near −1; Jennings, 2012; Anderson, 2019; Gonzalez-García et al., 2023). Jennings (2012) suggested that size distribution slopes do not encompass all the complex interactions within marine food webs and are most consistent in the open ocean where pelagic ecosystems are least impacted by benthic processes. Slope variance observed in our study may be influenced by spatio-temporal variation in benthic-pelagic coupling as a result of the local hydrodynamics (e.g., water column mixing due to the sill between Mid and Outer stations) and shellfish aquaculture. The influence of shellfish aquaculture on benthic-pelagic coupling is gaining attention in the scientific community as the industry continues to expand (Filgueira et al., 2015; Lacoste et al., 2020; Azra et al., 2021). Intensive shellfish aquaculture may cause bay-wide depletion of pelagic particles through biofiltration (Grant et al., 2008; Guyondet et al., 2013). Additionally, altering benthic environments via sinking of (pseudo)feces may lead to organic enrichment of the seafloor, changes in macroinvertebrate community structure, and alterations to ecosystem functioning (Callier et al., 2008, 2009; McKindsey et al., 2011; Filgueira et al., 2016; Lacoste et al., 2020; Zhang et al., 2020). Paradoxically, bivalves also release nutrients directly through ammonia excretion and remineralization of (pseudo)feces on the seafloor, which can enhance primary production (Filgueira et al., 2015). Zooplankton play a key role in benthic-pelagic coupling as they are components in biogeochemical cycling and represent a key link between trophic levels in food webs (Ratnaraja et al., 2023). For example, zooplankton facilitate the downward transfer of energy, mass, and nutrients through sinking fecal matter, carcasses, and exuvia to the seafloor (Schnack-Schiel and Isla, 2005; Griffiths et al., 2017). Zooplankton also undergo vertical migrations (e.g., diel and/or ontogenetic), which represent net fluxes of organic matter, energy, and nutrients between the surface and deeper layers (Bollens et al., 2011; Agnetta et al., 2019; Archibald et al., 2019; Bandara et al., 2021). In addition, the resuspension of bottom sediments, such as during storms, may displace ichthyoplankton in the water column (Johnson and Allen, 2012) while meroplankton also link the benthos and water column through shifting life stages (Marcus and Boero, 1998; Schnack-Schiel and Isla, 2005).
4.4 Predicted long-term changes and pathways of effects
In the context of a long-term monitoring program, it is critical to discern the influence of shellfish aquaculture from that of climate change on pelagic food web dynamics. Although their confounding influences cannot be realized with the one-year time series presented in this study, the following section discusses how this type of data, collected over several years, may be used for long-term monitoring to understand aquaculture ecosystem interactions. Based on previously published work, we hypothesize that the synergistic influences of shellfish aquaculture and climate change may increase productivity at the lowest trophic levels but reduce biomass and energy transfer efficiency to higher trophic levels (Figure 10, see discussion below). Although we may be able to predict the direction of shifts in plankton communities, the rate of these shifts is unknown and highly dependent on local conditions and hydrodynamics (Comean et al., 2023). This can only be realized through long-term monitoring of shellfish aquaculture and reference sites, and with the support of validated accurate hydrodynamic and ecosystem models, to help determine what proportion of the observed changes may be related to shellfish aquaculture activities.
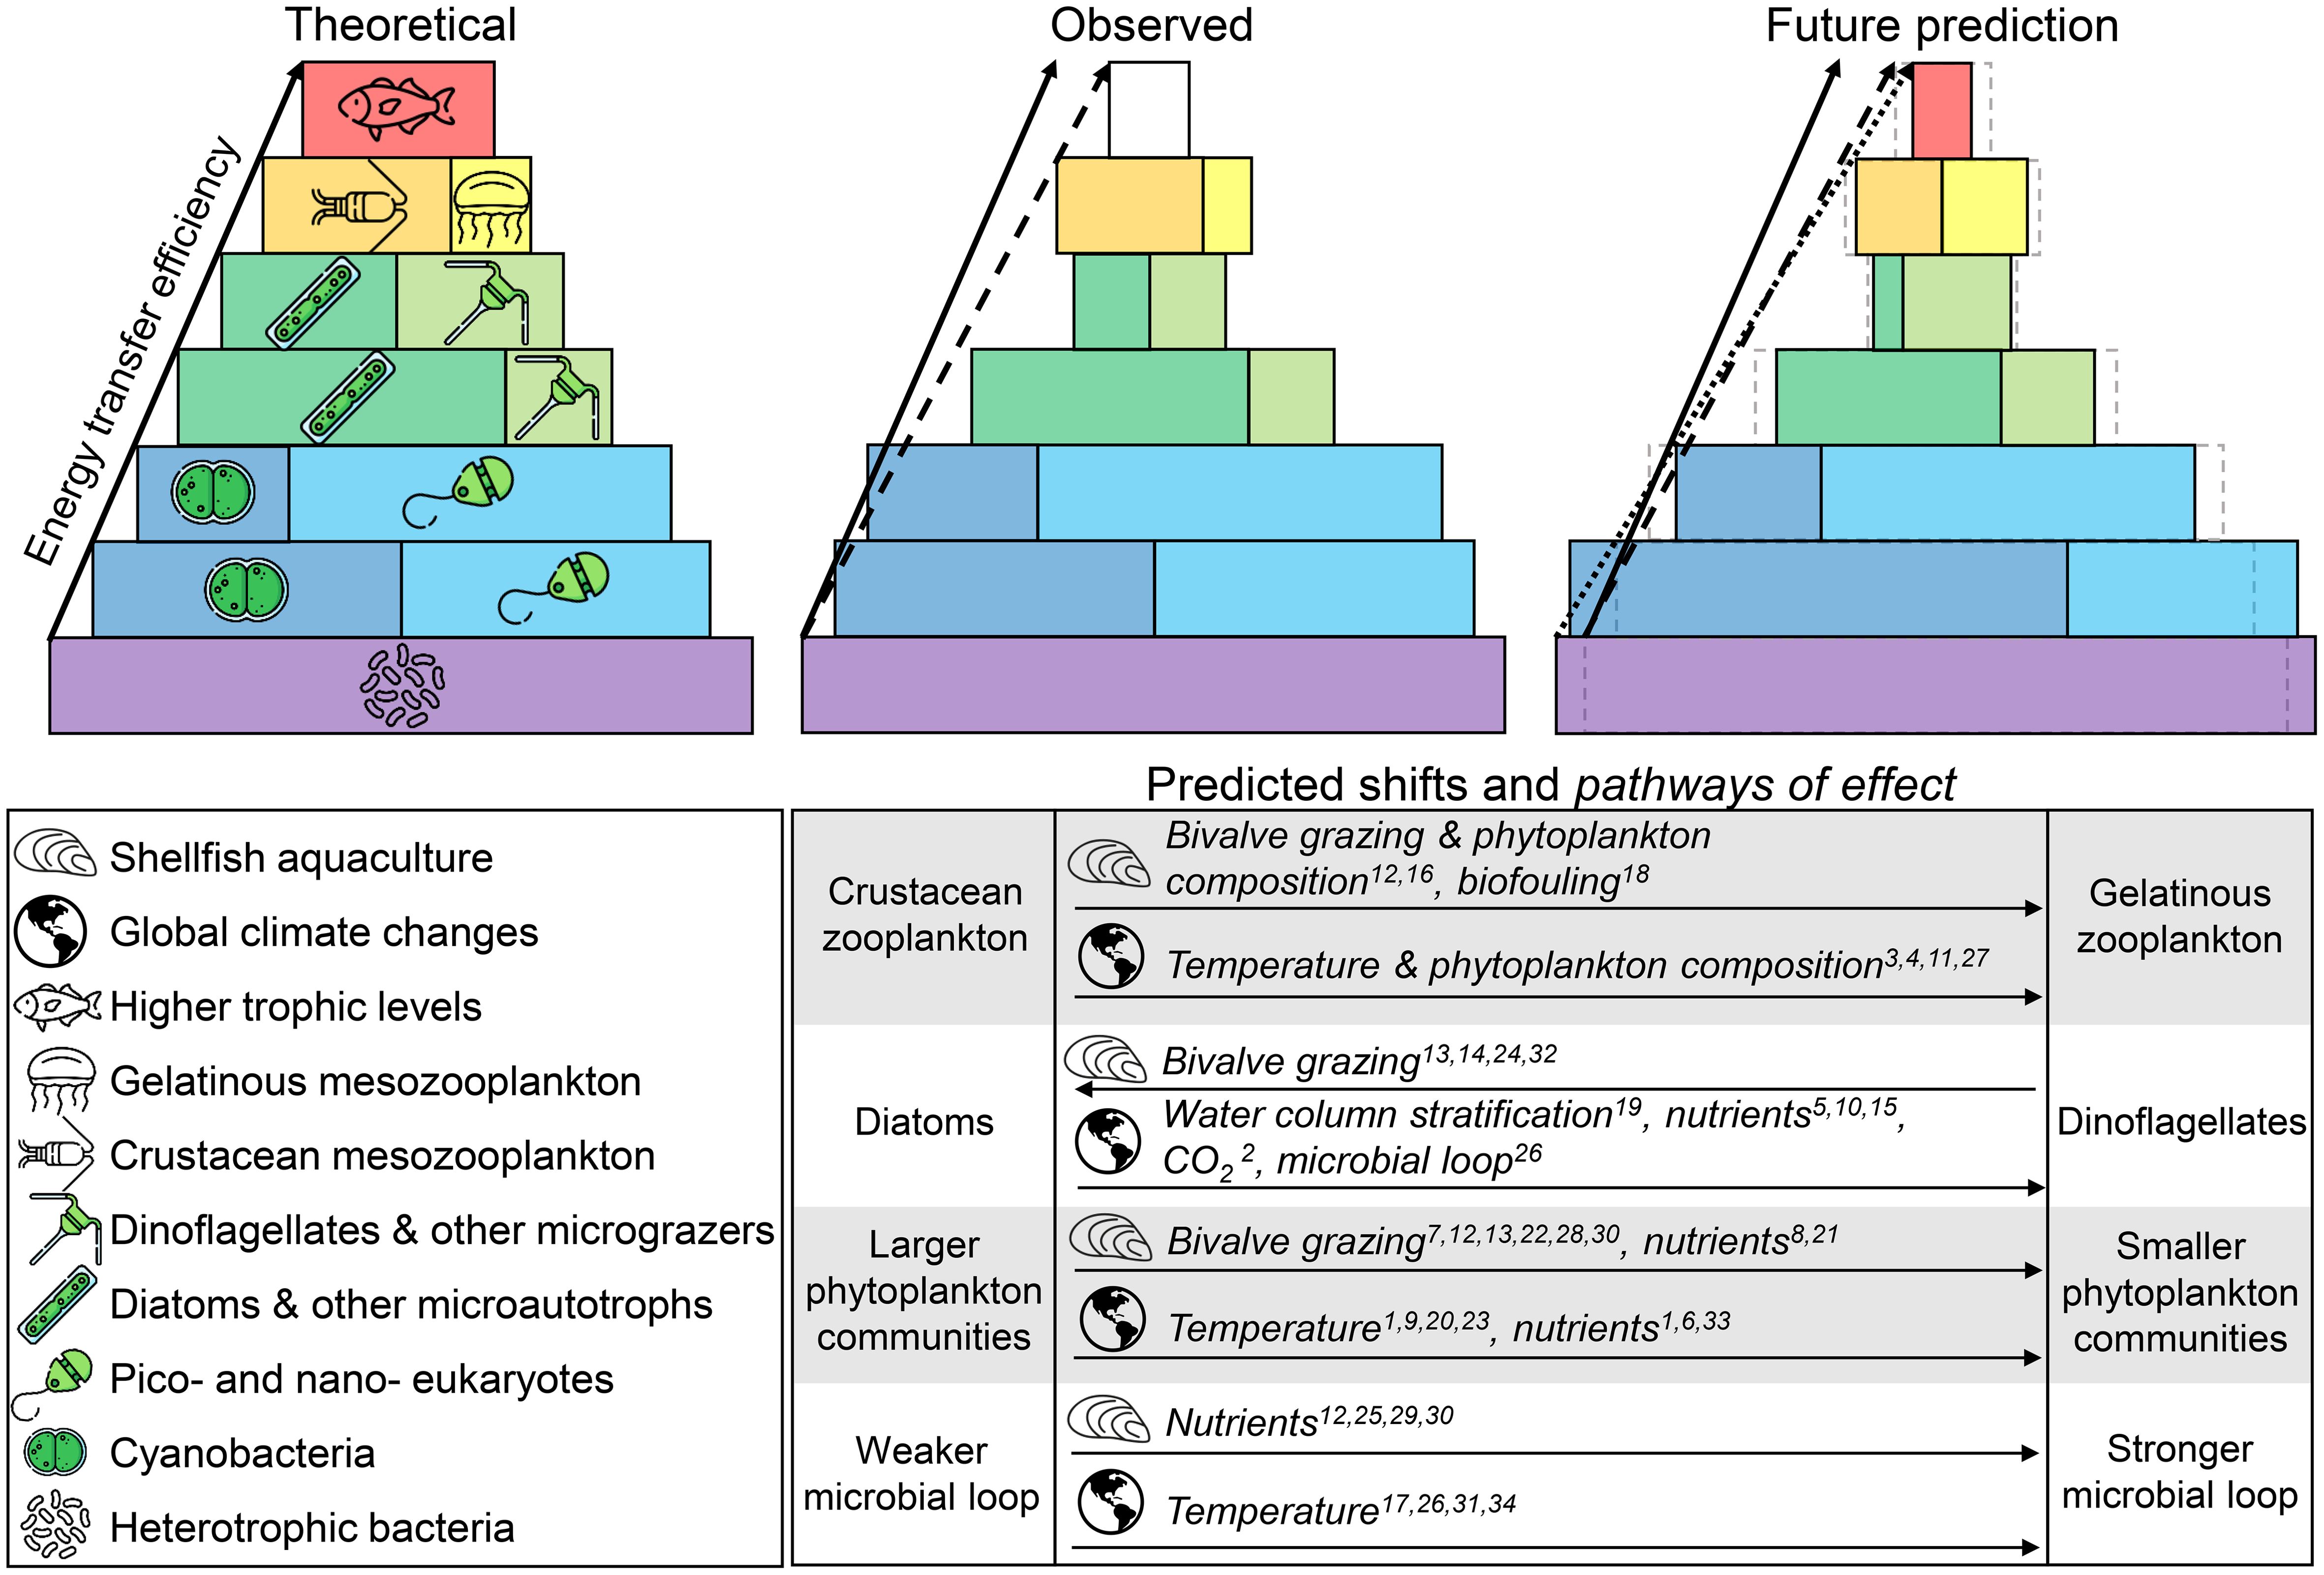
Figure 10. Predicted shifts in plankton communities and pathways of effect considering increased shellfish aquaculture and global change. Ecological pyramids compare productivity (intercept) and energy transfer (slope) efficiency between the theoretical (left, solid arrow), observed (South Arm 2021–2022, central, dashed arrow) and future prediction (right, dotted arrow) based on predicted shifts in plankton communities. Future prediction shows that greater productivity is expected at the lowest trophic levels with less efficient energy transfer to higher trophic levels. Dashed gray lines represent the “observed” pyramid to visually emphasize predicted shifts. Autotrophic and mixotrophic functional groups are indicated with green symbols. References indicated with superscripts: 1) Agawin et al., 2000; 2) Brandenburg et al., 2019; 3) Brodeur et al., 2019a; 4) Brodeur et al., 2019b; 5) Cabré et al., 2015; 6) Chisholm, 1992; 7) Cranford et al., 2008; 8) Dame, 1996; 9) Daufresne et al., 2009; 10) Hattenrath-Lehmann et al., 2015; 11) Heneghan et al., 2023; 12) Hulot et al., 2020; 13) Jiang et al., 2016; 14) Jiang et al., 2022; 15) Lavoie et al., 2010; 16) Lehane and Davenport, 2006; 17) López-Urrutia and Morán, 2007; 18) McKindsey et al., 2007; 19) Moore et al., 2008; 20) Morán et al., 2010; 21) Newell, 2004; 22) Norén et al., 1999; 23) Paerl and Huisman, 2008); 24) Prins et al., 1995; 25) Rodhouse and Roden, 1987; 26) Sarmento et al., 2010; 27) Sommer and Stibor, 2002; 28) Sonier et al., 2016; 29) Stuart et al., 1982; 30) Trottet et al., 2008; 31) Vázquez-Domínguez et al., 2007; 32) Ward and Shumway, 2004; 33) Ward et al., 2017. Symbols were retrieved from Flaticon.com.
Phytoplankton and bacteria form the base of the pelagic aquatic food web and shifts in their abundance and composition may affect ecosystem functioning (Figure 10). Water temperature and nutrient availability are strongly correlated to bacterial and phytoplankton growth rates in South Arm (nutrients inferred using salinity as a proxy; Figure 4; Table 1) and at the global scale (Stuart et al., 1982; Rodhouse and Roden, 1987; White et al., 1991; López-Urrutia and Morán, 2007; Vázquez-Domínguez et al., 2007; Sarmento et al., 2010; Ibarbalz et al., 2019). Phytoplankton communities are expected to shift towards smaller phytoplankton cell size individuals and increase the proportion of cyanobacteria to eukaryotic phytoplankton as a result of increased shellfish aquaculture (Dame, 1996; Norén et al., 1999; Newell, 2004; Cranford et al., 2008; Trottet et al., 2008; Sonier et al., 2016). A synergistic effect is expected from global change, which influences the amplitude and seasonal timing of water temperature (Agawin et al., 2000; Paerl and Huisman, 2008; Daufresne et al., 2009; Morán et al., 2010; Cooley et al., 2022) and nutrient availability (Agawin et al., 2000; Chisholm, 1992; Ward et al., 2017). Morán et al. (2010) showed that temperature alone explained 73% of the variance in the relative contribution of small cells to total phytoplankton biomass, regardless of nutrient availability.
To our knowledge, the ratio of diatoms to dinoflagellates is the only plankton indicator predicted to have antagonistic influences from bivalve aquaculture and global change, and could therefore be an important indicator for disentangling aquaculture-related ecosystem effects from climate change. Bivalve aquaculture may shift phytoplankton composition towards faster growing taxa, thereby increasing the proportion of diatoms to dinoflagellates (Prins et al., 1995; Ward and Shumway, 2004; Jiang et al., 2016, 2022). However, in contrast, dinoflagellate growth may be favored by climate changes, which are expected to cause stronger water column stratification (Moore et al., 2008) and higher pCO2 levels (Brandenburg et al., 2019). Additionally, many dinoflagellates have the ability to feed on smaller plankton rather than solely rely on inorganic nutrients and light availability, which is advantageous for dinoflagellate dominance as inorganic nutrient availability is expected to decrease in the north western Atlantic (Lavoie et al., 2010; Cabré et al., 2015; Hattenrath-Lehmann et al., 2015), and light availability is expected to decrease in coastal marine environments (Striebe et al., 2023 and references therein).
Similar to aquaculture effects, global change is expected to decrease energy transfer efficiency due to a shift towards smaller sized phytoplankton communities (Ryther, 1969; Eddy et al., 2021). A redirection of energy flow away from crustacean zooplankton and towards gelatinous plankton, such as appendicularian and larvacean tunicates and jellyfish which have a greater filtration capacity for smaller particles, is expected (Sommer and Stibor, 2002; Heneghan et al., 2023). Warmer water climate events, such as marine heatwaves, have additionally been linked to shifts in mesozooplankton composition, and subsequent fish prey consumption, from more nutritious copepods to gelatinous zooplankton (Brodeur et al., 2019a, 2019). Thermally-induced changes have additionally been observed in predator-prey relationships (e.g. Atlantic cod in Neuheimer et al., 2018) and create phenological trophic mismatches with implications for fisheries productivity and recruitment (Asch et al., 2019). Water temperature is generally positively correlated with copepod reproduction and growth rates and negatively correlated with body size, clutch size, and the time interval between clutches (Moore and Folt, 1993; Atkinson, 1994; Lee et al., 2003; Angilletta et al., 2004; Bunker and Hirst, 2004; Kozlowski et al., 2004). In the long-term, it is thus expected that climate change will have a cumulative effect on copepod size and abundance (Garzke et al., 2015) as well as distribution and turnover rate (McGinty et al., 2020), which may reduce biomass flow and ecosystem production (du Pontavice et al., 2021).
4.5 Monitoring shellfish aquaculture ecosystem interactions
In the context of a long-term bay-scale aquaculture monitoring program, it is critical to understand local seasonal plankton patterns to identify the optimal sampling period that can detect aquaculture-related effects. Ideally, the sampling window would sufficiently capture aquaculture effects, while providing enough information to discern between interannual variability and long-term phenological climatic shifts. When logistic challenges require targeting specific sampling periods, sample collection during months with unstable plankton assemblage composition is not optimal for identifying long-term aquaculture impacts. We identified three time periods with observed large shifts in plankton composition associated with water column stratification:
1. November to December, water column mixing caused a shift from picoPE to nanoeukaryotes.
2. March to April, water column stratification correlated with an increase in picoPC and a shift in mesozooplankton from copepod-dominated to copepod- and tunicate-dominated.
3. May to June, mesozooplankton shift was characterized by the transition of tunicate life stages from free-swimming larvae to sessile phases driven by complex interactions between factors such as structure availability, temperature, salinity, nutrients, and an increase in the number of picoeukaryotes.
Sampling during these time periods will report inter-annual inconsistent patterns associated with the timing of water column stratification, increasing interpretation uncertainty between short-term natural stochasticity and long-term ecosystem trends.
No large shifts in plankton assemblages were observed between August, September, and October (see Figure 8) and size distribution slopes were −3.4 to −3.3 from August to October, indicating that bay-scale food web efficiency was relatively stable during this time period. To maintain sampling consistency between years, we suggest that those three months constitute the priority sampling window for detecting long-term aquaculture ecosystem effects. However, zooplankton communities show inter-annual variability in the timing of seasonal patterns ranging from one to three months and are often linked to water temperature (Mackas et al., 2012). Extending the sampling months to include the zooplankton peak (July based on previous studies in the region; Stacey, 2003; Maillet et al., 2022) and the spring phytoplankton bloom (March and April) would provide a more holistic understanding of interannual variability and provide the ability to differentiate long-term phenological shifts in plankton abundance vs ecosystem changes induced by aquaculture.
Data availability statement
The datasets presented in this study can be found in online repositories. The names of the repository/repositories and accession number(s) can be found below: https://doi.org/10.25607/2ujdvh.
Ethics statement
The manuscript presents research on animals that do not require ethical approval for their study.
Author contributions
HS: Formal Analysis, Visualization, Writing – original draft, Writing – review & editing. DG: Conceptualization, Data curation, Funding acquisition, Project administration, Resources, Writing – review & editing. HG-S: Writing – review & editing. TG: Conceptualization, Writing – review & editing. CM: Conceptualization, Writing – review & editing. AL-R: Conceptualization, Data curation, Funding acquisition, Project administration, Resources, Supervision, Writing – review & editing.
Funding
The author(s) declare that financial support was received for the research, authorship, and/or publication of this article. This project was funded by the Fisheries and Oceans Canada Aquaculture Monitoring Program, and by a Competitive Science Research Fund (CSRF, Grant 21-AQ-20-01) awarded to DG.
Acknowledgments
Thanks to the Aquaculture Monitoring Program (AMP) working group members, the Advisory Committee, and program management for exchanging scientific ideas on this project, including Johannie Duhaime who coordinated AMP and Flora Salvo who suggested using flow cytometry. Thank you to Olivia Gibbs and Khang Hua for reviewing sampling protocol and compiling and providing the data and metadata. Thank you to Stephen Finnis for metadata compilation, analysis of mesozooplankton, and guidance with statistical analysis and R scripts. We thank Julie Arseneau (lab manager), Halyna Klymentieva, Tara MacDonald, Jesslynn Shaw for their laboratory support with the FlowCam sample processes and image classification. We thank Claude Belzile for the flow cytometry sample processing. Thank you to Sebastien Donnet for the oceanographic data collection, processing and analysis and to Terry Bungay, Shannon Cross, Kim Hobbs, Vanessa Oldford, Terry Mills and Thimble Bay blue personnel for the fieldwork.
Conflict of interest
The authors declare that the research was conducted in the absence of any commercial or financial relationships that could be construed as a potential conflict of interest.
Publisher’s note
All claims expressed in this article are solely those of the authors and do not necessarily represent those of their affiliated organizations, or those of the publisher, the editors and the reviewers. Any product that may be evaluated in this article, or claim that may be made by its manufacturer, is not guaranteed or endorsed by the publisher.
Supplementary material
The Supplementary Material for this article can be found online at: https://www.frontiersin.org/articles/10.3389/fmars.2024.1448718/full#supplementary-material
References
Agawin N. S. R., Duarte C. M., Agustí S. (2000). Nutrient and temperature control of the contribution of picoplankton to phytoplankton biomass and production. Limnol. Oceanogr. 45, 591–600. doi: 10.4319/lo.2000.45.3.0591
Agnetta D., Badalamenti F., Colloca F., D’Anna G., Di Lorenzo M., Fiorentino F., et al. (2019). Benthic-pelagic coupling mediates interactions in Mediterranean mixed fisheries: An ecosystem modeling approach. PloS One 14, e0210659. doi: 10.1371/journal.pone.0210659
Anderson K. (2019). “Size spectrum theory,” in Fish Ecology, Evolution, and Exploitation: A New Theoretical Synthesis. Eds. Levin S. A., Horn H. S. (Princeton, NJ: Princeton University Press). 19p.
Angilletta M. J., Steury T. D., Sears M. W. (2004). Temperature, growth rate, and body size in ectotherms: Fitting pieces of a life-history puzzle. Integr. Comp. Biol. 44, 498–509. doi: 10.1093/icb/44.6.498
Arbizu P. M. (2017). GitHub - pmartinezarbizu/pairwiseAdonis: Pairwise multilevel comparison using adonis (Version 0.4).
Archibald K. M., Siegel D. A., Doney S. C. (2019). Modeling the impact of zooplankton diel vertical migration on the carbon export flux of the biological pump. Global Biogeochem. Cycles 33, 181–199. doi: 10.1029/2018GB005983
Arrigo K. R., Robinson D. H., Worthen D. L., Dunbar R. B., DiTullio G. R., VanWoert M., et al. (1999). Phytoplankton community structure and the drawdown of nutrients and CO2 in the Southern Ocean. Science 283, 365–367. doi: 10.1126/science.283.5400.365
Asch R. G., Stock C. A., Sarmiento J. L. (2019). Climate change impacts on mismatches between phytoplankton blooms and fish spawning phenology. Glob. Change Biol. 25, 2544–2559. doi: 10.1111/gcb.14650
Atkinson D. (1994). Temperature and organism size—a biological law for ectotherms? Adv. Ecol. Res. 25, 1–58. doi: 10.1016/S0306-4565(99)00015-7
Azam F., Fenchel T., Field J. G., Gray J. S., Meyer-Reil L. A., Thingstad F. (1983). The ecological role of water-column microbes in the sea. Mar. Ecol. Prog. Ser. 10, 257–263. doi: 10.3354/meps010257
Azra M. N., Okomoda V. T., Tabatabaei M., Hassan M., Ikhwanuddin M. (2021). The contributions of shellfish aquaculture to global food security: assessing its characteristics from a future food perspective. Front. Mar. Sci. 8. doi: 10.3389/fmars.2021.654897
Balaguru K., Doney S. C., Bianucci L., Rasch P. J., Leung L. R., Yoon J.-H., et al. (2018). Linking deep convection and phytoplankton blooms in the northern Labrador Sea in a changing climate. PloS One 13, e0191509. doi: 10.1371/journal.pone.0191509
Bandara K., Varpe O., Wijewardene L., Tverberg V., Eiane K. (2021). Two hundred years of zooplankton vertical migration research. Biol. Rev. 96, 1547–1589. doi: 10.1111/brv.12715
Barton A. D., Irwin A. J., Finkel Z. V., Stock C. A. (2016). Anthropogenic climate change drives shift and shuffle in North Atlantic phytoplankton communities. PNAS 113, 2964–2969. doi: 10.1073/pnas.1519080113
Belzile C., Brugel S., Nozais C., Gratton Y., Demers S. (2008). Variations of the abundance and nucleic acid content of heterotrophic bacteria in Beaufort Shelf waters during winter and spring. J. Mar. Syst. 74, 946–956. doi: 10.1016/j.jmarsys.2007.12.010
Blanchard J. L., Heneghan R. F., Everett J. D., Trebilco R., Richardson A. J. (2017). From bacteria to whales: using functional size spectra to model marine ecosystems. Trends Ecol. Evol. 32, 174–186. doi: 10.1016/j.tree.2016.12.003
Boivin-Rioux A., Starr M., Chassé J., Scarratt M., Perrie W., Long Z. (2021). Predicting the effects of climate change on the occurrence of the toxic dinoflagellate Alexandrium catenella along Canada’s east coast. Front. Mar. Sci. 7. doi: 10.3389/fmars.2020.608021
Boivin-Rioux A., Starr M., Chassé J., Scarratt M., Perrie W., Long Z., et al. (2022). Harmful algae and climate change on the Canadian East Coast: Exploring occurrence predictions of Dinophysis acuminata, D. norvegica, and Pseudo-nitzschia seriata. Harmful Algae 112, 102183. doi: 10.1016/j.hal.2022.102183
Bollens S. M., Rollwagen-Bollens G., Quenette J. A., Bochdansky A. B. (2011). Cascading migrations and implications for vertical fluxes in pelagic ecosystems. J. Plankton Res. 33, 349–355. doi: 10.1093/plankt/fbq152
Borg I., Groenen P. J. F. (2005). Modern multidimensional scaling: Theory and applications. 2nd ed (New York, NY, US: Springer Science+ Business Media).
Boyce D. G., Lewis M. R., Worm B. (2010). Global phytoplankton decline over the past century. Nature 466, 591–596. doi: 10.1038/nature09268
Boyd P. W., Sundby S., Pörtner H.-O. (2014). “Net primary production in the ocean,” in Climate Change 2014: impacts, Adaptation and Vulnerability. Part A. Contribution of Working group II to the Fifth Assessment Report of the Intergovernmental Panel on Climate Change. Eds. Field C. B., Barros V. R., Dokken D. J., Mach K. J., Mastrandrea M. D., Bilir T. E., et al (Cambridge Univ. Press, Cambridge, UK and New York, USA), 133–136.
Brandenburg K. M., Velthuis M., Van de Waal D. B. (2019). Meta-analysis reveals enhanced growth of marine harmful algae from temperate regions with warming and elevated CO2 levels. Glob. Change Biol. 25, 2607–2618. doi: 10.1111/gcb.14678
Brito A. C., Pereira H., Picado A., Cruz J., Cereja R., Biguino B., et al. (2023). Increased oyster aquaculture in the Sado Estuary (Portugal): How to ensure ecosystem sustainability? Sci. Total Environ. 855, 158898. doi: 10.1016/j.scitotenv.2022.158898
Brodeur R. D., Auth T. D., Phillips A. J. (2019a). Major shifts in pelagic micronekton and macrozooplankton community structure in an upwelling ecosystem related to an unprecedented marine heatwave. Front. Mar. Sci. 6. doi: 10.3389/fmars.2019.00212
Brodeur R. D., Hunsicker M. E., Hann A., Miller T. W. (2019b). Effects of warming ocean conditions on feeding ecology of small pelagic fishes in a coastal upwelling ecosystem: a shift to gelatinous food sources. Mar. Ecol. Prog. Ser. 617-618, 149–163. doi: 10.3354/meps12497
Bunker A. J., Hirst A. G. (2004). Fecundity of marine planktonic copepods: global rates and patterns in relation to chlorophyll a, temperature and body weight. Mar. Ecol. Prog. Ser. 279, 161–181. doi: 10.3354/meps279161
Byron C., Link J., Costa-Pierce B., Bengtson D. (2011). Modeling ecological carrying capacity of shellfish aquaculture in highly flushed temperate lagoons. Aquaculture 314, 87–99. doi: 10.1016/j.aquaculture.2011.02.019
Cabré A., Marinov I., Leung S. (2015). Consistent global responses of marine ecosystems to future climate change across the IPCC AR5 earth system models. Clim. Dyn. 45, 1253–1280. doi: 10.1007/s00382-014-2374-3
Callier M. D., McKindsey C. W., Desrosiers G. (2008). Evaluation of indicators used to detect mussel farm influence on the benthos: Two case studies in the Magdalen Islands, Eastern Canada. Aquaculture 278, 77–88. doi: 10.1016/j.aquaculture.2008.03.026
Callier M. D., Richard M., McKindsey C. W., Archambault P., Desrosiers G. (2009). Responses of benthic macrofauna and biogeochemical fluxes to various levels of mussel biodeposition: An in situ “benthocosm” experiment. Mar. pollut. Bull. 58, 1544–1553. doi: 10.1016/j.marpolbul.2009.05.010
Chisholm S. W. (1992). “Phytoplankton size,” in Primary Productivity and Biogeochemical Cycles in the Sea. Eds. Falkowski P. G., Woodhead A. D. (Springer Science + Business Media, New York, USA), 213–237.
Comean L. A., Guyondet T., Drolet D., Sonier R., Clements J. C., Tremblay R., et al. (2023). Revisiting ecological carrying capacity indices for bivalve culture. Aquaculture 577, 739911. doi: 10.1016/j.aquaculture.2023.739911
Cooley S., Schoeman D., Bopp L., Boyd P., Donner S., Ghebrehiwet D. Y., et al. (2022). “Oceans and coastal ecosystems and their services,” in Climate Change 2022: Impacts, Adaptation and Vulnerability. Eds. Pörtner H.-O., Roberts D. C., Tignor M., Poloczanska E. S., Mintenbeck K., Alegría A., et al (Cambridge University Press, Cambridge, UK and New York, NY, USA), 379–550. doi: 10.1017/9781009325844.005
Courties C., Vaquer A., Troussellier M., Lautier J., Chrétiennot-Dinet M. J., Neveux J., et al. (1994). Smallest eukaryotic organism. Nature 370, 255. doi: 10.1038/370255a0
Cranford P. J., Li W., Strand Ø., Strohmeier T. (2008). Phytoplankton depletion by mussel aquaculture: high resolution mapping, ecosystem modeling and potential indicators of ecological carrying capacity (Copenhagen, Denmark; ICES CM Document). Available at: www.ices.dk/products/CMdocs/CM-2008/H/H1208.pdf. 5p.
Cranford P. J., Ward E., Shumway S. E. (2011). “Bivalve filter feeding: variability and limits of the aquaculture biofilter,” in Shellfish Aquaculture and the Environment. Ed. Shumway S. E. (Oxford, UK: John Wiley & Sons, Inc), 81–124.
Cyr F., Bélanger D. (2024). “Environmental indices for NAFO subareas 0 to 4 in support of the Standing Committee on Fisheries Science (STACFIS - 2023 update),” in NAFO SCR Doc. (Halifax, Nova Scotia, Canada: Northwest Atlantic Fisheries Organization) 9, 191–198.
Cyr F., Lewis K., Bélanger D., Regular P., Clay S., Devred E. (2023). Physical controls and ecological implications of the timing of the spring phytoplankton bloom on the Newfoundland and Labrador shelf. Limnol. Oceanogr. Lett. 9 (3), 191–198. doi: 10.1002/lol2.10347
Dame R. F. (1996). Ecology of marine bivalves: An ecosystem approach (Boca Raton, Florida: CRC Press).
Daufresne M., Lengfellner K., Sommer U. (2009). Global warming benefits the small in aquatic ecosystems. Proc. Nat. Acad. Sci. U.S.A. 106, 12788–12793. doi: 10.1073/pnas.0902080106
Davenport J., Smith R. J. J. W., Packer M. (2000). Mussels Mytilus edulis: significant consumers and destroyers of mesozooplankton. Mar. Ecol. Prog. Ser. 198, 131–137. doi: 10.3354/meps198131
Degerman R., Lefébure R., Byström P., Båmstedt U., Larsson S., Andersson A. (2018). Food web interactions determine energy transfer efficiency and top consumer responses to inputs of dissolved organic carbon. Hydrobiologia 805, 131–146. doi: 10.1007/s10750-017-3298-9
Deibel D., Powell C. V. L. (1987). Comparison of the ultrastructure of the food-concentrating filter of two appendicularians. Mar. Ecol. Prog. Ser. 39, 81–85. doi: 10.3354/meps039081
Donnet S., Cross S., Goulet P., Ratsimandresy A. W. (2018). Coast of Bays seawater vertical and horizontal structure, (2009-13): Hydrographic structure, spatial variability and seasonality based on the Program for Aquaculture Regulatory Research (PARR) 2009-13 oceanographic surveys (St. John’s, NL: DFO Canadian Science Advisory Sector Research Document). viii + 255 p.
du Pontavice H., Gascuel D., Reygondeau G., Stock C., Cheung W. W. L. (2021). Climate-induced decrease in biomass flow in marine food webs may severely affect predators and ecosystem production. Glob. Change Biol. 27, 2608–2622. doi: 10.1111/gcb.15576
Eddy T. D., Bernhardt J. R., Blanchard J. L., Cheung W. W. L., Colléter, du Pontavice H. (2021). Energy flow through marine ecosystems: confronting transfer efficiency. Trends Ecol. Evol. 36, 76–86. doi: 10.1016/j.tree.2020.09.006
Edwards K. F., Thimas M. K., Klausmeier C. A., Litchman E. (2016). Phytoplankton growth and the interaction of light and temperature: A synthesis at the species and community level. Limnol. Oceanogr. 61, 1232–1244. doi: 10.1002/lno.10282
FAO Fisheries and Aquaculture Department (2022). The state of world fisheries and aquaculture 2022. Towards Blue Transformation (Rome: Food and Agriculture Organization of the United Nations). xxv + 236 p.
Filgueira R., Byron C. J., Comeau L. A., Costa-Pierce B., Cranford P. J., Ferreira J. G., et al. (2015). An integrated ecosystem approach for assessing the potential role of cultivated bivalve shells as part of the carbon trading system. Mar. Ecol. Prog. Ser. 518, 281–287. doi: 10.3354/meps11048
Filgueira R., Guyondet T., Comeau L. A., Tremblay R. (2016). Bivalve aquaculture-environment interactions in the context of climate change. Glob. Change Biol. 22, 3901–3913. doi: 10.1111/gcb.13346
Filgueira R., Guyondet T., Thupaki P., Sakamaki T., Grant J. (2021). The effect of embayment complexity on ecological carrying capacity estimations in bivalve aquaculture sites. J. Clean. Prod. 288, 125739. doi: 10.1016/j.jclepro.2020.125739
Finnis S., Guyondet T., McKindsey C. W., Arseneau J., Barrell J., Duhaime J., et al. (2023). Guidance on sampling effort to monitor mesozooplankton communities at Canadian bivalve aquaculture sites using an optical imaging system. Can. Tech. Rep. Fish. Aquat. Sci. 3581, vii + 101. Available online at: https://www.google.com/url?q=https://publications.gc.ca/collections/collection_2023/mpo-dfo/Fs97-6-3581-eng.pdf&sa=D&source=docs&ust=1726517275556564&usg=AOvVaw2u5LnAnTP-C3H1fYsmqddk.
Fong C. R., Gaynus C. J., Carpenter R. C. (2020). Extreme rainfall events pulse substantial nutrients and sediments from terrestrial to nearshore coastal communities: a case study from French Polynesia. Sci. Rep. 10, 2955. doi: 10.1038/s41598-020-59807-5
Gallardi D. (2016). Effect of the environment on condition and quality of cultured blue mussel (Mytilus edulis) with reference to culture depth and post-harvest practices. Memorial University of Newfoundland and Labrador, St. John’s (NL.
Gallardi D., Mills T., Donnet S., Parrish C. C., Murray H. M. (2017). Condition and biochemical profile of blue mussels (Mytilus edulis L.) cultured at different depths in a cold water coastal environment. J. Sea. Res. 126, 37–45. doi: 10.1016/j.seares.2017.07.001
Gao Y., Jiang Z., Chen Y., Liu J., Zhu Y., Liu X., et al. (2022). Spatial variability of phytoplankton and environmental drivers in the turbid Sanmen Bay (East China Sea). Estuaries Coast. 45, 2519–2533. doi: 10.1007/s12237-022-01104-7
Garzke J., Ismar S. M. H., Sommer U. (2015). Climate change affects low trophic level marine consumers: warming decreases copepod size and abundance. Oecologia 177, 849–860. doi: 10.1007/s00442-014-3130-4
Gibbs M. T. (2004). Interactions between bivalve shellfish farms and fishery resources. Aquaculture 240, 267–296. doi: 10.1016/j.aquaculture.2004.06.038
Gobler C. J., Doherty O. M., Hattenrath-Lehmann T. K., Griffith A. W., Kang Y., Litaker R. W. (2017). Ocean warming since 1982 has expanded the niche of toxic algal blooms in the North Atlantic and North Pacific oceans. PNAS 114, 4975–4980. doi: 10.1073/pnas.1619575114
Gonzalez-García C., Agustí S., Aiken J., Bertrand A., Fariasf G. B., Bode A., et al. (2023). Basin-scale variability in phytoplankton size-abundance spectra across the Atlantic Ocean. Prog. Oceanogr 217, 103104. doi: 10.1016/j.pocean.2023.103104
Granados M., Duffy S., McKindsey C. W., Fussman G. F. (2017). Stabilizing mechanisms in a food web with an introduced omnivore. Ecol. Evol. 7, 5016–5025. doi: 10.1002/ece3.2773
Grant J., Bacher C., Cranford P. J., Guyondet T., Carreau M. (2008). A spatially explicit ecosystem model of seston depletion in dense mussel culture. J. Mar. Syst. 73, 155–168. doi: 10.1016/j.jmarsys.2007.10.007
Grant J., Hatcher A., Scott D. B., Pocklington P., Schafer C. T., Winters G. V. (1995). A multidisciplinary approach to evaluating impacts of shellfish aquaculture on benthic communities. Estuaries 18, 124. doi: 10.2307/1352288
Griffiths J. R., Kadin M., Nascimento F. J. A., Tamelander T., Tornroos A., Bongalia S., et al. (2017). The importance of benthic-pelagic coupling for marine ecosystem functioning in a changing world. Glob. Change Biol. 23, 2179–2196. doi: 10.1111/gcb.13642
Guyondet T., Filgueira R., Pearce C. M., Tremblay R., Comeau L. A. (2022). Nutrient-loading mitigation by shellfish aquaculture in semi-enclosed estuaries. Front. Mar. Sci. 9. doi: 10.3389/fmars.2022.909926
Guyondet T., Sonier R., Comeau L. A. (2013). Spatially explicit seston depletion index to optimize shellfish culture. Aquac. Environ. Interact. 4, 175–186. doi: 10.3354/aei00083
Hattenrath-Lehmann T. K., Marcoval M. A., Mittlesdorf H., Goleski J. A., Wang Z., Haynes B., et al. (2015). Nitrogenous nutrients promote the growth and toxicity of Dinophysis acuminata during estuarine bloom events. PloS One 10, e0124148. doi: 10.1371/journal.pone.0124148
Hatton I. A., Heneghan R. F., Bar-On Y. M., Galbraith E. D. (2021). The global ocean size spectrum from bacteria to whales. Sci. Adv. 7, eabh3732. doi: 10.1126/sciadv.abh3732
Heneghan R. F., Everett J. D., Blanchard J. L., Sykes P., Richardson A. J. (2023). Climate-driven zooplankton shifts cause large-scale declines in food quality for fish. Nat. Clim. Change 13, 470–477. doi: 10.1038/s41558-023-01630-7
Ho Q. N., Fettweis M., Spencer K. L., Lee B. J. (2022). Flocculation with heterogeneous composition in water environments: A review. Water Res. 213, 118147. doi: 10.1016/j.watres.2022.118147
Horsted S. J., Nielsen T. G., Riemann B., Pock-Steen J., Bjørnsen P. K. (1988). Regulation of zooplankton by suspension-feeding bivalves and fish in estuarine enclosures. Mar. Ecol. Prog. Ser. 48, 217–224. doi: 10.3354/meps048217
Hu C., Chen X., Yu L., Xu D., Jiao N. (2020). Elevated contribution of low nucleic acid prokaryotes and viral lysis to the prokaryotic community along the nutrient gradient from an estuary to open ocean transect. Front. Microbiol. 11. doi: 10.3389/fmicb.2020.612053
Hulot F. D., Lacroix G., Loreau M. (2014). Differential responses of size-based functional groups to bottom-up and top-down perturbations in pelagic food webs: a metaanalysis. Oikos 123, 1291–1300. doi: 10.1111/oik.01116
Hulot V., Saulnier D., Lafabrie C., Gaertner-Mazouni N. (2020). Shellfish culture: a complex driver of planktonic communities. Rev. Aquac. 12, 33–46. doi: 10.1111/raq.12303
Ibarbalz F. M., Henry N., Brandao M. C., Martini S., Busseni G., Byrne H., et al. (2019). Global trends in marine plankton diversity across kingdoms of life. Cell 179, 1084–1097. doi: 10.1016/j.cell.2019.10.008
IPCC. (2021). “Climate change 2021: the physical science basis,” in Contribution of working group I to the sixth assessment report of the intergovernmental panel on climate change, eds. Masson-Delmotte V., Zhai P., Pirani A., Connors S. L., Péan C., Berger S., et al. (eds). (Cambridge, United Kingdom and New York, NY, USA: Cambridge University Press), 2391pp. doi: 10.1017/9781009157896
Jennings S. (2012). “Size-based analyses of aquatic food webs,” in Aquatic Food Webs: An Ecosystem Approach. Eds. Belgrano A., Schlarler U. M., Dunne J., Ulanowicz R. E. (Oxford University Press, Oxford, UK), 86–97.
Jiang T., Chen F., Yu Z., Lu L., Wang Z. (2016). Size-dependent depletion and community disturbance of phytoplankton under intensive oyster mariculture based on HPLC pigment analysis in Daya Bay, South China Sea. Environ. pollut. 219, 804–814. doi: 10.1016/j.envpol.2016.07.058
Jiang H., Osborn T. R. (2004). ). Hydrodynamics of copepods: A review. Surv. Geophys 25, 339–270. doi: 10.1007/s10712-003-1282-6
Jiang T., Pan H., Steeves L., Jiang Z., Filgueira R., Strand Ø., et al. (2022). Effect of Mytilus coruscus selective filtration on phytoplankton assemblages. Front. Mar. Sci. 9. doi: 10.3389/fmars.2022.1070737
Johnson W. S., Allen D. M. (2012). Zooplankton of the Atlantic and Gulf coasts: a guide to their identification and ecology (Baltimore, USA: The Johns Hopkins University Press).
Katechakis A., Stibor H., Sommer U., Hansen T. (2002). Changes in the phytoplankton community and in the microbial food web of Blanes Bay (Catalan Sea, NW-Mediterranean) under prolonged grazing pressure by doliolids (Tunicata), cladocerans or copepods (Crustacea). Mar. Ecol. Prog. Ser. 234, 55–69. doi: 10.3354/meps234055
Kiørboe T. (2009). A Mechanistic Approach to Plankton Ecology Vol. 1 (Princeton, USA: Princeton University Press), 1–91. ASLO Web Lectures. doi: 10.1515/9780691190310
Kiørboe T. (2011). How zooplankton feed: Mechanisms, traits and trade-offs. Biol. Rev. 86, 311–339. doi: 10.1111/j.1469-185X.2010.00148.x
Kirk J. T. O. (1994). Light and photosynthesis in aquatic ecosystems. 2nd edition (Cambridge: Cambridge University Press). 509 p.
Kondo R., Mori Y., Sakami T. (2012). Comparison of sulphate-reducing bacterial communities in Japanese fish farm sediments with different levels of organic enrichment. Microbes Environ. 27, 193–199. doi: 10.1264/jsme2.ME11278
Kozlowski J., Czarnoleski M., Danko M. (2004). Can optimal resource allocation models explain why ectotherms grow larger in cold? Integr. Comp. Biol. 44, 480–493. doi: 10.1093/icb/44.6.480
Lacoste E., McKindsey C. W., Archambault P. (2020). Biodiversity-Ecosystem Functioning (BEF) approach to further understanding aquaculture-environment interactions with application to bivalve culture and benthic ecosystems. Rev. Aquacult. 12, 2027–2041. doi: 10.1111/raq.12420
Lam-Hoai T., Rougier C. (2001). Zooplankton assemblages and biomass during a 4-period survey in a northern Mediterranean coastal lagoon. Water Res. 35, 271–283. doi: 10.1016/S0043-1354(00)00243-8
Langdon C. J., Newell R. I. E. (1990). Utilization of detritus and bacteria as food sources by two bivalve suspension-feeders, the oyster Crassostrea virginica and the mussel Geukensia demissa. Mar. Ecol. Prog. Ser. 58, 299–310. doi: 10.3354/meps058299
Lapeyra Martin J., John U., Royer C., Gypens N. (2022). Fantastic beasts: Unfolding mixoplankton temporal variability in the Belgian coastal zone through DNA-metabarcoding. Front. Mar. Sci. 9. doi: 10.3389/fmars.2022.786787
Lavaud R., Guyondet T., Filgueira R. (2020). Modelling bivalve culture - Eutrophication interactions in shallow coastal ecosystems. Mar. pollut. Bull. 157, 111282. doi: 10.1016/j.marpolbul.2020.111282
Lavoie D., Lambert N., Rousseau S., Dumas J., Chassé J., Long Z., et al. (2010). Projections of future physical and biochemical conditions in the Gulf of St. Lawrence, on the Scotian Shelf and in the Gulf of Maine using a regional climate model. Can. Tech. Rep. Hydrogr. Ocean Sci. 334, xiii + 102 p. Available online at: https://www.google.com/url?q=https://publications.gc.ca/site/eng/9.892092/publication.html&sa=D&source=docs&ust=1726517275558201&usg=AOvVaw1YbF77gfQpaEDsAM6MwYFa
Lee H.-W., Ban S., Ikeda T., Matsuishi T. (2003). Effect of temperature on development, growth and reproduction in the marine copepod Pseudocalanus newmani at satiating food condition. J. Plankton Res. 25, 261–271. doi: 10.1093/plankt/25.3.261
Legendre L., Rassoulzadegan F. (1995). Plankton and nutrient dynamics in marine waters. Ophelia 41, 153–172. doi: 10.1080/00785236.1995.10422042
Lehane C., Davenport J. (2002). Ingestion of mesozooplankton by three species of bivalve; Mytilus edulis, Cerastoderma edule and Aequipecten opercularis. J. Mar. Biolog. Assoc. 82, 615–619. doi: 10.1017/S0025315402005957
Lehane C., Davenport J. (2006). A 15-month study of zooplankton ingestion by farmed mussels (Mytilus edulis) in Bantry Bay, Southwest Ireland. Estuar. Coast. Shelf Sci. 67 4, 645–652. doi: 10.1016/j.ecss.2005.12.015
Levasseur M., Therriault J.-C., Legendre L. (1984). Hierarchical control of phytoplankton succession by physical factors. Mar. Ecol. Prog. Ser. 19, 211–222. doi: 10.3354/meps019211
Lin J., Li C., Zhang S. (2016). Hydrodynamic effect of a large offshore mussel suspended aquaculture farm. Aquaculture 451, 147–155. doi: 10.1016/j.aquaculture.2015.08.039
Lindeman R. L. (1942). The trophic-dynamic aspect of ecology. Ecol. 23, 399–417. doi: 10.2307/1930126
Lombard F., Boss E., Waite A. M., Vogt M., Uitz J., Stemmann L., et al. (2019). Globally consistent quantitative observations of planktonic ecosystems. Front. Mar. Sci. 6. doi: 10.3389/fmars.2019.00196
Longnecker K., Sherr B. F., Sherr E. B. (2005). Activity and phylogenetic diversity of bacterial cells with high and low nucleic acid content and electron transport system activity in an upwelling ecosystem. Appl. Environ. Microb. 71, 7737–7749. doi: 10.1128/aem.71.12.7737-7749.2005
López-Urrutia Á., Morán X. A. G. (2007). Resource limitation of bacterial production distorts the temperature dependence of oceanic carbon cycling. Ecol 88, 817–822. doi: 10.1890/06-1641
Maar M., Nielsen T., Petersen J. (2008). Depletion of plankton in a raft culture of Mytilus galloprovincialis in Ría de Vigo, NW Spain. II. Zooplankton. Aquat. Biol. 4, 127–141. doi: 10.3354/ab00125
Mackas D. L., Greve W., Edwards M., Chiba S., Tadokoro K., Eloire D., et al. (2012). Changing zooplankton seasonality in a changing ocean: Comparing time series of zooplankton phenology. Prog. Oceanogr. 97-100, 31–62. doi: 10.1016/j.pocean.2011.11.005
Maillet G., Bélanger D., Doyle G., Robar A., Rastin S., Ramsay D., et al. (2022). Optical, chemical, and biological oceanographic conditions on the Newfoundland and Labrador Shelf during 2018 (St. John’s, NL: DFO Can. Sci. Advis. Sec. Res. Doc). viii + 53 p.
Malone T. C. (1980). “Algal size,” in The Physiological Ecology of Phytoplankton. Ed. Morris I. (University of California Press, Berkely), 433–463.
Marcus N. H., Boero F. (1998). Minireview: The importance of benthic-pelagic coupling and the forgotten role of life cycles in coastal aquatic systems. Limnol. Oceanogr. 43, 763–768. doi: 10.4319/lo.1998.43.5.0763
Matsumoto K., Honda M. C., Sasaoka K., Wakita M., Kawakami H., Watanabe S. (2014). Seasonal variability of primary production and phytoplankton biomass in the western Pacific subarctic gyre: Control of light availability within the mixed layer. J. Geophys. Res. Oceans 119, 6523–6534. doi: 10.1002/2014JC009982
McGinty N., Barton A. D., Record N. R., Finkel Z. V., Johns D. G., Stock C. A., et al. (2020). Anthropogenic climate change impacts on copepod trait biogeography. Glob. Change Biol. 27, 1431–1442. doi: 10.1111/gcb.15499
McKindsey C. W., Archambault P., Callier M. D., Olivier F. (2011). Influence of suspended and off-bottom mussel culture on the sea bottom and benthic habitats: a review. Can. J. Zool. 89, 622–646. doi: 10.1139/z11-037
McKindsey C. W., Landry T., O'Beirn F. X., Davies I. M. (2007). Bivalve aquaculture and exotic species: a review of ecological considerations and management issues. J. Shellfish. Res. 26, 281–294. doi: 10.2983/0730-8000(2007)26[281:BAAESA]2.0.CO;2
Mella-Flores D., Six C., Ratin M., Partensky F., Boutte C., Le Corguillé G., et al. (2012). Prochlorococcus and Synechococcus have evolved different adaptive mechanisms to cope with light and UV stress. Front. Microbiol. 3. doi: 10.3389/fmicb.2012.00285
Michelsen H. K., Svensen C., Reigstad M., Nilssen E. M., Pedersen T. (2017). Seasonal dynamics of meroplankton in a high-latitude fjord. J. Mar. Syst. 167, 17–30. doi: 10.1016/j.jmarsys.2016.12.001
Møhlenberg F., Riisgård H. U. (1978). Efficiency of particle retention in 13 species of suspension feeding bivalves. Ophelia 17, 239–246. doi: 10.1080/00785326.1978.10425487
Moore M., Folt C. (1993). Zooplankton body size and community structure: effects of thermal and toxicant stress. Trends Ecol. Evol. 8, 178. doi: 10.1016/0169-5347(93)90144-E
Moore S. K., Trainer V. L., Mantua N. J., Parker M. S., Laws E. A., Backer L. C., et al. (2008). Impacts of climate variability and future climate change on harmful algal blooms and human health. Environ. Health 7, S4. doi: 10.1186/1476-069X-7-S2-S4
Morán X. A. G., López-Urrutia Á., Calvo-Díaz L., Li W. K. W. (2010). Increasing importance of small phytoplankton in a warmer ocean. Glob. Change Biol. 16, 1137–1144. doi: 10.1111/j.1365-2486.2009.01960.x
Neuheimer A. B., Mackenzie B. R., Payne M. R. (2018). Temperature-dependent adaptation allows fish to meet their food across their species’ range. Sci. Adv. 4, eaar4349. doi: 10.1126/sciadv.eaar4349
Newell R. I. (2004). Ecosystem influences of natural and cultivated populations of suspension-feeding bivalve molluscs: a review. J. Shellfish Res. 23, 51–62. Available online at: https://go.gale.com/ps/i.do?id=GALE%7CA118543914&sid=googleScholar&v=2.1&it=r&linkaccess=abs&issn=07308000&p=AONE&sw=w&userGroupName=anon%7E519eea50&aty=open-web-entry
Norén F., Haamer J., Lindahl O. (1999). Changes in the plankton community passing a Mytilus edulis bed. Mar. Ecol. Prog. Ser. 191, 187e194. doi: 10.3354/meps191187
Novotny A., Serandour B., Kortsch S., Gauzens B., Jan K. M. G., Winder M. (2023). DNA metabarcoding highlights cyanobacteria as the main source of primary production in a pelagic food web model. Sci. Adv. 9, eadg1096. doi: 10.1126/sciadv.adg1096
Oksanen J., Simpson G. L., Blanchet F. G., Kindt R., Legendre P., Minchin P. R., et al. (2022). vegan: community ecology package. doi: 10.32614/CRAN.package.vegan (version 2.6-6).
Owen B. M., Hallett C. S., Cosgrove J. J., Tweedley J. R., Moheimani N. R. (2022). Reporting of methods for automated devices: A systematic review and recommendation for studies using FlowCam for phytoplankton. Limnol. Oceanogr. Methods 20, 373–465. doi: 10.1002/lom3.10496
Penney R. W., McKenzie C. H., Mills T. J. (2001). Assessment of the particulate food supply available for mussel (Mytilus spp.) farming in a semi-enclosed, northern inlet. Estuar. Coast. Shelf Sci. 53, 107–121. doi: 10.1006/ecss.2001.0783
Petersen J. K. (2007). Ascidian suspension feeding. J. Exp. Mar. Biol. Ecol. 342, 127–137. doi: 10.1016/j.jembe.2006.10.023
Poniedziałek B., Falfushynska H. I., Rzymski P. (2017). Flow cytometry as a valuable tool to study cyanobacteria: A mini-review. Limnol. Rev. 17, 89–95. doi: 10.1515/limre-2017-0009
Prins T. C., Escaravage V., Smaal A. C., Peters J. C. H. (1995). Nutrient cycling and phytoplankton dynamics in relation to mussel grazing in a mesocosm experiment. Ophelia 41, 289–315. doi: 10.1080/00785236.1995.10422049
Ratnaraja L., Abu-Alhaija R., Atkinson A., Batten S., Bax N. J., Bernard K. S., et al. (2023). Monitoring and modelling marine zooplankton in a changing climate. Nat. Commun. 14, 564. doi: 10.1038/s41467-023-36241-5
Riisgård H. U. (1988). Efficiency of particle retention and filtration-rate in 6 species of northeast American bivalves. Mar. Ecol. Prog. Ser. 45, 217–223. doi: 10.3354/meps045217
Rodhouse P. G., Roden C. M. (1987). Carbon budget for a coastal inlet in relation to intensive cultivation of suspension-feeding bivalve molluscs. Mar. Ecol. Prog. Ser. 36, 225–236. doi: 10.3354/meps036225
Rodrigues M. A., Agostini V. O., Ozorio C. P. (2019). Short-term temporal variations in the zooplankton community of the surf zone influenced by estuarine discharge. Reg. Stud. Mar. Sci. 29, 100687. doi: 10.1016/j.rsma.2019.100687
Ryther J. H. (1969). Photosynthesis and fish production in the sea. Science 166, 72–76. doi: 10.1126/science.166.3901.72
Sarmento H., Montoya J. M., Vázquez-Domínguez E., Vaqué D., Gasol J. M. (2010). Warming effects on marine microbial food web processes: how far can we go when it comes to predictions? Philos. Trans. R. Soc Lond. B. Biol. Sci. 365, 2137–2149. doi: 10.1098/rstb.2010.0045
Schmidt K., Birchill A. J., Atkinson A., Brewin R. J. W., Clark J. R., Hickman A. E., et al. (2020). Increasing picocyanobacterial success in shelf waters contributes to long-term food web degradation. Glob. Change Biol. 26, 5574–5587. doi: 10.1111/gcb.15161
Schnack-Schiel S. B., Isla E. (2005). The role of zooplankton in the pelagic-benthic coupling of the Southern Ocean. Sci. Mar. 69, 39–55. doi: 10.3989/SCIMAR.2005.69S239
Schröder T., Stank J., Schernewski G., Krost P. (2014). The impact of a mussel farm on water transparency in the Kiel Fjord. Ocean Coast. Manage. 101, 42–52. doi: 10.1016/J.OCECOAMAN.2014.04.034
Seiderer L. J., Newell R. J. (1985). Relative significance of phytoplankton, bacteria and plankton detritus as carbon and nitrogen resources for the kelp bed filter-feeder Chromytilus meridionalis. Mar. Biol. Prog. Ser. 22, 127–139. doi: 10.3354/meps022127
Selifonova Z. P. (2012). Taxonomic composition and seasonal dynamics of the meroplankton of the coastal zone of the northeastern Black Sea. Russ. J. Mar. Biol. 38, 1–9. doi: 10.1134/S1063074012010129
Servais P., Casamayor E. O., Courties C., Catala P., Parthuisot N., Lebaron P. (2003). Activity and diversity of bacterial cells with high and low nucleic acid content. Aquat. Microb. Ecol. 33, 41–51. doi: 10.3354/ame033041
Sevellec M., Laporte M., Bernatchez A., Derome N., Bernatchez L. (2019). Evidence for host effect on the intestinal microbiota of whitefish (Coregonus sp.) species pairs and their hybrids. Ecol. Evol. 9, 11762–11774. doi: 10.1002/ece3.5676
Silva E., Garbossa L. H. P., Nuner A. P. O., Lapa K. R. (2019). Hydrodynamic modelling of the dispersion and deposition of biodeposits from marine bivalve mollusc farming under neap and spring tides in Santa Catarina Island bays. Aquaculture 501, 507–514. doi: 10.1016/j.aquaculture.2018.11.001
Sommer U., Stibor H. (2002). Copepoda - Cladocera - Tunicata: The role of three major mesozooplankton groups in pelagic food webs. Ecol. Res. 17, 161–174. doi: 10.1046/j.1440-1703.2002.00476.x
Sommer U., Stibor H., Katechakis A., Sommer F., Hansen T. (2002). Pelagic food web configurations under different levels of nutrient richness and their implications for the ratio fish production: primary production. Hydrobiologia 484, 11–20. doi: 10.1023/A:1021340601986
Sonier R., Filgueira R., Guyondet T., Tremblay R., Olivier F., Meziane T., et al. (2016). Picophytoplankton contribution to Mytilus edulis growth in an intensive culture environment. Mar. Biol. 163, 1e15. doi: 10.1007/s00227-016-2845-7
Sorokin Y. I. (1981). “Microheterotorphic organisms in marine ecosystems,” in Analysis of Marine Ecosystems. Ed. Longhurts A. R. (Academic Press, London, UK), 293–342.
Souchu P., Vaquer A., Collos Y., Landrein S., Deslous-Paoli J., Bibent B. (2001). Influence of shellfish farming activities on the biogeochemical composition of the water column in Thau lagoon. Mar. Ecol. Prog. Ser. 218, 141e152. doi: 10.3354/meps218141
Stacey J. E. (2003). The impact of mussel (Mytilus sp.) farming on zooplankton communities in Notre Dame Bay, Newfoundland. (St. John’s, NL, Canada: Memorial University of Newfoundland and Labrador).
Striebe M., Kallajoki L., Kunze C., Wollschläger J., Deininger A., Hillebrand H. (2023). Marine primary producers in a darker future: a meta-analysis of light effects on pelagic and benthic autotrophs. Oikos 2023, e09501. doi: 10.1111/oik.09501
Strohmeier T., Strand Ø., Alunno-Bruscia M., Duinker A., Cranford P. J. (2012). Variability in particle retention efficiency by the mussel Mytilus edulis. J. Exp. Mar. Biol. Ecol. 412, 96–102. doi: 10.1016/j.jembe.2011.11.006
Stuart V., Newell R. C., Lucas M. I. (1982). Conversion of kelp debris and faecal material from the mussel Aulacomya ater by marine micro-organisms. Mar. Ecol. Prog. Ser. 7, 47–57. doi: 10.3354/MEPS007047
Sugie K., Fujiwara A., Nishino S., Kameyama S., Harada N. (2020). Impacts of temperature, CO2, and salinity on phytoplankton community composition in the western Arctic Ocean. Front. Mar. Sci. 6. doi: 10.3389/fmars.2019.00821
Therriault J. C., Levasseur M. (1985). Control of phytoplankton production in the Lower St. Lawrence Estuary: Light and freshwater runoff. Le Naturaliste Canadien 112, 77–96.
Thomas Y., Garen P., Courties C., Charpy L. (2010). Spatial and temporal variability of the pico- and nanophytoplankton and bacterioplankton in a deep Polynesian atoll lagoon. Aquat. Microb. Ecol. 59, 89–101. doi: 10.3354/ame01384
Titelman J., Kiørboe T. (2003). Predator avoidance by nauplii. Mar. Ecol. Prog. Ser. 247, 137–149. doi: 10.3354/meps247137
Trebilco R., Baum J. K., Salomon A. K., Dulvy N. K. (2013). Ecosystem ecology: size-based constraints on the pyramid of life. Trends Ecol. Evol. 28, 423–431. doi: 10.1016/j.tree.2013.03.008
Tremblay G., Belzile C., Gosselin M., Poulin M., Roy S., Tremblay J.-E. (2009). Late summer phytoplankton distribution along a 3500 km transect in Canadian Arctic waters: strong numerical dominance by picoeukaryotes. Aquat. Microb. Ecol. 54, 55–70. doi: 10.3354/ame01257
Trottet A., Roy S., Tamigneaux E., Lovejoy C., Tremblay R. (2008). Impact of suspended mussels (Mytilus edulis L.) on plankton communities in a Magdalen Islands lagoon (Québec, Canada): A mesocosm approach. J. Exp. Mar. Biol. Ecol. 365, 103e115. doi: 10.1016/j.jembe.2008.08.001
Vaquer A., Troussellier M., Courtues C., Bibent B. (1996). Standing stock and dynamics of picophytoplankton in the Thau Lagoon (northwest Mediterranean coast). Limnol. Oceanogr. 41, 1821–1828. doi: 10.4319/lo.1996.41.8.1821
Vázquez-Domínguez E., Vaqué D., Gasol A. M. (2007). Ocean warming enhances respiration and carbon demand of coastal microbial plankton. Glob. Change Biol. 13, 1327–1334. doi: 10.1111/j.1365-2486.2007.01377.x
Wangersky P. J. (1977). The role of particulate matter in the productivity of surface waters. Helgol. Wiss. Meeresunters. 30, 546–564. doi: 10.1007/BF02207860
Ward B. A., Maranon E., Sauterey B., Rault J., Claessen D. (2017). The size dependence of phytoplankton growth rates: A trade-off between nutrient uptake and metabolism. Am. Nat. 189, 170–177. doi: 10.1086/689992
Ward J. E., Shumway S. E. (2004). Separating the grain from the chaff, particle selection in suspension- and deposit-feeding bivalves. J. Exp. Mar. Biol. Ecol. 300, 83–130. doi: 10.1016/j.jembe.2004.03.002
Wetz M. S., Lewitus A. J., Koepfler E. T., Hayes K. C. (2002). Impact of the eastern oyster Crassostrea virginica on microbial community structure in a salt marsh estuary. Aquat. Microb. Ecol. 28, 87–97. doi: 10.3354/ame028087
White P. A., Kalff J., Rasmussen J. B., Gasol J. M. (1991). The effect of temperature and algal biomass on bacterial production and specific growth-rate in fresh-water and marine habitats. Microb. Ecol. 21, 99–118. doi: 10.1007/BF02539147
Zhang J., Hansen P. K., Wu W., Liu Y., Sun K., Zhao Y., et al. (2020). Sediment-focused environmental impact of long-term large-scale marine bivalve and seaweed farming in Sungo Bay, China. Aquaculture 528, 735561. doi: 10.1016/j.aquaculture.2020.735561
Keywords: phytoplankton, zooplankton, shellfish, flow cytometry, FlowCam imaging, size distribution, pelagic food web, coastal embayment
Citation: Sharpe H, Gallardi D, Gurney-Smith H, Guyondet T, McKindsey CW and Lacoursière-Roussel A (2024) Ecological insight of seasonal plankton succession to monitor shellfish aquaculture ecosystem interactions. Front. Mar. Sci. 11:1448718. doi: 10.3389/fmars.2024.1448718
Received: 13 June 2024; Accepted: 04 September 2024;
Published: 26 September 2024.
Edited by:
Tilmann Harder, University of Bremen, GermanyReviewed by:
Zhixuan Feng, East China Normal University, ChinaMichael William Lomas, Bigelow Laboratory For Ocean Sciences, United States
Copyright © 2024 Sharpe, Gallardi, Gurney-Smith, Guyondet, McKindsey and Lacoursière-Roussel. This is an open-access article distributed under the terms of the Creative Commons Attribution License (CC BY). The use, distribution or reproduction in other forums is permitted, provided the original author(s) and the copyright owner(s) are credited and that the original publication in this journal is cited, in accordance with accepted academic practice. No use, distribution or reproduction is permitted which does not comply with these terms.
*Correspondence: Hannah Sharpe, aHNoYXJwZUB1bmIuY2E=; Anaïs Lacoursière-Roussel, QW5haXMuTGFjb3Vyc2llcmVAZGZvLW1wby5nYy5jYQ==
†ORCID: Anaïs Lacoursière-Rousse, orcid.org/0000-0002-9345-5682