- 1Department of Electrical Engineering and Computer Science, Florida Atlantic University, Boca Raton, FL, United States
- 2Harbor Branch Oceanographic Institute, Florida Atlantic University, Fort Pierce, FL, United States
- 3Fisheries and Oceans Canada, Freshwater Institute, Winnipeg, MB, Canada
Aerial images are increasingly adopted and widely used in various research areas. In marine mammal studies, these imagery surveys serve multiple purposes: determining population size, mapping migration routes, and gaining behavioral insights. A single aerial scan using a drone yields a wealth of data, but processing it requires significant human effort. Our research demonstrates that deep learning models can significantly reduce human effort. They are not only able to detect marine mammals but also track their behavior using continuous aerial (video) footage. By distinguishing between different age classes, these algorithms can inform studies on population biology, ontogeny, and adult-calf relationships. To detect beluga whales from imagery footage, we trained the YOLOv7 model on a proprietary dataset of aerial footage of beluga whales. The deep learning model achieved impressive results with the following precision and recall scores: beluga adult = 92%—92%, beluga calf = 94%—89%. To track the detected beluga whales, we implemented the deep Simple Online and Realtime Tracking (SORT) algorithm. Unfortunately, the performance of the deep SORT algorithm was disappointing, with Multiple Object Tracking Accuracy (MOTA) scores ranging from 27% to 48%. An analysis revealed that the low tracking accuracy resulted from identity switching; that is, an identical beluga whale was given two IDs in two different frames. To overcome the problem of identity switching, a new post-processing algorithm was implemented, significantly improving MOTA to approximately 70%. The main contribution of this research is providing a system that accurately detects and tracks features of beluga whales, both adults and calves, from aerial footage. Additionally, this system can be customized to identify and analyze other marine mammal species by fine-tuning the model with annotated data.
1 Introduction
Behavioral research on cetaceans is challenging. Such research is especially challenging on polar species. Their remote location, the hostile environmental conditions and the financial costs involved severely limit scientific access to wild populations. Field studies of behavior (such as social behavior and feeding habits) on Arctic whales has also been limited by technology and poor visibility. Most behavioral research to date has relied on photo-identification of whale dorsal fins and exposed backs taken at oblique angles from land or boats. This captures a small fraction of the behavior and a small fraction of the animals, severely limiting scientific insight. All these challenges pertain particularly to research on beluga whales, especially populations in the High Arctic where there are few locations where beluga whales are consistently present in clear waters in summer. In this study we tackled each of these challenges.
The use of technology for monitoring marine species, particularly cetaceans, has become an increasingly valuable tool in conservation and ecological research. For instance, the use of unmanned systems offers a non-invasive method for observing animal behavior, movement patterns, and habitat use, thus providing significant advantages for conservation efforts. Durban et al. Durban et al. (2015) utilized a compact unmanned hexacopter (APH-22) to photograph killer whales (Orcinus orca). Over the course of 60 flights, they captured 18,920 images, which enabled precise measurement and identification of individual whales based on unique natural markings. This method demonstrated the effectiveness of automated imaging for non-intrusive, large-scale monitoring of whale populations. Similarly, in a study on beluga whales (Delphinapterus leucas), researchers used automated imagery to create a photographic identification catalog based on unique markings (Ryan et al., 2022). Their analysis identified 93 individuals, contributing valuable data for understanding beluga populations and the threats they face.
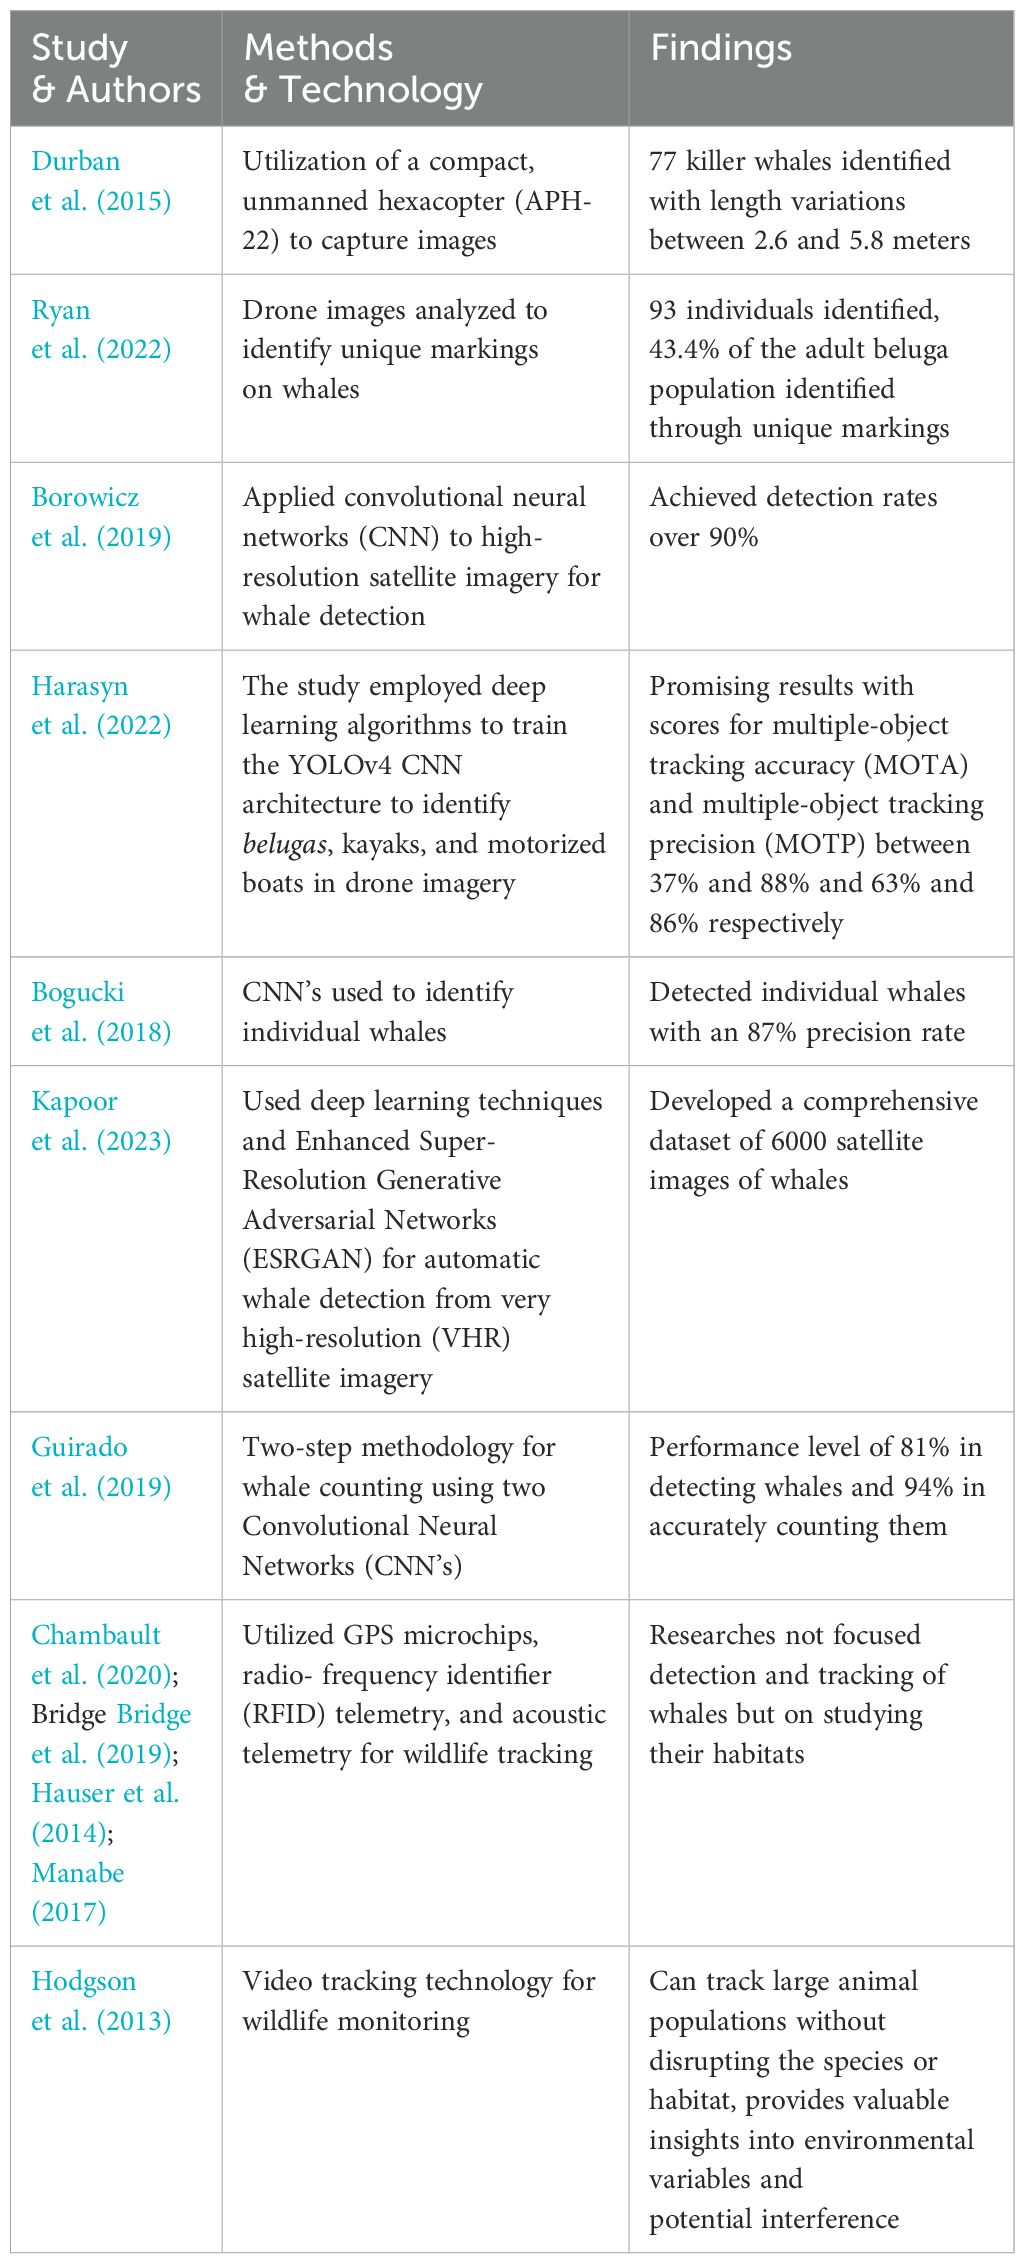
The technology of using drones to detect and tracking marine animals enables detailed studies of animals in their natural environments with minimal human interference, contributing to the broader goal of wildlife monitoring and protection, as illustrated in Table 1. We launched an expedition in summer 2022 to the High Arctic and set up a field camp close to one of the few locations where beluga whales concentrate in clear water and conducted continuous observations over three weeks. Such extended field camps are rare at such latitudes. Ours was one of the first for over 20 years. We used new technology, unmanned aerial vehicles (UAVs) or drones, to capture detailed beluga whale behaviors from a novel angle. The clear waters combined with the drone data provided unprecedented views of how these whales interact with each other and respond to changes in their environment.
Advancements in computer vision and deep learning have further enhanced the capabilities of remote monitoring technologies, allowing us to efficiently process huge amount of data collected by drones. Object detection, a fundamental task of computer vision, plays a critical role for this task. However, it poses challenges in beluga whale detection and tracking due to variations in scale, appearance, occlusion, and cluttered backgrounds. Traditionally, object detection methods comprised three main steps: 1) searching for Regions of Interest (RoI), 2) extracting discriminative features, and 3) classifying objects, relying heavily on feature descriptors (Ballard, 1981). Despite significant resource allocation, improvements in traditional methods became less pronounced over time, highlighting their limitations. In contrast, deep learning methods, particularly those employing Convolutional Neural Networks (CNNs), have made remarkable progress by enabling models to learn hierarchical feature representations from raw image data (Girshick et al., 2014). CNNs have significantly improved the performance of computer vision tasks such as classification and localization, becoming essential tools in modern wildlife monitoring and other domains like healthcare (Jan et al., 2024; Alsaidi et al., 2023; Lin et al., 2017).
To overcome the limitations of manual analysis of image data, researchers have begun to employ automated techniques for detecting marine fauna in aerial and satellite imagery. Borowicz et al. (2019) used a CNN to detect whales in high-resolution satellite imagery, achieving a detection accuracy exceeding 90%. Similarly, another study applied the YOLOv4 CNN architecture to detect belugas, kayaks, and motorized boats in oblique imagery (Harasyn et al., 2022). In that research, DeepSORT was used as a tracking algorithm, yielding promising results for multiple-object tracking accuracy (MOTA) and multiple-object tracking precision (MOTP), with scores ranging from 37% to 88% and 63% to 86%, respectively. The major limitation encountered was the brief visibility of belugas at the water’s surface, which restricted the frames available for accurate tracking.
Other deep learning applications for whale detection have shown promising results as well. For instance, Bogucki et al. (2018) organized a crowdsourcing competition on Kaggle to automate the detection of North Atlantic Right whales (Eubalaena glacialis), achieving 87% precision using CNNs. In another study, deep learning was used to automatically detect whales in very high-resolution (VHR) satellite imagery. This research introduced Enhanced Super-Resolution Generative Adversarial Networks (ESRGAN) to improve image quality while maintaining texture, resulting in a dataset of 6,000 satellite images containing whales (Kapoor et al., 2023). Guirado et al. Guirado et al. (2019) also developed a two-step method for whale counting, using CNN models to first detect whales in images and then quantify the number of whales within each detected image. This approach improved precision by 36% compared to standalone detection models.
Our study aims to integrate aerial, non-intrusive video with autonomous detection and tracking for monitoring beluga whales. Specifically, our system: a) employs a modular design integrating advanced object detection and tracking techniques, b) processes video streams in real-time, and c) offers a scalable, non-invasive platform for monitoring beluga whales in their natural habitat.
In the remainder of this paper, Section 2 discusses the materials and methods, including the dataset and the data annotation method used in this research. This is followed by the presentation of the beluga whale detection and tracking algorithms, the post-processing procedure, and issues related to model training and evaluations. Section 3, Results and Discussions, presents both the beluga whale detection and tracking results using the aforementioned dataset of the proposed method, along with comparisons with some state-of-the-art detection and related tracking methods in the literature. The paper concludes with remarks addressing the ecological and conservation implications of this research, the advantages and limitations of the proposed approach, and future work.
2 Materials and methods
2.1 Study area
Aerial drone footage was collected of beluga whales in Creswell Bay in the Qikiqtaaluk Region, Nunavut in Canada’s High Arctic (Figure 1) in the summer of 2022 as part of a study conducted in partnership with indigenous communities on the population status and behavioral responses of whales to a changing Arctic.
2.2 Data acquisition
In this study, we used newly acquired data that had not been introduced in the research community before. The behavior of beluga whales in the wild was observed and recorded via videography using small unmanned aerial vehicles (UAVs). DJI® quadcopters (Phantom 4, and Mavik 2 models) with gimbaled cameras recorded UHD 4K video of whales performing social behavior though this study is focused on tracking only. With special permits (OPA-ACC-2022-NU and AUP) from Fisheries and Oceans Canada, under the Animal Use Protocol, our UAVs were allowed to fly 20 meters above sea level, which is significantly lower than the normally permitted 300 meters.
Water visibility typically ranged from 5m to 12m, sometimes greater, and often reached the seafloor when whales were in shallow waters. This facilitated the collection of high-resolution videos of whale behaviors both above and right below the water surface, allowing for the collection of entire behavior sequences, where whales were under continuous observation, for periods of up to 25 minutes. It should be noted that viewing beluga whales in the wild for extended periods in clear water conditions is unusual, as they typically inhabit turbid waters with poor visibility during summer months or ice-strewn waters at other times of the year (Torres et al., 2018).
2.3 Data annotation
Data annotation is a crucial initial step in the development of deep learning pipelines. The data utilized for this study was extracted from the acquired drone footage videos, with frames extracted at a rate of one frame every three seconds. A total of 400 images were carefully chosen for annotation corresponding to the variety of scenes captured by the drone. The selection process aimed to accommodate various factors such as the drone’s altitude, the color and depth of seawater, and beluga whales’ closeness to the shore and to each other. The selection of distinctive scenes for annotation greatly contributes to the model’s ability to accurately localize beluga whales present under different conditions.
Annotating data for the localization task requires enclosing beluga whales present in the image with bounding boxes and assigning appropriate labels to each individual whale. This diligent process can be tedious and prone to error. To aid with the annotation process, we utilized Roboflow (Roboflow, 2024), a comprehensive data annotation solution. Figure 2 shows a sample of an original image and the annotated image with bounding boxes. Roboflow further assists in the generation and splitting of the dataset. Additionally, augmentation techniques were applied to the data to further diversify our dataset. Multiple augmentation techniques were used, such as random translations and image scaling with factors of up to 0.2 and 0.9, respectively. We also applied random rotations up to 90 degrees, horizontal flipping with a probability of 0.5, mosaic augmentation (Bochkovskiy et al., 2020), mixup augmentation (Zhang et al., 2017) with a probability of 0.15, and HSV augmentation with 0.015, 0.7, and 0.4 maximum variations for hue, saturation, and value, respectively.
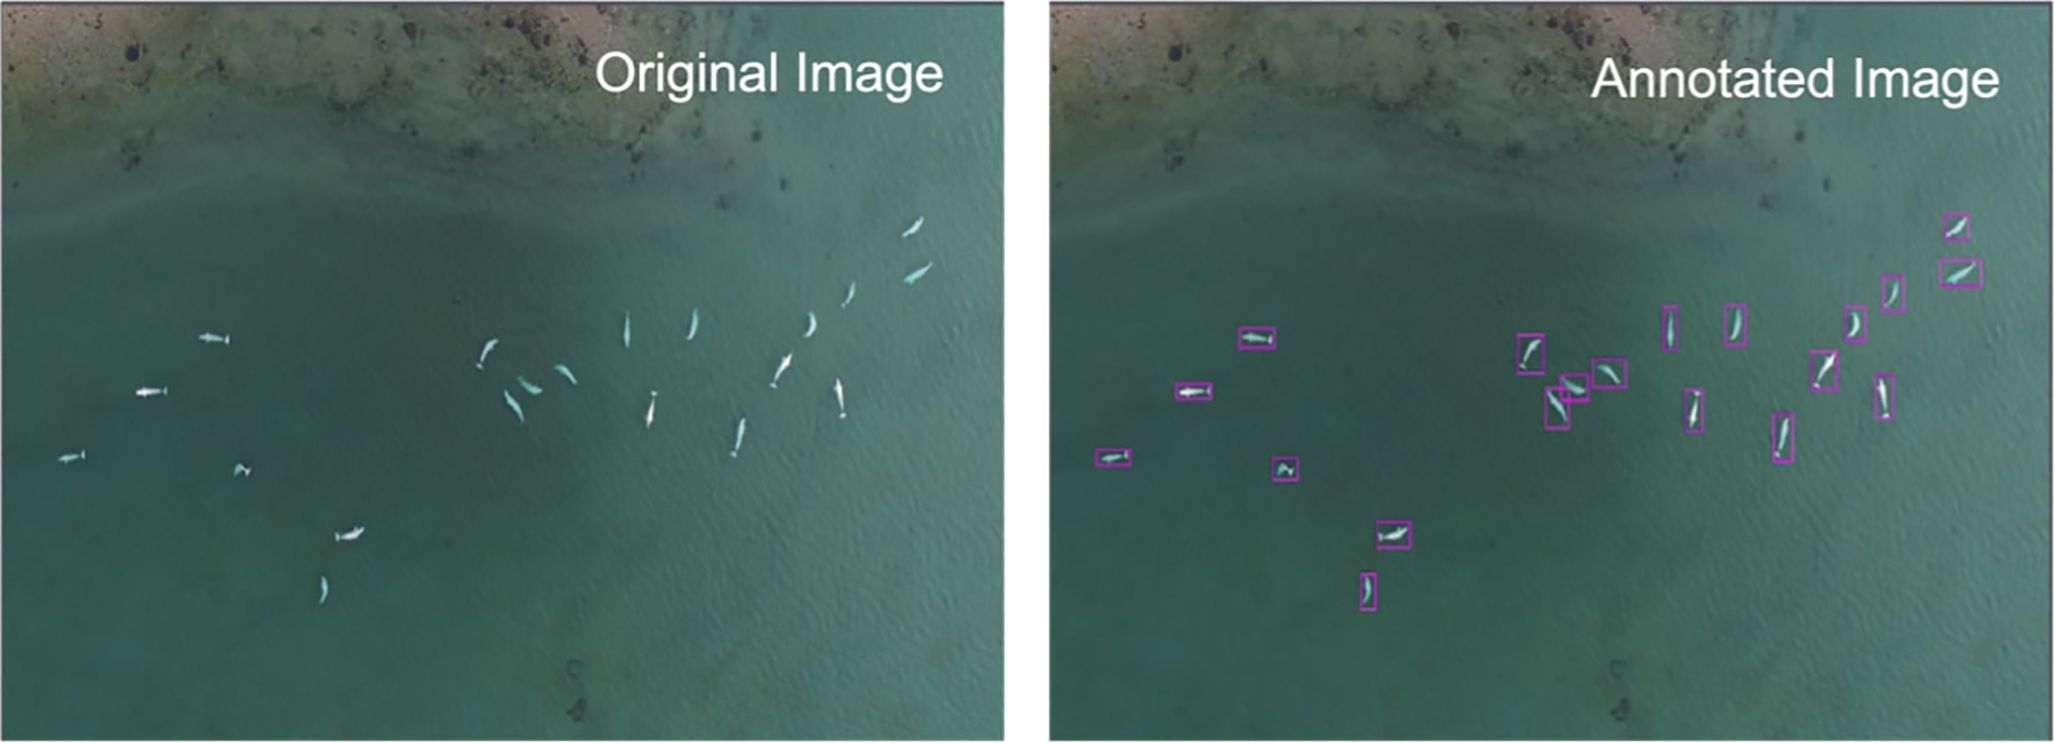
Figure 2. An example of data annotation: original image (left) and annotated image with bounding boxes (right).
To reduce the computational cost associated with data annotation and model training, image resolution was adjusted from the original 4K resolution to a downsized resolution of 1080x1080. Images with a resolution lower than 1080x1080 presented difficulties in accurate annotation as the defining features of the beluga whale became less prominent. This was especially true with beluga calves that were increasingly difficult to identify in videos with low resolutions.
For the task of tracking beluga whales in the drone footage, a different approach was adopted utilizing nutsh.ai (Xu and Yu, 2023), an advanced tool specifically designed for video annotation for tracking tasks, as well as other vision tasks. This platform specializes in temporal data annotation, a key aspect for effectively tracking objects across video frames. In this phase, nutsh.ai was employed to annotate sequences rather than individual frames, enabling the identification and continuous tracking of individual beluga whales over time.
The process involved annotating the trajectory of each beluga whale across consecutive frames, ensuring a consistent identification of each individual throughout the sequence. This was particularly challenging given the dynamic nature of the underwater environment and the movement of the whales. The nutsh.ai platform’s features like interpolation of bounding boxes and automatic tracking algorithms greatly facilitated this task. These features significantly reduced the workload and aided in improving the consistency of the annotations.
The tracking data generated from nutsh.ai provided invaluable insights for the development of the deep learning model. This model not only needed to accurately detect the presence of beluga whales in a single frame (as handled by Roboflow) but also required the capability to track their movement time by assigning each annotated object with an ID. The combination of these two annotation approaches – spatial localization with Roboflow and temporal tracking with nutsh.ai – offered a comprehensive dataset, crucial for the development of an effective and robust deep learning pipeline for monitoring and studying beluga whale behavior using drone footage.
Figure 3 shows a screen view of our tracking annotation setup using nutsh.ai. This is one of the videos that was annotated and it contains four unique objects that were tracked through the sequence. The highlighted boxes on the right margin contain the annotation information added and tracked. It is important to highlight the preservation of the Object ID value across different frames which is essential for tracking tasks.

Figure 3. nutsh.ai annotation platform: tracking annotation showing four object IDs with respective information.
2.4 Beluga whale detection and tracking algorithms
This section presents the model employed in our study for beluga whale detection and tracking. Our primary objective was to develop a comprehensive system for localizing and tracking beluga whales in UAV footage. Our solution needed real-time performance and the ability to process high-resolution footage with minimal latency while posing no negative effect on the accuracy of the model. Additionally, this should be done with a small overhead in computation and with the adaptability of retraining and expanding the model’s knowledge. To that extent, we set our eyes on YOLO models coupled with the SORT algorithm for tracking.
YOLO, which stands for You Only Look Once, is a well-developed and highly efficient object detection framework. Over the years, many researchers and practitioners have participated in the development and enhancement of YOLO. Unlike prior work, YOLO frames object detection as a regression problem to spatially separated bounding boxes and class probabilities in one evaluation. This unified architecture enables real-time performance which is crucial for our UAV-based system. In this study, we employed YOLOv7 (Wang et al., 2023), a version that was released in July 2022, the most recent version at the time of this study.
For tracking, we integrated the SORT algorithm (Bewley et al., 2016) with YOLO. The SORT algorithm is a popular tracking algorithm that extends our system’s abilities to track objects in real time with little overhead in computation. SORT operates on bounding boxes provided by the object detection model. It operates by assigning unique IDs to individual objects to track them over consecutive frames and estimates their positions and velocities using a Kalman filter (Kalman, 1960).
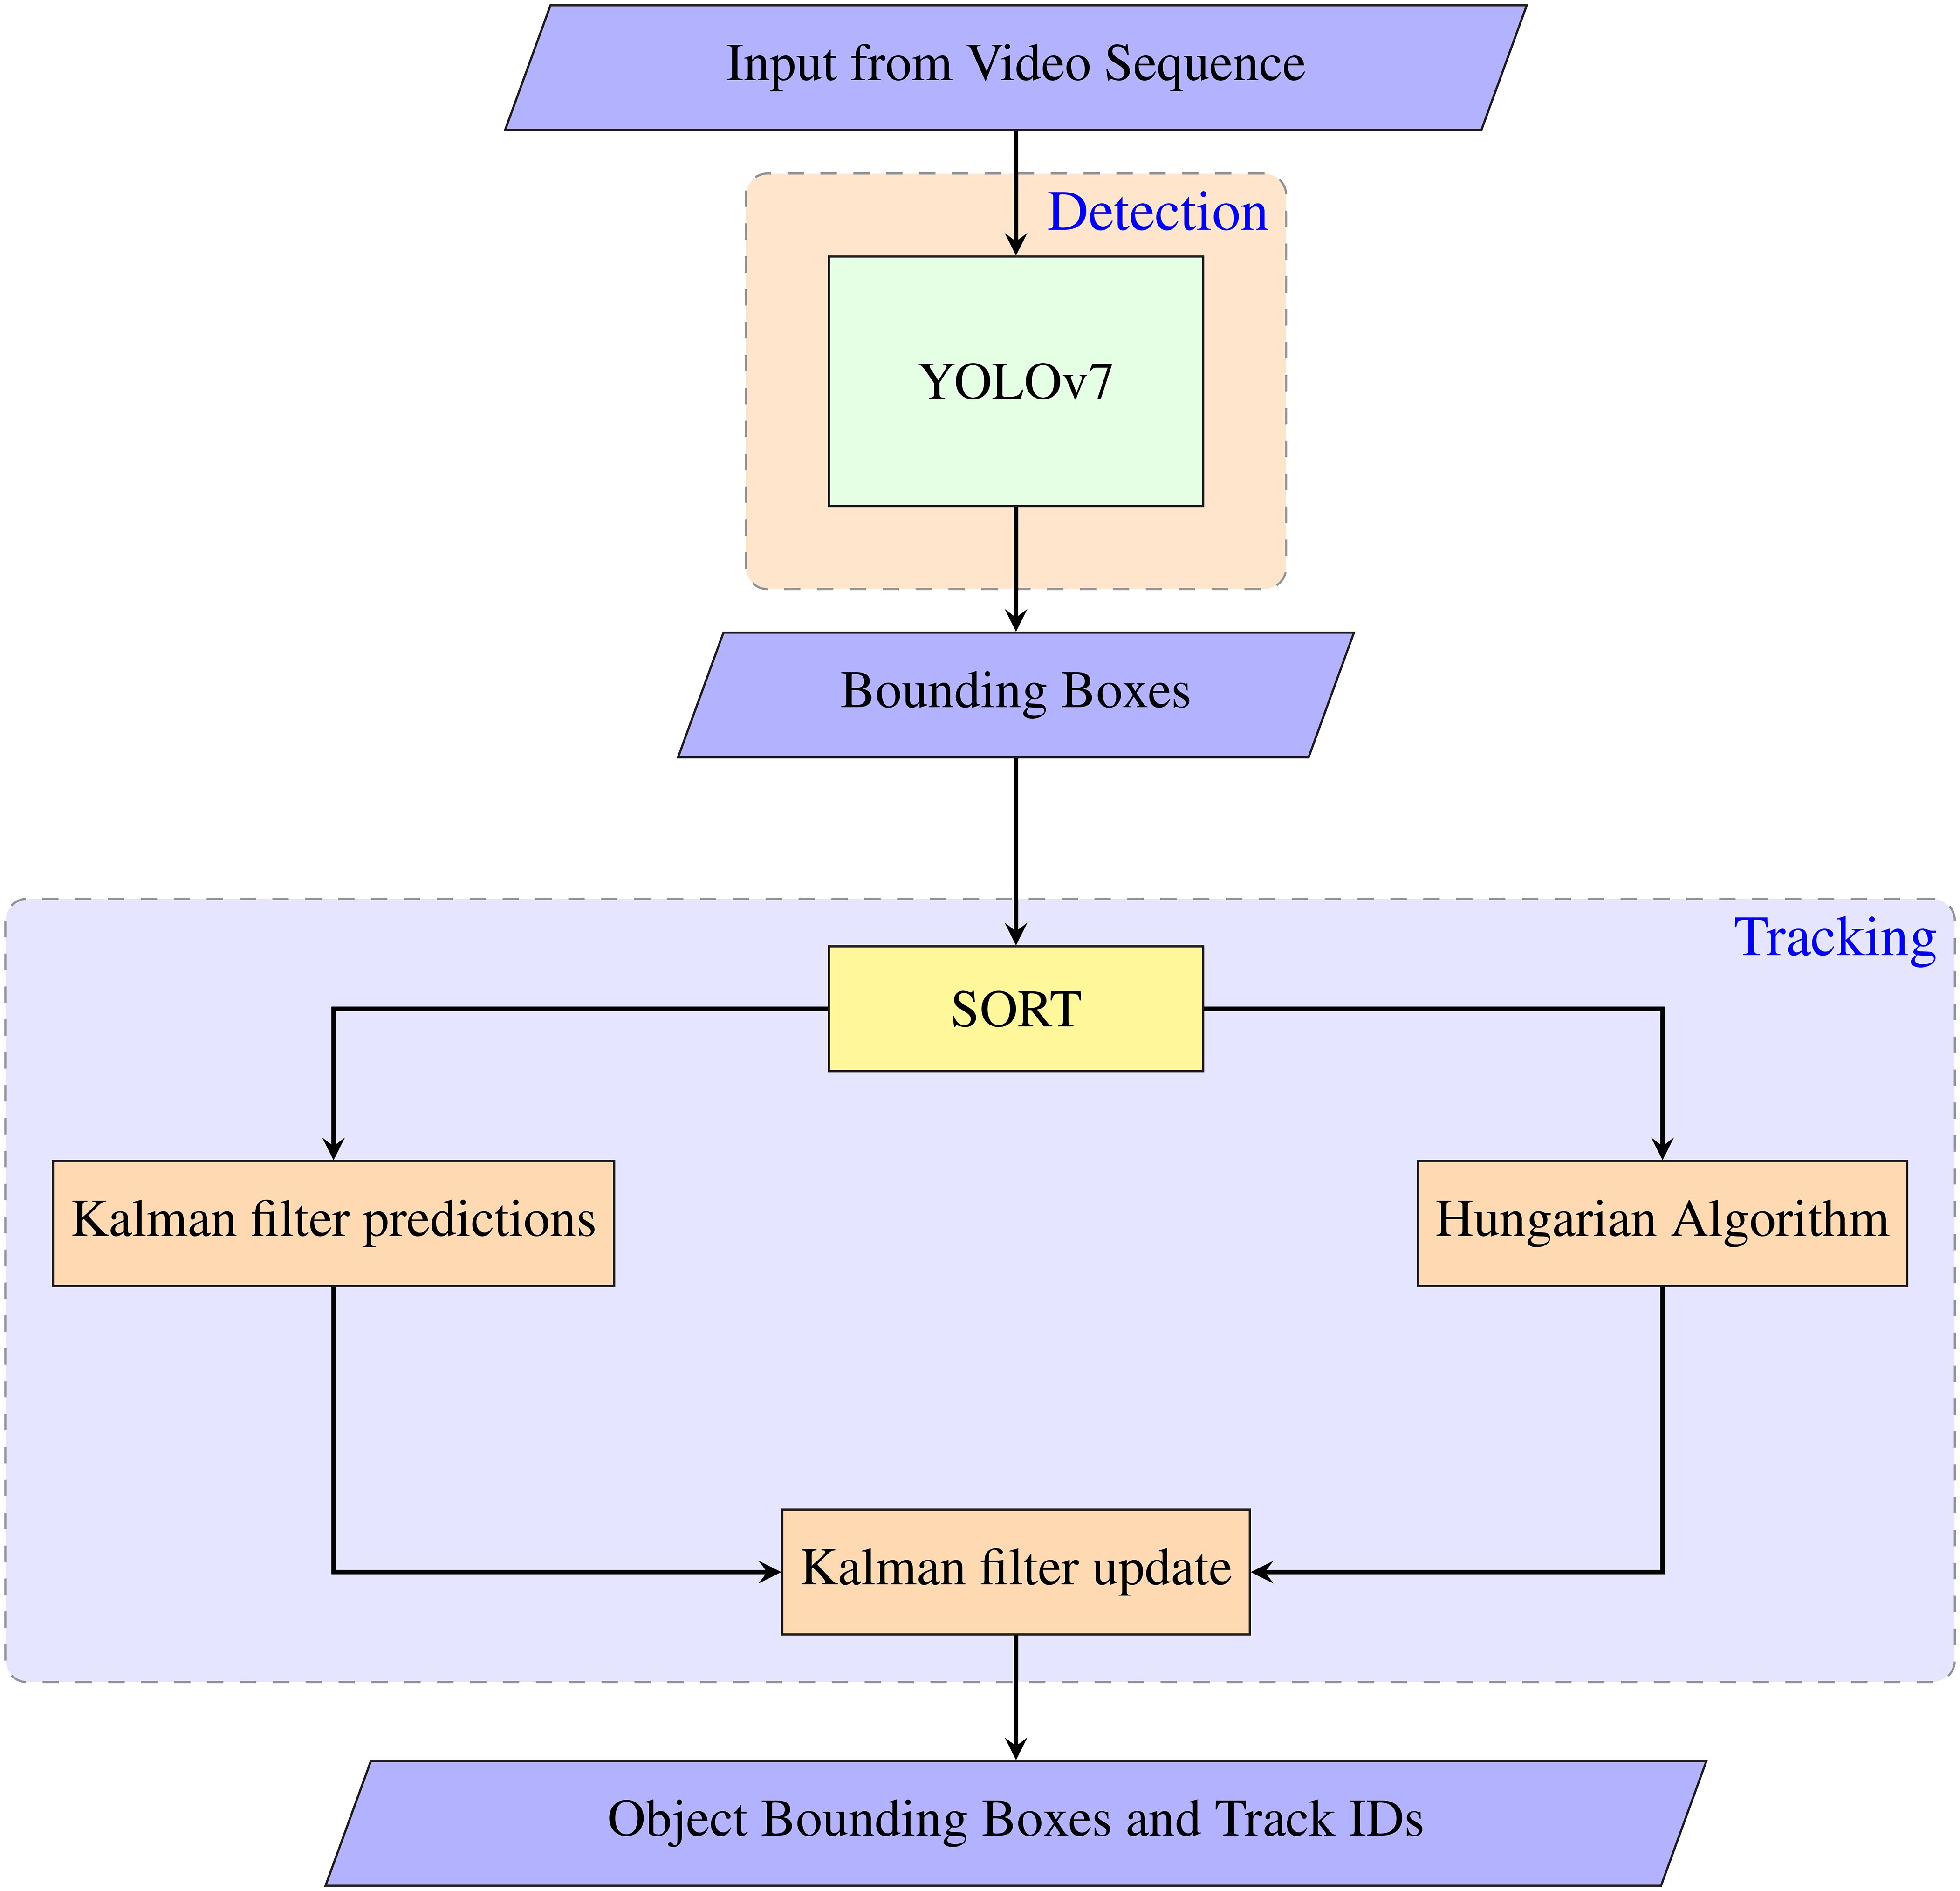
Our system is the fusion of these algorithms together. First, YOLO provides detections at a frame level which serves as an input to the SORT algorithm for multi-object tracking. SORT matches detections to existing tracks based on intersection-over-union (IOU) between bounding boxes. New tracks are initialized for unmatched detections, while tracks that cannot be matched for a certain number of consecutive frames are terminated. Our system thereby achieves simultaneous object detection and tracking for beluga whales. Figure 4 shows the operation of our system at a high level. The input is sent to YOLOv7 for detection and the detected bounding boxes are passed into the SORT algorithm for tracking. Kalman filter predicts the trajectory of each target. The outputs of the Kalman filter and YOLO’s bounding boxes are evaluated by the Hungarian algorithm which optimizes the assignment of detected objects to predicted trajectories. This step is crucial for maintaining consistent tracking across frames.
By combining YOLO’s efficient object detection with the robust tracking capabilities of SORT, our system achieves real-time and accurate localization and tracking of beluga whales in UAV footage. The integration of these algorithms allows for efficient computation with low overhead, enabling the system to handle large-scale datasets and adapt to varying tracking scenarios. Moreover, the modular nature of the system enables easy retraining and expansion of the model’s knowledge, making it a flexible solution for future improvements and applications in object detection and tracking.
2.5 Post-processing algorithm
As effective as SORT is, we recognized an opportunity to improve the tracking performance using a simple yet effective post-processing technique. Object identity switch is an important factor that negatively contributes to the accuracy of multi-object tracking, which is the metric under which a tracking algorithm is judged. Upon evaluating our system performance we noticed a large discrepancy of the object id between our ground truth data and the system output. Due to the nature of our dataset, a whale diving into the water or re-entering a frame was given a new object id, leading to an increase in the id switch counter. This was significantly affecting our evaluation metric. A countermeasure for handling this issue is to implement a post-processing technique. The idea behind the algorithm is that if a new object is detected in a new frame, which is very close to a disappeared object in the previous frame, the two objects are most likely identical. The algorithm based on this idea is provided below (Algorithm 1).
Algorithm 1. Post-processing technique for object identity switch reduction.
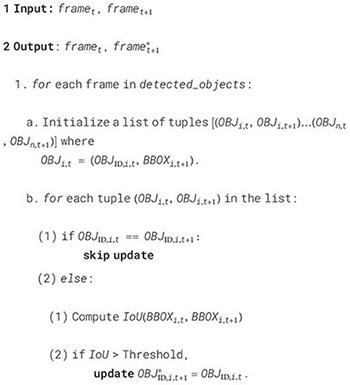
Note that there is a parameter called ‘Threshold’ in Algorithm 1. Its value defines a neighborhood within which a newly detected object will be considered the same as the object that appeared before. The value of Threshold needs to be adjusted through experiments. Due to a high sampling rate of the videos, an identical object would overlap across consecutive frames. The introduced post-processing algorithm evaluates the closeness of an old object to the detected object by computing the intersection over union (IoU) between two objects across consecutive frames. If the computed IoU is higher than a set Threshold, then the detected object is considered to have the same object id with the old one.
2.6 Model training for beluga whale detection
To effectively create a system to detect Beluga whales from the given drone footage, a suitable dataset for this task must be created. To that extent, we leverage the Roboflow framework, which provides a user-friendly interface for data annotation and dataset generation (see section 2.3). The dataset generated using Roboflow was annotated with two classes that are (Adult Beluga Whale, Beluga Calf). After augmenting the annotated images, the dataset had a total of 600 images. Furthermore, the dataset was split into training, validation, and testing data using an 80/10/10 data split, resulting in 480 images for training, 60 images for validating, and 60 images for testing for a fair evaluation.
We utilized transfer learning to finetune the YOLOv7 model on our dataset using the readily available model on GitHub (Wong et al., 2022) and YOLOv7 pre-trained weights. Fine-tuning our model allows us to leverage the knowledge YOLO has acquired from being trained on a large benchmark dataset COCO (Lin et al., 2014b). Furthermore, it reduces our computation cost as the model does not require to be trained for hundreds of epochs.
For our input, we used the annotated dataset generated, and images were kept at 1080x1080 resolution. Model hyperparameters were fine-tuned, and we achieved the best performance with (batch size = 16, learning rate = 0.01). Furthermore, we employed the SGD optimizer with a 0.9 momentum.
2.7 Object detection and tracking evaluation metrics
The effectiveness of the trained object detection model was evaluated using the precision, recall, F1-score, and mAP (mean Average Precision) metrics.
● Precision: Measures the percentage of detections that were correct.
● Recall: Measures the percentage of objects that were correctly detected.
● F1-Score: The harmonic mean of precision and recall, providing a balanced evaluation of the model’s performance.
● mAP@0.5: it is the average over all classes of the area under the Precision-Recall curve for an IOU threshold of 0.5 (Everingham et al., 2010; Lin et al., 2014a)
The formulas for calculating the metrics are as follows:
where TP is the number of true positives (correctly identified objects), FP is the number of false positives (misclassified objects), and FN is the number of false negatives (objects that were not detected).
To evaluate the tracking performance of the model, we utilized standard metrics that are commonly reported in multi-object tracking literature. The primary metric we focused on was MOTA (Multiple Object Tracking Accuracy), which indicates the tracking model’s ability to maintain accurate object trajectories. The metric, MOTA, combines identity switches, false positives, and missed detection into a single comprehensive tracking accuracy measure. The formula for calculating MOTA is as follows:
where is the frame index, is the number of ground truth objects in the respective frame, and is the changing of ID value assigned to an object.
3 Results and discussion
3.1 Training and validation results
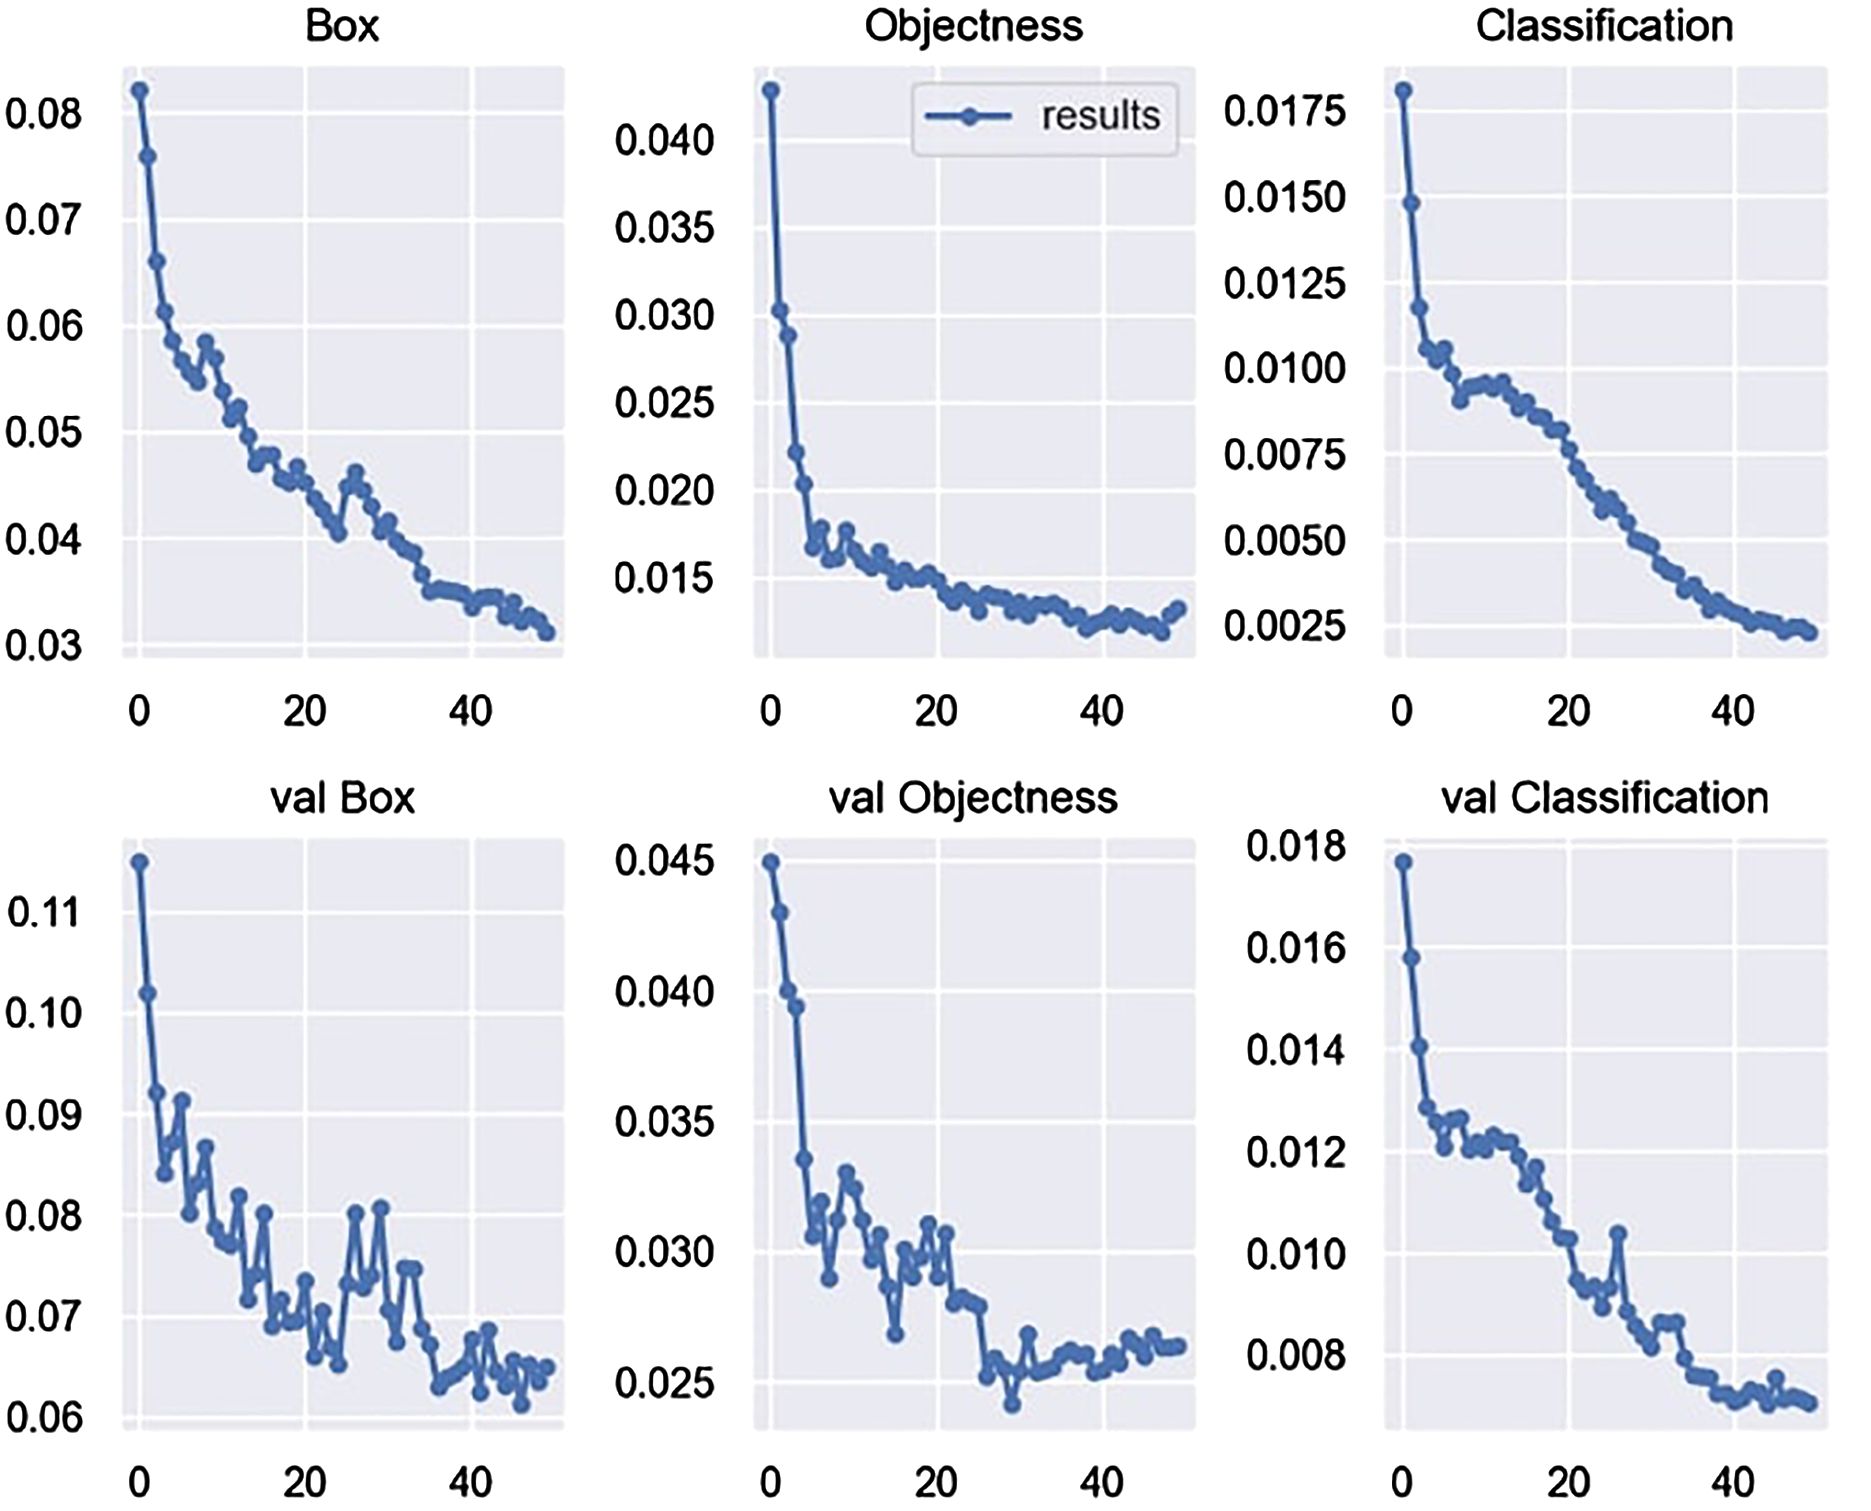
The YOLOv7 model was trained for a total of 50 epochs on our hand-annotated dataset. Figure 5 presents the loss curves from our model training, providing a comprehensive overview of the training and validation performance.
A detailed explanation of Figure 5 is given below:
● The Box plot demonstrates a consistent and significant reduction in the loss associated with bounding box coordinates throughout 50 training epochs, decreasing from an initial value of 0.08 to a final value of 0.03. Similarly, the validation counterpart, val Box, exhibits a notable drop from 0.12 to 0.06, indicating improved localization accuracy on unseen data.
● The Objectness plot displays a consistent decrease in the loss associated with objectness score prediction throughout training, gradually declining from 0.05 to 0.012. Correspondingly, the validation plot, val Objectness, showcases a similar trend, lowering the loss from 0.045 to 0.025.
● The Classification plot exhibits a steady decline in the loss value from 0.0175 to 0.0025, indicating an improved ability of the model to classify objects correctly. The validation counterpart, val Classification, also demonstrates a decrease from 0.018 to 0.0065, confirming the model’s generalization capabilities on unseen data.
A factor we noticed having an influence on the training results was the image input size, which we kept at 1080x1080 resolution. Lower-resolution images negatively impacted model performance due to pixel distortion caused by down-scaling.
3.2 Beluga whale detection testing
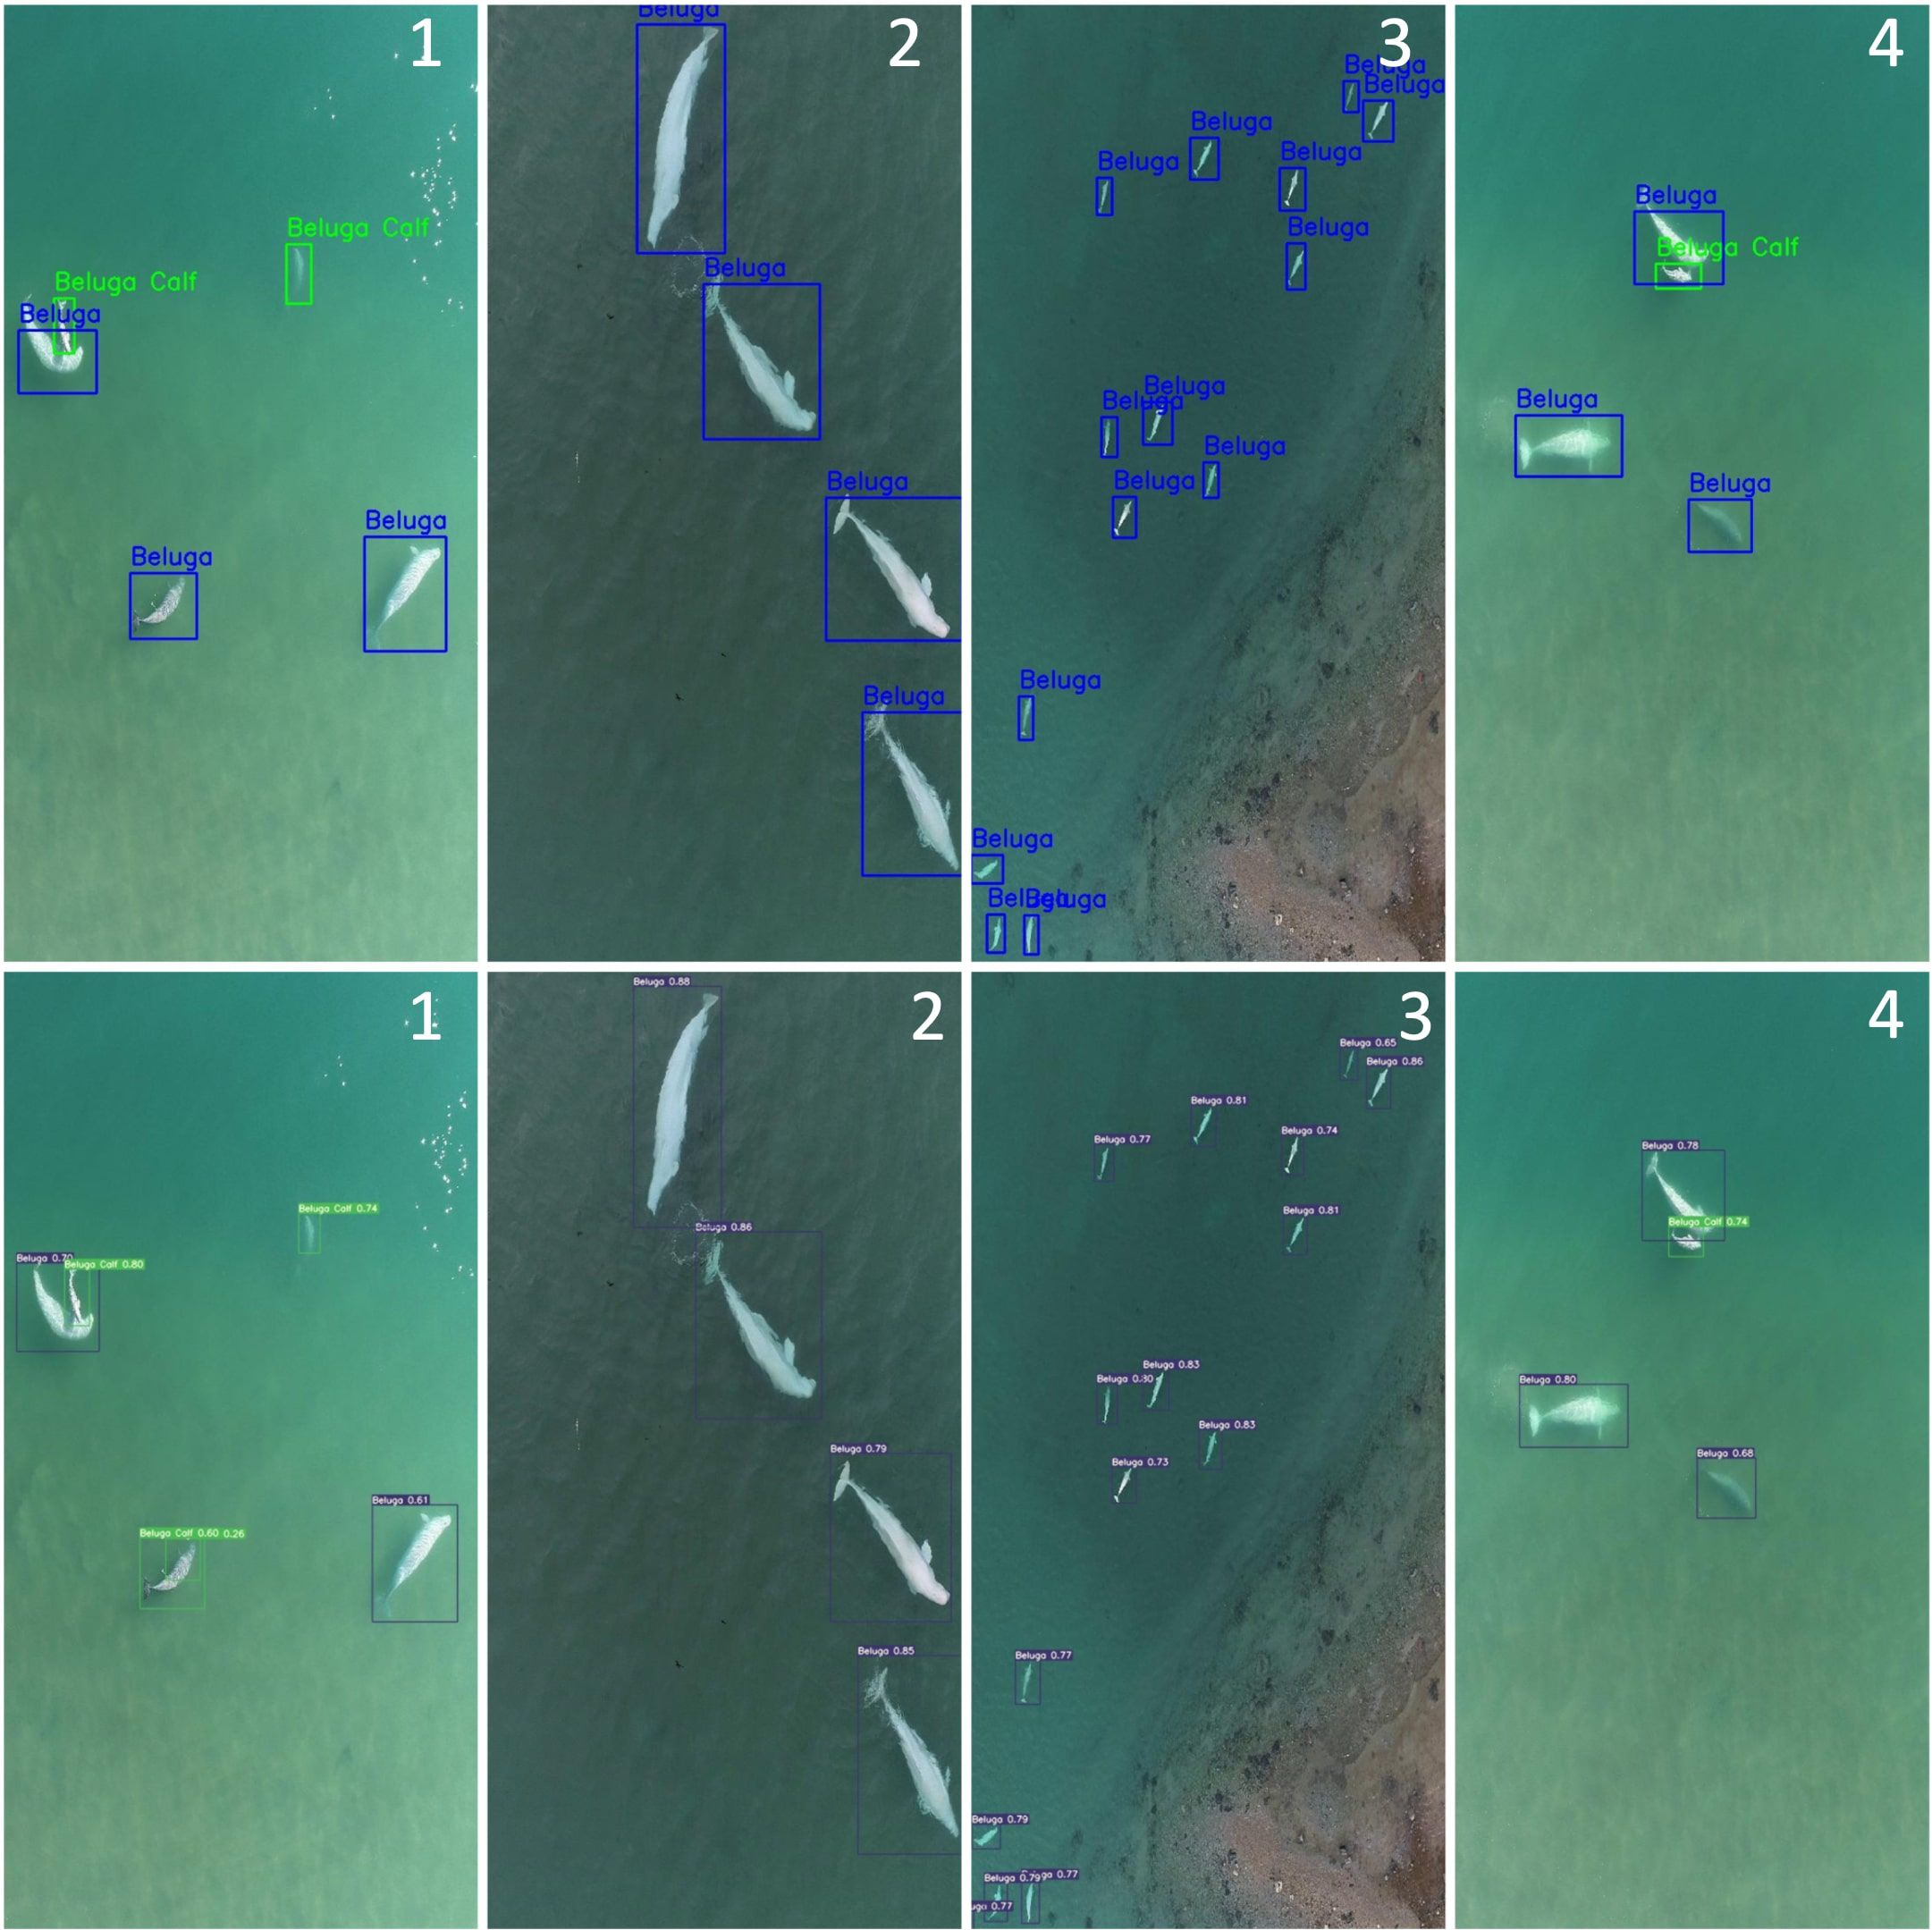
The beluga whale detection testing involved comparing the results of the trained beluga whale detection model with the ground truth data. Ground truth data is the data the authors of this paper annotated using Roboflow. The test dataset comprised 60 images that were selected accordingly to represent the diverse scenes in which beluga adult whales appeared. Additionally, test images also include scenes with Beluga calves swimming close to adult beluga whales. Figure 6 shows only 4 unique images that encapsulate diverse scenes. The top row with images annotated 1-4 represents the ground truth images that were hand-labeled using the RoboFlow platform and the bottom row shows the same images as output from our trained detection model YOLOv7.
Figure 6 shows one miss-classification but almost no failed detection among the test dataset. In Figure 6, the first image shows a miss-classification of a beluga whale that was classified as a beluga calf. Overall our detection model produced near-perfect performance in localizing beluga adult whales and beluga calves. Note that some of the images included calves, including newborn neonate individuals.
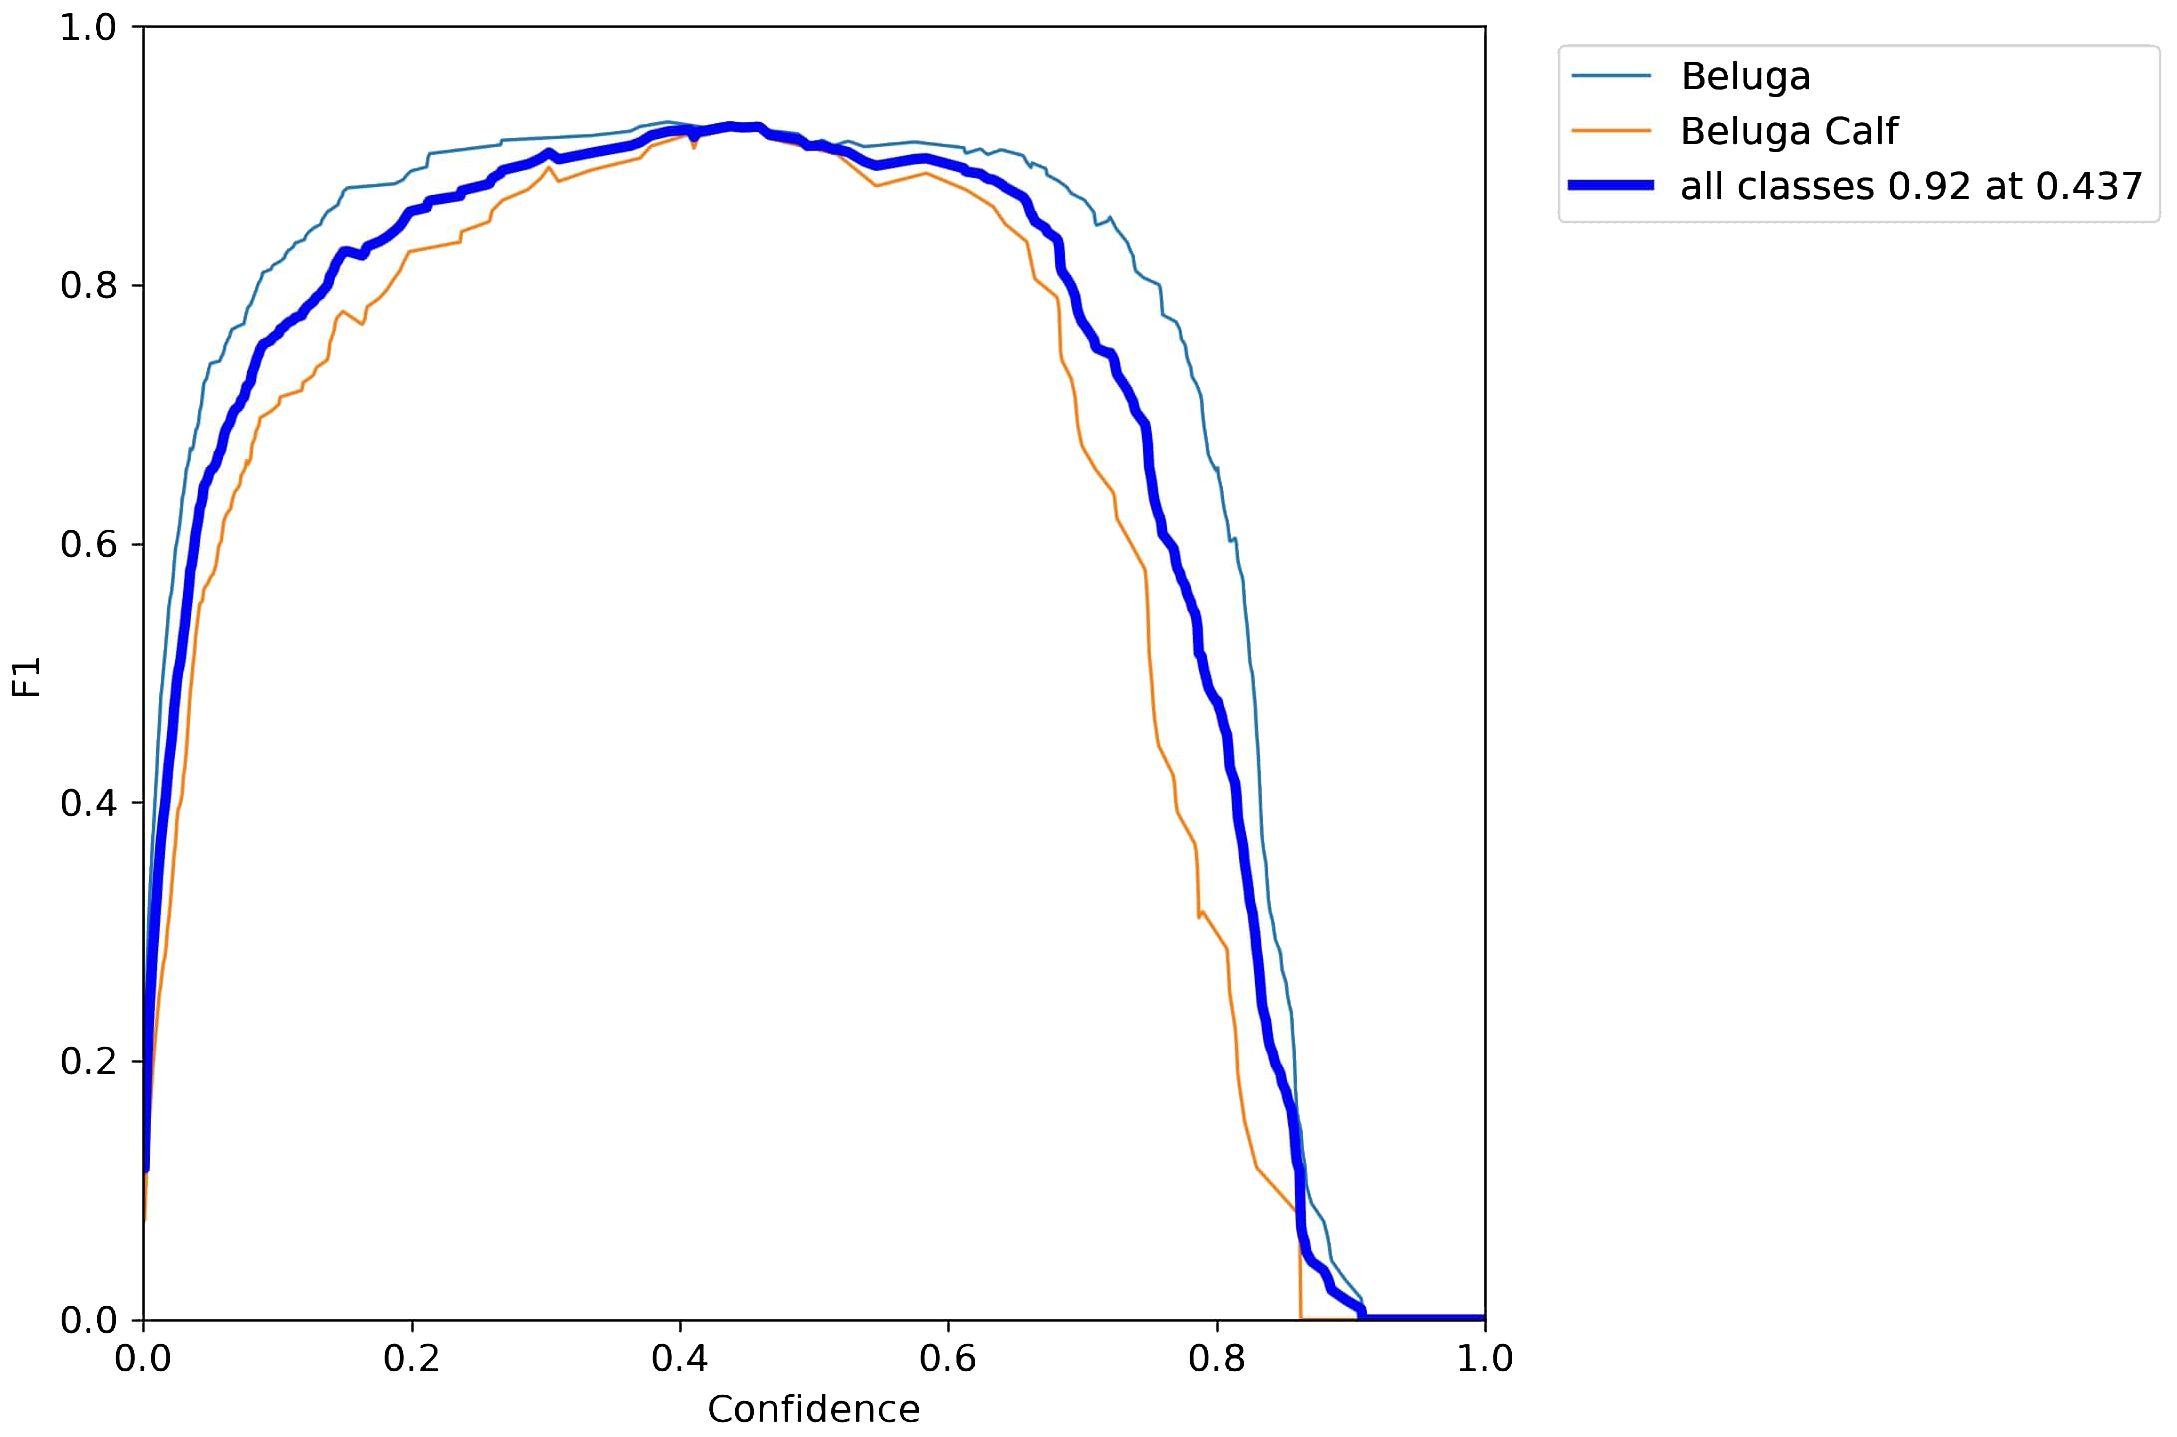
Figure 7 shows the F1-curve that we obtained by running our trained YOLOv7 model on the testing data. The curve shows a 0.92 F1-score at 0.437 confidence for all classes. This visualization encapsulates the model’s performance comprehensively. At a confidence threshold of 0.437, the F1 curve showcases an impressive F1-score of 0.92 across all classes. A more granular representation of the results is presented in Table 2, over our 60 images test set. Some limitations arise due to natural reasons such as occlusion caused by the depth of the whale underwater in some scenes.
In our comprehensive evaluation, detailed metrics underscore the efficacy of our object detection model, as depicted in Table 2. Across all categories, the model exhibited a commendable precision of 93.4% and recall of 91.2%, demonstrating robust and accurate detection and localization of adult beluga whales and beluga calves. Specifically, the detection of ‘Beluga Adult’ whales was highly accurate, with precision and recall rates closely aligned at 92.2% and 92.9%, respectively. This indicates a consistent performance of the model in identifying adult belugas. Performance metrics for ‘Beluga Calf’ detection also proved to be highly accurate, with precision reaching 94.6%, and with a slightly reduced recall of 89.6%, hinting at the nuanced challenges involved in calf detection. The model also achieved approximately 93.4% mAP at a confidence level of 0.5 and approximately 44.2% mAP within the range of 0.5 to 0.95, which we believe represents a state-of-the-art performance.
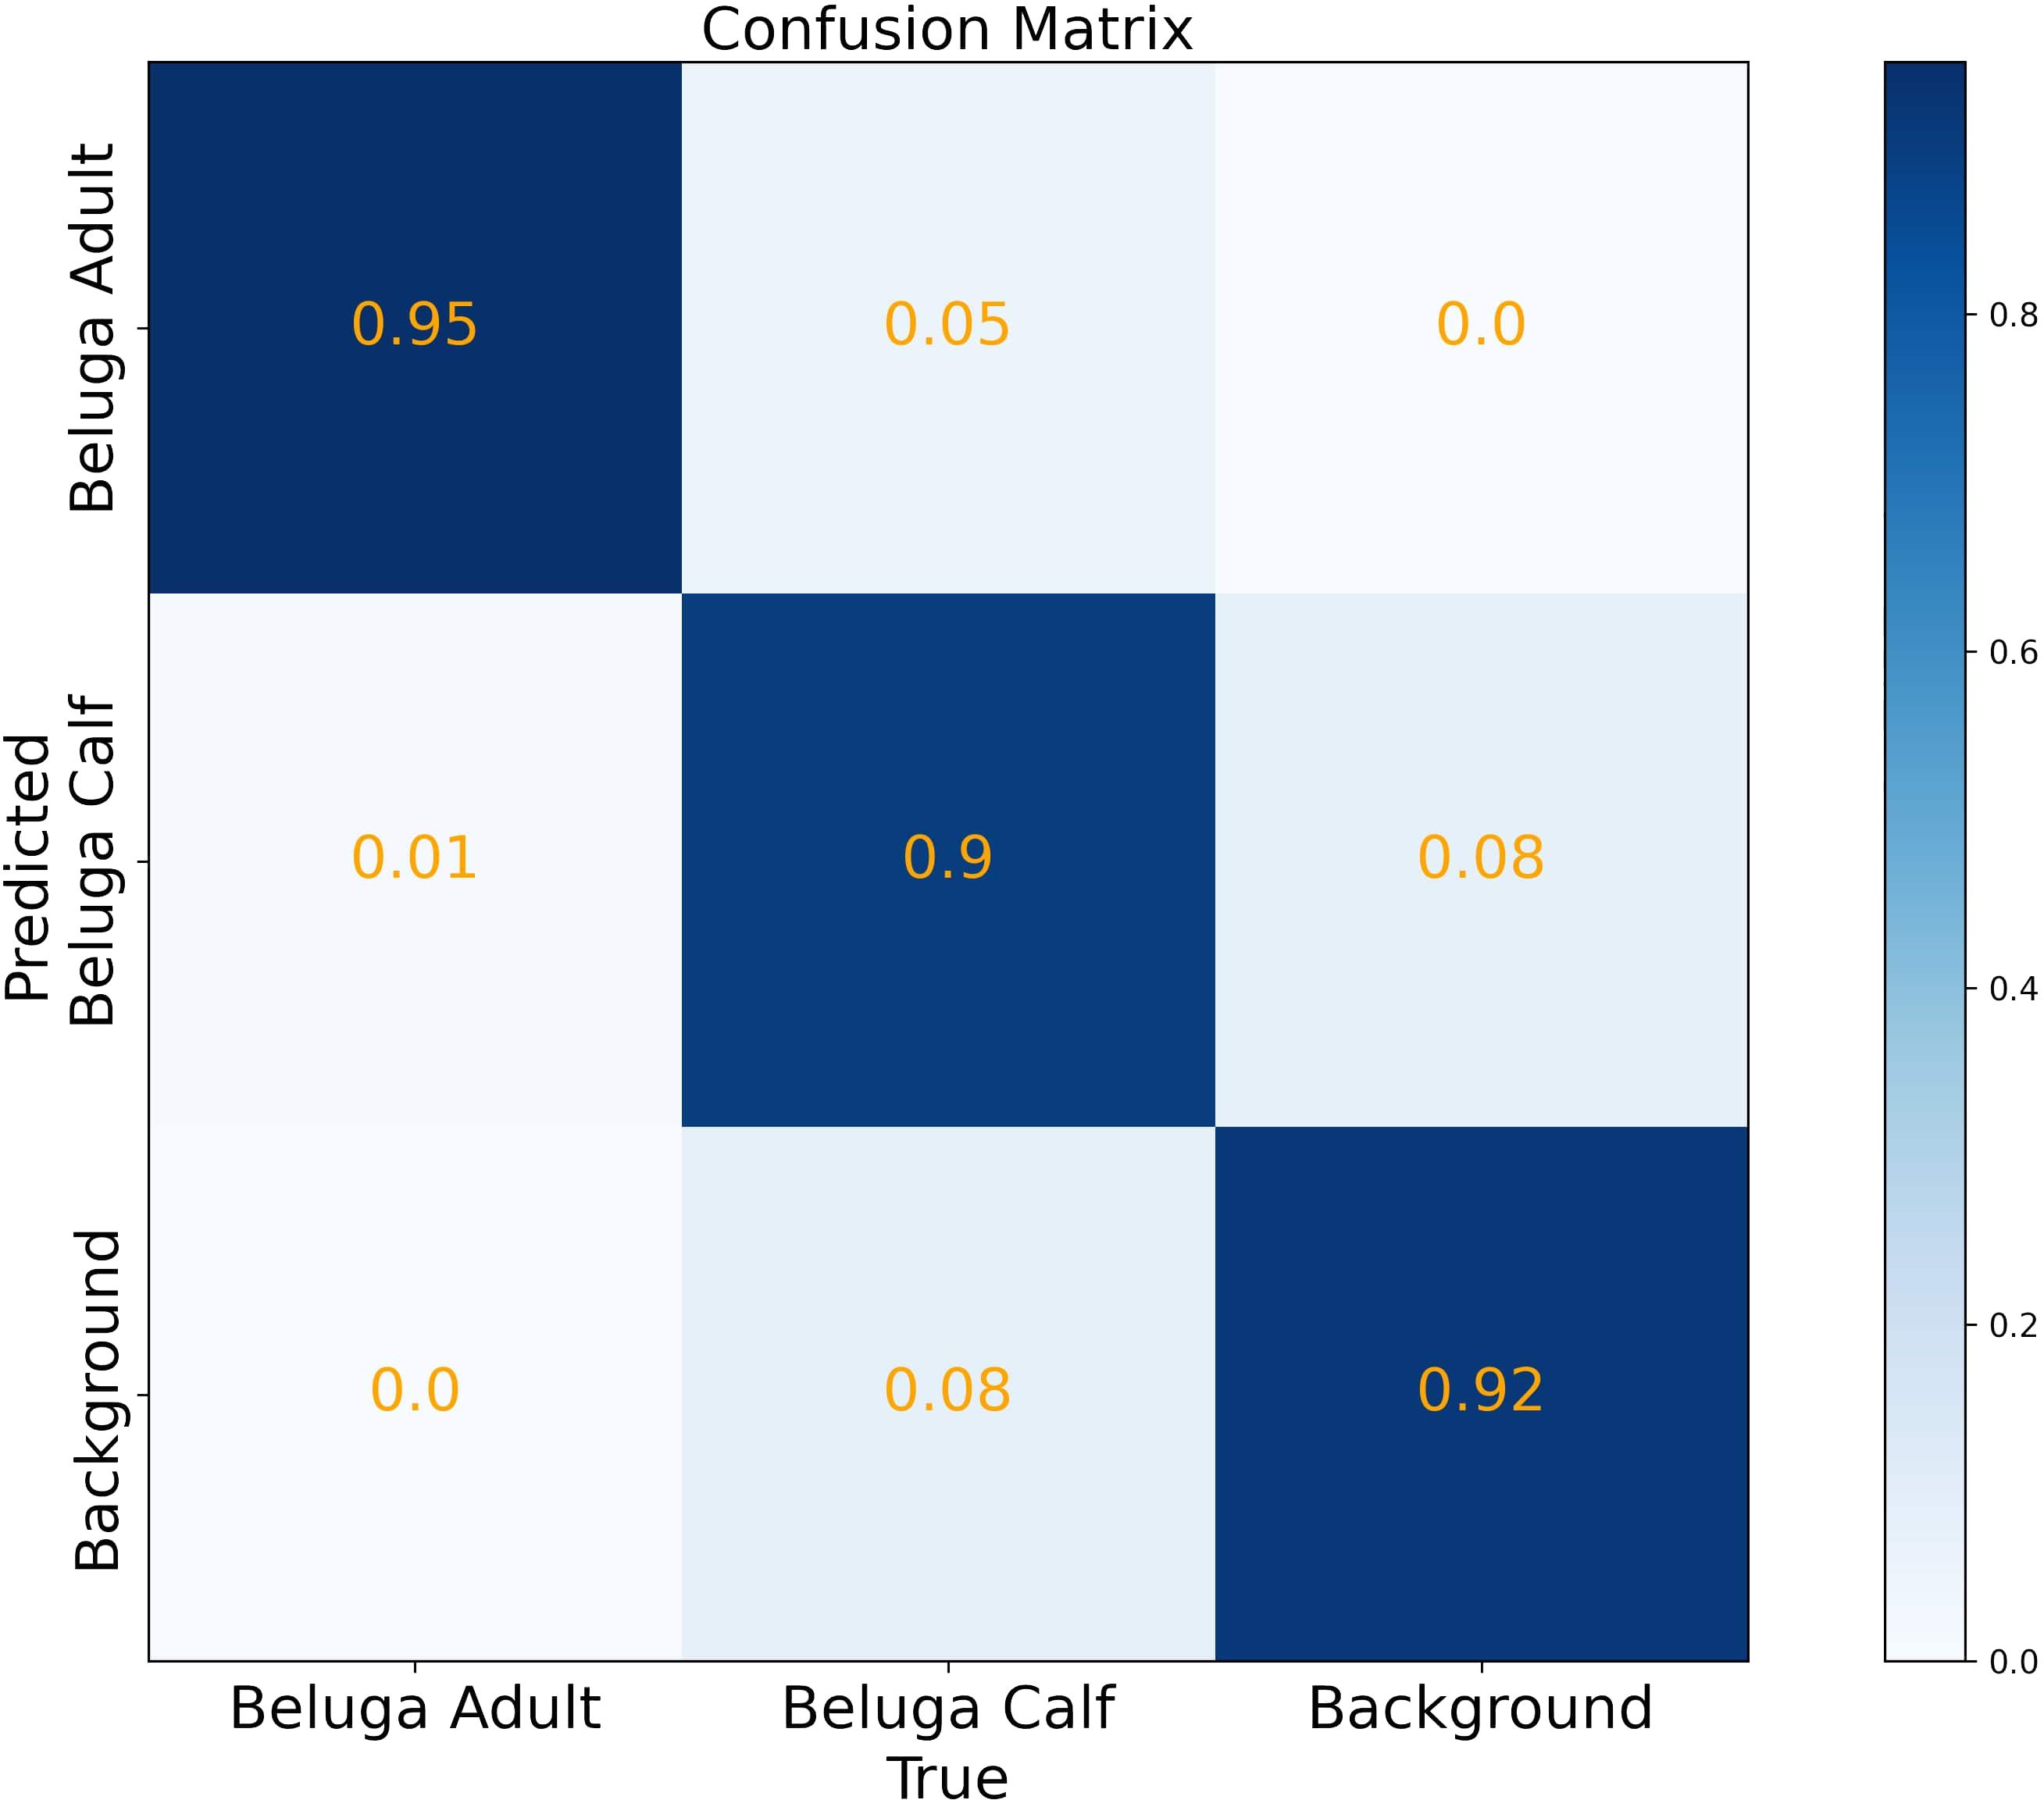
Finally, we present the classification results of the detected objects in the test dataset, as summarized in the confusion matrix (Figure 8). The model demonstrates robust performance, with high precision in distinguishing between ‘Beluga Adult’ and ‘Background’, as evidenced by the high true positive rates of 95% and 92% respectively. The ‘Beluga Calf’ class is also well-identified with a true positive rate of 90%. However, some confusion between the ‘Beluga Calf’ and ‘Background’ classes is observed. Upon investigating the misclassified cases we noticed that due to the water glare over the surface, some glare is detected and classified as a beluga calf. The overall high accuracy across classes indicates that the model is effective for its intended purpose, with specific opportunities for refinement.
3.3 Beluga whale tracking performance
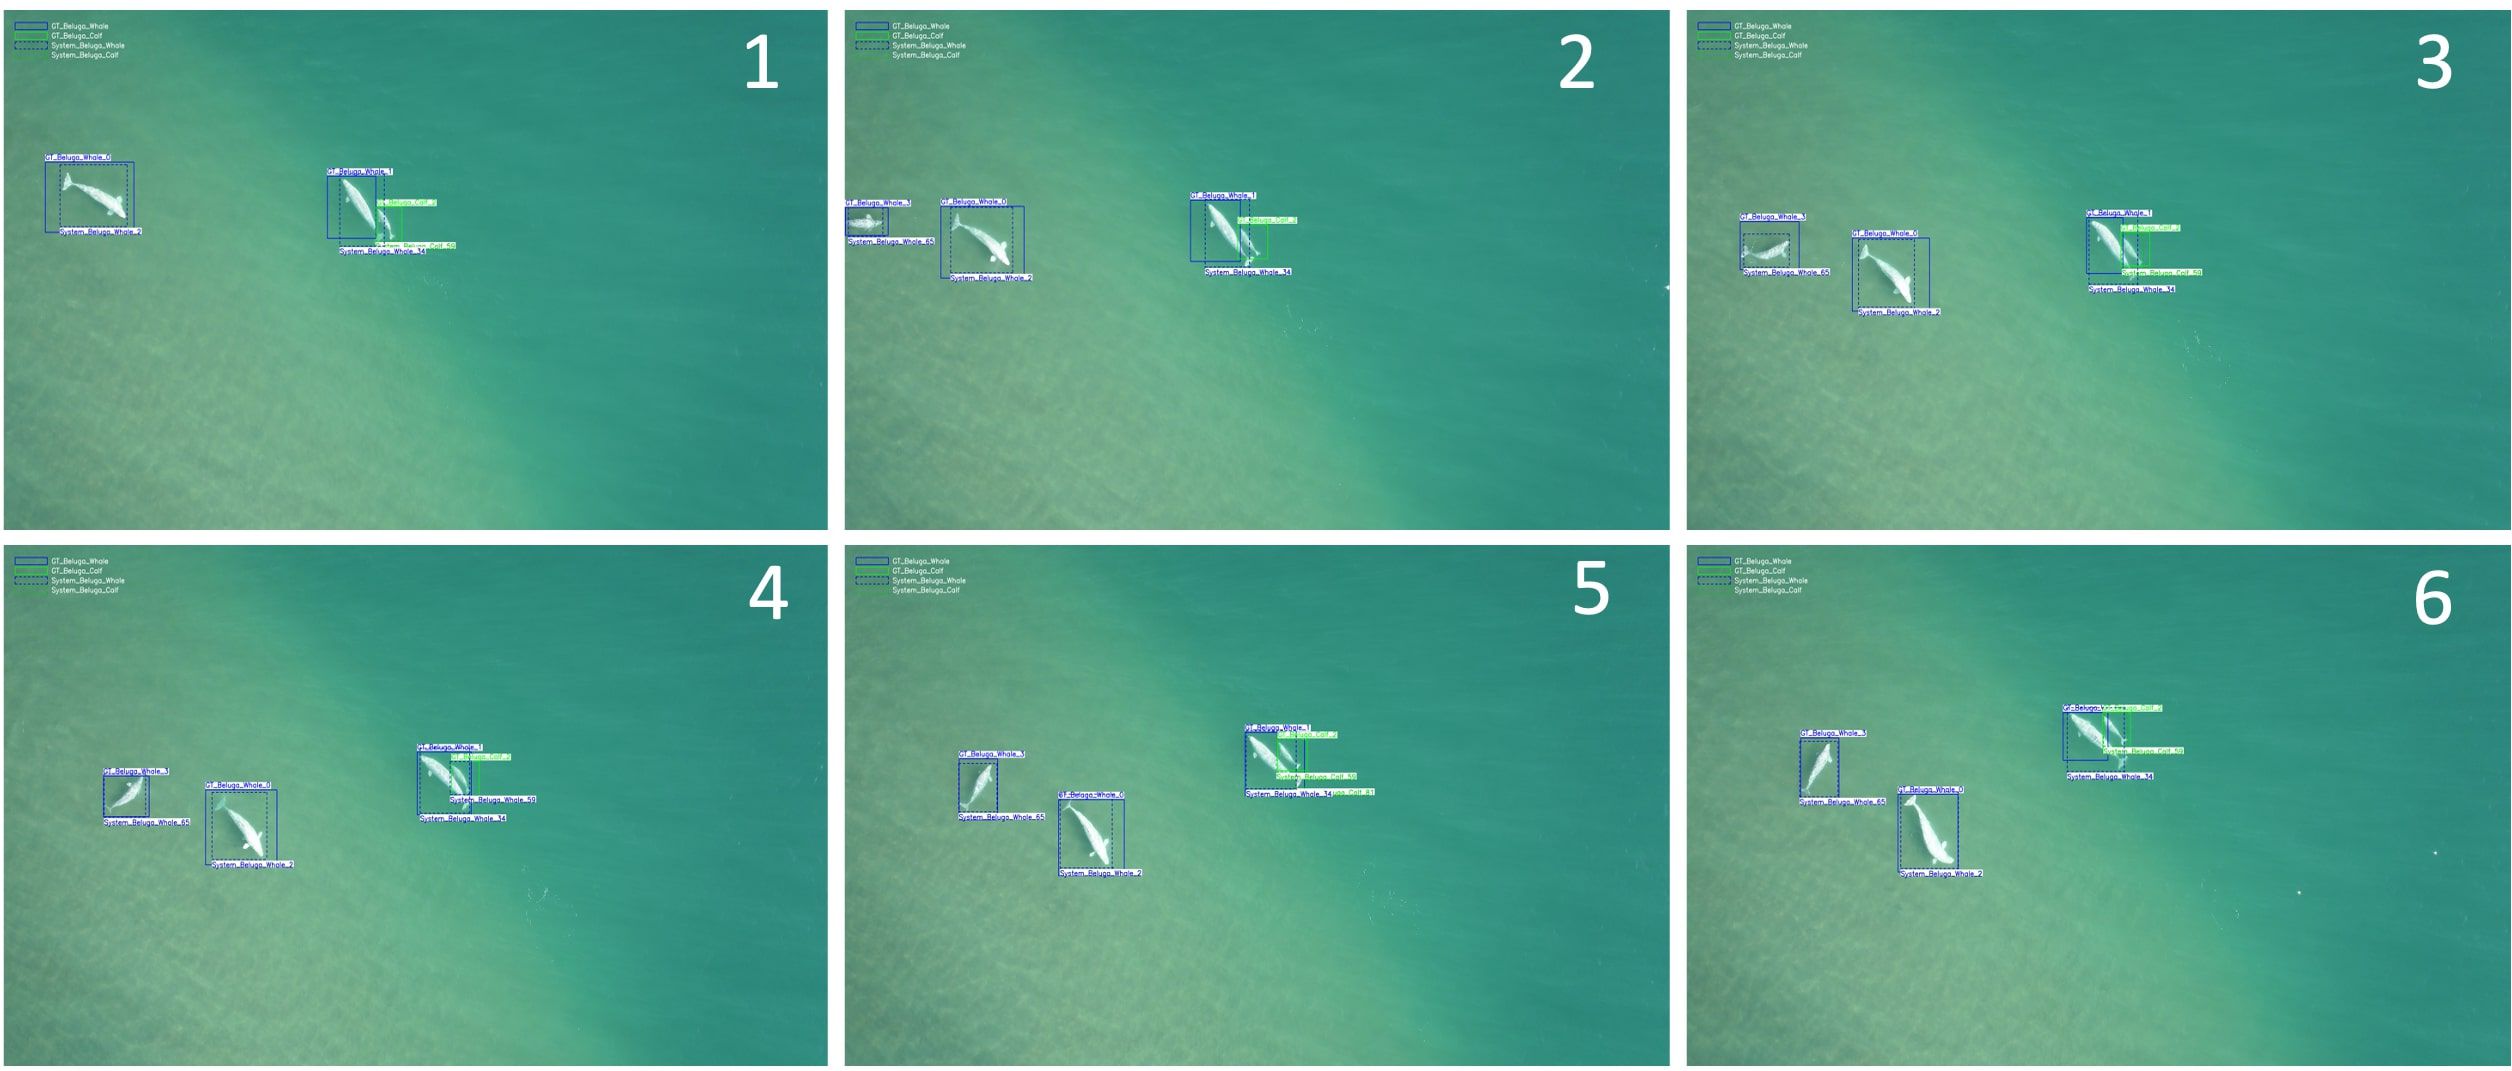
The comparative analysis between ground truth labels generated by expert annotation and system detections of beluga adult whales is shown in Figure 9. The figure illustrates data across six frames sampled every 15th frame from the input video, highlighting the detection accuracy over time. The green bounding boxes with solid and dashed lines represent beluga calves, ground truth annotation, and system detection respectively. While the blue bounding boxes represent the beluga adult whale class with ground truth represented by solid lines and system detection represented by dashed lines.
Each bounding box is associated with a label “GT_Class_ObjectID” for expert annotation bounding boxes and “System_Class_ObjectID” for system bounding boxes. Furthermore, we notice a high intersection over union (iou) between ground truth and system bounding boxes which signifies coherence between our YOLOv7 detector and SORT tracker of our system. Additionally, we noticed mismatches in the ObjectId value between our system and ground truth annotations due to frequent Object ID switches of our tracking algorithm.
Table 3 presents a summary of our object tracking efforts, characterized by the tracking of beluga adults and calves across three videos of different durations.
the rates of FP and FN are pivotal in evaluating the tracking precision and the algorithm’s ability to correctly identify objects. A noteworthy aspect of our findings is the lower frequency of false negatives relative to false positives, underscoring our model’s robustness in consistently identifying the presence of belugas within the visual field.
A noticeable trend in the table is the inverse relationship between the MOTA scores and the quantity of tracked belugas and calves. The MOTA metric gauges the aggregate accuracy of the tracking process, factoring in false positives, false negatives, and identity switches. Notably, in Video 3, which features the highest number of both adult belugas and calves, we observe a marked decline in MOTA. This is primarily due to occlusions — as belugas dive, the tracking algorithm temporarily loses sight of them, leading to a higher likelihood of assigning a new object ID to the whale as they re-appear on the surface. This issue is even more pronounced with beluga calves, where higher occlusion rates lead to more frequent loss of track, resulting in a greater number of identity switches. Beluga calves are often seen swimming close to adult beluga whales leading to more occlusion and higher identity switching rates. This poses a negative impact on MOTA and leads to a noticeable negative decline in tracking accuracy.
In an attempt to alleviate the effects of frequent object identity switches, the post-processing algorithm, Algorithm 1 showing in Section 2.6, was implemented. This simple yet effective algorithm evaluates the closeness of the objects across two consecutive frames and updates the object ID based on the IoU threshold. Upon testing, we found that for our case an IoU of 0.2 was a suitable value to differentiate whether the detected whale was the same whale with a different assigned ID or it was a different whale altogether. Table 4 shows the beluga whale tracking results after applying the post-processing algorithm.
In summary, the experimental study revealed that the deep learning algorithm effectively detected both adult belugas and calves. However, its performance was significantly hindered by occlusions, particularly when tracking the smaller and more agile calves. These findings emphasize the critical need for new deep learning models that can adeptly handle the challenges posed by occlusion in the marine environment.
3.4 Comparison to related studies
In this section, we compare YOLOv7, the model we used for object detection, to the state-of-the-art object detection model Co-DETR (Zong et al., 2023). Then, we will compare our approach to the one used in Harasyn et al. (2022), which also addresses beluga whale tracking in drone aerial images.
3.4.1 YOLOv7 vs Co-DETR
Co-DETR is an object detection model built on DETR (DEtection TRansformer) (Zhu et al., 2021), an end-to-end transformer-based neural network for object detection. It employs a collaborative hybrid assignment training strategy which aims to develop more efficient and effective DETR-based detectors through diverse label assignment methods. We applied transfer learning to train the Co-Deformable-DETR variant of the model, starting with weights that were trained on the COCO dataset for 36 epochs, which incorporates the Small version of Swin (Liu et al., 2021) as the backbone. The training was conducted over 50 epochs using the AdamW optimizer with a learning rate of 0.2, step scheduling, and a weight decay of 0.05. Default augmentation settings were maintained. It achieved a mAP@.5 of 0.851 and a mAP@.5:.95 of 0.369. YOLOv7 achieves 19.78% and 9.75% for mAP@.5 and mAP@.5:.95, respectively, compared to Co-DETR. Even though Co-DETR is the state-of-the-art object detection method on the COCO dataset, YOLOv7 exhibits better performances for our dataset. It may be due to the dataset size, which is small compared to benchmark object detection datasets such as COCO or PASCAL VOC (Everingham et al., 2010).
3.4.2 Comparison to Harasyn’s work
Harasyn et al. (2022) is a closely related study involving Beluga whales tracking on aerial videos. It explores the use of deep learning to improve marine mammal research workflows by automating the analysis of aerial imagery, which typically involves manually identifying individual animals and objects and converting these observations into biological statistics. The YOLOv4 model was trained on drone imagery to detect belugas, kayaks, and motorized boats, achieving both an average precision and recall of 89.12% and 88.53%, respectively. Additionally, the DeepSORT algorithm was used to track these objects, achieving an average MOTA of 63.6%.
Their dataset consists of aerial video footage capturing beluga whales, boats, and kayaks, with the goal of quantifying the impact of watercraft on beluga behavior in the Churchill River estuary. Notably, the videos feature oblique imagery of the scene, where whales only appear briefly. In contrast, our dataset includes videos of adult belugas and calves, captured from as orthogonal an angle as possible (bird’s-eye view) to allow for clear, long-term tracking of belugas. Specifically, we aim to address the challenges of studying beluga whale behavior, which is particularly difficult for polar species due to their remote habitats and harsh environmental conditions. In this study, we set up a rare, three-week field camp in the High Arctic and employed drones to obtain detailed aerial views of beluga whale behaviors. Although this research focuses on tracking belugas rather than studying their behavior directly, this tracking forms a critical first step toward future behavioral studies. Recognizing the broader potential of this data, we plan to make it publicly available following publication to support further research.
In terms of method, both Harasyn et al. (2022) and this study employ YOLO for object detection and DeepSORT for tracking. While the former uses YOLOv4 and we use YOLOv7, the main difference lies in the post-processing step we applied. Our post-processing method, designed to reduce identity switches (a common issue in tracking), significantly improved the MOTA from 34% to 71% by using a simple strategy based on the Intersection over Union (IoU). This step is crucial in addressing identity switches caused by belugas diving underwater.
The aforementioned aspects of the data and the method highlight the uniqueness of our research.
4 Conclusion
This research holds significant ecological and conservation implications as the Arctic, warming at an accelerated rate Rantanen et al. (2022), poses threats to both beluga whales and Indigenous communities. The rise in anthropogenic activities, such as oil exploration and shipping, exacerbates these risks. To effectively understand and mitigate these impacts, there is a pressing need for innovative methods to analyze extensive remote sensing data collected from drones, thus allowing the processing of large datasets and deriving meaningful insights.
Deep learning has emerged as a transformative tool in various areas of research ranging from detecting driver behavior (Jan et al., 2022) to marine mammal research. By leveraging deep learning algorithms, researchers can automate the processing of large datasets, enabling efficient analysis of marine mammal data. Our research specifically targeted the localization and tracking of adult beluga whales and beluga calves using custom proprietary aerial footage captured via drones.
The deep learning model, YOLOv7, trained on our annotated dataset, produced notable results for detecting and differentiating between beluga adults and calves. The experimental results demonstrated that the model yielded Precision—Recall of 93%—93% and 95%—89% for adults and calves, respectively. The model also achieved an overall 93.4% mAP at the confidence level of 0.5.
Upon examining our system, we noticed misclassifications were more likely to occur in occluded scenes, such as when a whale was submerged underwater or two whales overlapped each other. However, these misclassifications did not persist for consecutive frames of the video footage and were often self-corrected. Like most deep learning-based models, this model could be improved with the addition of expert-annotated data, allowing for fine-tuning or retraining on a larger dataset.
Furthermore, the application of the deep SORT algorithm for tracking extended our system’s capabilities, allowing for continuous tracking of detected whales. Our use of deep SORT provided valuable insights into the limitations of tracking beluga whales in water. We observed that high identity switching occurred among the same whales in different frames, primarily due to occlusion—such as when beluga whales dive underwater or overlap in the footage, especially with beluga calves. To address this issue, we implemented a post-processing procedure—a simple yet effective algorithm that reduces the number of identity-switching incidents. As a result, the MOTA score improved from approximately 30% to 70%. These add up to existing literature and contribute to establishing a foundation for advancing marine mammal science, emphasizing conservation and a comprehensive understanding of population behavior.
Moving forward, our research will focus on developing more effective methods to address the identity-switching challenge and analyzing larger video datasets. This aims to create more robust models that enhance tracking performance in beluga whale studies. Additionally, we will investigate various aspects of beluga whale behavior, including social interactions and feeding habits.
Data availability statement
The raw data supporting the conclusions of this article will be made available by the authors, without undue reservation.
Author contributions
MA: Validation, Software, Investigation, Formal analysis, Data curation, Writing – review & editing, Writing – original draft, Methodology. MA-J: Writing – original draft, Visualization, Software, Formal analysis. CB: Methodology, Formal analysis, Writing – review & editing. GO’C-C: Data curation, Writing – review & editing, Validation, Resources, Investigation, Funding acquisition, Conceptualization. CW: Resources, Funding acquisition, Conceptualization, Writing – review & editing, Validation, Investigation. MG: Validation, Investigation, Data curation, Writing – review & editing. HZ: Writing – review & editing, Supervision, Resources, Project administration, Methodology, Funding acquisition, Conceptualization.
Funding
The author(s) declare financial support was received for the research, authorship, and/or publication of this article. Funding, logistical, and administrative support for this research was provided by the National Geographic Society, Harbor Branch Oceanographic Institute at Florida Atlantic University , Fisheries and Oceans Canada, the World Wildlife Fund, the Nunavut Wildlife Management Board, and Natural Resources Canada’s Polar Continental Shelf Program. Thanks to the Resolute Bay Hunters and Trappers Association for their support for this field work. All research was conducted under permit A-22/23-002-NU and animal care protocol OPA-ACC-2022-25 both issued by Fisheries and Oceans Canada.
Acknowledgments
The authors would like to thank Fisheries and Oceans Canada for granting special permits that allowed us to fly drones 20 meters above sea level to record video footage of beluga whales used in this study.
Conflict of interest
The authors declare that the research was conducted in the absence of any commercial or financial relationships that could be construed as a potential conflict of interest.
Publisher’s note
All claims expressed in this article are solely those of the authors and do not necessarily represent those of their affiliated organizations, or those of the publisher, the editors and the reviewers. Any product that may be evaluated in this article, or claim that may be made by its manufacturer, is not guaranteed or endorsed by the publisher.
References
Alsaidi M., Jan M., Altaher A., Zhuang H., Zhu X. (2023). Tackling the class imbalanced dermoscopic image classification using data augmentation and gan. Multimedia Tools Appl. 83, 49121–49147. doi: 10.1007/s11042-023-17067-1
Ballard D. (1981). Generalizing the hough transform to detect arbitrary shapes. Pattern Recognition 13, 111–122. doi: 10.1016/0031-3203(81)90009-1
Bewley A., Ge Z., Ott L., Ramos F., Upcroft B. (2016). “Simple online and realtime tracking,” in 2016 IEEE International Conference on Image Processing (ICIP). (IEEE), 3464–3468. doi: 10.1109/ICIP.2016.7533003
Bochkovskiy A., Wang C., Liao H. M. (2020). Yolov4: Optimal speed and accuracy of object detection, CoRR abs/2004.10934.
Bogucki R., Cygan M., Khan C. B., Klimek M., Milczek J. K., Mucha M. (2018). Applying deep learning to right whale photo identification. Conserv. Biol. 33, 676–684. doi: 10.1111/cobi.13226
Borowicz A., Le H., Humphries G., Nehls G., Höschle C., Kosarev V., et al. (2019). Aerial-trained deep learning networks for surveying cetaceans from satellite imagery. PloS One 14, e0212532. doi: 10.1371/journal.pone.0212532
Bridge E. S., Wilhelm J., Pandit M. M., Moreno A., Curry C. M., Pearson T. D., et al. (2019). An Arduino-Based RFID platform for animal research. Front. Ecol. Evol. 7. doi: 10.3389/fevo.2019.00257
Chambault P., Dalleau M., Nicet J.-B., Mouquet P., Ballorain K., Jean C., et al. (2020). Contrasted habitats and individual plasticity drive the fine scale movements of juvenile green turtles in coastal ecosystems. Movement Ecol. 8. doi: 10.1186/s40462-019-0184-2
Durban J., Fearnbach H., Barrett-Lennard L., Perryman W., Leroi D. (2015). Photogrammetry of killer whales using a small hexacopter launched at sea. J. Unmanned Vehicle Syst. 3, 131–135. doi: 10.1139/juvs-2015-0020
Everingham M., Gool L. V., Williams C. K. I., Winn J. M., Zisserman A. (2010). The pascal visual object classes (voc) challenge. Int. J. Comput. Vis. 88, 303–338. doi: 10.1007/s11263-009-0275-4
Girshick R., Donahue J., Darrell T., Malik J. (2014). “Rich feature hierarchies for accurate object detection and semantic segmentation,” in Proceedings of the 2014 IEEE conference on computer vision and pattern recognition, vol. 14. (IEEE Computer Society, USA), 580–587. doi: 10.1109/CVPR.2014.81
Guirado E., Tabik S., Rivas M. L., Alcaraz-Segura D., Herrera F. (2019). Whale counting in satellite and aerial images with deep learning. Sci. Rep. 9. doi: 10.1038/s41598-019-50795-9
Harasyn M. L., Chan W. S., Ausen E. L., Barber D (2022). Detection and tracking of belugas, kayaks and motorized boats in drone video using deep learning. Drone Syst. Appl. 10, 77–96. doi: 10.1139/juvs-2021-0024
Hauser D. D. W., Laidre K. L., Suydam R. S., Richard P (2014). Population-specific home ranges and migration timing of Pacific Arctic beluga whales (Delphinapterus leucas). R. Polar Biol. 37, 1171–1183. doi: 10.1007/s00300-014-1510-1
Hodgson A., Kelly N., Peel D. (2013). Unmanned aerial Vehicles (UAVs) for surveying marine fauna: a Dugong case study. PloS One 8, e79556. doi: 10.1371/journal.pone.0079556
Jan M., Garbin C., Ruetschi J., Marques O., Kalva H. (2024). Automated patient localization in challenging hospital environments. Multimedia Tools Appl. 83, 1–19. doi: 10.1007/s11042-024-18118-x
Jan M., Hashemi A., Jang J., Yang K., Zhai J., Newman D., et al. (2022). “Non-intrusive drowsiness detection techniques and their application in detecting early dementia in older drivers,” in Lecture notes in networks and systems, vol. 580. (Springer), 776–796. doi: 10.1007/978-3-031-18458-1
Kalman R. E. (1960). A new approach to linear filtering and prediction problems. J. Basic Eng. 82, 35–45. doi: 10.1115/1.3662552
Kapoor S., Kumar M., Kaushal M. (2023). Deep learning based whale detection from satellite imagery. Sustain. Computing Inf. Syst. 38, 100858. doi: 10.1016/j.suscom.2023.100858
Lin T.-Y., Dollar P., Girshick R., He K., Hariharan B., Belongie S. (2017). “Feature pyramid networks for object detection,” in Proceedings of the IEEE Conference on Computer Vision and Pattern Recognition (CVPR).
Lin T.-Y., Maire M., Belongie S., Bourdev L., Girshick R., Hays J., et al. (2014a). Coco detection evaluation. Available online at: https://cocodataset.org/detection-eval (Accessed 2024-0926).
Lin T.-Y., Maire M., Belongie S., Hays J., Perona P., Ramanan D., et al. (2014b). Microsoft COCO: common objects in context. doi: 10.1007/978-3-319-10602-1
Liu Z., Lin Y., Cao Y., Hu H., Wei Y., Zhang Z., et al. (2021). “Swin transformer: Hierarchical vision transformer using shifted windows,” in Proceedings of the IEEE/CVF International Conference on Computer Vision (ICCV). 10012–10022.
Manabe K. (2017). The skinner box evolving to detect movement and vocalization. Rev. Mexicana Análisis la Conducta 43, 192–211. doi: 10.5514/rmac.v43.i2.62313
Rantanen M., Karpechko A. Y., Lipponen A., Nordling K., Hyvärinen O., Ruosteenoja K., et al. (2022). The Arctic has warmed nearly four times faster than the globe since 1979. Commun. Earth Environ. 3. doi: 10.1038/s43247-022-00498-3
Roboflow. (2024). Roboflow python package. Available online at: https://github.com/roboflow/roboflow-python.
Ryan K. P., Ferguson S. H., Koski W. R., Young B. G., Roth J. D., Watt C. A. (2022). Use of drones for the creation and development of a photographic identification catalogue for an endangered whale population. Arctic Sci. 8, 1191–1201. doi: 10.1139/as-2021-0047
Torres L. G., Nieukirk S. L., Lemos L., Chandler T. E. (2018). Drone up! quantifying whale behavior from a new perspective improves observational capacity. Front. Mar. Sci. 5, 319. doi: 10.3389/fmars.2018.00319
Wang C.-Y., Bochkovskiy A., Liao H.-Y. M. (2023). “Yolov7: Trainable bag-of-freebies sets new state-of-the-art for real-time object detectors,” in Proceedings of the IEEE/CVF Conference on Computer Vision and Pattern Recognition (CVPR). 7464–7475.
Wong K.-Y., et al. (2022). Yolov7. Available at: https://github.com/WongKinYiu/yolov7.
Zhang H., Cissé M., Dauphin Y. N., Lopez-Paz D. (2017). mixup: Beyond empirical risk minimization, CoRR abs/1710.09412.
Zhu X., Su W., Lu L., Li B., Wang X., Dai J. (2021). “Deformable DETR: deformable transformers for end-to-end object detection,” in 9th International Conference on Learning Representations, ICLR 2021, Virtual Event, Austria, May 3-7, 2021 (OpenReview.net).
Keywords: marine mammals, beluga whale, localization, tracking, deep learning, aerial video footage, multiple object tracking
Citation: Alsaidi M, Al-Jassani MG, Bang C, O’Corry-Crowe G, Watt C, Ghazal M and Zhuang H (2024) Localization and tracking of beluga whales in aerial video using deep learning. Front. Mar. Sci. 11:1445698. doi: 10.3389/fmars.2024.1445698
Received: 07 June 2024; Accepted: 03 October 2024;
Published: 14 November 2024.
Edited by:
Fengqin Yan, Institute of Geography Science and Natural Resources (CAS), ChinaReviewed by:
Duane Edgington, Monterey Bay Aquarium Research Institute (MBARI), United StatesCarla Cherubini, Politecnico di Bari, Italy
Copyright © 2024 Alsaidi, Al-Jassani, Bang, O’Corry-Crowe, Watt, Ghazal and Zhuang. This is an open-access article distributed under the terms of the Creative Commons Attribution License (CC BY). The use, distribution or reproduction in other forums is permitted, provided the original author(s) and the copyright owner(s) are credited and that the original publication in this journal is cited, in accordance with accepted academic practice. No use, distribution or reproduction is permitted which does not comply with these terms.
*Correspondence: Hanqi Zhuang, emh1YW5nQGZhdS5lZHU=
 Mostapha Alsaidi
 Mohammed G. Al-Jassani
 Chiron Bang
 Gregory O’Corry-Crowe
 Cortney Watt
 Maha Ghazal
 Hanqi Zhuang