 Imke M. Böök1*†
 Erik C. Krieger1†Nicole E. Phillips1Keith P. Michael2James J. Bell1
 Wayne D. N. Dillon3
 Christopher E. Cornwall1
- 1School of Biological Sciences, Victoria University of Wellington, Wellington, New Zealand
- 2National Institute of Water and Atmospheric Research, Wellington, New Zealand
- 3Department of Chemistry, University of Otago, Dunedin, New Zealand
Ocean acidification can negatively affect a broad range of physiological processes in marine shelled molluscs. Marine bioeroding organisms could, in contrast, benefit from ocean acidification due to reduced energetic costs of bioerosion. Ocean acidification could thus exacerbate negative effects (e.g. reduced growth) of ocean acidification and shell borers on oysters. The aim of this study was to assess the impact of ocean acidification on the oyster Ostrea chilensis, the boring sponge Cliona sp., and their host-parasite relationship. We exposed three sets of organisms 1) O. chilensis, 2) Cliona sp., and 3) O. chilensis infested with Cliona sp. to pHT 8.03, 7.83, and 7.63. Reduced pH had no significant effect on calcification, respiration and clearance rate of uninfested O. chilensis. Low pH significantly reduced calcification leading to net dissolution of oyster shells at pHT 7.63 in sponge infested oysters. Net dissolution was likely caused by increased bioerosion by Cliona sp. at pHT 7.63. Additionally, declining pH and sponge infestation had a significant negative antagonistic effect (less negative than predicted additively) on clearance rate. This interaction suggests that sponge infested oysters increase clearance rates to cope with higher energy demand of increased shell repair resulting from higher boring activity of Cliona sp. at low seawater pH. O. chilensis body condition was unaffected by sponge infestation, pH, and the interaction of the two. The reduction in calcification rate suggests sponge infestation and ocean acidification together would exacerbate direct (reduced growth) and indirect (e.g., increased predation) negative effects on oyster health and survival. Our results indicate that ocean acidification by the end of the century could have severe consequences for marine molluscs with boring organisms.
1 Introduction
Anthropogenic carbon dioxide (CO2) emissions are increasing CO2 concentrations in the atmosphere, leading to an increase in the amount of CO2 being absorbed by the world’s surface seawater. The subsequent reduction in seawater pH due to the resulting increase in H+ concentrations is called ocean acidification (Caldeira and Wickett, 2003). The rapid and ongoing decrease in seawater pH and alteration of seawater carbonate chemistry is threatening marine life on a global scale (Raven et al., 2005; Kroeker et al., 2013). Marine calcifiers such as corals, coralline algae and shellfish are particularly susceptible to this impact because lower seawater pH reduces their calcification rates (Feely et al., 2009; Hofmann et al., 2010). The direct negative effects of ocean acidification are well described in marine shelled molluscs and include effects on survival, development, growth, and shell morphology (Ries et al., 2009; Gazeau et al., 2013; Kroeker et al., 2013).
However, ocean acidification could also indirectly affect marine shelled molluscs by increasing bioerosion rates. Bioerosion is the erosion of substrates such as shells and sediments by bioeroding organisms (Bromley and Hanken, 1981; Holmes et al., 2000). Bioeroding sponges, such as Cliona sp., erode calcium carbonate through chemical and mechanical mechanisms (Warburton, 1958; Rützler and Rieger, 1973). Sponge bioerosion rates are positively affected by low seawater pH (Duckworth and Peterson, 2013; Fang et al., 2013, 2014; Wisshak et al., 2013, 2014; Stubler and Peterson, 2016) and could increase under ocean acidification. However, there might be a threshold of pH reduction that could have negative impacts on sponge health and therefore reduce bioerosion rates (Duckworth and Peterson, 2013; Enochs et al., 2015; Morris et al., 2022). Low seawater pH creates a more favourable chemical gradient, thus lowering energetic costs of bioerosion by sponges (Fang et al., 2013, 2014; Schönberg et al., 2017). Bioeroding sponges are common macroborers in the shells of molluscs (Bergquist, 1961, 1968; Probert et al., 1979; Pritchard et al., 1984). They can heavily damage mollusc shells and are regarded as a pest in the oyster aquaculture and fisheries industries (Alagarswami and Chellam, 1976; Thomas, 1979; Rützler, 2002a, b; Carver et al., 2010).
Oysters have a high socio-economical value (Grabowski et al., 2012; Lemasson et al., 2017) and are undergoing extensive restoration in many parts of the world (Duarte et al., 2020; Howie and Bishop, 2021; Smith and Pruett, 2024) due to significant loss (~80%) of wild oyster populations over the past 140 years (Beck et al., 2011; Zu Ermgassen et al., 2012; Gillies et al., 2018). Ocean acidification and increasing bioerosion could threaten these restoration efforts and healthy oyster populations worldwide. Negative effects of ocean acidification on oysters affect all life stages (Lemasson et al., 2017). In adult oysters, reduced pH negatively impacts shell calcification, making shells softer and more fragile (Beniash et al., 2010; Dickinson et al., 2012), as well as reducing calcification rates (Gazeau et al., 2007; Ries et al., 2009; Beniash et al., 2010; Waldbusser et al., 2011b) and increasing shell dissolution (Ries et al., 2009; Waldbusser et al., 2011a). Further, low pH can significantly impact respiration (Beniash et al., 2010) and feeding rates of oysters (Lemasson et al., 2018) and reduce oyster body condition (hereafter condition) (Lannig et al., 2010). The impacts of ocean acidification on oyster physiology could create shifts in species interactions by increasing oyster susceptibility to biological stressors such as bioerosion from sponges (Sanford et al., 2014).
Increased bioerosion rates under ocean acidification could be detrimental for hosts of sponges, further exacerbating the direct negative impacts of ocean acidification they already experience. Oysters might experience higher energetic expenditure under lower seawater pH due to higher costs of shell deposition and maintenance, which could lead to metabolic depression of other processes (Lannig et al., 2010). Additionally, oyster energy budgets could be negatively affected due to active reduction of respiration and feeding/clearance rates under ocean acidification. Respiration and feeding rates can be reduced as a means to protect soft-tissues from unfavourable conditions such as low pH (Rastrick et al., 2018). Consequently, the ability to maintain or increase energy assimilation likely determines resilience to ocean acidification (Lemasson et al., 2018). For sponge-infested oysters, energy expenditure under ocean acidification may be further increased by the high energetic costs of shell repair (Dame, 1976; Carroll et al., 2015). The negative impacts of sponge boring on oyster growth and condition (Carroll et al., 2015; Watts et al., 2018; Hanley et al., 2019; Dieudonne and Carroll, 2022) could thus be exacerbated under ocean acidification because of higher borer activity.
The wild oyster population of the native flat oyster Ostrea chilensis in the Foveaux Strait (FS), New Zealand, is heavily colonised by the boring sponge Cliona sp. (Böök, 2024). The oysters are important to commercial, recreational, and indigenous fishers (Michael, 2010). Cliona sp. is a native sponge that is widespread along New Zealand coastal water and infestation in the FS oyster fishery can affect as many as 100% of oysters (O. chilensis) in certain areas (Böök, 2024). Cliona sp. has long been considered a “parasite” in O. chilensis from the FS that might contribute to poor quality and mortality of oysters (Stead, 1971a, b; Michael et al., 2015, 2019, 2021; Michael, 2018). More recent studies however did not find biological and disease processes of O. chilensis to be strongly impacted by Cliona sp. (Böök et al., 2023; Böök, 2024). With the anthropogenically driven fast changes in oceanic pH, it is crucial to understand how future conditions might affect the relationship between oysters and bioeroding sponges.
The aim of this study was to assess the impact of ocean acidification on the oyster O. chilensis, the boring sponge Cliona sp., and their interaction. We hypothesised that 1) reduced pH would decrease calcification rate and condition of oysters and increase both clearance rates and respiration rates due to higher energetic costs of calcification; 2) that ocean acidification would increase the bioerosion rate, clearance rate, and respiration rate of Cliona sp.; and 3) that sponge infestation would increase calcification, clearance rate, and respiration rates and reduce condition of oysters due to additional energy needed for shell repair and possible negative effects of sponge boring on oyster soft-tissues. To test these hypotheses, we exposed oysters with and without sponge infestation and sponges infesting dead oyster shells to three projected and present-day pH levels (roughly 8.03, 7.83, 7.63, see Supplementary Table 1 for details) and used standard physiological methods such as growth measurements (buoyant weight), closed-chamber respirometry, clearance rates and an oyster condition index to assess the effect of these treatments on the organisms.
2 Materials and methods
2.1 Organism collection and acclimation
Samples were collected in the FS oyster fishery area (46°S 40.2, 168°E 10.8) in May 2021 by the Bluff Oyster Management Company (BOMC) from single dredge tows using commercial fishing vessels. The samples were collected under the NIWA project code (SIL20302), using the NIWA special permit (665). Sixty-four living oysters without sponge infestation (uninfested oysters), 64 oysters with sponge infestation (infested oysters, visually assessed) and 64 dead shells with sponge infestation (sponges) were collected. The sponges on infested oysters and dead shells were all in the alpha stage (boring stage), meaning that sponge infestation was clearly visible as sponge papillae (boreholes) protruding from the shell surface (see Supplementary Figure 1). The living oysters were of minimum legal size (>58 mm shell length). Samples were transported alive in polystyrene boxes to Wellington (New Zealand) within 24 hours of collection. At the experimental facility, samples were carefully cleaned of epibionts (as much as possible) and dirt, and labelled with Hallprint Shellfish Tags (Hallprint Inc., Hindmarsh Valley, South Australia, Australia) before distributing them into the experimental tanks. Though sponges were out of water during transport and handling, the sponge tissue remained moist and visibly undamaged before and during the experiment. The organisms were slowly acclimatised to experimental conditions by decreasing the pH by 0.1 units per day (Doo et al., 2020) (from 8.03) until the target pH for the respective treatments was reached. This was followed by an acclimation phase of one week. Subsequently the experiment ran for 119 days from 20th May 2021 (T0) to 14th September 2021 (T2).
2.2 Experimental setup and treatments
The experiment was designed to include three different treatments of differing mean seawater pHT (Supplementary Table 1). A control treatment was chosen to represent the mean present-day pHT of the coastal waters around New Zealand (8.03 or ambient; see Supplementary Table 1 for mean pHT). The other two treatments (7.83, 7.63; see Supplementary Table 1 for mean pHT) represent two ocean acidification scenarios, which were informed by expected future pH levels for different relative concentration pathways (RCPs, RCP 4.5 2100, RCP 8.5 2100) outlined by the Intergovernmental Panel on Climate Change (IPCC) (Gattuso et al., 2015). Calcite saturation states corresponding to the treatments are 3.24 ± 0.03 SE, 2.41 ± 0.07 SE and 1.61 ± 0.03 SE respectively. pH predictions under different RCP scenarios are very similar across most of the surface oceans and therefore should accurately reflect local conditions (see Law et al., 2018b, a). The pHT levels 8.03 and 7.63 were replicated 18 times (six tanks each for uninfested oysters, infested oysters and sponges on dead shells)), and pHT level 7.83 12 times (four tanks each for uninfested oysters, infested oysters and sponges on dead shells; Supplementary Figure 2). The uneven replication was due to spatial restrictions in the experimental facilities, and it was considered better to have more replicates in the two farthest treatment levels to each other as modern statistical models can deal with unbalanced designs easily (see Boyd et al., 2018). The 48 experimental tanks (~4 L each; 17.5 cm W x 23 cm L x 12 cm H) were arranged in groups of six into 60 L water baths (56 cm W x 76 cm L x 18.5 cm H). Eight water baths in total were used to hold all experimental tanks and each water bath contained three experimental tanks from two treatments (Supplementary Figure 2). Each tank contained four specimens of either uninfested oysters, sponge-infested oysters, or sponge-infested dead shells. Additionally, twenty-seven tanks contained a dead control shell without any sponge infestation, to monitor for additional biotic and abiotic influences on shell weight (e.g., passive dissolution, leftover borers and calcifying epibionts). The location of tanks per treatment within the water bath was mostly alternated sequentially between the eight water baths, for equal distribution of the experimental tanks over the whole setup. However, this was not entirely possible because of the differences in replicate numbers. The experimental setup was spread out over two shelf levels because of spatial restrictions in the experimental facility.
2.3 Seawater supply
The raw seawater used for the experiment was sourced from a rocky reef kelp forest ecosystem in front of the laboratory facilities (Victoria University of Wellington Coastal Ecology Laboratory) and pumped directly into the setup. The seawater was fed through aquarium chillers to reduce temperature variability and chilled water was collected in two intermediate tanks (one per shelf level with ~60 L each; 56 cm W x 76 cm L x 18.5 cm H). From here, water was pumped into the header tanks (~20 L each; 30 cm W x 25 cm L x 38 cm H) using submersible pumps (Jeboa DC-650, 200 L h-1). There was a total of eight header tanks, and one header tank supplied each of six experimental tanks (3 per water bath) with 150 mL seawater per min. Each header tank contained one pump (Jeboa DC-650, 650 L h-1) to ensure water mixing. The organisms were fed with Shellfish Diet 1800 (Reed Mariculture Inc., Campbell, CA, USA) at least 5 times a week. The Shellfish Diet 1800 contains algal cells of 4–20 μm diameter. The raw seawater alone should be suitable for sponge feeding because Cliona sp. is found on the Wellington Cook Strait coastline in front of the laboratory (personal obs. I. M. Böök, Berman, 2011). Nevertheless, feed was added to all tanks to ensure nutrition for oysters and to keep conditions the same across all tanks. Prior to feeding, the seawater supply was turned off to avoid flushing the feed out while the smaller jet pumps placed in each experimental tank ensured mixing and kept the feed in suspension (Hailea BT100, 150 L h-1). During feeding, previously diluted Shellfish Diet was poured into each experimental tank and organisms were left for 1–2 hours to feed. Each organism was supplied with the equivalent of approximately 1 mL of undiluted Shellfish Diet per feeding (~3% algae dry weight per oyster dry meat weight, as per manufacturers recommendations).
2.4 Seawater pH maintenance and seawater carbonate chemistry
Over the course of the day, pH levels fluctuated around the mean ± 0.1 units during certain times due to natural variability from the nearby kelp forest in the incoming raw seawater. pH was lowest during the day (8 am to 4 pm) and highest during the night (8 pm to 4 am); the rest of the time the pH was approximately equivalent to the target mean pH (see Supplementary Figure 3 for daily pH variability). Due to the natural variation in pH in the subtidal kelp forest in front of the laboratory, pH fluctuations were difficult to remove, especially when incoming water had a very low pH. Therefore, we opted to allow for some pH variation, while keeping the mean pH stable over the course of one day. The pH levels for the respective treatments (see Supplementary Table 1) were regulated inside the header tanks with an aquarium control system (AquaController, Neptune systems, USA). pH electrodes connected to the control system were placed inside the header tanks. The control system reduced or increased pH automatically by bubbling CO2 or air into the header tanks through connected solenoid valves. The variability of seawater pH and total alkalinity (AT) inside the experimental tanks were monitored in each header tank and in randomly selected experimental tanks of each water bath at regular intervals (for results see Appendix Supplementary Table 1). The pH was measured at least once per week with a pH meter (HQ40D equipped with IntelliCal PHC101 probe, Hach Company, Loveland, USA), which was calibrated on the total scale (pHT) using Tris/HCl buffers (after Dickson et al., 2007). From now on we refer to pHT used as pH throughout unless otherwise stated. Water samples for titrations of AT were taken every two weeks and AT was calculated with a modified Gran function (Dickson et al., 2007). Titrations (AS-ALK2, Apollo SciTech, USA) of certified reference material (CRM, Batch 190 provided by A.G. Dickson lab, University of California, San Diego, USA) yielded AT values which deviated on average 3.76 ± 1.39 μmol kg-1 from the reference material. Seawater carbonate chemistry was calculated with the “seacarb” package in R (Gattuso et al., 2021) and the Microsoft Excel programme Co2sys v2.1 (Pierrot et al., 2006) (see Supplementary Table 1). In the Co2sys programme we used constants K1 and K2 (carbonic acid constants) (Mehrbach et al., 1973; refitted: Dickson and Millero, 1987), KHSO4 (sulfate constant) (Dickson, 1990) and BT (total boron concentration) (Lee et al., 2010).
2.5 Temperature control
Temperature was controlled by aquarium chillers and by submersible 300 W titanium heaters (Weipro MX1021) which were placed in each water bath and connected to a controller (AquaController, Neptune systems, USA). Temperature probes connected to the control system were placed in each water bath: Temperature control was improved by pumps (Jeboa DC-650, 650 L h-1) placed in each water bath which guaranteed mixing of water. Additionally, each experimental tank contained one smaller jet pump to create horizontal water motion for improved pH and temperature control. Temperature was measured at least once per week (for results see Appendix Supplementary Table 1) with an external probe (Kangaroo Traceable Thermometer, Fisherbrand, Fisher Scientific, Toronto, Canada). The temperature in the experimental setup (~14.4°C) reflects average summer temperatures (2011–2021) in FS (167°E 37.5, 46°S 52.5; 168°E 37.5, 46°S 37.5) inferred from satellite derived data (NOAA OI SST V2 High Resolution Dataset data provided by the NOAA PSL, Boulder, Colorado, USA, from their website at https://psl.noaa.gov).
2.6 Mean net calcification/bioerosion
All individuals were weighed using the buoyant weight technique (Jokiel et al., 1978) once the acclimation period was completed (20th May 2021, T0) after one month (T1) and at the end of the experiment (T2). To measure buoyant weight a tray (wire mesh) was connected to the hook on the underside of a scale (Pioneer Precision Balance PX2202, Ohaus, New Jersey, USA) with fishing line. A container with seawater was placed below the scale and the tray was completely submersed in the water. Individuals were placed on the tray and the weight was recorded.
Buoyant weight (BW) was corrected using the following formula:
where Ds is the density of seawater, and Dc is the density of calcite (2.71 kg L-1). The density of seawater was calculated using temperature and salinity measurements taken during the buoyant weight sampling. For most organisms the difference between T0 and T2 was used to determine weight changes, however for individuals that died before T2 (4 uninfested and 4 infested oysters) the difference between T0 and T1 was used. Weight changes between timepoints were corrected for the average proportional weight change per original weight (T0) of control shells across treatments (-0.0080 ± 0.0009 SE). Finally, weight changes were converted into dry weight of CaCO3 and used to calculate net calcification/bioerosion (mg CaCO3 g-1 day-1) respectively. The buoyant weight technique has been used to measure sponge bioerosion in previous studies (e.g., Wisshak et al., 2012; McNally, 2022).
2.7 Incubations to assess respiration and short-term calcification/chemical bioerosion
Closed-chamber respirometry was used to measure respiration rates and collected water samples were used to determine short-term calcification/bioerosion rates through changes in calcium concentration (see 2.9). For the incubations, five different individuals from each group (uninfested oysters, infested oysters, sponges) from each treatment were selected blindly (i.e., randomly) for analysis. Specimens were placed in clear plastic beakers (∅11.43 cm, 16.43 cm high) together with a stirrer bar that was separated from the organism. Containers were closed underwater inside the header tanks with an airtight lid and enclosure of air bubbles were avoided. Closed containers (Volume: 1000 mL) were then placed inside a water-filled tank on a submersible stirring plate (2mag MIXdrive6, 2mag AG, Munich, Germany), which was placed in a temperature control room. Incubations were run for 6 hours in order to get measurable results for sponge bioerosion (after Webb et al., 2017). Oxygen content did not drop below 6.5 mg L-1 in any of the incubations, therefore the organisms should have not been negatively affected by low oxygen. Water samples and measurement of dissolved oxygen (HQ40D equipped with IntelliCal LDO101 probe oxymeter, Hach Company, Loveland, USA) were taken in the header tanks at the starting point (T0) and inside the incubation containers at the end point (Tend). Empty shells without sponge served as a control and were placed into identical containers on the stirrer plate during incubations. Mean changes in O2 (-0.1 mg L-1, within measurement error) in the control chambers were deducted from change caused by the organisms. Respiration rate was calculated per organism dry weight or ash-free dry weight (sponges) as mg O2 g-1 DW h-1 (see 2.10 and 2.11). Respiration rates of infested oysters were corrected for sponge respiration. The average respiration rate of sponges per dry weight from the sponge incubations was multiplied with the tissue dry weight of sponges from the sponge infested oysters in order to calculate sponge respiration in sponge infested oysters. The resulting value was subtracted from the uncorrected respiration rate of sponge infested oysters. The incubations were run between days 28 and 43 of the experimental phase.
2.8 Clearance rate
A second set of incubations was conducted to measure clearance rate (volume of water cleared of suspended particles per unit of time). For these incubations, five different individuals from each group (uninfested oysters, infested oysters, sponges) from the ambient and pH 7.63 treatment were selected blindly (i.e., randomly) for analysis. Specimens were placed in clear plastic containers (1000 mL) which were filled in the header tanks and Shellfish Diet 1800 was added to each container to give an initial concentration of ~100,000 cells mL-1. A stirrer bar that was separated from the organism was added and containers were then placed on a submersible stirring plate (2mag MIXdrive6, 2mag AG, Munich, Germany) to ensure that the algae remained in suspension. This plate was placed in a water-filled tank in a temperature-controlled room. Incubations were run for 1 hour. Water samples were taken at the starting point (T0), at half time (T1) and at the end of the incubation (T2). Changes in particle concentration were measured with a Coulter counter (Coulter Z series; Beckman Coulter, Buckinghamshire, UK). Three different particle size ranges were measured: >5–60 μm, >2.5–60 μm and 2.5–5 μm. Control chambers with control shells (empty shells without sponge) were also placed on the stirrer plate during incubations. Mean changes in particle concentrations in the control chambers were deducted from clearance rate of the organisms. The timeframe (T0–T1 or T1–T2) which had the highest change in particle concentration was chosen to calculate clearance rate of the organisms. Clearance rates of organism groups were calculated after Coughlan (1969):
where V is the volume of the incubation chamber, t is the time elapsed between C0 and Ct (30min), C0 is the particle concentration used as the start point (T0 or T1), Ct is the particle concentration used as the end point (T1 or T2) and Cf is a correction factor for particle sedimentation in the control chambers. Cf is calculated by dividing the end concentration measured for the control by the initial concentration in control chambers (Ctc/C0c). Finally, clearance rate was standardised per gram dry weight or ash-free dry weight (see 2.10 and 2.11). The incubations were run between days 106 and 117 of the experimental phase.
2.9 Determination of calcium concentrations
Changes in calcium ion (Ca2+) concentration were determined by titration. Seawater samples (see 2.7) were titrated for Ca2+ with EGTA (ethyleneglycol-bis (2-aminoethylether)-N, N, N’, N’, tetraacetic acid) and the selective metal indicator GHA (glyoxal-bis (2hydroxy-anil)) (Tsunogai et al., 1968). For this work, the EGTA titrant was standardised using a ‘secondary’ seawater standard, for which the [Ca2+] had been previously determined in an ‘initial’ standardisation using a different batch of EGTA titrant. The ‘secondary’ standard used were seawater Certified Reference Materials (CRMs) provided by the Scripps Institution of Oceanography, which had been filtered and poisoned with mercuric chloride (Dickson et al., 2007). The ‘initial’ EGTA titrant was standardised using standard [Ca2+] solutions prepared by dissolving a known mass of pure CaCO3 in deionised water using a minimal amount of hydrochloric acid. In the determination of the ‘secondary’ seawater standard [Ca2+], a multiplicative factor of 0.9946 was applied to the final titre to correct for the interference of strontium and magnesium ions (Tsunogai et al., 1968). As the matrix effects had thus been accounted for, no correction was applied to the standardisation of EGTA using the secondary seawater standards. Approximately 10 g of each seawater sample was accurately weighed (4 decimal points) into a 100 ml conical flask. Sufficient EGTA (≈10 mM) was added to the flask to complex at least 99% of the total calcium. 2 ml of 0.05% GHA in n-propanol and 4 ml borate buffer solution (10 g Na2B4O7.10H2O and 30 g NaOH in 500 ml of water) were added. After stirring for 3 minutes to allow colour development, 8 ml of n-butanol was added. The titration with EGTA was continued until the red colour had completely disappeared from the organic layer. If the initial addition of EGTA was not >99% of the final titre value, the result was discarded, and the analysis repeated. Changes in [Ca2+] were corrected for mean change of the control samples. Subsequently, change in [Ca2+] was corrected for water volume and incubation time to obtain net bioerosion/calcification rates. Calcification/bioerosion rates were determined as 1 mole change in Ca2+ representing 1 mole change in CaCO3. Finally, calcification and chemical bioerosion rates were standardised per gram dry weight or ash-free dry weight (sponges) in mmol CaCO3 per g-1 DW h-1 (see 2.10 and 2.11). Only samples for the ambient treatment (8.03) and the lowest pH treatment (7.63) were processed because of time constraints for the sample processing.
2.10 Oyster condition index (CI) and meat dry weight
At the end of the experiment (after 26 days of treatment), oysters were shucked completely and their meat and valves were dried in a drying oven. Meat dry weight (70°C, 72 h) and shell dry weight (70°C for 24 h) were used together to calculate the following condition index (Lawrence and Scott, 1982; Rainer and Mann, 1992):
MDW = meat dry weight, SW = shell dry weight.
CI is a commonly used oyster condition index (see Rainer and Mann, 1992; Abbe and Albright, 2003) and compares investment into calcification (shell repair, shell growth) and investment into somatic and gametic growth. The index reflects energy reserves by comparing tissue weight, which is sensitive to short-term changes to shell weight, which is relatively stable over time and does not decrease except during shell erosion (Rainer and Mann, 1992). In sponge-infested oysters CI could be slightly positively inflated due to reduced shell weight which would likely be more impactful than the fact that shell dry weight included sponge dry weight for sponge-infested shells. The meat dry weight was used to standardise metabolic rates of oysters. For six uninfested oysters and six infested oysters that died during the experimental period only shell dry weight could be measured. Meat dry weight for these individuals was estimated by using a conversion factor based on the meat dry weights and shell dry weights of all other uninfested and infested oysters (n = 116).
2.11 Sponge ash-free dry weight
Sponge tissue ash-free dry weight from sponges and infested oysters at the end of the experiment was calculated by weighing dried shells (70°C for 24 h) with sponge and control shells and then combusting them at 500°C for 4 h. Control shells lost on average 2.16 ± 0.28% of their weight during combustion. Shell weights for infested oysters and sponge shells were corrected for the weight loss of the control to correct for potential weight loss due to attached epibionts. Sponge ash-free dry weight was determined as the difference between the corrected shell weight and the combusted shell weight (see Carroll et al., 2015).
While this method was used for all 64 infested oysters it was not possible to determine sponge dry weight for all sponge samples (n = 64) because some sponges from the 8.03 and 7.63 treatment (n = 39) were used in a following experiment and could not be sacrificed. Therefore, a relationship between sponge wet weight and sponge ash-free dry weight was established for the remaining 25 sponge samples. Sponge wet weight was calculated by subtracting density corrected buoyant weight (T2) of the sponge shells from shell wet weight (semi-dry, in air) of the sponge shells (T2). The average percentage weight loss that controls shells lost from wet weight to buoyant weight was used to adjust sponge wet weight. The resulting conversion factor (sponge ash-free dry weight/sponge wet weight) was used to estimate sponge ash-free dry weight for the remaining 39 sponge samples.
2.12 Statistics
Linear mixed effect models were used to test the effects of pH and sponge infestation on the different measured physiological rates and parameters. pH was used as a continuous predictor and fixed effect, while water bath and header tank were used as random effects. Differences between calcification rates of uninfested and infested oysters were compared separately for each pH treatment using linear mixed effect models with Category (uninfested/infested) as a fixed factor while including the above-mentioned random effects. Additionally, the effects of pH and sponge infestation and their interaction on oysters were tested by adding pH (continuous) and sponge infestation (yes/no) as fixed factors to the model. Conditional coefficients of determination (R2) values were taken from the full model. For all data sets the assumptions of normality and equality of variance were evaluated through graphical analyses of residuals. All tests and analyses were conducted using R (R Core Team, 2022) implemented in RStudio (RStudio Team, 2020, Version 1.4.1717). We used the R software packages “lme4”, “sjPlot”, “MuMin”, “lmerTest” in addition to packages implemented in base R. We used alpha = 0.05 as a significance level for all analyses but regarded alpha< 0.1 as a noteworthy trend. All the calculated uncertainties are given as standard errors.
3 Results
3.1 Net calcification/bioerosion
Net calcification in oysters without sponge infestation was not significantly affected by pH (Figure 1A, Supplementary Table 2). However, net calcification and net bioerosion respectively were significantly impacted by pH in sponge-infested oysters (Figure 1B, Supplementary Table 2) and sponges (Figure 1C and Supplementary Table 2). The net calcification rate increased with increasing pH from -0.19 ± 0.35 to 1.34 ± 0.27 mg CaCO3 g-1 DW day-1 in sponge-infested oysters. In sponges, the net bioerosion rate decreased significantly with increasing pH from -6.46 ± 2.54 to 2.36 ± 1.03 mg CaCO3 g-1 DW day-1.
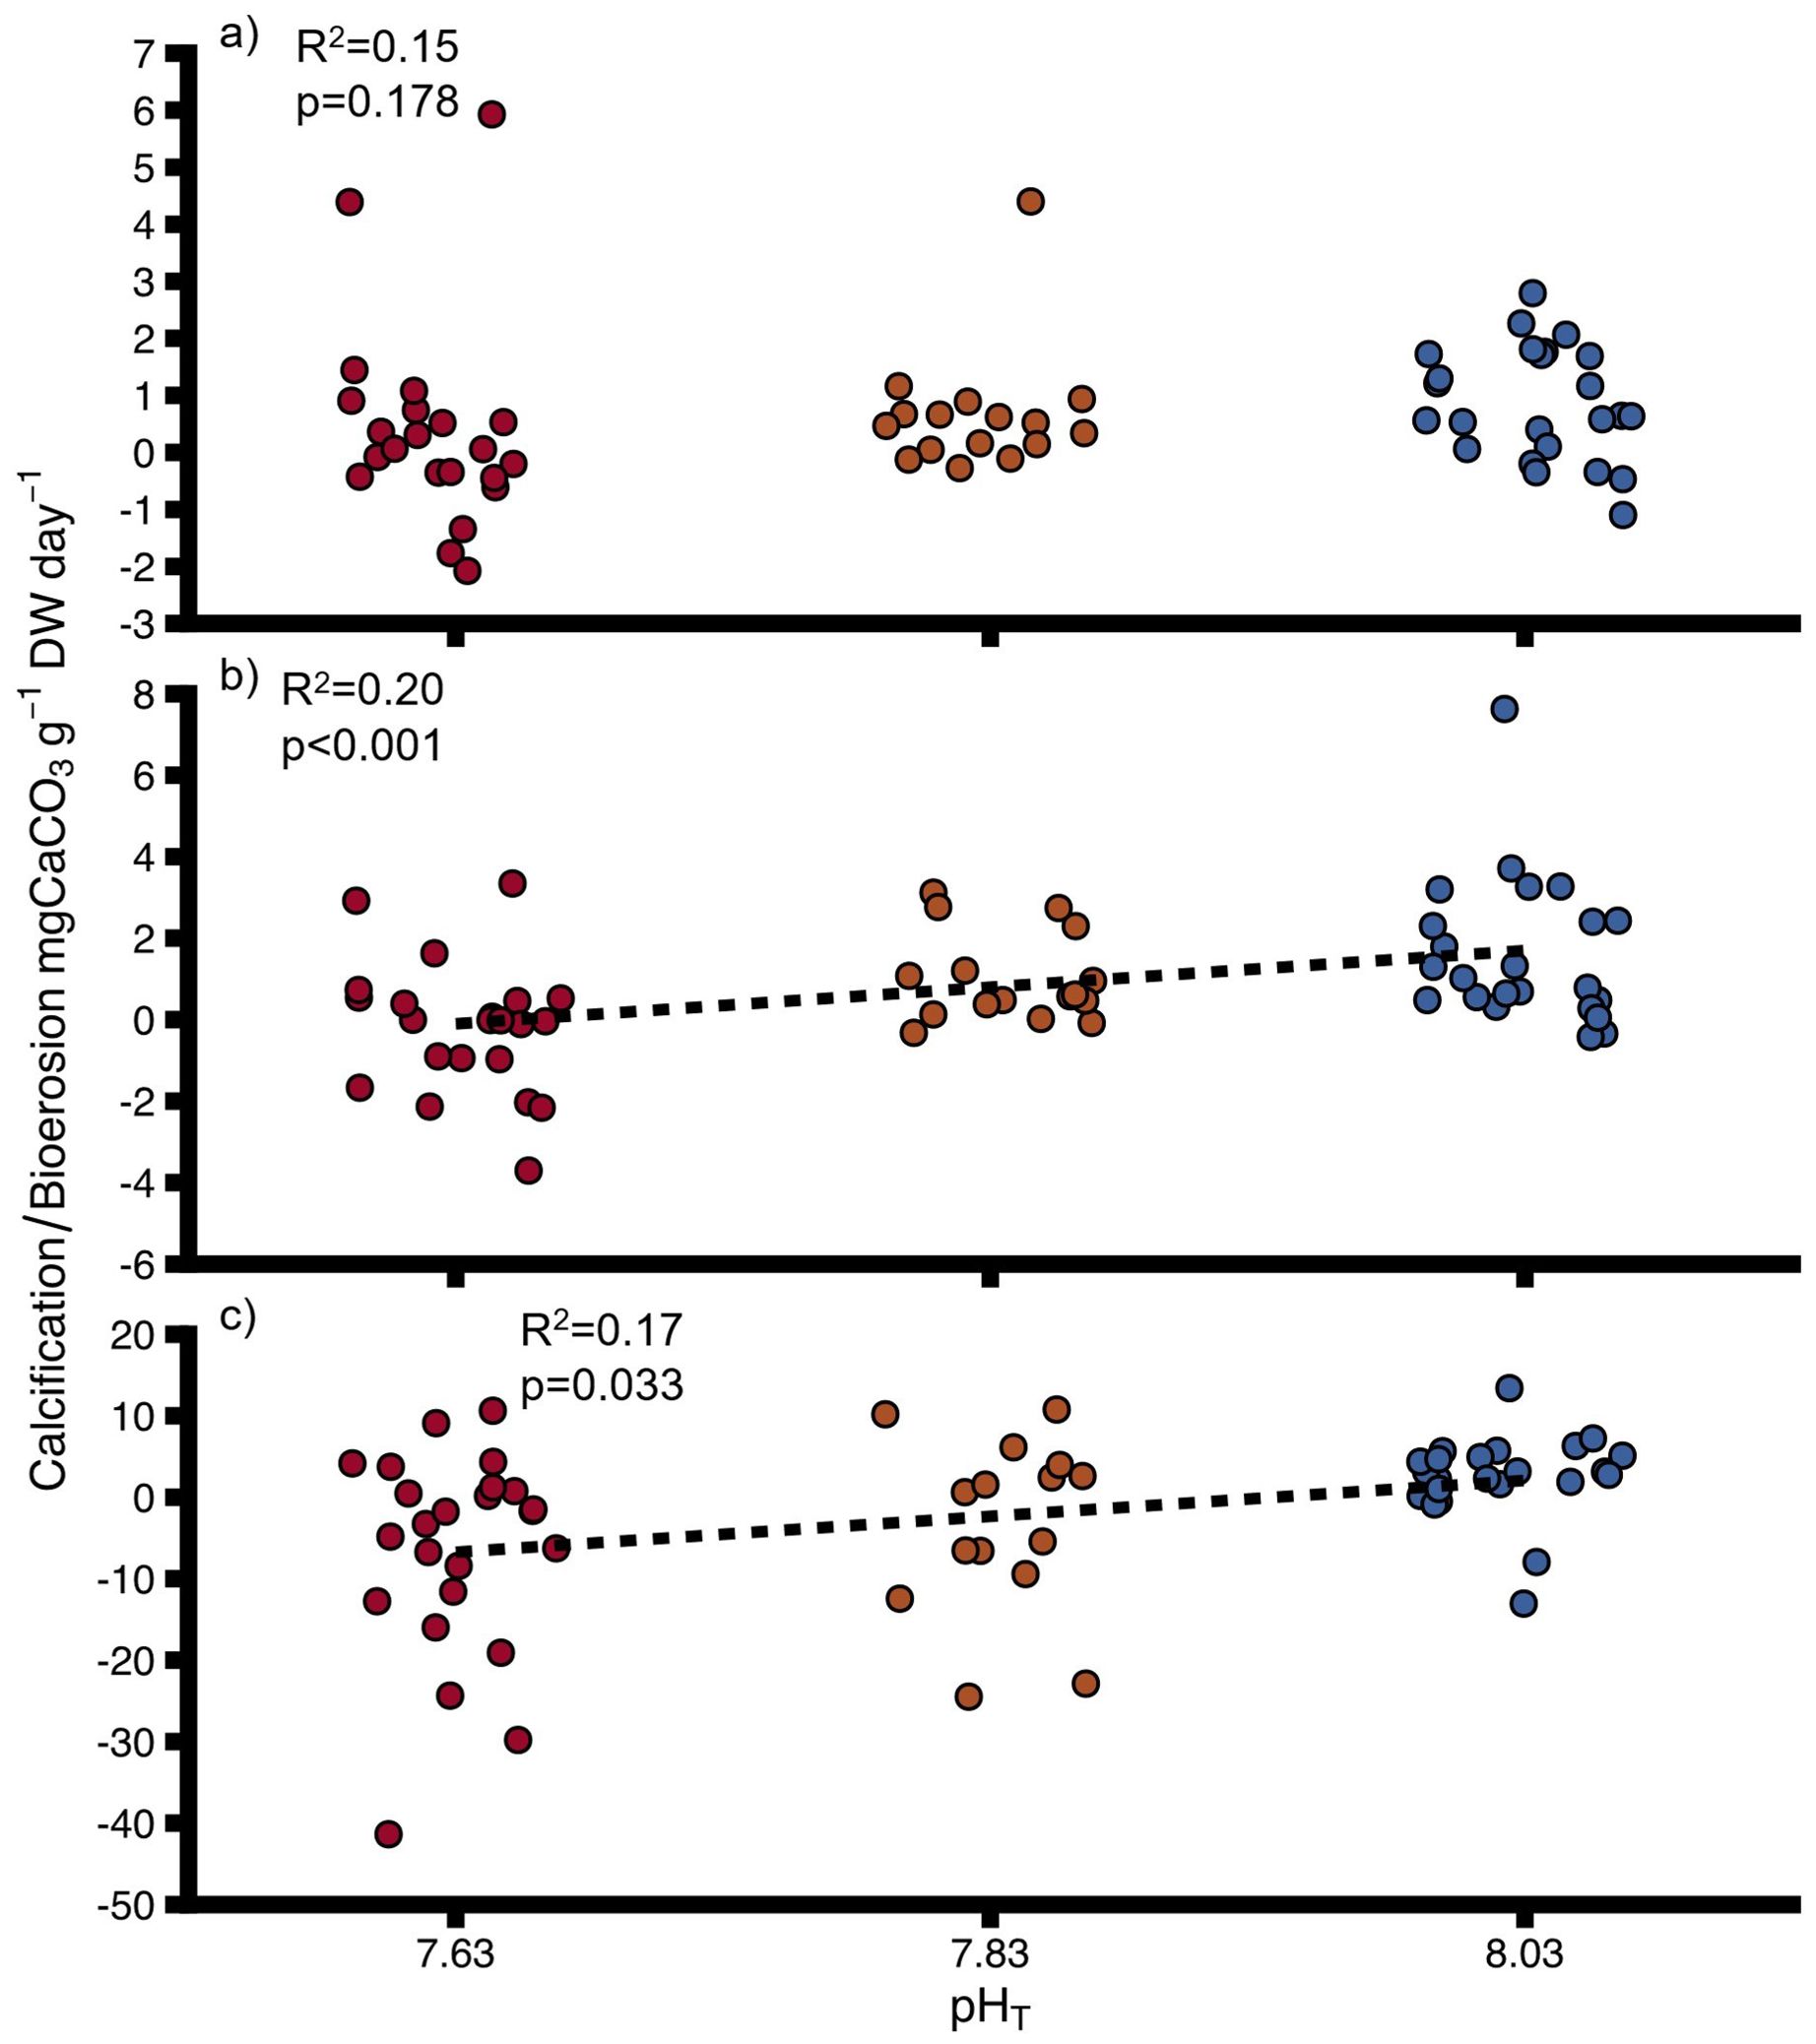
Figure 1. Net calcification (positive values)/net bioerosion rates (negative values) for (A) uninfested oysters, (B) infested oysters, (C) sponges at different pH. DW, dry weight for oysters and ash-free dry weight for sponges. Negative values indicate bioerosion activity, positive values indicate calcification activity. Points show individual values. Colours indicate pH treatment (blue = 8.03, orange = 7.83, red = 7.63). Dashed lines indicate significant trends. Proportions of variation (R2) and p-values were obtained from full linear mixed effect models.
There was no significant difference between calcification of uninfested oysters and infested oysters when separately compared between treatments (Supplementary Table 3) and pH did not significantly affect the calcification rates of uninfested oysters and sponge-infested oysters grouped together (Interactive model, Supplementary Table 4). There was a tendency for a negative effect of sponge infestation on calcification (Interactive model, model significance p = 0.06, Supplementary Table 4). The interaction between decreasing pH and sponge infestation also had a strong tendency to negatively affect calcification rates (model significance p = 0.06, Supplementary Table 4). From pH 8.03 to pH 7.83 the interactive effect was positively antagonistic (less positive than predicted additively) and from pH 8.03 to pH 7.63 the interaction was negatively synergistic (more negative than predicted additively).
3.2 Respiration
Respiration rate was not significantly impacted by pH in uninfested oysters (Figure 2A, Supplementary Table 5), sponge-infested oysters (Figure 2B, Supplementary Table 5) and sponges (Figure 2C, Supplementary Table 5). pH levels did not significantly impact oyster respiration when uninfested and infested oysters were grouped together (Interactive model, Supplementary Table 6). Sponge infestation did not have any effect on respiration rates of oysters (Interactive model, Supplementary Table 6). Additionally, there was no statistical interactive effect of pH and sponge infestation on respiration rates (Supplementary Table 6).
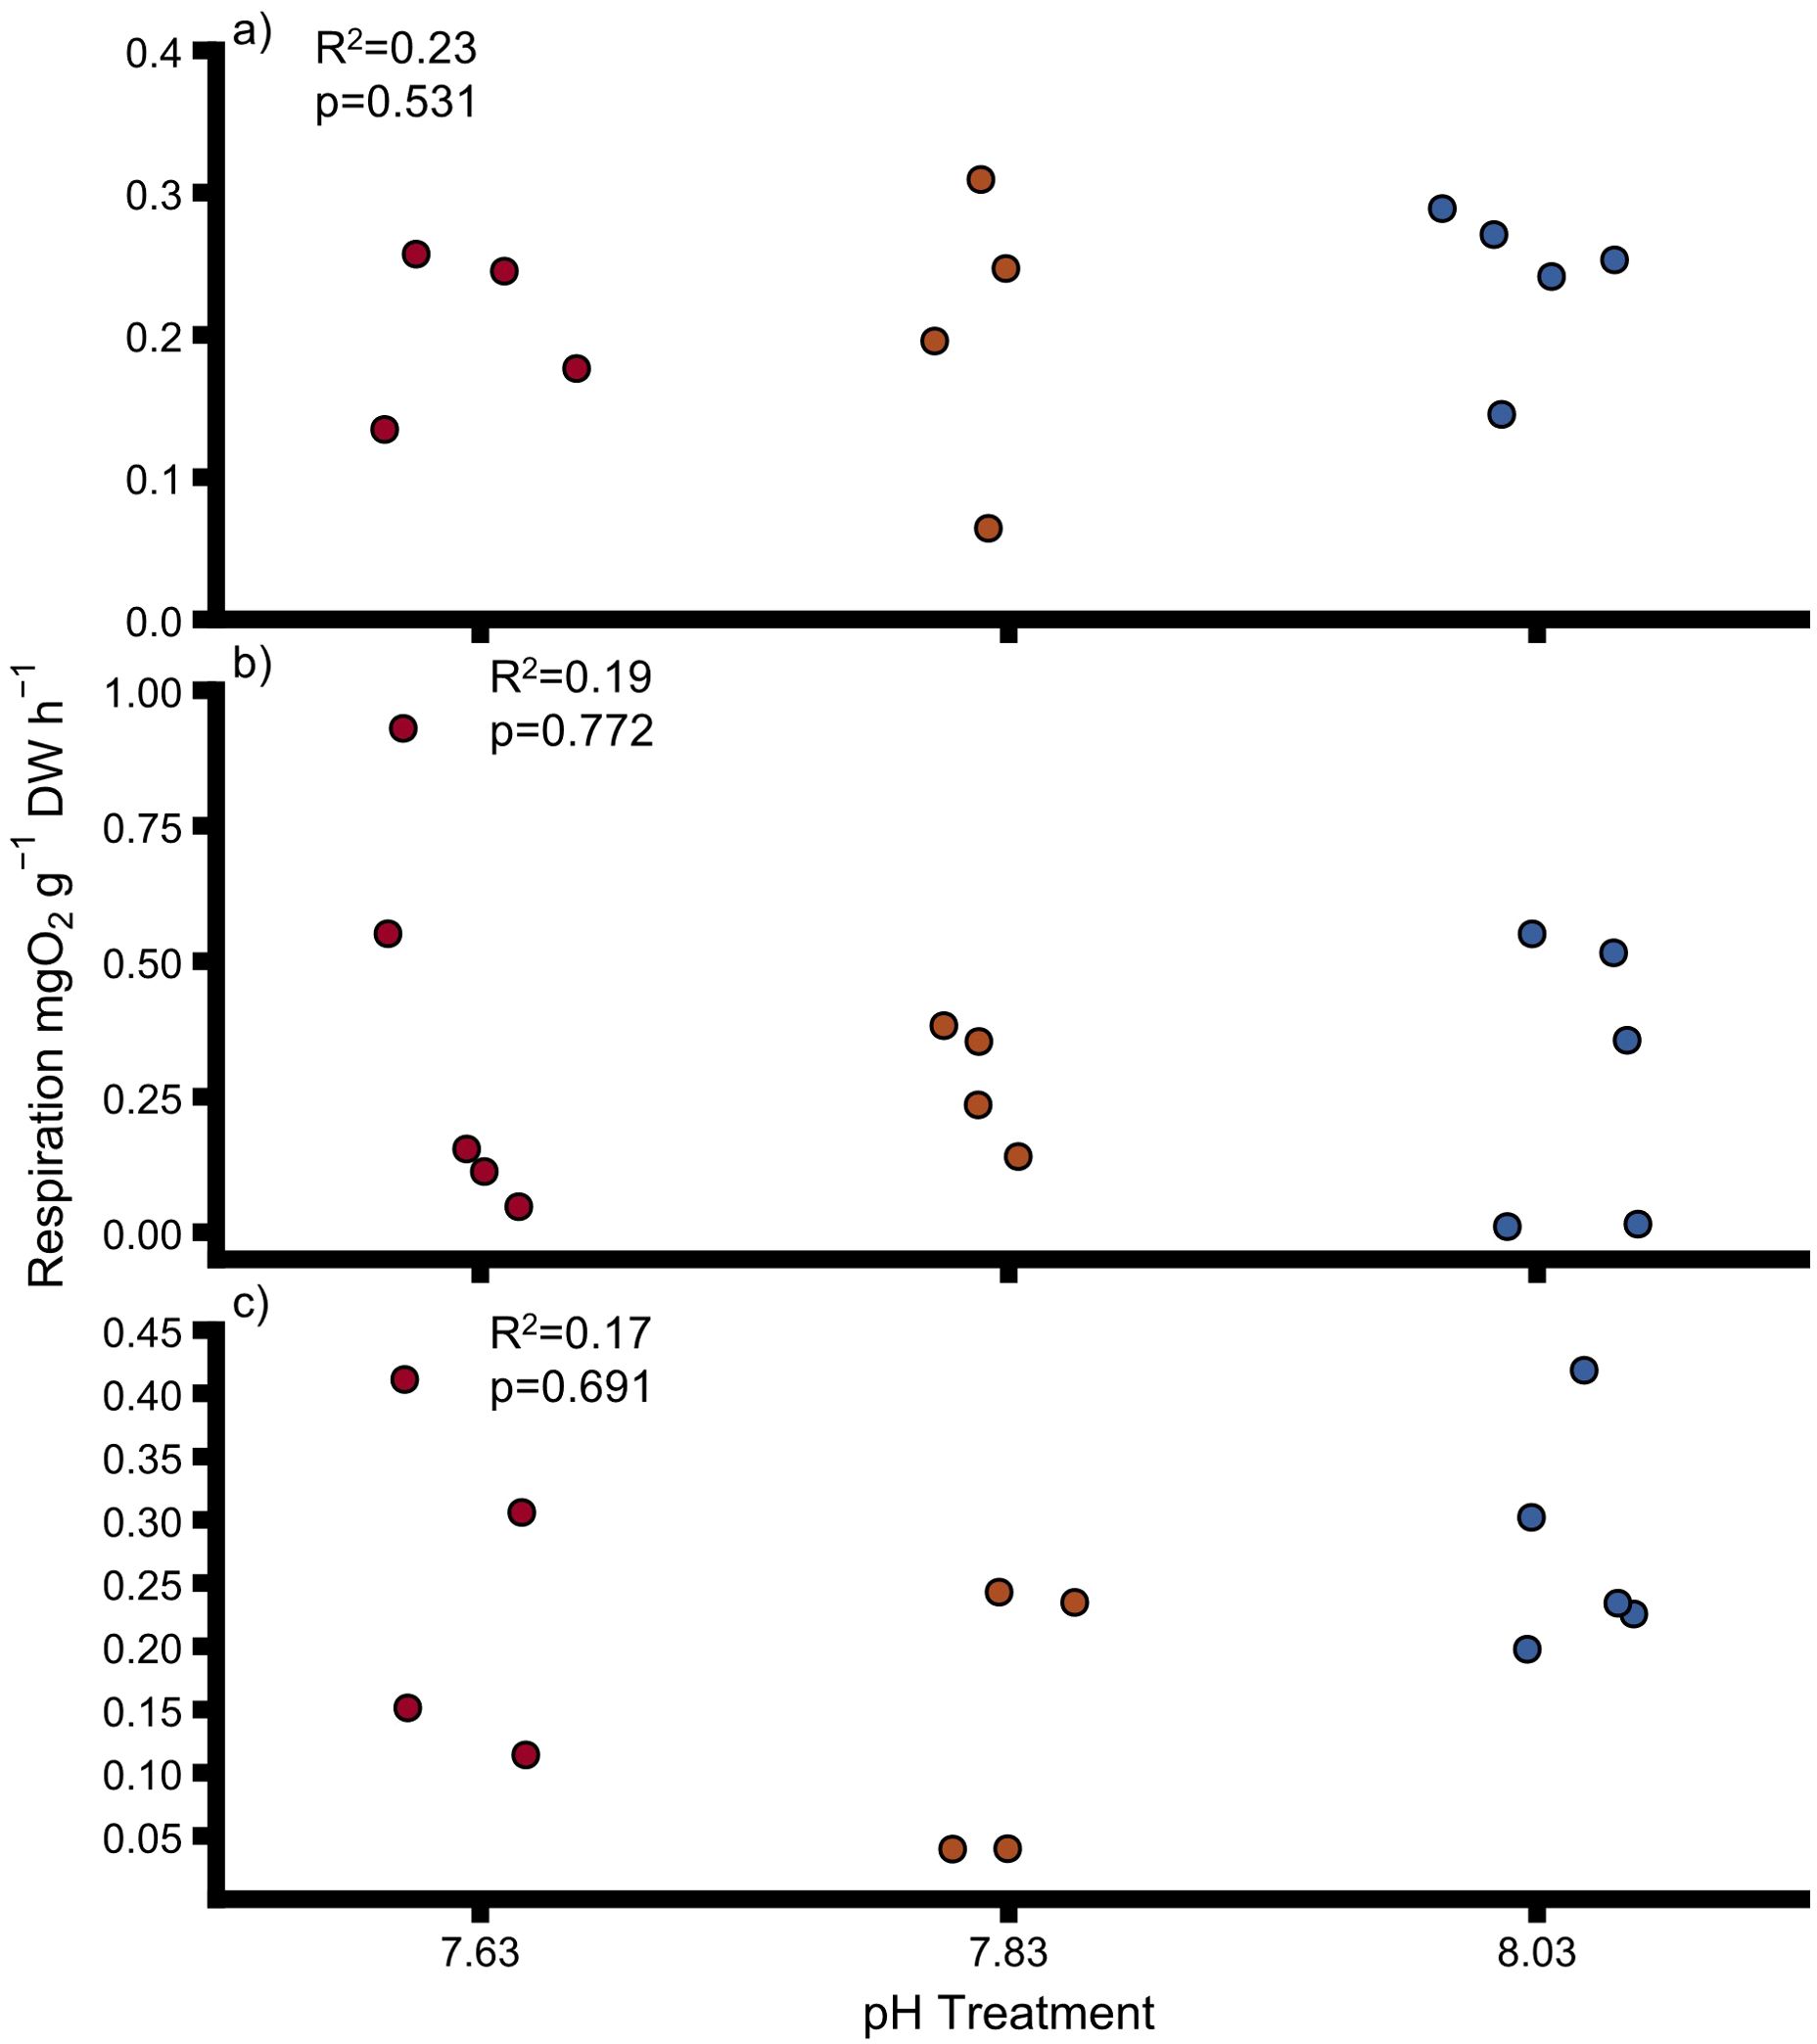
Figure 2. Respiration rates for (A) uninfested oysters, (B) infested oysters, (C) sponges at different pH. Points show individual values. Colours indicate pH treatment (blue = 8.03, orange = 7.83, red = 7.63). DW, dry weight for oysters and ash-free dry weight for sponges. Dashed lines indicate significant trends. Proportions of variation (R2) and p-values were obtained from full linear mixed effect models.
3.3 Clearance rate
Clearance rate of uninfested oysters, infested oysters and sponges was not significantly impacted by pH (Figure 3 and Supplementary Table 7). Oyster clearance rate of particles >2.5 μm varied from 0.51 ± 0.21L g-1 h-1 at pH 8.03 to 0.03 ± 0.05L g-1 h-1 at pH 7.63 and clearance rate of particles 2.5–5 μm varied from 0.50 ± 0.21 L g-1 h-1 (pH 8.03) to 0.04 ± 0.05 L g-1 h-1 (pH 7.63). For the sponges, no positive clearance rate was determined after correction for particle sedimentation in the control chambers. Therefore, we did not correct clearance rates of sponge-infested oysters for possible sponge clearance rate. Decreasing pH had a significant negative effect on clearance rates of all particle sizes of uninfested oysters and sponge-infested oysters grouped together (Interactive model, Supplementary Table 8, Figure 4) and sponge infestation had a significant positive effect on clearance rates (Interactive model, Supplementary Table 8). The interaction of pH and sponge infestation had a significant positive effect on clearance rates of all particle sizes (Supplementary Table 8). The interactive effect was negative antagonistic (less negative than predicted additively).
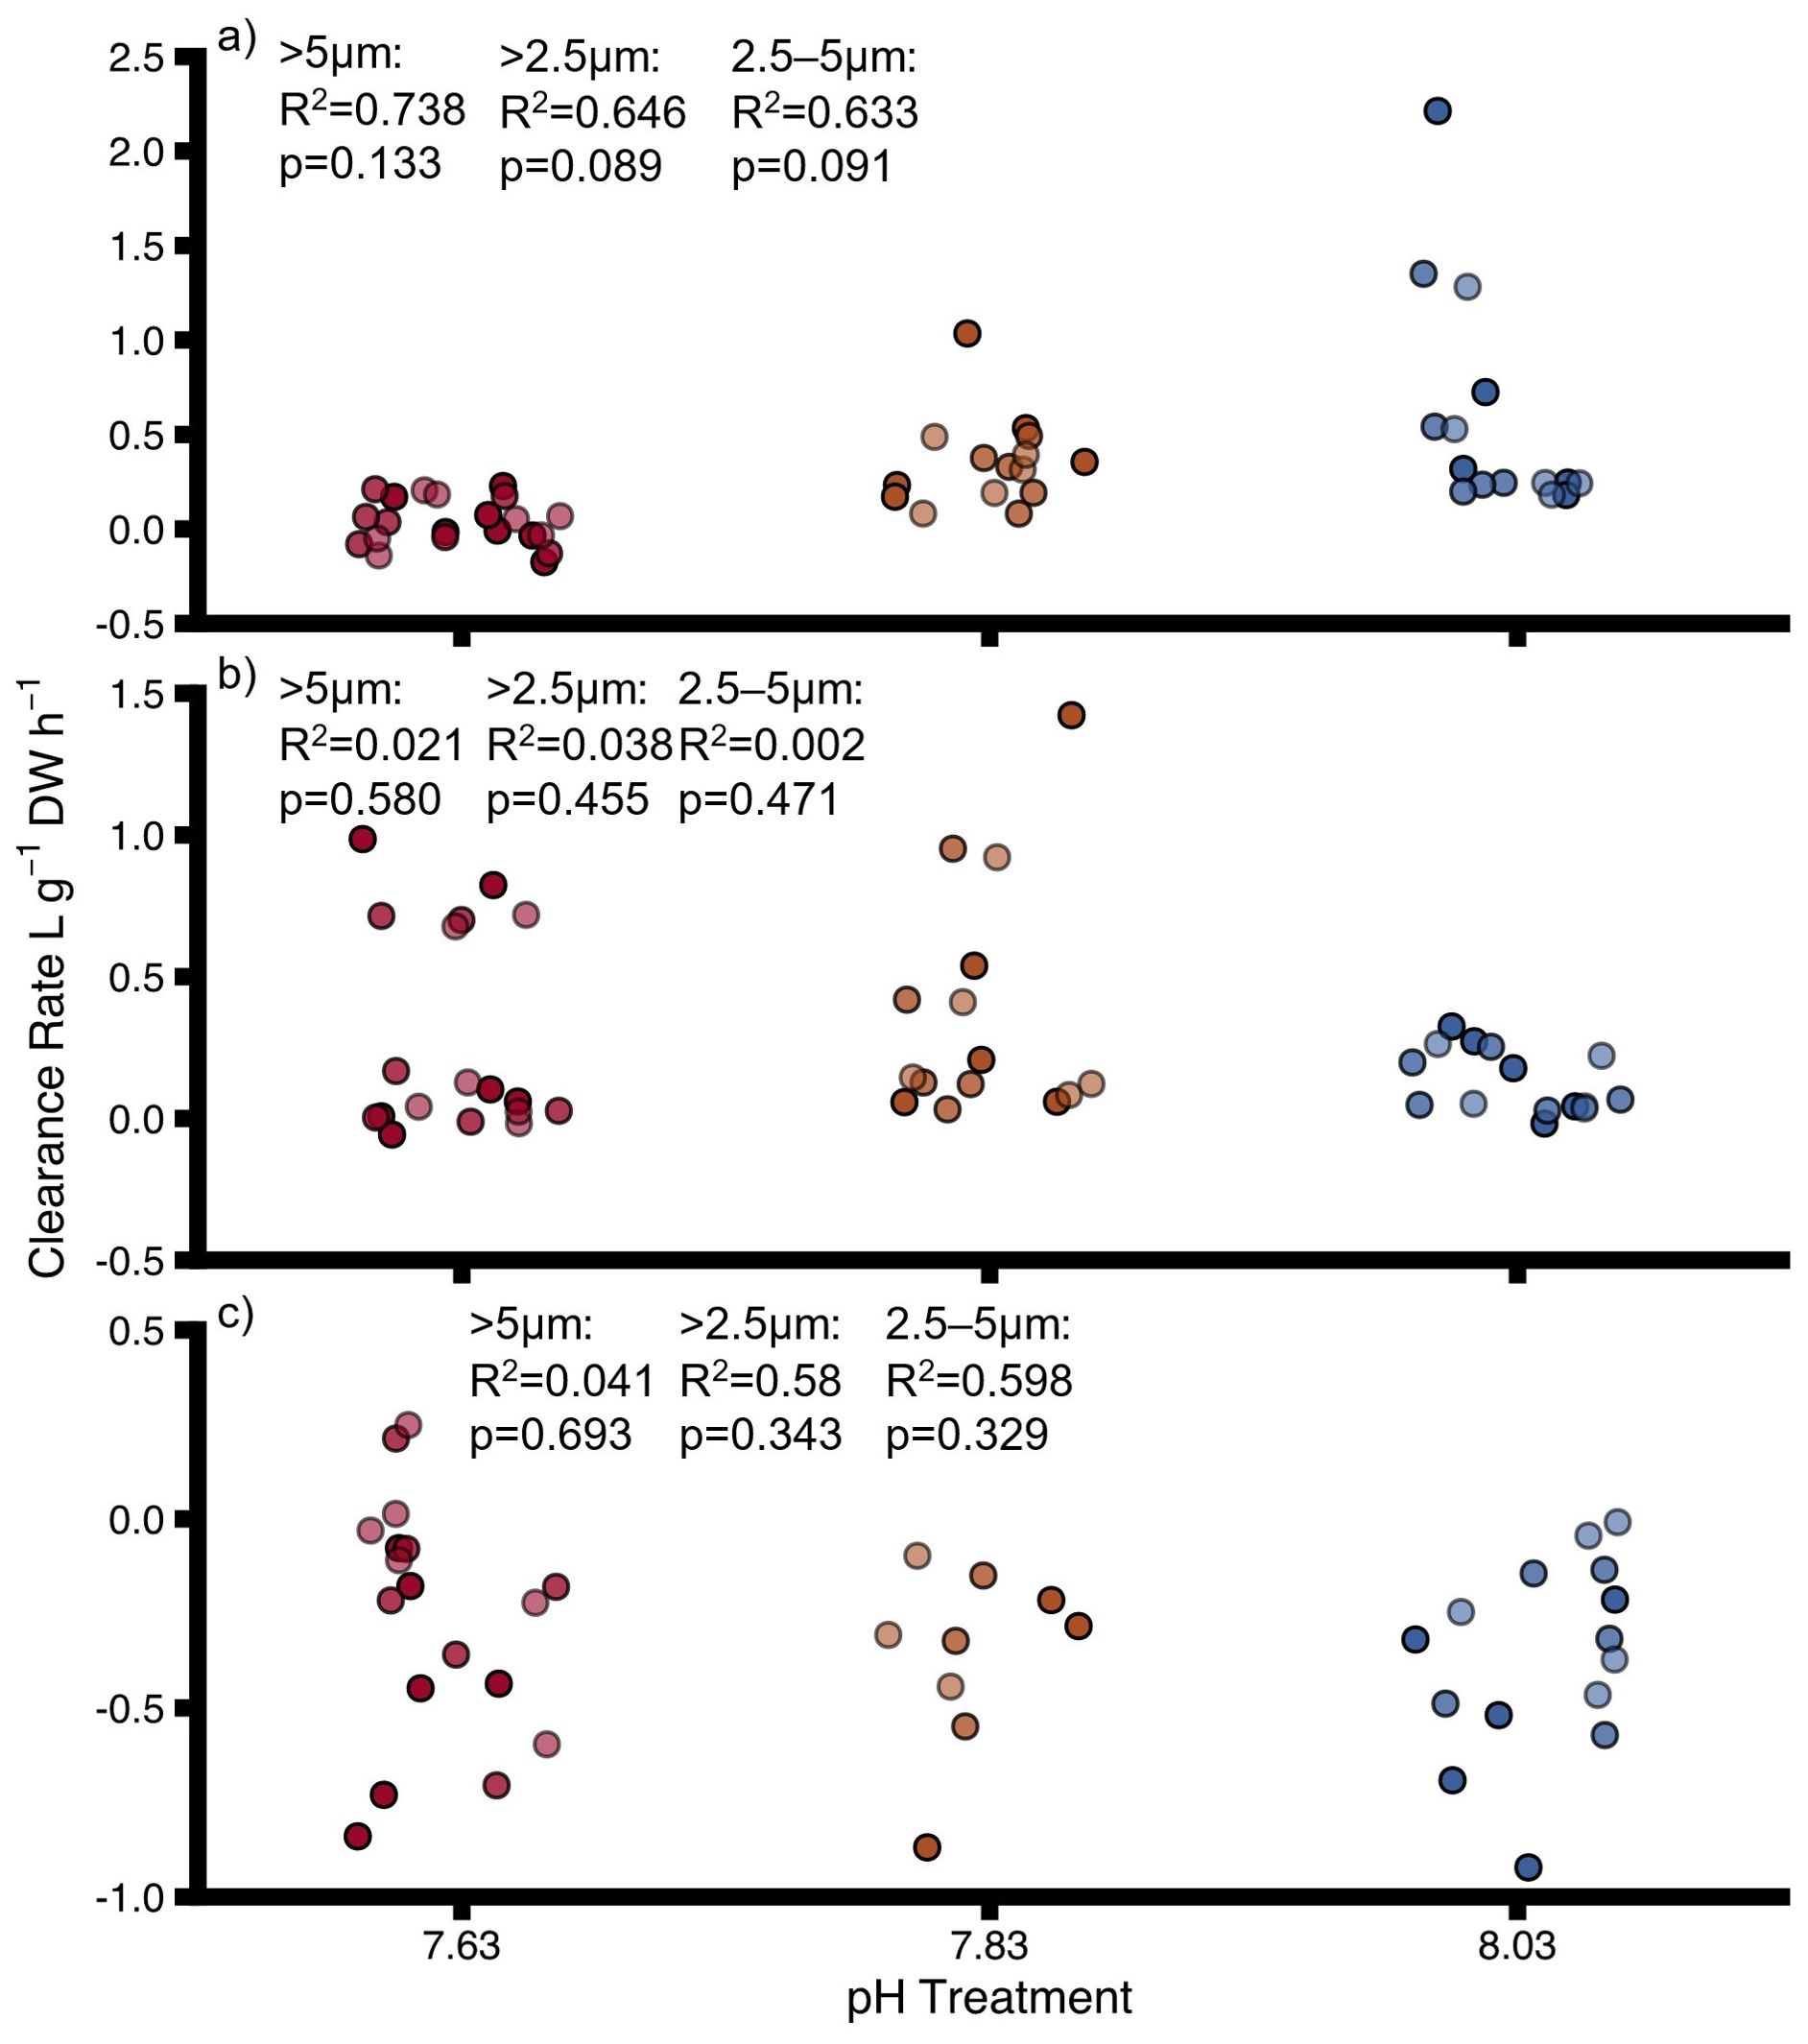
Figure 3. Clearance rates for (A) uninfested oysters, (B) infested oysters, (C) sponges at different pH for different particle size ranges. DW, dry weight for oysters and ash-free dry weight for sponges. Points show individual values. Colours indicate pH treatment (blue = 8.03, orange = 7.83, red = 7.63). The transparency of the colours reflects the particle size range: dark colours = >5–60 μm, medium colours = >2.5–60 μm, light colours = 2.5–5 μm. Proportions of variation (R2) and p-values were obtained from full linear mixed effect models.
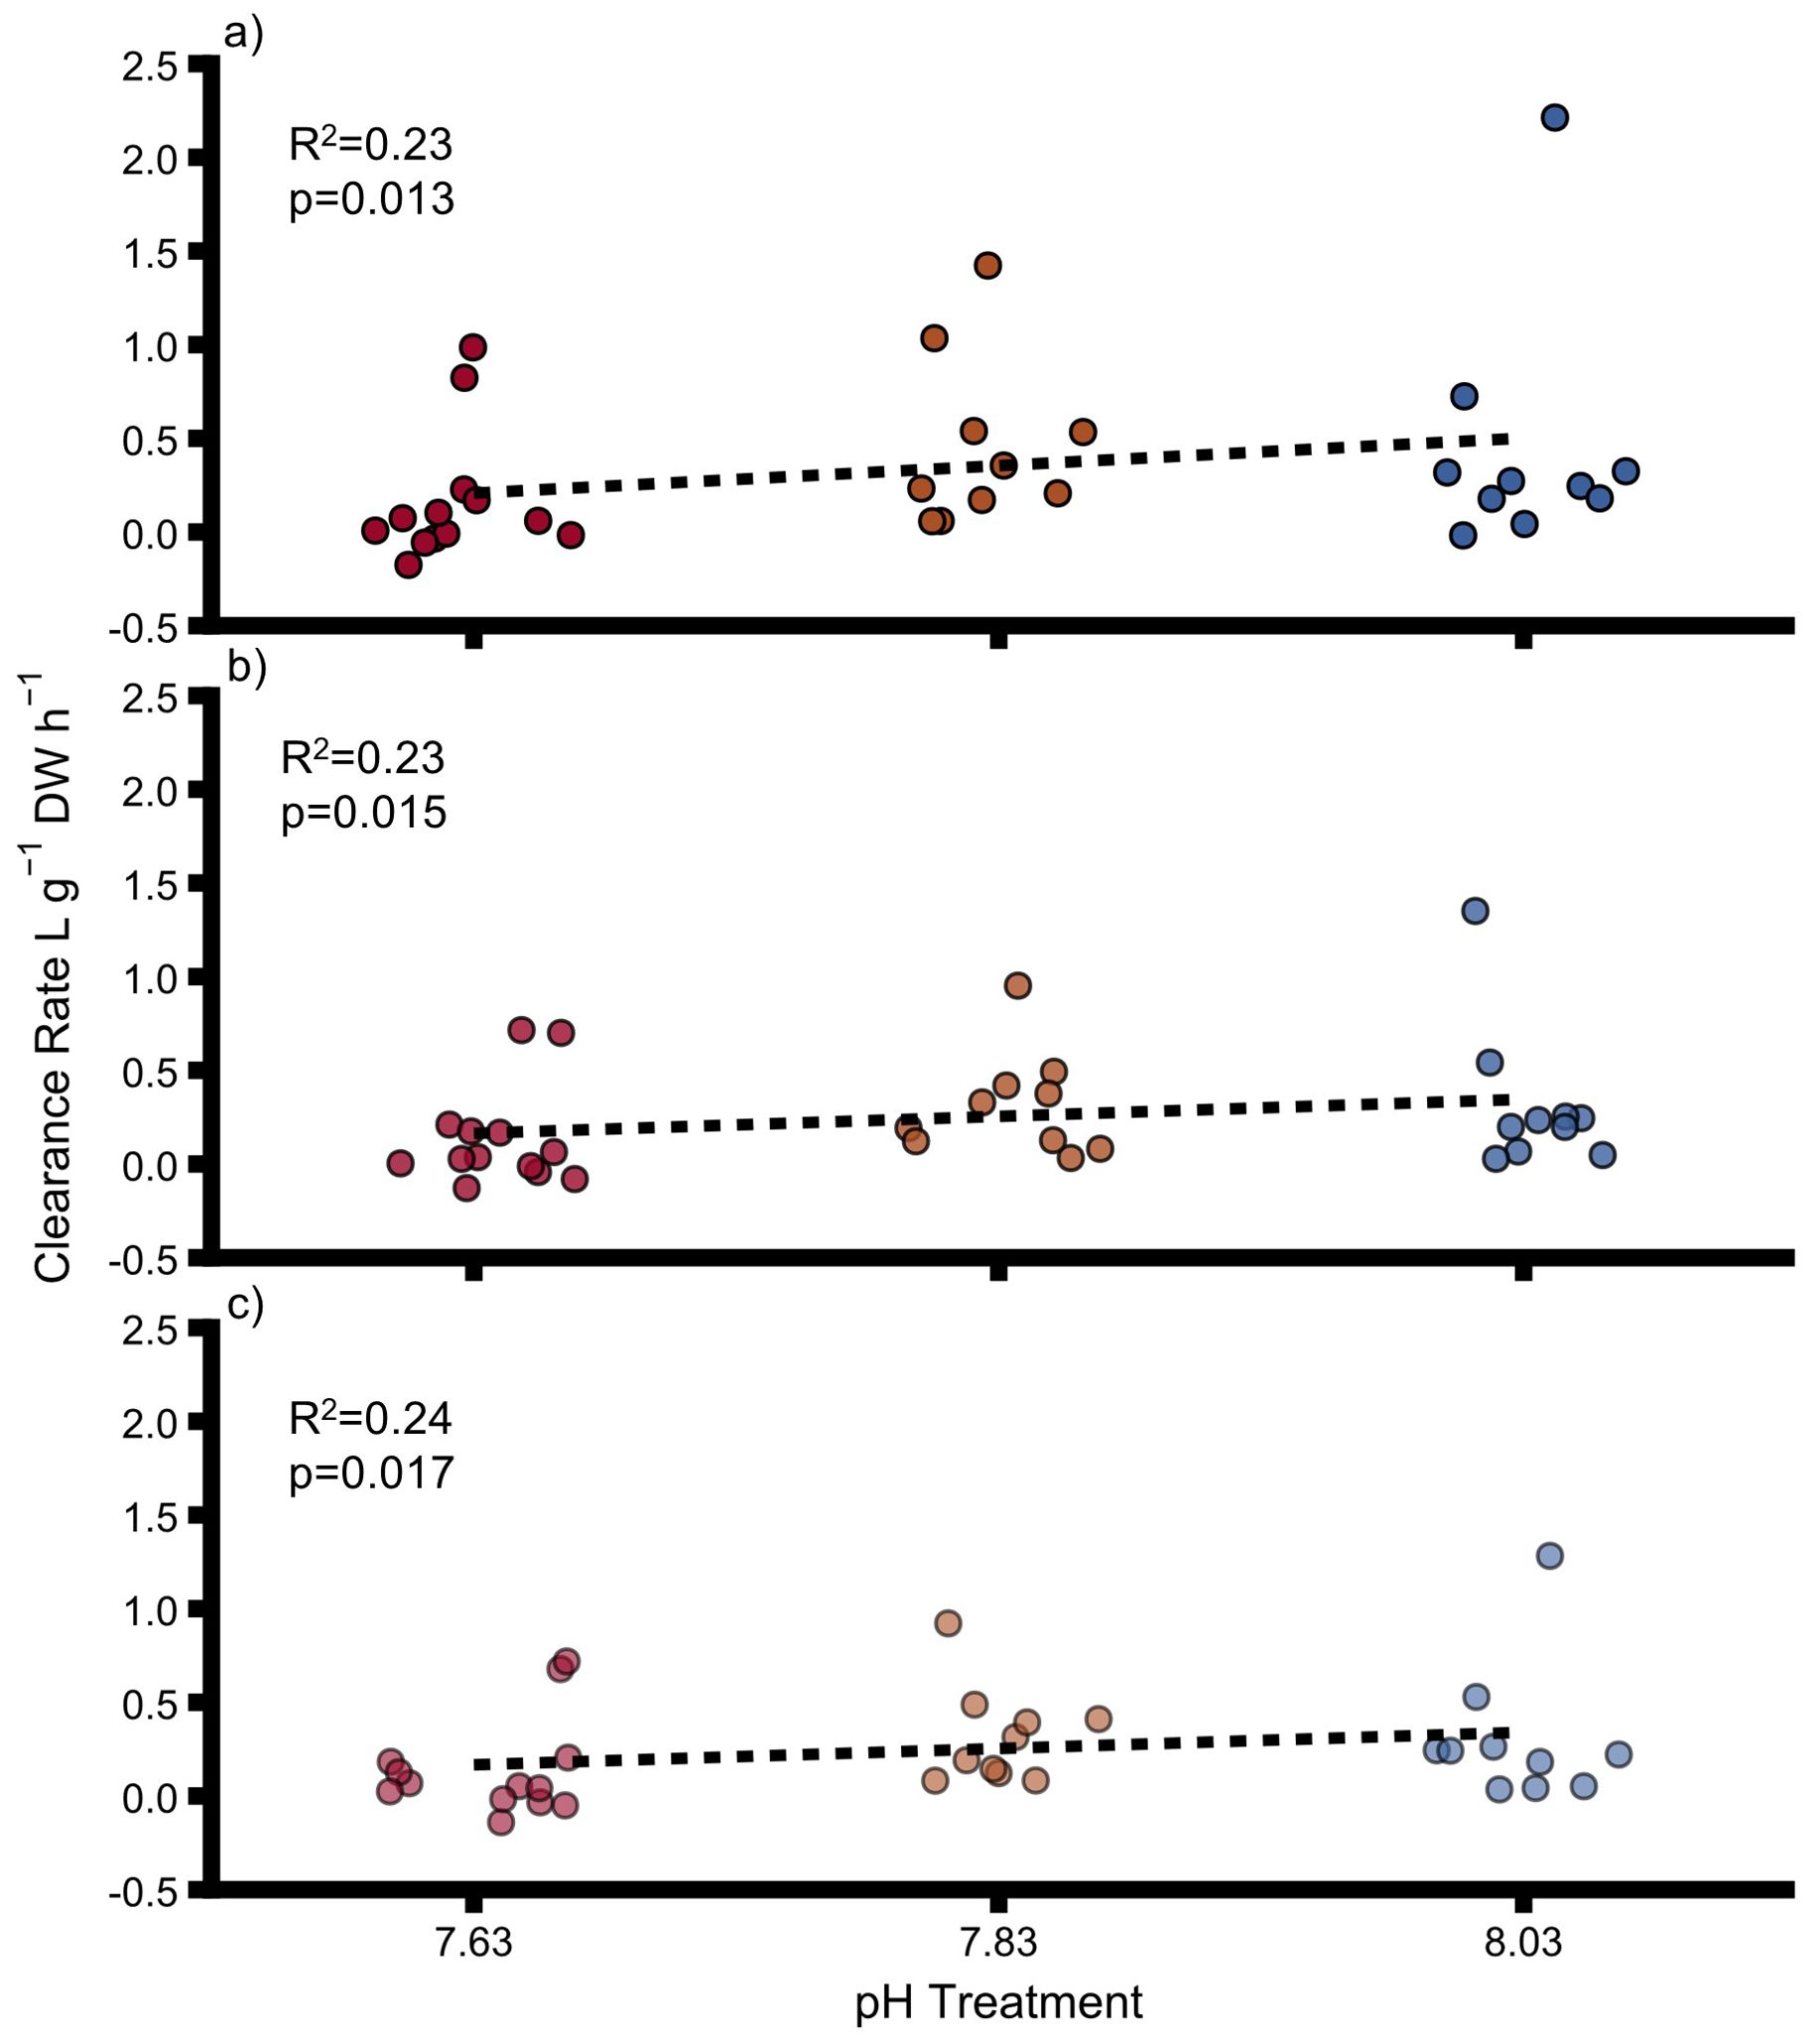
Figure 4. Clearance rates for uninfested and infested oysters at particle size ranges of (A) >5–60 μm (B) >2.5–60 μm and (C) 2.5–5 μm. DW = dry weight for oysters and ash-free dry weight for sponges. Points show individual values. Colours indicate pH treatment (blue = 8.03, orange = 7.83, red = 7.63). The transparency of the colours reflects the particle size range: dark colours = >5–60 μm, medium colours = >2.5–60 μm, light colours = 2.5–5 μm. Proportions of variation (R2) and p-values were obtained from full linear mixed effect models.
3.4 Short-term calcification/chemical bioerosion
Uninfested and sponge-infested oysters seemingly did not calcify (or not enough to be detectable) over the course of the incubations as no net decrease in calcium concentration between start and end of the incubations was detected. The dissolution rate (increase in calcium) of uninfested oysters and sponge-infested oysters was not significantly impacted by pH (Figures 5A, B, Supplementary Table 9) and neither was the chemical bioerosion rate of sponges (Figure 5C, Supplementary Table 9). Decreasing pH had no significant effect on calcification/net dissolution of uninfested oysters and sponge-infested oysters grouped together, and sponge infestation had no effect on calcification/net dissolution when treatments were disregarded (Interactive model, Supplementary Table 10). There was no statistical interactive effect of pH and sponge infestation on calcification/net dissolution rates (Supplementary Table 10). Overall, some of the calculated differences between T0 and Tend of the incubations were not discernible within the uncertainty of the measurement.
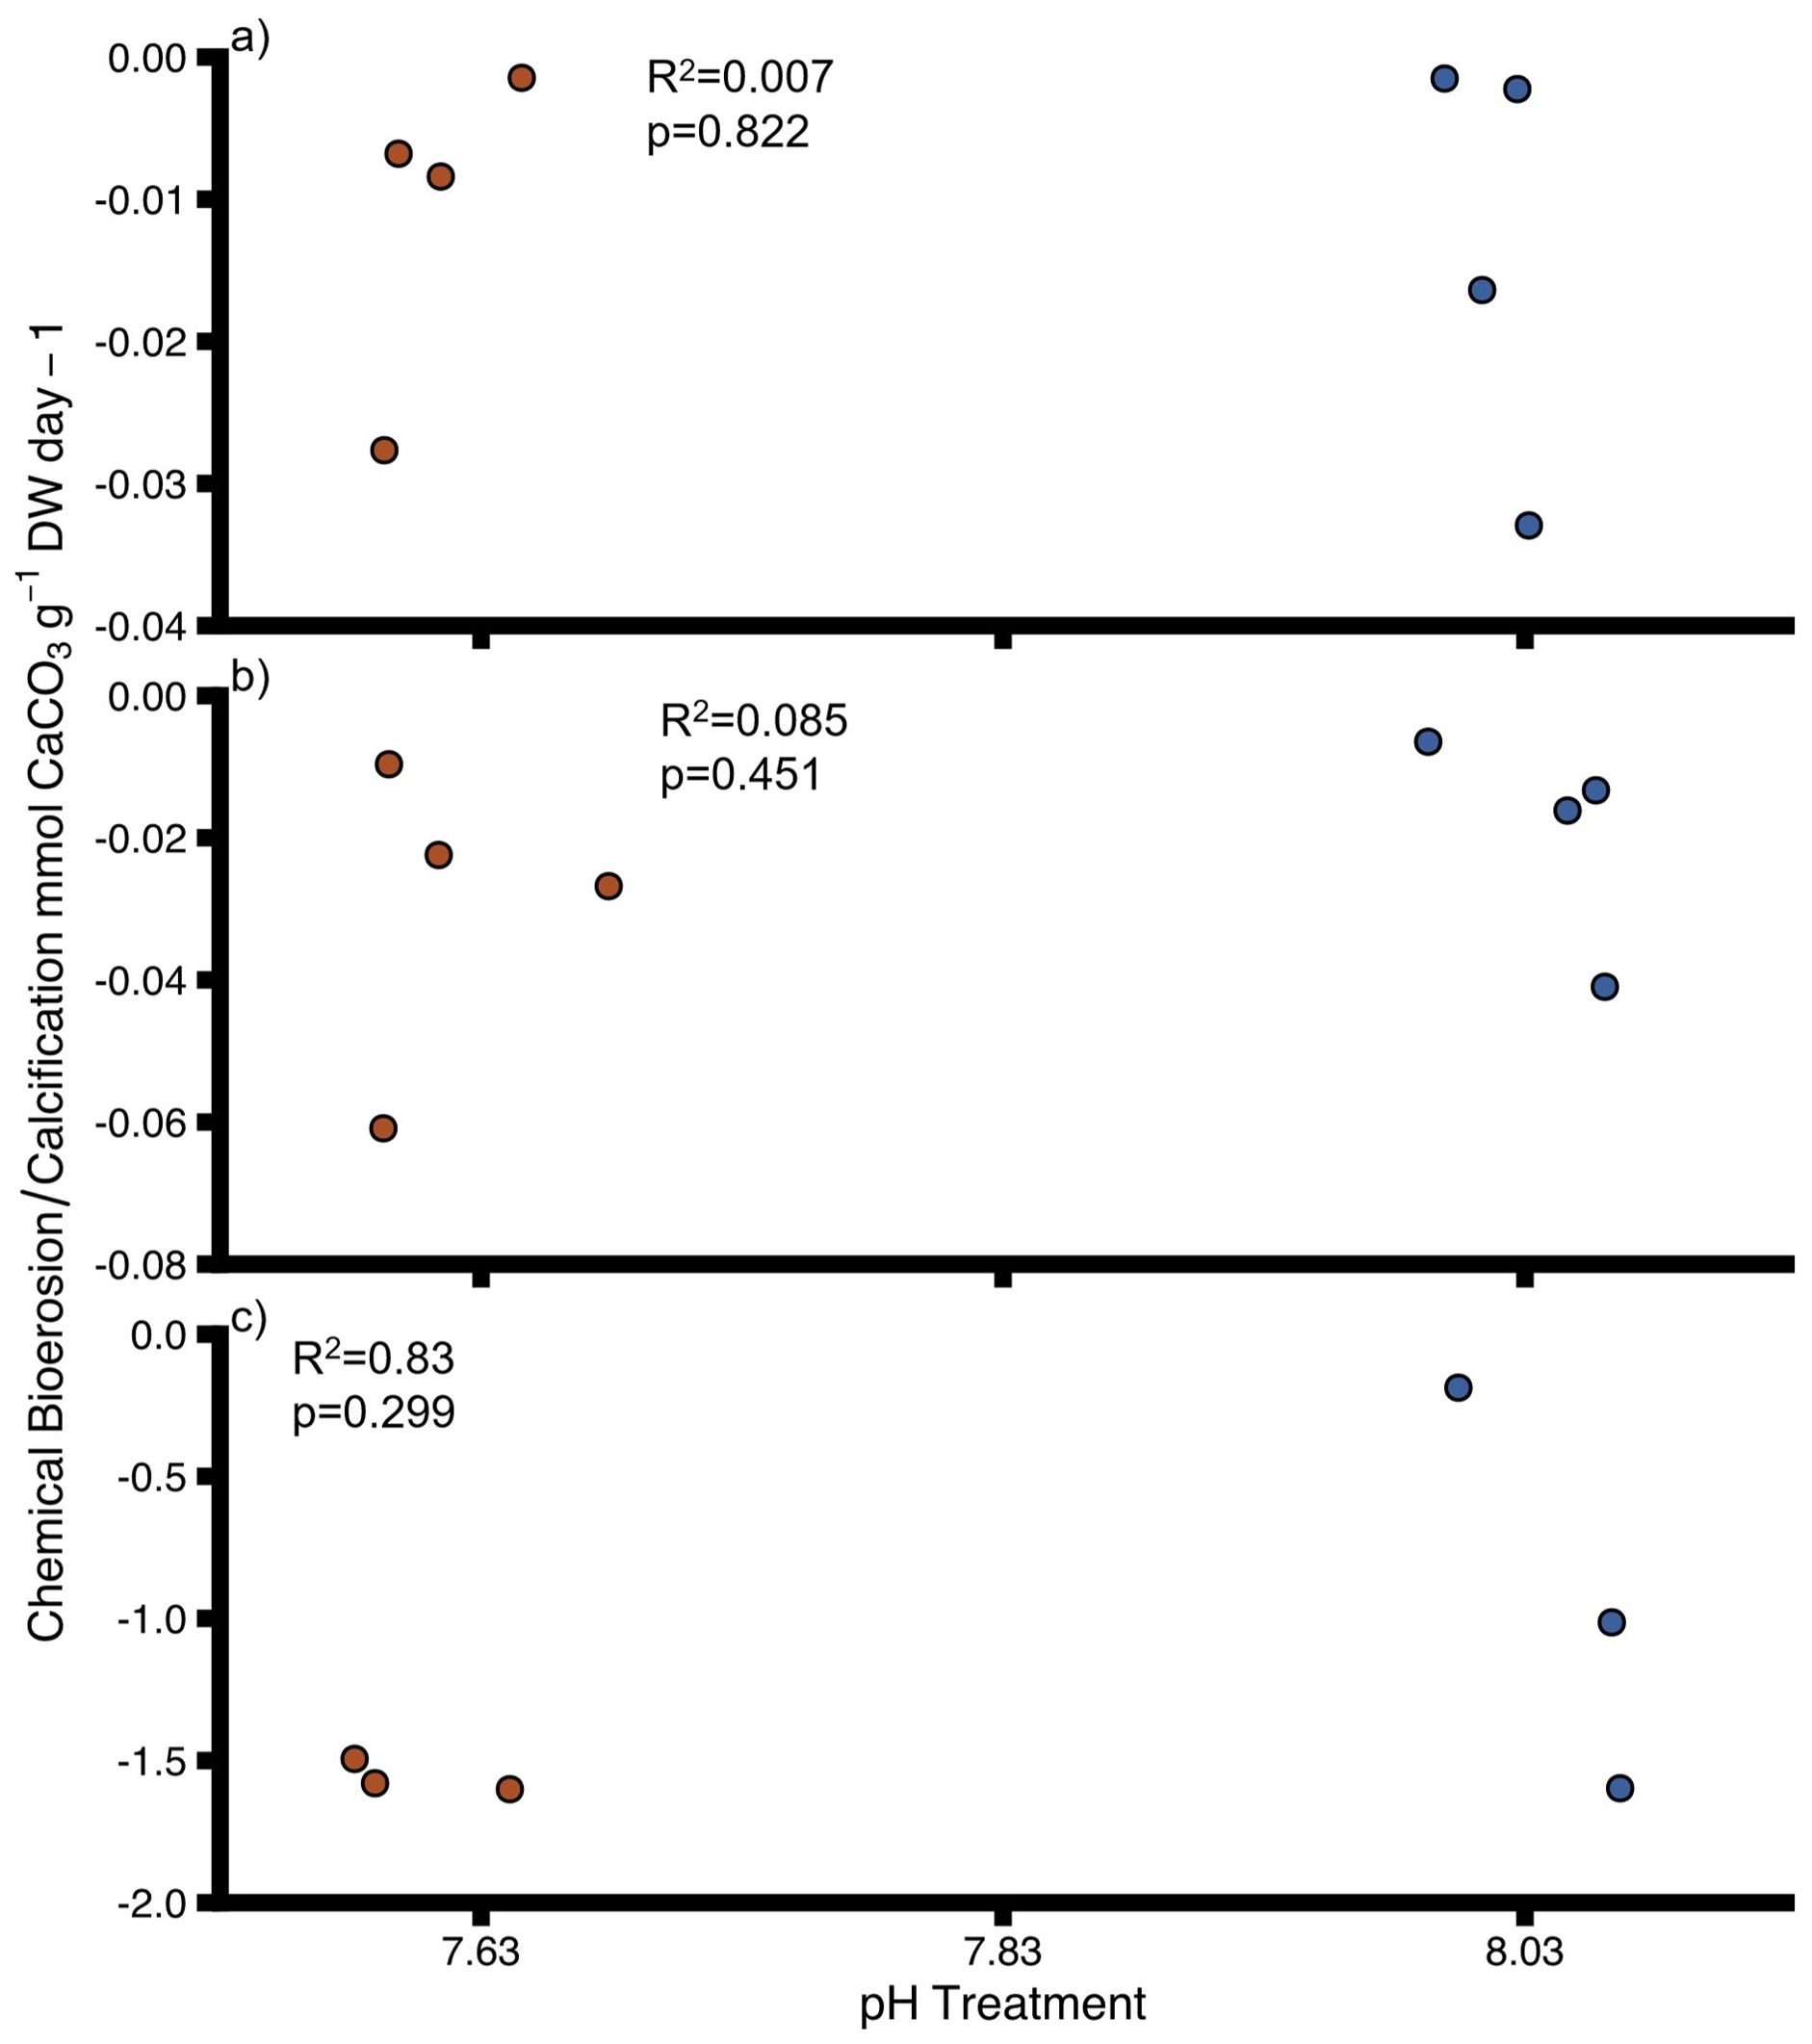
Figure 5. Chemical bioerosion (negative values) and calcification (positive values) for (A) uninfested oysters, (B) infested oysters and (C) sponges at different pH. DW = dry weight for oysters and ash-free dry weight for sponges Points show individual values. Colours indicate pH treatment (blue = 8.03, red = 7.63). Proportions of variation (R2) and p-values were obtained from full linear mixed effect model.
3.5 Oyster condition
Oyster condition was not significantly impacted by pH in uninfested oysters (Figure 6A, Supplementary Table 11) and sponge-infested oysters (Figure 6B, Supplementary Table 11). pH did not significantly impact condition when uninfested and infested oysters were grouped together, and sponge infestation did not have a significant effect when pH treatments were disregarded (Interactive model, Supplementary Table 12). There was also no significant interactive effect of pH and sponge infestation on oyster condition (Supplementary Table 12).
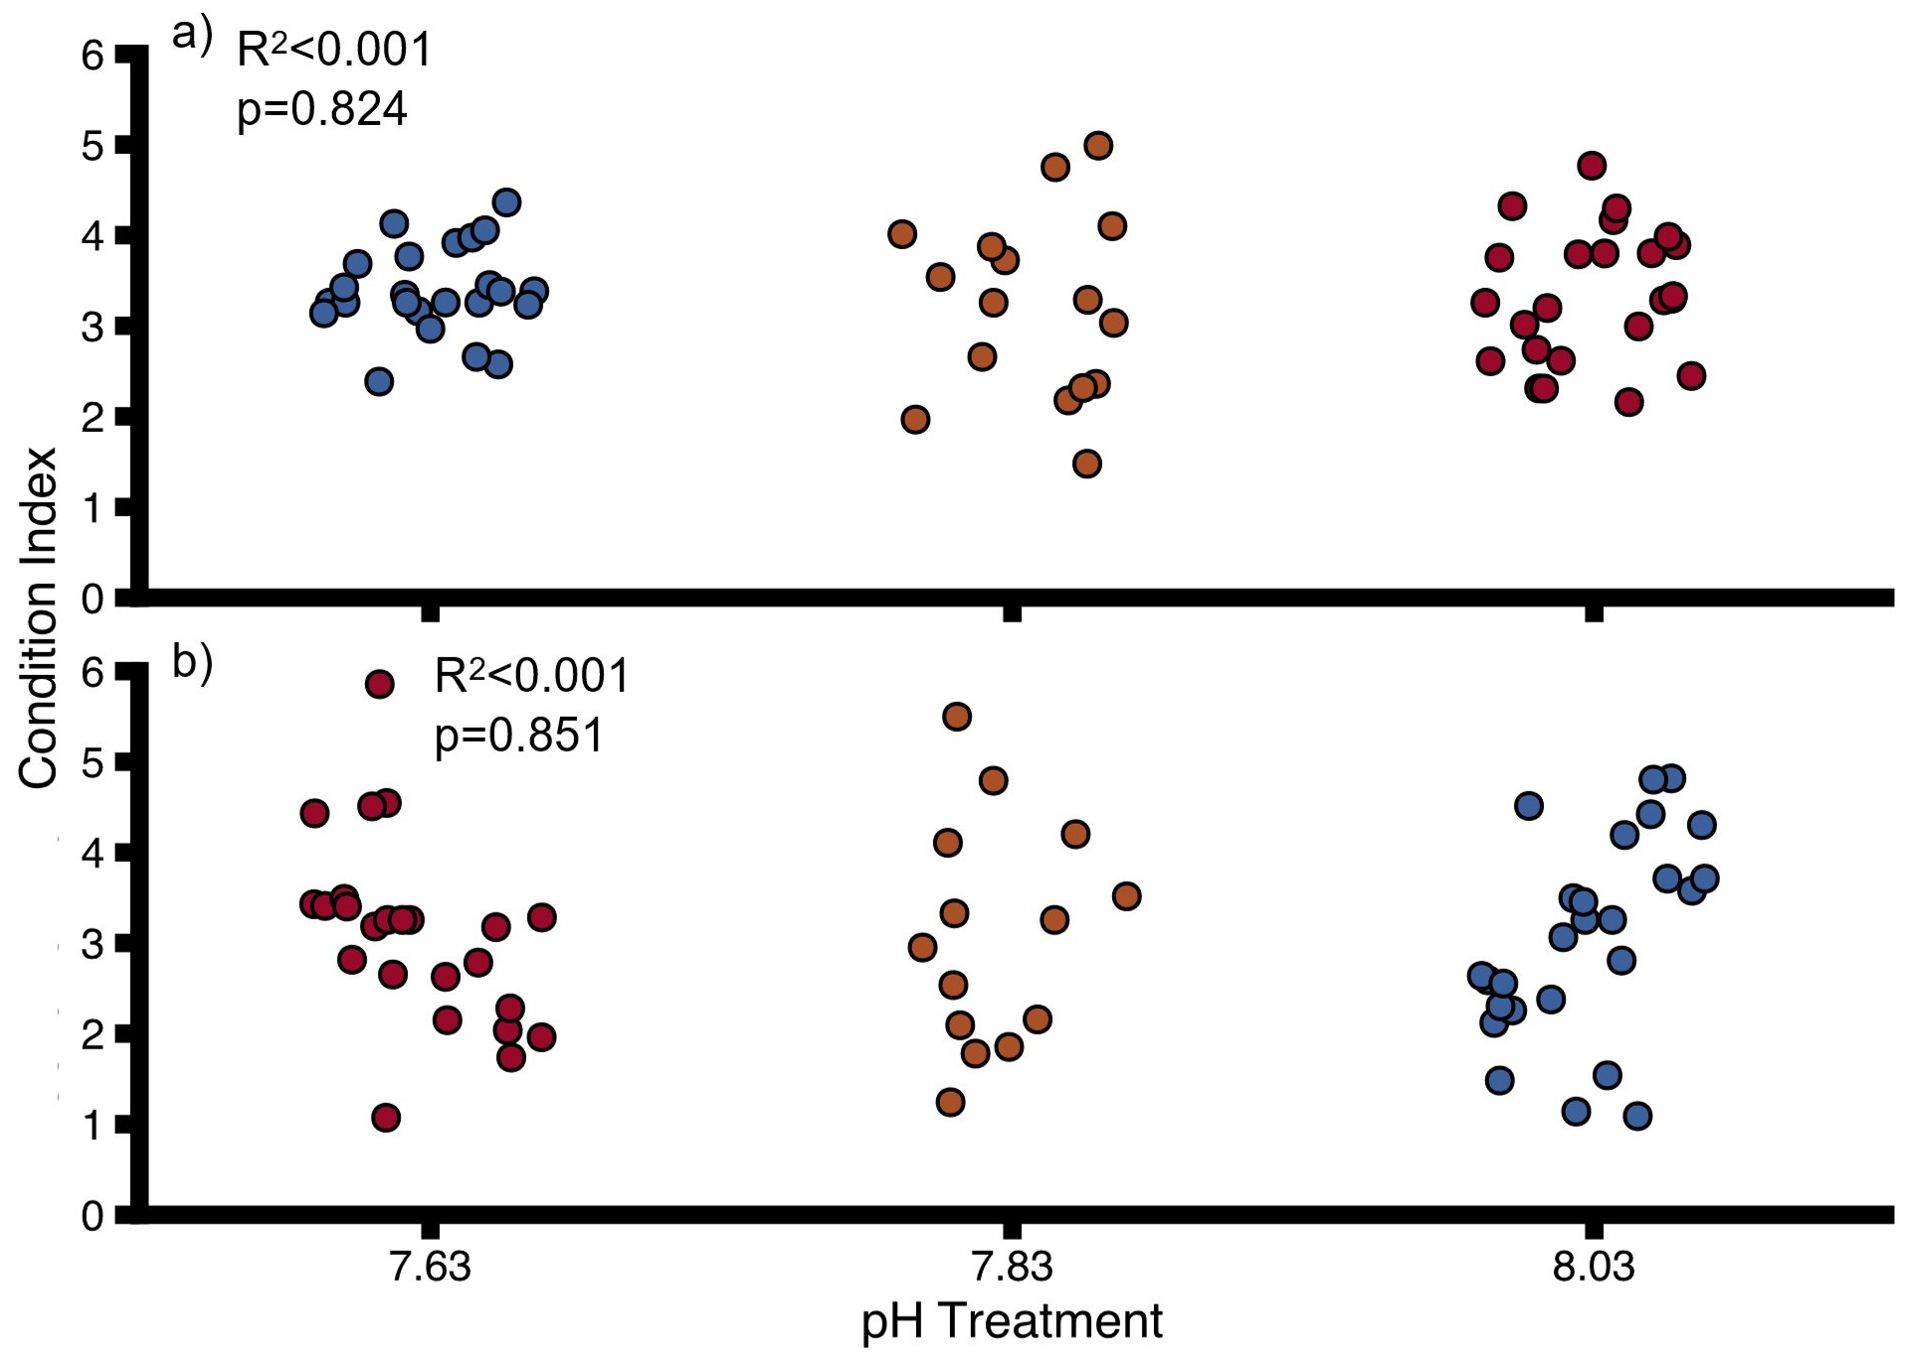
Figure 6. Condition Index for (A) uninfested oysters, (B) infested oysters at different pH. Points show individual values. Colours indicate pH treatment (blue = 8.03, orange = 7.83, red = 7.63). Proportions of variation (R2) and p-values were obtained from full linear mixed effect models.
4 Discussion
Our results showed that pH had no measurable effect on calcification, respiration, clearance rate and condition of uninfested oysters indicating that O. chilensis might be largely unaffected by ocean acidification, opposing our initial hypotheses. Reduced pH caused a significant reduction in calcification in sponge infested oysters. However, respiration, clearance rate and condition were not measurably affected by pH, also opposing our initial hypotheses. The reduction in calcification rates of sponge infested oysters is likely related to the observed positive effect of pH on bioerosion rate of Cliona sp. as initially hypothesised. Respiration rate and clearance rate of Cliona sp. was not measurably affected by reduced pH, which could indicate that Cliona sp. will not be strongly affected by future ocean acidification. Without measurable impacts of pH on Cliona sp., gross bioerosion is likely to increase under ocean acidification. Therefore, oysters and other marine shelled molluscs infested with Cliona sp. will likely be especially vulnerable to future decreases in seawater pH.
4.1 Effect of pH and sponge infestation on oyster physiology
The net calcification rate of infested oysters significantly decreased with declining pH and turned into net dissolution at pH 7.63. The observed net dissolution of infested oysters suggests that at low pH, sponge bioerosion outpaces calcification, which is supported by the strong trend (p = 0.06) for sponge infestation to decrease calcification. Similarly, in an earlier study, Cliona sp. infestation significantly reduced calcification of Crassostrea virginica (McNally, 2022). Sponge infestation may not have a significant negative effect (p = 0.06) on calcification in our study because shell repair, triggered when the boring organism breaks through to the inner valve surface of the oyster (Thomas, 1979; Hoeksema, 1983; Handley, 1998), counteracted bioerosion by the sponge. In comparison large (old) adult oysters naturally have low calcification rates (Kraeuter et al., 2007; Burchell et al., 2013). Together, low calcification rates of uninfested oysters and increased shell repair in infested oyster could explain the lack of significant difference between calcification of uninfested and infested oysters when compared per treatment. While we visually assessed the level of sponge infestation to be high in infested oysters, it is unclear whether the sponge broke through to the inner surface to trigger a response in all samples.
Increased shell repair would increase the energy demand in infested oysters (Palmer, 1992; Handley, 1998). An increased energy demand of sponge-infested oysters could explain why sponge infestation had a significant positive effect on clearance rate (Interactive model). In C. virginica, clearance rates were unaffected by sponge infestation while condition and growth were significantly reduced (Carroll et al., 2021). In contrast, respiration and condition were unaffected by sponge infestation and pH in our study. Therefore, the increase in clearance rate (increased energy assimilation) might represent a coping mechanism for sponge-infested oysters which allows the maintenance of other metabolic processes (see Lannig et al., 2010), while meeting energetic demands of shell repair.
Surprisingly, net calcification of uninfested oysters was not significantly impacted by pH, even though reduced pH significantly affected net calcification in other oyster species. One explanation for the differing results could be the smaller range of ocean acidification/pH treatments (pCO2 from 475.0–1151.7 μatm or pCO2 482.6–1170.3 ppm) used in our study compared to in others (Magallana gigas, pCO2 421–2351 ppm: Gazeau et al., 2007; C. virginica, pCO2 280–2856 ppm: Ries et al., 2009; C. virgnicia, pCO2 380–3500 μatm: Beniash et al., 2010; Dickinson et al., 2012). For example, there was a tendency (p< 0.10) for calcification of C. virginica to decline from pH 7.8 to ~7.0, but a tipping point was identified below pH 6.98, after which net calcification drastically decreased with pH (p< 0.01) (Lutier et al., 2022). Therefore, there is a possibility that the pH reduction used in our study was not strong enough to significantly affect calcification of O. chilensis. O. chilensis calcification may thus remain unaffected by seawater pH values predicted for the end of the century. Nevertheless, the calcification rate of uninfested oysters at pH 7.63 was ~half of the calcification rate at pH 8.03 indicating that the variability between individual samples within treatments might have hindered the detection of a significant effect.
Individual variability likely also hindered the detection of a significant effect of pH on average clearance rate of uninfested oysters which was reduced by 82–96% between the highest and lowest pH treatment. Reduction of clearance rate can be a mechanism to reduce contact of adverse seawater pH with internal tissues (Rastrick et al., 2018), but reduced clearance rate could also lead to a decline in the energy available for calcification. The interactive model showed that pH had a negative effect on clearance rate of uninfested and infested oysters combined. The lack of an impact on condition could indicate that oysters reduced calcification as a trade-off for reduced clearance rates instead of reducing other metabolic processes, such as somatic growth. Similarly, M. gigas reduced clearance rates by ~40% from 400 ppm to 750 ppm, while condition and standard metabolic rate were unaffected (Lemasson et al., 2018). The CI of sponge infested oysters in our study could have been slightly positively inflated due to reduced shell weight and thus could have been affected by differential bioerosion rates in treatments. Nevertheless, sponge infestation and pH also had no impact on the condition of C. virginica (McNally, 2022) and condition was also not affected by pH in uninfested oysters in this study.
4.2 Interactive effect of pH and sponge infestation on oysters
pH and sponge infestation had a near but not significant interactive effect (p = 0.06) on oyster calcification in this study. By contrast, in other oysters (such as C. virginica) such interactive effects of pH and sponge infestation have not been found (McNally, 2022). Here, any interaction seems to be occurring across a non-linear antagonistic gradient that slowly reverses as pH declines. pH and sponge infestation first seem to have a slightly positive effect, due to higher calcification rates of sponge-infested oysters at pH 8.03 and pH 7.83 compared to uninfested oysters. However, the average net dissolution of infested oysters at pH 7.63 suggests that at this pH, both factors were interacting to have a more negative effect than the simple addition of both effects (negative synergistic, definitions following Piggott et al., 2015). Simultaneously, the interaction of sponge infestation with decreasing pH had a significant negative antagonistic (i.e., less negative than negative effects of both added together) effect on clearance rate of oysters. Infested oysters might be able to reduce negative effects of sponge infestation on calcification by increasing clearance rates, shown by positive calcification rate and increased clearance rate at pH 7.83. Further, the slight reduction in average clearance rate of sponge-infested oysters at pH 7.63 could reflect the increased need to avoid internal tissue exposure to low pH seawater (Rastrick et al., 2018). The inability to further increase clearance rate could lead to the observed net dissolution, likely influenced by increased boring activity of Cliona sp.
4.3 The effect of pH and sponge infestation on short-term calcification/chemical bioerosion
Oysters had net loss of calcium carbonate over the course of six hours during the incubations, but no significant effect of pH was detected. The mean net dissolution calculated for infested oysters was slightly lower (not significantly) than that of uninfested oysters for both treatments. However, no interactive effect of pH and sponge infestation was detected. The results suggest that boring sponges were more active during the incubations than oysters. It is possible that sponges were less affected by stress caused from being removed from treatment tanks and being placed in incubation chambers. The low number of replicates overall (control: n = 4, sponges: n = 6, infested oysters n = 8, uninfested oysters n = 8) might have impaired our ability to detect significant trends due to lack of power. The low number of replicates here was due to logistic constraints. In contrast to our results, chemical sponge bioerosion has been shown to increase significantly with ocean acidification in bioeroding sponges from tropical reefs (Fang et al., 2013; Wisshak et al., 2013; Webb et al., 2017; Watts et al., 2018) and temperate waters (Wisshak et al., 2014).
4.4 Effect of pH on physiology of Cliona sp.
Net bioerosion rate of Cliona sp. in the shells of dead oysters increased significantly with decreasing pH. This contrasts with the lack of impact of pH detected on chemical bioerosion. Accordingly, reduced pH caused an increase in net bioerosion in C. orientalis from the Great Barrier Reef (Fang et al., 2013; Wisshak et al., 2014; Webb et al., 2017) and C. celata in cold-temperate waters (New York, USA, Duckworth and Peterson, 2013; Heligoland, Germany, Wisshak et al., 2014). In two Carribean sponges (P. lampa, Cliona varians) bioerosion rates increased non-linearly with reduced pH (Enochs et al., 2015; Morris et al., 2023). In this study, the fact that sponge-infested shells in the ambient treatment gained weight on average is non-sensical and probably caused by the subtraction of the average percentage weight change of the control shells, which was done to correct for passive dissolution (and possible weight change due to leftover epibionts/borers) to obtain net bioerosion rates. This indicates that sponges in the control treatment did not erode the shells to an extent that an effect beyond passive dissolution was detectable (see uncorrected rates, Supplementary Table 13). Nevertheless, significantly increased net bioerosion activity at pH 7.83 and 7.63 indicates that sponge erosion will benefit from ocean acidification.
There was no significant effect of pH on sponge respiration. The effects of low seawater pH on sponge respiration have been variable. For example, in an experiment with two temperate sponges, the low seawater pH treatment (7.62) significantly increased the respiration rate of Tethia bergquistae compared to the control (~8.05), but did not affect respiration in Crella incrustans (Bates and Bell, 2018). Contrastingly, OA significantly depressed the respiration rate of the Great Barrier Reef sponge Stylissa flabelliformis (Bennett et al., 2017). The bioerosion rate of temperate C. celata (New York, USA) increased significantly with pH but so did mortality rate (Duckworth and Peterson, 2013). Chemical bioerosion rates of the sponge Pione lampa followed a parabolic curve and were depressed again at a pCO2 of ~1000 μatm (Enochs et al., 2015). In our study the survival of sponges was unaffected by pH (no mortality) and no negative effects of pH on sponge on health were observed. Alpha stage (boring) sponges used here and in other studies with seemingly pH tolerant sponges (Wisshak et al., 2014), are completely hidden inside the oyster shell except for their papillae. Reduced contact with seawater could also explain the higher tolerance to reduced pH compared with gamma stage (massive) sponges (e.g., Duckworth and Peterson, 2013). Another reason for the lack of negative impact of pH on respiration and sponge health observed here could be the slight diurnal pH variation in treatments. Diurnal pH variation might alleviate negative effects of low seawater pH on bioeroding sponges and can increase bioerosion rates compared to static treatments (Morris et al., 2022). Similar to respiration, there was no effect of pH on clearance rate of sponges, but the average clearance rate was also negative for all treatments. This suggests that sponges did not feed, even in the smaller particle range (2.5–5 μm) that should have been suitable for sponge feeding. Sponges can show high food selectivity, so it is possible that Cliona sp. was selectively feeding on particles outside of our measured range that were available from the raw seawater (Varamogianni-Mamatsi et al., 2021; Harris, 2022).
5 Conclusion
Our results show that sponge infestation can interact with further ocean acidification and increase bioerosion activity of sponges and therefore exacerbate the effects of sponge infestation and pH on oysters. The net dissolution rates of infested oysters at pH 7.63 suggest that oysters will not be able to calcify fast enough to work against the significantly increased bioerosion activity of the sponge at this pH. Therefore, even in cases where sponge infestation seems to have limited effects on their hosts as suggested for O. chilensis from FS (Böök et al., 2023), sponge infestation could increasingly affect host organisms by the end of this century. Oysters seemed to be able to mitigate some of the effects of increased sponge erosion by increasing clearance rates at reduced pH (significant positive antagonistic effect of sponge infestation and pH on clearance rate), which could also explain condition and respiration being unaffected by sponge erosion and pH. Adult oysters that might have naturally reduced shell growth compared to juvenile oysters could be severely impacted by sponge erosion that outpaces their shell repair and shell growth. Weakening of shells occurs in many bivalves at low seawater pH. Increasing bioerosion in addition to already weakened shells could lead to higher mortality in adult oysters due to increased predation and simply through crumbling of their shells. While this study provides insight into interaction between bioeroders and host-organisms in a less alkaline ocean, CO2 emissions are also causing our oceans to warm up due to the greenhouse effect and increase the frequency and intensity of marine heatwaves. It is important that future studies investigate the effect of ocean warming and marine heatwaves together with ocean acidification on the interaction of bioeroding sponges and O. chilensis. This study highlights that calcifying organisms that are colonised by bioeroding organisms could be especially vulnerable to changes in seawater pH and also indicates that bioerosion might increase under predicted future ocean acidification scenarios. It is therefore crucial to further increase our knowledge on interactions of bioeroding organisms and calcifying organisms in a fast-changing environment.
Data availability statement
The raw data supporting the conclusions of this article is available at Dryad (DOI: 10.5061/dryad.4qrfj6qkj).
Ethics statement
The manuscript presents research on animals that do not require ethical approval for their study.
Author contributions
IB: Conceptualization, Data curation, Formal analysis, Investigation, Methodology, Writing – original draft, Writing – review & editing. EK: Conceptualization, Investigation, Methodology, Visualization, Writing – review & editing. NP: Conceptualization, Methodology, Resources, Supervision, Writing – review & editing. KM: Conceptualization, Methodology, Resources, Supervision, Writing – review & editing. JB: Conceptualization, Methodology, Resources, Supervision, Writing – review & editing. WD: Investigation, Methodology, Resources, Writing – review & editing. CC: Conceptualization, Investigation, Methodology, Resources, Supervision, Writing – review & editing.
Funding
The author(s) declare financial support was received for the research, authorship, and/or publication of this article. Funding received through a NIWA research programme (SIL20302) was jointly funded by the New Zealand Ministry of Business, Innovation and Employment (MBIE) through Seafood Innovations Limited and the Bluff Oyster Management Company Limited (New Zealand). A Rutherford Discovery Fellowship granted to CC and the Centre of Excellence Coastal People Southern Skies supported this research as well as the Victoria University Doctoral Scholarship awarded to IB. The authors declare that this study received funding from NIWA who provided sampling support and external supervision. The cofunders (Seafood Innovations Limited and the Bluff Oyster Management Company Limited) were not involved in the study design, experiments, data collection, analysis, interpretation of data, or the writing of this article or the decision to submit it for publication.
Acknowledgments
We thank Graeme Wright, and the Bluff Oyster Management Company Limited crews and staff for their assistance with sampling. We thank Lorenzo Ravallo for assistance with the Coulter Counter.
Conflict of interest
The authors declare that the research was conducted in the absence of any commercial or financial relationships that could be construed as a potential conflict of interest.
The author(s) declared that they were an editorial board member of Frontiers, at the time of submission. This had no impact on the peer review process and the final decision.
Publisher’s note
All claims expressed in this article are solely those of the authors and do not necessarily represent those of their affiliated organizations, or those of the publisher, the editors and the reviewers. Any product that may be evaluated in this article, or claim that may be made by its manufacturer, is not guaranteed or endorsed by the publisher.
Supplementary material
The Supplementary Material for this article can be found online at: https://www.frontiersin.org/articles/10.3389/fmars.2024.1444863/full#supplementary-material
References
Abbe G. R., Albright B. W. (2003). An improvement to the determination of meat condition index for the eastern oyster Crassostrea virginica (Gmelin 1791). J. Shellfish Res. 22, 747–752.
Alagarswami K., Chellam A. (1976). On fouling and boring organisms and mortality of pearl oysters in the farm at Veppalodai, Gulf of Mannar. Indian J. Fish 23, 10–22.
Bates T. E. M., Bell J. J. (2018). Responses of two temperate sponge species to ocean acidification. New Zeal J. Mar. Freshw. Res. 52, 247–263. doi: 10.1080/00288330.2017.1369132
Beck M. W., Brumbaugh R. D., Airoldi L., Carranza A., Coen L. D., Crawford C., et al. (2011). Oyster reefs at risk and recommendations for conservation, restoration, and management. Bioscience 61, 107–116. doi: 10.1525/bio.2011.61.2.5
Beniash E., Ivanina A., Lieb N. S., Kurochkin I., Sokolova I. M. (2010). Elevated level of carbon dioxide affects metabolism and shell formation in oysters Crassostrea virginica. Mar. Ecol. Prog. Ser. 419, 95–108. doi: 10.3354/meps08841
Bennett H. M., Altenrath C., Woods L., Davy S. K., Webster N. S., Bell J. J. (2017). Interactive effects of temperature and pCO2 on sponges: from the cradle to the grave. Glob Chang Biol. 23, 2031–2046. doi: 10.1111/gcb.13474
Bergquist P. R. (1961). A collection of Porifera from northern New Zealand, with descriptions of seventeen new species. Pacific Sci. 15, 33–48.
Bergquist P. R. (1968). The marine fauna of New Zealand: porifera, demospongiae, part 1 (Tetractinomorpha and lithistida). New Zeal Ocean Inst Mem. 37, 1–105.
Berman J. (2011). Spatial variability of sponge assemblages on the Wellington South Coast, New Zealand. Open Mar. Biol. J. 4, 12–25. doi: 10.2174/1874450801004010012
Böök I. M. (2024). Boring Sponges and Bored Oysters – Interactions between the Bioeroding Sponge Cliona sp. and the New Zealand Flat Oyster Ostrea chilensis. Wellington, New Zealand: Victoria University of Wellington. PhD Dissertation.
Böök I., Michael K., Lane H., Cornwall C., Bell J., Phillips N. (2023). Limited impact of a bioeroding sponge, Cliona sp., on Ostrea chilensis from Foveaux Strait, New Zealand. Dis. Aquat Organ 155, 59–71. doi: 10.3354/dao03743
Boyd P. W., Collins S., Dupont S., Fabricius K., Gattuso J., Havenhand J., et al. (2018). Experimental strategies to assess the biological ramifications of multiple drivers of global ocean change - A review. Glob Chang Biol. 24, 2239–2261. doi: 10.1111/gcb.14102
Bromley R. G., Hanken N. M. (1981). Shallow marine bioerosion at Vardø, arctic Norway. Bull. Geol Soc. Denmark 29, 103–109.
Burchell M., Cannon A., Hallmann N., Schwarcz H. P., Schöne B. R. (2013). Refining Estimates for the season of shellfish collection on the pacific northwest coast: Applying high-resolution stable oxygen isotope analysis and sclerochronology. Archaeometry 55, 258–276. doi: 10.1111/j.1475-4754.2012.00684.x
Caldeira K., Wickett M. E. (2003). Anthropogenic carbon and ocean pH. Nature 425, 365. doi: 10.1038/425365a
Carroll J. M., Dashiell R., Watts J. C., Hunter E. A. (2021). Tidal level affects the prevalence and impacts of pests and parasites on oysters (Crassostrea virginica) on intertidal reefs in Georgia, USA. Mar. Biol. 168, 45. doi: 10.1007/s00227-021-03848-5
Carroll J. M., O’Shaughnessy K. A., Diedrich G. A., Finelli C. M. (2015). Are oysters being bored to death? Influence of Cliona celata on Crassostrea virginica condition, growth and survival. Dis. Aquat Organ 117, 31–44. doi: 10.3354/dao02928
Carver C. E., Thériault I., Mallet A. L. (2010). Infection of Cultured Eastern Oysters Crassostrea virginica by the Boring Sponge Cliona celata, with Emphasis on Sponge Life History and Mitigation Strategies. J. Shellfish Res. 29, 905–915. doi: 10.2983/035.029.0423
Coughlan J. (1969). The estimation of filtering rate from the clearance of suspensions. Mar. Biol. 2, 356–358. doi: 10.1007/BF00355716
Dame R. F. (1976). Energy flows in an intertidal oyster reef. Estuar. Coast. Mar. Sci. 4, 243–253. doi: 10.1016/0302-3524(76)90058-X
Dickinson G. H., Ivanina A. V., Matoo O. B., Pörtner H. O., Lannig G., Bock C., et al. (2012). Interactive effects of salinity and elevated CO2 levels on juvenile eastern oysters, Crassostrea virginica. J. Exp. Biol. 215, 29–43. doi: 10.1242/jeb.061481
Dickson A. G. (1990). Standard potential of the reaction: AgCl(s) + ½H2(g) = Ag(s) + HCl(aq), and and the standard acidity constant of the ion HSO4- in synthetic sea water from 273.15 to 318.15 K. J. Chem. Thermodyn 22, 113–127. doi: 10.1016/0021-9614(90)90074-Z
Dickson A. G., Millero F. J. (1987). A comparison of the equilibrium constants for the dissociation of carbonic acid in seawater media. Deep Sea Res Part A. Oceanogr Res. Pap 34, 1733–1743.
Dickson A. G., Sabine C. L., Christian J. R. (eds) (2007). Guide to best practices for ocean CO2 measurements. (Sidney, British Columbia: North Pacific Marine Science Organization), 191pp. (PICES Special Publication 3; IOCCP Report 8). doi: 10.25607/OBP-1342
Dieudonne J., Carroll J. M. (2022). The impacts of boring sponges on oyster health across multiple sites and tidal heights. Estuaries Coasts 45, 213–224. doi: 10.1007/s12237-021-00942-1
Doo S. S., Leplastrier A., Graba-Landry A., Harianto J., Coleman R. A., Byrne M. (2020). Amelioration of ocean acidification and warming effects through physiological buffering of a macroalgae. Ecol. Evol. 10, 8465–8475. doi: 10.1002/ece3.6552
Duarte C. M., Agusti S., Barbier E., Britten G. L., Castilla J. C., Gattuso J. P., et al. (2020). Rebuilding marine life. Nature 580, 39–51. doi: 10.1038/s41586-020-2146-7
Duckworth A. R., Peterson B. J. (2013). Effects of seawater temperature and pH on the boring rates of the sponge Cliona celata in scallop shells. Mar. Biol. 160, 27–35. doi: 10.1007/s00227-012-2053-z
Enochs I. C., Manzello D. P., Carlton R. D., Graham D. M., Ruzicka R., Colella M. A. (2015). Ocean acidification enhances the bioerosion of a common coral reef sponge: Implications for the persistence of the Florida Reef Tract. Bull. Mar. Sci. 91, 271–290. doi: 10.5343/bms.2014.1045
Fang J. K. H., Mello-Athayde M. A., Schönberg C. H. L., Kline D. I., Hoegh-Guldberg O., Dove S. (2013). Sponge biomass and bioerosion rates increase under ocean warming and acidification. Glob Chang Biol. 19, 3581–3591. doi: 10.1111/gcb.12334
Fang J. K. H., Schönberg C. H. L., Mello-Athayde M. A., Hoegh-Guldberg O., Dove S. (2014). Effects of ocean warming and acidification on the energy budget of an excavating sponge. Glob Chang Biol. 20, 1043–1054. doi: 10.1111/gcb.12369
Feely R. A., Doney S. C., Cooley S. R. (2009). Ocean acidification: present conditions and future changes in a high-CO2 world. Oceanography 22, 36–47. doi: 10.5670/oceanog
Gattuso J.-P., Epitalon J.-M., Lavigne E., Orr J. (2021). seacarb: Seawater Carbonate Chemistry. R package version 3.3.0. Available at: http://CRAN.R-project.org/package=seacarb. (accessed March 2021).
Gattuso J.-P., Magnan A., Billé R., Cheung W. W. L., Howes E. L., Joos F., et al. (2015). Contrasting futures for ocean and society from different anthropogenic CO2 emissions scenarios. Science 349, aac4722. doi: 10.1126/science.aac4722
Gazeau F., Parker L. M., Comeau S., Gattuso J. P., O’Connor W. A., Martin S., et al. (2013). Impacts of ocean acidification on marine shelled molluscs. Mar. Biol. 160, 2207–2245. doi: 10.1007/s00227-013-2219-3
Gazeau F., Quiblier C., Jansen J. M., Gattuso J. P., Middelburg J. J., Heip C. H. R. (2007). Impact of elevated CO2 on shellfish calcification. Geophys Res. Lett. 34, 1–5. doi: 10.1029/2006GL028554
Gillies C. L., McLeod I. M., Alleway H. K., Cook P., Crawford C., Creighton C., et al. (2018). Australian shellfish ecosystems: Past distribution, current status and future direction. PloS One 13, e0190914. doi: 10.1371/journal.pone.0190914
Grabowski J. H., Brumbaugh R. D., Conrad R. F., Keeler A. G., Opaluch J. J., Peterson CH, et al. (2012). Economic valuation of ecosystem services provided by oyster reefs. Bioscience 62, 900–909. doi: 10.1525/bio.2012.62.10.10
Handley S. J. (1998). Power to the oyster: Do spionid-induced shell blisters affect condition in subtidal oysters? J. Shellfish Res. 17, 1093–1099.
Hanley T. C., White J. W., Stallings C. D., Kimbro D. L. (2019). Environmental gradients shape the combined effects of multiple parasites on oyster hosts in the northern Gulf of Mexico. Mar. Ecol. Prog. Ser. 612, 111–125. doi: 10.3354/meps12849
Harris B. J. (2022). The distribution and feeding ecology of temperate marine sponges through shallow and mesophotic habitats. Wellington, New Zealand: Victoria University of Wellington. PhD Dissertation.
Hoeksema B. W. (1983). Excavation patterns and spiculae dimensions of the boring sponge Cliona celata from the SW Netherlands. Senckenb Marit 15, 55–85.
Hofmann G. E., Barry J. P., Edmunds P. J., Gates R. D., Hutchins D. A., Klinger T., et al. (2010). The effect of ocean acidification on calcifying organisms in marine ecosystems: an organism-to-ecosystem perspective. Annu. Rev. Ecol. Evol. Syst. 41, 127–147. doi: 10.1146/annurev.ecolsys.110308.120227
Holmes K. E., Edinger E. N., Hariyadi, Limmon G. V., Risk M. J. (2000). Bioerosion of live massive corals and branching coral rubble on Indonesian coral reefs. Mar. pollut. Bull. 40, 606617. doi: 10.1016/S0025-326X(00)00067-9
Howie A. H., Bishop M. J. (2021). Contemporary oyster reef restoration: responding to a changing world. Front. Ecol. Evol. 9, 689915. doi: 10.3389/fevo.2021.689915
Jokiel P., Maragos J., Franzisket L. (1978). “Coral growth: buoyant weight technique,” in Coral reefs: research methods. Eds. Stoddart D. R., Johannes R. E. (UNESCO, Paris, France), 529–541.
Kraeuter J. N., Ford S., Cummings M. (2007). Oyster growth analysis: A comparison of methods. J. Shellfish Res. 26, 479–491. doi: 10.2983/0730-8000(2007)26[479:OGAACO]2.0.CO;2
Kroeker K. J., Kordas R. L., Crim R., Hendriks I. E., Ramajo L., Singh G. S., et al. (2013). Impacts of ocean acidification on marine organisms: Quantifying sensitivities and interaction with warming. Glob Chang Biol. 19, 1884–1896. doi: 10.1111/gcb.12179
Lannig G., Eilers S., Pörtner H. O., Sokolova I. M., Bock C. (2010). Impact of ocean acidification on energy metabolism of oyster, Crassostrea gigas - Changes in metabolic pathways and thermal response. Mar. Drugs 8, 2318–2339. doi: 10.3390/md8082318
Law C. S., Bell J. J., Bostock H. C., Cornwall C. E., Cummings V. J., Currie K., et al. (2018a). Ocean acidification in New Zealand waters: trends and impacts. New Zeal J. Mar. Freshw. Res. 52, 155–195. doi: 10.1080/00288330.2017.1374983
Law C. S., Rickard G. J., Mikaloff-Fletcher S. E., Pinkerton M. H., Behrens E., Chiswell S. M., et al. (2018b). Climate change projections for the surface ocean around New Zealand. New Zeal J. Mar. Freshw. Res. 52, 309–335. doi: 10.1080/00288330.2017.1390772
Lawrence D. R., Scott G. I. (1982). The determination and use of condition index of oysters. Estuaries 5, 23–27. doi: 10.2307/1352213
Lee K., Kim T. W., Byrne R. H., Millero F. J., Feely R. A., Liu Y. M. (2010). The universal ratio of boron to chlorinity for the North Pacific and North Atlantic oceans. Geochim Cosmochim Acta 74, 1801–1811. doi: 10.1016/j.gca.2009.12.027
Lemasson A. J., Fletcher S., Hall-Spencer J. M., Knights A. M. (2017). Linking the biological impacts of ocean acidification on oysters to changes in ecosystem services: A review. J. Exp. Mar. Bio Ecol. 492, 49–62. doi: 10.1016/j.jembe.2017.01.019
Lemasson A. J., Hall-Spencer J. M., Fletcher S., Provstgaard-Morys S., Knights A. M. (2018). Indications of future performance of native and non-native adult oysters under acidification and warming. Mar. Environ. Res. 142, 178–189. doi: 10.1016/j.marenvres.2018.10.003
Lutier M., Di Poi C., Gazeau F., Appolis A., Le Luyer J., Pernet F. (2022). Revisiting tolerance to ocean acidification: Insights from a new framework combining physiological and molecular tipping points of Pacific oyster. Glob Chang Biol. 28, 3333–3348. doi: 10.1111/gcb.16101
McNally E. M. (2022). Understanding the impacts of environment and parasitism on eastern oyster (Crassostrea virginica) vulnerability to ocean acidification. Northeastern University, Boston. PhD Dissertation.
Mehrbach C., Culberson C. H., Hawley J. E., Pytkowicx R. M. (1973). Measurement of the apparent dissociation constants of carbonic acid in seawater at atmospheric pressure. Limnol Oceanogr 18, 897–907. doi: 10.4319/lo.1973.18.6.0897
Michael K. P. (2010). Summary of information from Foveaux Strait oyster (Ostrea chilensis, OYU 5) strategic research 2000–09: context for the 2010 strategic research plan. Assessment Report 2010/20 (Wellington, New Zealand: New Zealand Fisheries).
Michael K. P. (2018). Recruitment of Ostrea chilensis (Philippi 1844) in Foveaux Strait, southern New Zealand. Victoria University of Wellington. PhD Dissertation.
Michael K. P., Bilewitch J., Forman J., Hulston D., Moss G. (2021). Surveys of the Foveaux Strait oyster (Ostrea chilensis) population (OYU 5) and Bonamia exitiosa prevalence, intensity, and disease related oyster mortality in February 2020. Assessment Report 2021/06 (Wellington: Fisheries New Zealand).
Michael K. P., Forman J., Hulston D., Bilewitch J., Moss G. (2019). The Foveaux Strait oyster and Bonamia surveys, February 2017. Assessment Report 2019/46 (Wellington: Fisheries New Zealand).
Michael K. P., Forman J., Hulston D., Fu D., Maas E. (2015). A survey of the Foveaux Strait oyster (Ostrea chilensis) population (OYU5) in commercial fishery areas and the status of bonamia (Bonamia exitiosa) in February 2014. Assessment Report 2015/40 (Wellington: Fisheries New Zealand).
Morris J. T., Enochs I. C., Studivan M. S., Young B. D., Mayfield A., Soderberg N., et al. (2023). Ocean acidification influences the gene expression and physiology of two Caribbean bioeroding sponges. Front. Mar. Sci. 10, 1223380. doi: 10.3389/fmars.2023.1223380
Morris J., Enochs I., Webb A., de Bakker D., Soderberg N., Kolodziej G., et al. (2022). The influences of diurnal variability and ocean acidification on the bioerosion rates of two reef-dwelling Caribbean sponges. Glob Chang Biol. 28, 7126–7138. doi: 10.1111/gcb.16442
Palmer A. R. (1992). Calcification in marine molluscs: how costly is it? Proc. Natl. Acad. Sci. U.S.A. 89, 1379–1382. doi: 10.1073/pnas.89.4.1379
Pierrot D., Lewis E., Wallace D. W. R. (2006). MS Excel Program Developed for CO2 System Calculations ORNL/CDIAC 105 (Carbon Dioxide Information Analysis Center, Oak Ridge National Laboratory, US Department of Energy). Available at: https://github.com/epitalon/CO2SYS-Excel.
Piggott J. J., Townsend C. R., Matthaei C. D. (2015). Reconceptualizing synergism and antagonism among multiple stressors. Ecol. Evol. 5, 1538–1547. doi: 10.1002/ece3.1465
Pritchard K., Battershill C. N., Bergquist P. R. (1984). Marine Sponges. Forty Six Sponges of northern New Zealand (Auckland: University of Auckland Leigh Laboratory), 150.
Probert P. K., Batham E. J., Wilson J. B. (1979). Epibenthic macrofauna off southeastern New Zealand and mid-shelf bryozoan dominance. New Zeal J. Mar. Freshw. Res. 13, 379–392. doi: 10.1080/00288330.1979.9515814
Rainer J. S., Mann R. (1992). A comparison of methods for calculating condition index in eastern oysters, Crassostrea virginica (Gmelin 1791). J. Shellfish Res. 11, 55–58.
Rastrick S. P. S., Collier V., Graham H., Strohmeier T., Whiteley N. M., Strand Ø. O., et al. (2018). Feeding plasticity more than metabolic rate drives the productivity of economically important filter feeders in response to elevated CO2 and reduced salinity. ICES J. Mar. Sci. 75, 2117–2128. doi: 10.1093/icesjms/fsy079
Raven J., Caldeira K., Elderfield H., Hoegh-Guldberg O., Liss P., Riebesell U., et al. (2005). Ocean acidification due to increasing atmospeheric carbon dioxide. R. Soc. London.
R Core Team (2022). R: A language and environment for statistical computing (Vienna, Austria: R Foundation for Statistical Computing). Available at: https://www.R-project.org/.
Ries J. B., Cohen A. L., McCorkle D. C. (2009). Marine calcifiers exhibit mixed responses to CO2-induced ocean acidification. Geology 37, 1131–1134. doi: 10.1130/G30210A.1
RStudio Team (2020). RStudio: Integrated Development for R (Boston, MA: RStudio, PBC). Available at: http://www.rstudio.com/.
Rützler K. (2002a). “Family Clionaidae D´Obrigny 1851,” in Systema Porifera: A Guide to the Classification of Sponges. Eds. Hooper J. N. A., Van Soest R. W. M. (Kluwer Academic/Plenum Publishers, New York), 173–185.
Rützler K. (2002b). Impact of crustose clionid sponges on Caribbean reef corals. Acta Geol Hisp 37, 61–72.
Rützler K., Rieger G. (1973). Sponge burrowing: Fine structure of Cliona lampa penetrating calcareous substrata. Mar. Biol. 21, 144–162. doi: 10.1007/BF00354611
Sanford E., Gaylord B., Hettinger A., Lenz E. A., Meyer K., Hill T. M. (2014). Ocean acidification increases the vulnerability of native oysters to predation by invasive snails. Proc. R Soc. B Biol. Sci. 281, 20132681. doi: 10.1098/rspb.2013.2681
Schönberg C. H. L., Fang J. K. H., Carreiro-Silva M., Tribollet A., Wisshak M. (2017). Bioerosion: the other ocean acidification problem. ICES J. Mar. Sci. 74, 895–925. doi: 10.1093/icesjms/fsw254
Smith R. S., Pruett J. L. (2024). Oyster restoration to recover ecosystem services. Ann. Rev. Mar. Sci. 17, 10.1-10.31. Review in Advance first posted online on July 18, 2024. doi: 10.1146/annurev-marine-040423-023007
Stead D. H. (1971a). Observations on the Behavior and Ecology of of the Foveaux Strait Dredge Oyster (Ostrea Lutaria Hutton) (Wellington, New Zealand: New Zealand Marine Department). Fisheries Technical Report No. 68.
Stead D. H. (1971b). Survey of Foveaux Strait Oyster Beds 1960 -1964 (New Zealand Marine Department), 1–64. Fisheries Technical Report No. 59, Wellington, New Zealand
Stubler A. D., Peterson B. J. (2016). Ocean acidification accelerates net calcium carbonate loss in a coral rubble community. Coral Reefs 35, 795–803. doi: 10.1007/s00338-016-1436-x
Thomas P. A. (1979). Boring sponges destructive to economically important molluscan beds and coral reefs in Indian Seas. Indian J. Fish 26, 163–200.
Tsunogai S., Nishimura M., Nakaya S. (1968). Complexometric titration of calcium in the presence of larger amounts of magnesium. Talanta 15, 385–390. doi: 10.1016/0039-9140(68)80247-4
Varamogianni-Mamatsi D., Anastasiou T. I., Vernadou E., Papandroulakis N., Kalogerakis N., Dailianis T., et al. (2021). A multi-species investigation of sponges’ Filtering activity towards marine microalgae. Mar. Drugs 20, 24. doi: 10.3390/md20010024
Waldbusser G. G., Steenson R. A., Green M. A. (2011a). Oyster shell dissolution rates in estuarine waters: effects of pH and shell legacy. J. Shellfish Res. 30, 659–669. doi: 10.2983/035.030.0308
Waldbusser G. G., Voigt E. P., Bergschneider H., Green M. A., Newell R. I. E. (2011b). Biocalcification in the Eastern Oyster (Crassostrea virginica) in Relation to Long-term Trends in Chesapeake Bay pH. Estuaries Coasts 34, 221–231. doi: 10.1007/s12237-010-9307-0
Warburton F. E. (1958). Reproduction of fused larvae in the boring sponge, Cliona celata Grant. Nature 181, 493–494. doi: 10.1038/181493a0
Watts J. C., Carroll J. M., Munroe D. M., Finelli C. M. (2018). Examination of the potential relationship between boring sponges and pea crabs and their effects on eastern oyster condition. Dis. Aquat Organ 130, 25–36. doi: 10.3354/dao03257
Webb A. E., van Heuven S. M. A. C., de Bakker D. M., van Duyl F. C., Reichart G. J., de Nooijer L. J. (2017). Combined effects of experimental acidification and eutrophication on reef sponge bioerosion rates. Front. Mar. Sci. 4, 1–15. doi: 10.3389/fmars.2017.00311
Wisshak M., Schönberg C. H. L., Form A., Freiwald A. (2012). Ocean acidification accelerates reef bioerosion. PloS One 7, e45124. doi: 10.1371/journal.pone.0045124
Wisshak M., Schönberg C., Form A., Freiwald A. (2013). Effects of ocean acidification and global warming on reef bioerosion–lessons from a clionaid sponge. Aquat Biol. 19, 111–127. doi: 10.3354/ab00527
Wisshak M., Schönberg C. H. L., Form A., Freiwald A. (2014). Sponge bioerosion accelerated by ocean acidification across species and latitudes? Helgol Mar. Res. 68, 253–262. doi: 10.1007/s10152-014-0385-4
Keywords: ocean acidification, host-parasite interaction, boring sponge, flat oyster, Cliona sp., Ostrea chilensis, shellfish shells, global change
Citation: Böök IM, Krieger EC, Phillips NE, Michael KP, Bell JJ, Dillon WDN and Cornwall CE (2024) Effects of ocean acidification on the interaction between calcifying oysters (Ostrea chilensis) and bioeroding sponges (Cliona sp.). Front. Mar. Sci. 11:1444863. doi: 10.3389/fmars.2024.1444863
Received: 06 June 2024; Accepted: 30 August 2024;
Published: 01 October 2024.
Edited by:
Pauline Mary Ross, The University of Sydney, AustraliaReviewed by:
Elliot Scanes, University of Technology Sydney, AustraliaJinlin Liu, Tongji University, China
Copyright © 2024 Böök, Krieger, Phillips, Michael, Bell, Dillon and Cornwall. This is an open-access article distributed under the terms of the Creative Commons Attribution License (CC BY). The use, distribution or reproduction in other forums is permitted, provided the original author(s) and the copyright owner(s) are credited and that the original publication in this journal is cited, in accordance with accepted academic practice. No use, distribution or reproduction is permitted which does not comply with these terms.
*Correspondence: Imke M. Böök, aW1rZS5ib29rQGthdXN0LmVkdS5zYQ==
†Present address: Imke M. Böök, Biological and Environmental Science and Engineering Division, King Abdullah University of Science and Technology, Thuwal, Saudi ArabiaErik C. Krieger, Biological and Environmental Science and Engineering Division, King Abdullah University of Science and Technology, Thuwal, Saudi Arabia