- 1Laboratory of Water Ecological Health and Environmental Safety, School of Life Sciences, Chongqing Normal University, Chongqing, China
- 2Chongqing Key Laboratory of Conservation and Utilization of Freshwater Fishes, Chongqing Normal University, Chongqing, China
- 3Animal Biology Key Laboratory of Chongqing Education Commission, Chongqing Normal University, Chongqing, China
The rich and special biodiversity in mountain rivers is experiencing a continuous decline due to the influence of climate change and anthropogenic factors. To explore the alterations in the distribution of aquatic biodiversity in mountain rivers in the context of cascade dam development, the environmental DNA (eDNA) metabarcoding technique was used to examine the aquatic biodiversity of the Wujiang River, a representative mountain river with an 11-stage cascade dam. In this study, a comprehensive analysis of aquatic organisms in the Wujiang River mainstem was conducted, and 17 phyla and 38 classes were detected in the 36 water samples. The most abundant group is the benthic organisms, and the least abundant group is the amphibians. The results of the diversity analysis showed a clear longitudinal distribution pattern of aquatic organisms along the altitudinal gradient, with higher richness of aquatic organism communities the further to the lower reaches. Meanwhile, RDA analysis revealed that altitude, dissolved oxygen, reservoir length, and reservoir construction time were the key environmental factors influencing the distribution of aquatic organisms in the Wujiang River mainstem. The findings of this research also showed the applicability of the eDNA method in detecting aquatic biodiversity.
1 Introduction
The presence of an intricate and diverse natural environment made the mountainous regions of southwest China a highly favorable sanctuary for organisms (Wang, 2011). These regions are rich in rare, endangered, and endemic species, making them one of the most important regions of biodiversity in the world (Wang, 2011). Mountain river ecosystems are characterized by distinct spatial and temporal heterogeneity (Liu et al., 2021a). Throughout the protracted progression of river ecosystems, the biological assemblages dwelling within rivers have consistently adjust and adapt to the conditions of their aquatic habitats (Dong et al., 2010; Wang et al., 2021). Mountain river communities exhibit characteristic vertical altitude patterns (Colbert, 1980). This distribution pattern is determined by a combination of various local environments, including altitude of the river, orientation of the slope, and hydrological conditions, as determined by previous research (He et al., 2020; Liu et al., 2021b; Pero et al., 2020). Therefore, monitoring and protecting the diversity of aquatic organisms is key to maintaining the integrity of the ecosystem.
Human activities influence the hydrological conditions of mountain rivers and the terrestrial environment of riparian zones, ultimately affecting the resilience of delicate, unique, and diverse mountain river ecosystems (Principe et al., 2019; Soininen et al., 2015). The steep gradients, fast-flowing waters, and ample hydroelectric resources of mountain rivers make them suitable for generating hydropower (Wang, 2011). Although dams offer economic benefits (e.g., enhance water security), they can affect freshwater ecosystems by altering hydrological conditions, fragmenting habitats and so on (Nobile et al., 2019; Barbarossa et al., 2020). They also threaten aquatic communities (Cheng et al., 2023a; Dudgeon, 2000). Meanwhile, the decline in aquatic species and the increasing homogenization of communities can lead to a decrease in the stability, resistance and resilience of communities (Petchey, 2003).
Although the traditional sampling approach is commonly implemented to assess river biodiversity at a broad spatial scale, the traditional method is not only expensive, time-consuming and labor-intensive, but also harmful to the environment and organisms during monitoring periods (Reji Chacko et al., 2023; Valentini et al., 2016). The application of environmental DNA (eDNA) metabarcoding technology to assess the quality of various ecosystems has become prevalent (Keck et al., 2022; Valentini et al., 2016). The technique performs quick and extensive aquatic biodiversity surveys at a lower cost (Hui et al., 2019; West et al., 2021). Moreover, this method is non-destructive and non-invasive, causing no harm to the organisms or their habitats (Antognazza et al., 2019; Leempoel et al., 2020). It also achieves a high detection rate for species that are rare or elusive (Takahara et al., 2020; Carvalho et al., 2019). Hence, the application of environmental DNA techniques is realistic and achievable to comprehensively assess the aquatic biodiversity of mountain rivers.
The Wujiang River is the largest tributary on the right side of the upper reaches of the Yangtze River. It features a natural altitude gradient of 2,124 m, and different environments provide important habitats for the growth and reproduction of aquatic organisms (Xiao et al., 2015; Yao et al., 2009). However, the cascade dam development and construction have resulted in the division of the main stream of the Wujiang River into 12 separate sections by the dams, which has disrupted river continuity, thus threatening the survival of aquatic organisms. Existing researches have primarily investigated higher vertebrate organisms or zooplankton, but studies on the status of aquatic biodiversity as a whole are lacking (Cheng et al., 2023b; Cui et al., 2021; Yang et al., 2010). Therefore, in this study, we used the environmental DNA metabarcoding technology to assess the aquatic biodiversity across 12 river sections of the Wujiang River mainstem. The objective of our research was to address the following questions: (1) What is the current condition of aquatic biodiversity in the 12 segments of the Wujiang River mainstem? (2) How has cascading development affected the aquatic biodiversity of the Wujiang River mainstem? (3) Which environmental factors drive the distribution pattern of aquatic biodiversity in the mainstem of the Wujiang River?
2 Materials and methods
2.1 Study area, eDNA sampling and measurement of environmental factors
The Wujiang River can be geographically divided into the upper reaches (UR) above the Liuchong River confluence, the middle reaches (MR) from the confluence to Sinan, and the lower reaches (LR) below Sinan. In addition, the 11 cascade dams on the mainstem also physically divide the Wujiang River into 12 different river sections. Therefore, the 12 different river sections were set up as sampling areas [the UR included the Hongjiadu reservoir (HJD), Puding reservoir (PD), Yinzidu reservoir (YZD), and Dongfeng reservoir (DF); the MR included the Suofengying reservoir (SFY), Wujiangdu reservoir (WJD), Goupitan reservoir (GPT), and Silin reservoir (SL); the LR included the Shatuo reservoir (ST), Pengshui reservoir (PS), Yinpan reservoir (YP), and Fuling section (FL)] (Figure 1A).
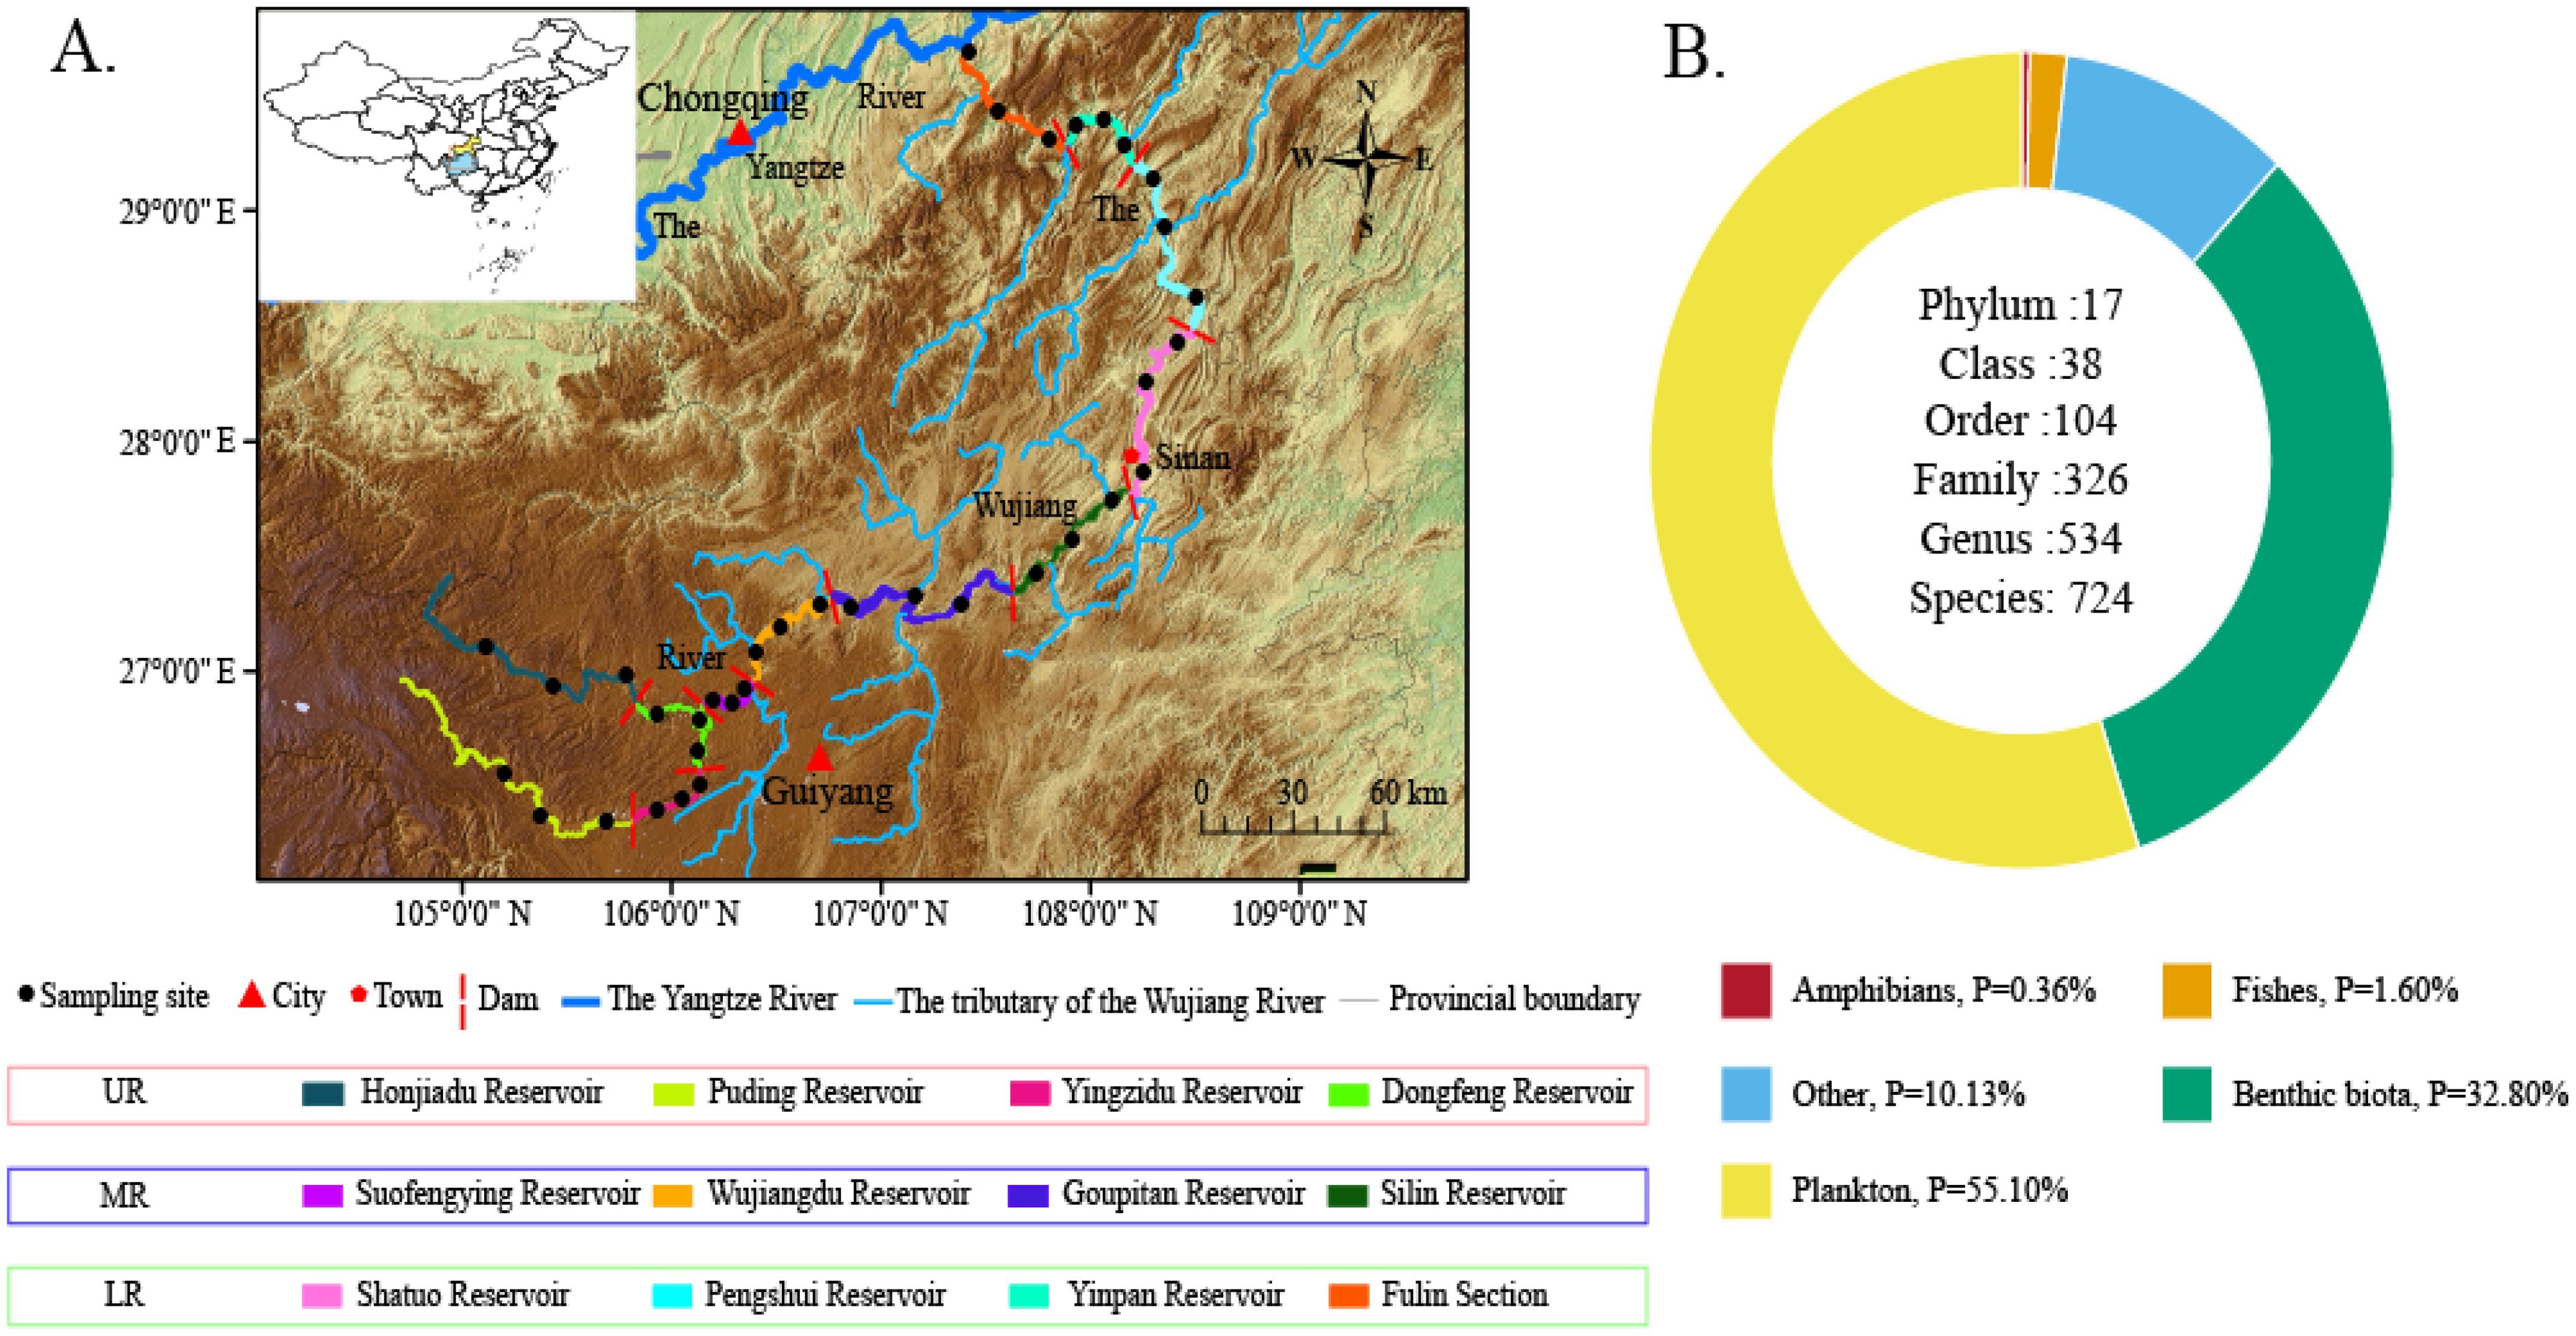
Figure 1. Study area (A) and total percentage of the five major taxa in the Wujiang River mainstem (B).
In order to obtain aquatic organisms that are more comprehensively representative of the true results of the12 different river sections, three sampling points were set up in each river sections (Figure 1A). Equal volumes of water were collected and mixed from the upper, middle and lower layers of the water column at each sampling point, and equal volumes of mixed water from the three sampling points in the same river sections were further mixed together. The mixed water from the same river sections were then equally divided into three technical replicates, with each replicate using only 2L water. Thus, 12 river sections obtained 36 environmental samples. All sampling instruments, including sampling bottles and water collectors, were cleaned with a 10% commercial bleach solution (approximately 8% sodium hypochlorite) and rinsed twice with distilled water to minimize contamination across various sampling points and external DNA. While collecting water from each sampling site, a fresh pair of disposable gloves was used to reduce the risk of water cross-contamination. The historical data of the power station and GPS positioning were used to determine the time of reservoir construction, the length and altitude of the reservoir. Hydrological situation indicators such as water temperature, dissolved oxygen and pH were assessed using the YSI (6600) water quality analyzer.
2.2 Water samples processing and amplification
Water samples were filtered and treated following strict pollution control guidelines at a designated laboratory bench. Before treatment, the laboratory bench and operating instruments were disinfected with a 10% disinfectant solution and double-distilled water. The environmental water samples were preserved in a cryogenic environment (use lots of ice packs and foam boxes) and promptly transported to the laboratory within 10 h. The eDNA samples were enriched using a peristaltic pump to filter each 2 L water sample through a 0.45 µm mixed cellulose filter membrane (Whatman, UK). Filtration blanks consisting of 2 L of double distilled water were used as a negative control for each set of samples to check for possible contamination. The filter membranes were preserved at -80°C until the subsequent extraction process.
The eDNA was extracted from the filter membranes using the PowerWater DNA Isolation Kit following the manufacturer’s instructions with minor adjustments. The quality of the extracted eDNA was subsequently tested by 1% agarose gel electrophoresis. Each sample was extracted separately, and a blank filter membrane was used as a negative control. Finally, the extracted DNA samples were stored at -20°C until the next step of amplification.
In this study, universal primers targeting the COI locus of the mitochondrial gene (lCOlintF: 5’-GGW ACW GGW TGA ACW GTW TAY CCY CC-3’, jgHCO2198: 5’-TAI ACY TCI GGRTGICCRAARAAYCA-3’) were used to amplify the samples, resulting in a 313 bp fragment from the targeted variable region (Geller et al., 2013; Leray et al., 2013). PCR amplification was conducted three times for each sample mainly to exclude the single sample may be affected by many human factors and the PCR products from the same sample were mixed and detected via electrophoresis on a 2% agarose gel electrophoresis. The TransStart Fastpfu DNA Polymerase amplification system (20 µL) contained: 4 µL of 5× FastPfu Buffer, 2 µL of dNTPs, 0.4 µL of FastPfu Polymerase, 1-2 µL of template DNA (10 ng/µL), and 0.8 µL each of the upstream and downstream primers (10 µmol/L); finally, the total volume of the system was made up to 20 µL with ddH2O. The PCR reaction conditions were as follows: 5 min 95°C pre-denaturation, 30 s 95°C denaturation, 30 s 55°C annealing, 45 s 72°C extension, 10 min 72°C final extension, and finally the products were preserved at 10°C (denaturation-annealing-extension for 35 cycles). A negative PCR control was conducted using ddH2O to assess the presence of contamination during PCR amplification. The resulting PCR product was purified and submitted to Shanghai Lingen Biotechnology Co. The entire process, from water sample collection to the shipment of samples to the company for analysis, does not exceed 15 days. The COI amplicon libraries were sequenced on the Illumina NovaSeq platform following the manufacturer’s protocol and analyzed in the 2×300 bp double-ended format.
2.3 Bioinformatic analysis
Trimmomatic v.0.36 was used to filter out low-quality reads, defined as sequenced original reads (login number: SRR27793197-SRR27793232) less than 100 bp long and with a tail quality below 20 bases. Utilizing the FLASH software, paired reads are merged into a single sequence by considering the overlap relationship between the original reads, with a minimum overlap length of 10 bp (Magoč and Salzberg, 2011). Following the method described by Cheng et al., chimeras and primers were removed, and operations such as clustering analysis, classification, and annotation were performed (Cheng et al., 2023c).
Sequences affiliated with non-aquatic taxa or unassigned taxa were discarded. Solely sequences assigned to species, genus and family levels were retained for the subsequent manual examination. Non-repetitive sequences were clustered based on 97% similarity to derive unique representative sequences (Cheng et al., 2023a). The Blastn tool and uclust algorithm were used to categorize each unique sequence in the GenBank nucleotide database, following which, they were manually assigned based on the molecular operational taxonomic unit (MOTU) (Zhang et al., 2022). We examined each match representing the highest scoring sequence, and those exhibiting a similarity of ≥97% under 100% coverage were retained for the downstream analysis.
2.4 Statistical analysis
To visually represent the distribution of aquatic biodiversity in the Wujiang River, we classified the detected aquatic organisms into five major groups, including fish, amphibians, benthic organisms, planktonic organisms and others. Pie charts were made to illustrate the occupancy of MOTU of the five major groups of organisms within each group at different sampling sections. Additionally, histograms were plotted to display the sequential abundance of organisms at the phylum and class levels. Box plots were constructed to visualize the Shannon index, Simpson index, and Pielou index of alpha diversity across the specie level. These analyses were conducted using the origin software. Dilution curves were generated for each sample using R software 4.0.3 to evaluate sampling effort and species richness accumulation (Ross and Robert, 2008).
The NMDS analysis based on the Bray-Curtis distance was performed to demonstrate the similarity of total taxonomic level diversity in the UR, MR and LR of the Wujiang River mainstem. Additionally, permutational multivariate analysis of variance (PERMANOVA) utilizing the vegan function adonis with 999 free permutations, and it was used to assess the differences in aquatic biodiversity across the aforementioned river reaches. Meanwhile, in each sampling section, after Decision Curve Analysis (DCA), we found that the value of the first axis was less than 4, hence we proceeded with Redundancy Analysis (RDA) for the correlation analysis between environmental factors and the aquatic biological community. All statistical analyses were conducted using R v. 4.0.3.
3 Results
3.1 Detecting taxonomic diversity of aquatic organisms by eDNA metabarcoding
Using the sequencing process, a total of 2.63 million sequences were generated, with 2.18 million clean reads remaining after quality control filtration. After manual correction, 0.89 million sequences were compared to the aquatic organisms of the Wujiang River (Supplementary Table 1). This analysis identified 21,900 sequences (1.63%) of fish, 32,000 sequences (0.37%) of amphibians, and 28,000 sequences (31.46%) of benthic species, 500,000 sequences (56.21%) of plankton and 92,000 sequences (10.34%) of other taxa (Figure 2).
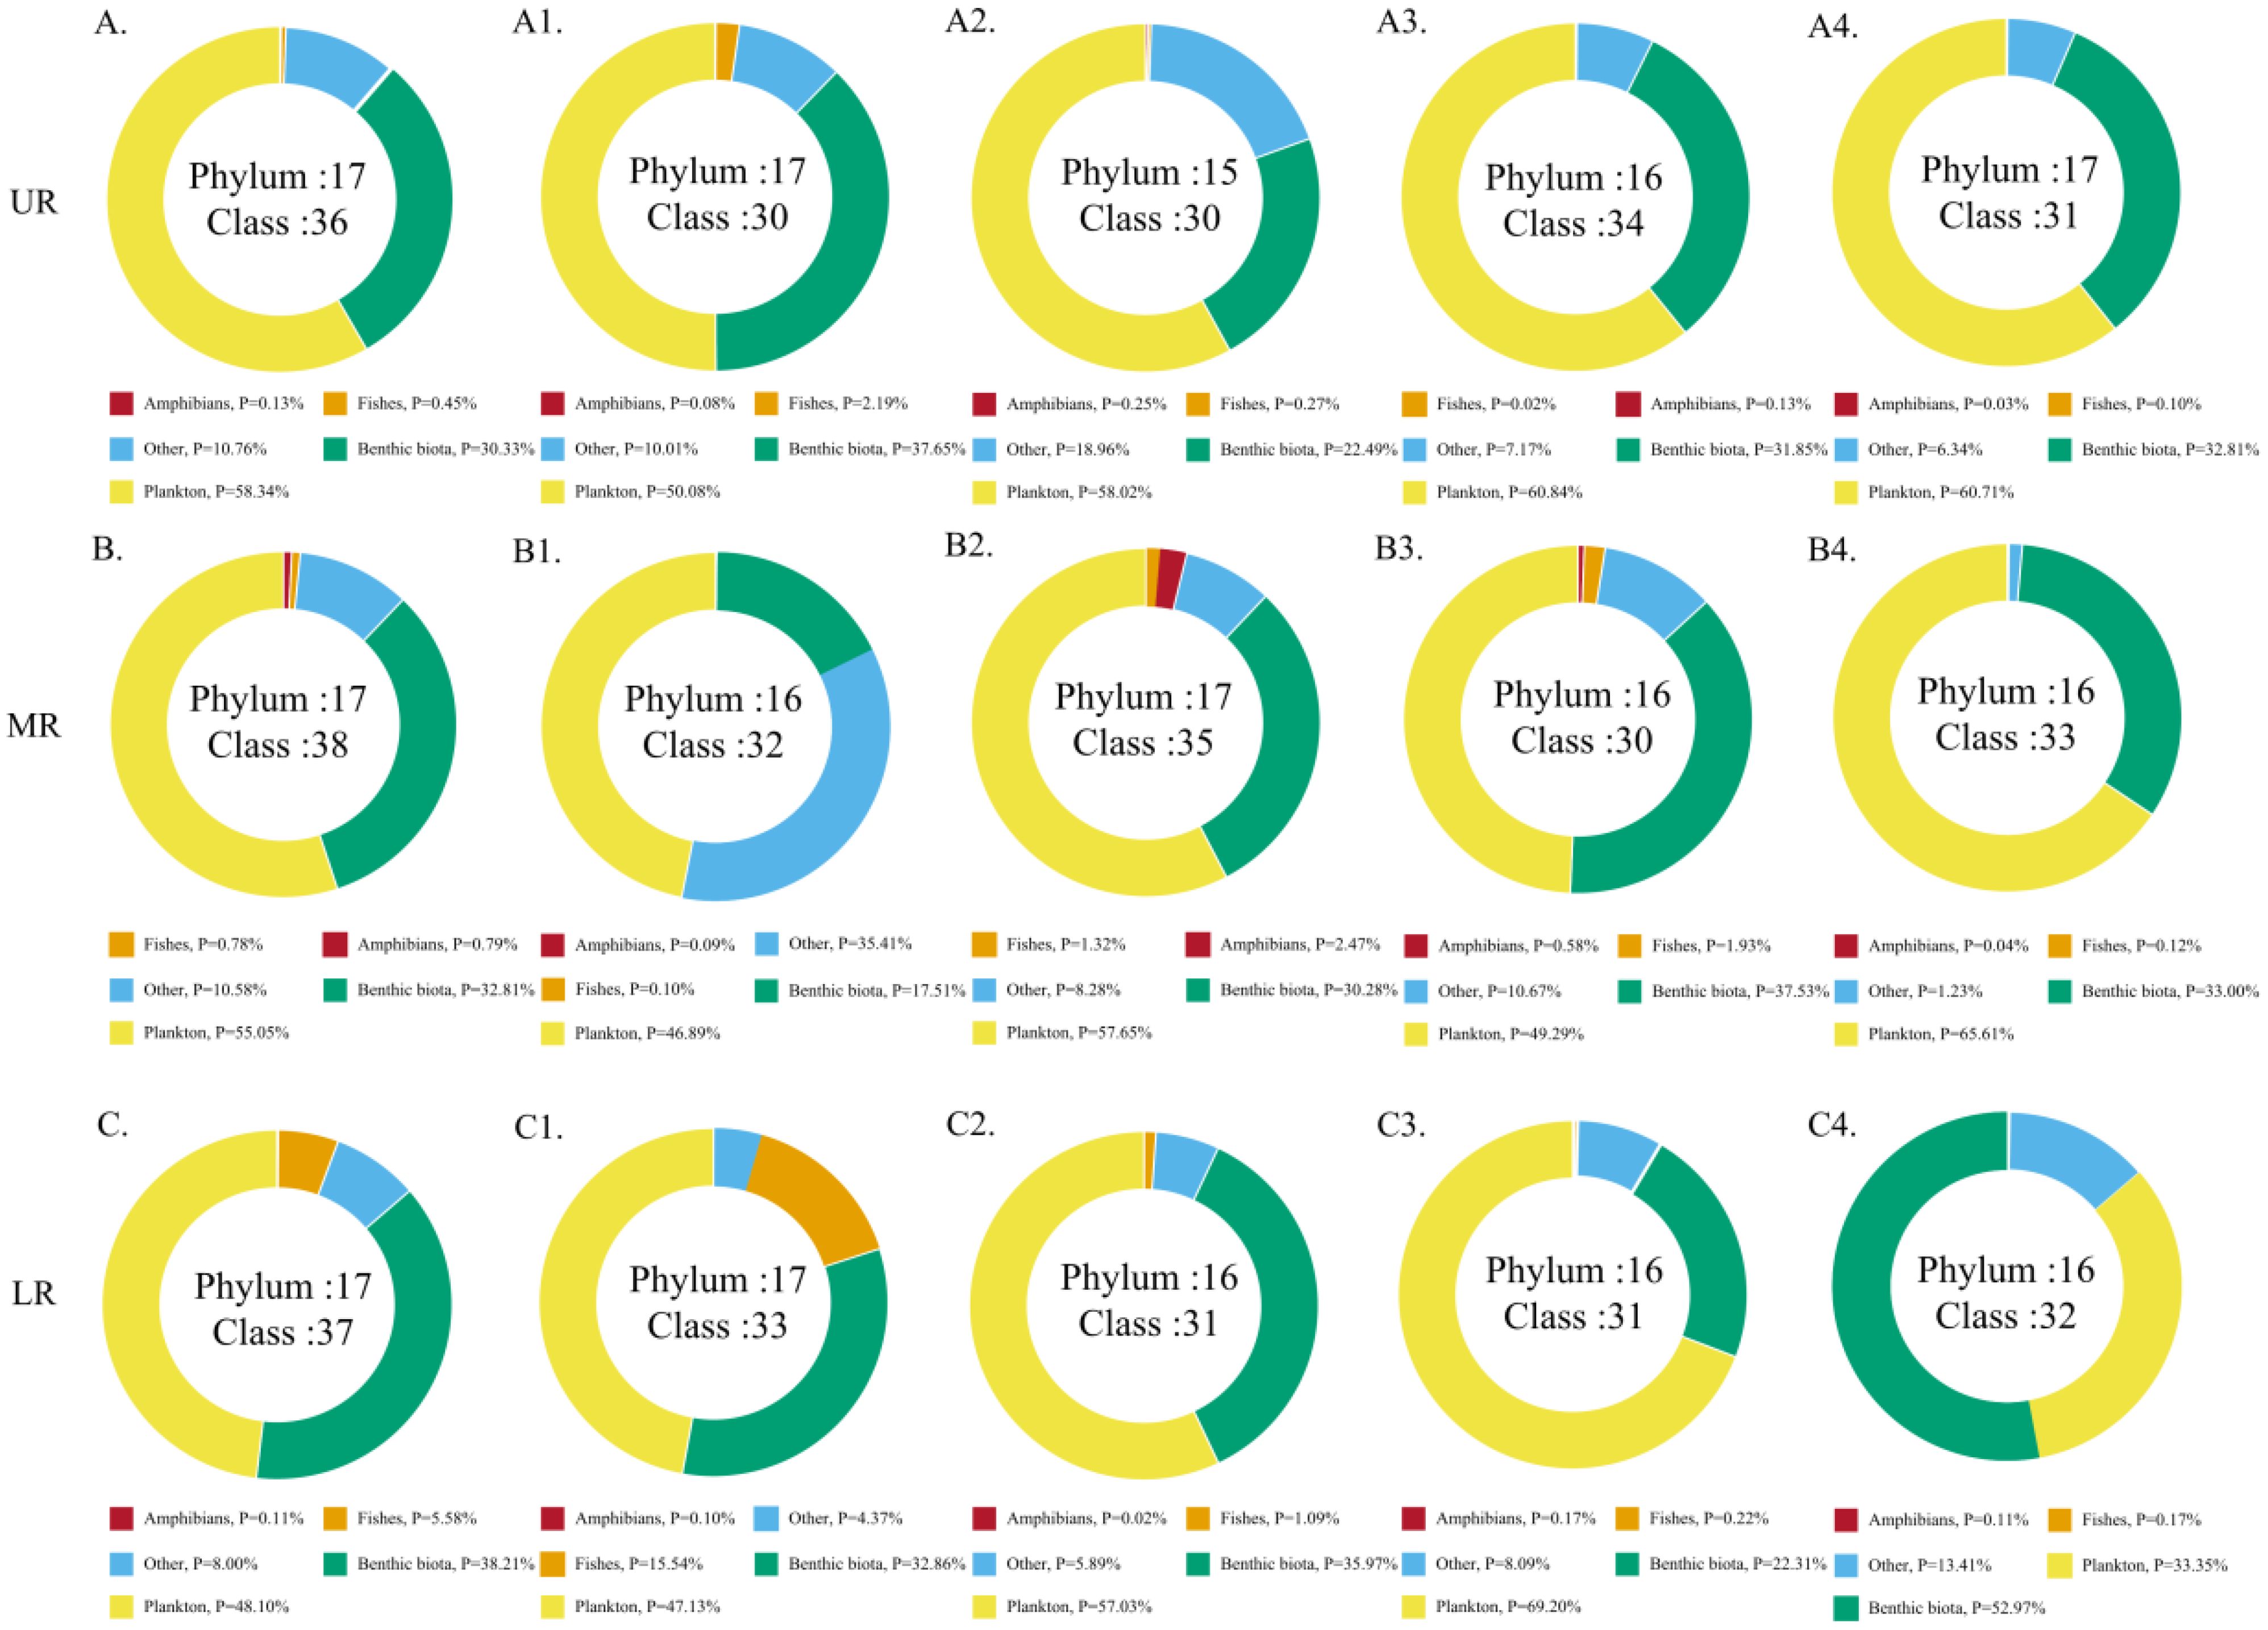
Figure 2. Percentage of the five major taxa in each river section (A–C) and reservoir area (A1: HJD, A2: PD, A3: YZD, A4: DF, B1: SFY, B2: WJD, B3: GPT, B4: SL, C1: ST, C2: PS, C3: YP, C4: FL).
After removing low abundance MOTUs (sequence abundance less than 0.01% of the total sequences), the eDNA analysis revealed 724 MOTUs belonging to 17 phyla and 38 classes within five taxa (fishes, amphibians, benthic species, plankton, and others). Specifically, fishes had 22 MOTUs in 1 phylum and 1 class, amphibians had 7 MOTUs in 1 phylum and 1 order, benthic species had 402 MOTUs in 3 phyla and 7 classes, plankton had 179 MOTUs in 7 phyla and 17 classes, and 114 MOTUs in 8 phyla and 12 classes of other species, with benthic species exhibiting dominance in taxonomic abundance. The dilution curves indicated that the sequencing depth of the 36 samples analyzed in this study could cover all taxa, suggesting minimal variation in the abundance of MOTU across samples (Supplementary Figure 1).
3.2 Comparison of taxonomic diversity of aquatic organisms in different river sections
In this study, 36 samples were grouped into two subgroups based on the reservoir area and the upper, middle and lower reaches of the river to compare the taxonomic diversity of aquatic organisms in different river sections. The relative sequence abundance of the five major taxa varied in different river sections; among them, in the FL section, the benthic taxa accounted for the highest proportion, followed by planktonic taxa. In the SFY reservoir area, planktonic taxa accounted for the highest proportion, with other taxa accounting for the second highest proportion. In the remaining reservoir areas, planktonic taxa accounted for the highest proportion of the relative sequence abundance, and benthic taxa accounted for the second (Figure 2). Histograms depicting the relative sequence abundance at the phylum and class levels in each river segment revealed that the highest relative sequence abundance was found in Arthropoda and the Haptophyta. Furthermore, the SL reservoir area exhibited the highest total relative sequence abundance, whereas the YP reservoir area showed the lowest total relative sequence abundance. Additionally, a decrease trend in the total sequence abundance was observed in the UR, MR, and LR corresponding to a decrease in altitude gradient (Figures 3A2, B2).
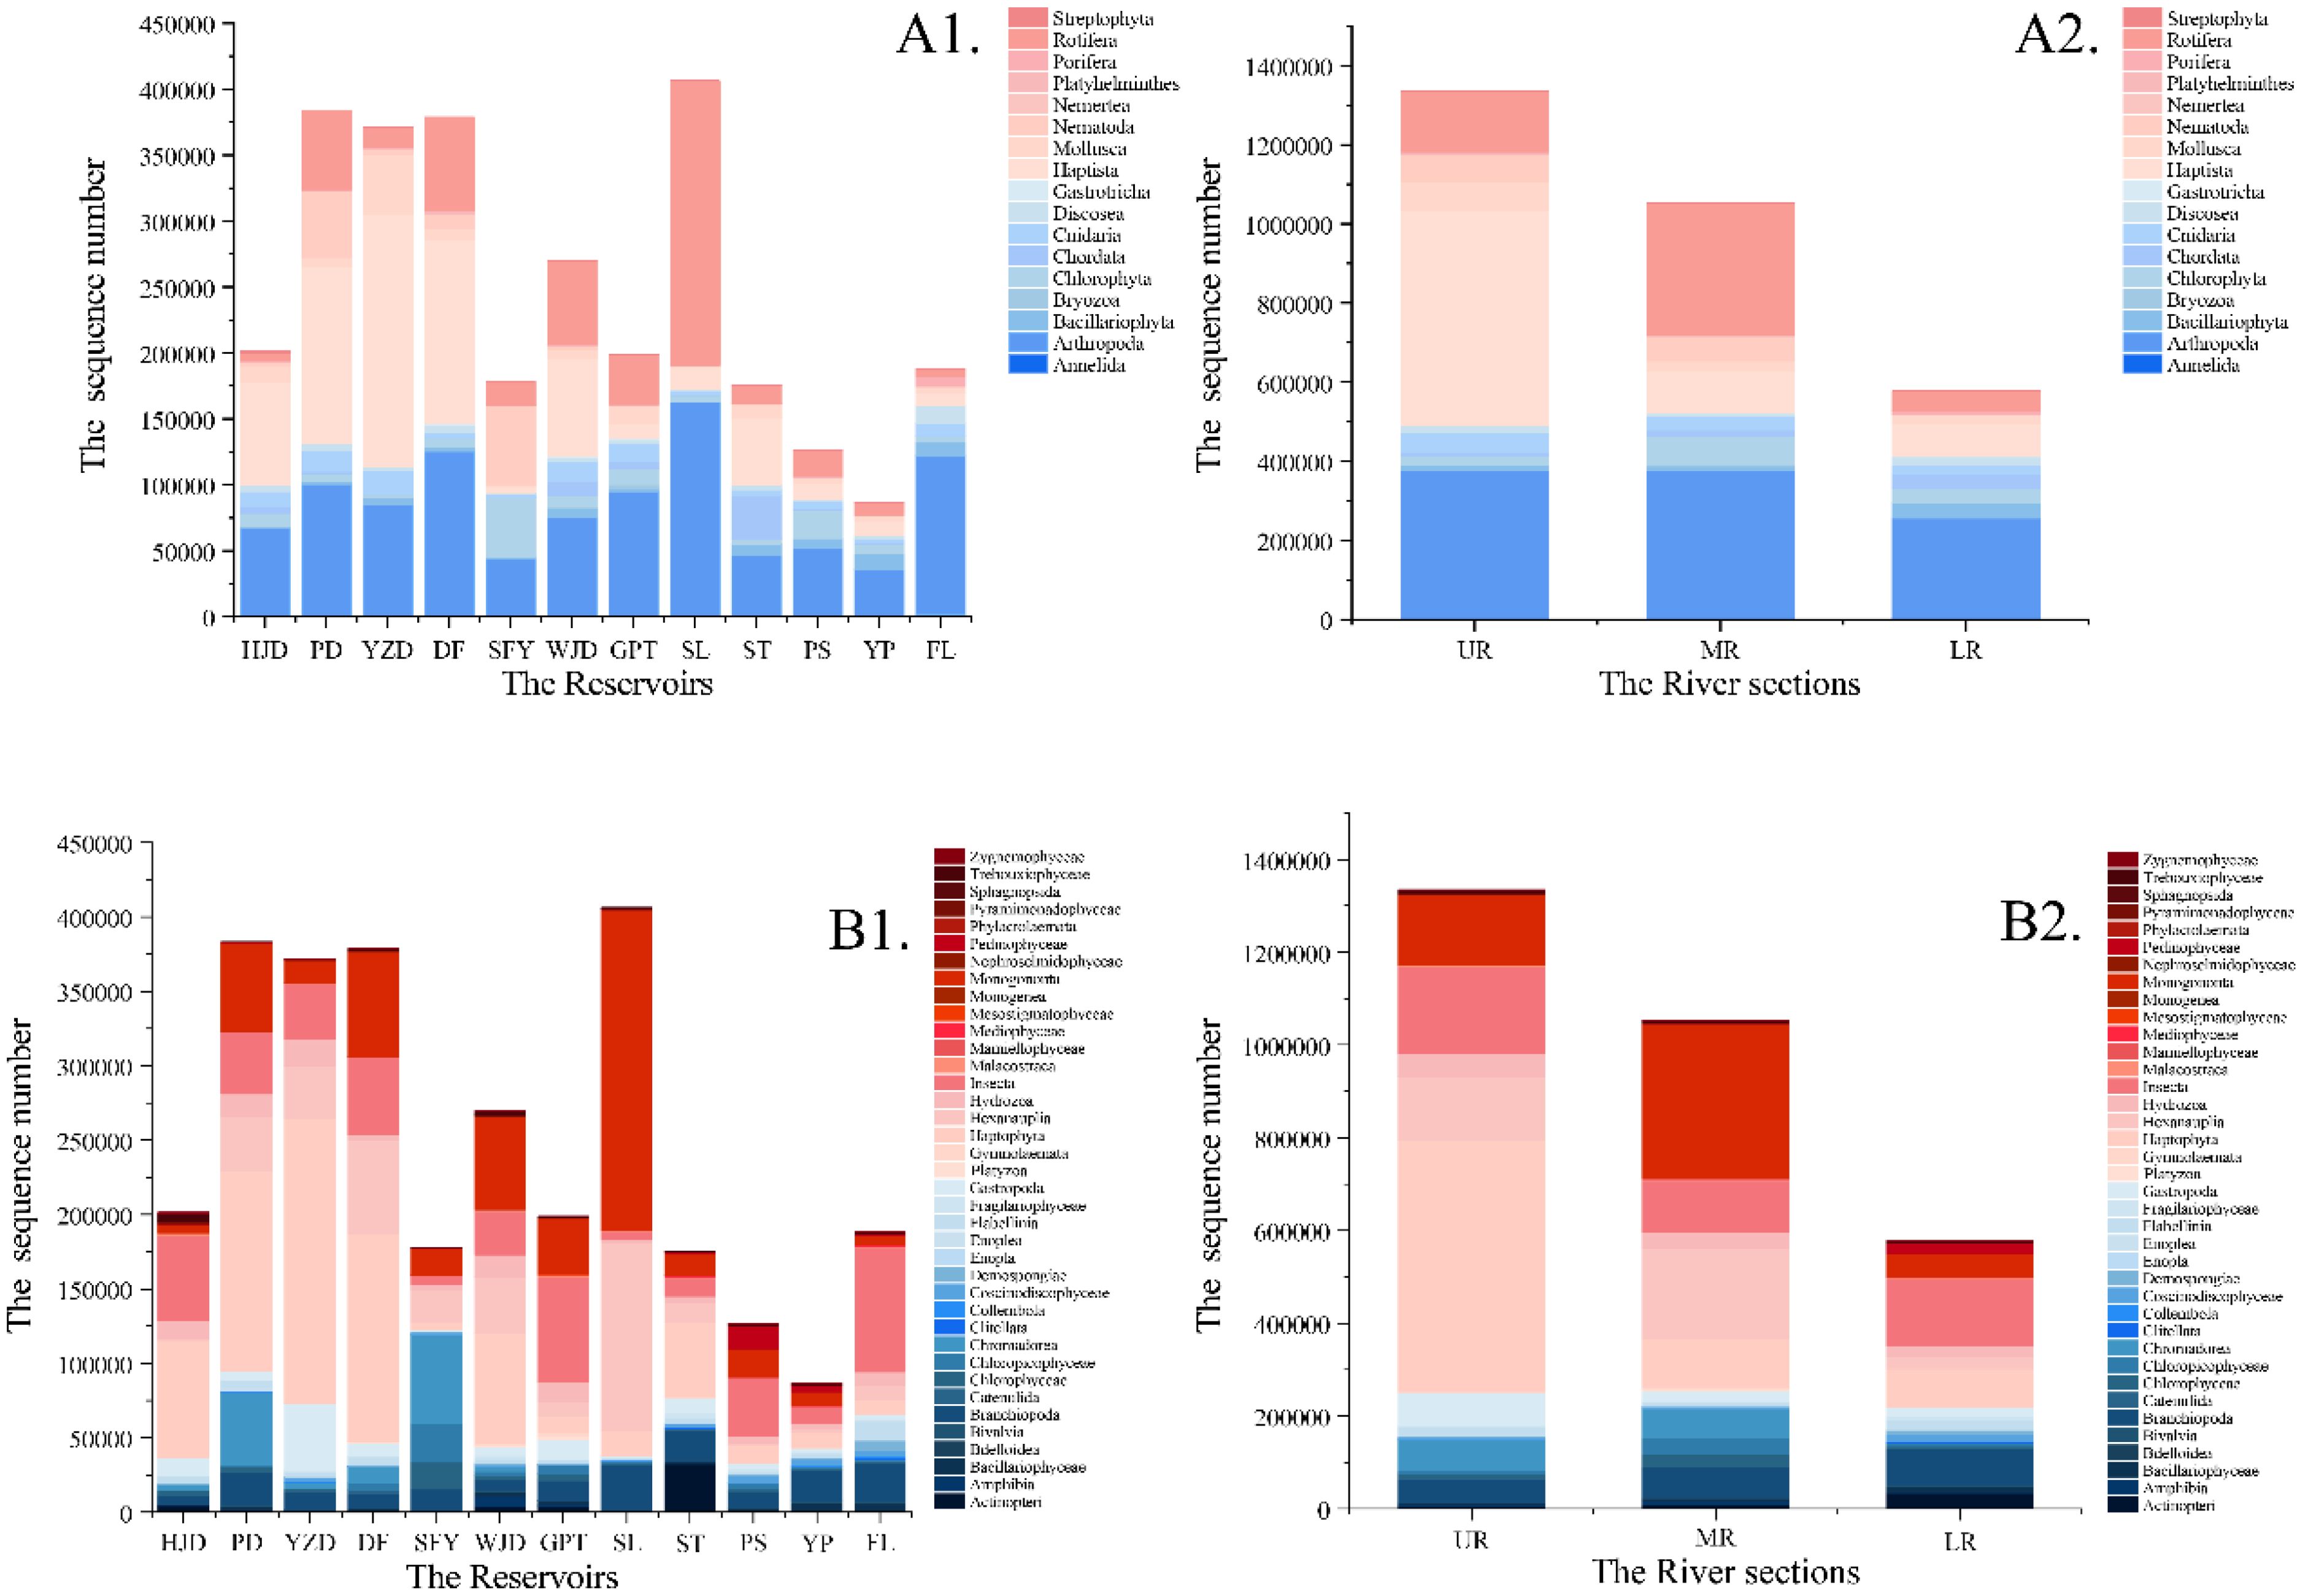
Figure 3. Histograms of sequence number at phylum level (A1, A2) and class level (B1, B2) for each river section and reservoir area.
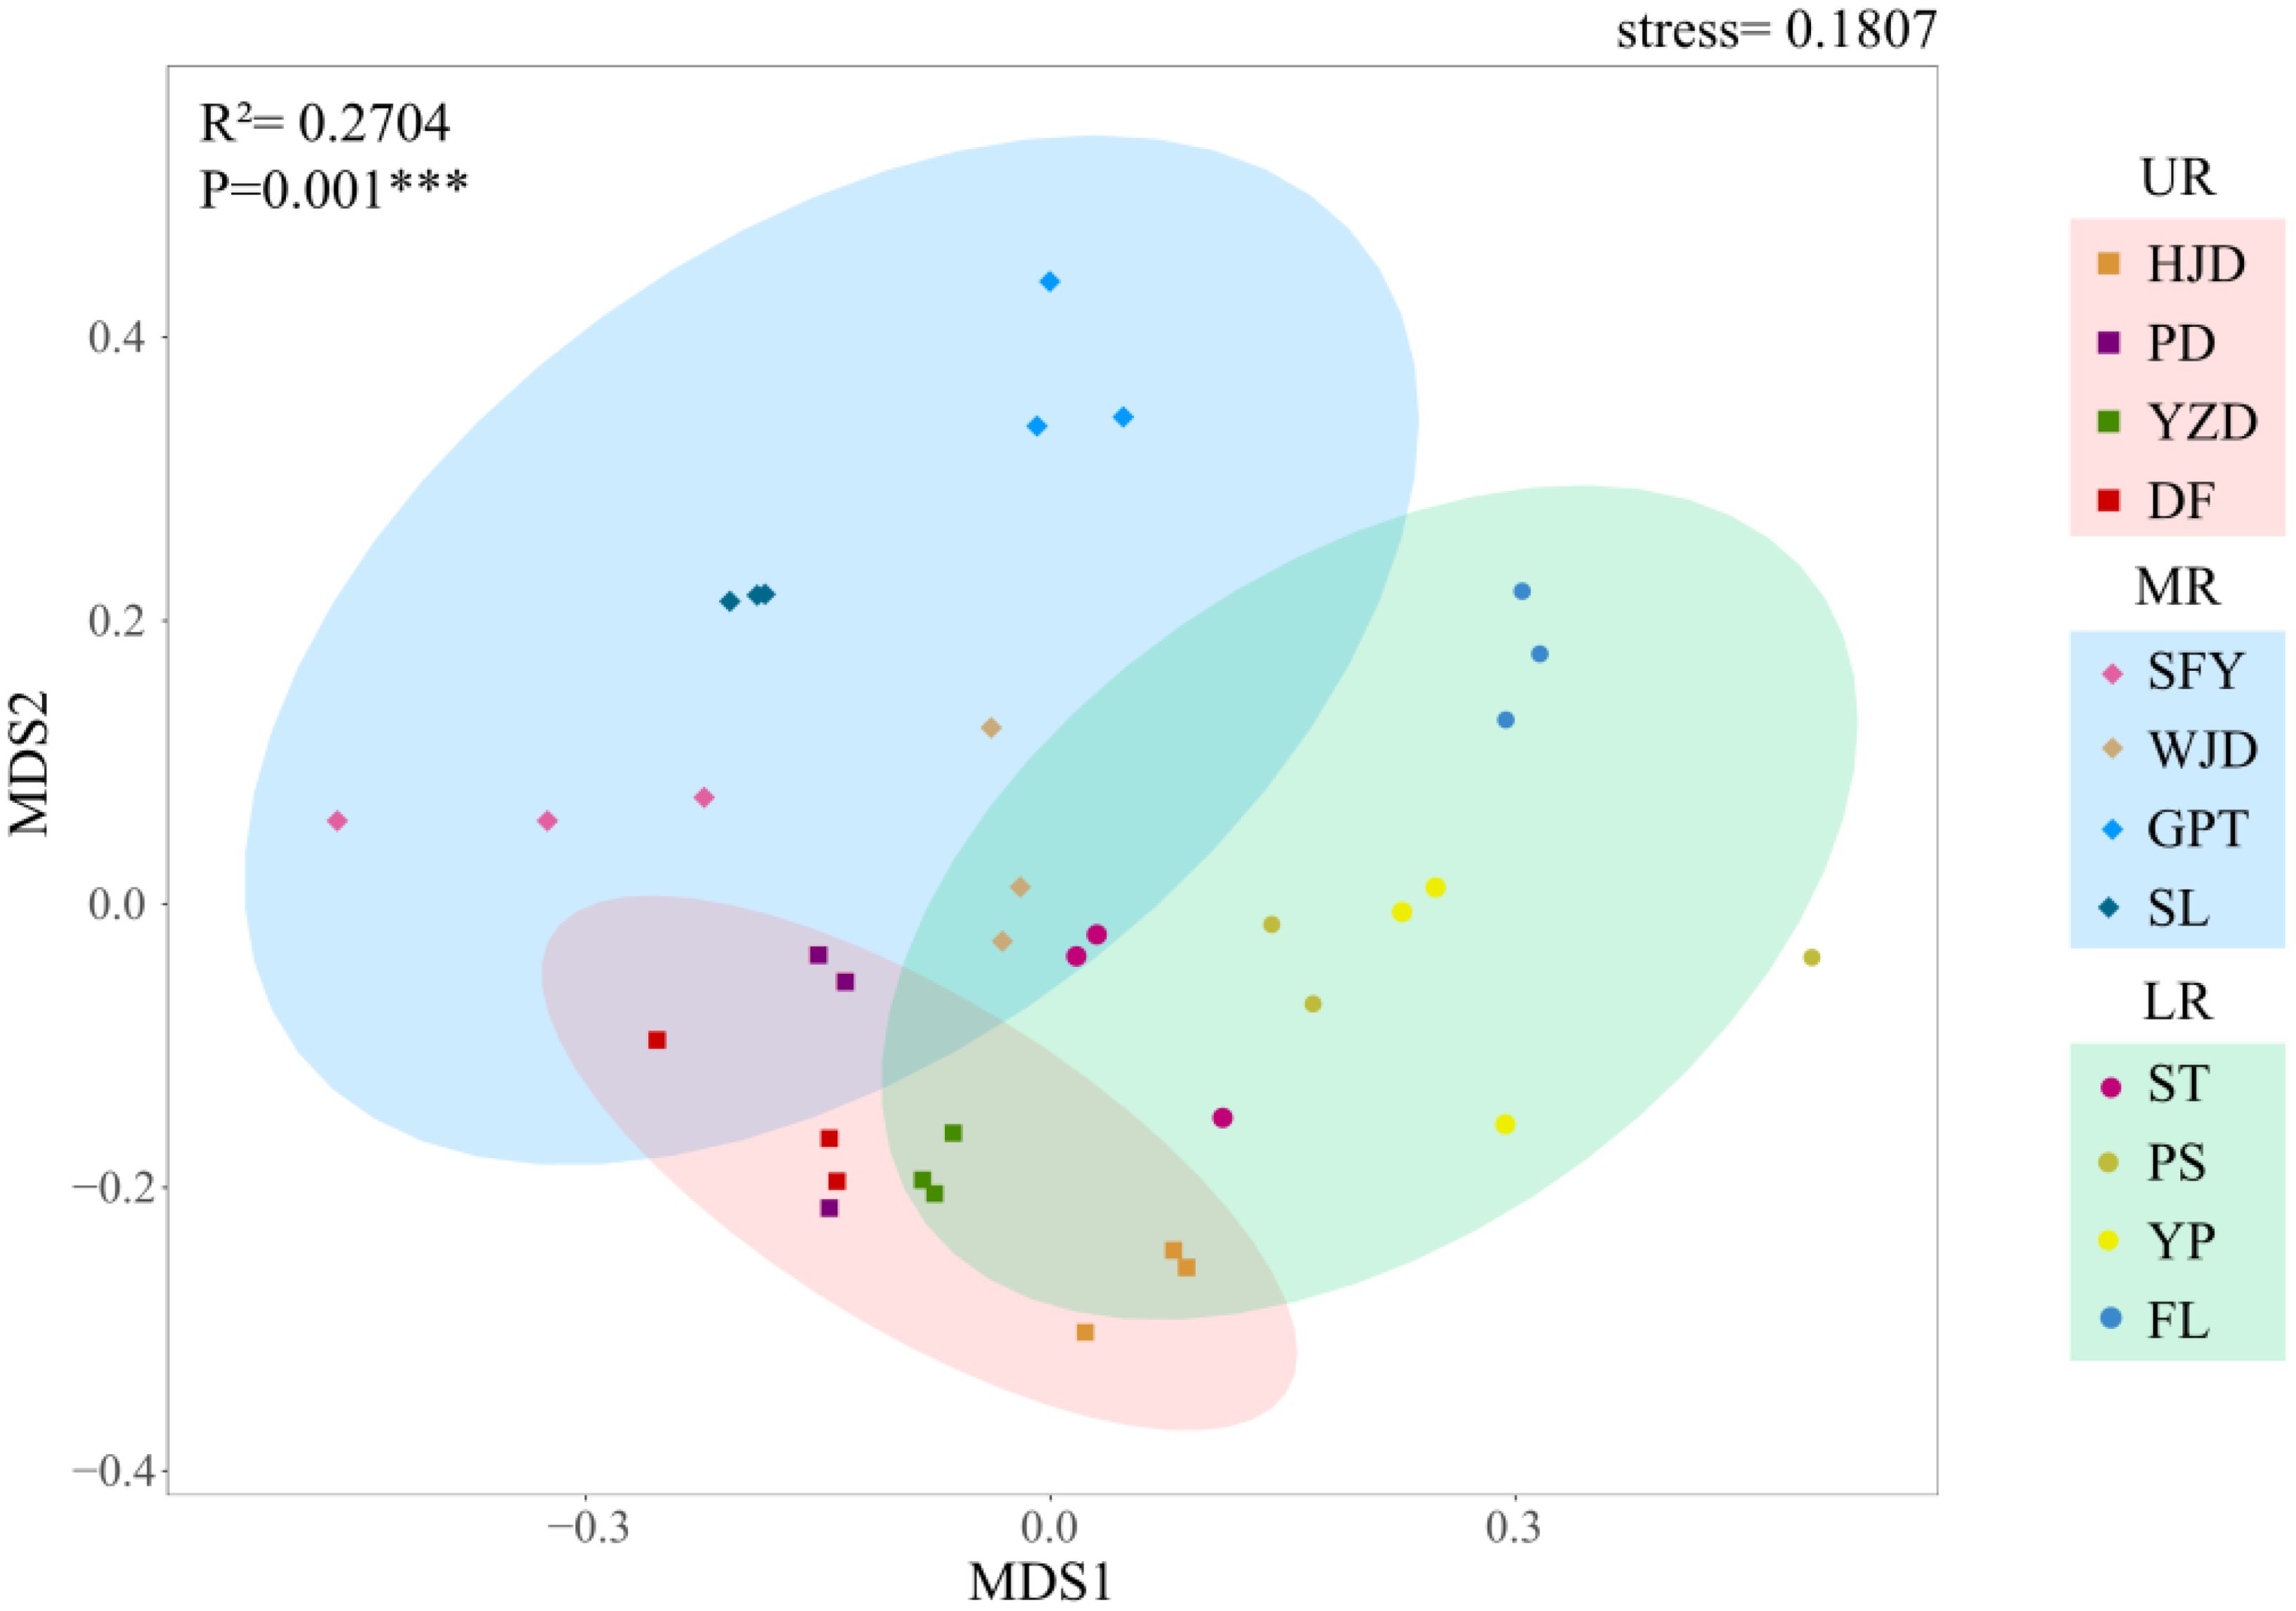
The alpha diversity was assessed for each river section, and the findings showed that for reservoir area grouping, no significant difference occurred between reservoirs for the other indices, except for the Simpson index in the GPT reservoir, which was significantly higher than that in the YZD reservoir, while the three indices exhibited the consistent trend. Considering the grouping of the upper, middle and lower reaches of the river, the Shannon index, Simpson index, and Pielou index were notably higher in the LR compared to the UR. In contrast, MR did not differ significantly from the UR and LR (Figure 4). In beta diversity, a NMDS analysis utilizing Bray-Curtis distance to investigate the differences in aquatic community composition among the UR, MR, and LR of the Wujiang River (Figure 5). The results showed a significant difference in the composition of the aquatic communities among the UR, MR, and LR of the Wujiang River mainstem (PERMANOVA: R2 = 0.27, p=0.001), with a stress value of 0.1807. This indicated that the analysis had interpretive significance for the results of this research.
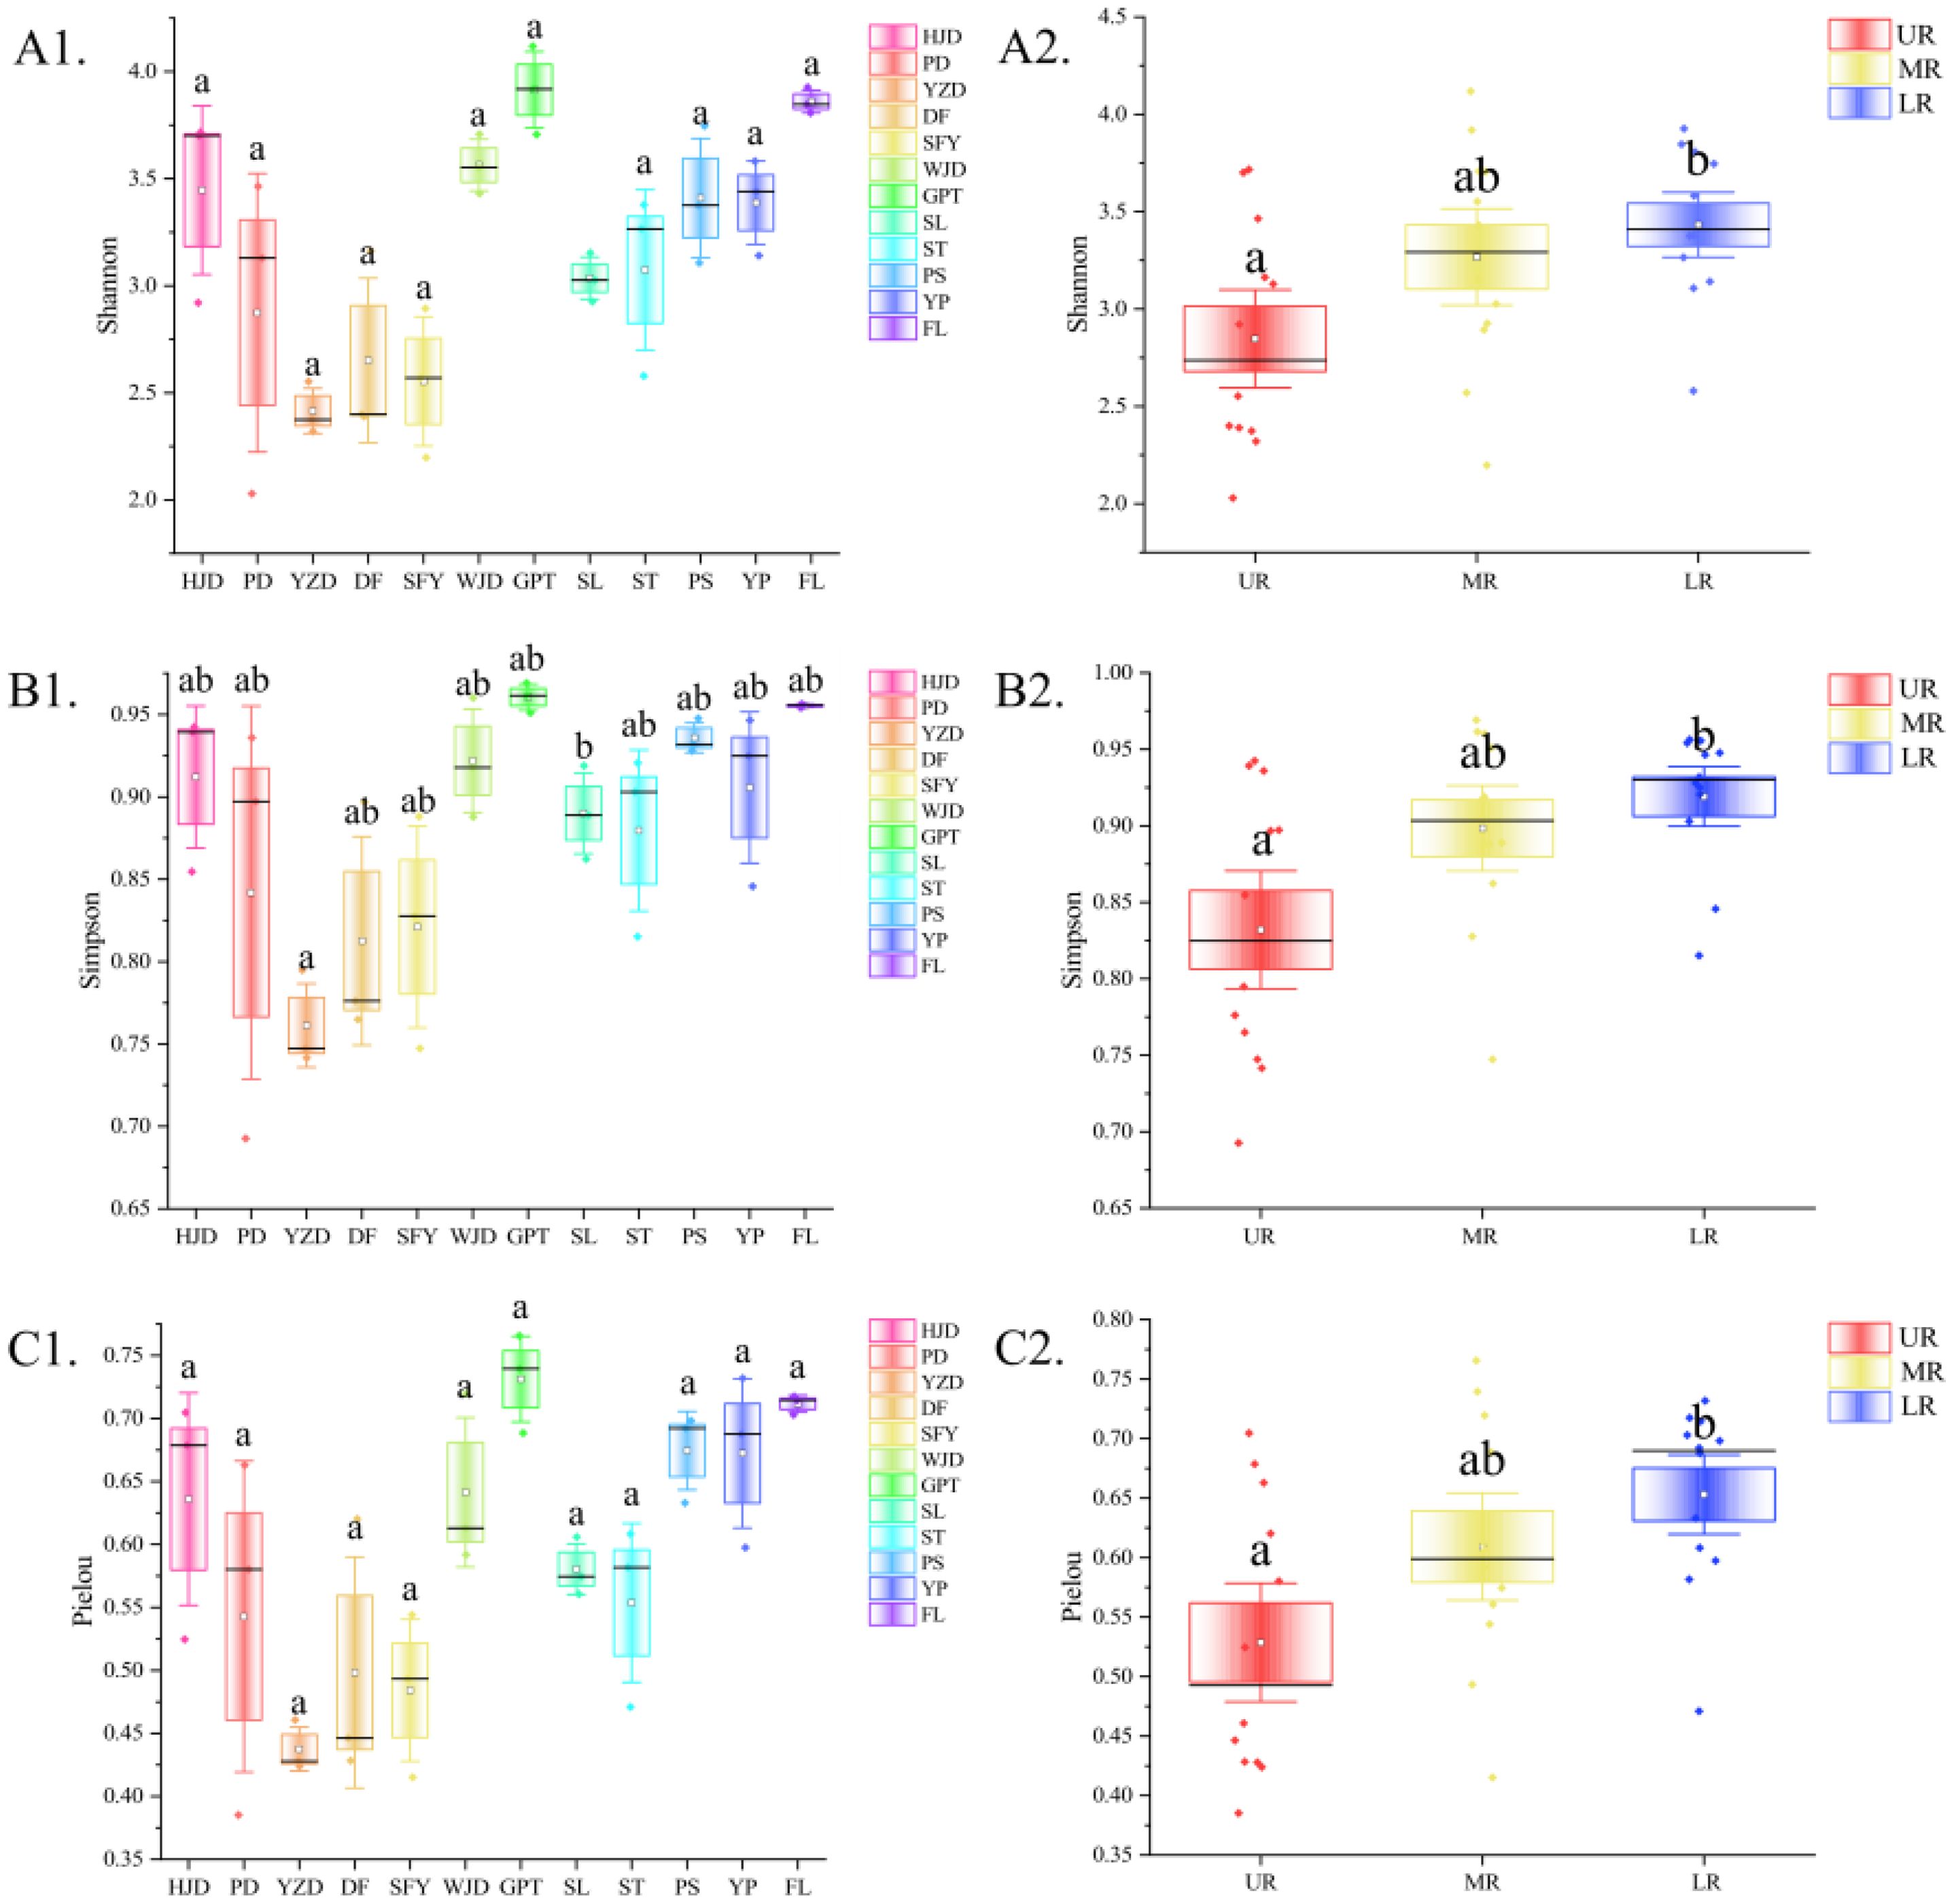
Figure 4. Alpha diversity indices and their differences (significant differences are indicated by the absence of the same letter) for each reservoir area (A1, B1, C1) and river section (A2, B2, C2).
3.3 Environmental driving factors of the distribution pattern of aquatic biodiversity in the Wujiang mainstem
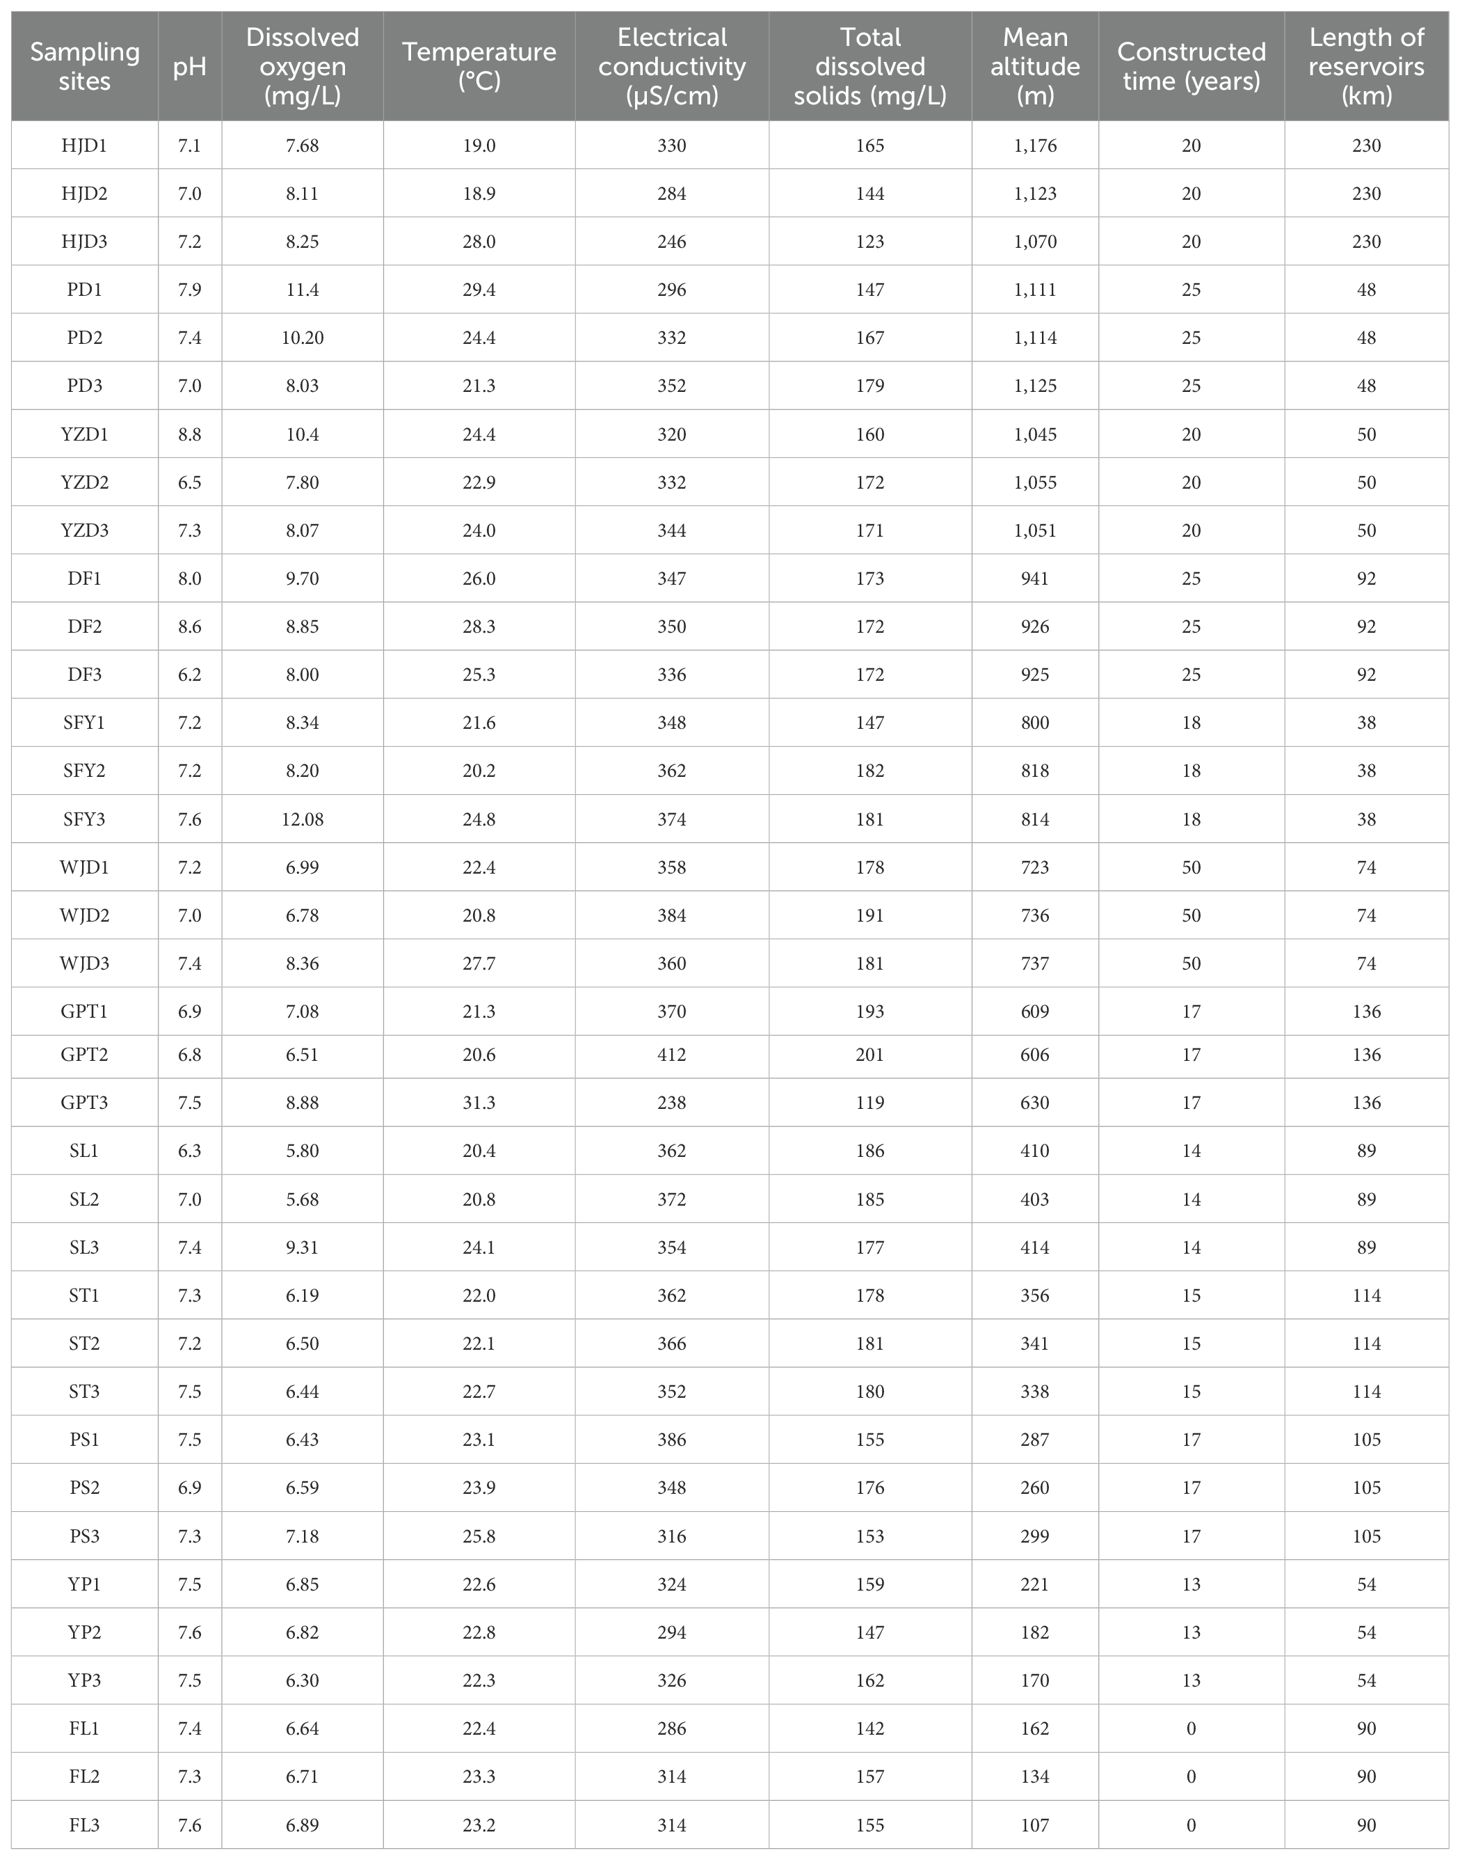
Environmental factors such as altitude, temperature, and dissolved oxygen were collected at the time of sample collection (Table 1) to investigate the relationship between the distribution of aquatic communities in the Wujiang River mainstem and each environmental factor. DCA revealed that the first axis value was less than 4 (Figure 6A), and RDA analysis was conducted to further showed the correlation between environmental factors and aquatic communities. The results of the RDA indicated that dissolved oxygen, altitude, reservoir length and time of reservoir construction significantly influenced the distribution of aquatic communities in the mainstem of the Wujiang River (Figure 6B). Overall, the correlation between aquatic communities and each environmental factor decreased from the upper reaches to the lower reaches, and the aquatic communities in the lower reaches exhibited the lowest correlation with each environmental factor (Figure 6B). From the perspective of the reservoir area, the distribution of aquatic organisms in the HJD, PD, YZD and DF reservoir areas in the UR, located at a higher altitude, showed a higher correlation with altitude and dissolved oxygen. Similarly, the distribution of aquatic organisms in the HJD and GPT reservoirs, which are longer than other reservoirs, demonstrated a higher correlation with their respective lengths. Additionally, the time of reservoir construction for the HJD, PD, YZD and DF reservoir areas in the UR, and the WJD reservoir area in the MR, exceeded 20 years, indicating a high positive correlation between the time of reservoir construction and the distribution of aquatic organisms in these areas.
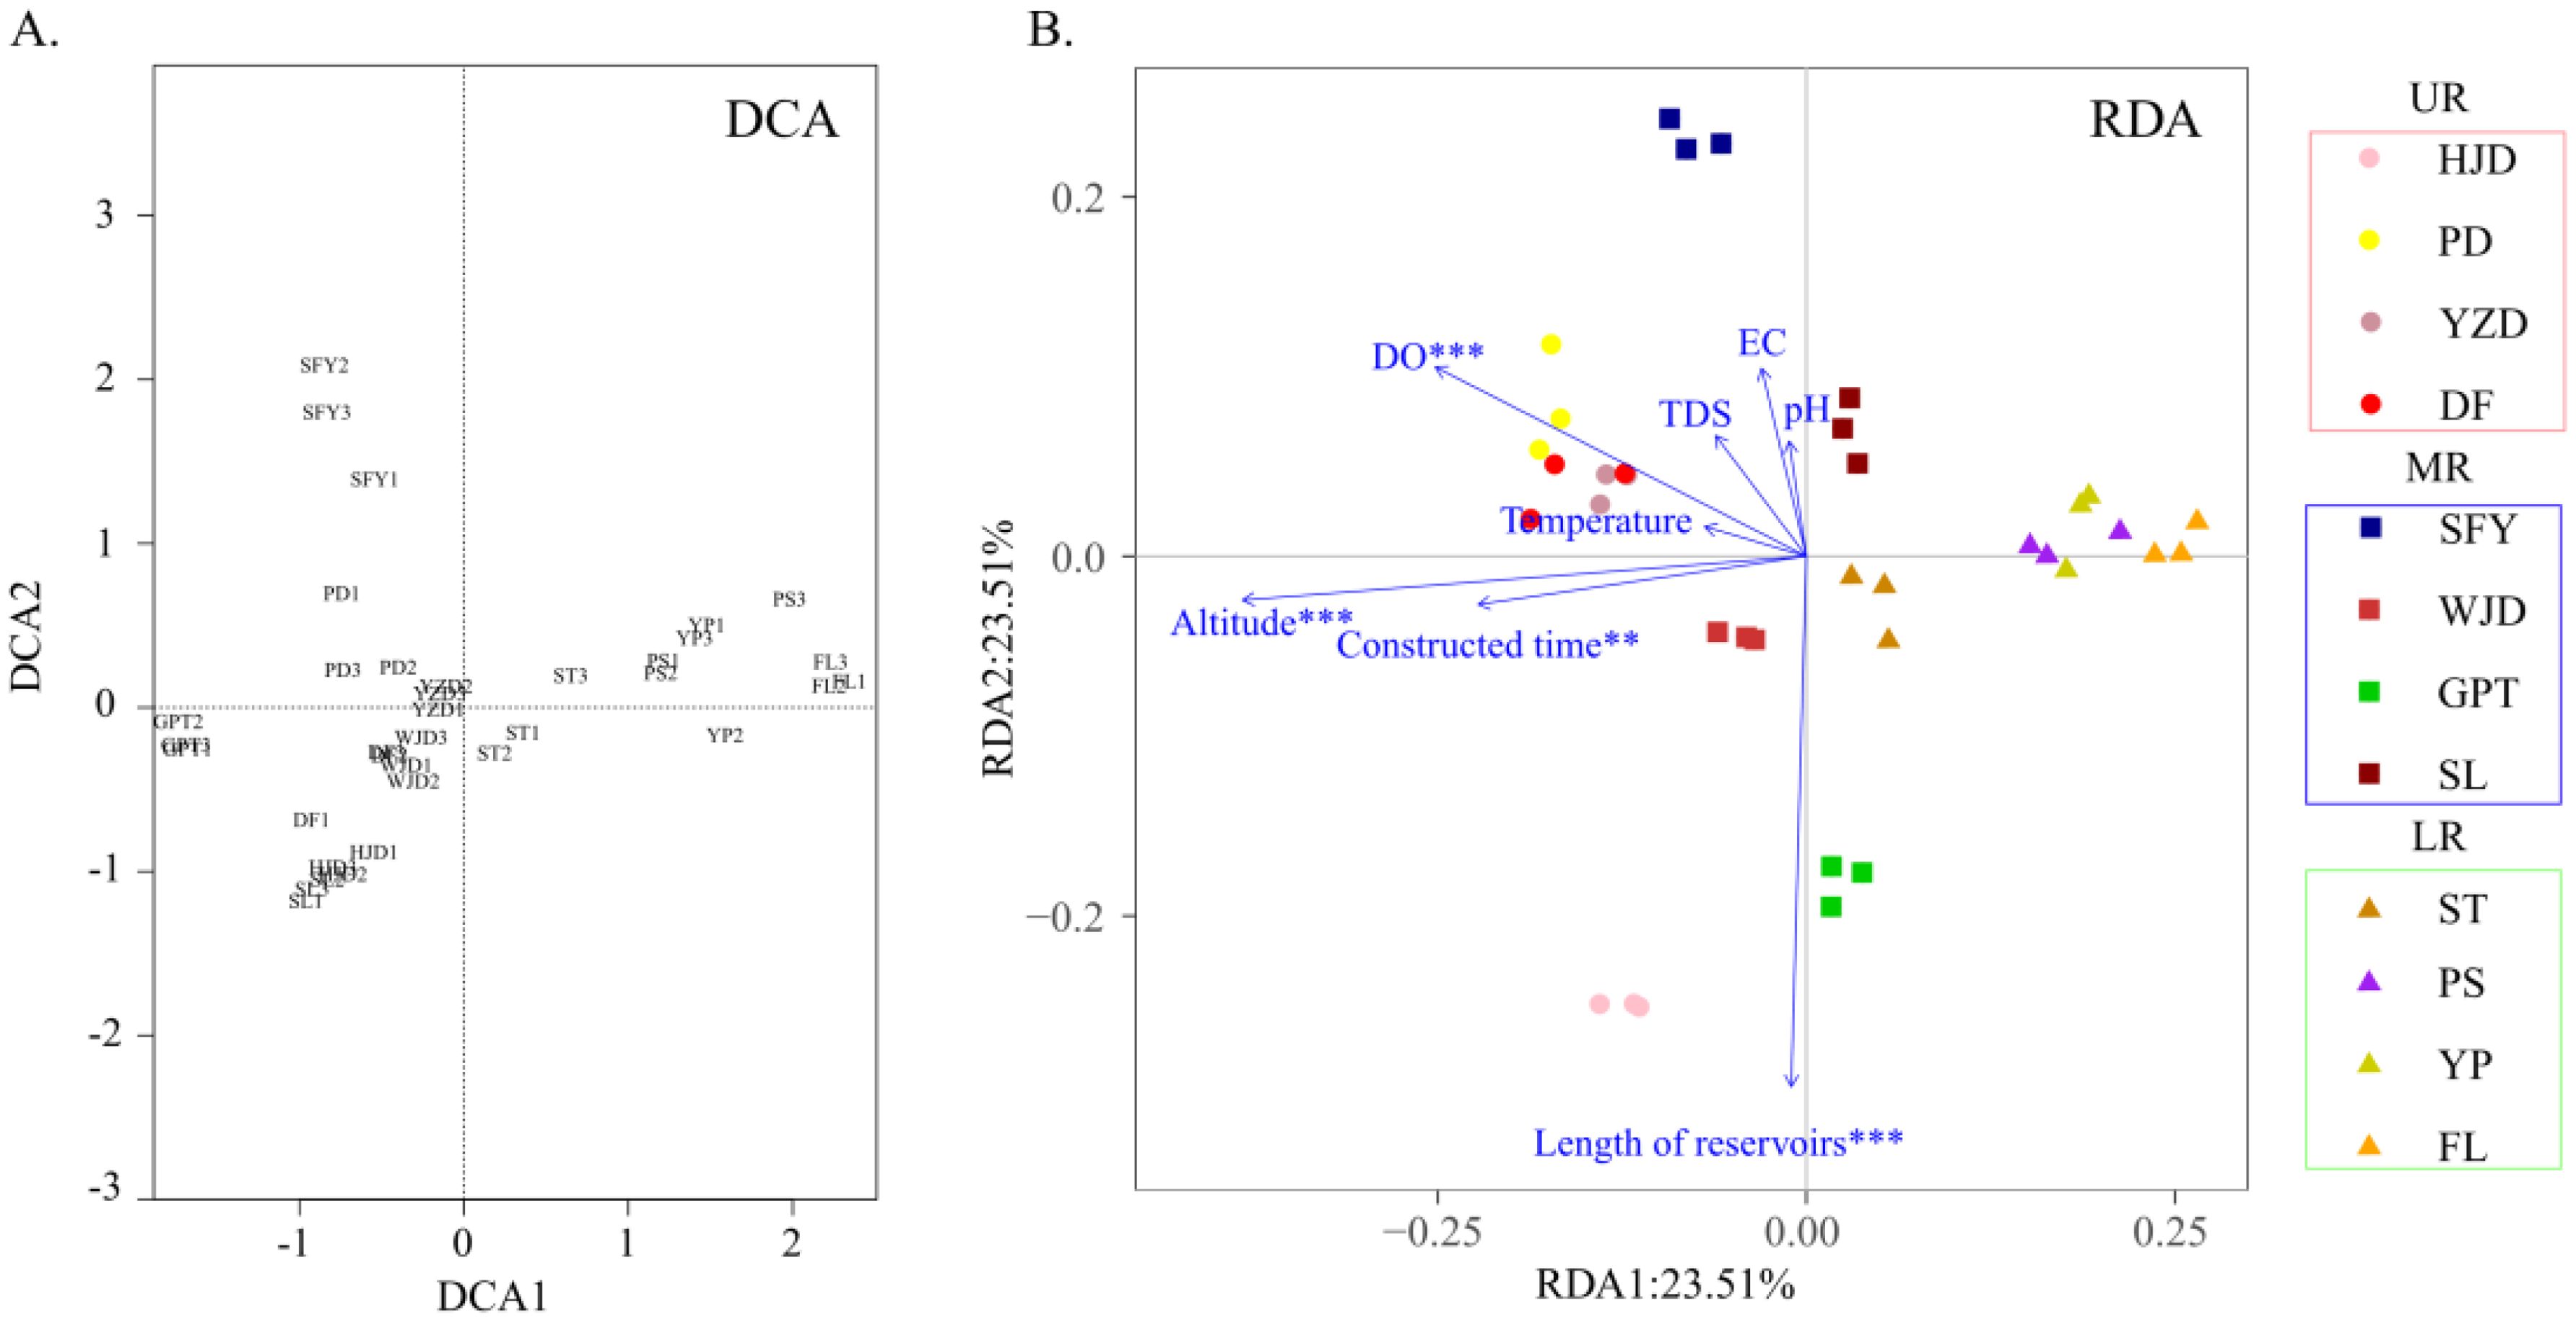
Figure 6. DCA analysis (A) and correlation analysis between environmental factors and aquatic communities (B).
4 Discussion
4.1 Effectiveness of using eDNA to detect aquatic communities in the Wujiang River mainstem
In this study, the eDNA method was used to identify 17 phyla and 38 classes of aquatic organisms which included a wide range of aquatic communities, from small plankton to large vertebrates, in the mainstem of the Wujiang River. The findings provided preliminary overview of the aquatic biodiversity in the mainstream of the Wujiang River and demonstrate the applicability of the eDNA method in detecting the diversity of aquatic organisms. Concerning relative sequence abundance, planktonic species are highly dominant and are abundant in the surface waters of the river (Suter et al., 2021). Therefore, the enrichment of water samples results in a significant increase in plankton, with a higher sequence abundance compared to other organism categories. Benthic organisms, predominantly small invertebrates, exhibit a higher advantage of taxonomic diversity. The constantly changing geography of the river bottom and the nutrient-rich sediments provide suitable conditions for various benthic organisms, facilitating activities of benthic organisms, such as reproduction, migration, and interpenetration, thus increasing the diversity of benthic organisms. Although the presence of uncontrollable biotic and abiotic factors influencing the production, release, transport, and persistence of eDNA, our findings related to aquatic biodiversity showed that eDNA metabarcoding is a valuable technique for characterizing the aquatic biodiversity and monitoring ecosystems (Bista et al., 2017; Luca et al., 2020).
4.2 Differences in the distribution of aquatic communities in different river sections
The presence of different habitats along the different sections of the Wujiang River mainstem is attributed to environmental gradients, the construction of dams, and some anthropogenic activities. The sequence number of aquatic communities in the Wujiang River mainstem exhibited a decreasing trend from upper to lower reaches (Figure 3), whereas the sequence number of fish displayed an increasing trend from upper to lower reaches (Figure 2). Most of the aquatic communities detected by eDNA in the mainstem of the Wujiang River were dominated by tiny benthic and planktonic species, which mostly included organisms used as fish bait (Yang et al., 2020). Therefore, when the number of fish increased, the number of small aquatic organisms that fish preyed upon decreases, resulting in a decrease in the sequence number of the overall aquatic community, and a reverse trend in the sequence number of fish and the overall aquatic community.
Additionally, variations in the diversity of aquatic community composition were observed among different river sections in the Wujiang River mainstem. The aquatic community richness in the GPT reservoir area was considerably higher than that in the YZD reservoir area, probably because the GPT reservoir area has a longer length and more tributaries, resulting in the availability of more variable habitats and abundant nutrients conducive to the growth and development of aquatic organisms (Granzotti et al., 2018; Zou et al., 2021). Therefore, abundant aquatic groups were recorded in this reservoir area and their distribution was relatively even. Additionally, significant differences in the diversity and composition of aquatic communities were observed in the upper, middle and lower reaches of the Wujiang River mainstem, exhibiting an increasing trend along the declining altitude gradient, which was similar to other studies (Colbert, 1980; MacArthur, 1984). A study showed that higher altitudes have more fragile ecosystems and lower benthic community richness (Colbert, 1980). Meanwhile, the distribution of aquatic communities may also be related to the distribution of plants in the riparian zone, particularly in higher altitude riparian zones that are more homogeneous and at a greater risk of loss, which can lead to a decrease in the richness of aquatic communities (Hieber et al., 2003; Niskanen et al., 2019).
4.3 Environmental driving factors of the distribution pattern of aquatic biodiversity in the Wujiang mainstem
A barrier was made across the river due to the construction of the dam, which disrupted the continuous ecosystem and led to significant changes in hydrological conditions, thus affecting the distribution of aquatic communities (Liu et al., 2017). In this study, a significant positive correlation was found between the length of the reservoir area, the time of reservoir construction, and the distribution of aquatic communities in the Wujiang River mainstem. The findings suggested that longer reservoirs may mitigate the impact of hydropower development on aquatic biodiversity (Zhang, 2018). This was also validated by the fact that a higher aquatic community richness was recorded in the two longest reservoirs (HJD and GPT reservoirs). Meanwhile, the longer the time after the reservoir construction, the more stable the ecosystem was found to be in the reservoir area, which led to an increase in the richness of the aquatic community (Dong et al., 2019; Wei et al., 2021). This finding matched the observation made in this study that longer reservoir construction times corresponded to higher community richness of aquatic organisms in the reservoir area. Thus, to protect the aquatic communities in the river sections affected by the terraced hydropower development, increasing the distance between the hydropower stations and implementing monitoring and protection measures for many years might be effective strategies.
Dissolved oxygen and altitude are important environmental factors that can influence species distribution (He et al., 2020; Prommi and Payakka, 2015). The study found a significant positive correlation between the distribution of aquatic community and dissolved oxygen and altitude. As altitude and dissolved oxygen decreased further towards the lower reaches, the richness of aquatic communities increased. This suggests that high dissolved oxygen and high altitude restrict the increase in aquatic community richness, which was also found in other studies (Colbert, 1980; Prommi and Payakka, 2015; Zhu et al., 2022). This result may be related to the fact that high dissolved oxygen is detrimental to the proliferation of aquatic plants but favor macrobenthos (Wenqiang et al., 2023). Additionally, plankton accounted for a higher relative sequence abundance in this study, indicating a higher correlation with dissolved oxygen. Species inhabiting a higher altitude are at a higher risk of extinction and the ecosystem is more susceptible to disturbances. Thus, we should pay more attention to areas at a higher altitude when conserving aquatic biodiversity.
4.4 Limitations in detecting aquatic communities using eDNA
The eDNA metabarcoding of water samples provides quick access to aquatic biodiversity in rivers, but the results obtained are crude (Zhang et al., 2023). Although selecting a single primer for labeling is more convenient and economical, the COI primers selected offer great versatility and can amplify fragments of only a few hundred base pairs, which may have low genetic variability to accurately differentiate among closely related species (Elbrecht et al., 2017), and the error in identifying a more accurate taxonomic unit result would be large. Consequently, identifying to the phylum and class levels to improve accuracy. To improve the precision of species identification in biodiversity analyses using eDNA metabarcoding, researchers may use multiple primer markers, which can increase taxonomic resolution and identification accuracy (Pablo et al., 2021). Additionally, increasing the frequency of sampling and the number of sampling points can further improve the reliability of the results. eDNA present in rivers may originate from exogenous eDNA input due to some anthropogenic factors (Barnes and Turner, 2016). Meanwhile, as the processing of eDNA is highly susceptible to contamination from exogenous DNA, the chances of recording false positive results for eDNA are quite high. In this study, contamination was rigorously managed throughout the processing of eDNA, and the resulting sequences were strictly filtered and removed. Additionally, MOTUs with limited sequence reads were excluded to minimize the occurrence of false positive results. Despite these efforts, false positive signals seriously affect eDNA data (Furlan et al., 2020). Therefore, the accuracy of eDNA results should be verified in conjunction with traditional survey methods. Additionally, environmental factors can affect the stability and persistence of eDNA (Barnes et al., 2014). However, some studies have found that most eDNA degradation occurs within 10 days, while some can last for months (Eichmiller et al., 2016). Although eDNA can denature under very high temperatures (>50°C), the degradation rate is lowest under cold conditions (Eichmiller et al., 2016). Therefore, we immediately placed the water samples into a refrigerated environment after collection and promptly transported them to the laboratory for filtration within 10 hours. These measures all contribute to improving the detection of eDNA.
5 Conclusion
The findings of this study indicated that the most abundant class is the benthic organisms, and the least abundant class is the amphibians in the Wujiang River mainstem. The aquatic biodiversity had a longitudinal distribution pattern along the river altitudinal gradient. The richness of the aquatic biological community increases as one goes further downstream. The results also showed that altitude, dissolved oxygen, reservoir length, and reservoir construction time were the key drivers affecting the distribution of aquatic communities. Meanwhile, the eDNA metabarcoding technology is applicable to detect the aquatic biodiversity in the Wujiang River mainstem.
Data availability statement
The datasets presented in this study can be found in online repositories. The names of the repository/repositories and accession number(s) can be found in the article/Supplementary Material.
Ethics statement
This study did not involve any live animals, and fish species were obtained by collecting river water samples for environmental DNA analysis. The animal study was approved by the Ethics Committee of Chongqing Normal University. The study was conducted in accordance with the local legislation and institutional requirements.
Author contributions
YS: Writing – review & editing, Funding acquisition. XZ: Data curation, Writing – original draft. YZ: Investigation, Writing – original draft. QL: Investigation, Writing – original draft. JZ: Software, Writing – original draft. RC: Formal analysis, Writing – review & editing.
Funding
The author(s) declare financial support was received for the research, authorship, and/or publication of this article. This work was supported by the National Natural Science Foundation of China (Grant No. 32202939).
Acknowledgments
The authors sincerely thank all the crew members for their help with manuscript writing and data analysis.
Conflict of interest
The authors declare that the research was conducted in the absence of any commercial or financial relationships that could be construed as a potential conflict of interest.
Publisher’s note
All claims expressed in this article are solely those of the authors and do not necessarily represent those of their affiliated organizations, or those of the publisher, the editors and the reviewers. Any product that may be evaluated in this article, or claim that may be made by its manufacturer, is not guaranteed or endorsed by the publisher.
Supplementary material
The Supplementary Material for this article can be found online at: https://www.frontiersin.org/articles/10.3389/fmars.2024.1444097/full#supplementary-material
References
Antognazza M. C., Britton R. J., Potter C., Franklin E., Hardouin E. A., Gutmann R. C. (2019). Environmental DNA as a non-invasive sampling tool to detect the spawning distribution of European anadromous shads (Alosa spp.). Aquat. Conservation: Mar. Freshw. Ecosyst. 29, 148–152. doi: 10.1002/aqc.3010
Barbarossa V., Schmitt R. J. P., Huijbregts M. A. J., Zarfl C., King H., Schipper A. M. (2020). Impacts of current and future large dams on the geographic range connectivity of freshwater fish worldwide. Proc. Natl. Acad. Sci. United States America 117, 3648–3655. doi: 10.1073/pnas.1912776117
Barnes M. A., Turner C. R. (2016). The ecology of environmental DNA and implications for conservation genetics. Conserv. Genet. 17, 1–17. doi: 10.1007/s10592-015-0775-4
Barnes M. A., Turner C. R., Jerde C. L., Renshaw M. A., Chadderton W. L., Lodge D. M. (2014). Environmental conditions influence eDNA persistence in aquatic systems. Environ. Sci. Technol. 48, 1819–1827. doi: 10.1021/es404734p
Bista I., Carvalho G. R., Walsh K., Seymour M., Hajibabaei M., Lallias D., et al. (2017). Annual time-series analysis of aqueous eDNA reveals ecologically relevant dynamics of lake ecosystem biodiversity. Nat. Commun. 8, 14087. doi: 10.1038/ncomms14087
Carvalho S., Aylagas E., Villalobos R., Kattan Y., Berumen M., Pearman J. K. (2019). Beyond the visual: using metabarcoding to characterize the hidden reef cryptobiome. Proc. Biol. Sci. 286, 20182697. doi: 10.1098/rspb.2018.2697
Cheng R. L., Luo Y., Zhang Y. F., Li Q. H., Li Y. W., Shen Y. J. (2023a). eDNA metabarcoding reveals differences in fish diversity and community structure in heterogeneous habitat areas shaped by cascade hydropower. Ecol. Evol. 13, e10275. doi: 10.1002/ece3.10275
Cheng R. L., Luo Y., Zhang Y. F., Li Q. H., Wang M., Zhang Y., et al. (2023b). Research on fish diversity of the cascade hydropower reservoir area of the Wujiang River based on environmental DNA technology. J. Fisheries China, 1–19. Available online at: https://kns.cnki.net/kcms/detail/31.1283.S.20230412.1705.006.html.
Cheng R. L., Luo Y., Li Q. H., Zhang Y. F., Liu Z. H., Chen Q. L., et al. (2023c). Application of eDNA metabarcoding for monitoring the fish diversity of the Jiangjin to Fuling section of the upper reaches of the Yangtze River. Hydrobiologia 850, 4067–4088. doi: 10.1007/s10750-023-05297-1
Colbert E. C. (1980). The river continuum concept. Can. J. fisheries Aquat. Sci. 37, 130–137. doi: 10.1139/f80-017
Cui G., Wang B., Xiao J., Qiu X.-L., Liu C.-Q., Li X.-D. (2021). Water column stability driving the succession of phytoplankton functional groups in karst hydroelectric reservoirs. J. Hydrology 592, 125607. doi: 10.1016/j.jhydrol.2020.125607
Dong C., Yang Z., Gong Y., Tang H. (2019). Fish resource status and biodiversity conservation in the main channel of Three Gorges Reservoir. J. Hydroecology 40, 15–21. doi: 10.15928/j.1674-3075.2019.01.003
Dong Z., Sun D., Zhao J., Zhang J. (2010). Holistic conceptual model for the structure and function of river ecosystems. Adv. Water Sci. 21, 550–559. doi: 10.14042/j.cnki.32.1309.2010.04.016
Dudgeon D. (2000). Large-scale hydrological changes in tropical Asia: prospects for riverine biodiversity: the construction of large dams will have an impact on the biodiversity of tropical Asian rivers and their associated wetlands. BioScience 50, 793–806. doi: 10.1641/0006-3568(2000)050[0793:LSHCIT]2.0.CO;2
Eichmiller J. J., Best S. E., Sorensen P. W. (2016). Effects of temperature and trophic state on degradation of environmental DNA in lake water. Environ. Sci. Technol. 50, 1859–1867. doi: 10.1021/acs.est.5b05672
Elbrecht V., Vamos E. E., Meissner K., Aroviita J., Leese F. (2017). Assessing strengths and weaknesses of DNA metabarcoding-based macroinvertebrate identification for routine stream monitoring. Methods Ecol. Evol. 8, 1265–1275. doi: 10.1111/mee3.2017.8.issue-10
Furlan E. M., Davis J., Duncan R. P. (2020). Identifying error and accurately interpreting environmental DNA metabarcoding results: A case study to detect vertebrates at arid zone waterholes. Mol. Ecol. Resour. 20, 1259–1276. doi: 10.1111/1755-0998.13170
Geller J., Meyer C., Parker M., Hawk H. (2013). Redesign of PCR primers for mitochondrial cytochrome c oxidase subunit I for marine invertebrates and application in all-taxa biotic surveys. Mol. Ecol. Resour. 13, 851–861. doi: 10.1111/men.2013.13.issue-5
Granzotti R. V., Miranda L. E., Agostinho A. A., Gomes L. C. (2018). Downstream impacts of dams: shifts in benthic invertivorous fish assemblages. Aquat. Sci. 80, 1–14. doi: 10.1007/s00027-018-0579-y
He F., Wu N., Dong X., Tang T., Domisch S., Cai Q., et al. (2020). Elevation, aspect, and local environment jointly determine diatom and macroinvertebrate diversity in the Cangshan Mountain, Southwest China. Ecol. Indic. 108, 105618. doi: 10.1016/j.ecolind.2019.105618
Hieber M., Burgherr P., Uehlinger U., Tockner K. (2003). Alpine streams: Diverse and sensitive ecosystems. Eawag news 55e Dübendorf.
Hui Z., Susumu Y., Wataru I., Weiwei X. (2019). Seasonal fish assemblage structure using environmental DNA in the yangtze estuary and its adjacent waters. Front. Mar. Sci. 6. doi: 10.3389/fmars.2019.00515
Keck F., Blackman R. C., Bossart R., Brantschen J., Couton M., Hürlemann S., et al. (2022). Meta-analysis shows both congruence and complementarity of DNA and eDNA metabarcoding to traditional methods for biological community assessment. Mol. Ecol. 31, 1820–1835. doi: 10.1111/mec.16364
Leempoel K., Hebert T., Hadly E. A. (2020). A comparison of eDNA to camera trapping for assessment of terrestrial mammal diversity. Proc. Biol. Sci. 287, 20192353. doi: 10.1098/rspb.2019.2353
Leray M., Yang J. Y., Meyer C. P., Mills S. C., Agudelo N., Ranwez V., et al. (2013). A new versatile primer set targeting a short fragment of the mitochondrial COI region for metabarcoding metazoan diversity: application for characterizing coral reef fish gut contents. Front. zoology 10, 34. doi: 10.1186/1742-9994-10-34
Liu F., Li M., Wang J., Gong Z., Liu M., Liu H., et al. (2021b). Species composition and longitudinal patterns of fish assemblages in the middle and lower Yarlung Zangbo River, Tibetan Plateau, China. Ecol. Indic. 125, 107542. doi: 10.1016/j.ecolind.2021.107542
Liu S., Li X., Tan L., Fornacca D., Fang Y., Zhu L., et al. (2021a). The ecological niche and terrestrial environment jointly influence the altitudinal pattern of aquatic biodiversity. Sci. Total Environ. 800, 149404. doi: 10.1016/j.scitotenv.2021.149404
Liu X., Hu X., Ao X., Wu X., Ouyang S. (2017). Community characteristics of aquatic organisms and management implications after construction of Shihutang Dam in the Gangjiang River, China. Lake Reservoir Manage. 34, 42–57. doi: 10.1080/10402381.2017.1373716
Luca C., Elvira M., Remo W., Florian A. (2020). Environmental DNA allows upscaling spatial patterns of biodiversity in freshwater ecosystems. Nat. Commun. 11, 3585. doi: 10.1038/s41467-020-17337-8
MacArthur R. H. (1984). Geographical ecology: patterns in the distribution of species (Princeton: Princeton University Press).
Magoč T., Salzberg S. L. (2011). FLASH: fast length adjustment of short reads to improve genome assemblies. Bioinf. (Oxford England) 27, 2957–2963. doi: 10.1093/bioinformatics/btr507
Niskanen A. K. J., Niittynen P., Aalto J., Väre H., Luoto M., Diez J. (2019). Lost at high latitudes: Arctic and endemic plants under threat as climate warms. Diversity Distributions. 25, 809–821. doi: 10.1111/ddi.2019.25.issue-5
Nobile A. B., Freitas-Souza D., Lima F. P., Queiroz J., Bayona-Perez I. L., Carvalho E. D., et al. (2019). Damming and seasonality as modulators of fish community structure in a small tributary. Ecol. Freshw. Fish 28, 563–572. doi: 10.1111/eff.12475
Pablo S., Erwan D., D. D. J., Diego M., Sarai M., Felipe P., et al. (2021). Monitoring vertebrate biodiversity of a protected coastal wetland using eDNA metabarcoding. Environ. DNA 4, 77–92. doi: 10.1002/edn3.200
Pero E. J. I., Georgieff S. M., de Lourdes Gultemirian M., Romero F., Hankel G. E., Domínguez E. (2020). Ecoregions, climate, topography, physicochemical, or a combination of all: Which criteria are the best to define river types based on abiotic variables and macroinvertebrates in neotropical rivers? Sci. Total Environ. 738, 140303. doi: 10.1016/j.scitotenv.2020.140303
Petchey O. L. (2003). Integrating methods that investigate how complementarity influences ecosystem functioning. Oikos 101, 323–330. doi: 10.1034/j.1600-0706.2003.11828.x
Principe R. E., Marquez J. A., Cibils-Martina L. (2019). Distribution and habitat preference of Ephemeroptera and Trichoptera in subtropical mountain streams: implications for monitoring and conservation. Anais da Academia Bras. Ciências 91, e20180692. doi: 10.1590/0001-3765201920180692
Prommi T., Payakka A. (2015). Aquatic insect biodiversity and water quality parameters of streams in Northern Thailand. Sains Malaysiana 44, 707–717. doi: 10.17576/jsm-2015-4405-10
Reji Chacko M., Altermatt F., Fopp F., Guisan A., Keggin T., Lyet A., et al. (2023). Catchment-based sampling of river eDNA integrates terrestrial and aquatic biodiversity of alpine landscapes. Oecologia 202, 1–15. doi: 10.1007/s00442-023-05428-4
Ross I., Robert G. (2008). R: a language and environment for statistical computing (R Foundation for Statistical Computing). Available online at: https://www.r-project.org/.
Soininen J., Bartels P., Heino J., Luoto M., Hillebrand H. (2015). Toward more integrated ecosystem research in aquatic and terrestrial environments. BioScience 65, 174–182. doi: 10.1093/biosci/biu216
Suter L., Polanowski A. M., Clarke L. J., Kitchener J. A., Deagle B. E. (2021). Capturing open ocean biodiversity: Comparing environmental DNA metabarcoding to the continuous plankton recorder. Mol. Ecol. 30, 3140–3157. doi: 10.1111/mec.v30.13
Takahara T., Iwai N., Yasumiba K., Igawa T. (2020). Comparison of the detection of 3 endangered frog species by eDNA and acoustic surveys across 3 seasons. Freshw. Sci. 39, 18–27. doi: 10.1086/707365
Valentini A., Taberlet P., Miaud C., Civade R., Herder J., Thomsen P. F., et al. (2016). Next-generation monitoring of aquatic biodiversity using environmental DNA metabarcoding. Mol. Ecol. 25, 929–942. doi: 10.1111/mec.2016.25.issue-4
Wang J., Soininen J., Heino J. (2021). Ecological indicators for aquatic biodiversity, ecosystem functions, human activities and climate change. Ecol. Indic. 132. doi: 10.1016/j.ecolind.2021.108250
Wang Q. (2011). Research on the effect of river habitat on biodiversity in mountain river (Chongqing: Chongqing University).
Wei N., Zhang Y., Wu F., Shen Z. W., Ru H. J. (2021). Current status and changes in fish assemblages in the three gorges reservoir. Resour. Environ. Yangtze Basin 30, 1858–1869.
Wenqiang Z., Songjie H., Dianwei Z., Baoqing S., Dongyang W. (2023). Variations in dissolved oxygen and aquatic biological responses in China's coastal seas. Environ. Res. 223, 115418–115418. doi: 10.1016/j.envres.2023.115418
West K., Travers M. J., Stat M., Harvey E. S., Richard Z. T., DiBattista J. D., et al. (2021). Large-scale eDNA metabarcoding survey reveals marine biogeographic break and transitions over tropical north-western Australia. Diversity Distributions 27, 1942–1957. doi: 10.1111/ddi.v27.10
Xiao Q., Yang Z., Tang H., Duan P., Wang X., Xiao T., et al. (2015). Species diversity of fish and its conservation in the mainstream of the lower reaches of Wu River. Biodiversity Sci. 23, 499–506. doi: 10.17520/biods.2014270
Yang N., Yang X., Li Y., Liu Z., Chen Q., Shen Y. (2020). The current situation of plankton and fish resources of Lixiang Rivulet and Maxi River in Fuling District of Chongqing Municipality. J. Chongqing Normal Univ. (Natural Science) 37, 63–77. doi: 10.11721/cqnuj20200608
Yang Z., Zhang Q., Lv W., Hou Y., Cui J. (2010). Survey of fish resources in the reservoir area along the reach of Pengshui Power Station in Wujiang River. Modern Agric. Sci. Technol., 312–313+319. doi: 10.3969/j.issn.1007-5739.2010.24.199
Yao J., Li C., Yang X., Li Z. (2009). Status and protection countermeasures of fish resources in Guizhou Province. Fishery Inf. Strategy 24, 12–14. doi: 10.3969/j.issn.1004-8340.2009.02.003
Zhang C. (2018). Responses of species and phylogenetic diversity of fish communities in the Lancang River to cascade hydropower development (Kunming: Yunnan University).
Zhang S., Zhao J., Yao M. (2023). Urban landscape-level biodiversity assessments of aquatic and terrestrial vertebrates by environmental DNA metabarcoding. J. Environ. Manage. 340, 117971. doi: 10.1016/j.jenvman.2023.117971
Zhang S., Zheng Y., Zhan A., Dong C., Zhao J., Yao M. (2022). Environmental DNA captures native and non-native fish community variations across the lentic and lotic systems of a megacity. Sci. Adv. 8, eabk0097–eabk0097. doi: 10.1126/sciadv.abk0097
Zhu S., Chen W., Li X., Li J., Li Y. (2022). Pattern of fish assemblage structure and diversity in Liujiang River. Acta Hydrobiologica Sin. 46, 375–384. doi: 10.7541/2022.2021.013
Keywords: environmental DNA, aquatic biodiversity, mountain rivers, cascading hydropower, environmental factors
Citation: Shen Y, Zhou X, Zhang Y, Li Q, Zhang J and Cheng R (2024) Environmental DNA (eDNA) reveals the effects of cascade dam development on the distribution patterns of aquatic biodiversity in mountain rivers. Front. Mar. Sci. 11:1444097. doi: 10.3389/fmars.2024.1444097
Received: 05 June 2024; Accepted: 29 October 2024;
Published: 28 November 2024.
Edited by:
Michael Rappe, University of Hawaii at Manoa, United StatesReviewed by:
Sandi Orlic, Rudjer Boskovic Institute, CroatiaSivalingam Periyasamy, National Research Council (CNR), Italy
Copyright © 2024 Shen, Zhou, Zhang, Li, Zhang and Cheng. This is an open-access article distributed under the terms of the Creative Commons Attribution License (CC BY). The use, distribution or reproduction in other forums is permitted, provided the original author(s) and the copyright owner(s) are credited and that the original publication in this journal is cited, in accordance with accepted academic practice. No use, distribution or reproduction is permitted which does not comply with these terms.
*Correspondence: Yanjun Shen, c2hlbnlhbmp1bkBjcW51LmVkdS5jbg==; Ruli Cheng, ODQwNzU0NjMzQHFxLmNvbQ==
 Yanjun Shen
 Xinxin Zhou1,2