
94% of researchers rate our articles as excellent or good
Learn more about the work of our research integrity team to safeguard the quality of each article we publish.
Find out more
ORIGINAL RESEARCH article
Front. Mar. Sci., 30 September 2024
Sec. Aquatic Microbiology
Volume 11 - 2024 | https://doi.org/10.3389/fmars.2024.1443533
 Patrichka Wei-Yi Chen1,2
 Madeline Olivia1,2
 Gwo-Ching Gong1,3
 Sen Jan4
 Tung-Yuan Ho5
 Louis St. Laurent6
 An-Yi Tsai1,2,3*
Throughout the western tropical Pacific Ocean, eddies and currents play an important role in biogeochemical cycling. Many studies have investigated the effects of hydrography on vertical patterns of picophytoplankton and heterotrophic bacterial abundance in mesoscale eddies. There is a lack of field observations to determine what impact dynamic hydrological systems of eddies have on prokaryotic community activity (growth and mortality rates). An objective of this study was to examine how anticyclonic eddies influence picoplankton abundance and activity (growth and mortality rates). To meet this purpose, heterotrophic bacterial and picophytoplankton growth and mortality rates were examined by modified dilution experiments conducted at the surface, deep chlorophyll maximum (DCM), and 200 m depth outside (OE) and inside of warm eddies core (EC) in the west Pacific Ocean. A high heterotrophic bacterial grazing rate was found in the EC region in the present study. Furthermore, the picophytoplankton grazing rate in EC was frequently greater than the grazing rate in OE. Furthermore, the higher grazing rates in the EC region cause a lower proportion of viral lysis to account for heterotrophic bacteria and picophytoplankton mortality. The results of our experiments suggest that downwelling in EC might increase picophytoplankton growth and grazing rates, increasing the carbon sink in the warm eddy and potentially increasing ocean carbon storage.
In marine ecosystems, picophytoplankton populations contribute a substantial amount of biomass and production, particularly in oligotrophic waters where they contribute up to 90% of total photosynthetic biomass and carbon production (Campbell et al., 1994). Picophytoplankton is primarily composed of Prochlorococcus spp. (PRO) (Chisholm et al., 1988) and Synechococcus spp. (SYNE), which play important roles in microbial ecology (Azam et al., 1983). PRO can be found in oligotrophic oceans from the surface to 150 m (Kettler et al., 2008), and it requires a certain temperature range (Johnson et al., 2006). The SYNE however, is more commonly found in surface mesotrophic regions with a larger geographical distribution (Flombaum et al., 2013). As well as picoplankton, heterotrophic bacteria (HB) are considered decomposers and nutrient recyclers in marine food webs by assimilating dissolved organic matter (Kujawinski, 2011).
It is well known that mesoscale eddies are physical oceanographic phenomena resulting from the turbulence or circulation of water masses, which vary in location (tens to hundreds of kilometers) and time (days to months). It has been observed frequently that mesoscale eddies occur in the Pacific (Chelton et al., 2011; Chang et al., 2017). Many studies have examined the biogeochemical effects of cold and warm eddies over the past few decades, especially how they affect marine phytoplankton biomass (Perruche et al., 2011; Clayton et al., 2013; Polovina et al., 2015). Generally, primary production increases in cyclonic cold eddies and decreases in anticyclonic warm eddies (Xiu and Chai, 2011; He et al., 2019). As a result of the anticyclonic warm eddies, the environment conditions (especially nutrient availability) have been adverse for phytoplankton. This is primarily due to downwelling, leading to a high mortality rate, thereby forcing photosynthesized carbon to fuel the dissolved pool (Lasternas et al., 2013). However, anticyclonic eddies cause complex biological responses. In some studies, warm eddies have been found to benefit phytoplankton abundance (Li et al., 2010; Wang et al., 2018). Furthermore, a limited amount of information is available about how HB respond to eddy-induced upwelling or downwelling. It has been reported that HB are abundant inside cold-core eddies (Thyssen et al., 2005). Bode et al. (2001), also found that higher HB production rates inside cold-core eddies near the Canary Islands than in surrounding waters. Marine HB, however, are not well understood to be affected by warm eddy. Warm eddies exhibit low HB abundance; it is observed at the edges that the abundance increases (Christaki et al., 2011; Wang et al., 2018).
Recent studies have examined the grazing rate of microzooplankton in mesoscale eddies, while few comparison studies have been conducted between different eddies (Landry et al., 2008; Chen et al., 2009). Moreover, to date, investigations into the prokaryotic mortality in in anticyclonic warm eddies are limited. Froneman and Perissinotto (1996) described a warm eddy assemblage composed of heterotrophic nanoflagellates, dinoflagellates, and ciliates. Their results showed that phytoplankton growth and microzooplankton grazing rates were higher at the edges of the warm eddy, resulting in more primary production being removed by the microzooplankton. In recent studies, a significant temperature increase was found to increase the grazing pressure in the anticyclonic eddy (An et al., 2024). A warmer, oxygen-rich environment in the center of anticyclonic eddies provides a metabolic advantage to predators and facilitates their search for suitable prey (Braun et al., 2019). According to another study, microzooplankton and nanoflagellates are driven toward anticyclonic eddies by the convergence effect. Consequently, this causes an increase in microzooplankton and nanoflagellate abundance in surface waters, which increases grazing rates in HB and picophytoplankton in warm eddy cores (Wang et al., 2022). Similarly, Boras et al. (2010) found higher grazing activity at anticyclonic eddies, possibly because of higher nanoflagellate abundance. Moreover, mortality pressure caused by viruses (top-down control) should not be negligible in the eddy study. So far, we have not thoroughly studied viral dynamics and how they affect HB and picophytoplankton in warm eddy cores as another mortality factor.
The purpose of the current study was to examine how anticyclonic eddies influence picoplankton abundance and activity (growth and mortality rates). To meet this purpose, HB and picophytoplankton growth and mortality rates were examined by modified dilution experiments conducted at the surface, deep chlorophyll maximum (DCM), and 200 m depth inside and outside warm eddies in the west Pacific Ocean. As hypothesized here, warm eddies affect HB and picophytoplankton growth, as well as their mortality.
Field investigations were conducted aboard the R/V Thompson between May 29 and June 10, 2023, in the west Pacific Ocean (Figure 1). During the cruise, the sea surface height was monitored every day by a satellite altimeter (Figure 1). Sea level anomaly (SLA) was calculated from satellite altimeter data by AVISO (Archiving Validation and Interpretation of Satellite Oceanographic Data) to define warm eddy trajectory, http://www.aviso.oceanobs.com/). In this study, we sampled physical, chemical, and microbial parameters at two sites: eddy core (T3: EC) and out-of-eddy (T1: OE). Additionally, for the incubation experiments at OE and EC, surface depths of 2.5 m, 130-140 m DCM, and 200 m depth were collected. On the cruise, Teflon-coated Go-Flo bottles were used to collect seawater samples. The SBE 9/11plus CTD (Sea-Bird Scientific) was used to obtain temperature and salinity vertical profiles. For the detection of Chl a in water samples, a 25 mm GF/F filter and an in vitro fluorometer (Turner Design 10-AU-005) were used (Gong et al., 2000). Nutrient samples were collected then stored in -20°C freezer onboard for spectrophotometry analysis at land-based laboratory. Nitrite concentrations were determined by the classic Griess assay. Nitrate concentrations were determined by a new method using vanadium reduction with the Griess assay (Pai et al., 2021). Phosphate and silicate concentrations were measured by the phosphomolybdenum blue or silicomolybdenum blue/yellow methods, respectively (Pai et al., 1990). The detection limits of nitrite, nitrate, phosphate, and silicate were 0.002, 0.01, 0.002, and 0.01 μM, respectively. Low level concentration samples collected in the mixed layer waters were determined by 5 cm wide cell. The accuracy of the analysis was validated by using certified reference material (Kanso, Japan), with the deviations of phosphate, silicate, and nitrate from the certified value mostly ranging from 0.2 to 1.4, 0.1-2.0, and 0.2-3.0%, respectively.
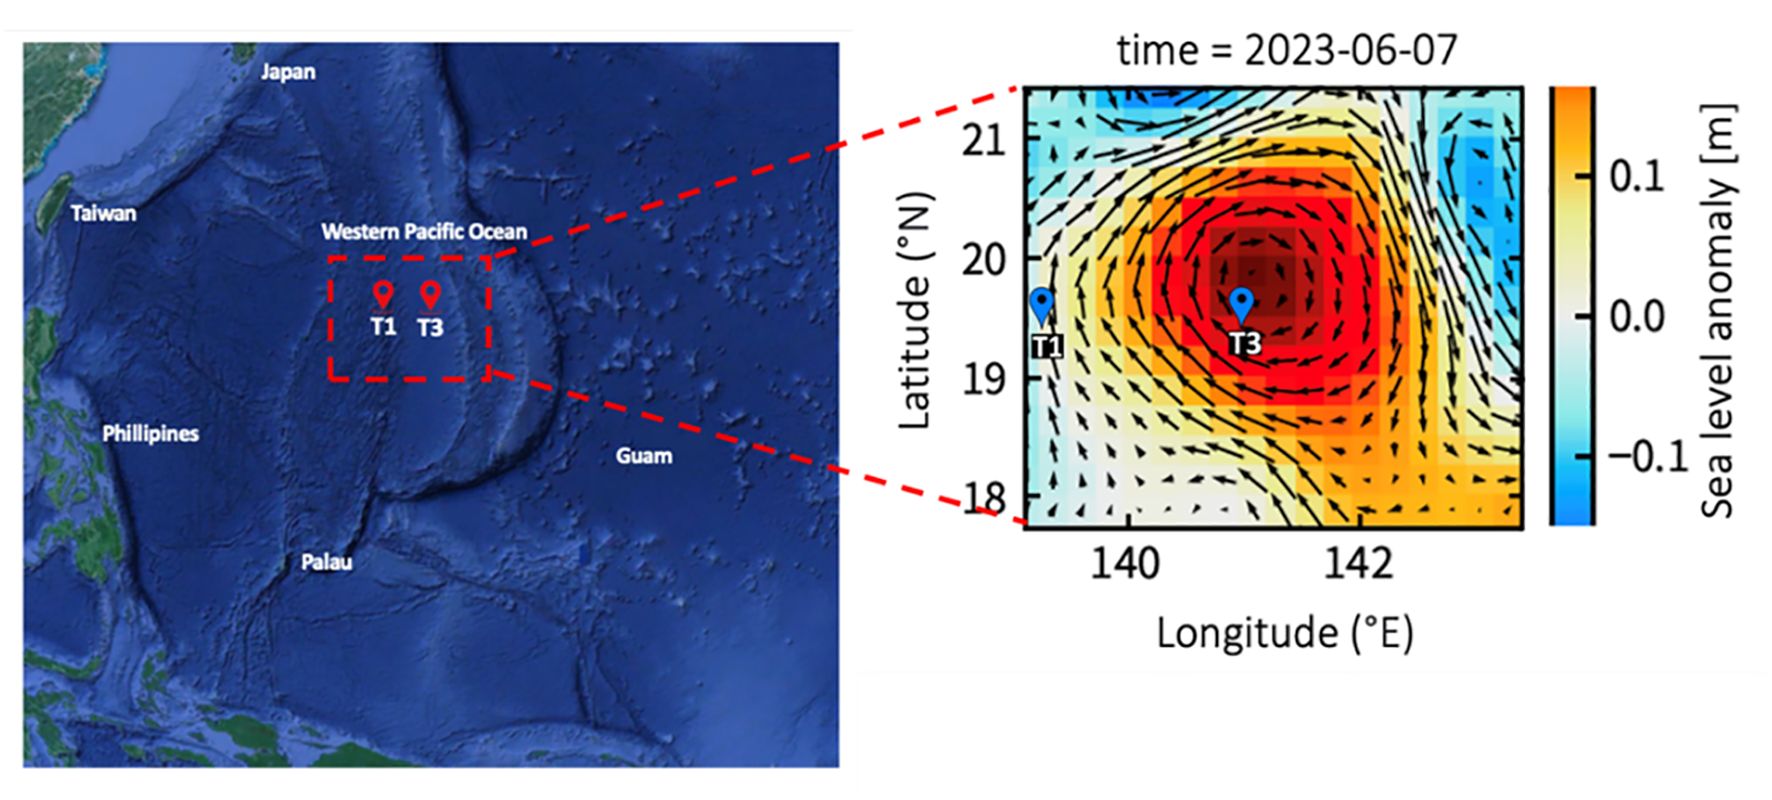
Figure 1. This map shows the sampling stations plotted against the averaged sea surface height anomaly (m) for the study period of 2023. The arrows represent sea surface currents.
The growth, nanoflagellate grazing, and viral lysis rates of HB and picophytoplankton were estimated using a modified dilution experiments according to Evans et al. (2003). First, we filtered the subsample water through a 10 µm mesh filter to remove large microzooplankton. Following that, we passed it through Nuclepore 47-mm filters (type PC, pore size 0.2 µm) to collect the standard diluent. With 0.2 µm pore size filtered seawater, a 4-point dilution series was prepared with 25, 50, 75, and 100% serial dilutions of 10 µm-filtered seawater. To dilution viruses, we used a Minimate TFF Capsule (Pall) to filter 200 mL of grazer-free seawater (pore size 0.2 µm) with a molecular weight cut-off of 30 kDa. Then, used 30 kDa filtered seawater instead of 0.2 µm filtered water altered total mortality (viral mortality and grazing). Triplicates of 50-mL polycarbonate incubation tubes was immediately performed on the deck for 24 hours at in situ temperature. As a simulation of the light intensity at the sampling depth, neutral-density plastic sheets (Lee Filters, Hampshire, UK) were used to cover seawater from the surface and DCM was incubated under natural light conditions. During the experiment, seawater from 200 m depth was incubated in the dark in a thermo-controlled incubator. At the end (T24) and at the beginning (T0) of the incubation period, water was collected from each tube to determine the abundance of HB and picophytoplankton. For each dilution (0.2 µm and 30 kDa), the net growth rate (k) of HB and picophytoplankton was calculated as ln(Nt24/N0)/t. Nt24 and N0 represent the final and initial abundances of HB and picophytoplankton, respectively, while t represents the 24 hour duration of the experiment. In this study, we calculated the growth, grazing, and viral-induced mortality coefficients for HB and picophytoplankton by Evans et al. (2003). In the model 1 (Figure 2), if virus-free seawater is used as a diluent (30 kDa dilution series), the net growth rate of HB and picophytoplankton (k1) should be calculated as the difference between instantaneous growth rate and mortality due to lysis and grazing which is a function of D (the level of dilution). Equation 1 can be rewritten as:
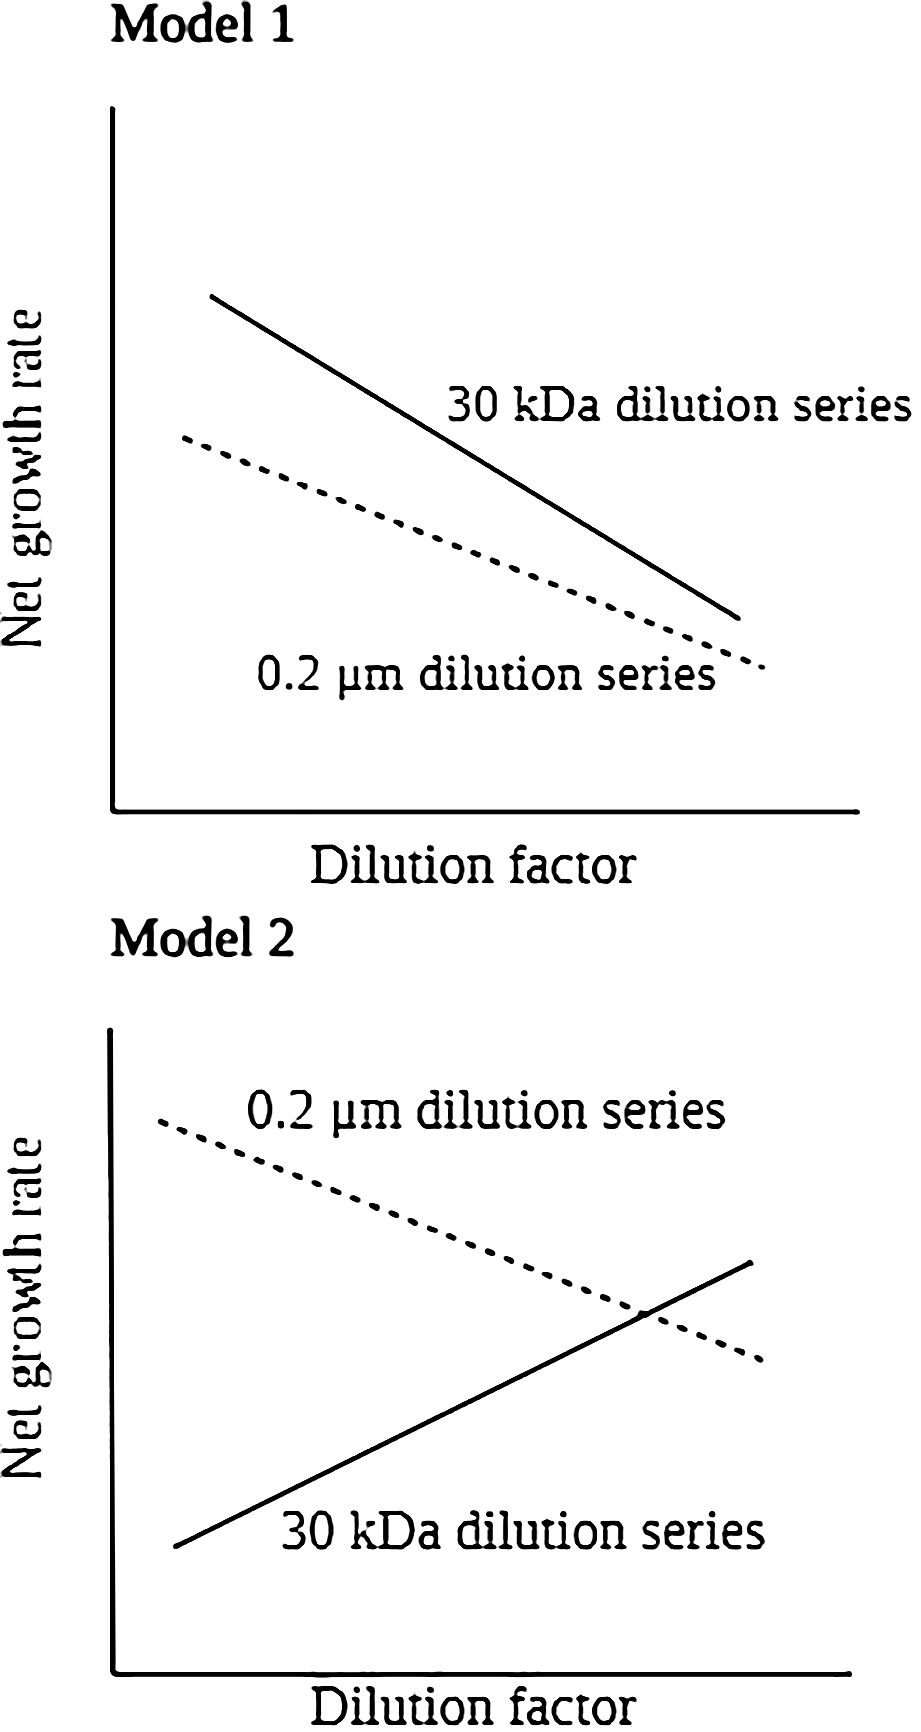
Figure 2. Model for idealized dilution plots and analysis when filtered water containing viruses (standard protocol used to determine grazing rates) and viral-free water are used to dilute whole water in the incubations that make up each dilution series.
The intercept of a 30 kDa dilution series regression was used to calculate the HB and picophytoplankton growth rates (µ). By the slope of 30 kDa dilution series, we determined grazing and viral-induced mortality coefficients (mv + mg). When only bacterial abundance is diluted with 0.2 µm diluents, lytic pressure (mv) is constant, whereas grazing pressure (mg) is reduced. Equation 2 can be rewritten as:
By calculating the slope of the dilution series of 0.2 µm-filtered seawater, the nanoflagellate grazing coefficient (mg) was determined. A virus-induced mortality of HB and picophytoplankton occurs when the slopes of the two regressions differ, which equals mv = [(mv + mg) − mg]. As a result of Model 1 regression analysis applied to the dilution experiments, we were able to determine both the specific growth (μ) and mortality coefficient (mg, mv) in each of the parallel dilution series (Figure 2).
In the model 2, we observed positive relationships between dilution factor and net growth rate in 30 kDa dilution series indicating the assumptions of the dilution method were not met (Figure 2). In this situation, total mortality (mg+mv) analyses did not estimate from this equation, as they represent unrealistic estimates. Moreover, in the 0.2 μm dilution series, there is a negative and significant linear relation between net growth rate and dilution factor, that can be applied to directly determine the grazing pressure (mg) on HB and picophytoplankton. Therefore, the intercept of a 0.2 μm dilution series regression was used to calculate the HB and picophytoplankton growth rates (μ).
We collected 2 ml seawater samples from each treatment, preserved them in 0.5% paraformaldehyde (final concentration), flash-frozen, and stored them in liquid nitrogen for enumerating nanoflagellates, picophytoplankton and HB. Samples were frozen at −80°C until analysis in the laboratory a CytoFLEX S flow cytometer (Beckman Coulter, Indianapolis) equipped with a 488 nm air-cooled argon-ion laser, a standard 525 nm filter, and an SYBR signal trigger. To minimize interference from high particle density, viral samples were diluted 1:10 in TE buffer (pH 8.0, EM grade) prior to staining. SYBR Green I (final concentration 1:50,000 commercial stock) was stained onto the diluted samples and incubated in the dark for 10 minutes at 80°C. Following the staining process, samples were cooled to 25°C in an ice bath and analyzed by FCM according to Brussaard (2004). To detect and eliminate buffer noise, blank controls of TE buffer stained with SYBR Green I were used. According to Hammes and Egli (2010), HB samples were stained with SYBR Green I (final concentration 1:10,000) for 15 minutes in the dark, then processed by FCM. Based on flow cytometric analysis, on the basis of their red fluorescence from chlorophyll (>650 nm) and orange fluorescence from phycoerythrin (578 nm) and light scatter signals (SSC), picophytoplankton from the area were separated into three groups (SYNE, PRO, and picoeukaryotes (PEUK)) according to Calvo-Díaz and Morán (2006). Furthermore, in this study, heterotrophic and pigmented nanoflagellates enumeration was also performed using flow cytometer according to Rose et al. (2004).
For each dilution series (0.2 µm and 30 kDa), we conducted a linear regression analysis of apparent growth rates against the whole water fraction to estimate instantaneous growth and mortality. ANOVA was used to test the significance of deviations from linear regressions compared to triplicate bottle variability when assessing the appropriateness of linear regressions. F-tests were used to estimate viral mortality in these experiments based on the mortality slopes obtained between the 0.2 µm and 30 kDa dilution series. The statistical analysis was carried out using StatView software (SAS).
In this study, the temperature and salinity profile of OE and EC showed a well-mixed surface layer that reached ca 50 m depth (Figures 3A, B). Physical processes associated with the warm eddy affected the vertical distributions of temperature, salinity, and Chl a in this study (Figure 3). In the EC, water temperatures ranged from 21.6 to 29.9C and salinity varied between 34.63 and 34.97 psu in the upper 200 m depth (Figures 3A, B). Comparing vertical profiles of physical and chemical parameters at the 2 stations reveals that shallow waters (upper 200 m) of EC had higher temperatures and salinities (Figure 3; Table 1). Our results also illustrate differences in nutrient concentrations between warm eddy-influenced waters (EC) and OE. Higher concentrations of PO43− appeared in surface, and the DCM layer in the EC region (Table 1).
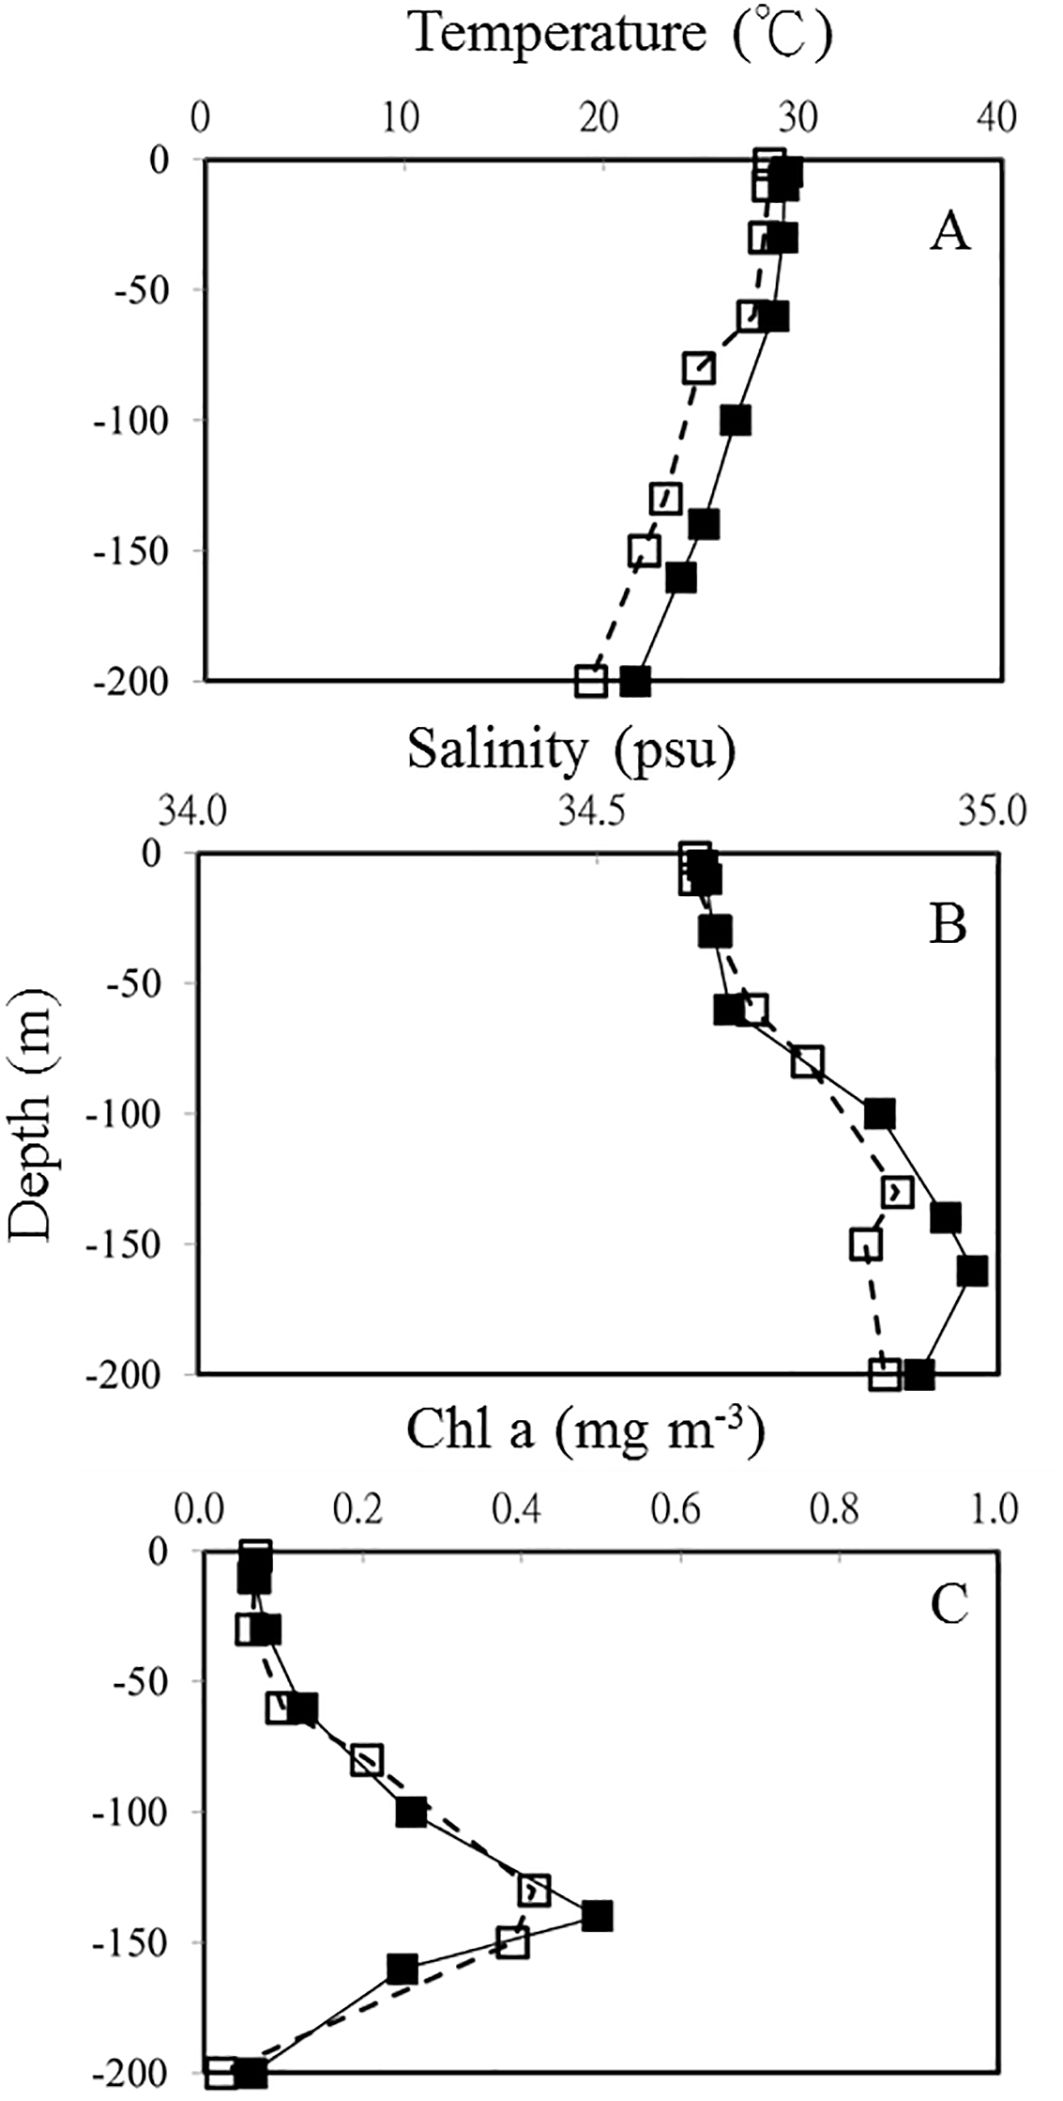
Figure 3. Vertical profiles of temperature (A) salinity (B) and Chl a (C) in OE (□) and EC (▪), respectively.
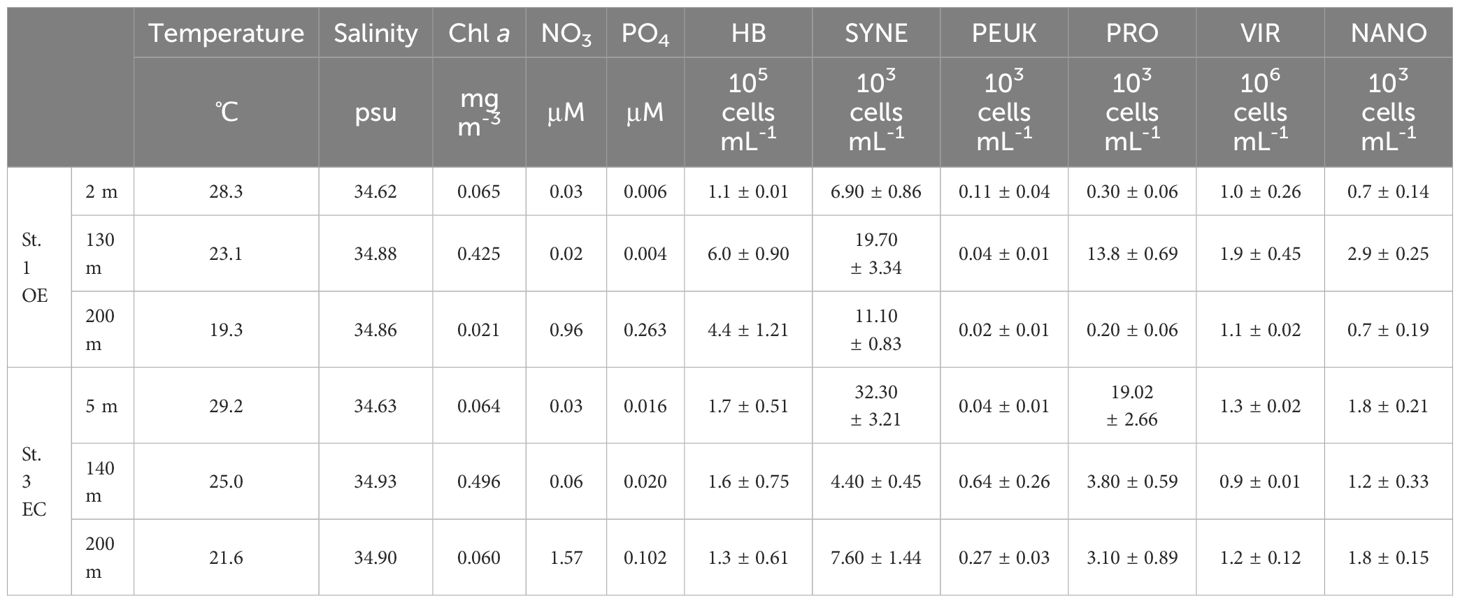
Table 1. Temperature, salinity, nutrients, chlorophyll α concentration, picophytoplankton (SYNE: Synechococcus spp., PEUK: picoeukaryotes, PRO: Prochlorococcus spp.), heterotrophic bacterial (HB), viral (VIR) and total nanoflagellate (NANO) abundance at each sampling stations and depth.
The vertical distribution of Chl a concentration at OE and EC showed that the depth of DCM was at 130 m and 140 m, respectively (Table 1; Figure 3C). A warm eddy inside surface water showed similar chlorophyll a concentration as outside, while phytoplankton biomass in the DCM and 200 m depth layer of EC were higher than that in OE (Table 1; Figure 2C). We observed a similar amount of phytoplankton biomass (Chl a) was observed between EC and OE surface stations, however, there was a significant difference in the phytoplankton community structure between them in surface water. In EC surface samples, PEUK abundance was very low (<100 cells mL-1), and SYNE was the most abundant picophytoplankton (32.3 ± 3.21 x 10³ cells mL-1), with contributions of 63% (Table 1). Moreover, in OE surface samples, the picophytoplankton community was also dominated by SYNE (6.9 ± 0.86 x 10³ cells mL-1), with increased a contribution of up to 90% (Table 1). At DCM layer, abundance of PRO and SYNE in the EC (3.8 ± 0.59 and 4.4 ± 0.45 × 10³ cells ml-1, respectively) was significantly lower (p<0.05) than that of the OE (13.8 ± 0.69, and 19.7 ± 3.34 × 10³ cells ml-1, respectively) (Table 1). Similarly, in OE region, the abundance of HB, nanoflagellate and viruses at DCM samples was higher than that in EC (Table 1). At the EC station, however, there were no significant vertical differences in the abundance of HB, nanoflagellates, and viruses (Table 1).
In the present study, EC and OE samples were analyzed according to the modified dilution protocol, and results are shown in Figures 4–6. The descriptive statistics (slope, intercept, p values) for regression lines calculated for the HB, SYNE, and PRO as well as for 95% confidence intervals are summarized in Tables 2, 3. In 5 of the 6 analyses, the net growth rate of HB in the 30 kDa dilution series in EC and OE samples showed a significant negative linear relationship (Figure 4). As shown in Figures 4A–E, the y-intercept of the significant regression for HB in the 30 kDa dilution series was used to calculate the growth rate. However, in other case, we calculated the HB growth rate from model 2 (Figure 3F). In this study, we found that growth rates of HB in EC samples (1.34-2.10 d-1) was higher than that in OE (0.23-0.40 d-1), except at 200 m (Table 4; Figure 7A).
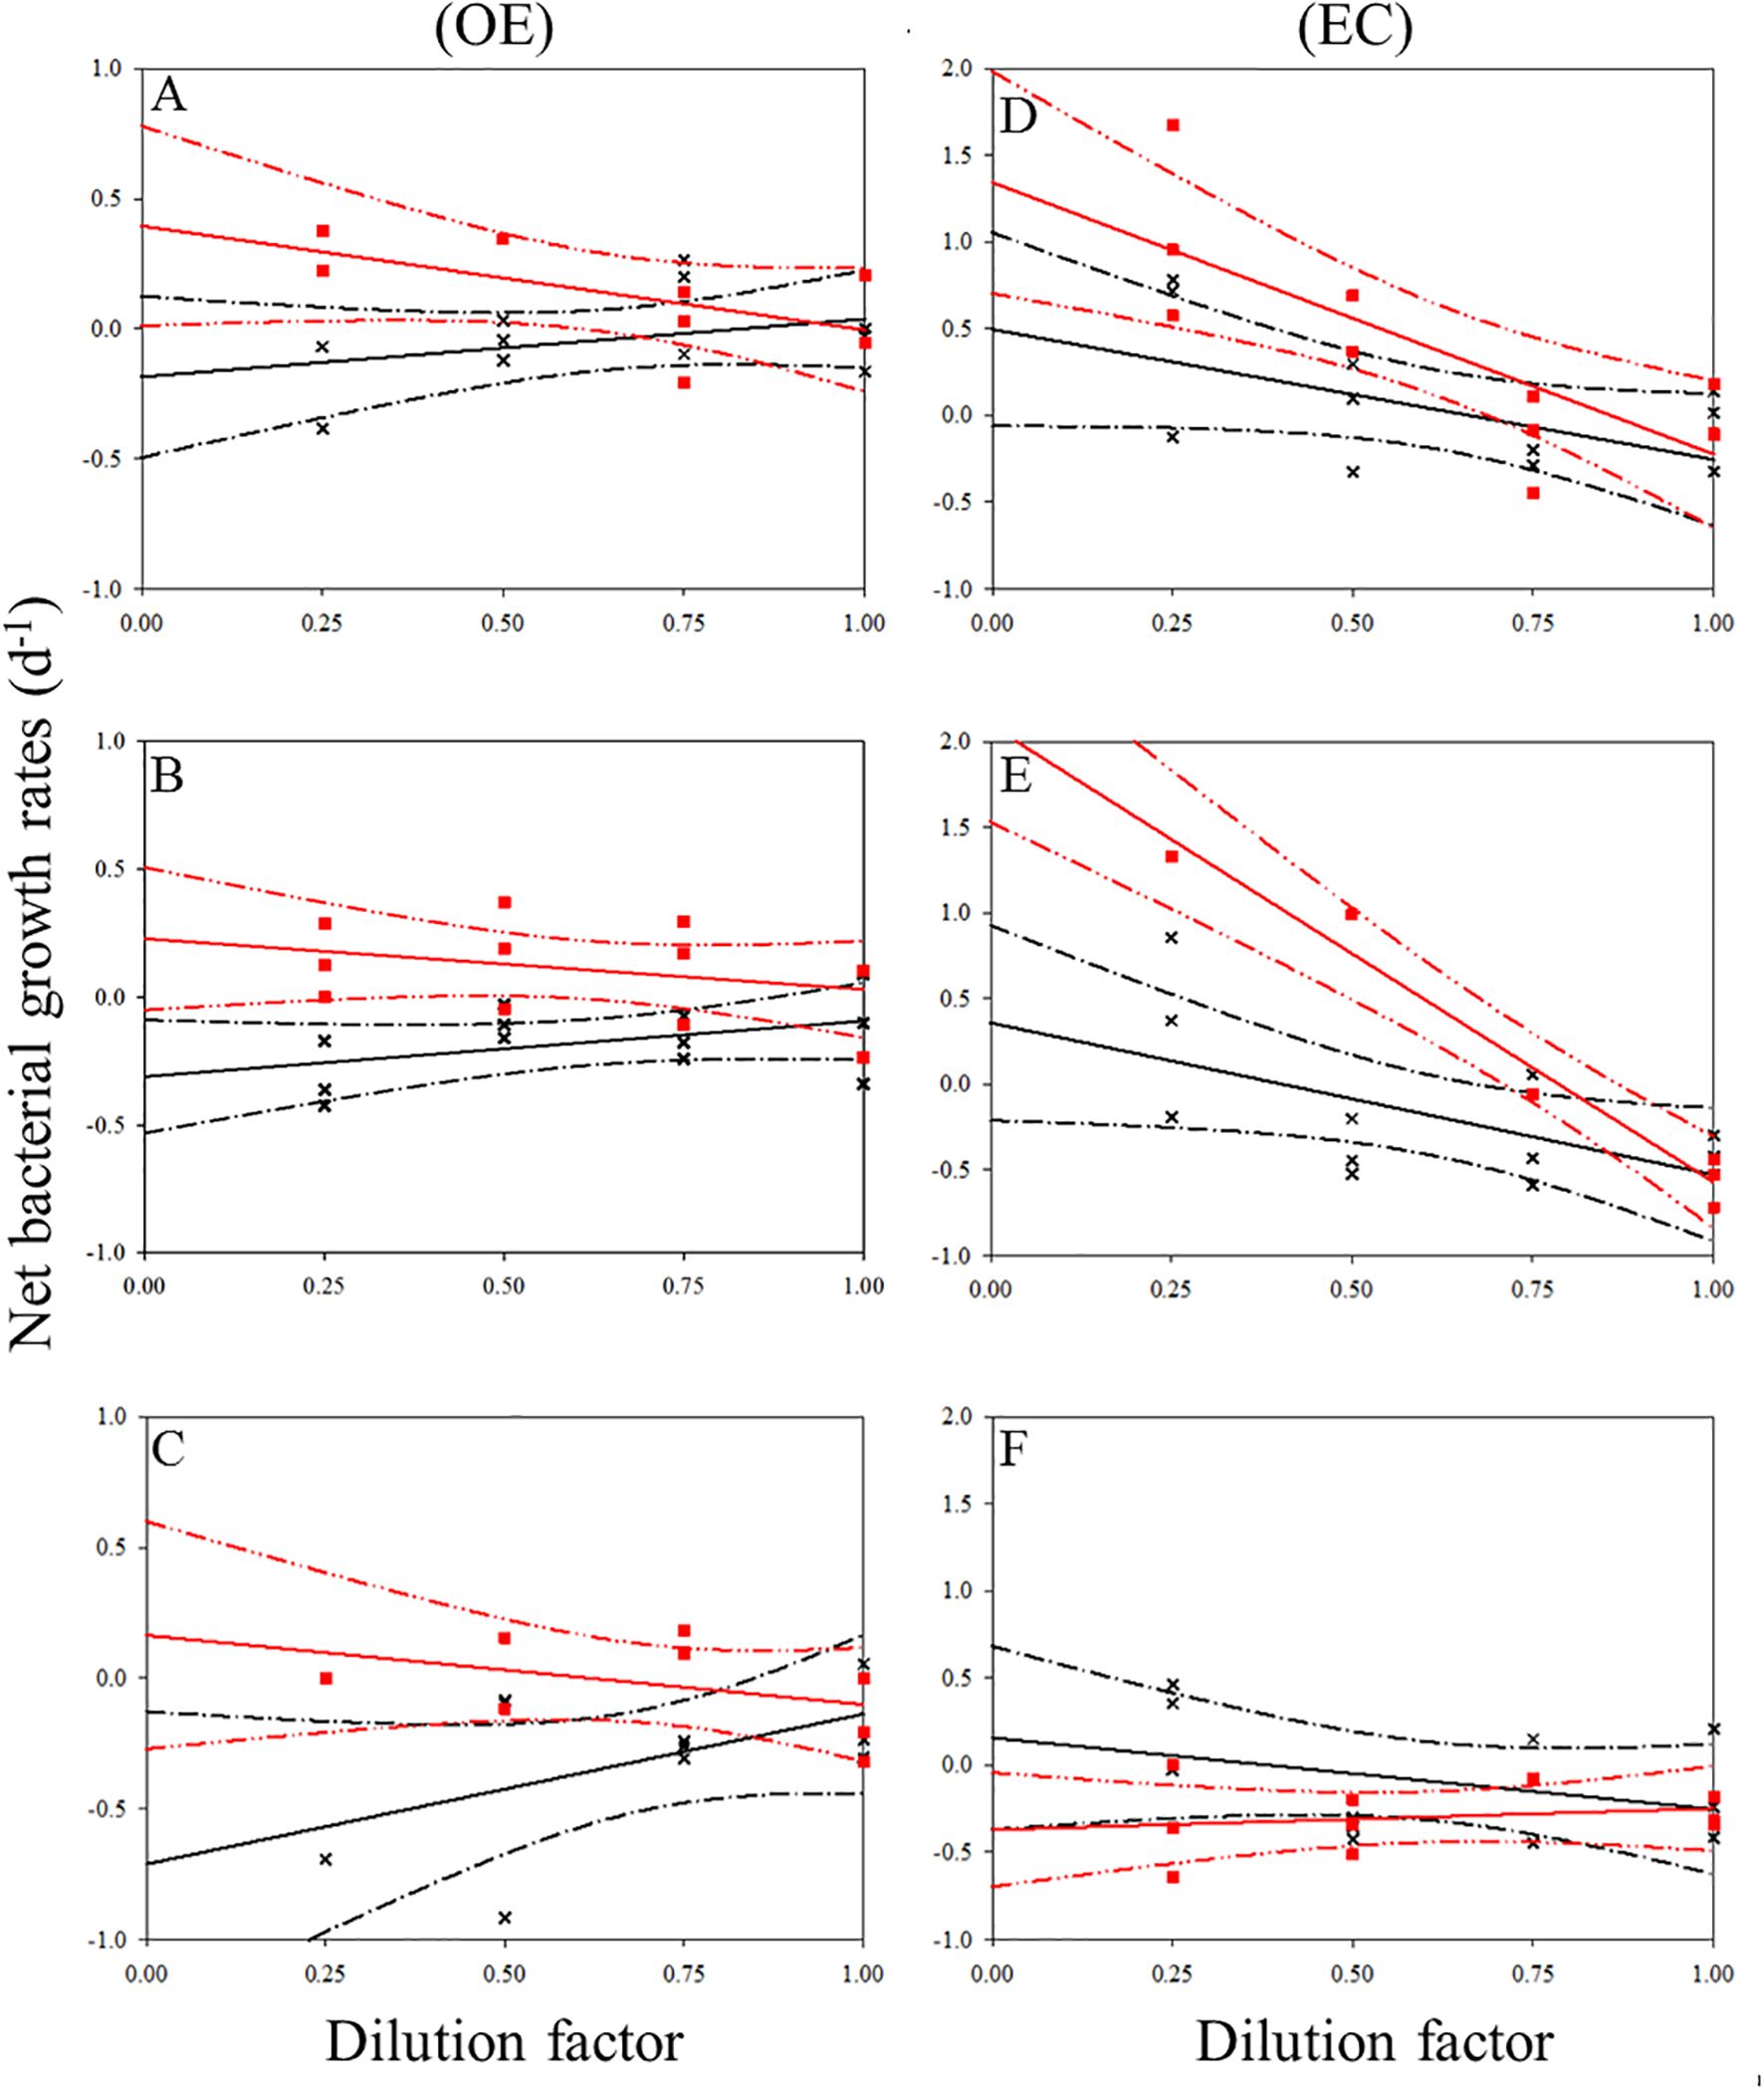
Figure 4. Dilution plots of net bacterial growth rate (d−1) versus seawater fraction in parallel experiments in OE and EC. Cross and closed squares represent growth rates from the 0.2 μm (black line) and 30 kDa (red line) dilution series, respectively. (A) surface, (B) DCM layer (C) 200 m in OE, and (D) surface, (E) DCM layer (F) 200 m in EC, respectively. Dash line: 95% confidence intervals.
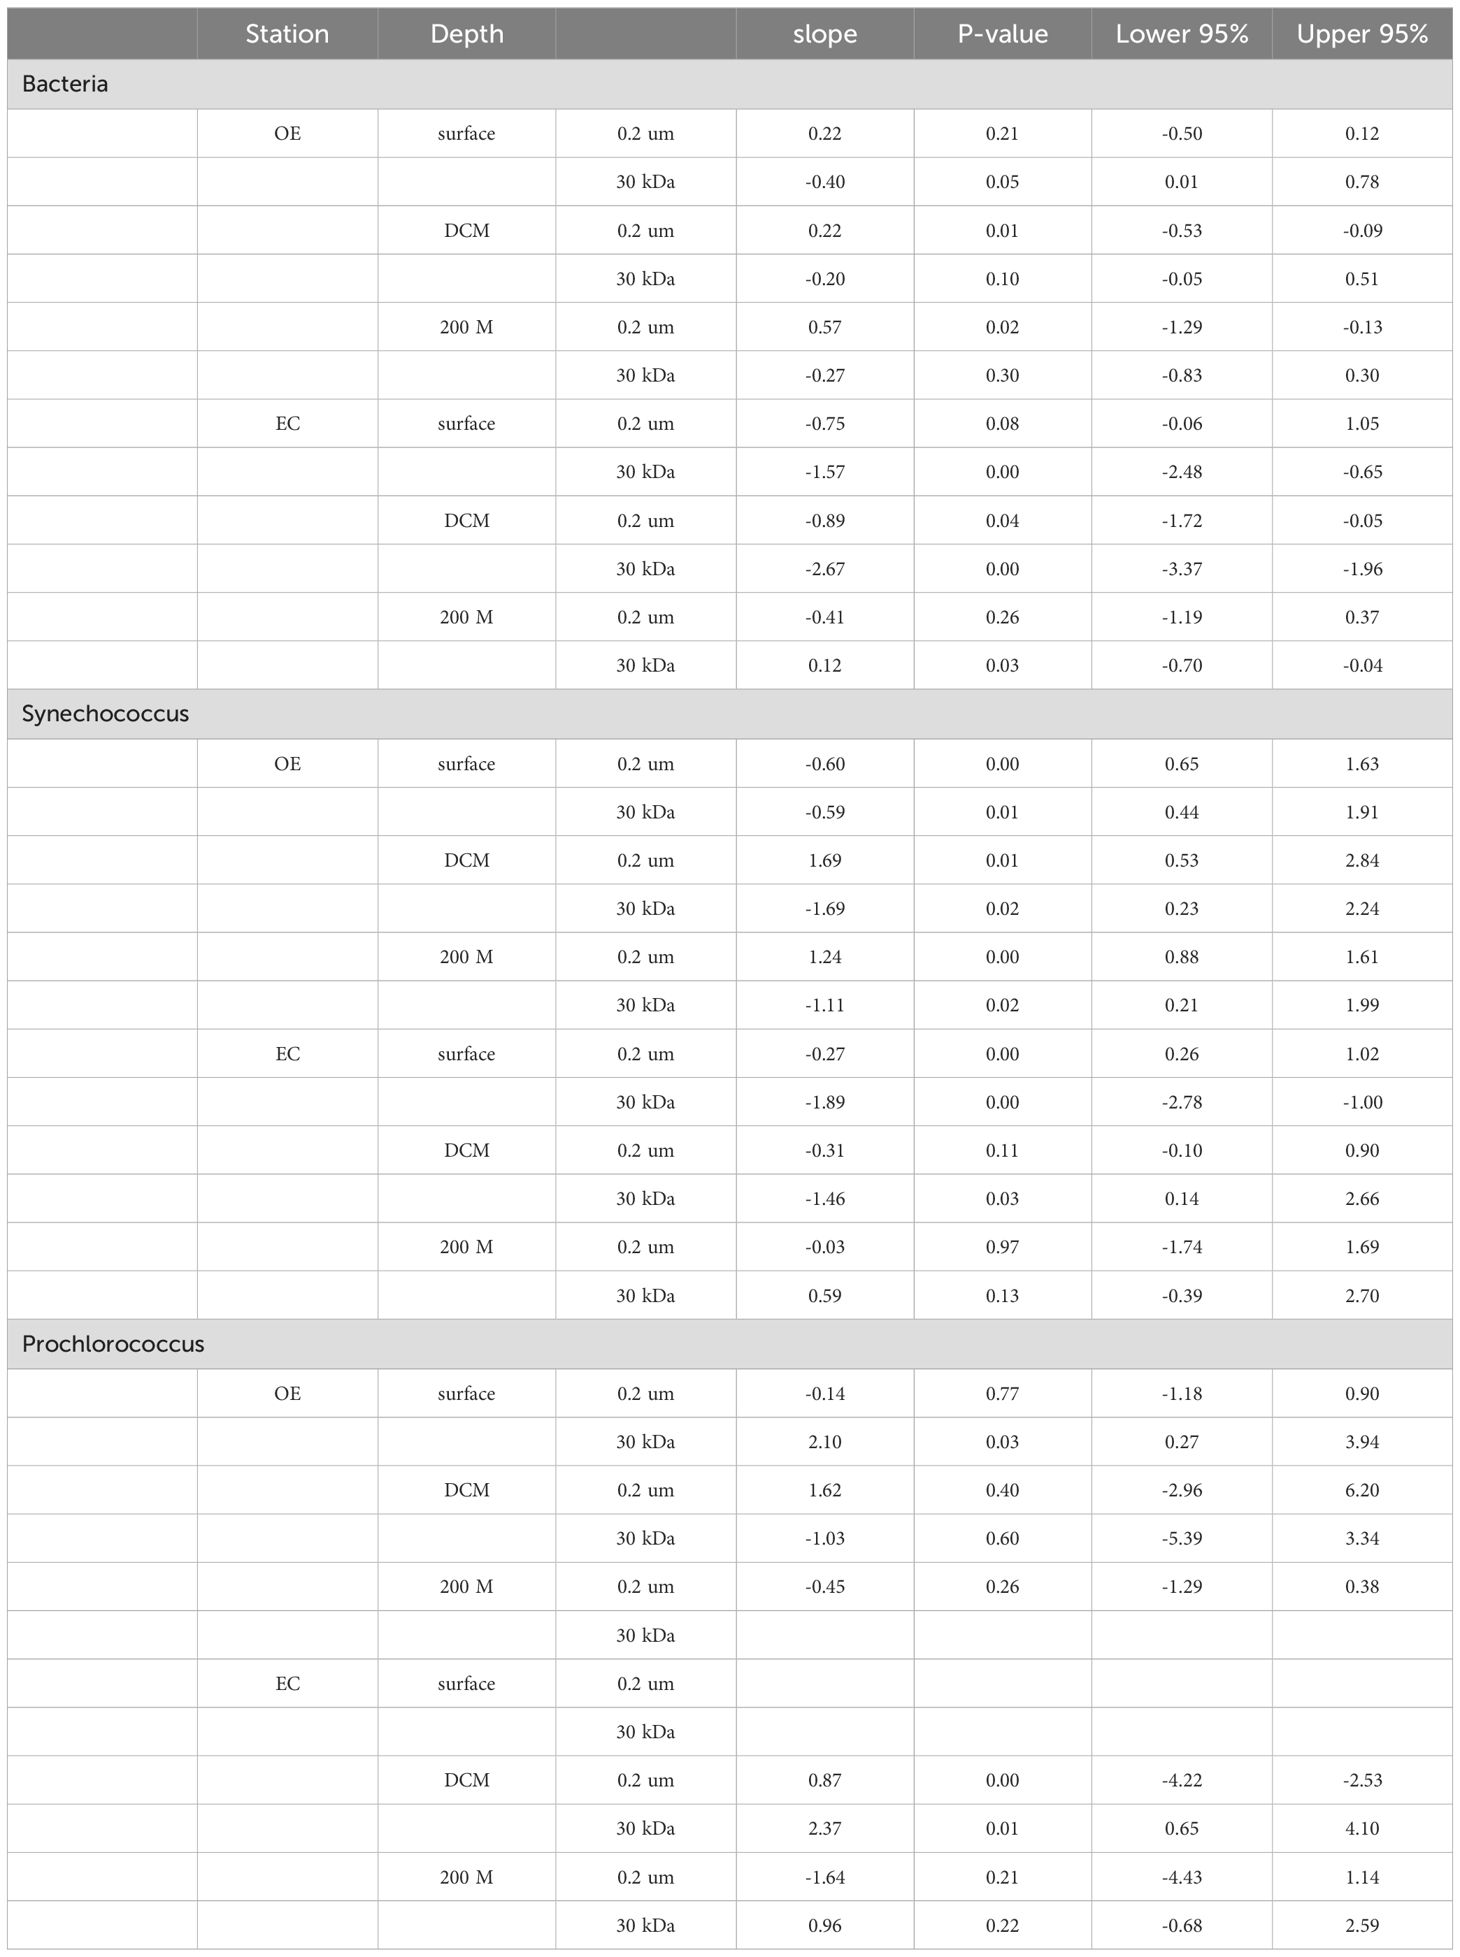
Table 2. Summary of descriptive statistics for slope of regression analysis and 95% confidence intervals.
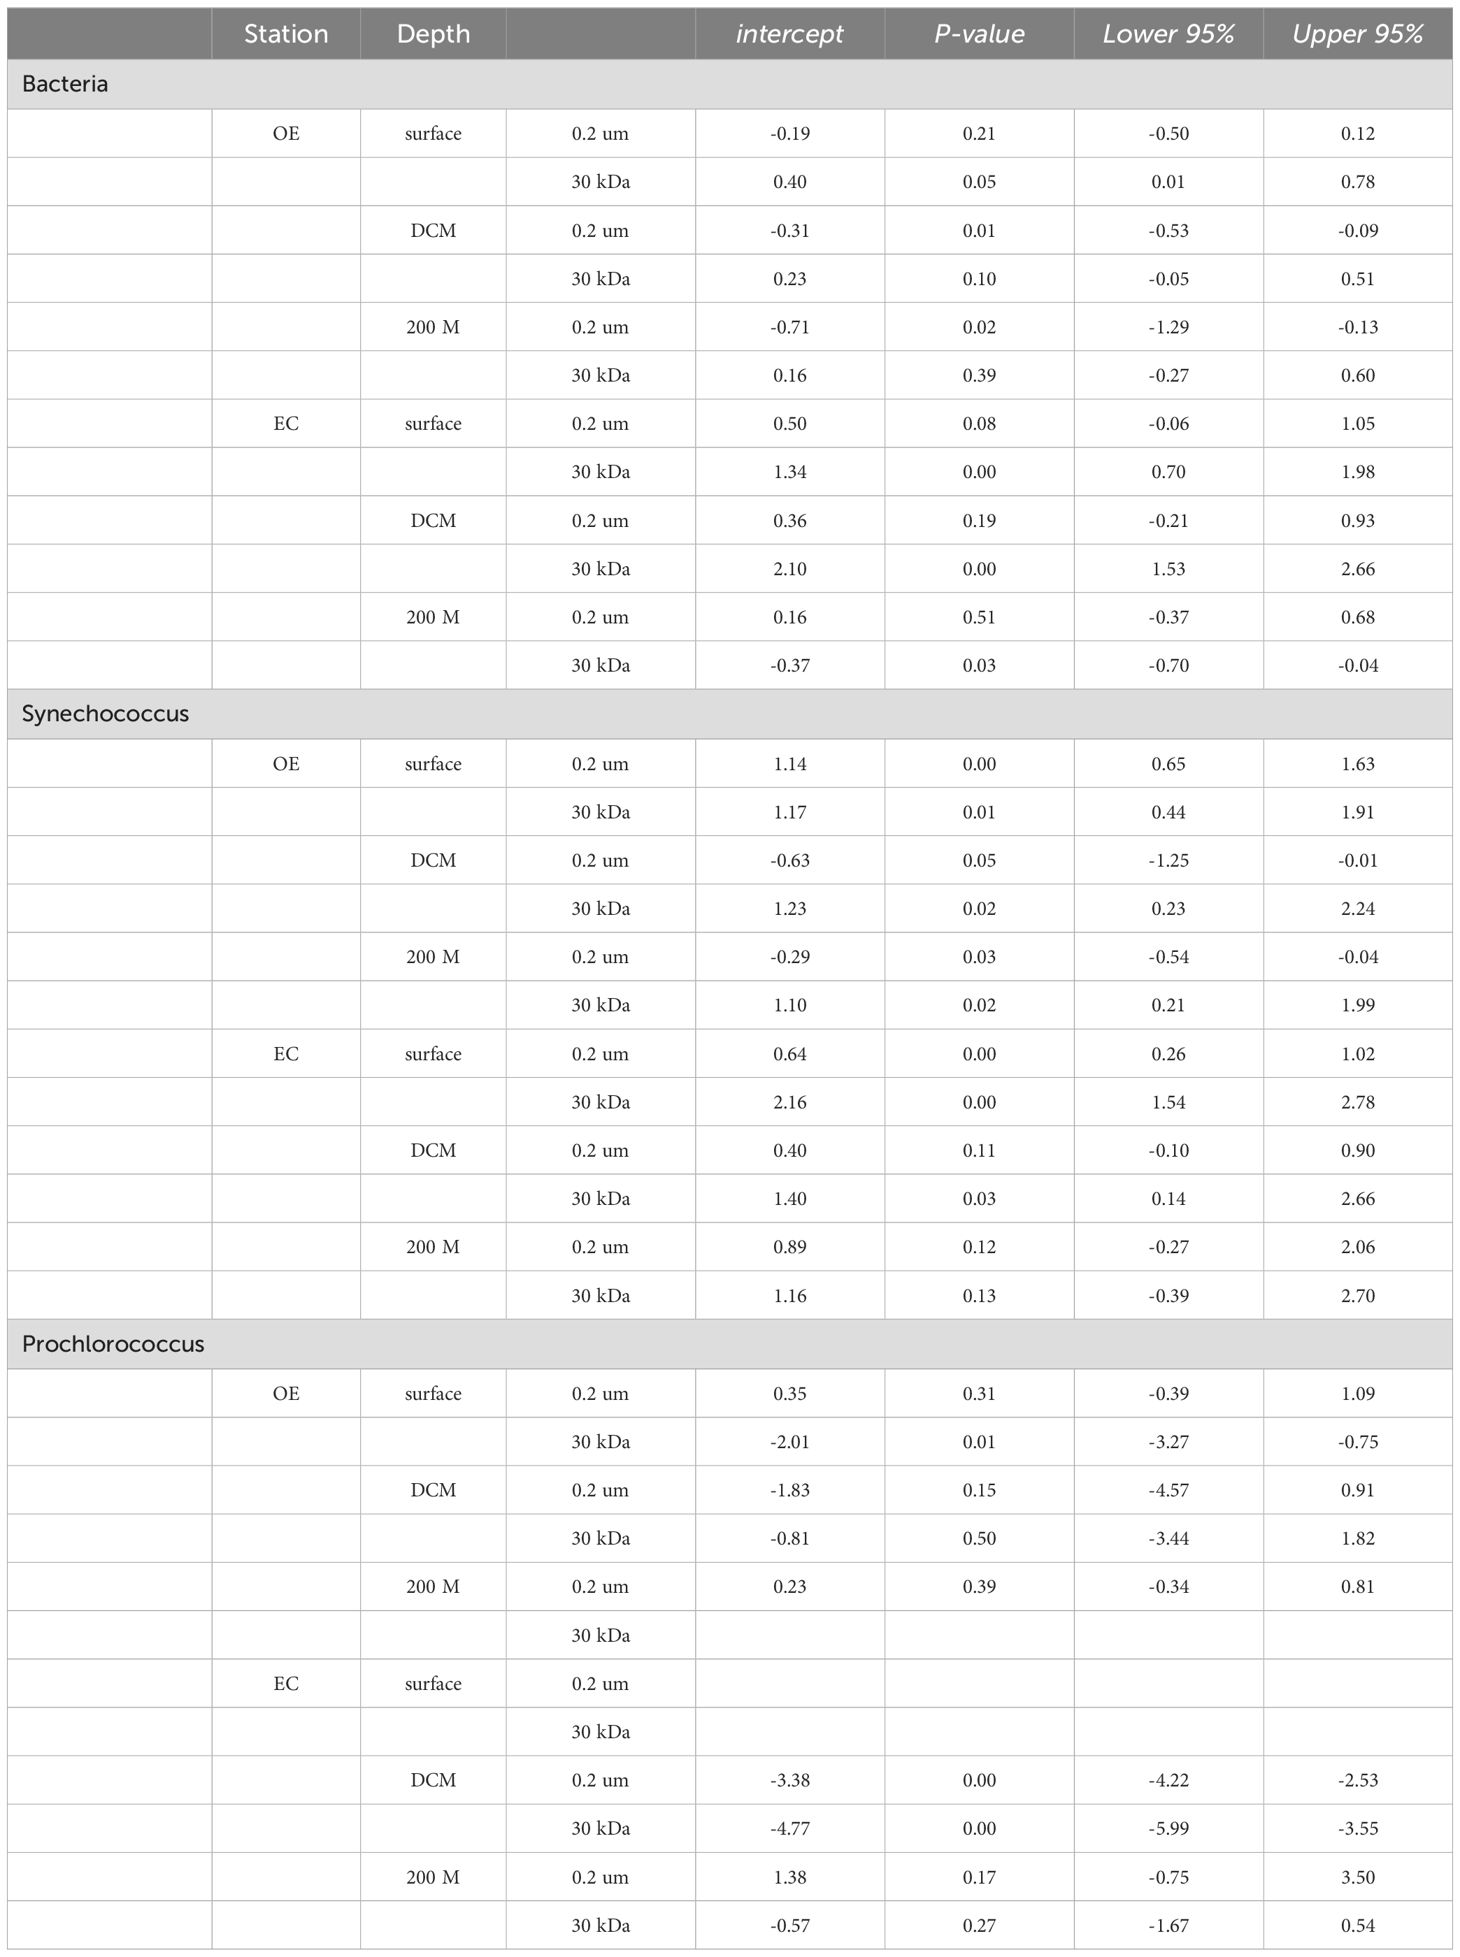
Table 3. Summary of descriptive statistics for intercept of regression analysis and 95% confidence intervals.
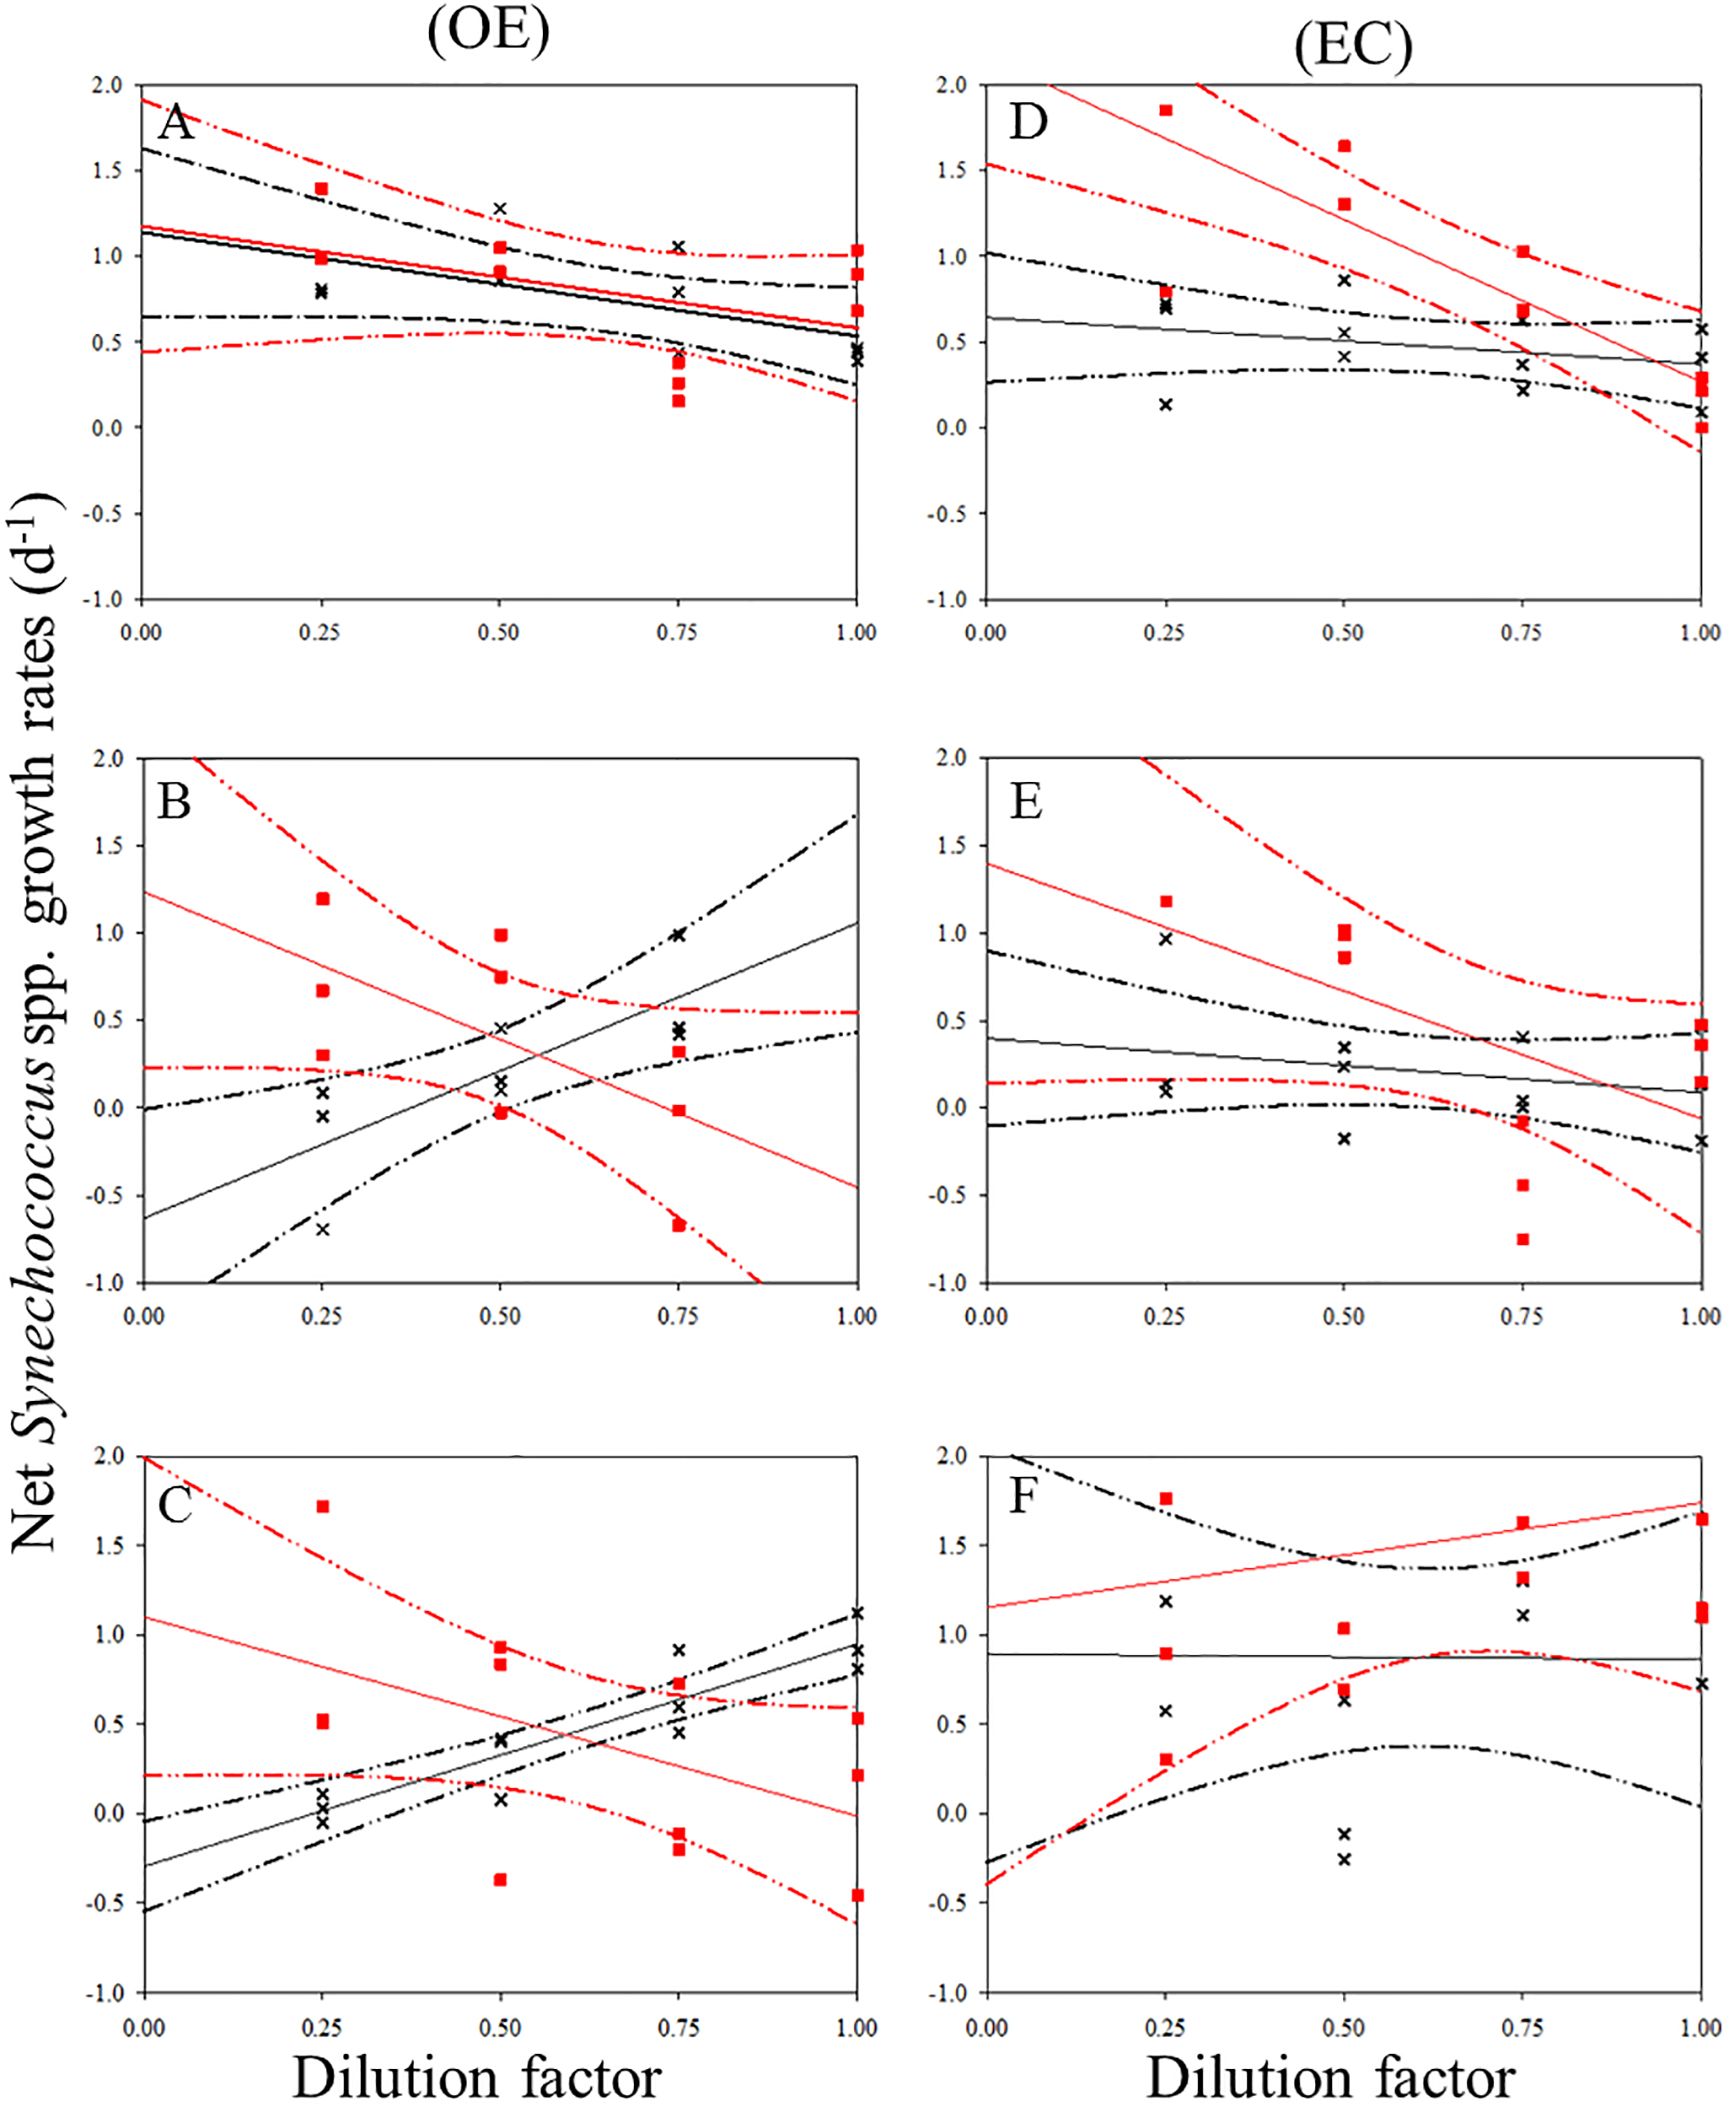
Figure 5. Dilution plots of net Synechococcus spp. growth rate (d−1) versus seawater fraction in parallel experiments in OE and EC. Cross and closed squares represent growth rates from the 0.2 μm (black line) and 30 kDa (red line) dilution series, respectively. (A) surface, (B) DCM layer (C) 200 m in OE, and (D) surface, (E) DCM layer (F) 200 m in EC, respectively. Dash line: 95% confidence intervals.
There was a negative correlation between the 30 kDa dilution series and the dilution level for SYNE in 5 cases (Figures 5A–E). For these analyses, significantly higher growths of SYNE were detected in EC than that in OE region, except at 200 m (Table 4; Figure 7B). Nonetheless, the highest growth rate of PRO was measured at surface water and 200 m in OE and EC region, respectively (Table 4; Figure 6).
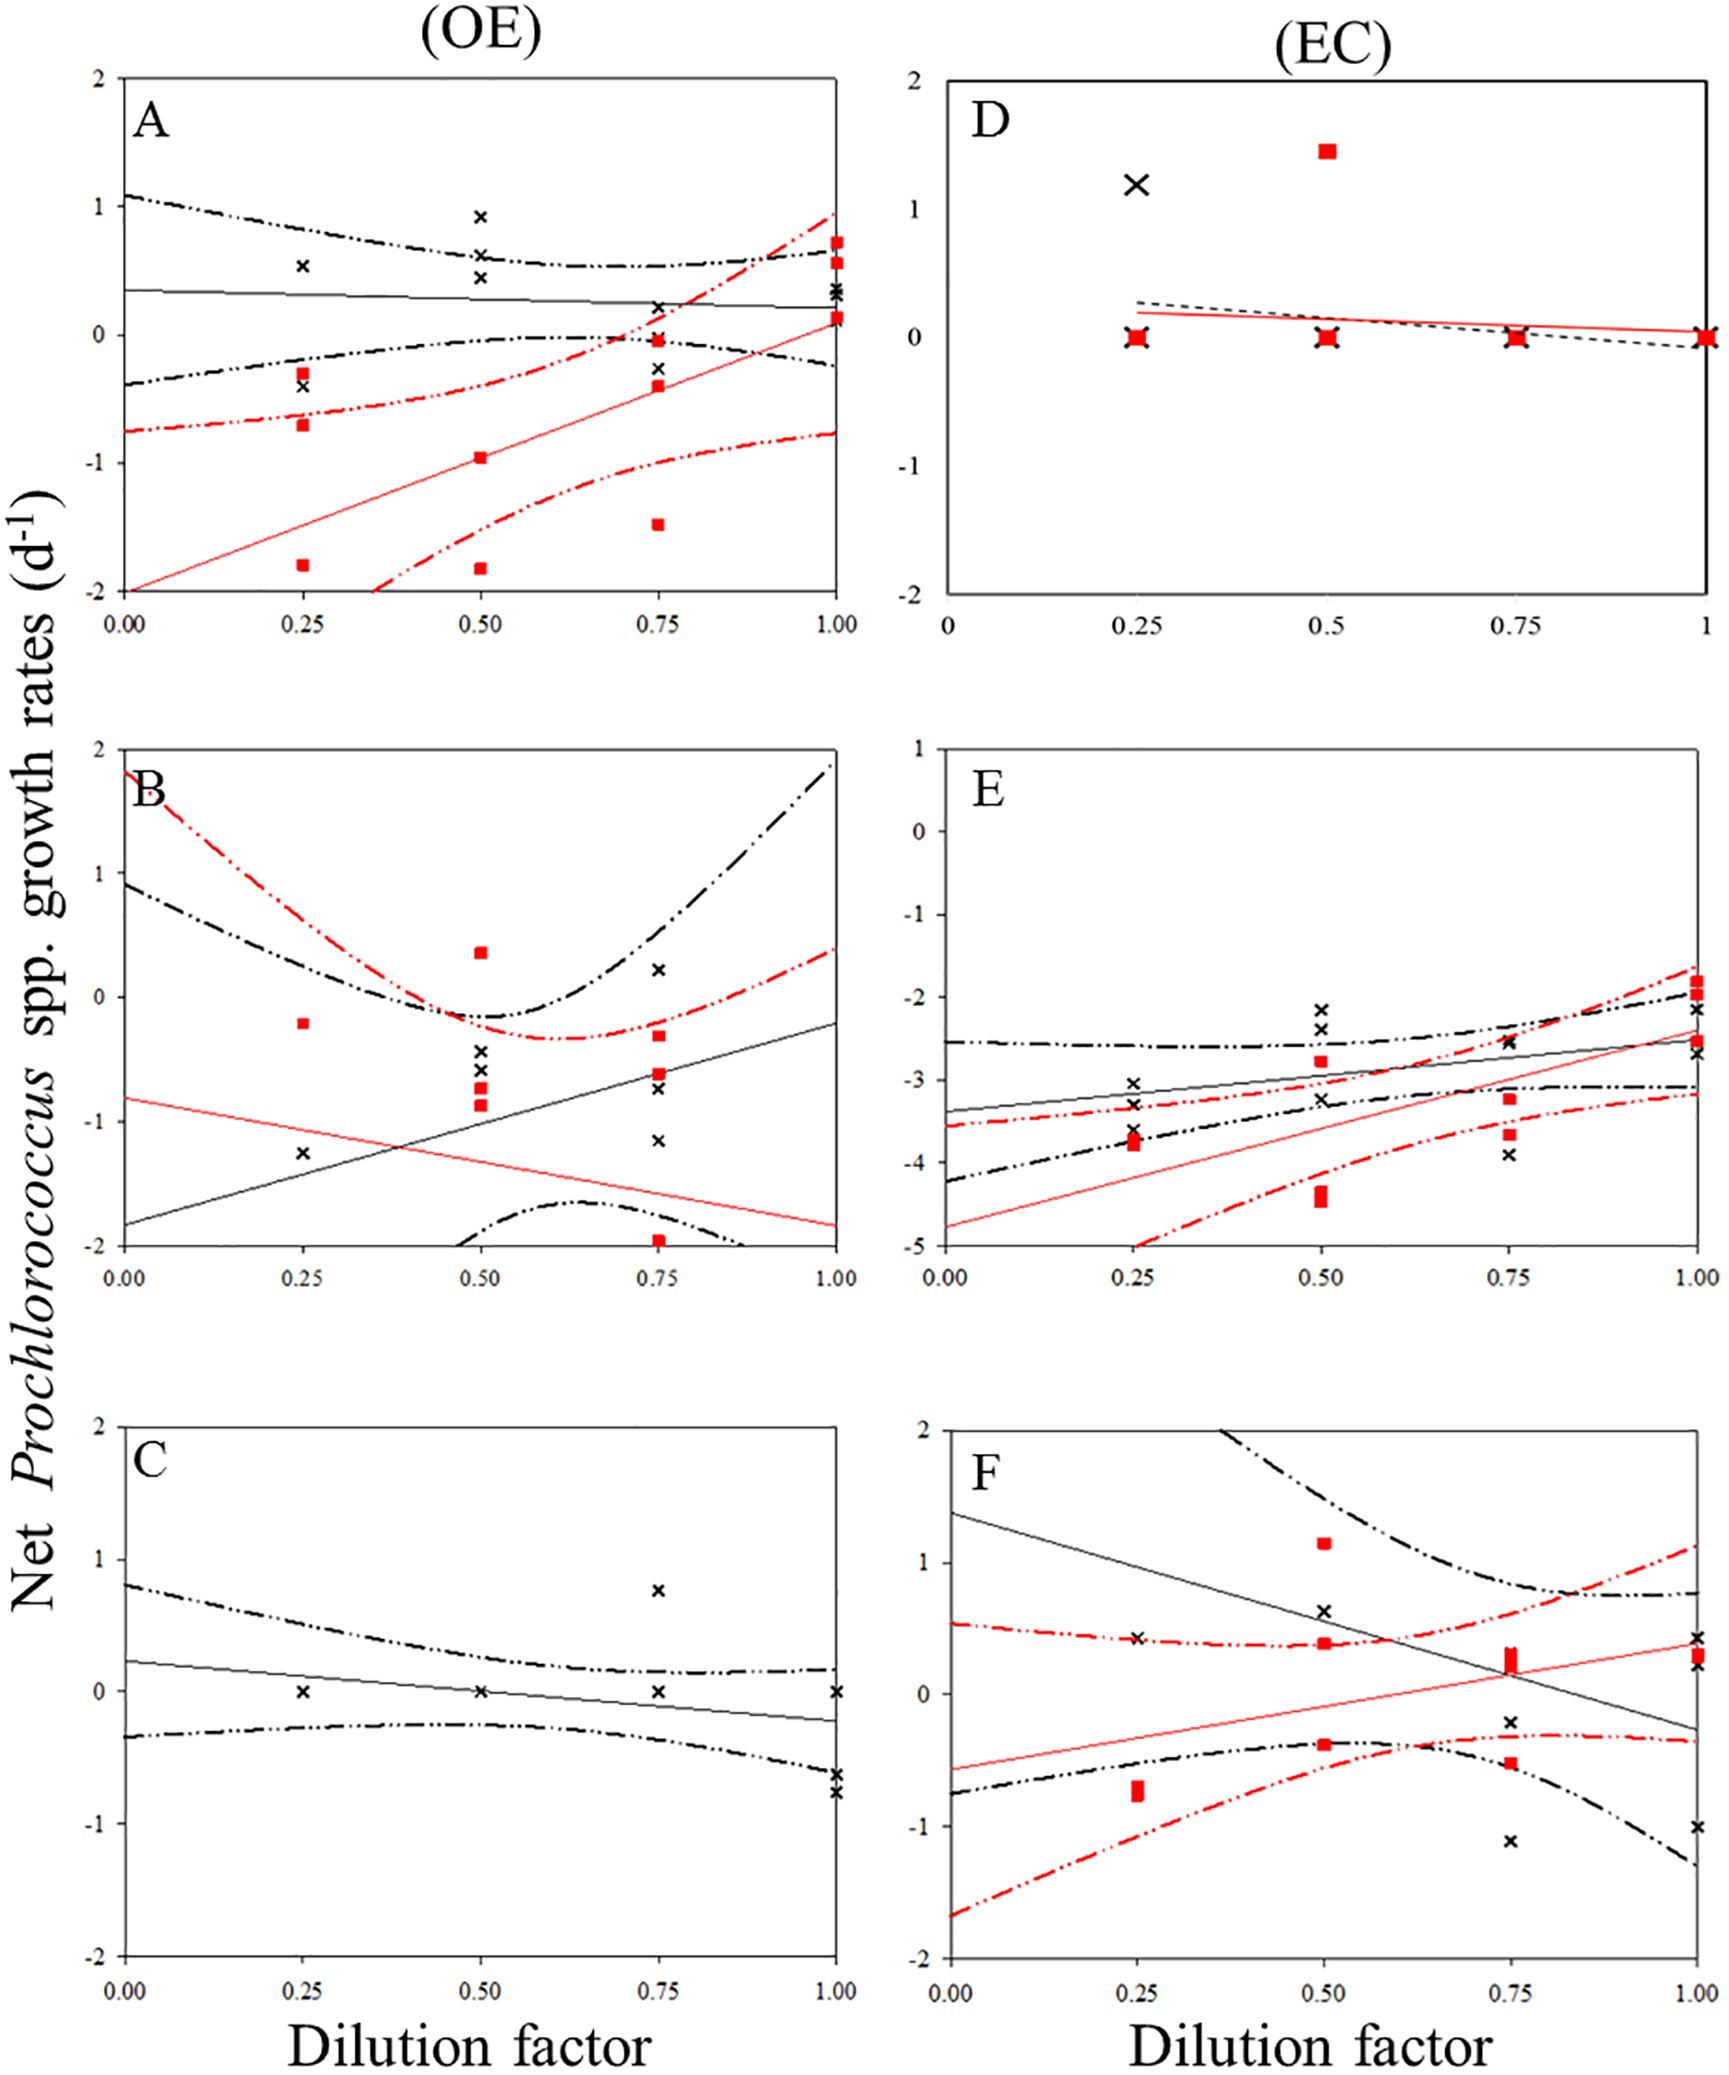
Figure 6. Dilution plots of net Prochlorococcus spp. growth rate (d−1) versus seawater fraction in parallel experiments in OE and EC. Cross and closed squares represent growth rates from the 0.2 μm (black line) and 30 kDa (red line) dilution series, respectively. (A) surface, (B) DCM layer (C) 200 m in OE, and (D) surface, (E) DCM layer (F) 200 m in EC, respectively. Dash line: 95% confidence intervals.
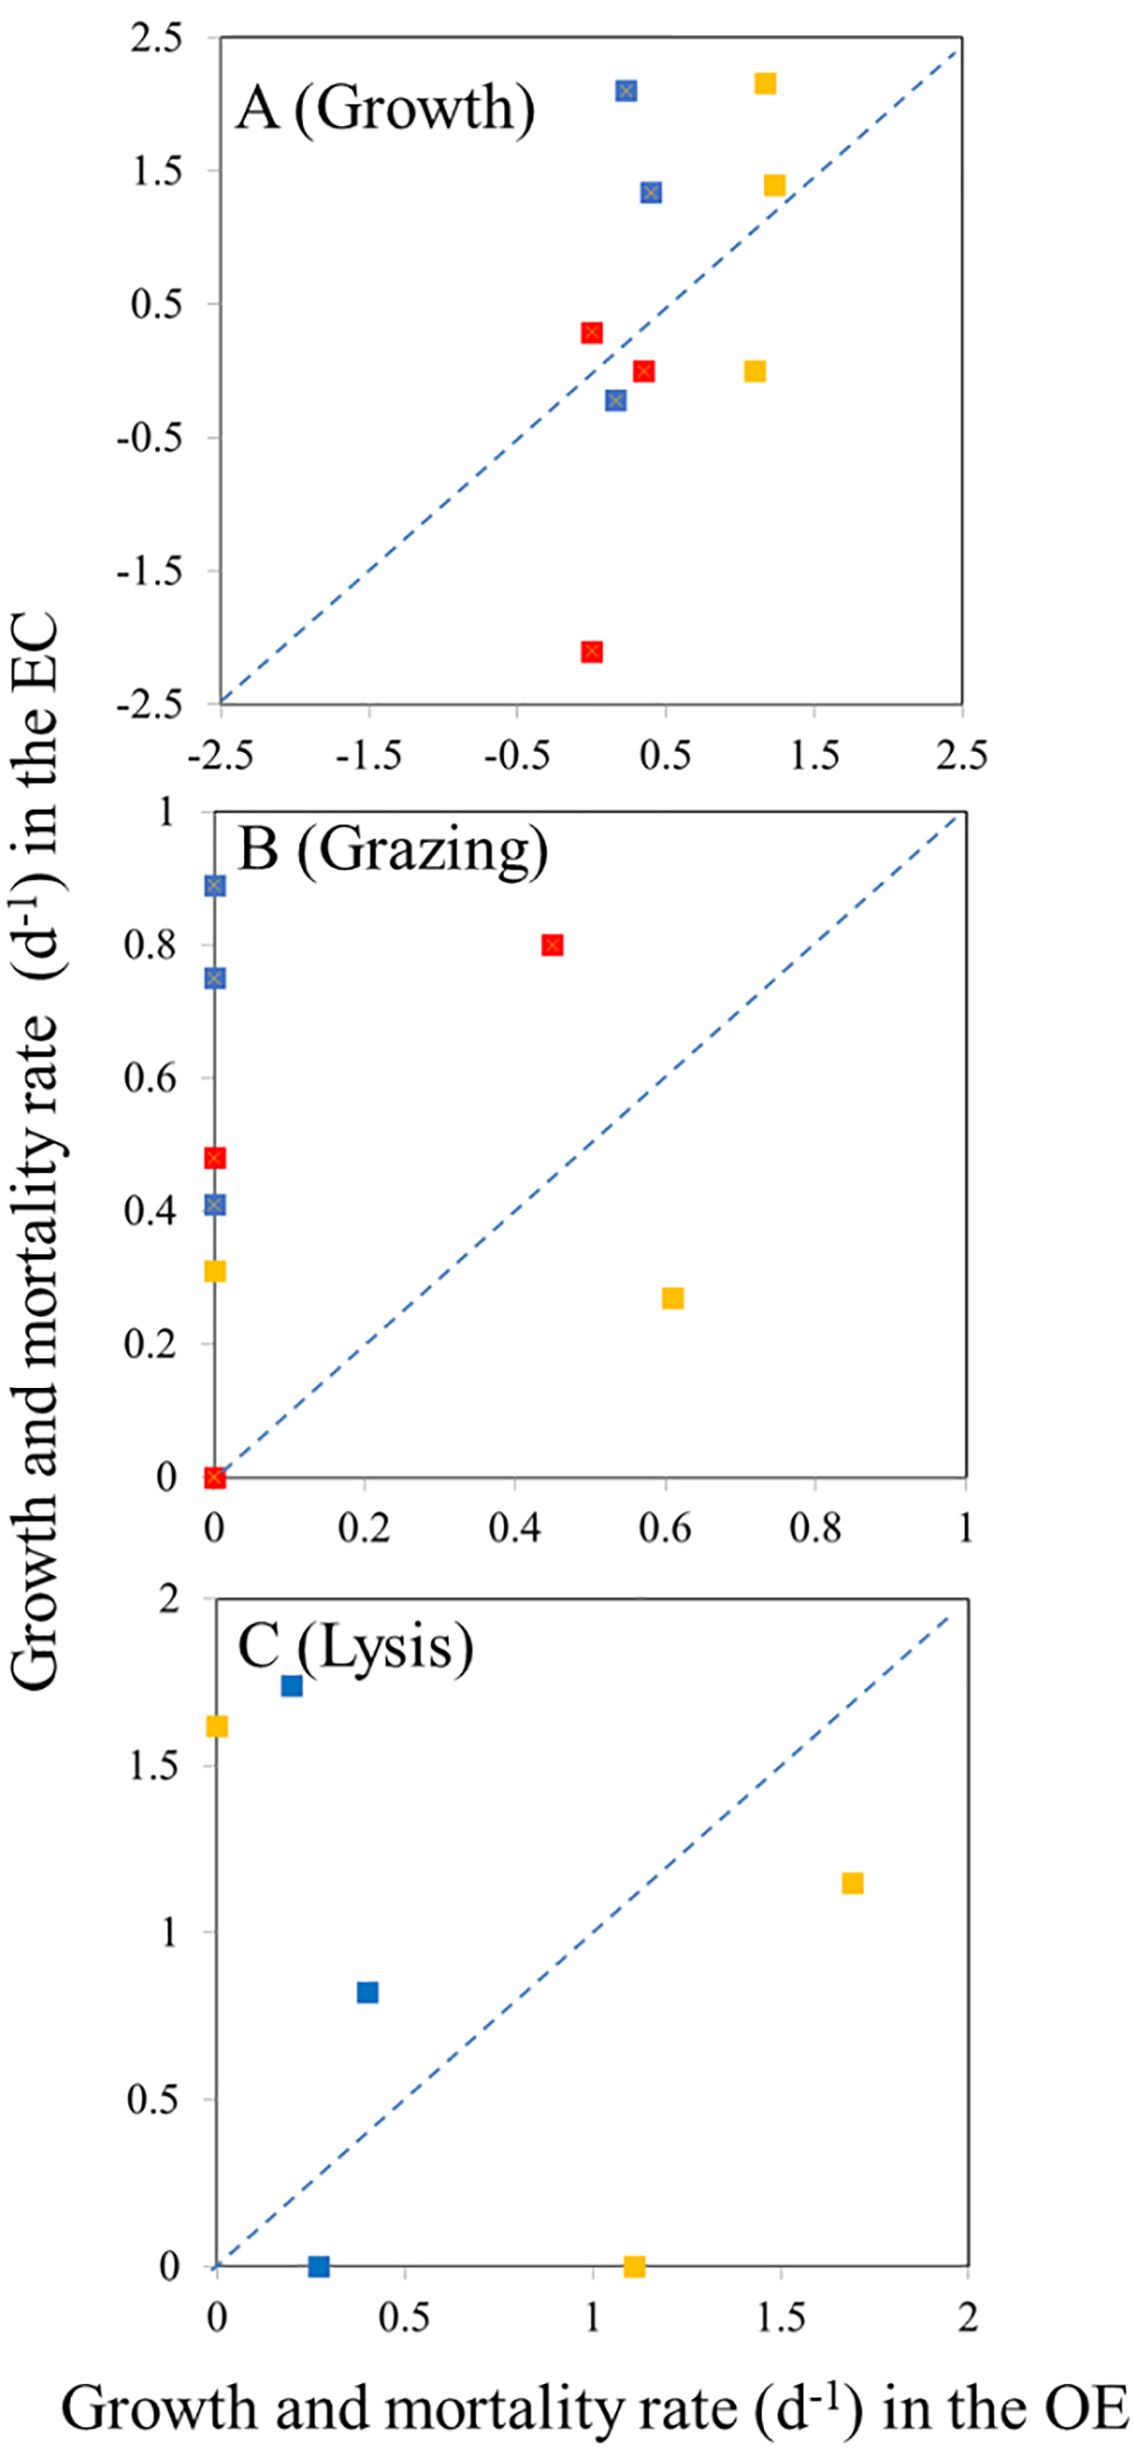
Figure 7. Compare the difference in growth rate (A), grazing rate (B), and (C) viral lysis between EC and OE region. Blue, orange, and red color represents bacterial, Synechococcus spp., and Prochlorococcus spp. values, respectively. Dashed lines represent 1:1 line.
In the OE region, a positive relationship between the net growth rate and the dilution factors in the 0.2 μm diluted series (Figures 4A–C). In this situation, grazing rate analyses did not estimate from these equations, as they represent unrealistic estimates. Further, for 3 cases in EC, a significant negative linear relationship between net growth rate and the dilution factors in the 0.2 μm diluted series, where grazing rates of HB ranged from 0.41 d-1 (200 m) to 0.89 d-1 (DCM) (Table 4; Figure 4). In the present study, we found that HB grazing rates in EC region were higher than that in OE (Figure 7B). On the other hand, the picophytoplankton grazing rate in EC was frequently greater than that in OE at each depth, except for SYNE grazing rate in OE surface water (Table 4; Figure 7B). The apparent growth rate of PRO in 30 kDa dilution series were positive for 4 of 6 estimates. Therefore, we were unable to estimate viral lysis for these 4 cases (Figure 6). In EC, viral lysis of bacteria was higher than in OE above the DCM (Table 4; Figure 7C).
Because of the unique physical processes within mesoscale eddies, their chemical properties and biological composition are distinct from those in their surroundings. There is considerable evidence that mesoscale eddies have distinct effects on ecosystems depending on their origin, age, stage, and type (warm and cold eddies) (Benitez-Nelson et al., 2007). An anticyclonic warm eddy can affect a number of marine environmental parameters, such as temperature, salinity, and nutrients, thus indicating its presence. The presence of warm eddies permits transport of surface water to the deep ocean, increasing temperature and decreasing salinity and nutrient concentrations in deeper waters (Fong et al., 2008; Kim et al., 2012). Currently, there is no understanding of the physical-biological coupling mechanism that occurs in warm-core eddies. In contrast to cold eddy, the ecological impact of warm eddy was much more complex. In the present study, we found significant differences in microbial effects between the inside and outside of the warm eddy.
In an eddy, structural elements such as mixing depths, surface-to-mixed layer interactions, variations in nutrient concentrations, and changes in the light field all affect biological processes (Guo et al., 2017). Based on this study, the EC surface samples had the highest picophytoplankton abundance (SYNE and PRO) and was significantly higher than the OE surface samples (Table 1). However, warm eddy inside surface water showed similar chlorophyll a concentration as outside in our study (Table 1). There is a possibility that other phytoplankton communities can contribute to phytoplankton biomass in OE surface water, and phytoplankton composition changes inside and outside eddies due to physical turbulence or sinking of the nutricline due to warm eddies (Barlow et al., 2017). There was a previous suggestion that the different mixing of water mass caused by the warm eddy and the redistribution of nutrients inside and outside led to a different composition of phytoplankton communities (Yun et al., 2020). As reported by Yun et al. (2020) as well, the phytoplankton composition of the warm eddy and outer area differed significantly, with relatively lower contributions by large phytoplankton, such as diatoms and dinoflagellates within the warm eddy. Further, under all environmental factors, temperature exhibited the greatest variability in phytoplankton community (Dasilva et al., 2014). Sun et al. (2022) suggested that this difference was caused by high temperatures and oligotrophic environments within warm eddy zones.
A distinct distribution of picophytoplankton in the typical layers was observed when we analyzed picophytoplankton distribution in different layers. At the DCM layer, OE samples contains a higher abundance of SYNE and PRO than those at EC (Table 1). There was, however, more phytoplankton biomass (0.496 mg m-3) and higher PEUK abundance in EC than that in OE region (Table 1). Previous study suggested that different phytoplankton communities can adjust to different environmental changes in varying ways (Ewart et al., 2008). In oligotrophic mesoscale eddies in Hawaii and the Sargasso Sea, an observation has been made showing that communities in the upper mixed layer mainly contained PRO and SYNE, while communities in DCM contained haptophytes and pelagophytes (Ewart et al., 2008; Rii et al., 2008). The significant vertical gradients in temperature and nutrients appeared to have an influence on the distribution of phytoplankton groups (Table 1). In this study, we found that a higher concentration of nutrient level in the DCM layer of EC than in the OE layer. This may have supported the rapid growth of phytoplankton in this region and the dominance of community structure in this region (Table 1). According to another explanation, some PEUK, such as haptophytes, are able to adapt to suboptimal irradiance and nutrients due to their mixotrophic metabolism (Liu et al., 2009).
At 200 m, the concentration of nitrate reached 1.57 μM and 0.96 μM in EC and OE, respectively, which can support the growth requirements of picophytoplankton (Agawin et al., 2000). Nevertheless, the PAR at 200 m in both stations was less than 0.05% of the surface light (data not shown). There was insufficient light irradiance at 200 m for phytoplankton to grow. The high picophytoplankton abundance at 200 m depth at the EC is likely the result of mesoscale physical processes since both nutrients and light were similar vertically at the OE and EC stations. A previous study also found that phytoplankton was also enhanced at 200 m EC stations because of the downward sinking of phytoplankton from the upper waters (Zhang et al., 2023). Our incubation experiments, however, found that the lower growth rates of SYNE were measured at 200 m (Table 2). Additionally, there are still to be considered the influences of warm eddy on the activity of picophytoplankton communities in EC besides the physical function of downwelling.
Our current understanding is that phytoplankton are the main source of dissolved organic carbon (DOC) for HB dynamics (such as production), linking phytoplankton with HB dynamics in the ocean. In the present study, we found that relative maxima in the vertical distribution of HB near the chlorophyll maximum in OE. It is possible that HB in the subsurface maximum depth efficiently utilize organic material from phytoplankton and produce noticeable increases in their population. Despite this, there was no clear vertical pattern in HB abundance in the EC region (Table 1). In general, temperature and DOC were the most influential factors in determining the distributions of HB communities. However, in our study, neither temperature nor chlorophyll concentration were associated with HB abundance in EC. A further interesting finding of our study was that the anticyclonic warm eddy enhanced the grazing rate of microzooplankton and nanoflagellates on HB (Table 2). It is also plausible that grazers such as microzooplankton and nanoflagellates remove a large percentage of the total daily HB production in this region, explaining the absence of clear vertical variation in HB abundance in the EC region.
A modified dilution approach (Evans et al., 2003) was developed to determine virus-induced mortality of specific phytoplankton. It is based on the original dilution method developed by Landry and Hassett (1982), which has been extensively used to estimate phytoplankton growth and microzooplankton consumption (Worden and Binder, 2003; Zheng et al., 2015). One of the assumptions of the dilution approach is that the prey growth rate is independent of dilution (Landry and Hassett, 1982). The modified dilution method, however, is subject to some potential methodological constraints. As a result of this study, we noticed a significant decline in HB and picophytoplanktonic growth rates in the 30 kDa dilution series compared to the 0.2 μm dilution series (Figures 3F, 4F, 5A, B, E, F). As reported by Ayukai (1996), limiting nutrients in their study reduced SYNE growth in most diluted treatments and differed from the effects postulated by Landry and Hassett (1982). Similarly, Kimmance et al. (2007) found that dilution in virus-free water reduced the growth rate of picophytoplankton, including SYNE and PEUK. Furthermore, Landry and Hassett (1982) proposed nutrient amendments for nutrient-limited waters to ensure phytoplankton growth rates are independent of the dilution effect. As added nutrients can affect food quality, this may affect estimates of grazing-induced mortality (Worden and Binder, 2003). As another mechanism, increased viral burst size and production might also influence viral mortality estimates with nutrient addition (Gons et al., 2006). For these reasons, although in situ nutrients were low (NO3<0.1 μmolL−1) in surface waters, nutrients were not added to the bottles during the experiments in this study.
According to the present study, growth rates of HB in EC samples were higher than those in OE samples at surface and DCM layers (Table 4; Figure 7A). A variety of bottom-up factors, including DOC quality and temperature, affect HB communities and growth (Kirchman et al., 2000; Tsai et al., 2005). The warm eddy was found to stimulate HB production at its center (EC) compared to its edges, with elevated Chl a concentration, which indicated that phytoplankton biomass was a significant determinant of HB production variability (Ewart et al., 2008). One of the mechanisms was that as high temperatures in the EC region caused microbial communities to be more active and diverse, different phylogenetic types were favored by temperature (Sun et al., 2020). Another explanation may be that the protistan grazing on prokaryotes (an important mechanism for nutrient regeneration in the ocean) is high due to the accumulation of microorganisms within warm eddies. Prokaryotes may be affected more by this increased supply of inorganic nutrients than eukaryotes, since aquatic HB are better competitors for phosphorus at low concentrations of inorganic nutrients (Thingstad et al., 1998). Moreover, this study shows that warm eddy downwelling changes environmental parameters, with higher phosphorus values in the EC region (Table 1).
The majority of studies have focused on bottom-up influences such as variation in nutrients, light, and temperature led by mesoscale eddies that affect phytoplankton communities (Gaube et al., 2014; Kang et al., 2022). It should not be considered negligible that nanoflagellates and microzooplankton are grazing pressure. Few comparison analyses have been conducted between different eddies to determine how nanoflagellates or microzooplankton graze in mesoscale eddies (Landry et al., 2008; Chen et al., 2009). Due to ciliate abundance in the open ocean, this study uses a size fractionation of 10 μm for grazers only. Additionally, trophic cascades might have occurred due to dilution grazing experiments, and nanoflagellates may have caused an overestimation of mortality in HB and picophytoplankton. There is the possibility that if nanoflagellates of size >10 μm are absent, smaller nanoflagellates (2-5 μm) may develop which, in turn, might consume HB and picophytoplanktonic directly. As preferred grazing was not assessed during the dilution experiments, it is not known whether it occurred.
Field observations based on a modified dilution experiment revealed significant differences between the EC and OE regions in terms of grazing rates of HB and picophytoplankton (Table 4; Figures 7A, B), and showed the higher grazing rates in EC. A previous study reported that a significant temperature increase was found to increase the grazing pressure in the anticyclonic eddy (An et al., 2024). Furthermore, a warmer, oxygen-rich environment in the center of anticyclonic eddies provides a metabolic advantage to predators and facilitates their search for suitable prey (Braun et al., 2019). According to another study, microzooplankton and nanoflagellates are driven toward anticyclonic eddies by the convergence effect. Consequently, this causes an increase in microzooplankton and nanoflagellate abundance in surface waters, which increases grazing rates in HB and picophytoplankton in warm eddy cores (Wang et al., 2022). Similarly, Boras et al. (2010) found higher grazing activity at anticyclonic eddies, possibly because of higher nanoflagellate abundance. These abiotic and biotic factors which were simultaneously driven by warm eddies affect HB and picophytoplankton communities through top-down controls.
It has been found that varying physico-chemical conditions at varying depths affect the abundance and growth of HB and picophytoplankton as well as their mortality loss (Chang et al., 2024). In our study, grazing and virus lysis were significantly different for HB and picophytoplankton mortality within and outside the warm eddy (Figure 8). A lower proportion of viral lysis is responsible for HB and picophytoplankton mortality in the EC region, due to higher grazing rates. To the best of our knowledge, no study has compared the relative importance of grazing and virus lysis for HB and picophytoplankton mortality in warm eddies. It is still unknown how viruses contribute to HB mortality in that region. Viral lysis has been shown to have greater significance when protozoan grazing is limited by environmental constraints (Danovaro et al., 2008). According to Weinbauer and Höfle (1998), lytic infection leads to HB mortality in anaerobic hypolimnion layers of Lake Plußsee (Germany), where protists are scarce due to low oxygen levels. The extent to which viral lysis and grazing contributed to HB mortality changed with depth, according to Weinbauer and Höfle (1998). Furthermore, viruses and grazers interact complexly with picoplankton, possibly resulting in antagonistic or synergistic effects (Sime-Ngando and Pradeep Ram, 2005). It has been shown that nanoflagellates can reduce viral abundance and infectivity by consuming viruses directly or grazing specifically on viral-infected cells (Bettarel et al., 2005).
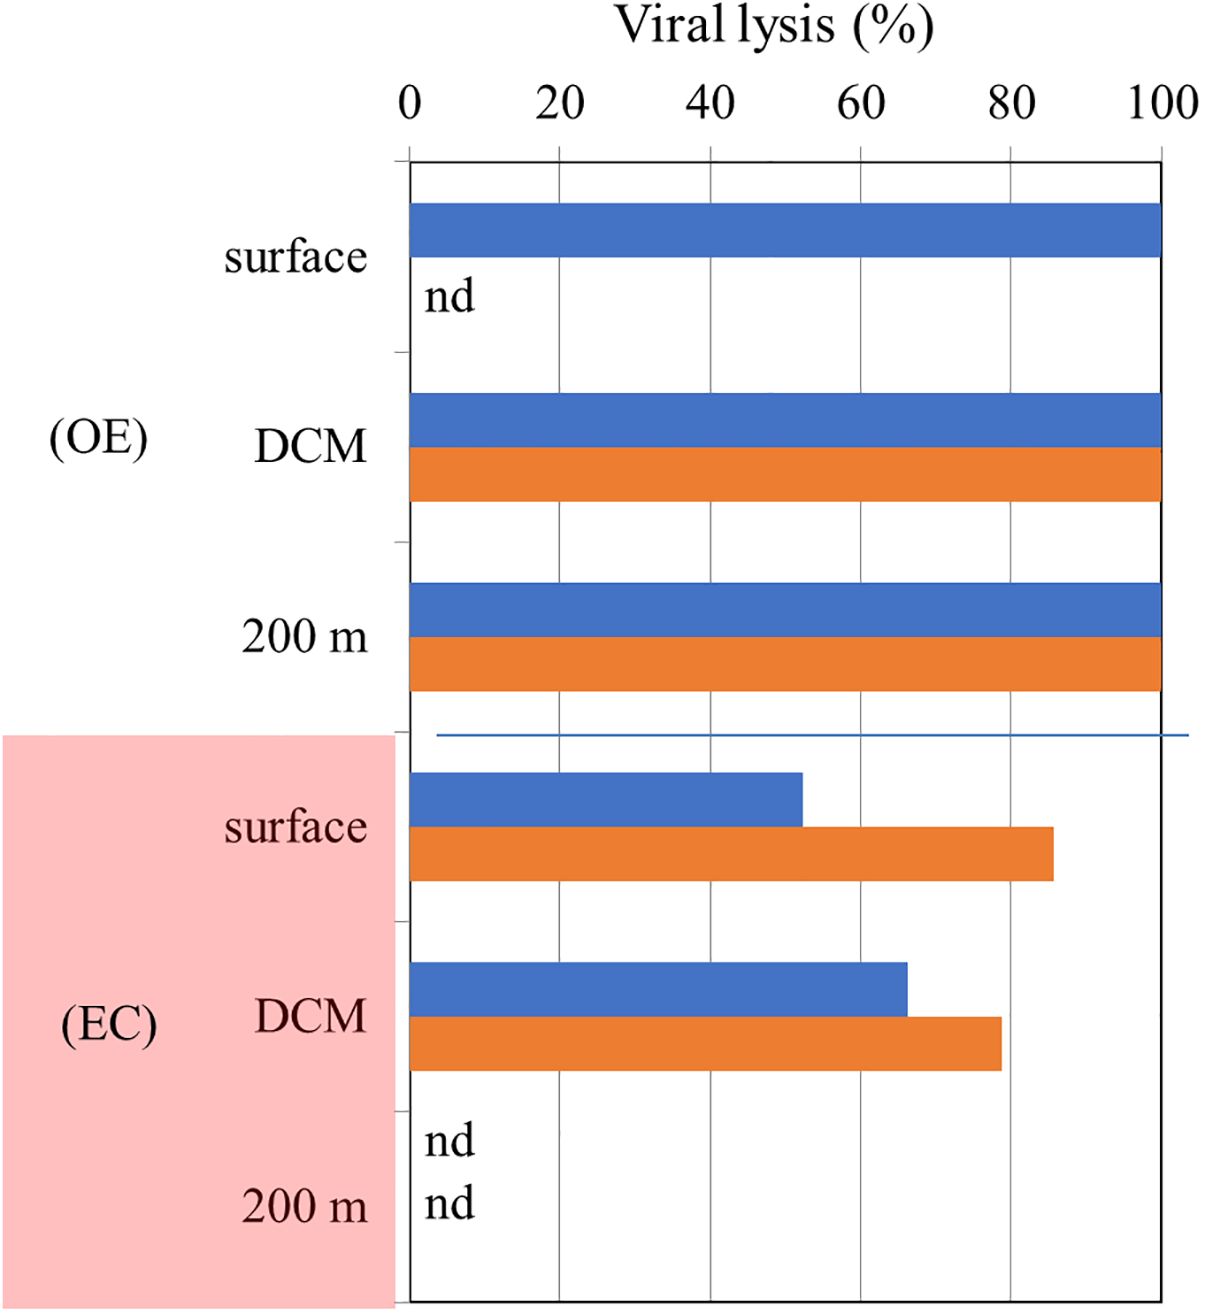
Figure 8. Vertical variations in the ratio of viral lysis to total mortality in OE and EC (Red color). Blue, and orange bars represent bacterial, and Synechococcus spp. values, respectively. nd is non-detectable value.
In terms of vertical variations, we found that viral lysis is almost 100% of the HB and SYNE mortality at the surface, DCM and 200 m layer in OE (Figure 8). In comparing the experiments conducted in Kuroshio water, 70% of the mortality loss was related to nanoflagellate grazing in the DCM layer, while the majority of mortality loss was attributed to viral lysis in the mesopelagic zone (300-500 m) (Chang et al., 2024). As a result of the shallow depth of3the DCM layer (75 m depth), higher water temperature (24.5 to 28.6°C), and higher nitrate concentration (0.6 μM) in Chang et al. (2024) study, different environmental factors must be considered.
In summary, this study shed light on the vertically fine distribution of picophytoplankton influenced by warm eddies and provided new insights into the biological response to warm eddies in tropical Pacific Ocean for the first time. We suggest that nanoflagellates within warm eddies transfer more picoplankton production to higher trophic levels, while viruses return more picoplankton production to DOM pools outside warm eddies. In addition, the downwelling in EC may increase picophytoplankton growth and grazing rates, increasing the carbon sink in the warm eddy and potentially increasing deep ocean carbon storage.
The original contributions presented in the study are included in the article/supplementary material. Further inquiries can be directed to the corresponding author.
PC: Formal analysis, Investigation, Methodology, Writing – review & editing. MO: Formal analysis, Investigation, Methodology, Writing – review & editing. G-CG: Resources, Writing – review & editing. SJ: Resources, Writing – review & editing. T-YH: Resources, Writing – review & editing. LS: Resources, Writing – review & editing. A-YT: Conceptualization, Data curation, Formal analysis, Funding acquisition, Investigation, Methodology, Resources, Validation, Writing – original draft, Writing – review & editing.
The author(s) declare financial support was received for the research, authorship, and/or publication of this article. This study was supported by a grant (MOST 111-2119-M-019-002) from the Ministry of Science and Technology, ROC.
We appreciate the language editing and helpful comments from Choice Language Service Co., Ltd. on this manuscript.
The authors declare that the research was conducted in the absence of any commercial or financial relationships that could be construed as a potential conflict of interest.
All claims expressed in this article are solely those of the authors and do not necessarily represent those of their affiliated organizations, or those of the publisher, the editors and the reviewers. Any product that may be evaluated in this article, or claim that may be made by its manufacturer, is not guaranteed or endorsed by the publisher.
Agawin N. S., Duarte C., Agustí S. (2000). Nutrient and temperature control of the contribution of picoplankton to phytoplankton biomass and production (Errata). Limnol. Oceanogr. 45, 591–600. doi: 10.4319/lo.2000.45.3.0591
An L., Liu X., Xu F., Fan X., Wang P., Yin W., et al. (2024). Different responses of plankton community to mesoscale eddies in the western equatorial Pacific Ocean. Deep Sea Res. Part I: Oceanographic Res. Papers 203, 104219. doi: 10.1016/j.dsr.2023.104219
Ayukai T. (1996). Possible limitation of the dilution technique for estimating growth and grazing mortality rates of picoplanktonic cyanobacteria in oligotrophic tropical waters. J. Exp. Mar. Biol. Ecol. 198, 101–111. doi: 10.1016/0022-0981(95)00208-1
Azam F., Fenchel T., Field J. G., Gray J. S., Meyer-Reil L. A., Thingstad F. (1983). The ecological role of water-column microbes in the sea. Mar. Ecol. Prog. Ser. 10, 257–263. doi: 10.3354/meps010257
Barlow R., Lamont T., Gibberd M. J., Airs R., Jacobs L., Britz K. (2017). Phytoplankton communities and acclimation in a cyclonic eddy in the southwest Indian Ocean. Deep Sea Res. Part I: Oceanographic Res. Papers 124, 18–30. doi: 10.1016/j.dsr.2017.03.013
Benitez-Nelson C., Bidigare R., Dickey T., Landry M., Leonard C., Brown S., et al. (2007). Mesoscale eddies drive increased silica export in the subtropical pacific ocean. Sci. 316, 1017–1021. doi: 10.1126/science.1136221
Bettarel Y., Sime-Ngando T., Bouey M., Arfi R., Amblard C. (2005). Low consumption of virus-sized particles by heterotrophic nanoflagellates in two lakes of French Massif Central. Aquat. Microb. Ecol. 39, 205–209. doi: 10.3354/ame039205
Bode A., Barquero S., Cardoso M., Braun J. G., Armas D. (2001). Pelagic bacteria and phytoplankton in oceanic waters near the Canary Islands in summer. Mar. Ecol. Prog. Ser. 209, 1–17. doi: 10.3354/meps209001
Boras J., Montserrat Sala M., Baltar F., Aristegui J., Duarte C., Vaqué D. (2010). Effect of viruses and protists on bacteria in eddies of the Canary Current region (subtropical northeast Atlantic). Limnol. Oceanogr. 55, 885–898. doi: 10.4319/lo.2010.55.2.0885
Braun C., Gaube P., Sinclair-Taylor T., Skomal G., Thorrold S. (2019). Mesoscale eddies release pelagic sharks from thermal constraints to foraging in the ocean twilight zone. Proc. Natl. Acad. Sci 116, 201903067. doi: 10.1073/pnas.1903067116
Brussaard C. P. D. (2004). Optimization of procedures for counting viruses by flow cytometry. Appl. Environ. Microbiol 70, 1506–1513. doi: 10.1128/AEM.70.3.1506-1513.2004
Calvo-Díaz A., Morán X. A. (2006). Seasonal dynamics of picoplankton in shelf waters of the southern Bay of Biscay. Aquat. Microb. Ecol. 42, 159–174. doi: 10.3354/ame042159
Campbell L., Nolla H. A., Vaulot D. (1994). The importance of Prochlorococcus to community structure in the central North Pacific Ocean. Limnol. Oceanogr. 39, 954–961. doi: 10.4319/lo.1994.39.4.0954
Chang F.-H., Gong G.-C., Hsieh C.-H., Chen P. W.-Y., Mukhanov V., Tsai A.-Y. (2024). Vertical variations of bacterial growth, mortality loss to nanoflagellates, and viruses in the subtropical northwestern Pacific Ocean. J. Mar. Syst. 243, 103963. doi: 10.1016/j.jmarsys.2024.103963
Chang Y.-L., Miyazawa Y., Oey L.-Y., Kodaira T., Huang S.-M. (2017). The formation processes of phytoplankton growth and decline in mesoscale eddies in the western North Pacific Ocean. J. Geophys. Res.: Oceans 122. doi: 10.1002/2017jc012722
Chelton D., Gaube P., Schlax M., Early J., Samelson R. (2011). The influence of nonlinear mesoscale eddies on near-surface oceanic chlorophyll. Sci. 334, 328–332. doi: 10.1126/science.1208897
Chen B., Liu H., Landry M., Dai M., Huang B., Sun J. (2009). Close coupling between phytoplankton growth and microzooplankton grazing in the western South China Sea. Limnol. Oceanogr. 54, 1084–1097. doi: 10.4319/lo.2009.54.4.1084
Chisholm S. W., Olson R. J., Zettler E. R., Waterbury J. B., Goericke R., Welschmeyer N. A. (1988). A novel free-living prochlorophyte abundant in the oceanic euphotic zone. Nature 334, 340–343. doi: 10.1038/334340a0
Christaki U., Wambeke F., Lefevre D., Lagaria A., Prieur L., Pujo-Pay M., et al. (2011). The impact of anticyclonic mesoscale structures on microbial food webs in the Mediterranean Sea. Biogeosci. Discuss. 8. doi: 10.5194/bgd-8-185-2011
Clayton S., Dutkiewicz S., Jahn O., Follows M. (2013). Dispersal, eddies and the diversity of marine phytoplankton. Limnology Oceanography: Fluids Environments 3. doi: 10.1215/21573689-2373515
Danovaro R., Corinaldesi C., Filippini M., Fischer Ur, Gessner Mo, Jacquet S., et al. (2008). Viriobenthos in freshwater and marine sediments: a review. Freshw. Biol 53, 1186–1213. doi: 10.1111/j.1365-2427.2008.01961.x
Dasilva C. R., Li W. K. W., Lovejoy C. (2014). Phylogenetic diversity of eukaryotic marine microbial plankton on the Scotian Shelf Northwestern Atlantic Ocean. J. Plankton Res 36, 344–363. doi: 10.1093/plankt/fbt123
Evans C., Archer S., Jacquet S., Wilson W. (2003). Direct estimates of the contribution of viral lysis and microzooplankton grazing to the decline of a Micromonas spp. population. Aquat. Microb. Ecol. 30, 207–219. doi: 10.3354/ame030207
Ewart C., Meyers M., Wallner E., McGillicuddy D., Carlson C. (2008). Microbial dynamics in cyclonic and anticyclonic mode-water eddies in the northwestern Sargasso Sea. Deep Sea Res. Part II: Topical Stud. Oceanography 55, 1334–1347. doi: 10.1016/j.dsr2.2008.02.013
Flombaum P., Gallegos J., Gordillo R., Rincón J., Zabala L., Jiao N., et al. (2013). Present and future global distributions of the marine Cyanobacteria Prochlorococcus and Synechococcus. Proc. Natl. Acad. Sci. U.S.A. 110. doi: 10.1073/pnas.1307701110
Fong A. A., Karl D. M., Lukas R., Letelier R. M., Zehr J. P., Church M. J. (2008). Nitrogen fixation in an anticyclonic eddy in the oligotrophic North Pacific Ocean. ISME J 2, 663–676. doi: 10.1038/ismej.2008.22
Froneman P. W., Perissinotto R. (1996). Structure and grazing of the microzooplankton communities of the Subtropical Convergence and a warm-core eddy in the Atlantic Sector of the Southern Ocean. Mar. Ecol. Prog. Ser. 135, 237–245. doi: 10.3354/meps135237
Gaube P., McGillicuddy D., Chelton D., Behrenfeld M., Strutton P. (2014). Regional variations in the influence of mesoscale eddies on near-surface chlorophyll. J. Geophys. Res.: Oceans 119, 12. doi: 10.1002/2014JC010111
Gong G.-C., Shiah F.-K., Liu K.-K., Wen Y.-H., Ming-Hsin L. (2000). Spatial and temporal variation of chlorophyll a, primary productivity and chemical hydrography in the southern East China Sea. Continental Shelf Res 20, 411–436. doi: 10.1016/S0278-4343(99)00079-5
Gons H. J., Hoogveld H., Simis S. G. H., Tijdens M. (2006). Dynamic modeling of viral impact on cyanobacterial populations in shallow lakes: implications of burst size. J. Mar. Biol. Assoc. United Kingdom 86, 537–542. doi: 10.1017/S0025315406013440
Guo M., Xiu P., Li S., Chai F., Xue H., Zhou K., et al. (2017). Seasonal variability and mechanisms regulating chlorophyll distribution in mesoscale eddies in the South China Sea. J. Geophys. Res.: Oceans 122, 5329–5347. doi: 10.1002/2016JC012670
Hammes F., Egli T. (2010). Cytometric methods for measuring bacteria in water: advantages, pitfalls and applications. Anal. Bioanal. Chem. 397, 1083–1095. doi: 10.1007/s00216-010-3646-3
He Q., Zhan H., Xu J., Zhan W., Zhou L., Zha G. (2019). Eddy-induced chlorophyll anomalies in the western south China sea. J. Geophys. Res.: Oceans 124, 9487–9506. doi: 10.1029/2019JC015371
Johnson Z., Zinser E., Coe A., McNulty N., Woodward E., Chisholm S. (2006). Niche partitioning among Prochlorococcus ecotypes along ocean-scale environmental gradients. Sci. 311, 1737–1740. doi: 10.1126/science.1118052
Kang J., Wang Y., Huang S., Pei L., Luo Z. (2022). Impacts of mesoscale eddies on biogeochemical variables in the northwest pacific. J. Mar. Sci. Eng. 10, 1451. doi: 10.3390/jmse10101451
Kettler G., Martiny A., Huang K., Zucker J., Coleman M., Rodrigue S., et al. (2008). Patterns and implications of gene gain and loss in the evolution. PloS Genet 3, e231. doi: 10.1371/journal.pgen.0030231
Kim D., Yang E. J., Kim K. H., Shin C.-W., Park J., Yoo S., et al. (2012). Impact of an anticyclonic eddy on the summer nutrient and chlorophyll a distributions in the Ulleung Basin, East Sea (Japan Sea). ICES J. Mar. Sci. 69, 23–29. doi: 10.1093/icesjms/fsr178
Kimmance S., Wilson W., Archer S. (2007). Modified dilution technique to estimate viral versus grazing mortality of phytoplankton: Limitations associated with method sensitivity in natural waters. Aquat. Microb. Ecol. 49, 207–222. doi: 10.3354/ame01136
Kirchman D., Meon B., Cottrell M., Hutchins D., Bruland K. (2000). Carbon versus iron limitation of bacterial growth in the California upwelling regime. Limnol. Oceanogr. 45, 1681–1688. doi: 10.4319/lo.2000.45.8.1681
Kujawinski E. (2011). The impact of microbial metabolism on marine dissolved organic matter. Annu. Rev. Mar. Sci. 3, 567–599. doi: 10.1146/annurev-marine-120308-081003
Landry M., Brown S., Rii Y., Selph K., Bidigare R., Yang E.-J., et al. (2008). Depth-stratified phytoplankton dynamics in Cyclone Opal, a subtropical mesoscale eddy. Deep Sea Res. Part II: Topical Stud. Oceanography 55, 1348–1359. doi: 10.1016/j.dsr2.2008.02.001
Landry M. R., Hassett R. P. (1982). Estimating the grazing impact of marine micro-zooplankton. Mar. Biol. 67, 283–288. doi: 10.1007/BF00397668
Lasternas S., Piedeleu M., Duarte C., Agustí S., Sangrà P. (2013). Forcing of dissolved organic carbon release by phytoplankton by anticyclonic mesoscale eddies in the subtropical NE Atlantic Ocean. Biogeosciences 10, 2129–2143. doi: 10.5194/bg-10-2129-2013
Li T., Zhao J., Rongtao S., Chang F., Sun H. (2010). The variation of upper ocean structure and paleoproductivity in the Kuroshio source region during the last 200kyr. Mar. Micropaleontol. 75, 50–61. doi: 10.1016/j.marmicro.2010.02.005
Liu H., Probert I., Uitz J., Claustre H., Aris-Brosou S., Frada M., et al. (2009). Extreme diversity in noncalcifying haptophytes explains a major pigment paradox in open oceans. Proc. Natl. Acad. Sci. U.S.A. 106, 12803–12808. doi: 10.1073/pnas.0905841106
Pai S.-C., Chung-Cheng Y., Riley J. P. (1990). Effects of acidity and molybdate concentration on the kinetics of the formation of the phosphoantimonylmolybdenum blue complex. Analytica Chimica Acta 229, 115–120. doi: 10.1016/S0003-2670(00)85116-8
Pai S.-C., Su Y.-T., Lu M.-C., Chou Y., Ho T.-Y. (2021). Determination of nitrate in natural waters by vanadium reduction and the griess assay: reassessment and optimization. ACS ES&T Water 1, 1524–1532. doi: 10.1021/acsestwater.1c00065
Perruche C., Rivière P., Lapeyre G., Xavier C., Pondaven P. (2011). Effects of surface quasi-geostrophic turbulence on phytoplankton competition and coexistence. J. Mar. Res. 69, 105–135. doi: 10.1357/002224011798147606
Polovina J., Howell E., Kobayashi D., Seki M. (2015). The Transition Zone Chlorophyll Front Updated: Advances from a decade of research. Prog. Oceanography 150. doi: 10.1016/j.pocean.2015.01.006
Rii Y. M., Brown S. L., Nencioli F., Kuwahara V., Dickey T., Karl D. M., et al. (2008). The transient oasis: Nutrient-phytoplankton dynamics and particle export in Hawaiian lee cyclones. Deep Sea Res. Part II: Topical Stud. Oceanography 55, 1275–1290. doi: 10.1016/j.dsr2.2008.01.013
Rose J., Caron D. A., Sieracki M. E., Poulton N. (2004). Counting heterotrophic nanoplanktonic protists in cultures and aquatic communities by flow cytometry. Aquat. Microb. Ecol. 34, 263–277. doi: 10.3354/ame034263
Sime-Ngando T., Pradeep Ram A. S. (2005). Grazer effects on prokaryotesandvirusesinafreshwatermicrocosmexperiment. Aquat. Microb. Ecol. 41, 115–124. doi: 10.3354/ame041115
Sun F., Wang C., Wang Y., Tu K., Zheng Z., Lin X. (2020). Diatom red tide significantly drive the changes of microbiome in mariculture ecosystem. Aquaculture 520, 734742. doi: 10.1016/j.aquaculture.2019.734742
Sun F.-L., Xia X., Simon M., Wang Y., Zhao H., Sun C., et al. (2022). Anticyclonic eddy driving significant changes in prokaryotic and eukaryotic communities in the south China sea. Front. Mar. Sci 9. doi: 10.3389/fmars.2022.773548
Thingstad T. F., Zweifel U. L., Rassoulzadegan F. (1998). P limitation of heterotrophic bacteria and phytoplankton in the northwest Mediterranean. Limnol. Oceanogr. 43, 88–94. doi: 10.4319/lo.1998.43.1.0088
Thyssen M., Lefèvre D., Caniaux G., Ras J., Fernández I. C., Denis M. (2005). Correction to “Spatial distribution of heterotrophic bacteria in the northeast Atlantic (POMME study area) during spring 2001. J. Geophys. Res.: Oceans 110. doi: 10.1029/2005JC003201
Tsai A.-Y., Chiang K.-P., Chang J. (2005). Seasonal diel variations of picoplankton and nanoplankton in a subtropical western Pacific coastal ecosystem. Limnol. Oceanogr. 50, 1221–1231. doi: 10.4319/lo.2005.50.4.1221
Wang L., Huang B., Laws E., Zhou K., Liu X., Xie Y., et al. (2018). Anticyclonic eddy edge effects on phytoplankton communities and particle export in the northern south China sea. J. Geophys. Res.: Oceans 123. doi: 10.1029/2017JC013623
Wang Y., Zhang J., Yu J., Wu Q., Sun D. (2022). Anticyclonic mesoscale eddy induces mesopelagic biomass hotspot in the oligotrophic ocean. J. Mar. Syst. 237, 103831. doi: 10.1016/j.jmarsys.2022.103831
Weinbauer M. G., Höfle M. G. (1998). Significance of viral lysis and flagellate grazing as factors controlling bacterioplankton production in a eutrophic lake. Appl. Environ. Microbiol 64, 431–438. doi: 10.1128/AEM.64.2.431-438.1998
Worden A., Binder B. (2003). Application of dilution experiments for measuring growth and mortality rates among Prochlorococcus and Synechococcus populations in oligotrophic environments. Aquat. Microb. Ecol. 30, 159–174. doi: 10.3354/ame030159
Xiu P., Chai F. (2011). Modeled biogeochemical responses to mesoscale eddies in the South China Sea. J. Geophys. Res.: Oceans 116. doi: 10.1029/2010JC006800
Yun M. S., Kim Y., Jeong Y., Joo H. T., Jo Y.-H., Lee C. H., et al. (2020). Weak response of biological productivity and community structure of phytoplankton to mesoscale eddies in the oligotrophic philippine sea. J. Geophys. Res.: Oceans 125, e2020JC016436. doi: 10.1029/2020JC016436
Zhang W., Zhang C., Zheng S., Chen Y., Zhu M., Sun X. (2023). Distribution of picophytoplankton in the northern slope of the South China Sea under environmental variation induced by a warm eddy. Mar. Pollut. Bull. 194, 115429. doi: 10.1016/j.marpolbul.2023.115429
Keywords: Pacific Ocean, anticyclonic eddies, growth, mortality rates, viral lysis
Citation: Chen PW-Y, Olivia M, Gong G-C, Jan S, Ho T-Y, St. Laurent L and Tsai A-Y (2024) Distinct water mass between inside and outside eddy drive changes in prokaryotic growth and mortality in the tropical Pacific Ocean. Front. Mar. Sci. 11:1443533. doi: 10.3389/fmars.2024.1443533
Received: 04 June 2024; Accepted: 05 September 2024;
Published: 30 September 2024.
Edited by:
Danny Ionescu, Leibniz-Institute of Freshwater Ecology and Inland Fisheries (IGB), GermanyReviewed by:
Wuchang Zhang, Chinese Academy of Sciences (CAS), ChinaCopyright © 2024 Chen, Olivia, Gong, Jan, Ho, St. Laurent and Tsai. This is an open-access article distributed under the terms of the Creative Commons Attribution License (CC BY). The use, distribution or reproduction in other forums is permitted, provided the original author(s) and the copyright owner(s) are credited and that the original publication in this journal is cited, in accordance with accepted academic practice. No use, distribution or reproduction is permitted which does not comply with these terms.
*Correspondence: An-Yi Tsai, YW55aXRzYWlAbWFpbC5udG91LmVkdS50dw==
Disclaimer: All claims expressed in this article are solely those of the authors and do not necessarily represent those of their affiliated organizations, or those of the publisher, the editors and the reviewers. Any product that may be evaluated in this article or claim that may be made by its manufacturer is not guaranteed or endorsed by the publisher.
Research integrity at Frontiers

Learn more about the work of our research integrity team to safeguard the quality of each article we publish.