 Julia Weissenbach
 Svetlana Goldin
 Yotam Hulata
 Debbie Lindell
- Faculty of Biology, Technion – Israel Institute of Technology, Haifa, Israel
Viruses are abundant in the ocean and influence both the composition of marine communities and biogeochemical cycles. Despite their high abundance, production rates of distinct virus taxa in the environment are largely unknown. Here, we investigated production dynamics of T4-like cyanophages and compared them to those of the total dsDNA virioplankton community in two adjacent eddies of opposite polarity in the North Pacific Subtropical Gyre. Virioplankton production rates were 3-fold higher in the cyclonic than in the anticyclonic eddy, potentially due to higher metabolic activity of their bacterial hosts in the cyclone, and had similar virus production rates during the day and night in the cyclone. In contrast, T4-like cyanophages had similar production rates in the two eddies but showed approximately 4-fold higher production rates at night than during the day, potentially due to a combination of greater infection, increased burst size and more cyanophages completing their infection cycle at night. These findings suggest that virioplankton community production is affected more by spatially differentiated environmental conditions while T4-like cyanophage production is more affected over the diel cycle. Differences in production for the T4-like cyanophages relative to the virioplankton community indicate that spatial variability at the mesoscale differentially impact distinct components of the virioplankton.
Introduction
Virioplankton are the most abundant biological entities in the oceans and form one of the largest gene reservoirs (Fuhrman, 1999; Breitbart, 2012). Globally there are estimated to be up to ~1030 viruses in the oceans (Suttle, 2005) and they are considered to be significant agents of microbial mortality. It is estimated that they are responsible for killing ∼20%–40% of marine bacterioplankton every day, which is similar to the mortality caused by zooplankton grazing (Fuhrman, 1999). In addition, lytic infection results in cell lysis and the release of dissolved organic matter, impacting biogeochemical cycles in aquatic ecosystems (Zimmerman et al., 2020).
One of the most well-studied groups of aquatic phages is the cyanophages, especially those infecting the picocyanobacteria belonging to the genera Prochlorococcus and Synechococcus. Prochlorococcus and Synechococcus are the most abundant phototrophs on earth and are responsible for a significant fraction of global primary production (Flombaum et al., 2013). Cyanophages influence cyanobacterial mortality, diversity, and evolution (Proctor and Fuhrman, 1990; Waterbury and Valois, 1993; Lindell et al., 2004; Palenik et al., 2006; Avrani et al., 2011; Marston et al., 2013; Ahlgren et al., 2019; Carlson et al., 2022).
Picocyanobacteria are infected by tailed, double-stranded DNA viruses belonging to Caudoviricetes (previously known as the order Caudovirales). Based on their tail morphology and genome content, they can be divided into taxonomically distinct groups; the T7-like cyanopodoviruses (recently named Autographiviridae by the ICTV), the T4-like cyanomyoviruses (Kyanoviridae) and the TIM5-like cyanomyoviruses (Aurunviruses), and a diverse group of siphovirus types (Fuller et al., 1998; Sullivan et al., 2005, 2009, 2010; Pope et al., 2007; Huang et al., 2012; Sabehi et al., 2012; Labrie et al., 2013; Turner et al., 2023). Based on relative abundance from metagenomic analyses and from direct quantification using a variety of methods, the T4-like myoviruses and the T7-like podoviruses appear to be the most abundant cyanophages in the ocean’s photic zones (Suttle and Chan, 1994; DeLong et al., 2006; Millard and Mann, 2006; Matteson et al., 2013; Dekel-Bird et al., 2015; Huang et al., 2015; Brum et al., 2016; Luo et al., 2017; Carlson et al., 2022; Cai et al., 2023).
Varying conditions impact cyanophage abundances on temporal and spatial scales (Waterbury and Valois, 1993; Suttle and Chan, 1994; Sullivan et al., 2003; Wilhelm and Matteson, 2008, 2008; Marston et al., 2013, 2013; Goldin et al., 2020; Mruwat et al., 2021; Carlson et al., 2022; Maidanik et al., 2022). Furthermore, temporal studies on picocyanobacterial host-phage dynamics show increased infection at night, indicating a diel impact on host-phage systems (Aylward et al., 2017; Liu et al., 2019; Mruwat et al., 2021). Despite our growing understanding of the distribution of cyanophages, little is known about the dynamics that lead to their observed abundances.
Mesoscale eddies (eddies 10–100 km in diameter) could contribute to regional heterogeneity in virus dynamics. Through vertical oscillations eddies alter the depth of the pycnocline, modifying nutrient and light supply, and directly influencing microbial populations (Mcgillicuddy and Robinson, 1997). Cyclonic eddies uplift the pycnocline, resulting in a greater supply of inorganic nutrients, and subsequently to increased primary production and phytoplankton biomass at shallower depths compared to anticyclonic eddies (Mcgillicuddy and Robinson, 1997; Oschlies and Garcon 1998; Dufois et al., 2016; Dugenne et al., 2023; Barone et al., 2022). Population dynamics in eddies can also be impacted by eddy-driven top-down controls including grazing and viral infection (Dugenne et al., 2023). Hence, understanding the impact of mesoscale eddies on the viral community is an important step toward understanding marine community dynamics in larger bodies of water where such eddies are found.
Mesoscale eddies are common in the North Pacific Subtropical Gyre (NPSG) (Barone et al., 2019). The NPSG is the largest oligotrophic region in the oceans and contributes significantly to global primary production (Karl and Church, 2014, 2017). Prochlorococcus dominates the phytoplankton community year-round and is generally two-orders of magnitude more abundant than other phytoplankton groups, including Synechococcus (Campbell et al., 1997; Malmstrom et al., 2010). While both major cyanophage groups are common in the NPSG, the T4-like cyanophages are generally more abundant than the T7-like cyanophages (Aylward et al., 2017; Goldin et al., 2020; Mruwat et al., 2021).
In this study, we investigated virus abundance and production rates in two adjacent eddies of opposite polarity in the NPSG as well as production during day and night in the cyclonic eddy. This was done for the dsDNA virioplanktonic community, as well as specifically for the T4-like cyanophages. We found higher virioplankton community production in the cyclonic eddy. However, no difference in production was observed between day and night. In contrast, more virus production by T4-like cyanophages was found at night, but no difference in their production was observed between the eddies. This first taxon-specific report of virus production rates revealed distinct differences in the patterns of T4-like cyanophage production relative to the dsDNA virioplankton community at large, emphasizing the need for such studies for understanding taxon-specific virus dynamics.
Materials and methods
Sample collection
Samples were collected in the North Pacific Subtropical Gyre aboard the R/V Falkor from March 27th to April 10th 2018 (FK180310_legII) from a cyclonic and an anticyclonic eddy. Eddies were identified as minima (cyclones) and maxima (anticyclones) in sea level anomaly (SLA) based on a combination of altimetry from all available satellites distributed by the Copernicus Marine Environment Monitoring Service (http://marine.copernicus.eu/). The SLA product was corrected for interannual trends and seasonal cycle following procedures recently used for the nearby Station ALOHA (Barone et al., 2019). Sampling locations and eddies are indicated in Figure 1. We investigated the vertical distribution of bacteria and viruses in the photic zone of the two eddies (3 depth profiles in the anticyclone and only 1 in the cyclone due to time constraints) and carried out virus production experiments from water collected in the mixed surface layers of both eddies (both during the day and night in the cyclone and during the day in the anticyclone). Seawater was collected in 12 L Niskin bottles attached to a conductivity-temperature-depth (CTD) rosette. Temperature, and salinity were determined from the CTD data downloaded from the Simons CMAP Collaborative Marine Atlas Project (http://www.simonscmap.com) and from Dugenne et al. (2023).
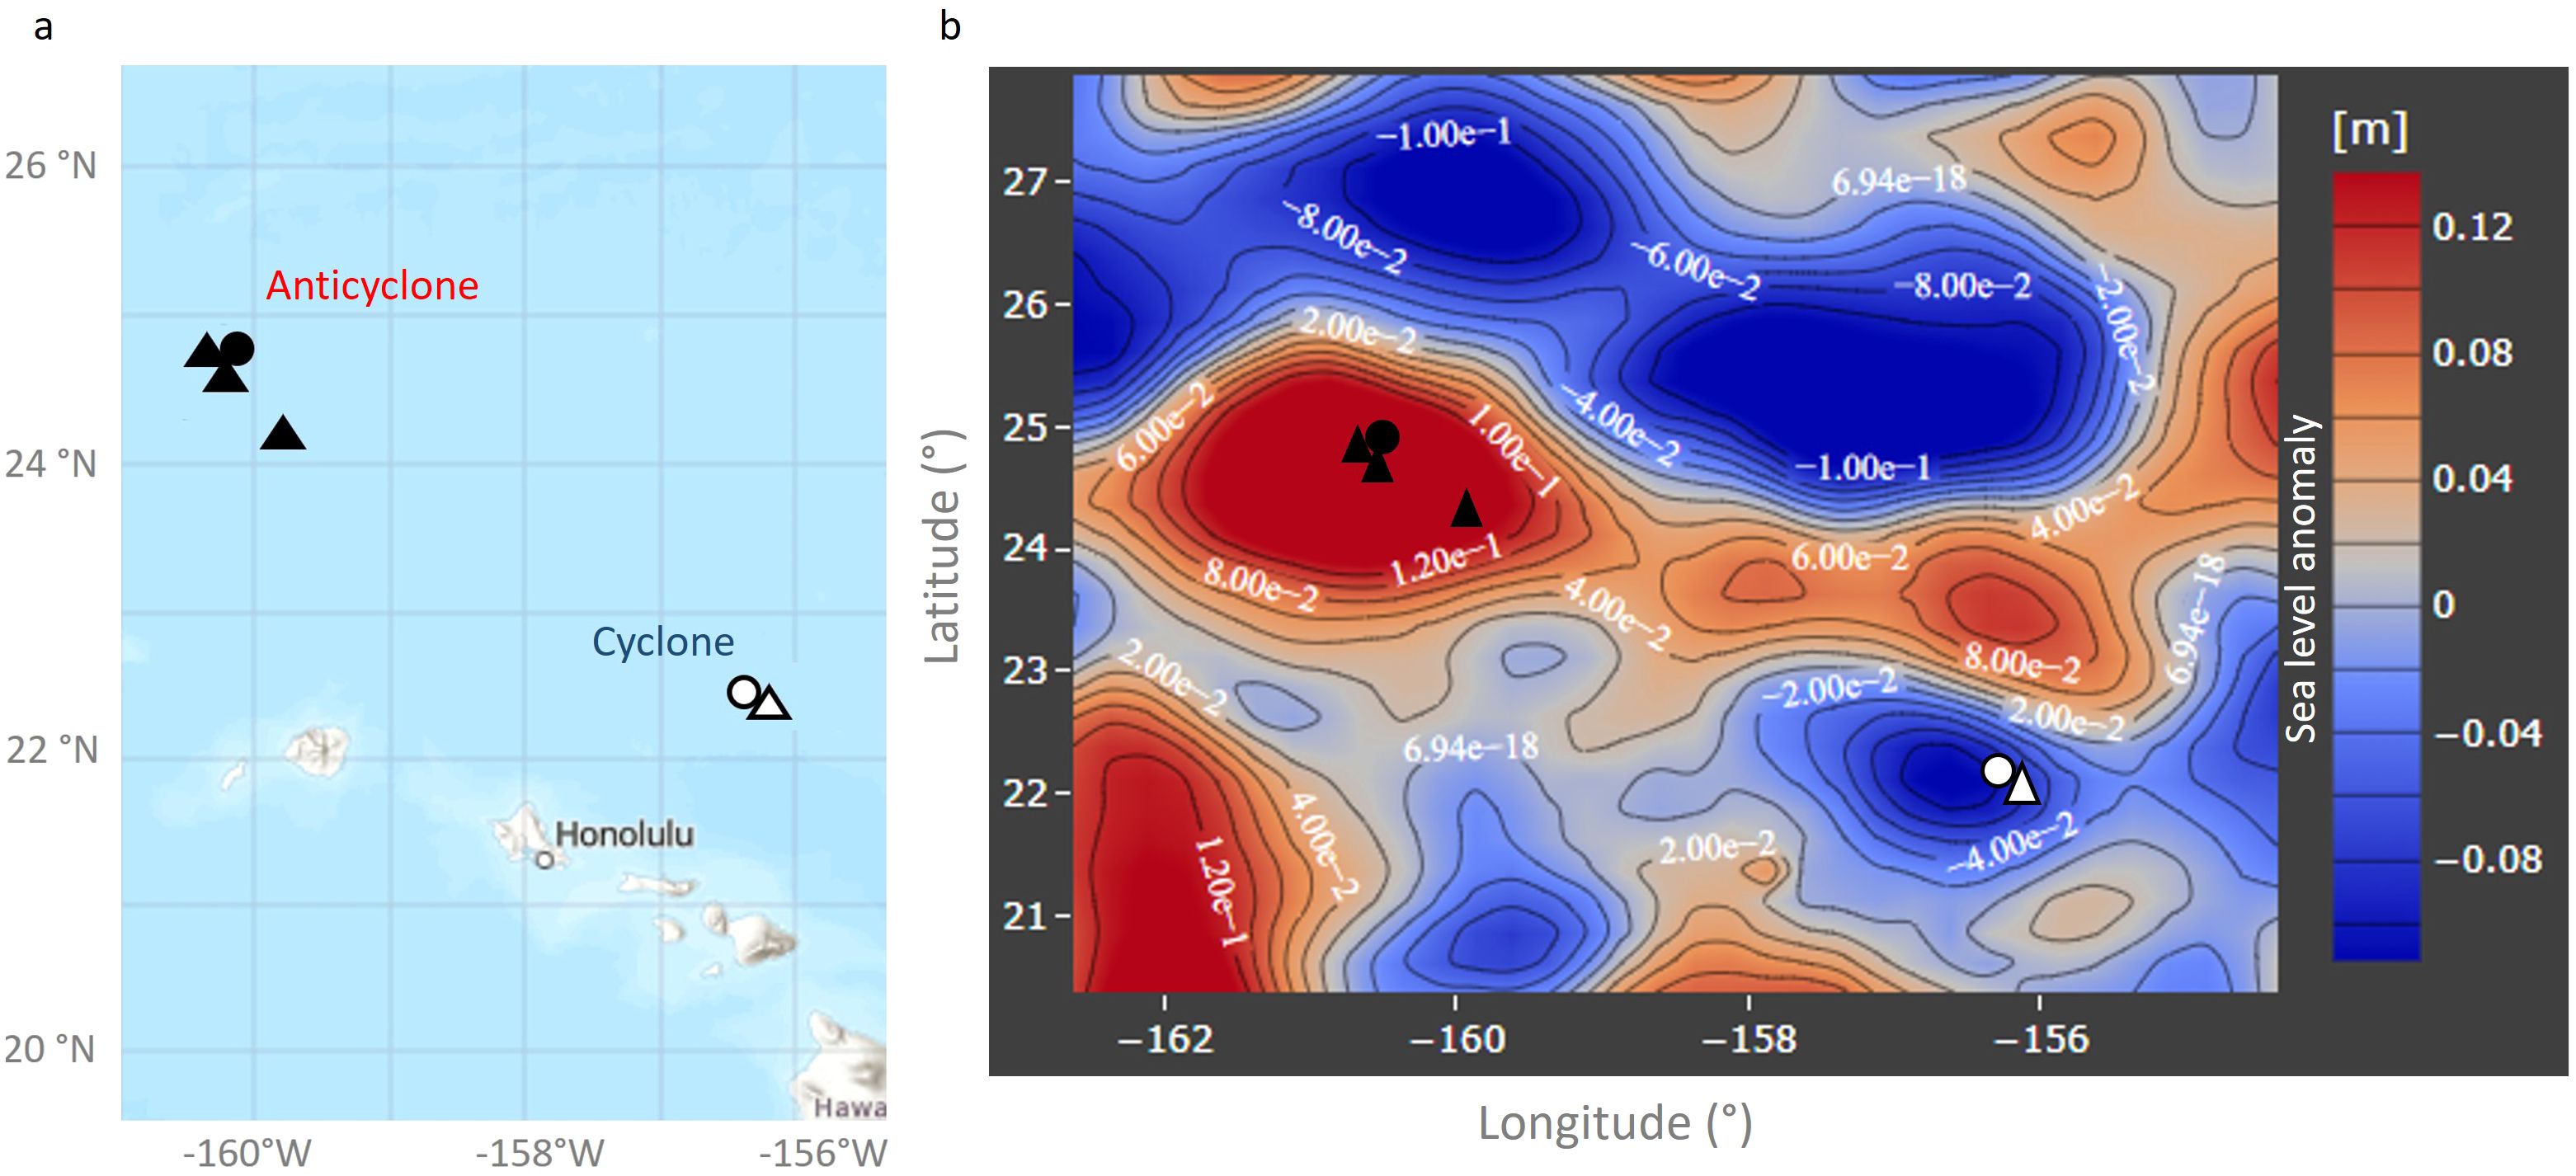
Figure 1. Sampling locations during the cruise. (A) Map of the region with sampling locations. (B) Contours of sea level anomalies from April 2018. Sampling locations for depth profiles for bacterial and viral abundance (triangles), and for virus production assays (circles), with symbols in black for the anticyclone, and in white for the cyclone are shown. Samples for virus production assays were taken from surface waters (15 m). Cyclonic eddies are identified as those with negative sea level anomalies of at least 10.1 m (blue contours) and anticyclonic eddies by positive sea level anomalies of at least 0.1 m (red contours). Data were downloaded from the Simons CMAP Collaborative Marine Atlas Project (http://www.simonscmap.com).
Samples for measuring the abundance of free viruses (VLPs and cyanophages), prokaryotes (heterotrophic bacteria, Synechococcus and Prochlorococcus), and Prochlorococcus infection were sampled as described in Mruwat et al. (2021). All seawater samples were pre-filtered through a 20-μm-pore-size nylon mesh. For determination of free virus abundances (VLPs and cyanophages), samples (10–40 ml) were gently filtered through a 0.22 µm syringe filter (Millex-GV PDVF, Millipore) and the filtrate was collected for analysis. VLP samples were fixed in 2% formaldehyde incubated for 20 minutes in the dark at room temperature, flash frozen in liquid nitrogen, and stored at -80°C. Samples for quantifying cyanophage abundance using the polony method were flash frozen in liquid nitrogen, and stored at -80°C frozen without fixative. For cell abundance and infected cell analyses, water samples (10 or 40 ml) were fixed immediately with 0.125% glutaraldehyde, incubated for 20 minutes in the dark at room temperature, flash frozen in liquid nitrogen, and stored at -80°C.
Virus production assays
Virus production experiments were conducted in the cyclonic and anticyclonic eddies with water collected from 15m depth. Each experiment was done in triplicate with water for each replicate collected from a different Niskin bottle. For daytime and nighttime experiments samples were collected at 6.55 am (cyclone) and 5.55 am (anticyclone) and 5.40 pm (cyclone) local time, respectively. Subsamples were taken immediately to determine natural bacterial and viral abundances as well as the percent of infected Prochlorococcus.
Virus production was determined using a modification of the approach described by Wilhelm et al. (2002). This method measures the production of new viruses from the bacterial community over time. The number of free viruses is reduced from the sample initially and then the appearance of new viruses that originate from cells that were infected at the time of sample collection is followed. The decrease of free viruses was achieved by gentle filtration over a 0.2 µm pore-size polycarbonate filter (GE). Cells were washed 3 times by filtration with virus-free seawater prepared using a 30 kDa cut-off tangential flow filtration system. Cells were resuspended continuously during the filtration and washes by gentle pipetting to avoid adherence to the filter. For each replicate, 300 ml of seawater was filtered independently, and the washed cells were diluted to 1 L with virus-free water in 1 L polycarbonate bottles.
Virus production assays were performed both in-situ and in on-deck incubations. In-situ incubations were done for VLPs using free-drifting arrays that were recovered 12 h after deployment. The experimental polycarbonate bottles were positioned to sit at 15 m in the water column. Samples were taken prior to deployment (T0) and after array recovery (T12). On-deck incubations were done for both VLPs and T4-like cyanophages. Incubation chambers were maintained at in-situ water temperatures through the constant inflow of surface seawater to the incubator and light intensity suited for 15 m depth. Subsamples for enumeration of bacterial and virus abundances were collected every 2 to 3 hours for 12 hours of incubation as described above. Viruses were quantified by the VLP staining method for the virioplankton community and by the polony method for T4-like cyanophages, (see below) and were used to determine virus production rates.
Virus production rates were determined from the slope of linear regressions of viral abundance versus time for individual replicates. Virus production rates were normalized to bacterial abundance at the beginning of the incubation to correct for differences in the number of cells in each experiment and replicate, including differential cell loss during experimental preparation. Cell preparation via gentle filtration and subsequent bottle incubations could negatively impact the physiology of the bacteria, especially Prochlorococcus. If this were to occur, our virus production rates could be considered conservative measures. To assess the viability of Prochlorococcus and heterotrophic bacteria, cell abundance was determined at the beginning and end of the incubation using flow cytometry (see below) (Table 1).
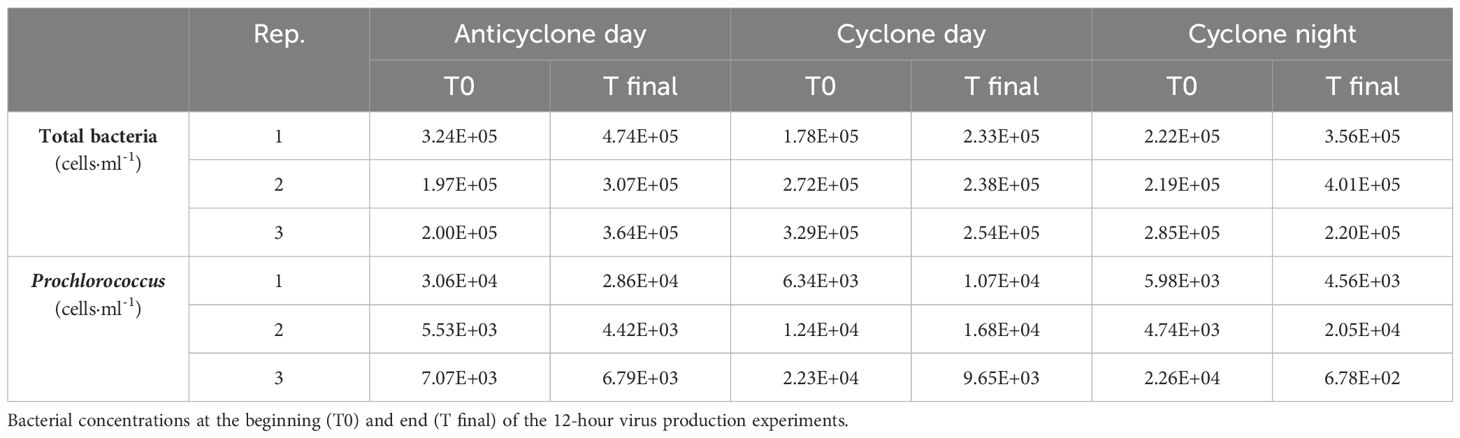
Table 1. Bacterial abundances in virus production assays.
Virus production rates were normalized by the bacterial abundance at T0 to provide production rates per cell since this method measures the number of viruses produced from the infected cells at the time of sample collection. The reduction of free viruses in the cell preparation step should keep new contacts and infection to a minimum. Virus production rates of the different incubations (anticyclone day, cyclone day and cyclone night) were tested for significant differences using ANCOVA. In-situ and on-deck incubations were tested for significant differences using students t-test, 2-tailed.
Daily mortality was estimated from the virus production rate. Virus production per hour was divided by the assumed average burst size to determine the number of cells killed per hour for each region and for the day and night periods. These were converted to mortality per day by scaling to 12 hours and combining the 12-hour day and 12-hour night periods in the cyclonic eddy. Since virus production was not measured at night in the anticyclone, we applied the same factor for the difference between day and night as found for the cyclone when estimating daily mortality in the anticyclone.
Cell and virus quantification
Heterotrophic bacteria and cyanobacteria were enumerated using a BD Influx flow cytometer using a phosphate buffered saline (PBS) solution as sheath fluid. The Influx was equipped with a 488 nm and a 457 nm laser and a 70 µm nozzle tip. Prochlorococcus was identified based on its red fluorescence and size using forward scatter as a proxy. Hierarchical gating based on orange then red fluorescence was employed to discriminate between Prochlorococcus and Synechococcus. Counts of total bacteria were performed after staining with SYBR Green I for 15 min in the dark. The heterotrophic bacterial abundances are the total bacteria less the cyanobacteria.
The abundance of virus-like particles was determined by epifluorescence microscopy after staining with SYBR Green I following Patel et al. (2007). Briefly, fixed seawater filtrate was filtered onto a 0.02 µm-pore size filter (Anodisc, Whatman) and stained with SYBR Green I at a dilution of 2.5x10⁻³. Filters were mounted on microscopy slides with 0.1% ρ-phenylalanine anti-fade solution (in 1:1 PBS/glycerol) and stored at -20 °C until microscopic analysis. Duplicate filters were prepared for each sample. For each filter, 10 to 20 fields were selected randomly and a total of >200 viruses were counted at a magnification of 1000 x using a Zeiss Axiovert 200 inverted epifluorescence microscope equipped with a GFP filter set (Ex: 470/40 nm; Em: 525/50 nm).
The abundance of cyanophages was determined using the polony method, a solid-phase single-molecule PCR (Mitra and Church, 1999) adapted for cyanophages by Baran et al. (2018) and Goldin et al. (2020). The spatial separation of viruses in this method enables the use of degenerate primers to capture the diversity of each phage family whereas quantitative PCR in liquid cannot be used for quantification with high degeneracy primers and diverse viruses (Baran et al., 2018). Prior to analysis of the virus production experiments, samples were concentrated 40-fold by iron chloride flocculation (John et al., 2011; Baran et al., 2018) due to low abundances after virus reduction. T7-like cyanophage abundances remained below the detection limit after concentration and virus production could not be determined for this cyanophage group.
Polony PCR was carried out by embedding the 0.2 µm filtrate in an acrylamide gel for in-gel PCR. Quantification of T7-like and T4-like cyanophages was performed in separate PCR reactions with degenerate primers for genes coding for DNA polymerase (DNApol) and the g20 portal protein respectively (Baran et al., 2018; Goldin et al., 2020). Hybridization to the resultant amplicons was carried out with probes specific for each phage family. Duplicate slides were prepared for each sample. Image analysis was carried out on a GenePix 4000B microarray scanner (Axon Instruments) using a 635 nm and 532 nm laser and a 10 µm pixel resolution and 20 µm focus position. For each slide, 6 to 8 fields (0.1 cm2) were selected randomly and counted or the whole slide was counted when polony abundances were low or not evenly distributed.
Infected cell analysis
The quantification of viral infection was performed using the iPolony method, which is based on the detection of viral DNA inside a cyanobacterial cell, as described in Mruwat et al. (2021). Briefly, the Influx flow cytometric sorter (as described above) was used to separate Prochlorococcus cells from other organisms, to concentrate them and to remove free phage and the fixative. Sorting was performed in the 1.0 drop purity mode and yielded high concentrations (700–1000 cells µl-1) of sorted cells. Sorted cells were enumerated and embedded in the acrylamide gel. Prior to thermal cycling, gels were heated to 94°C for 15 min to make the cells permeable to the PCR reagents. Detection of cyanophage DNA was performed using cyanophage-specific primers and probes as described above.
Results and discussion
We set out to investigate virus abundance and production in two adjacent eddies of opposite polarity in the NPSG in a cruise on the R/V Falkor in March-April 2018 (Figure 1). The anticyclonic eddy (anticyclone) was considered to be in a stable phase while the cyclonic eddy (cyclone) was in a weakening phase (Dugenne et al., 2023). We hypothesized that the cyclonic eddy would have greater nutrient concentrations and higher abundances of primary and secondary producers and thus would support higher virus production.
Water column conditions
The cyclone had a shallow mixed depth layer of 17.8 m while the anticyclone was mixed down to 50.3 m (Figure 2A) (Dugenne et al., 2023). Surface temperatures were slightly higher in the mixed layer in the cyclone than in the anticyclone, but were lower in the cyclone at depths of 75 m and deeper (Figure 2B) (Dugenne et al., 2023), consistent with uplifted isopycnals (Barone et al., 2022). Similarly, nutrient concentrations (phosphate and nitrate + nitrite) were at comparable concentrations in the surface layers, with higher concentrations of both in the cyclone at depths of 100 m and deeper (Dugenne et al., 2023).
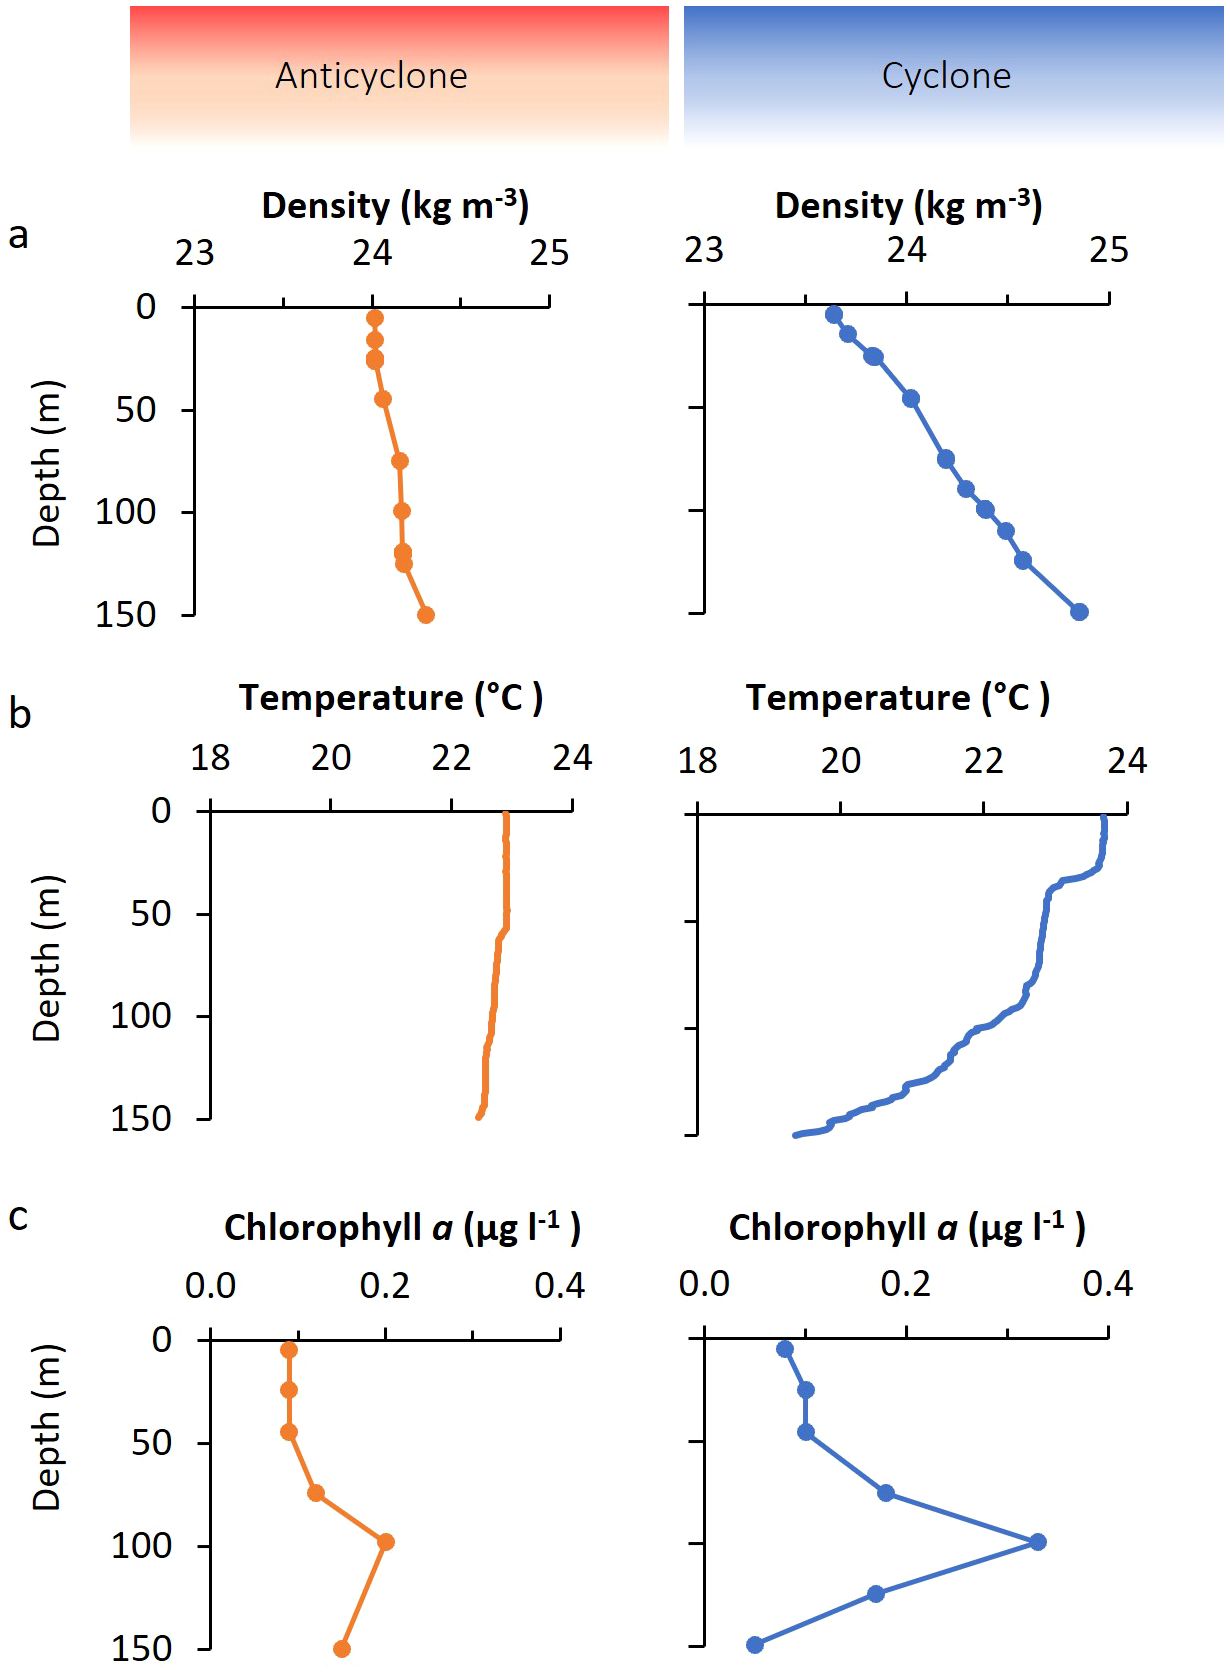
Figure 2. Water column properties in the cyclonic and anticyclonic eddies. Depth profiles of water density (A), temperature (B), and chlorophyll a concentration (C), in the anticyclone (left), and the cyclone (right).
Surface chlorophyll a concentrations were alike for both eddies (0.08–0.09 µg l-1) (Figure 2C). However, the chlorophyll a concentration at the deep chlorophyll maximum (DCM) was considerably higher in the cyclone (0.33 µg l-1) than in the anticyclone (0.2 µg l-1), consistent with an expected greater phytoplankton biomass in the cyclonic eddy.
Overall, water column conditions were similar for the two eddies in surface waters. More substantial differences were observed below the upper mixed layer, with lower temperatures, and higher macronutrient and chlorophyll a concentrations deeper in the cyclonic eddy (Figure 2) (Dugenne et al., 2023).
Bacteria and virus abundances
We investigated the vertical distribution of bacteria and viruses in the two eddies. Three depth profiles were carried out in the anticyclone and one in the cyclone (Figures 1, 3). Prochlorococcus vertical distribution patterns were similar in both eddies, however, there were approximately 20% more cells in the upper 50 m in the cyclone, with 1.87 ± 0.12×10⁵ cells ml-1 (n=3), relative to the anticyclone, with 1.5 ± 0.11×10⁵ cells ml-1 (n=9) (p=0.001, t-test) (Figure 3A). As expected for the NPSG (Malmstrom et al., 2010) Synechococcus were close to 2-orders of magnitude less abundant than Prochlorococcus and ranged between 2.4–4.9×10³ cells ml-1 in the upper photic zone. In the upper 50 m Synechococcus was considerably less abundant (1.6-fold) in the cyclone (2.53 ± 0.15×10³, n=3) than in the anticyclone (4.0 ± 0.66×10³, n=9) (p=0.005, t-test) and declined at a shallower depth than in the anticyclone (Figure 3B). Heterotrophic bacteria in the upper 50 m were, on average, 11% more abundant in the cyclone (4.73×10⁶ cells ml-1, n=3), than in the anticyclone (4.34 ± 0.19×10⁶ cells ml-1, n=9) (p=0.006, t-test). Furthermore, heterotrophic bacterial abundances declined in the cyclone below 50 m, while they remained stable throughout the water column in the anticyclone (Figure 3C).
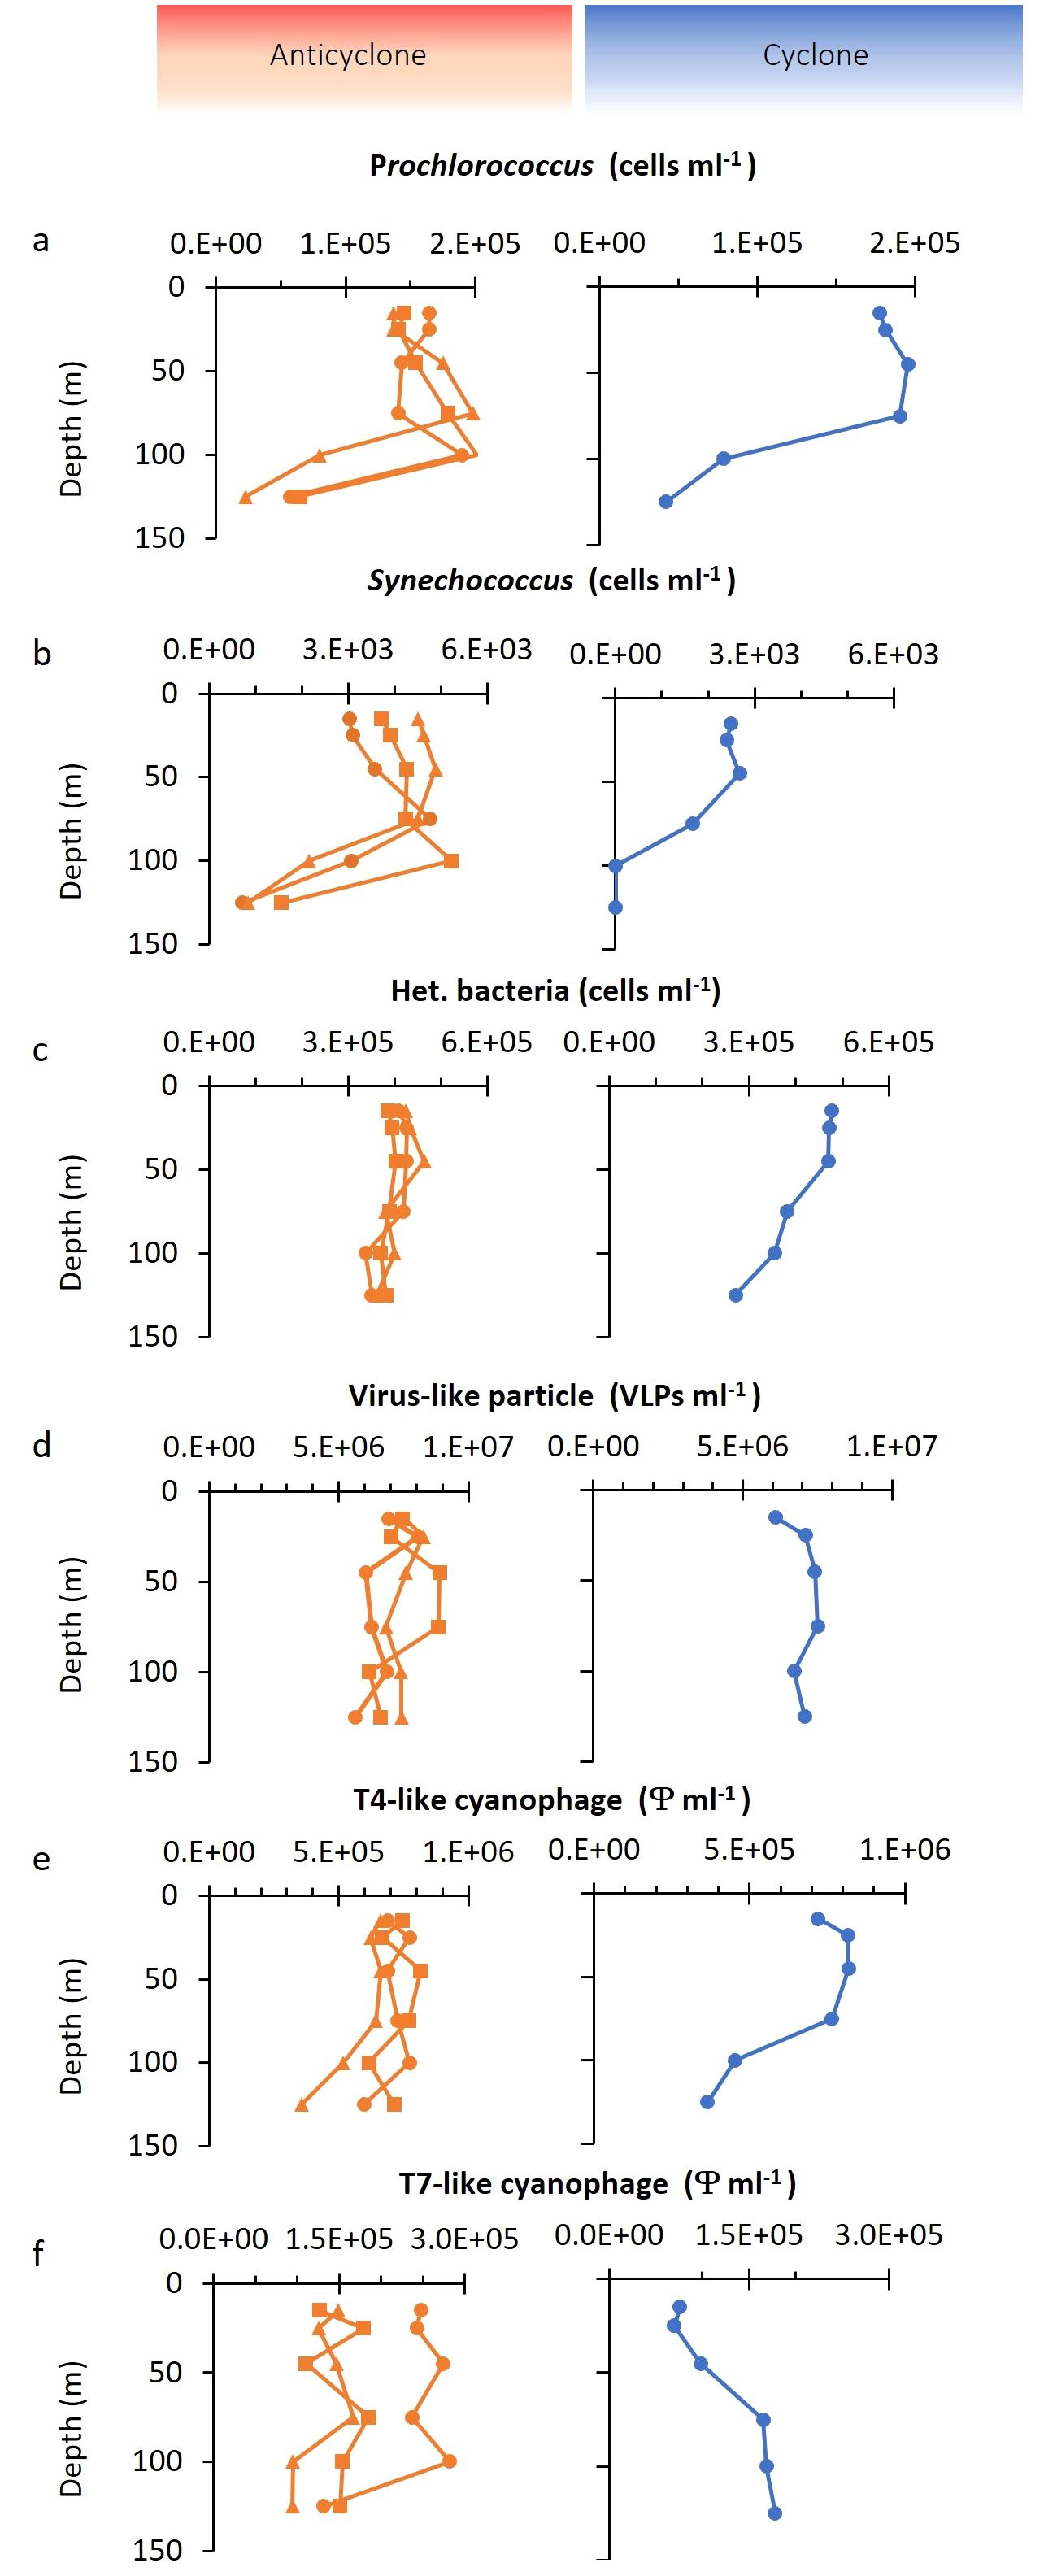
Figure 3. Depth distribution of bacterial and virus abundances. Depth distribution of (A) Prochlorococcus, (B) Synechococcus, (C) heterotrophic bacteria, (D) dsDNA virioplankton from virus-like particles (VLP) counts, (E) T4-like cyanophages, and (F) T7-like cyanophages. Different symbols in the anticyclone indicate the results from three independent depth profiles.
To assess the size of the virus community in the two eddies, we quantified virus-like-particles (VLP), stained with SYBR Green I, in the virus fraction (0.2 µm filtrate) which best reflects the myriad of dsDNA viruses found in the oceans (Patel et al., 2007). VLP abundances were similar in both eddies (p=0.26, t-test) and were relatively constant with depth, ranging between 5.6×10⁶ and 8.9×10⁶ VLPs ml-1 at all depths (Figure 3D). These abundances were similar to previously reported values in the surface mixed layer of the NPSG (Culley and Welschmeyer, 2002; Brum et al., 2005; Gainer et al., 2017; Goldin et al., 2020), although no information is provided regarding eddy presence for those studies.
To investigate the depth distribution of the two major cyanophage groups, the T4-like and T7-like cyanophages, we used the taxon-specific solid-phase PCR polony method (Baran et al., 2018; Goldin et al., 2020). The T4-like cyanophages were more abundant than T7-like cyanophages at all depths in all profiles (1.8–11.7-fold), similar to previous reports for this region (Goldin et al., 2020; Mruwat et al., 2021). The abundances of T4-like cyanophages were somewhat greater in the cyclone, with 7.02 ± 0.7×10⁵ phages ml-1 in the upper 50 m in the anticyclone and 7.87 ± 0.6×10⁵ phages ml-1 in the cyclone (t-test, p=0.07) (Figure 3E). In contrast, the T7-like cyanophages were 2.2-fold less abundant in the upper 50 m of the cyclone (0.81 ± 0.15×10⁵ phages ml-1) than in the anticyclone (1.79 ± 0.6×10⁵ phages ml-1) (t-test, p=0.02) (Figure 3F). Thus, the greatest difference in abundances between the T4-like and T7-like cyanophages was in the surface layers of the cyclonic eddy. Overall, cyanophages made up 6–16% of the dsDNA viroplankton community in both eddies.
In summary, Prochlorococcus and the heterotrophic bacteria were more abundant in the upper 50 m of the cyclone whereas Synechococcus was less abundant throughout the photic zone of the cyclone relative to the anticyclone. Significantly fewer T7-like cyanophages, but somewhat more T4-like cyanophages were also observed in the upper 50 m of the cyclone, whereas similar VLPs abundances were found in both eddies throughout the photic zone.
Virioplankton production rates
Viral abundances provide a measure of the standing stock but give no information about the processes that lead to these abundances. Viral concentrations are impacted by production rates and their losses (decay). Here, we determined the rate of virus production in both eddies using the method described by Wilhelm et al. (2002) which measures the appearance of new viruses over time after reducing the background of existing viruses (see Materials and Methods and Figure 4). However, this method has not previously been used to assess the production of viruses that infect specific microbial taxa. We compared virus production in the cyclonic and anticyclonic eddy during the day and compared day and night production in the cyclone for the dsDNA virioplankton community and for T4-like cyanophages. This was not done for T7-like cyanophages due to their low abundances after background virus removal (see Materials and Methods).
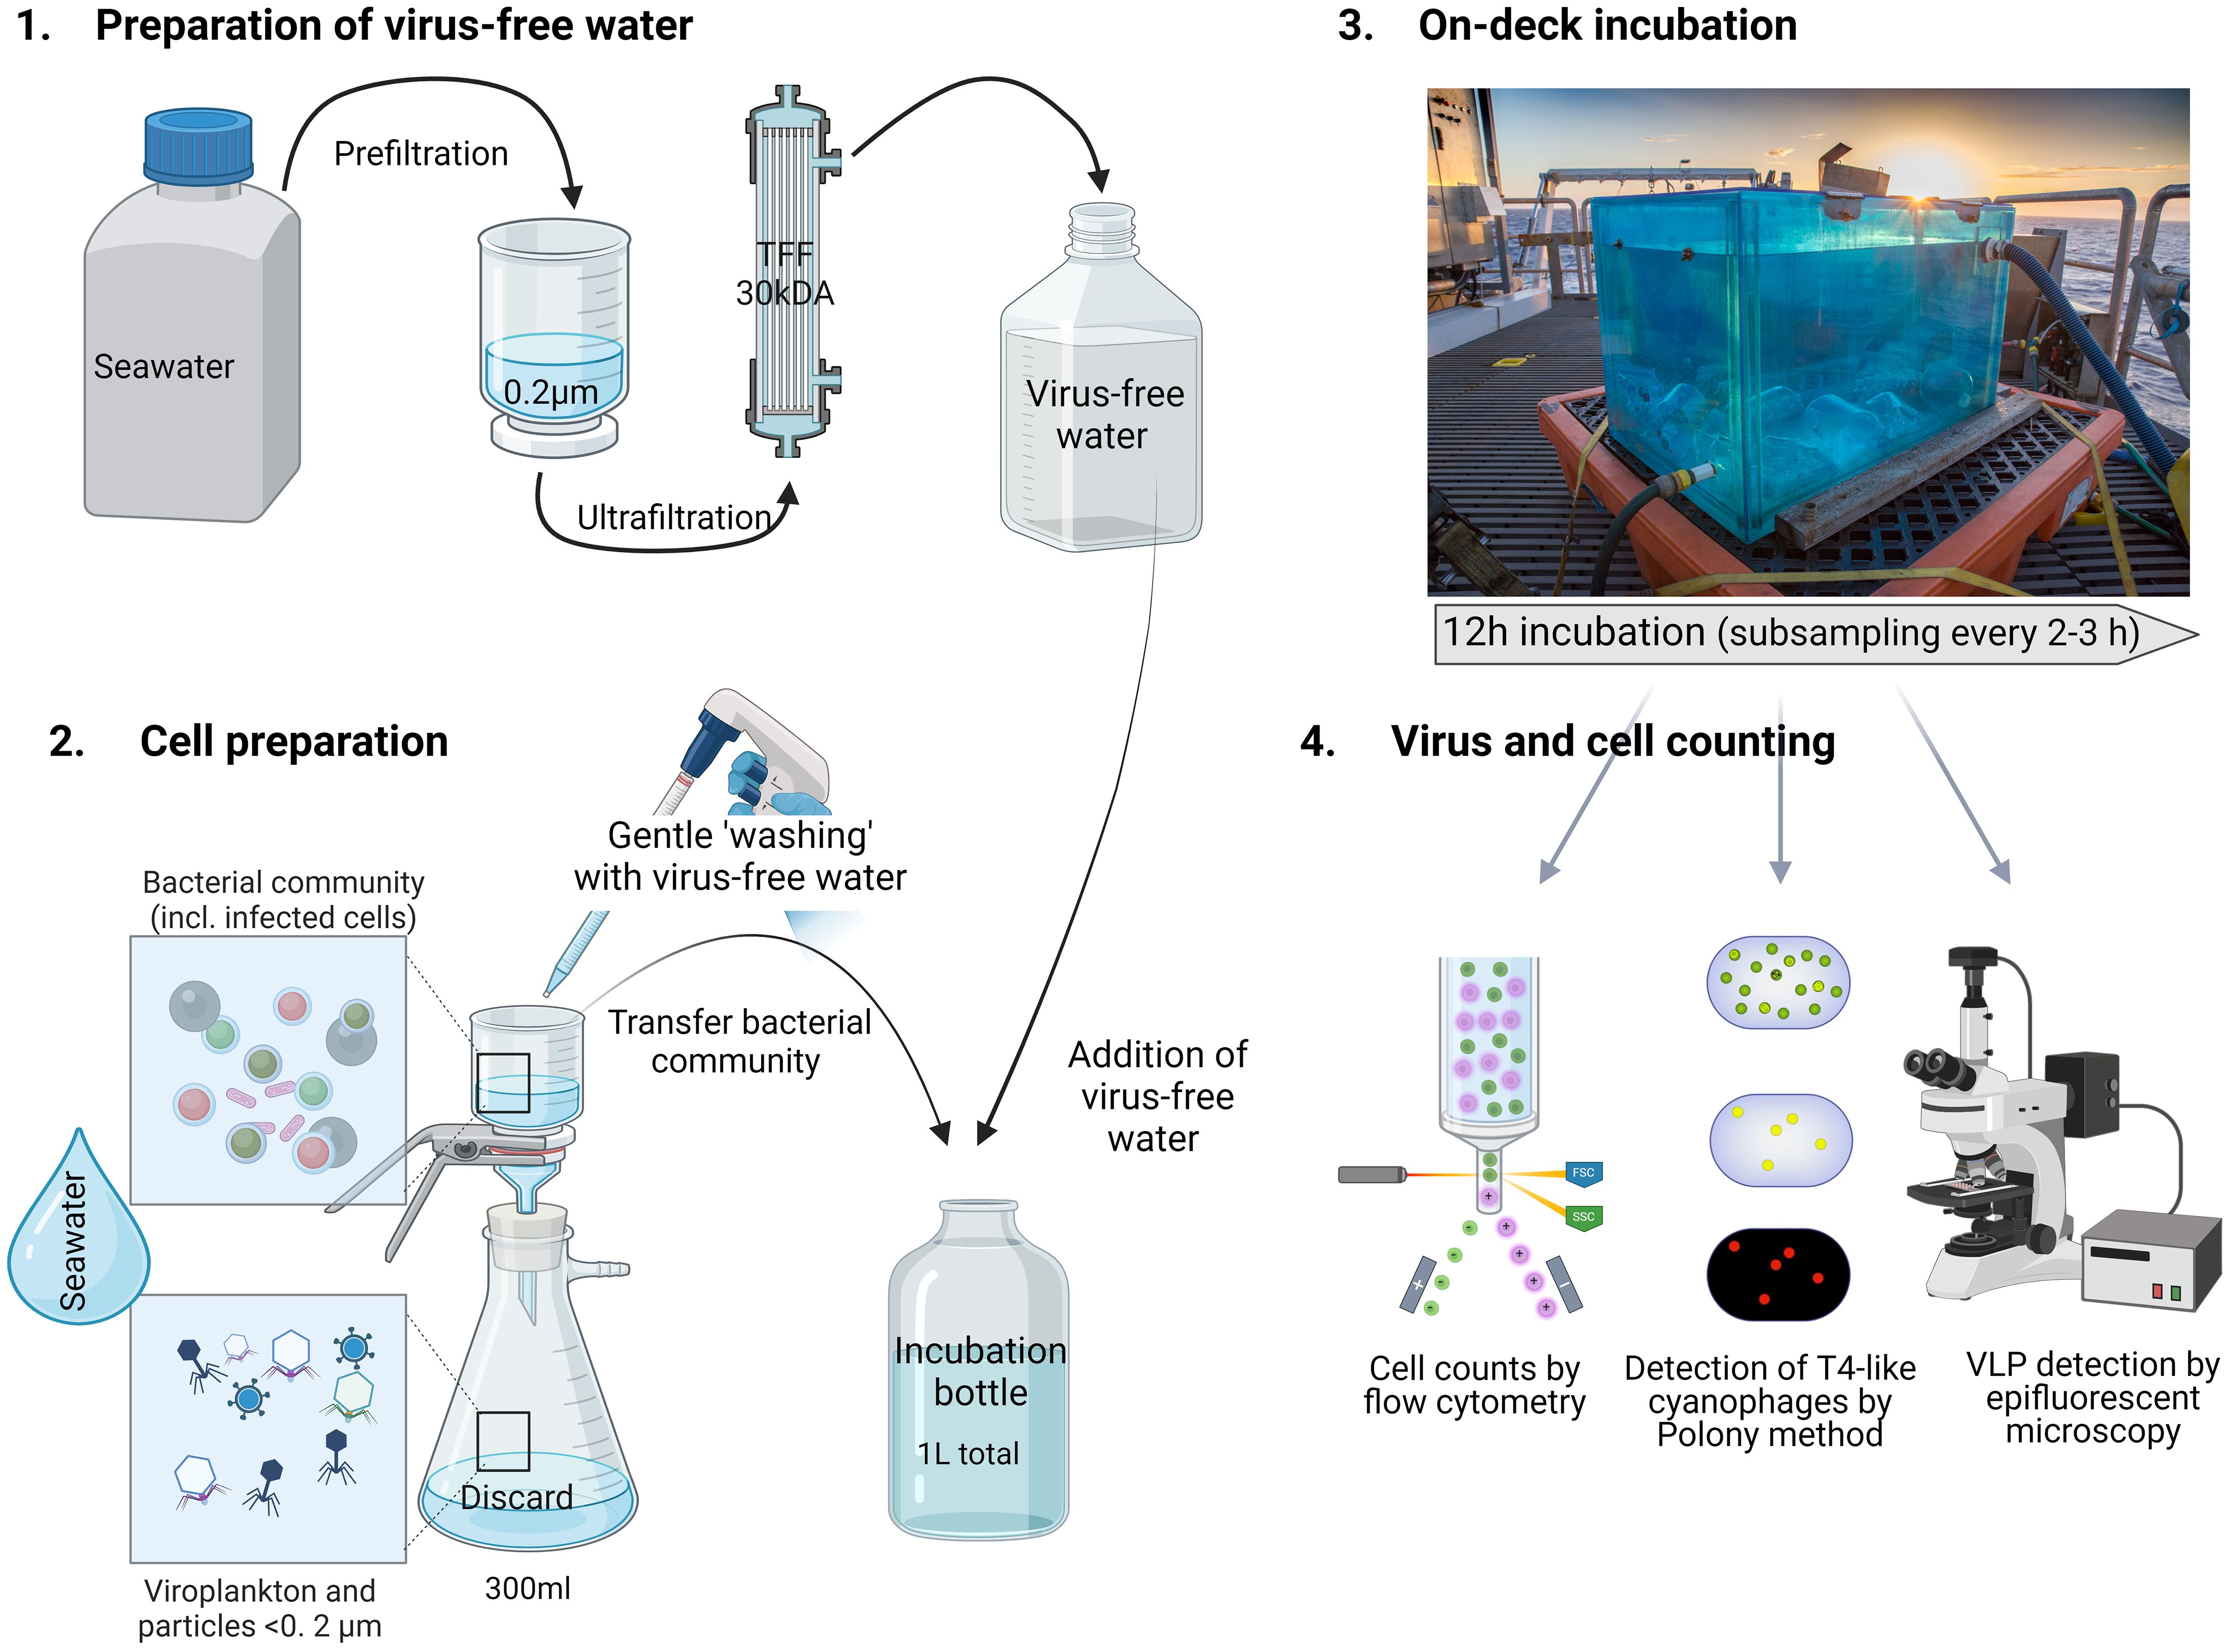
Figure 4. Schematic of the set-up of virus-production experiments. Virus production assays were performed for surface water samples collected from 15 m. Each virus production experiment consisted of 3 biological replicates collected from different Niskin bottles and handled separately for cell preparation. The preparation of virus-free water was performed before sampling for cell preparation.
First, we investigated virus production rates for the dsDNA virioplankton community. We began by measuring virus-like particle production for surface waters (15 m) in on-deck incubations in comparison to in-situ incubations on a floating array over a 12-hour period during the daytime in the cyclonic eddy. VLP production rates were similar with both incubation procedures (Figure 5A), indicating that on-deck incubations are suitable for determining virus production rates. However, it should be noted that the on-deck incubations displayed greater variability than the in-situ incubations. All subsequent experiments were carried out in on-deck incubations, imitating ambient light and temperature conditions for 15 m depth, with subsampling every 2–3 h for 12h.
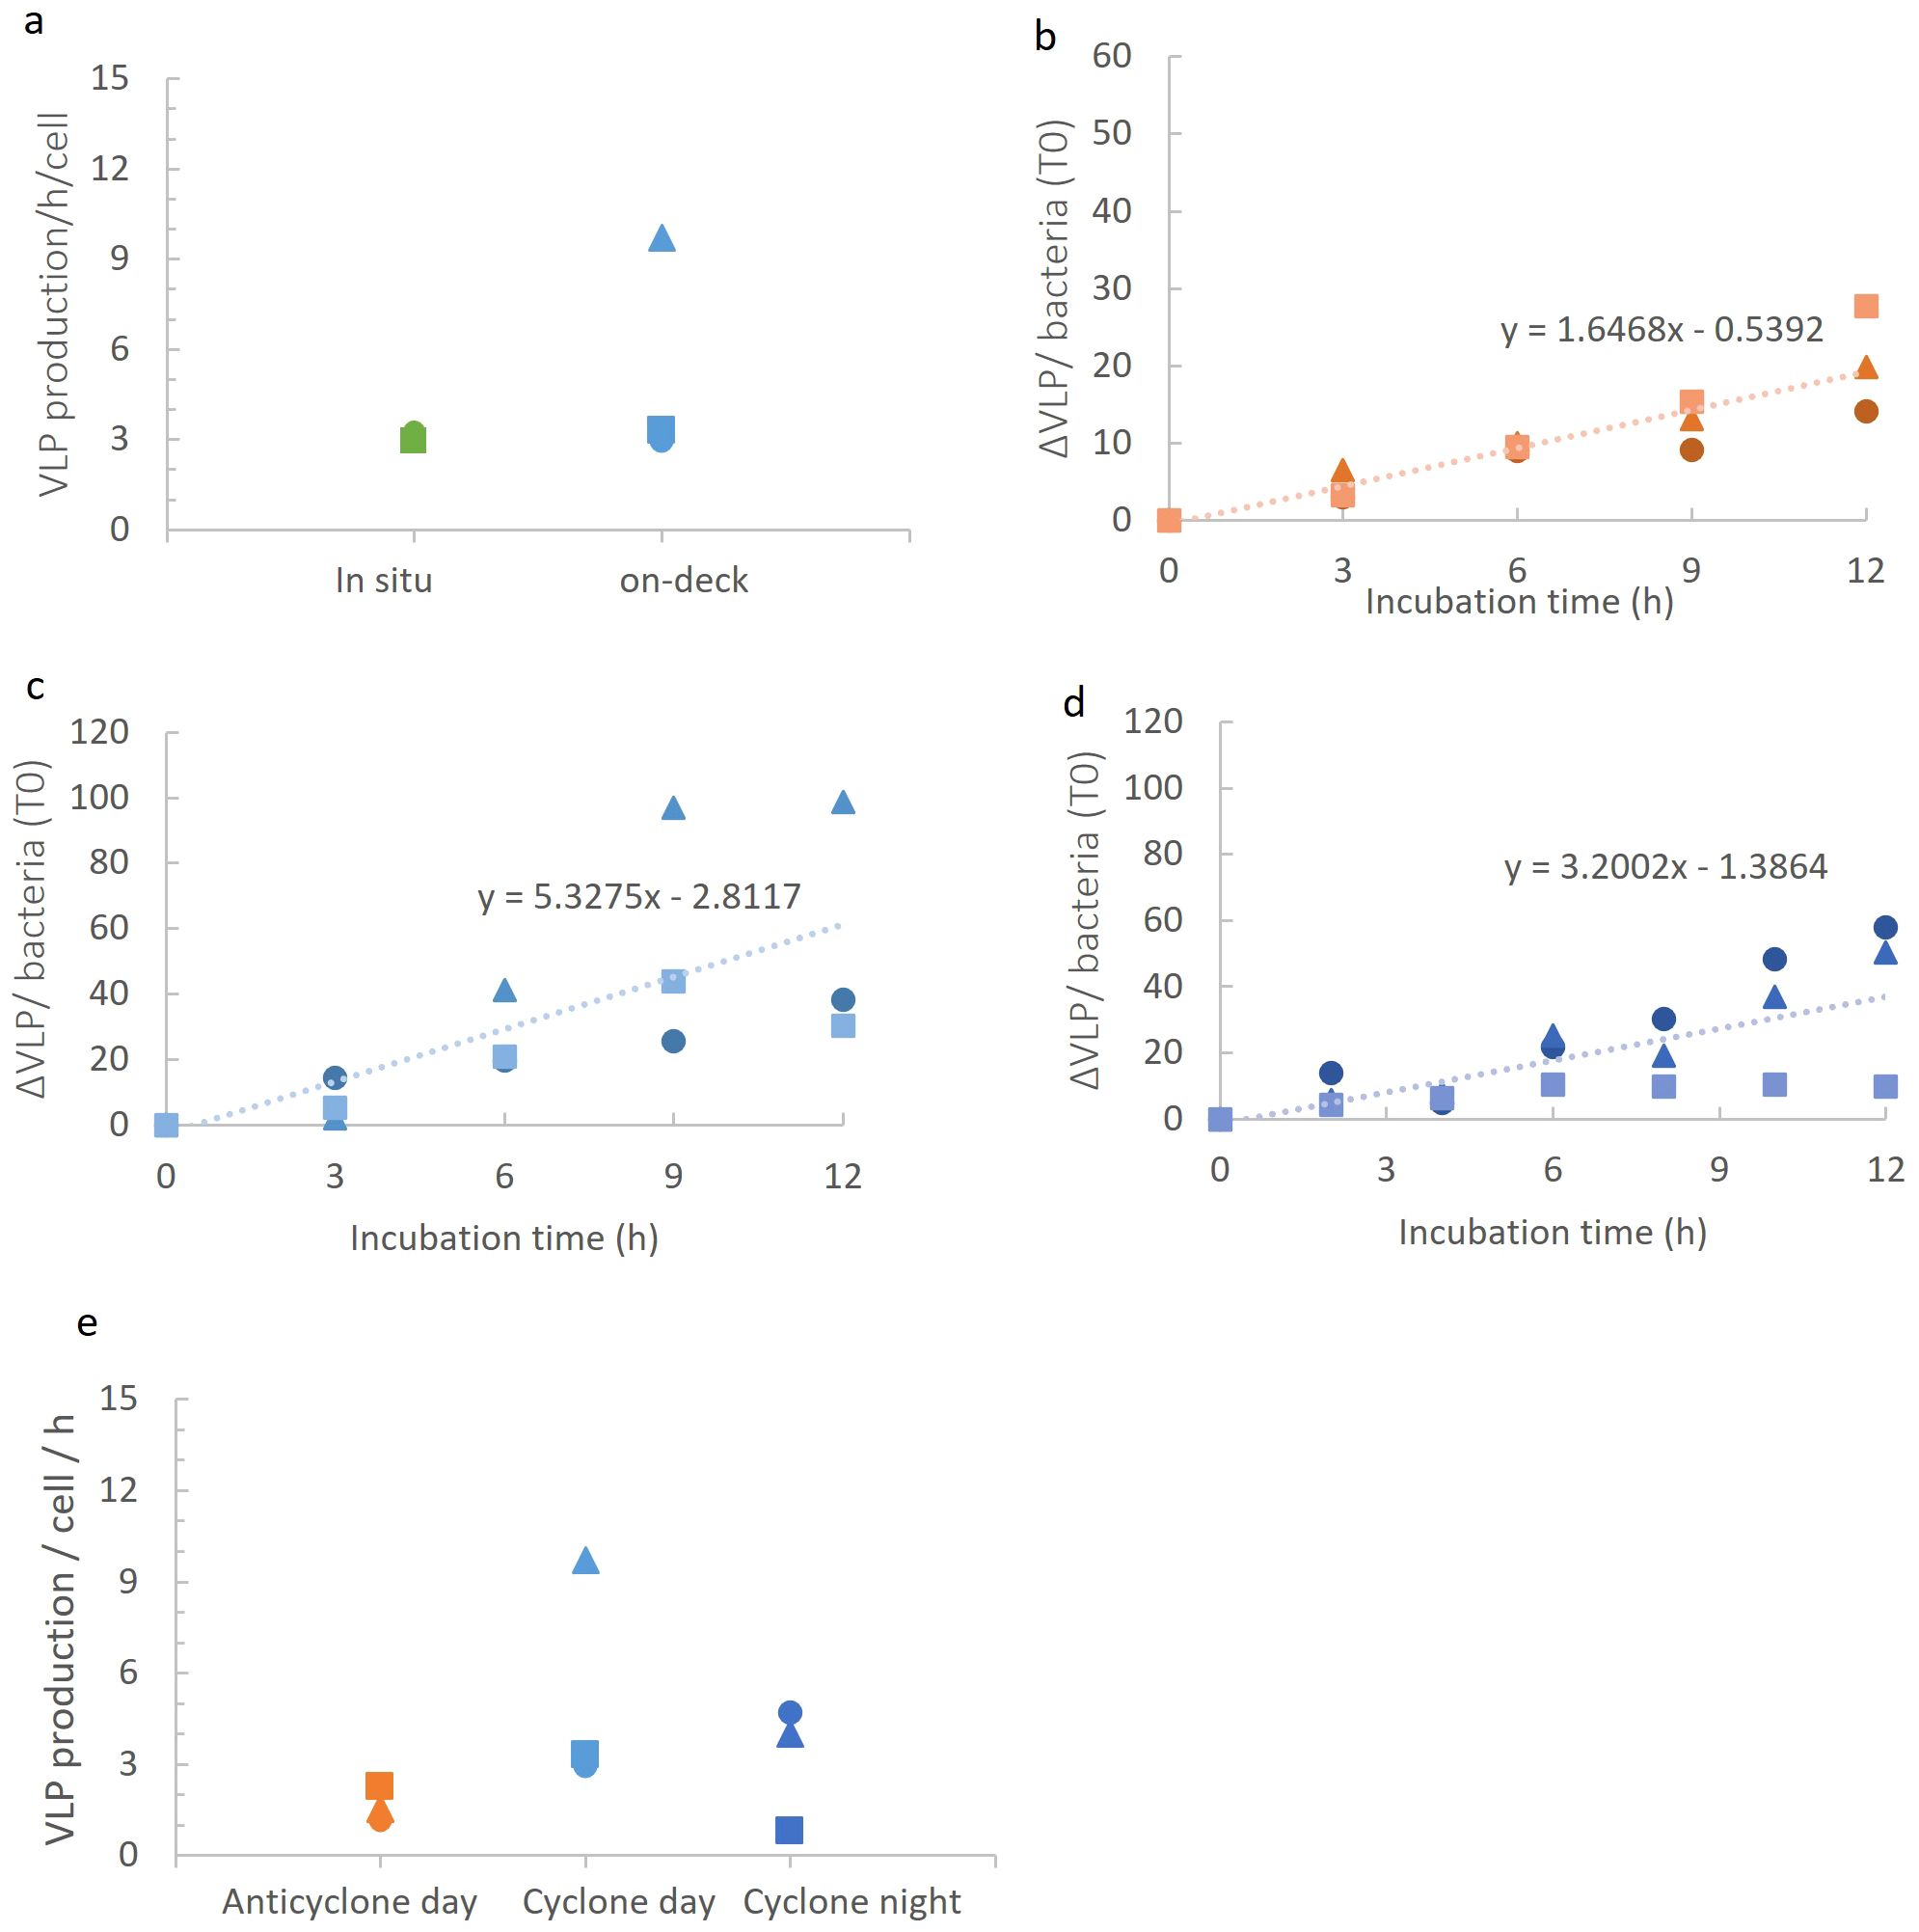
Figure 5. Virioplankton community production in the different eddies. (A) VLP production rates measured in in-situ and on-deck incubation systems in the cyclonic eddy during the night. No significant differences between incubation type (t-test, p=0.3). (B-D) VLP appearance over time per bacterium (at T0 in the incubation) in the anticyclonic eddy during the day (B), in the cyclonic eddy during the day (C), and in the cyclonic eddy during the night (D). (E) Comparison of VLP production rates in on-deck incubations. Production rates of VLPs in anticyclone and cyclone differed significantly during the day (ANCOVA, p=0.005), while no significant difference was seen between day and night in the cyclone (ANCOVA, p=0.81) (E). The different symbols represent different biological replicates.
We next compared virioplankton community production in the two eddies during the day. Distinct differences in dsDNA viroplankton community production were observed, with an average of 3-fold higher VLP production in the cyclone (5.33 ± 3.8 VLP h-1 bacteria-1) than in the anticyclone (1.65 ± 0.6 VLP h-1 bacteria-1) (Figures 5B, C, E) (p=0.005, ANCOVA). Next, we determined VLP production at night (3.18 ± 2.1 VLP h-1 bacteria-1) in the cyclonic eddy and found these to be similar to the daytime rates (Figures 5D, E) (p=0.81, ANCOVA). Thus, VLP production rates were significantly greater in the cyclonic eddy than in the anticyclonic eddy but no significant difference in virus production was found between day and night.
Our findings support our original hypothesis that cyclonic eddies would have higher virus production than anticyclonic eddies. This could be due to higher nutrient availability in the cyclone (Dugenne et al., 2023), potentially resulting in greater metabolic activity of the hosts. Such increased metabolic activity could have resulted in a higher burst size, a shortened latent period and/or a higher percentage of phages completing the infection cycle (Weinbauer and Peduzzi, 1994; Wilson et al., 1996; Weinbauer et al., 1998; Wilhelm et al., 1998; Šimek et al., 2001; Hwang and Cho, 2002; Bettarel et al., 2004; Parada et al., 2006; Nabergoj et al., 2018). Additionally, the somewhat higher bacterial abundances could also have contributed to higher virus production due to greater contact rates. While we did not measure virus decay rates in this study, these findings suggest that VLP losses [decay, attachment to hosts or particles, and ingestion by protists (Murray and Jackson, 1992; Binder, 1999; Brown et al., 2020)] would also be greater in the cyclone since VLP standing stock was similar in both eddies.
Scaling virus production rates to the bacterial population in the water column (VLP per bacterium in the incubation x total bacteria per liter), VLP production rates reported here range from 1.02x10⁹ to 3.62x10⁹ VLP h-1 l-1 in surface layers. These dsDNA viroplankton production rates are within the range of previous reports for several regions in surface waters of the Pacific Ocean, ranging from 1.3 x 10⁸ to 1.3 x 10¹¹ VLP h-1 l-1 (Wilhelm et al., 2002; Matteson et al., 2010; Rowe et al., 2012; Gainer et al., 2017). Our rates, measured in the summer, may be on the low end of this range since strong seasonal variation was found in the NPSG, with substantially more virus production in the winter than in the summer (Gainer et al., 2017). Our findings show that variability in dsDNA virioplankton community production expands to the spatial scale of 10–100 kilometers across mesoscale eddies, at least in surface layers of these eddies.
At present data on virus production is limited to the upper mixed layer (Brum, 2005; Rowe et al., 2012; Gainer et al., 2017). It is possible that the higher virus production found here for the upper mixed layer in the cyclonic eddy would also be found deeper in the photic zone. This is particularly possible since differences in nutrient concentrations, phytoplankton biomass and primary production are greater below the upper mixed layer (Figure 2) (Barone et al., 2022; Dugenne et al., 2023) which may enhance bacterial activity. However, temperature is also lower deeper in the photic zone in the cyclone relative to the anticyclone (Figure 2B) (Dugenne et al., 2023), which could have a dampening effect on virus production. Thus, further work is needed to gain insights into whether greater virus production in the cyclone than in the anticyclone would also be observed deeper in the photic zone.
Cyanophage production rates
Virus production experiments using VLP counts, average across the different components that make up the dsDNA virioplankton community and do not provide insight into production of a particular virus group. To determine cyanophage-specific production in the two eddies we used the polony method for the enumeration of T4-like cyanophages. Different to that observed for VLP production, daytime T4-like cyanophage production rates were similar in both the cyclonic and anticyclonic eddies (p=0.42, ANCOVA), with an average of 3.2 ± 0.4 and 3.1 ± 1.8 T4-like cyanophages per 103 Prochlorococcus cells h-1 in the cyclonic and anticyclonic eddies, respectively (Figures 6A, B, D). These results are different to our initial expectations of greater cyanophage production in cyclonic eddies.
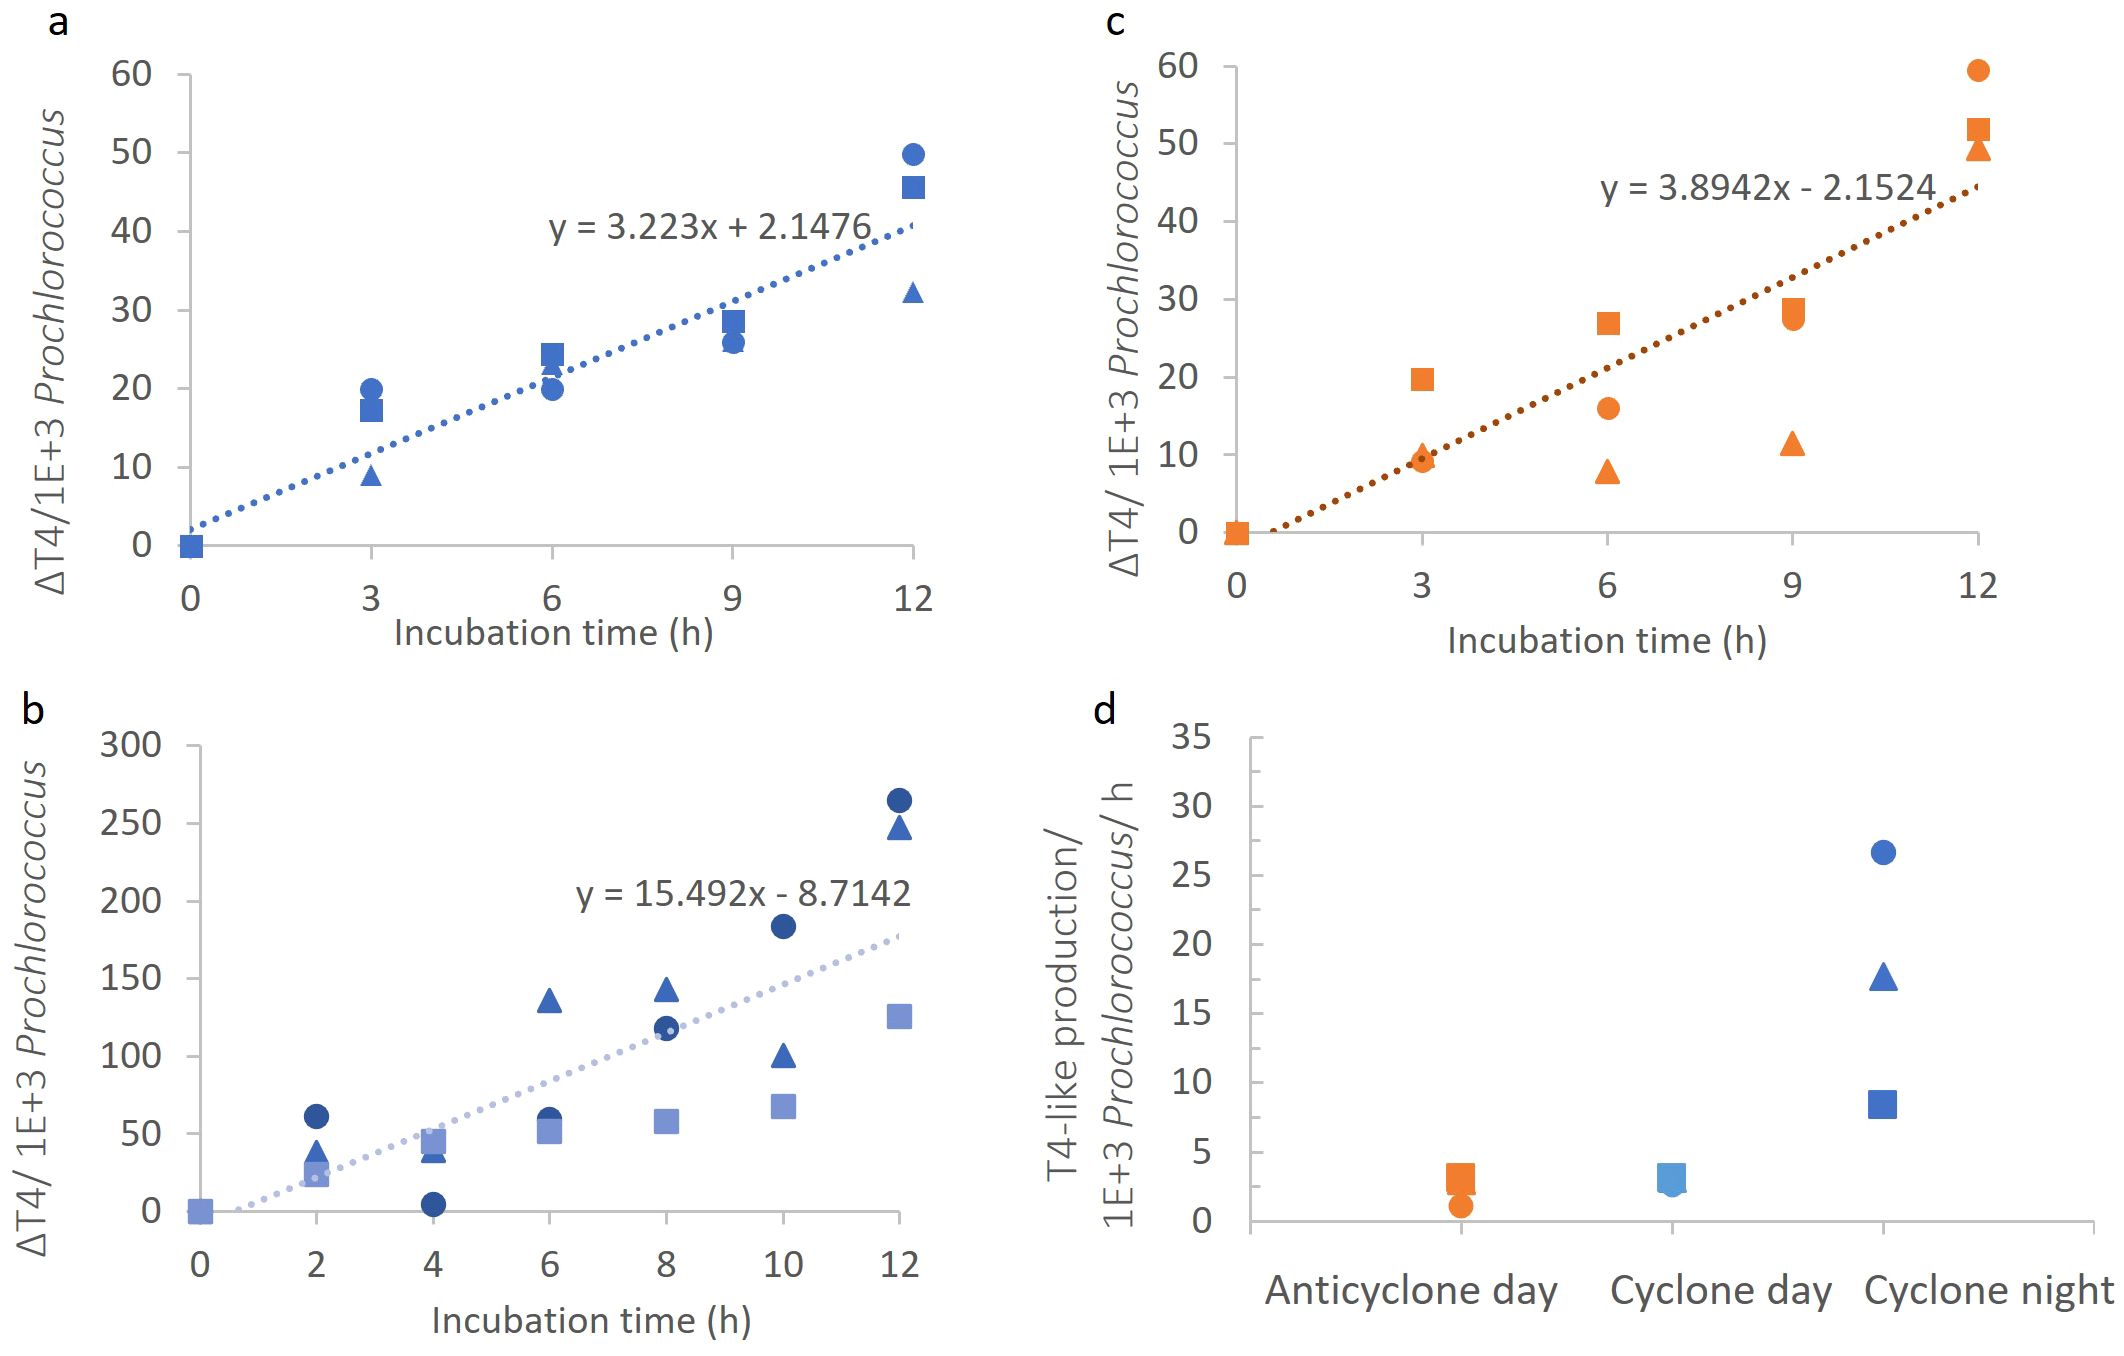
Figure 6. Cyanophage production in the different eddies. (A-C) T4-like cyanophage appearance over time per 1000 Prochlorococcus cells in the cyclonic eddy during the day (A), in the anticyclonic eddy during the day (B), and in the cyclonic eddy during the night (C). (D) Comparison of T4-like cyanophage production rates. Virus production rates significantly differed between day and night in the cyclone (ANCOVA, p=0.0001) but not between the cyclone and anticyclone during the day (ANCOVA, p=42).
We next compared T4-like cyanophage production during the day and at night in the cyclone. Also, in contrast to the dsDNA virioplankton, we found that cyanophage production rates were 4.8-fold higher at night than during the day (p=0.0001, ANCOVA) with 15.5 ± 6.2 cyanophages per 103 Prochlorococcus cells h-1 at night (Figures 6C, D). Greater T4-like cyanophage production at night could result from a higher number of Prochlorococcus cells being infected in the population. To assess this, we determined the percentage of Prochlorococcus cells infected by T4-like cyanophages using the iPolony method (Mruwat et al., 2021). Infection in the cyclonic eddy was higher at dusk than at dawn, with 1.46 ± 0.08% versus 1.06 ± 0.07% of Prochlorococcus cells infected (p=0.05, t-test). However, this 1.4-fold difference in infection is considerably less than the almost 5-fold difference in T4-like cyanophage production. This indicates that higher infection alone does not explain the observed difference in production at night. The greater cyanophage progeny production at night could therefore be a combination of higher infection and either an increased burst size or a higher percentage of cyanophages completing the infection cycle than during the day.
Diurnal rhythms of cyanophage gene expression and Prochlorococcus infection have been reported previously for the NPSG (Aylward et al., 2017; Liu et al., 2019; Mruwat et al., 2021). These studies reported greater transcription and infection at dusk, coinciding with the peak in Prochlorococcus genome replication. Our study expands these findings, showing that cyanophage progeny production is also greater at night than during the day, which may be related to more nucleotides available for cyanophage genome replication at the peak of host genome replication.
Mortality estimates from virus production rates
We used the virus production rates determined here to estimate the daily virus-mediated mortality of Prochlorococcus and the bacterial community. Combining day and night production rates from our incubation experiments in the cyclonic eddy, and scaling to the size of the Prochlorococcus population in the water column, we estimate daily T4-like cyanophage production rates to be 3.4 ± 1.8x10⁴ T4-like cyanophages per day. Assuming a burst size of 5–12 T4-like cyanophages per cell (Laurenceau et al., 2021; Carlson et al., 2022), this cyanophage family is estimated to be responsible for the mortality of 2.5–6% of Prochlorococcus standing stock per day. Prior work by Mruwat et al. (2021) in the NPSG using the iPolony method estimated that cyanophages were responsible for less than 5% of Prochlorococcus cell loss per day. Thus, these two independent studies using distinctly different methodological approaches and employing different assumptions for estimating mortality both report low percent infection and low viral-induced mortality estimates of Prochlorococcus in the upper mixed layer of the NPSG in the spring and summer.
Estimates of virus-mediated mortality of the bacterial community in marine environments often ranges between 10–30% (Heldal and Bratbak, 1991; Suttle, 1994; Fuhrman and Noble, 1995; Wommack and Colwell, 2000). The burst size of bacteriophages in the marine environment is predicted to vary greatly from 6 to 300 phages per cell (see review by Parada et al., 2006). This will be different for distinct virus and host taxa, and is thought to be indirectly linked to cell and phage size (Weinbauer and Peduzzi, 1994; Weinbauer et al., 1998), to bacterial activity (Wilhelm et al., 1998; Šimek et al., 2001; Hwang and Cho, 2002; Bettarel et al., 2004), and to abiotic factors such as temperature, light and nutrient availability in the environment (Wilson et al., 1996; Wilhelm et al., 1998; Weinbauer et al., 1999; Parada et al., 2006). It is challenging to use the burst size to estimate mortality at the community level since burst size is poorly constrained. Nonetheless, if we assume that the average burst size of the community is intermediate relative to the extremes of burst sizes mentioned above, i.e. between 50–200, and is the same for both eddies, then daily production of 2.45–8.69x10¹⁰ of dsDNA viruses (VLPs) would be responsible for the mortality of 18–72% and 37–171% of the bacterial standing stock in the anticyclone and cyclone respectively (Figure 7). However, if we assume that bacterial activity is greater in the cyclone due, for example, to more nutrient influx and slightly higher temperatures, this could result in a higher burst size. If this is the case, then mortality in the cyclonic eddy would be less than the 37–171% discussed above.
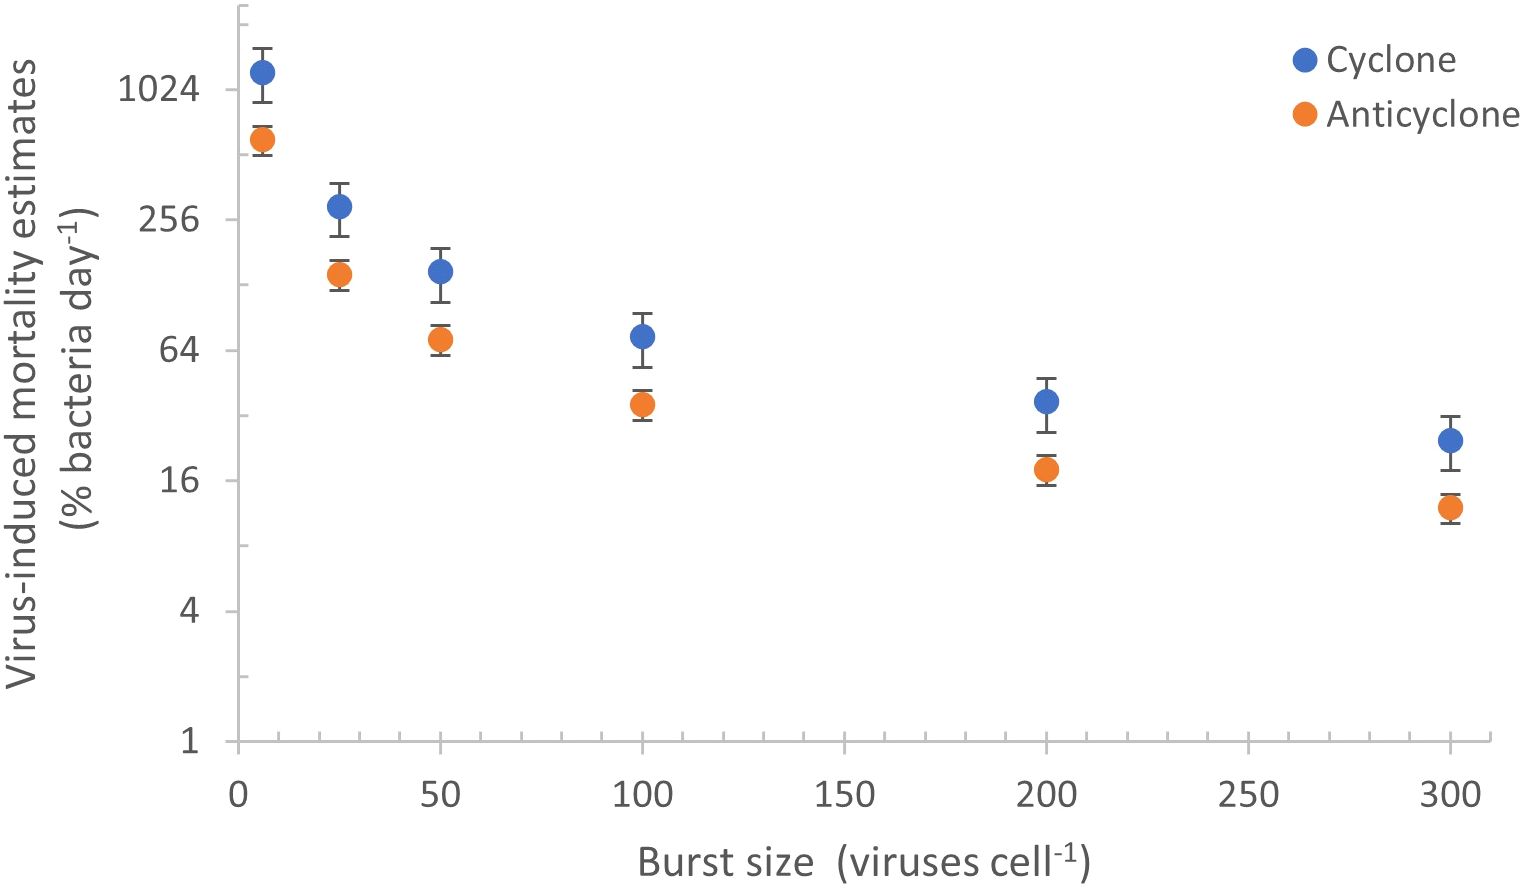
Figure 7. Virus-mediated daily mortality estimates inferred from different burst sizes. Daily bacterial mortality estimates of the bacterial standing stock were determined from the VLP production rates in the cyclone (blue) and anticyclone (orange) when assuming a range of burst sizes (from 6 to 300 phages cell-1). The range in mortality estimates is large since burst sizes are not well constrained at the community level, differing with virus and host types as well as with host metabolic activity and environmental conditions (see text).
Conclusions
The investigation of virus production in surface waters of eddies of opposite polarity in the NPSG revealed that the cyclone, with higher nutrient concentrations and somewhat higher microbial abundances, had greater overall dsDNA virioplankton production (but not T4-like cyanophage production) than the anticyclone (Figure 8). These differences suggest that such mesoscale features, with their different abiotic environmental conditions, are a source of variability in the NPSG for virus-mediated processes and microbial dynamics.
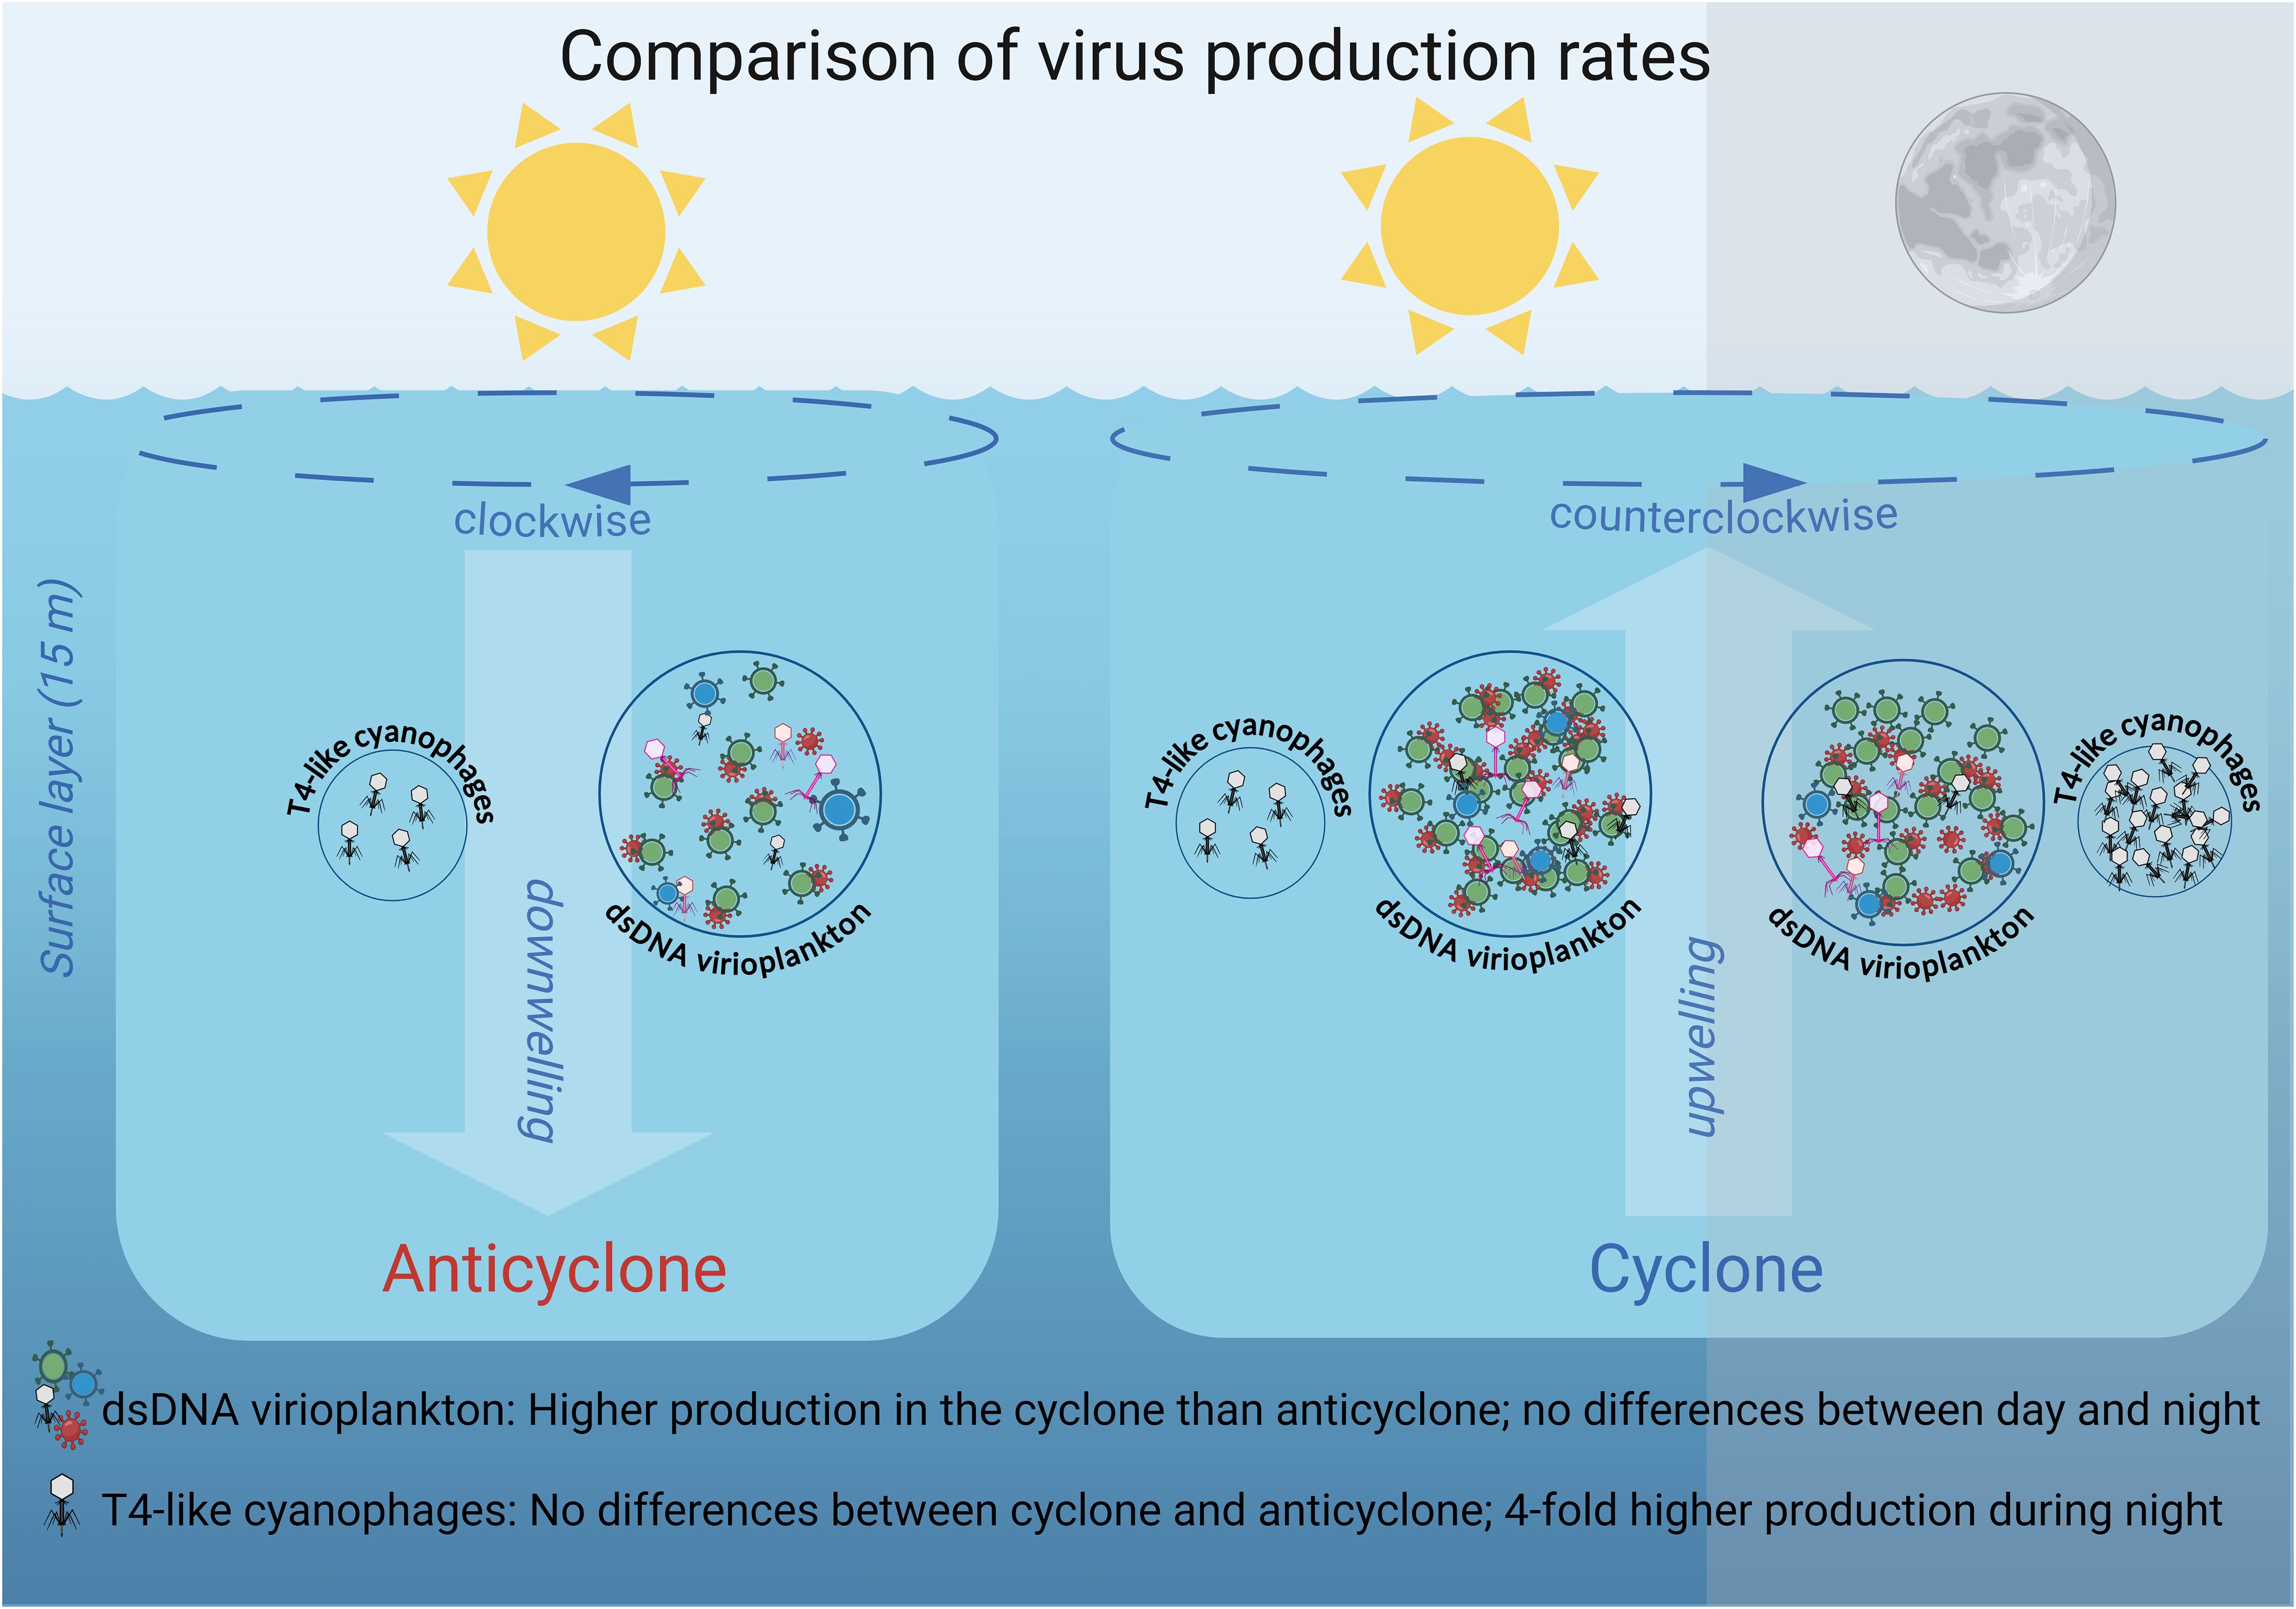
Figure 8. Schematic overview of differential virus production dynamics in the cyclone and anticyclone eddies in the NPSG. Larger circles indicate higher standing stock and greater virus production of the dsDNA virioplankton community relative to the T4-like cyanophages (not drawn to scale). The number of viruses inside the circles indicates their relative production rates in the two eddies and between day and night. The number of phages is not drawn to scale for differences in production between the dsDNA virioplankton and the T4-like cyanophages. Different colored particles indicate different virus types and white particles indicate T4-like cyanophages. The dashed line arrows at the sea surface indicate the clockwise and counterclockwise rotation of the eddies, while the large background arrows represent the subsequent downwelling movement within the anticyclonic eddy and the upwelling movement within the cyclonic eddy respectively.
This study provides the first information on virus production rates for T4-like cyanophages, one of the two major cyanophage families. We revealed considerably lower rates of production for the cyanophage, as well as differences in spatial and diel virus production rates, relative to those for the combined dsDNA virioplankton community (Figure 8). These findings highlight the importance of independent investigation of distinct components of the virus pool if we are to understand their dynamics and gain insights into viral impacts on different constituents of the microbial community. They further indicate that some components of the virioplankton, such as T4-like cyanophages, are more affected by the time of day, whereas other components of the virioplankton are affected more substantially by environmental conditions over mesoscale spatial scales.
Data availability statement
The raw data supporting the conclusions of this article will be made available by the authors, without undue reservation.
Author contributions
JW: Conceptualization, Formal Analysis, Investigation, Methodology, Writing – original draft, Writing – review & editing. SG: Investigation, Writing – review & editing. YH: Investigation, Writing – review & editing. DL: Conceptualization, Funding acquisition, Supervision, Writing – original draft, Writing – review & editing.
Funding
The author(s) declare financial support was received for the research, authorship, and/or publication of this article. This research was supported by grants from the Simons Foundation (SCOPE Grant No. 329108 and 721254, and Life Grant 529554).
Acknowledgments
We thank the captain and crew of the R/V Falkor, Sam Wilson the chief scientist, the labs of Dave Karl and Angelique White for equipment and supplies, and Ilia Maidanik and Michael Carlson for discussions. This manuscript is a contribution of the Simons Collaboration on Ocean Processes and Ecology (SCOPE).
Conflict of interest
The authors declare that the research was conducted in the absence of any commercial or financial relationships that could be construed as a potential conflict of interest.
Publisher’s note
All claims expressed in this article are solely those of the authors and do not necessarily represent those of their affiliated organizations, or those of the publisher, the editors and the reviewers. Any product that may be evaluated in this article, or claim that may be made by its manufacturer, is not guaranteed or endorsed by the publisher.
References
Ahlgren N. A., Perelman J. N., Yeh Y. C., Fuhrman J. A. (2019). Multi-year dynamics of fine-scale marine cyanobacterial populations are more strongly explained by phage interactions than abiotic, bottom-up factors. Environ. Microbiol. 21, 2948–2963. doi: 10.1111/1462-2920.14687
Avrani S., Wurtzel O., Sharon I., Sorek R., Lindell D. (2011). Genomic island variability facilitates Prochlorococcus virus coexistence. Nature 474, 604–608. doi: 10.1038/nature10172
Aylward F. O., Boeuf D., Mende D. R., Wood-Charlson E. M., Vislova A., Eppley J. M., et al. (2017). Diel cycling and long-term persistence of viruses in the ocean’s euphotic zone. Proc. Natl. Acad. Sci. U.S.A. 114, 11446–11451. doi: 10.1073/pnas.1714821114
Baran N., Goldin S., Maidanik I., Lindell D. (2018). Quantification of diverse virus populations in the environment using the polony method. Nat. Microbiol. 3, 62–72. doi: 10.1038/s41564-017-0045-y
Barone B., Coenen A. R., Beckett S. J., Mcgillicuddy D. J., Weitz J. S., Karl D. M. (2019). The ecological and biogeochemical state of the North Pacific Subtropical Gyre is linked to sea surface height. J. Mar. Res. 77, 215–245. doi: 10.1357/002224019828474241
Barone B., Church M. J., Dugenne M., Hawco N. J., Jahn A., White A. E., et al. (2022). Biogeochemical dynamics in adjacent mesoscalte eddies of opposite polarity. Glob. Biogeochem. Cycles. 36, e2021GB007115. doi: 10.1029/2021GB007115
Bettarel Y., Sime-Ngando T., Amblard C., Dolan J. (2004). Viral activity in two contrasting lake ecosystems. Appl. Environ. Microbiol. 70, 2941–2951. doi: 10.1128/AEM.70.5.2941-2951.2004
Binder B. (1999). Reconsidering the relationship between virally induced bacterial mortality and frequency of infected cells. Aquat Microb. Ecol. 18, 207–215. doi: 10.3354/ame018207
Breitbart M. (2012). Marine viruses: Truth or dare. Ann. Rev. Mar. Sci. 4, 425–448. doi: 10.1146/annurev-marine-120709-142805
Brown J. M., Labonté J. M., Brown J., Record N. R., Poulton N. J., Sieracki M. E., et al. (2020). Single cell genomics reveals viruses consumed by marine protists. Front. Microbiol. 11, 524828. doi: 10.3389/fmicb.2020.524828
Brum J. R. (2005). Concentration, production and turnover of viruses and dissolved DNA pools at Stn ALOHA, North Pacific Subtropical Gyre. Aquat Microb. Ecol. 41, 103–113. doi: 10.3354/ame041103
Brum J. R., Hurwitz B. L., Schofield O., Ducklow H. W., Sullivan M. B. (2016). Seasonal time bombs: Dominant temperate viruses affect Southern Ocean microbial dynamics. ISME J. 10, 437–449. doi: 10.1038/ismej.2015.125
Brum J. R., Steward G. F., Jiang S. C., Jellison R. (2005). Spatial and temporal variability of prokaryotes, viruses, and viral infections of prokaryotes in an alkaline, hypersaline lake. Aquat Microb. Ecol. 41, 247–260. doi: 10.3354/ame041247
Cai L., Chen Y., Xiao S., Liu R., He M., Zhang R., et al. (2023). Abundant and cosmopolitan lineage of cyanopodoviruses lacking a DNA polymerase gene. ISME J. 17, 252–262. doi: 10.1038/s41396-022-01340-6
Campbell L., Liu H., Nolla H. A., Vaulot D. (1997). Annual variability of phytoplankton and bacteria in the subtropical North Pacific Ocean at Station ALOHA during the 1991-1994 ENS0 event. Deep-Sea Res. 44, 167–192. doi: 10.1016/S0967-0637(96)00102-1
Carlson M. C. G., Ribalet F., Maidanik I., Durham B. P., Hulata Y., Ferrón S., et al. (2022). Viruses affect picocyanobacterial abundance and biogeography in the North Pacific Ocean. Nat. Microbiol. 7, 570–580. doi: 10.1038/s41564-022-01088-x
Culley A. I., Welschmeyer N. A. (2002). The abundance, distribution, and correlation of viruses, phytoplankton, and prokaryotes along a Pacific Ocean transect. Limnol. Oceanogr. 47, 1508–1513. doi: 10.4319/lo.2002.47.5.1508
Dekel-Bird N. P., Sabehi G., Mosevitzky B., Lindell D. (2015). Host-dependent differences in abundance, composition and host range of cyanophages from the Red Sea. Environ. Microbiol. 17, 1286–1299. doi: 10.1111/1462-2920.12569
DeLong E. F., Preston C. M., Mincer T., Rich V., Hallam S. J., Frigaard N. U., et al. (2006). Community genomics among stratified microbial assemblages in the ocean’s interior. Science 1979) 311, 496–503. doi: 10.1126/science.1120250
Dufois F., Hardman-Mountford N. J., Greenwood J., Richardson A. J., Feng M., Matear R. J. (2016). Anticyclonic eddies are more productive than cyclonic eddies in subtropical gyres because of winter mixing. Sci. Adv. 2, e1600282. doi: 10.1126/sciadv.1600282
Dugenne M., Gradoville M. R., Church M. J., Wilson S. T., Sheyn U., Harke M. J., et al. (2023). Nitrogen fixation in mesoscale eddies of the North Pacific Subtropical Gyre: Patterns and mechanisms. Global Biogeochem. Cycles 37, e2022GB007386. doi: 10.1029/2022GB007386
Flombaum P., Gallegos J. L., Gordillo R. A., Rincón J., Zabala L. L., Jiao N., et al. (2013). Present and future global distributions of the marine Cyanobacteria Prochlorococcus and Synechococcus. Proc. Natl. Acad. Sci. U.S.A. 110, 9824–9829. doi: 10.1073/pnas.1307701110
Fuhrman J. A. (1999). Marine viruses and their biogeochemical and ecological effects. Nature 399, 541–548. doi: 10.1038/21119
Fuhrman J. A., Noble R. T. (1995). Viruses and protists cause similar bacterial mortality in coastal seawater. Limnol. Oceanogr. 40, 1236–1242. doi: 10.4319/lo.1995.40.7.1236
Fuller N. J., Wilson W. H., Joint I. R., Mann N. H. (1998). Occurrence of a sequence in marine cyanophages similar to that of T4 g20 and its application to PCR-based detection and quantification techniques. Appl. Environ. Microbiol. 64, 2051–2060. doi: 10.1128/AEM.64.6.2051-2060.1998
Gainer P. J., Pound H. L., Larkin A. A., LeCleir G. R., DeBruyn J. M., Zinser E. R., et al. (2017). Contrasting seasonal drivers of virus abundance and production in the North Pacific Ocean. PloS One 12, e0184371. doi: 10.1371/journal.pone.0184371
Goldin S., Hulata Y., Baran N., Lindell D. (2020). Quantification of T4-like and T7-like cyanophages using the polony method show they are significant members of the virioplankton in the North Pacific Subtropical Gyre. Front. Microbiol. 11, 1210. doi: 10.3389/fmicb.2020.01210
Heldal M., Bratbak G. (1991). Production and decay of viruses in aquatic environments. Mar. Ecol. Prog. Ser. 72, 205–212. doi: 10.3354/meps072205
Huang S., Wang K., Jiao N., Chen F. (2012). Genome sequences of siphoviruses infecting marine Synechococcus unveil a diverse cyanophage group and extensive phage-host genetic exchanges. Environ. Microbiol. 14, 540–558. doi: 10.1111/j.1462-2920.2011.02667.x
Huang S., Zhang S., Jiao N., Chen F. (2015). Marine cyanophages demonstrate biogeographic patterns throughout the global ocean. Appl. Environ. Microbiol. 81, 441–452. doi: 10.1128/AEM.02483-14
Hwang C. Y., Cho B. C. (2002). Virus-infected bacteria in oligotrophic open waters of the East Sea, Korea. Aquat Microb. Ecol. 30, 1–9. doi: 10.3354/ame030001
John S. G., Mendez C. B., Deng L., Poulos B., Kauffman A. K. M., Kern S., et al. (2011). A simple and efficient method for concentration of ocean viruses by chemical flocculation. Environ. Microbiol. Rep. 3, 195–202. doi: 10.1111/j.1758-2229.2010.00208.x
Karl D. M., Church M. J. (2014). Microbial oceanography and the Hawaii Ocean Time-series programme. Nat. Rev. Microbiol. 12, 699–713. doi: 10.1038/nrmicro3333
Karl D. M., Church M. J. (2017). Ecosystem structure and dynamics in the North Pacific Subtropical Gyre: New views of an old ocean. Ecosystems 20, 433–457. doi: 10.1007/s10021-017-0117-0
Labrie S. J., Frois-Moniz K., Osburne M. S., Kelly L., Roggensack S. E., Sullivan M. B., et al. (2013). Genomes of marine cyanopodoviruses reveal multiple origins of diversity. Environ. Microbiol. 15, 1356–1376. doi: 10.1111/1462-2920.12053
Laurenceau R., Raho N., Forget M., Arellano A. A., Chisholm S. W. (2021). Frequency of mispackaging of Prochlorococcus DNA by cyanophage. ISME J. 15, 129–140. doi: 10.1038/s41396-020-00766-0
Lindell D., Sullivan M. B., Johnson Z. I., Tolonen A. C., Rohwer F., Chisholm S. W. (2004). Transfer of photosynthesis genes to and from Prochlorococcus viruses. Proc. Natl. Acad. Sci. U.S.A. 27, 11013–11018. doi: 10.1073/pnas.0401526101
Liu R., Liu Y., Chen Y., Zhan Y., Zeng Q. (2019). Cyanobacterial viruses exhibit diurnal rhythms during infection. Proc. Natl. Acad. Sci. U.S.A. 116, 14077–14082. doi: 10.1073/pnas.1819689116
Luo E., Aylward F. O., Mende D. R., Delong E. F. (2017). Bacteriophage distributions and temporal variability in the ocean’s interior. mBio 8, 10.1128. doi: 10.1128/mBio.01903-17
Maidanik I., Kirzner S., Pekarski I., Arsenieff L., Tahan R., Carlson M. C. G., et al. (2022). Cyanophages from a less virulent clade dominate over their sister clade in global oceans. ISME J. 16, 2169–2180. doi: 10.1038/s41396-022-01259-y
Malmstrom R. R., Coe A., Kettler G. C., Martiny A. C., Frias-Lopez J., Zinser E. R., et al. (2010). Temporal dynamics of Prochlorococcus ecotypes in the Atlantic and Pacific Oceans. ISME J. 4, 1252–1264. doi: 10.1038/ismej.2010.60
Marston M. F., Taylor S., Sme N., Parsons R. J., Noyes T. J. E., Martiny J. B. H. (2013). Marine cyanophages exhibit local and regional biogeography. Environ. Microbiol. 15, 1452–1463. doi: 10.1111/1462-2920.12062
Matteson A. R., Budinoff C. R., Campbell C. E., Buchan A., Wilhelm S. W. (2010). Estimating virus production rates in aquatic systems. J. Visualized Experiments 43, e2196. doi: 10.3791/2196
Matteson A. R., Rowe J. M., Ponsero A. J., Pimentel T. M., Boyd P. W., Wilhelm S. W. (2013). High abundances of cyanomyoviruses in marine ecosystems demonstrate ecological relevance. FEMS Microbiol. Ecol. 84, 223–234. doi: 10.1111/femsec.2013.84.issue-2
Mcgillicuddy D. J., Robinson A. R. (1997). Eddy-induced nutrient supply and new production in the Sargasso Sea. Deep-Sea Res. J. 44, 1427–1450. doi: 10.1016/S0967-0637(97)00024-1
Millard A. D., Mann N. H. (2006). A temporal and spatial investigation of cyanophage abundance in the Gulf of Aqaba, Red Sea. J. Mar. Biol. Assoc. United Kingdom 86, 507–515. doi: 10.1017/S0025315406013415
Mitra R. D., Church G. M. (1999). In situ localized amplification and contact replication of many individual DNA molecules. Nucleic Acids Res. 27, e34. doi: 10.1093/nar/27.24.e34
Mruwat N., Carlson M. C. G., Goldin S., Ribalet F., Kirzner S., Hulata Y., et al. (2021). A single-cell polony method reveals low levels of infected Prochlorococcus in oligotrophic waters despite high cyanophage abundances. ISME J. 15, 41–54. doi: 10.1038/s41396-020-00752-6
Murray A. G., Jackson G. A. (1992). Viral dynamics: a model of the effects of size, shape, motion and abundance of single-celled planktonic organisms and other particles. Mar. Ecol. Prog. Ser. 89, 103–116. doi: 10.3354/meps089103
Nabergoj D., Modic P., Podgornik A. (2018). Effect of bacterial growth rate on bacteriophage population growth rate. Microbiologyopen 7, e00558. doi: 10.1002/mbo3.558
Oschlies A., Garcon V. (1998). Eddy-induced enhancement of primary production in a model of the North Atlantic Ocean. Nature 394, 266–269. doi: 10.1038/28373
Palenik B., Ren Q., Dupont C. L., Myers G. S., Heidelberg J. F., Badger J. H., et al. (2006). Genome sequence of Synechococcus CC9311: Insights into adaptation to a coastal environment. Proc. Natl. Acad. Sci. U.S.A. 103, 13555–13559. doi: 10.1073/pnas.0602963103
Parada V., Herndl G. J., Weinbauer M. G. (2006). Viral burst size of heterotrophic prokaryotes in aquatic systems. J. Mar. Biol. Assoc. United Kingdom 86, 613–621. doi: 10.1017/S002531540601352X
Patel A., Noble R. T., Steele J. A., Schwalbach M. S., Hewson I., Fuhrman J. A. (2007). Virus and prokaryote enumeration from planktonic aquatic environments by epifluorescence microscopy with SYBR Green I. Nat. Protoc. 2, 269–276. doi: 10.1038/nprot.2007.6
Pope W. H., Weigele P. R., Chang J., Pedulla M. L., Ford M. E., Houtz J. M., et al. (2007). Genome sequence, structural proteins, and capsid organization of the cyanophage Syn5: A “horned” bacteriophage of marine Synechococcus. J. Mol. Biol. 368, 966–981. doi: 10.1016/j.jmb.2007.02.046
Proctor L. M., Fuhrman J. A. (1990). Viral mortality of marine bacteria and cyanobacteria. Nature 343, 60–62. doi: 10.1038/343060a0
Rowe J. M., Debruyn J. M., Poorvin L., Lecleir G. R., Johnson Z. I., Zinser E. R., et al. (2012). Viral and bacterial abundance and production in the Western Pacific Ocean and the relation to other oceanic realms. FEMS Microbiol. Ecol. 79, 359–370. doi: 10.1111/fem.2011.79.issue-2
Sabehi G., Shaulov L., Silver D. H., Yanai I., Harel A., Lindell D. (2012). A novel lineage of myoviruses infecting cyanobacteria is widespread in the oceans. Proc. Natl. Acad. Sci. U.S.A. 109, 2037–2042. doi: 10.1073/pnas.1115467109
Šimek K., Pernthaler J., Weinbauer M. G., Hornák K., Dolan J. R., Nedoma J., et al. (2001). Changes in bacterial community composition and dynamics and viral mortality rates associated with enhanced flagellate grazing in a mesotrophic reservoir. Appl. Environ. Microbiol. 67, 2723–2733. doi: 10.1128/AEM.67.6.2723–2733.2001
Sullivan M. B., Coleman M. L., Weigele P., Rohwer F., Chisholm S. W. (2005). Three Prochlorococcus cyanophage genomes: Signature features and ecological interpretations. PloS Biol. 3, 0790–0806. doi: 10.1371/journal.pbio.0030144
Sullivan M. B., Huang K. H., Ignacio-Espinoza J. C., Berlin A. M., Kelly L., Weigele P. R., et al. (2010). Genomic analysis of oceanic cyanobacterial myoviruses compared with T4-like myoviruses from diverse hosts and environments. Environ. Microbiol. 12, 3035–3056. doi: 10.1111/j.1462-2920.2010.02280.x
Sullivan M. B., Krastins B., Hughes J. L., Kelly L., Chase M., Sarracino D., et al. (2009). The genome and structural proteome of an ocean siphovirus: A new window into the cyanobacterial “mobilome. Environ. Microbiol. 11, 2935–2951. doi: 10.1111/j.1462-2920.2009.02081.x
Sullivan M. B., Waterbury J. B., Chisholm S. W. (2003). Cyanophages infecting the oceanic cyanobacterium Prochlorococcus. Nature 424, 1047–1051. doi: 10.1038/nature01929
Suttle C. A. (1994). The significance of viruses to mortality in aquatic microbial communities. Microb. Ecol. 28, 237–243. doi: 10.1007/BF00166813
Suttle C. A., Chan A. M. (1994). Dynamics and distribution of cyanophages and their effect on marine Synechococcus spp. Appl. Environ. Microbiol. 60, 3167–3174. doi: 10.1128/aem.60.9.3167-3174.1994
Turner D., Shkoporov A. N., Lood C., Millard A. D., Dutilh B. E., Alfenas-Zerbini P., et al. (2023). Abolishment of morphology-based taxa and change to binomial species names: 2022 taxonomy update of the ICTV bacterial viruses subcommittee. Arch. Virol. 168, 74. doi: 10.1007/s00705-022-05694-2
Waterbury J. B., Valois F. W. (1993). Resistance to co-occurring phages enables marine Synechococcus communities to coexist with cyanophages abundant in seawater. Appl. Environ. Microbiol. 59, 3393–3399. doi: 10.1128/aem.59.10.3393-3399.1993
Weinbauer M. G., Höfle G., Ecol A. M., Hijfle M. G. (1998). Size-specific mortality of lake bacterioplankton by natural virus communities. Aquat Microb. Ecol. 15, 103–113. doi: 10.3354/ame015103
Weinbauer M. G., Peduzzi P. (1994). Frequency, size and distribution of bacteriophages in different marine bacterial morphotypes. Mar. Ecol. Prog. Ser. 108, 11–20. doi: 10.3354/meps108011
Weinbauer M. G., Wilhelm S. W., Suttle C. A., Pledger R. J., Mitchell D. L. (1999). Sunlight-induced DNA damage and resistance in natural viral communities. Aquat Microb. Ecol. 17, 111–120. doi: 10.3354/ame017111
Wilhelm S. W., Brigden S. M., Suttle C. A. (2002). A dilution technique for the direct measurement of viral production: A comparison in stratified and tidally mixed coastal waters. Microb. Ecol. 43, 168–173. doi: 10.1007/s00248-001-1021-9
Wilhelm S. W., Matteson A. R. (2008). Freshwater and marine virioplankton: A brief overview of commonalities and differences. Freshw. Biol. 53, 1076–1089. doi: 10.1111/j.1365-2427.2008.01980.x
Wilhelm S. W., Weinbauer M. G., Suttle C. A., Pledger R. J., Mitchell D. L. (1998). Measurements of DNA damage and photoreactivation imply that most viruses in marine surface waters are infective. Aqua1 Microb. Ecol. 14, 215–222. doi: 10.3354/ame014215
Wilson W. H., Carr N. G., Mann N. H. (1996). The effect of phosphate status on the kinetics of cyanophage infection in the oceanic cyanobacterium Synechococcus sp. WH7803. J. Phycol. 32, 506–516. doi: 10.1111/j.0022-3646.1996.00506.x
Wommack K. E., Colwell R. R. (2000). Virioplankton: Viruses in aquatic ecosystems. Microbiol. Mol. Biol. Rev. 64, 69–114. doi: 10.1128/MMBR.64.1.69-114.2000
Keywords: virus production rates, virioplankton, cyanophage, eddies, NPSG
Citation: Weissenbach J, Goldin S, Hulata Y and Lindell D (2024) Differences in cyanophage and virioplankton production dynamics in eddies of opposite polarity in the North Pacific Subtropical Gyre. Front. Mar. Sci. 11:1442290. doi: 10.3389/fmars.2024.1442290
Received: 01 June 2024; Accepted: 31 July 2024;
Published: 19 August 2024.
Edited by:
Danny Ionescu, Leibniz-Institute of Freshwater Ecology and Inland Fisheries (IGB), GermanyReviewed by:
Qinglu Zeng, Hong Kong University of Science and Technology, Hong Kong SAR, ChinaClara A. Fuchsman, University of Maryland, College Park, United States
Julia M. Brown, Bigelow Laboratory For Ocean Sciences, United States
Copyright © 2024 Weissenbach, Goldin, Hulata and Lindell. This is an open-access article distributed under the terms of the Creative Commons Attribution License (CC BY). The use, distribution or reproduction in other forums is permitted, provided the original author(s) and the copyright owner(s) are credited and that the original publication in this journal is cited, in accordance with accepted academic practice. No use, distribution or reproduction is permitted which does not comply with these terms.
*Correspondence: Debbie Lindell, ZGxpbmRlbGxAdGVjaG5pb24uYWMuaWw=
†Present address: Julia Weissenbach, Department of Biology and Environmental Science, Centre for Ecology and Evolution in Microbial Model Systems (EEMiS), Linnaeus University, Kalmar, Sweden