 Dongfeng Xie
 Yuwen Chen2
 Wen Wei
 Jiali Gu
95% of researchers rate our articles as excellent or good
Learn more about the work of our research integrity team to safeguard the quality of each article we publish.
Find out more
ORIGINAL RESEARCH article
Front. Mar. Sci. , 12 August 2024
Sec. Coastal Ocean Processes
Volume 11 - 2024 | https://doi.org/10.3389/fmars.2024.1440754
The Changjiang Estuary and Hangzhou Bay system has experienced river damming and estuarine engineering in the last decades. However, few studies focused on the shifts in its sediment dynamics due to such human activities. In this study multi-decadal development of sediment dynamics in the transitional zone of the two large estuaries was analyzed, based on the synchronous hydrographic data in the winter of 2023, 2014 and 1983. The results revealed significant changes in regional hydrodynamics and suspended sediment transport, despite the continuous good correlations between the current velocity, suspended sediment concentration (SSC), water/sediment fluxes and tidal range. Specifically, the current velocity has been decreased by 8 - 21% after 2014, mainly due to the land reclamation (implemented around 2016) with several groins stretching into deep water and altering alongshore hydrodynamics. The SSC has decreased further by 29 - 38% in addition to the significant decrease during 1983 - 2014. The SSC changes are related to the combination of river damming which induced sediment load reduction and land reclamation which enclosed a large amount of sediment. Furthermore, the sediment transport from Changjiang Estuary to Hangzhou Bay decreased by 36% - 53%, explaining the observed bed erosion in the northern bay mouth in recent years. The findings are also relevant for studies on sediment dynamics in other large estuaries worldwide.
Estuaries feature extraordinary sediment dynamics due to intense river and sea interaction, and this has been further complicated by human activities in the last one or two centuries (Milliman, 1997; Syvitski et al., 2005; Wang et al., 2015; Fan et al., 2019). Sediment dynamics is among the most crucial processes in estuarine environment, having close connections with morphological evolution, channel and harbor siltation in estuaries, etc (Postma, 1961; Allen et al., 1980). Suspended sediment also acts as the major carrier of nutrients, heavy metals and organic matter and hence strongly affects the primary productivity, the delivery of pollution and biogeochemical processes (Oliveira et al., 2021). Understanding suspended sediment dynamics in response to human activities is therefore of major significance.
The Changjiang Estuary and Hangzhou Bay are two adjacent large estuarine systems on the East China Sea coast (Figure 1). The huge riverine sediment from the Changjiang River not only formed the Changjiang subaqueous delta and alluvial islands, but also dispersed southerly into Hangzhou Bay (e.g., Milliman et al., 1985; Su and Wang, 1989; Chen et al., 1990; Zhang et al., 2015). The Changjiang riverine sediment input, through a passage along the south flank of the Changjiang Estuary (Figure 1B), has played a significant role on the evolution of Hangzhou Bay. In the last decades, the sediment load of the Changjiang River has been drastically reduced (Figure 2), due to dam construction and soil conservation in the catchment, particularly since the construction and operation of the Three Gorges Dam in 2003 (Gao and Wang, 2008; Milliman and Farnsworth, 2011; Yang et al., 2011; Wu et al., 2023).
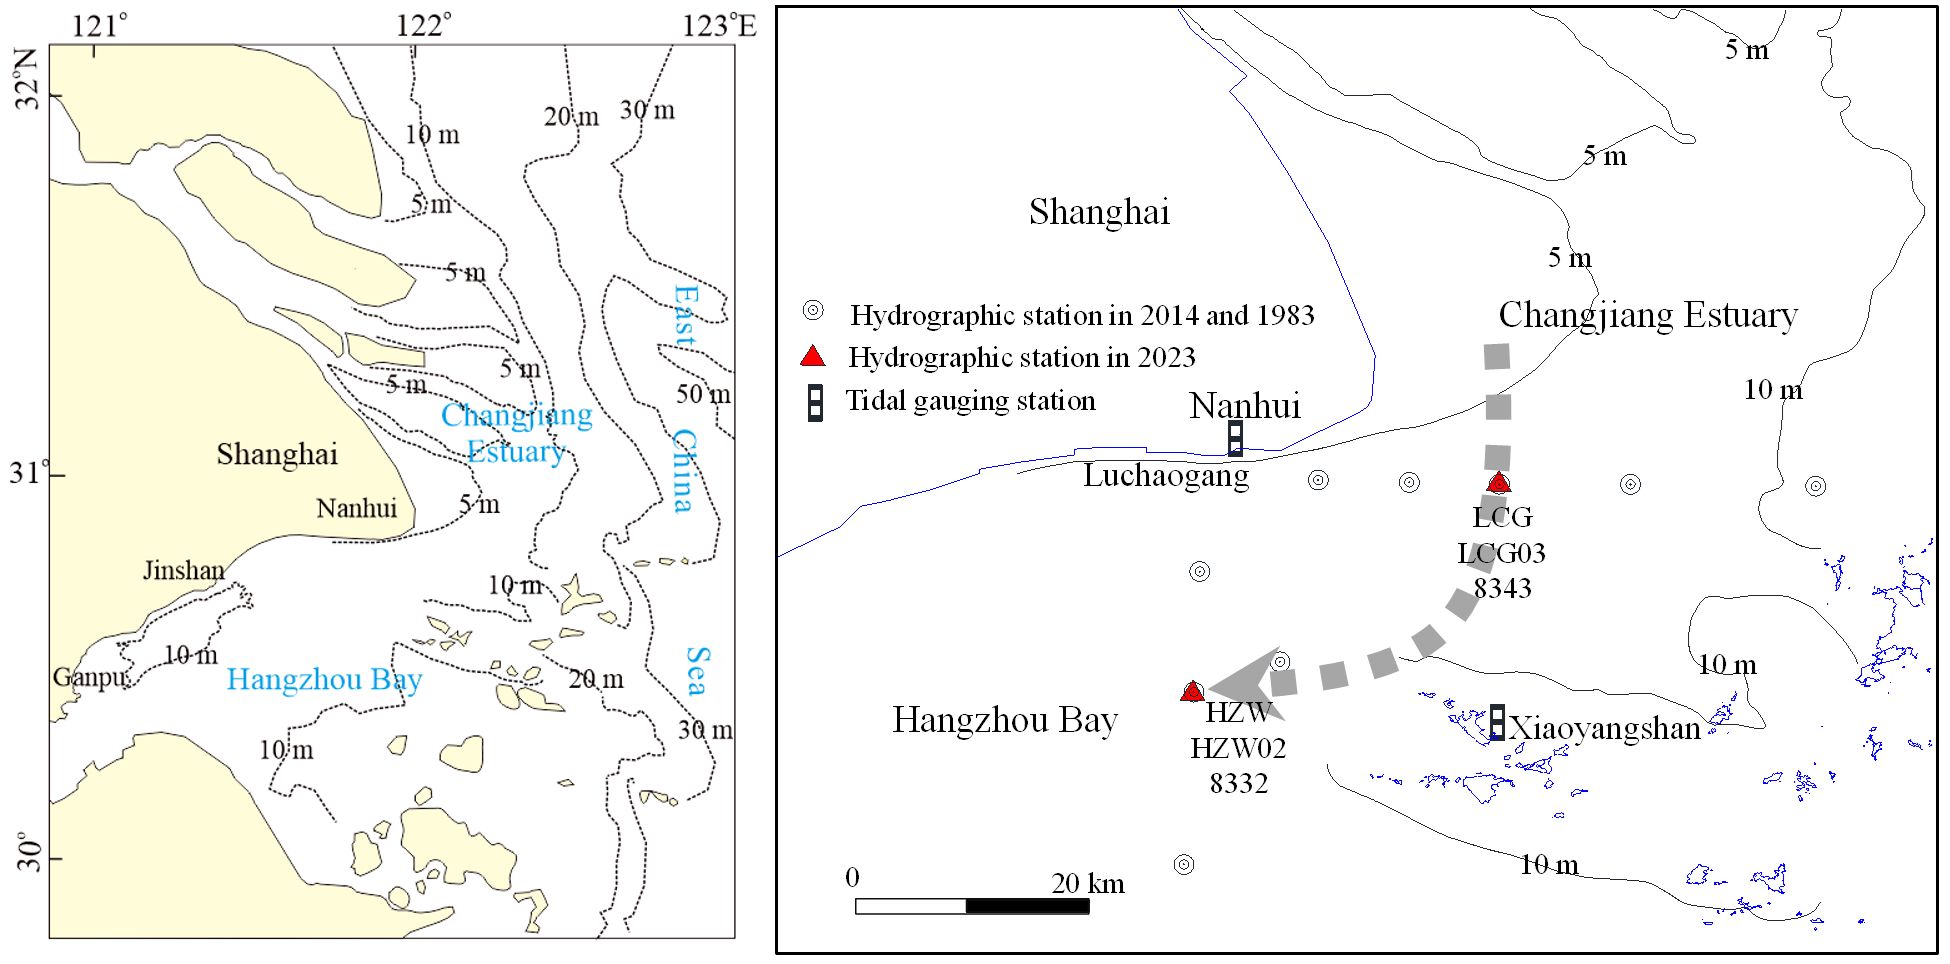
Figure 1. Map of the Changjiang Estuary and Hangzhou Bay (A) and locations of hydrographic stations (B). LCG and HZW are the stations in the 2023 cruise, LCG03 and HZW02 are the stations in the 2014 cruise, and 8343 and 8332 are the stations in the 1983 cruise. The dashed line in (B) denotes the sediment passage from the Changjiang Estuary directly into Hangzhou Bay (Chen et al., 2001).
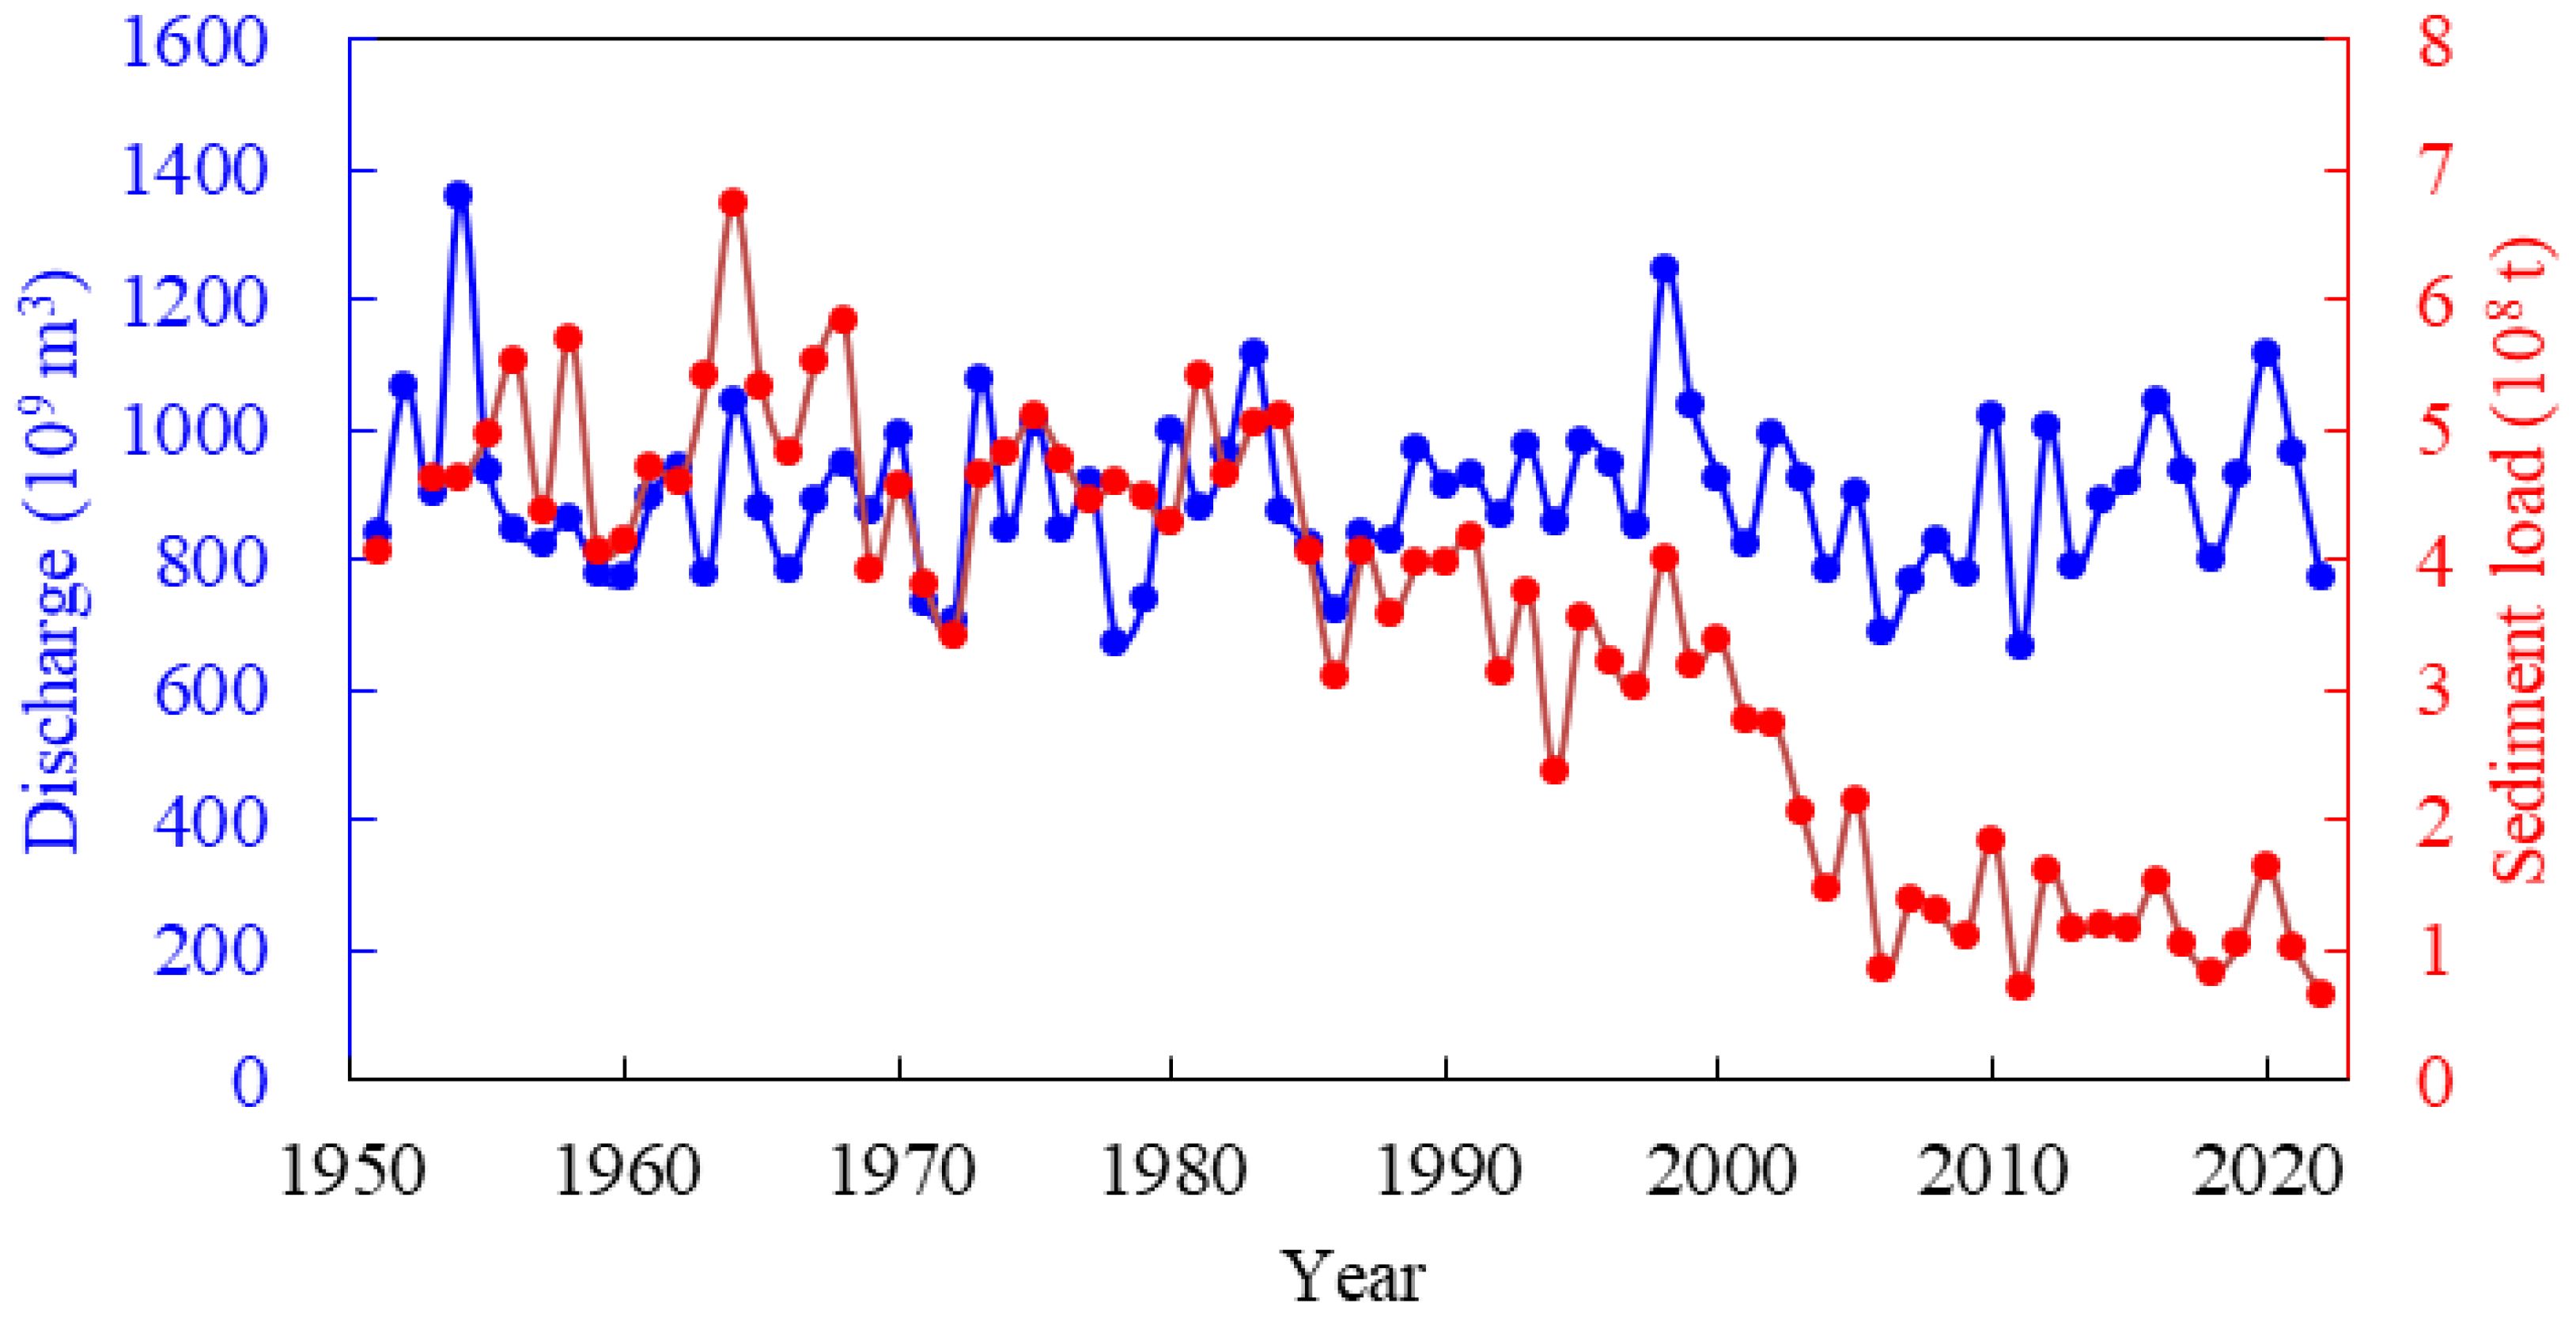
Figure 2. Temporal variations of annual water and sediment discharges at Datong station during 1951 -2022 (data from the Changjiang River Hydraulic Engineering Committee).
Several studies have focused on the long - term trends and spatial patterns of suspended sediment concentration (SSC) in the Changjiang Estuary and the adjacent area, based on multi - year time series of hydrographic observations or remote sensing (e.g., Li et al., 2012; Dai et al., 2013; Shen et al., 2013; Yang et al., 2015; Luo et al., 2022). The SSC in the inner Changjiang Estuary, mainly controlled by river discharge, has evidently decreased by more than 50%. Based on the hydrographic data at the outer Changjiang Estuary and Hangzhou Bay mouth in the summer and winter of 1980s and 2014, Xie et al. (2017a) found that the changes of SSCs at the outer Changjiang Estuary and northern Hangzhou Bay mouth was insignificant in summer whereas SSCs decreased significantly in winter. After 2014 the sediment load of the Changjiang River fluctuates around 1.2 × 10⁸ t/a, and its decrease has become less significant (Figure 2). However, few field data have been reported on the variations of sediment dynamics in this period. It is valuable to detect whether the SSC decrease has been stopped or not.
Both the Changjiang Estuary and Hangzhou Bay are among the largest estuaries worldwide. Close attention has always been paid to their sediment exchange. The nearshore of the Nanhui flat is the transitional zone between the two estuaries and the main venue of their water and sediment exchanges (Li, 1991; Chen et al., 2001). It is the largest marginal tidal flat in the Changjiang Estuary, playing a tremendous role in storm protection and land formation for Shanghai. In the last decades, large areas of tidal flats in the Changjiang Estuary have been reclaimed for socioeconomic development. Many studies have focused on the impacts of tidal flat reclamation on the morphological evolution in the estuaries or the tidal flat themselves (Fan et al., 2017; Wei et al., 2017; Luan et al., 2018; Guo et al., 2021). However, the sediment dynamics in the transitional zone of the two large estuaries under human activities have hardly been addressed, probably due to lack of hydrographic data over a decadal timescale.
In January of 2023, a hydrographic survey with synchronous observations at different locations was carried out in the transitional zone. The locations of the hydrographic stations were consistent with those in the winter cruises of 2014 and 1983 (Xie et al., 2017a). The data in the three cruises allow a comparison of sediment dynamics in this region over multiple timescales. This study attempts to: (1) delineate the recent changes of sediment dynamics in the transitional zone; (2) examine the linkage between the delineated sediment dynamics and human activities like river damming and estuarine reclamation; and (3) analyze the implications of sediment dynamics on the recent morphological evolution.
The Changjiang Estuary has a pattern of three - order bifurcation and has four outlets into the sea (Figure 1A). The Changjiang River is one of the largest rivers in the world, third in length (6,300 km), fourth in sediment load (used to be 4.86×10⁸ t/a) and fifth in water discharge (9.25×10⁹ m3/a) (Milliman and Farnsworth, 2011). The semi - diurnal tide is a main driving force behind the horizontal water flow, with the tidal range being 2 - 4 m at the mouth. A large quantity of deposited sediments are resuspended and transported southward by the longshore current driven by the prevailing north - northeasterly winds during winter (Chen et al., 1985; Milliman et al., 1985). Hangzhou Bay is located immediately south of the Changjiang Estuary. The width is about 100 km at the mouth and narrows to about 20 km some 100 km to the west. The bay has an average depth of about 10 m. Its bottom topography is relatively flat in the mouth area. With the sediment input from Changjiang River, Hangzhou Bay has been accreting with a rate of around 1.1 cm/a (Han et al., 2003).
The recent evolution of the Changjiang Estuary and Hangzhou Bay has suffered drastic changes from intensive artificial interferences in Changjiang river catchment and within the Changjiang Estuary. The operation of the Three Gorges Dam in 2003 has significantly decreased Changjiang riverine sediment by up to 70% (Yang et al., 2011). In addition, the Changjiang Estuary has also been largely influenced by estuarine reclamation projects for the urban expansion of Shanghai. More than 1200 km2 of land has been reclaimed from 1950 to 2010 (Wei et al., 2017) and about 202 km2 of land was reclaimed within the Nanhui flat from 1958 to 2013 (Wei et al., 2019).
The Luchaogang transect at the outer Changjiang Estuary and the Hangzhou Bay - mouth transect are important interfaces of the water and sediment exchanges between the Changjiang Estuary and Hangzhou Bay (Wan et al., 2009; Xie et al., 2017a), see Figure 1. The Luchaogang transect is located at the front of Luchaogang tidal gauge in the east - west direction, monitoring the southern water and sediment dispersion from the Changjiang Estuary. The bay - mouth transect is located at the Hangzhou Bay mouth in the north - south direct, representing the water and sediment fluxes entering and leaving the bay.
As above-mentioned, winter is the main season when the Changjiang sediment is resuspended and transported southward. To monitor the recent sediment dynamic variations in the transitional zone of the Changjiang Estuary and Hangzhou Bay, a synchronous hydrographic survey was carried out at two stations in the winter of 2023. The LCG station was located at the middle of the Luchaogang transect and coincided with the LCG03 station of the 2014 cruise and the 8343 station of the 1983 cruise. The HZW station was located at the northern Hangzhou Bay mouth and coincided with the HZW02 station in the 2014 cruise and the 8332 station in the 1983 cruise. The average water depths at LCG and HZW stations were 11.1 m and 12.0 m, respectively. Preliminary analysis shows that the water and sediment transport per unit width at the LCG03 and HZW02 correlated well with the water and sediment fluxes across the Luchaogang transect and northern bay - mouth transect in the winter of 2014, respectively (Figure 3). Moreover, the current velocities and SSCs at various stations along the Luchaogang transect and the northern bay - mouth transect showed similar seasonal and long - term variations (Xie et al., 2017a). Hence the two stations can represent the overall water and sediment transport of the two transects.

Figure 3. The correlations between the water (A) and sediment (B) fluxes per unit width at LCG03 and HZW02 and the water and sediment fluxes across the Lucgaogang transect and the bay - mouth transect in the 2014 cruise.
The measurements were carried out on January 7 - 8 (spring tide), 10 - 11 (intermediate tide) and 13 - 14 (neap tide), 2023. The corresponding tidal range at Luchaogang gauging station was 2.92 - 4.48 m, 3.08 - 4.29 m and 2.91 - 3.78 m, respectively and the mean tidal range was 3.77 m, 3.66 m and 3.31 m, respectively (Figure 4A). At both stations, water depth, current velocity and SSC were measured for two tidal cycles (25 h). The current velocity was measured by an Acoustic Doppler Current Profiler (ADCP) and SSC was measured by an Optical BackScatter Sensor (OBS) at the surface, 0.2 H, 0.4 H, 0.6 H, 0.8 H and the bottom, respectively, where H is the water depth. The OBS instruments were calibrated against discrete water samples. Meanwhile, the tidal level data at Luchaogang during the same period were collected.
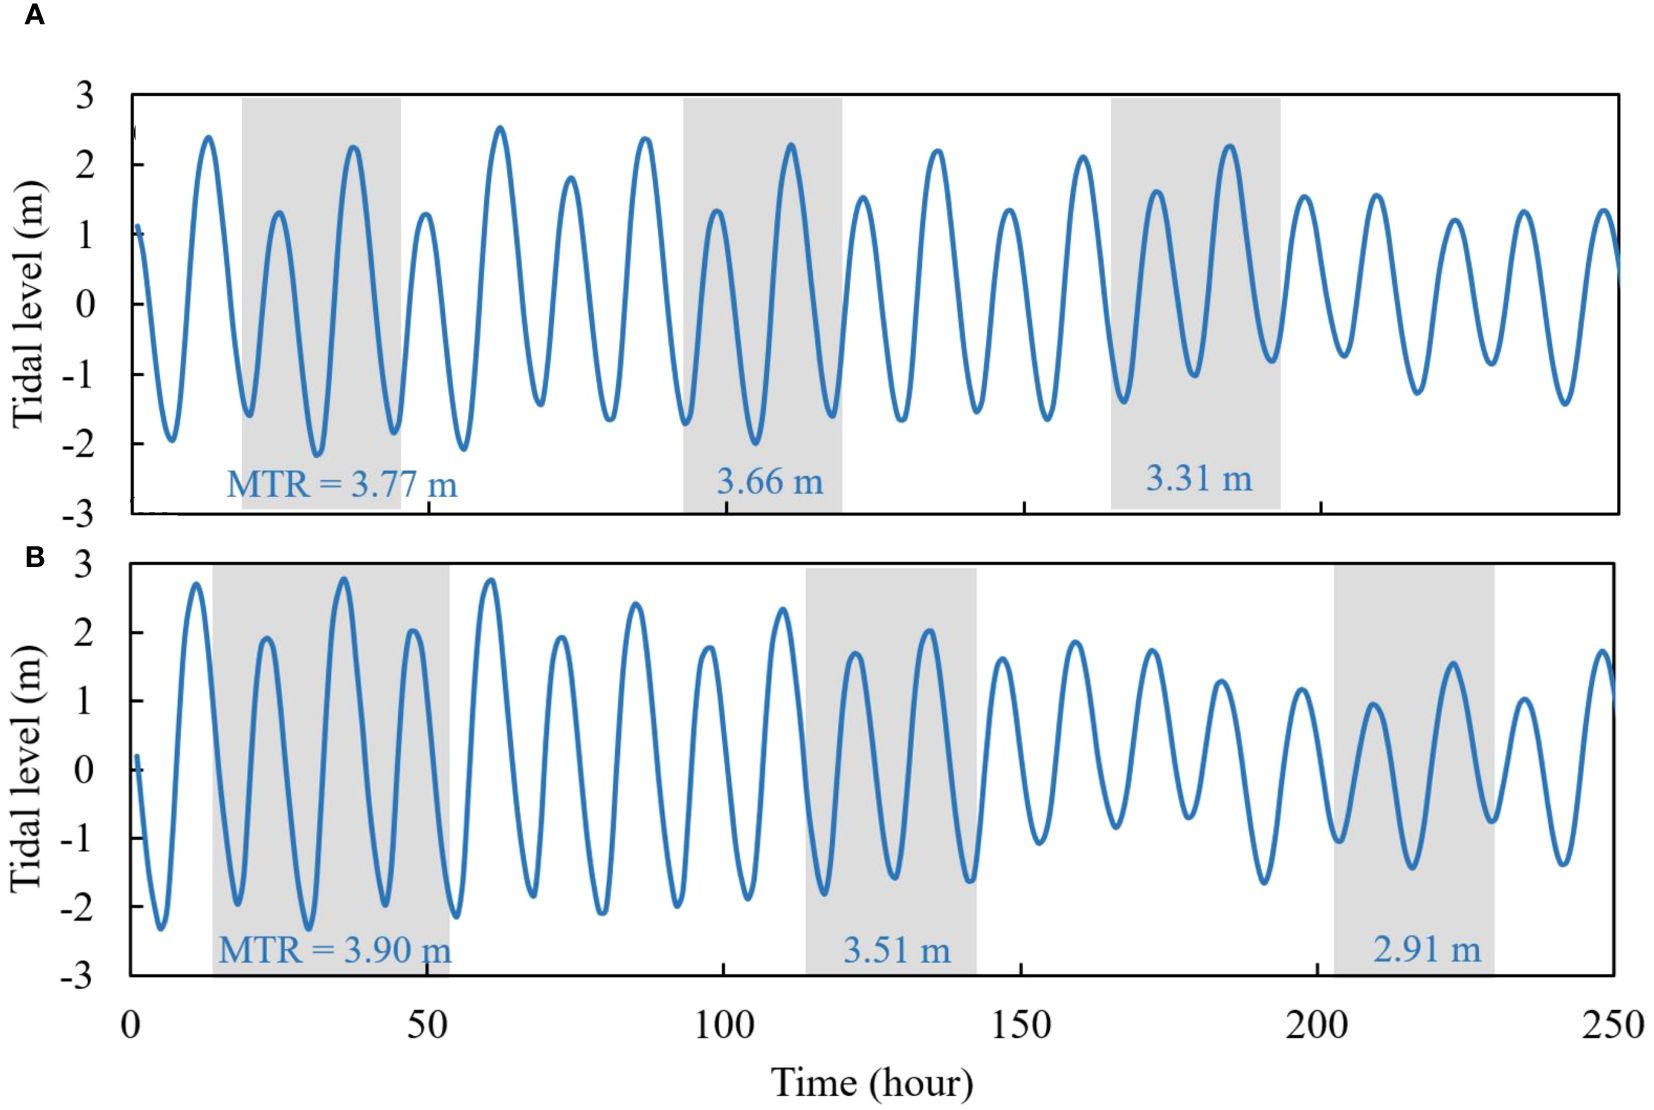
Figure 4. Tidal series of the tidal level and the mean tidal range (MTR) at Luchaogang gauging station during the 2023 (A) and 2014 (B) cruises. The shades denote the periods of hydrographic surveys.
To compare the recent variations of sediment transport, the hydrographic data at stations LCG03, HZW02, 8343 and 8332 in the 2014 and 1983 cruises were collected as well. The measurements in 2014 were carried out on January 2 - 4 (spring tide), 6 - 7 (intermediate tide) and 10 - 11 (neap tide). The corresponding tidal range at Luchaogang was 2.97 - 5.10 m, 1.97 - 4.74 m and 2.29 - 3.70 m, respectively and the mean tidal range was 3.90 m, 3.51 m and 2.91 m, respectively (Figure 4B). The measurements in 1983 were carried out on December 21 - 22 and 26 - 27 for the Luchaogang transect and bay - mouth transect, respectively. The tidal range at Luchaogang was between 2.26 and 4.29 m, representing neap to intermediate tides. The measurements at both stations took place for at least two tidal cycles (25 h). During the spring tide in the winter of the 2014 cruise, the measurement period was 36 h.
Wind conditions were recorded using aerovanes at HZW station and HZW02 station during the measurements in 2023 and 2014, respectively. It was dominated by northerly wind during both cruises. Most of the wind velocities were less than 5.0 m/s. The maximum wind velocities during the 2023 and 2014 cruises were 6.9 m/s and 6.5 m/s, respective, for only 2 - 4 hours (Figure 5). According to the definition for wind speed by Tian et al. (2024), the wind during the cruises was weak (<5.0 m/s) to moderate (5.0 - 9.4 m/s) winds. As the water depths at the two stations are more than 10 m, the influence of wind on the hydrodynamics and sediment transport was minor.
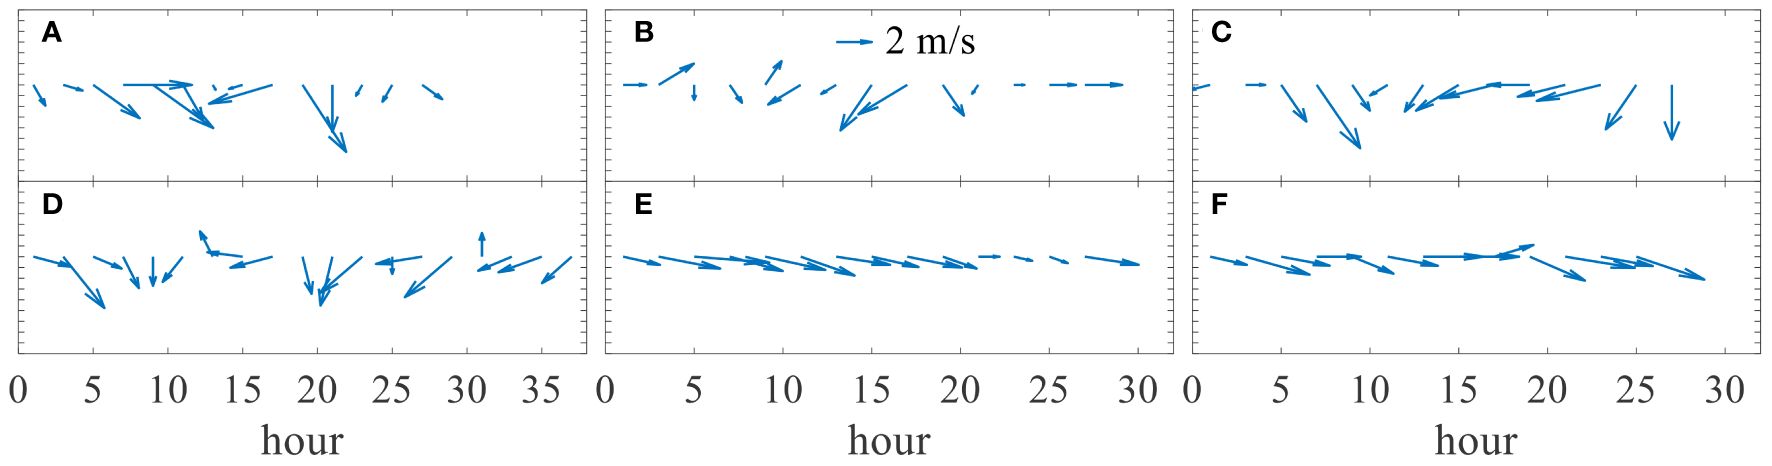
Figure 5. Time series of wind vectors during the spring (A), intermediate (B) and Neap (C) tides of the 2023 cruise and the spring (D), intermediate (E) and neap (F) tides of the 2014 cruise.
There are apparent cyclic variations such as tides and spring - neap cycle, etc., for sediment transport. Subsequently the time series of vertical SSC profiles can be very complex and the individual SSC profiles were multiform (Liu et al., 2014). It is well-known that in estuarine and coastal environments SSC is proportional to a higher power of current velocity and that current velocity is proportional to tidal range. To examine the tidal influences, the relationship between flood or ebb - averaged current velocity and SSC at LCG and HZW stations, i.e., the averages over flood or ebb period, and tidal range at Luchaogang were analyzed. This method favors to unify data from different tidal conditions into the same tidal range for comparison (Xie et al., 2017a) and has been applied to several estuaries on the East China sea coast (e.g., Xie et al., 2018; Zhang et al., 2023). The averaged velocities and SSCs were calculated by the time averaging over a flood or ebb tides. Then the averaged velocities and SSCs at the multi - year mean tidal range (around 3.50 m) during various cruises were obtained by interpolation using the correlations of velocities and SSCs versus tidal range. The water and sediment fluxes per unit width were calculated for various tides,
where and are water and sediment fluxes per unit width, respectively, u is current velocity, c is SSC, T is duration of flood or ebb tide.
Figures 6, 7 illustrate the time series of the vertical profile of current velocity and SSC at LCG and HZW stations in the 2023, 2014 and 1983 cruises, respectively. Figure 8 shows the time series of depth - averaged current velocities and directions at the two stations during the spring, intermediate and neap tides of 2023 and 2014. Both stations were dominated by rectilinear currents. At LCG, the current directions ranged from 250° to 340° during the flood tides and from 50° to 150° during ebb tides. At HZW it ranged from 280° to 320° during the flood tides and 85° to 115° during ebb tides. The directions of the flood and ebb velocities at LCG station deviated southward by about 20° from 2014 to 2023, probably due to the change in the local coastline which would be discussed later. No significant changes occurred in the directions of the current velocities at HZW station.
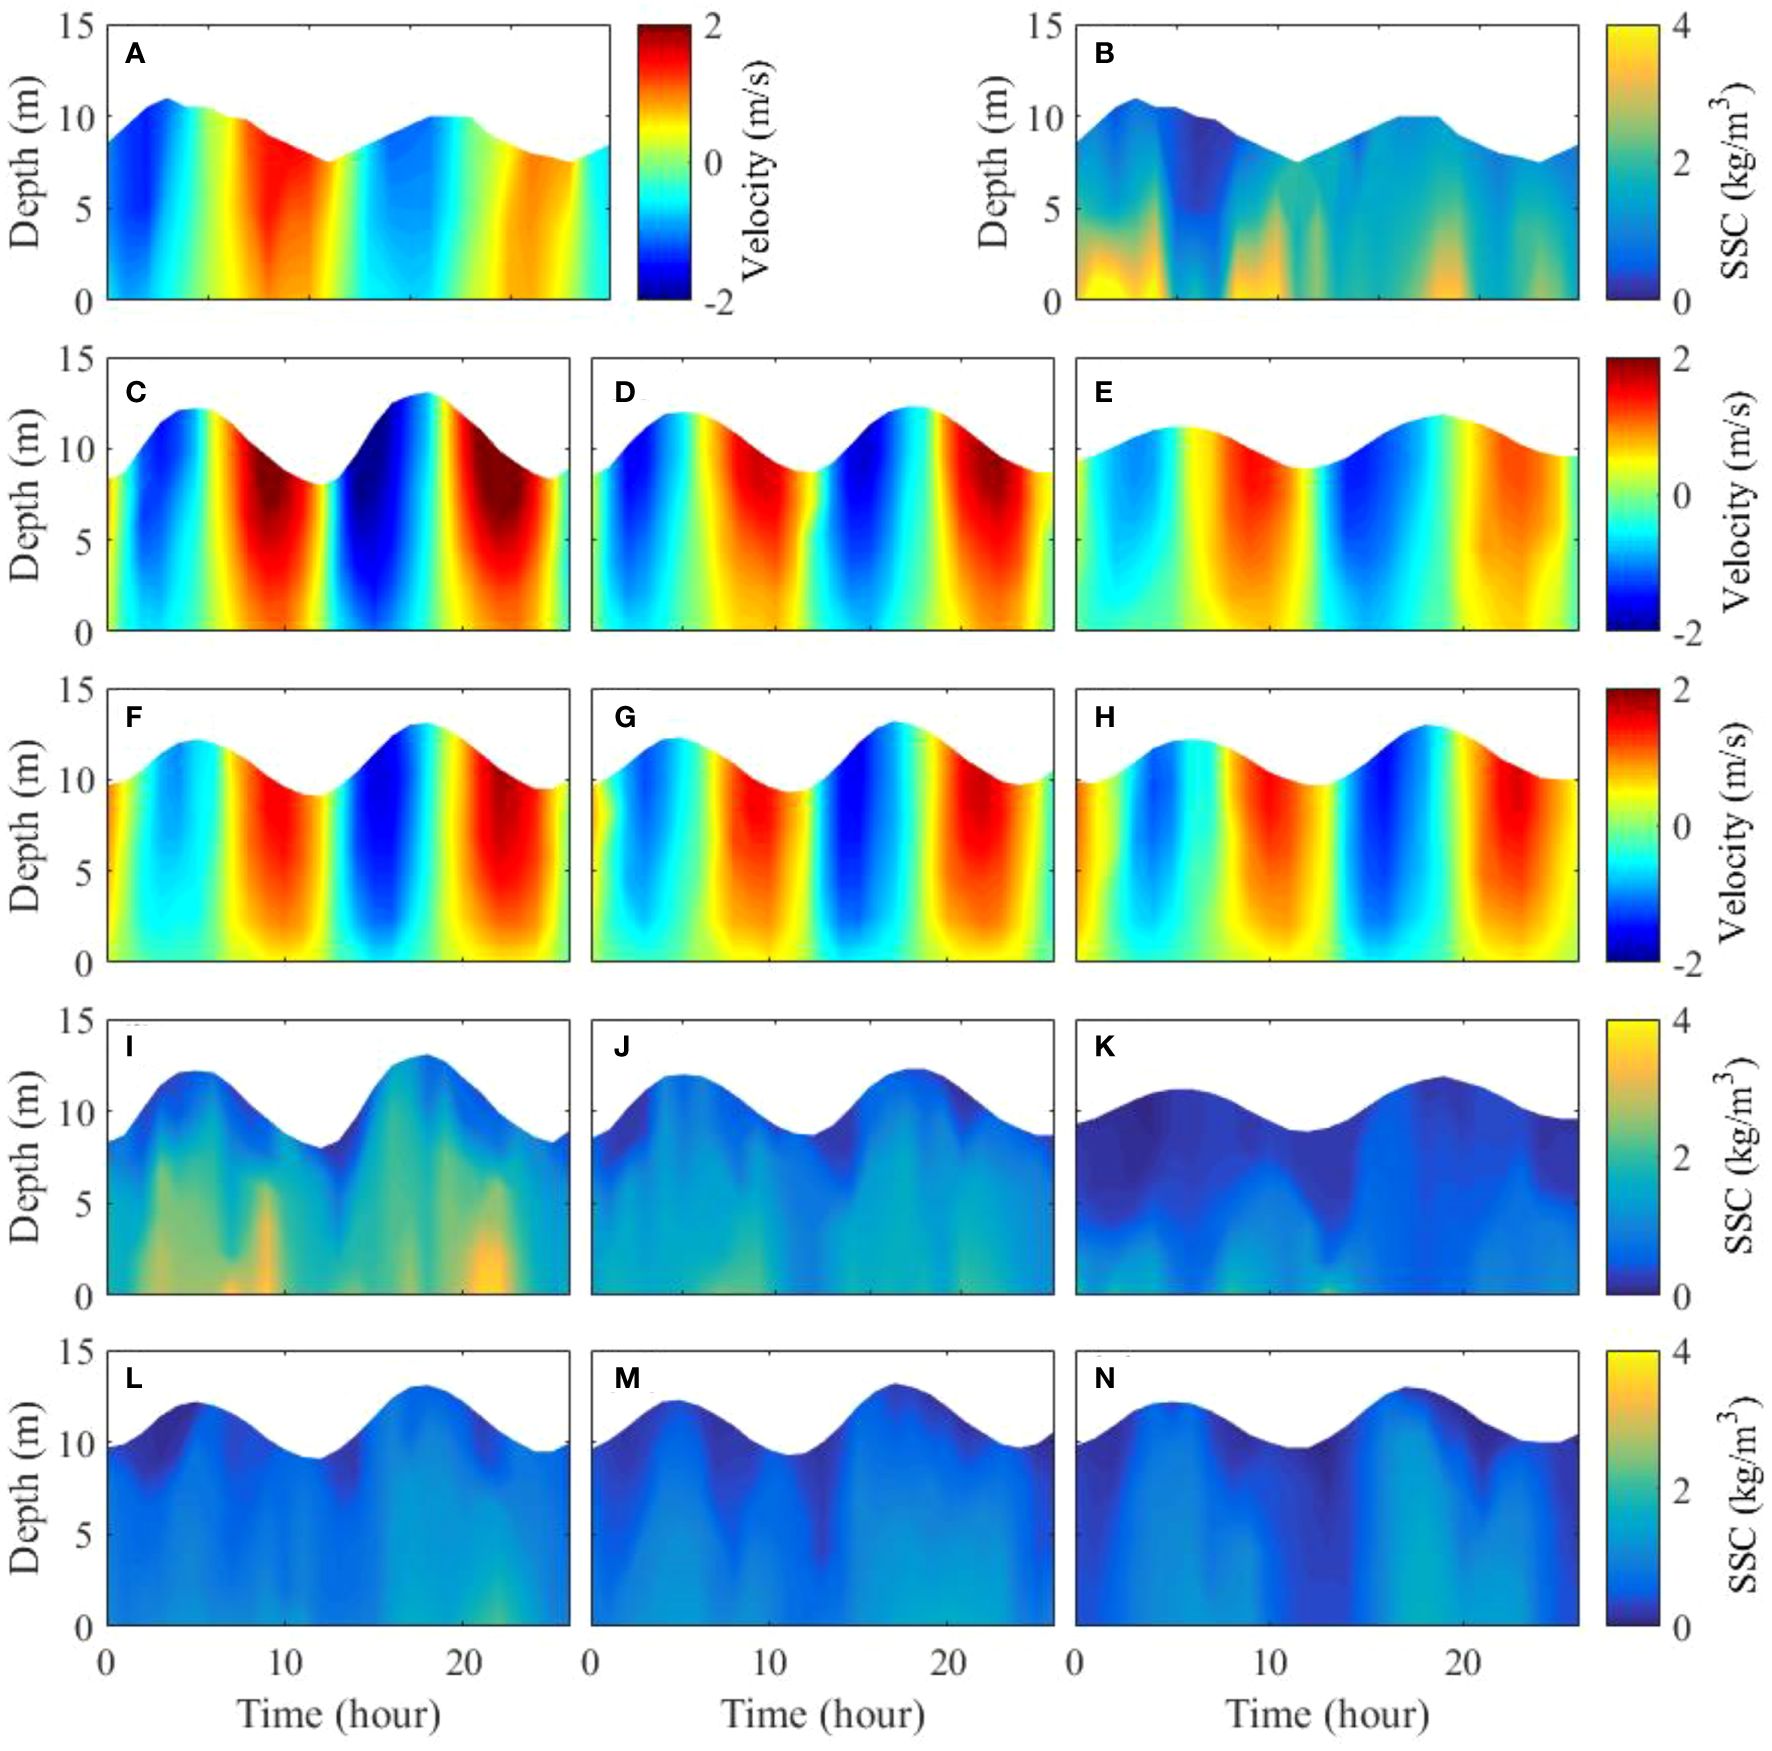
Figure 6. Time series of current velocity and SSC profiles at LCG station. (A, B) velocity and SSC in during the 1983 cruise; (C–E) and (F–H) are velocity during spring, intermediate and neap tides during the 2014 and 2023 cruises, respectively; (I–K) and (L–N) are SSC during spring, intermediate and neap tides during the 2014 and 2023 cruises, respectively.
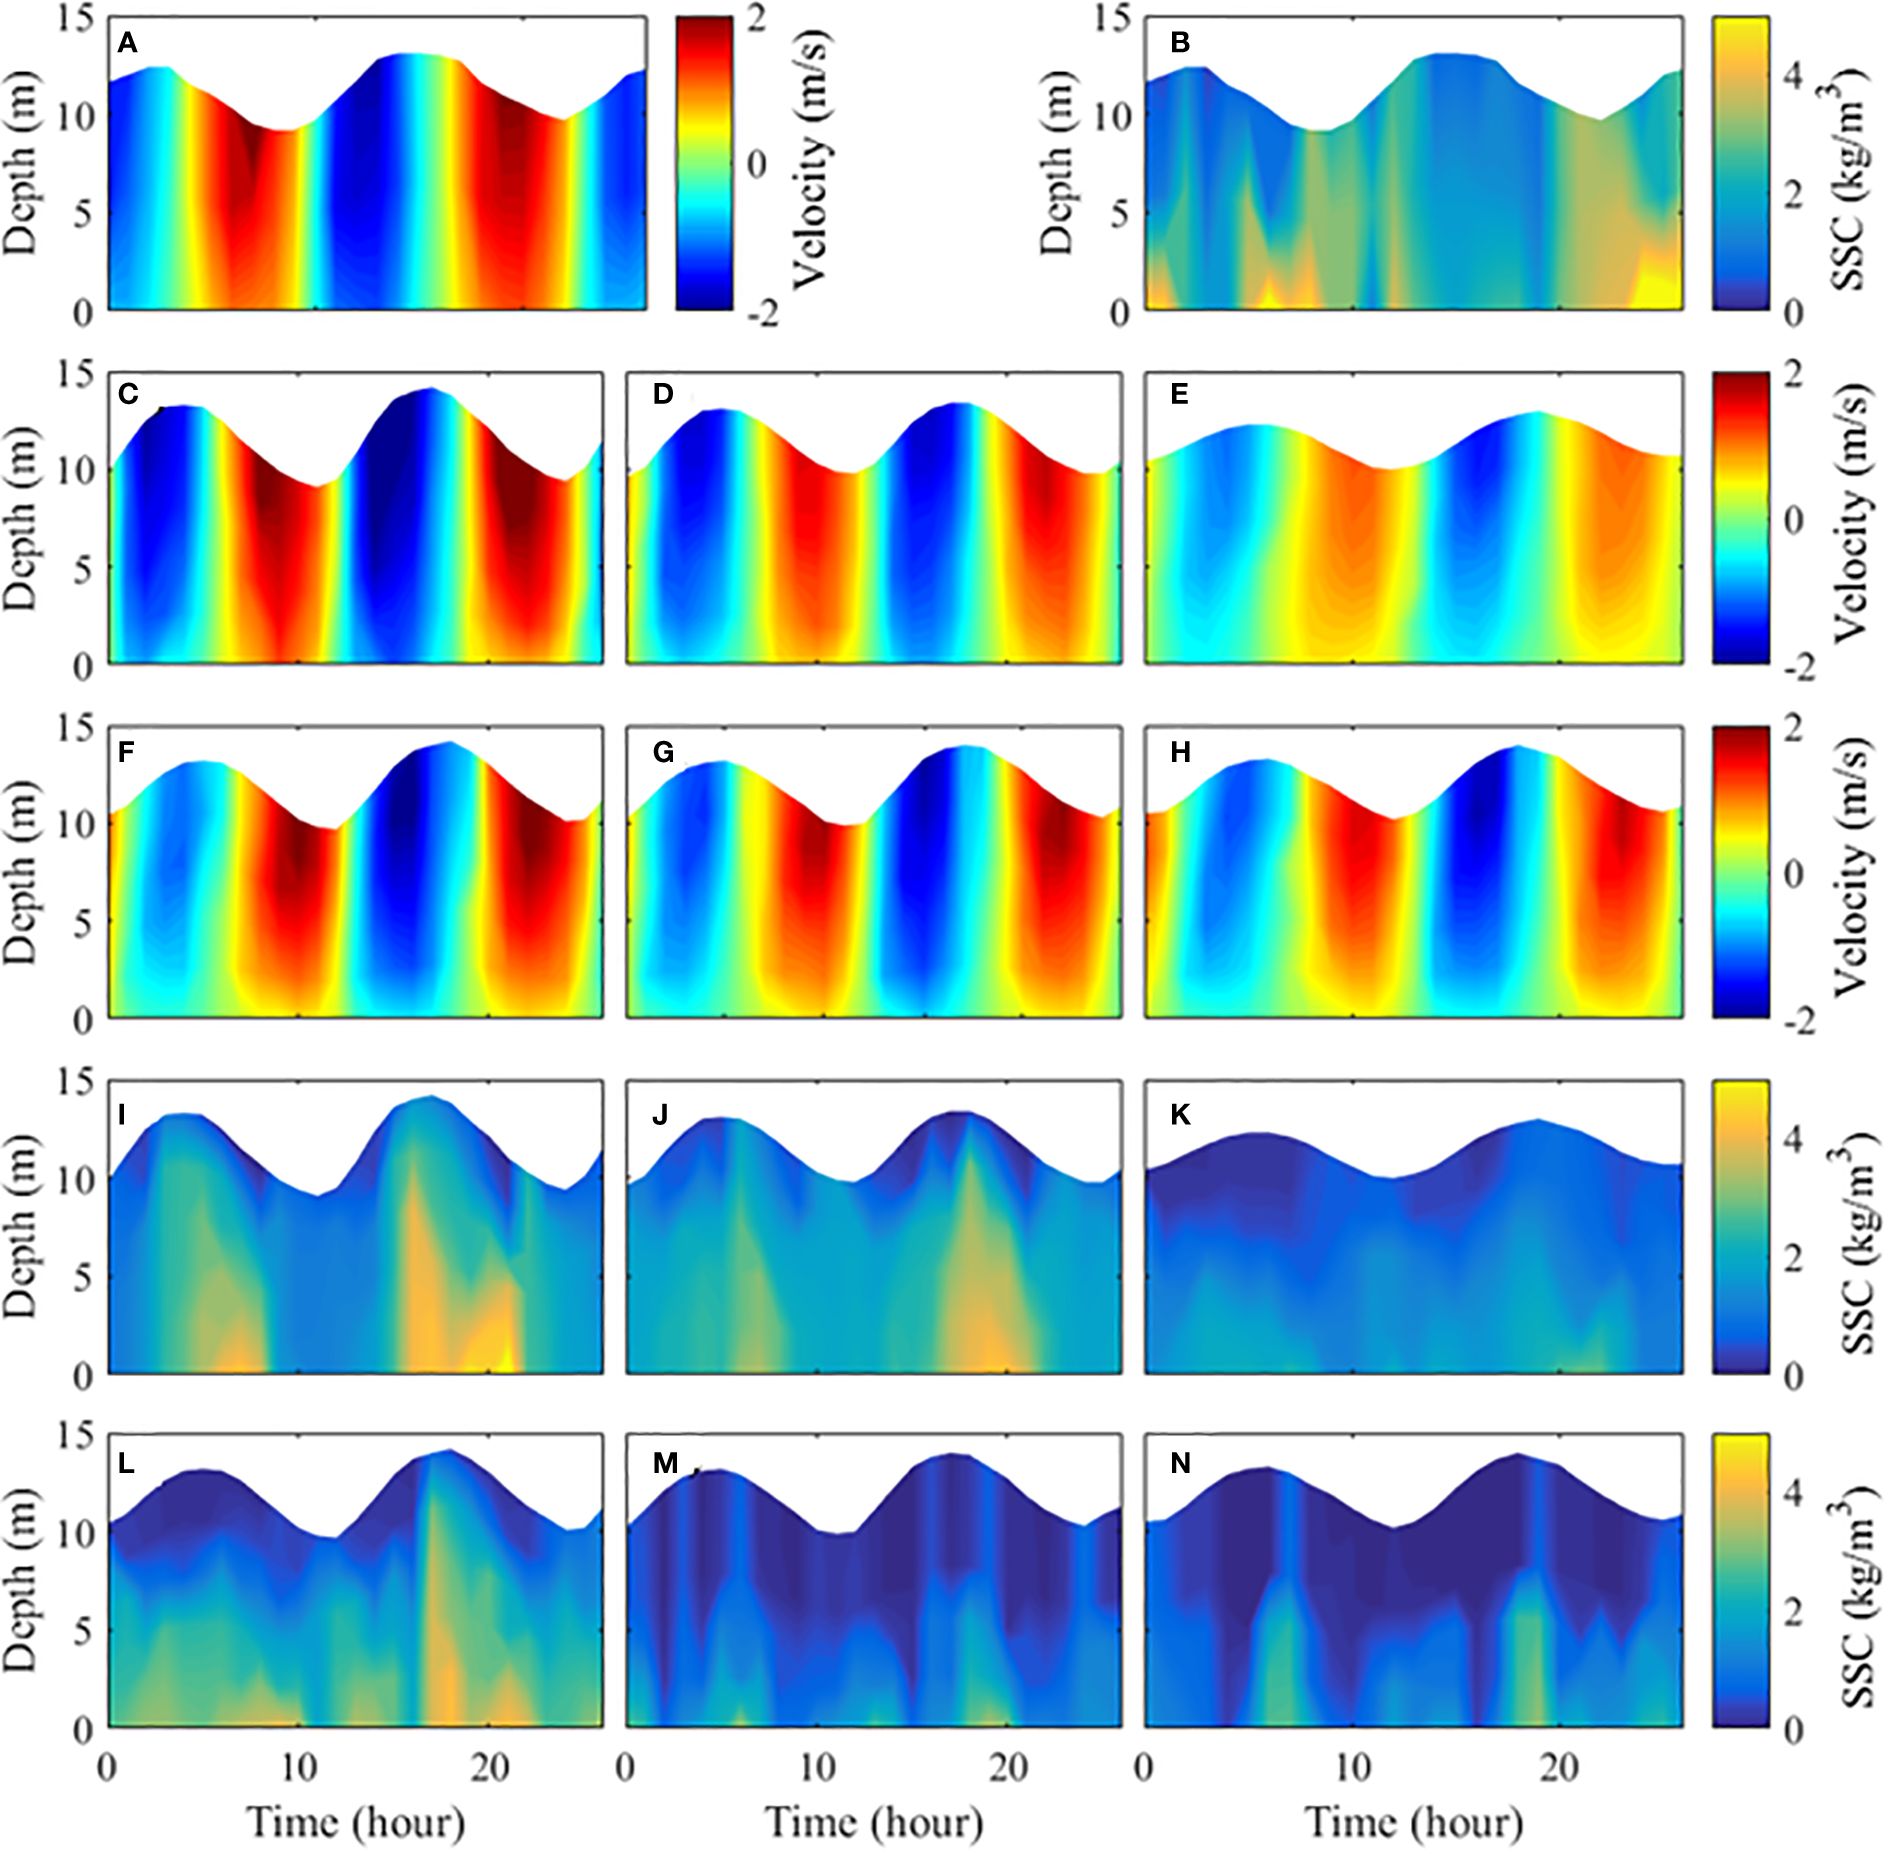
Figure 7. Time series of current velocity and SSC profiles at HZW station. (A, B) velocity and SSC in during the 1983 cruise; (C–E) and (F–H) are velocity during spring, intermediate and neap tides during the 2014 and 2023 cruises, respectively; (I–K) and (L–N) are SSC during spring, intermediate and neap tides during the 2014 and 2023 cruises, respectively.

Figure 8. Time series of depth - averaged velocity and direction at LCG station during spring (A), intermediate (B) and neap (C) tides of the 2023 and 2014 cruises; and at HZW station during spring (D), intermediate (E) and neap (F) tides of the 2023 and 2014 cruises.
The current velocities were strongly correlated with tidal range, with maximum seen during spring tides and minimum during neap tides (Figure 9). In the 2023 cruise the maximum depth - averaged flood and ebb current velocities at LCG were -1.32, -1.31, -1.26 m/s and 1.28, 1.22, 1.16 m/s during spring, intermediate and neap tides, respectively. At HZW they were -1.57, -1.51, -1.37 m/s and 1.54, 1.38, 1.24 m/s during spring, intermediate and neap tides, respectively. Overall, the flood maximum was slightly larger than the ebb maximum, consistent with findings from previous studies that this region is flood - dominated tidal environment (Zhang et al., 2022). Moreover, the current velocity at HZW was about 15% larger than that at LCG, indicating the northern Hangzhou Bay mouth is more dynamic than the outer Changjiang Estuary.
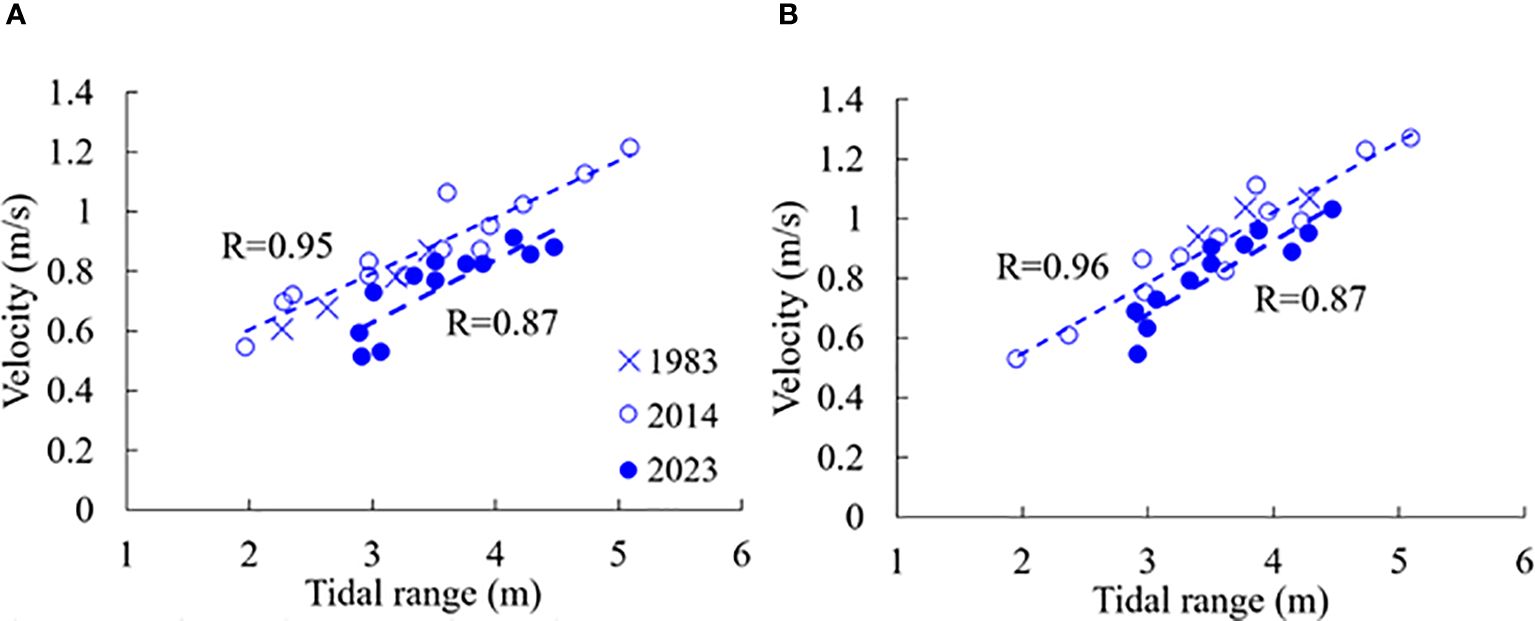
Figure 9. The correlations between flood or ebb - averaged current velocity at LCG (A) and HZW (B) stations and the corresponding tidal ranges during the cruises of 1983, 2014 and 2023.
Similarly, flood or ebb current velocities in the winter of 2014 also correlated well with the corresponding tidal range at Luchaogang (Figure 9). The maximum depth - averaged flood and ebb velocities at LCG during spring, intermediate and neap tides were -1.75, -1.34, -1.16 m/s, and 1.73, 1.52, 1.14 m/s, respectively; the maximum flood and ebb velocities at HZW during spring, intermediate and neap tides were -1.82, -1.43, -1.08 m/s, and 1.77, 1.29, 0.93 m/s, respectively. Significant decrease in current velocity occurred from 2014 to 2023. For example, under the multi - year mean tidal range at Luchaogang, the average velocities at LCG were 0.90 m/s and 0.71 m/s in 2014 and 2023, respectively, indicating a decrease of 21% (Table 1). At HZW station the velocities at the mean tidal range in 2014 and 2023 were 0.90 m/s and 0.83 m/s, respectively, indicating a decreased of 8%. No significant changes occurred from 1983 to 2014.
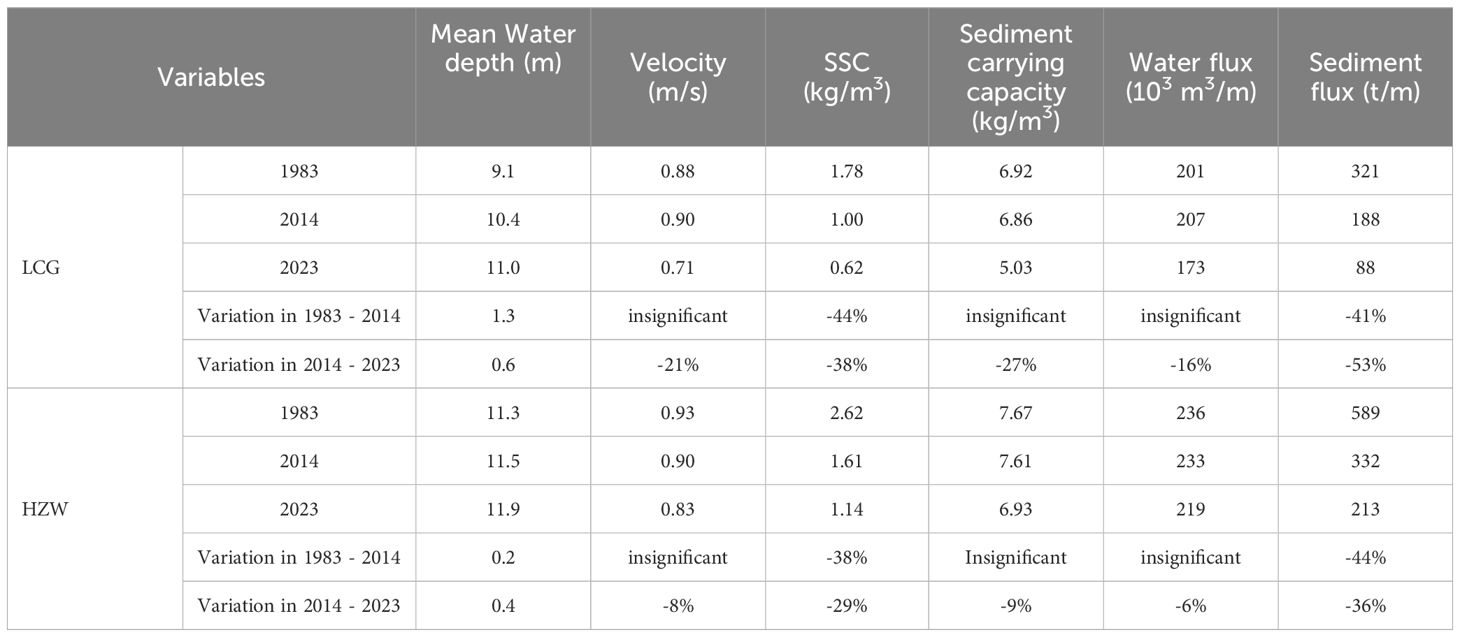
Table 1. Water depth, current velocity and sediment transport under the mean tidal range.
As shown in Figures 6, 7, SSC in the 2023 cruise increased with the increase in current velocity within a tidal cycle, but there existed a time lag of 1- 2 hours. The lag phenomenon results from the time it takes for the fine sediment in suspension to be carried upward or to settle downward (Postma, 1961; Grabemann and Krause, 1989; Shi, 2011). Figure 10 shows the time series of depth - averaged SSC at LCG and HZW. The SSC varied with the spring - neap cycle. The average SSC at LCG station was 0.66, 0.54 and 0.45 kg/m3 during spring, intermediate and neap tides of the 2023 cruise, respectively; and the average SSC at HZW station was 1.37, 0.75 and 0.35 kg/m3, respectively. The SSCs increase from the surface to the bottom during both cruises (Figure 11). The surficial SSC at LCG station was 0.33, 0.23 and 0.29 times of the bottom SSC during spring, intermediate and neap tides, respectively; and at HZW station the ratio was 0.11, 0.13 and 0.12 during spring, intermediate and neap tides, respectively. In the 2014 cruise the average SSC at LCG station was 1.66, 1.07 and 0.50 kg/m3 during spring, intermediate and neap tides, respectively; and those at HZW station was 1.87, 1.84 and 0.96 kg/m3, respectively. The surficial SSC at LCG station was 0.28, 0.26 and 0.23 times of the bottom SSC during spring, intermediate and neap tides, respectively; and the ratio at HZW station was 0.30, 0.35 and 0.23, respectively.
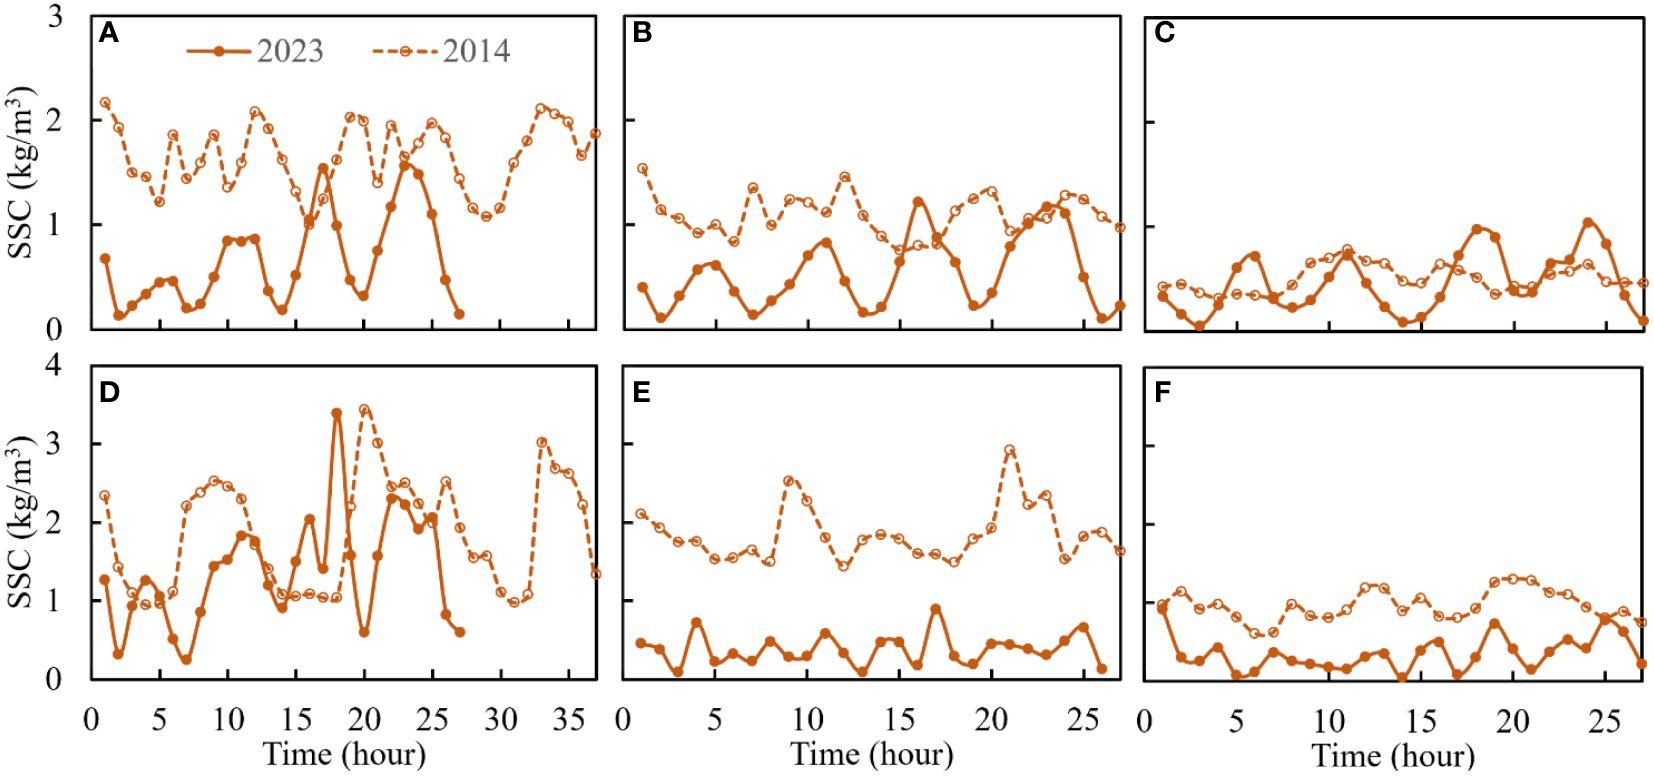
Figure 10. Time series of depth - averaged SSC at LCG station during spring (A), intermediate (B) and neap (C) tides of the 2023 and 2014 cruises; and at HZW station during spring (D), intermediate (E) and neap (F) tides of the 2023 and 2014 cruises.
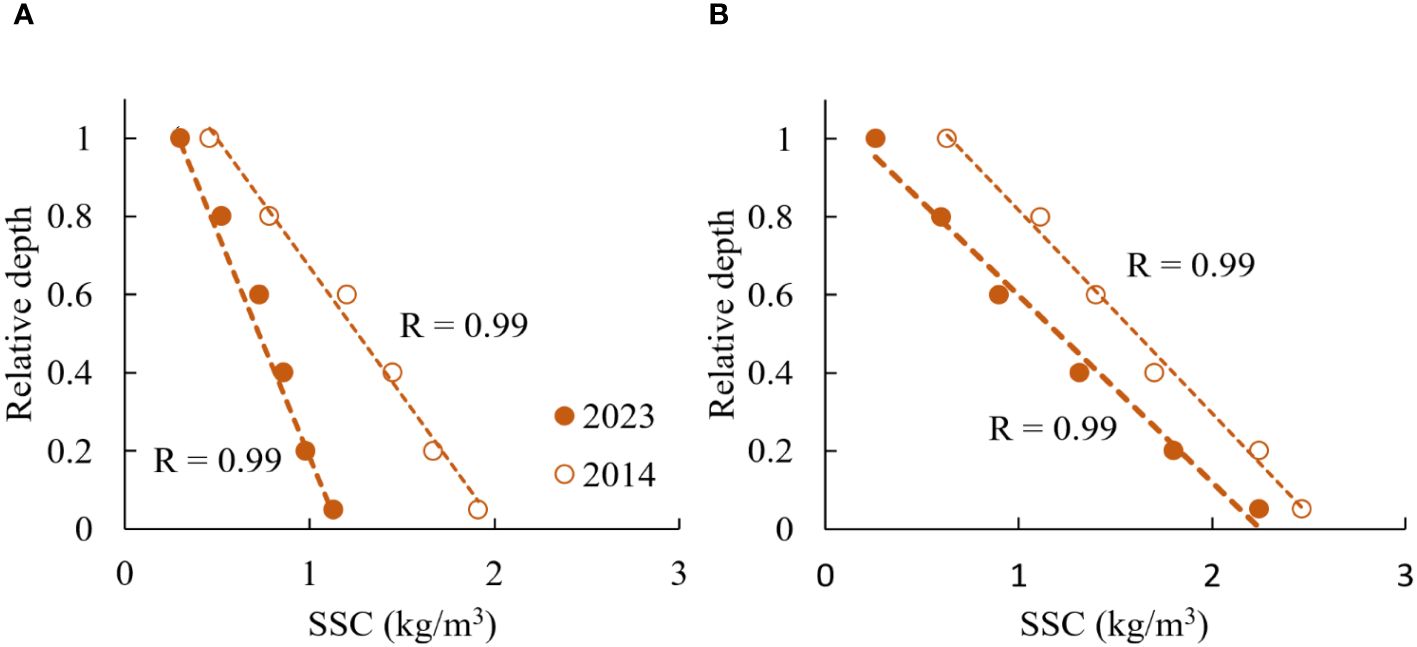
Figure 11. Vertical profiles of the averages of the measured SSC during the two cruises at LCG (A) and HZW (B) stations.
Overall, the vertical distribution of SSC at LCG station was comparable during the 2014 and 2023 cruises, but the SSC at HZW station was more stratified in 2023 than in 2014 (Figures 6, 7). Good relationships also exist between the SSCs at both stations and the corresponding tidal range at Luchaogang during various cruises (Figure 12). The SSCs at both stations have shown decreasing trends during 2014 - 2023. Under the mean tidal range of 3.50 m, SSC at LCG was 1.00 kg/m3 in 2014 and 0.62 kg/m3 in 2023, indicating a decrease of 38%; SSC at HZW was 1.61 kg/m3 in 2014 and 1.14 kg/m3 in 2023, indicating a decrease of 29%. A comparison of the SSC profiles between the 2023 and 2014 cruises suggests that the SSC decreased in all of the vertical layers (Figure 11). The average decreases at the LCG and HZW stations are 38% and 32%, respectively, consistent with the magnitudes of SSC decrease obtained from the correlations between SSC and the tidal ranges. From 1983 and 2023, the SSC at the two stations have decreased by 65% and 56%, respectively.
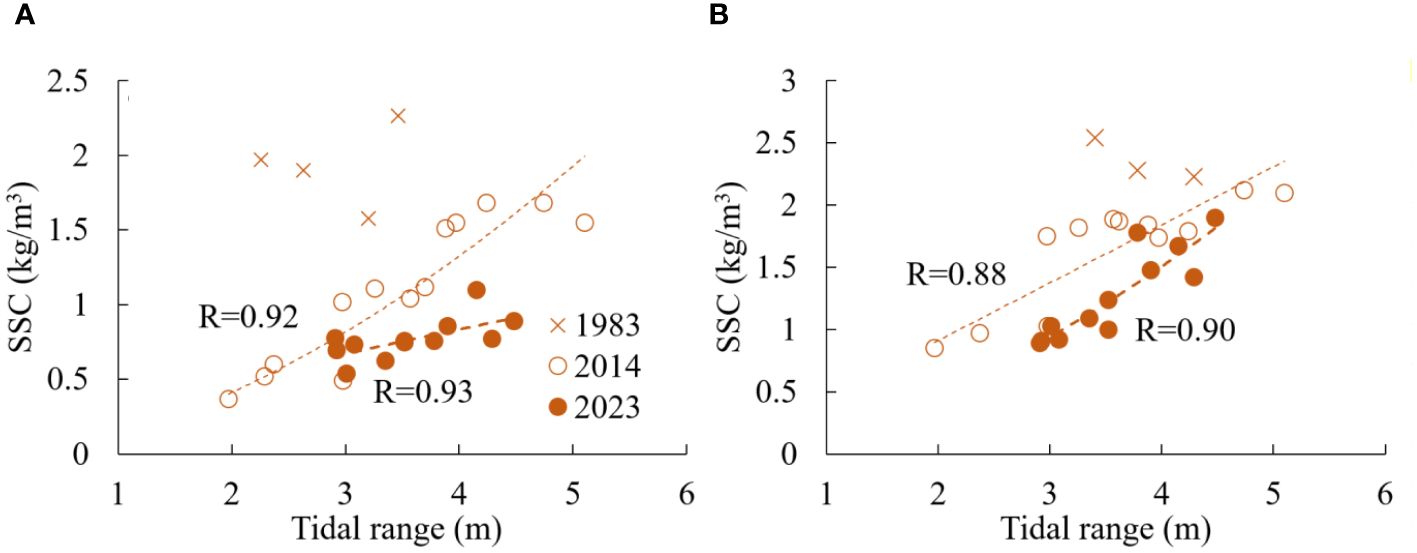
Figure 12. The correlations between flood or ebb - averaged SSC at LCG (A) and HZW (B) and the corresponding tidal ranges during the cruises of 1983, 2014 and 2023.
In the cruise of 2023, the water flux per unit width during flood or ebb tides varied between 126 × 103 m3/m and 228 × 103 m3/m at LCG and between 181 × 103 m3/m and 287 × 103 m3/m at HZW (Figures 13A, B). The averages were 184 × 103 m3/m and 230 × 103 m3/m, respectively. The sediment flux per unit width during flood or ebb tides varied between 40 t/m and 289 t/m at LCG and between 104 t/m and 476 t/m at HZW (Figures 13C, D). The averages were 135 t/m and 246 t/m, respectively. Similar to those of the SSC and current velocity, the water and sediment fluxes per unit width at both stations correlated well with the tidal range.
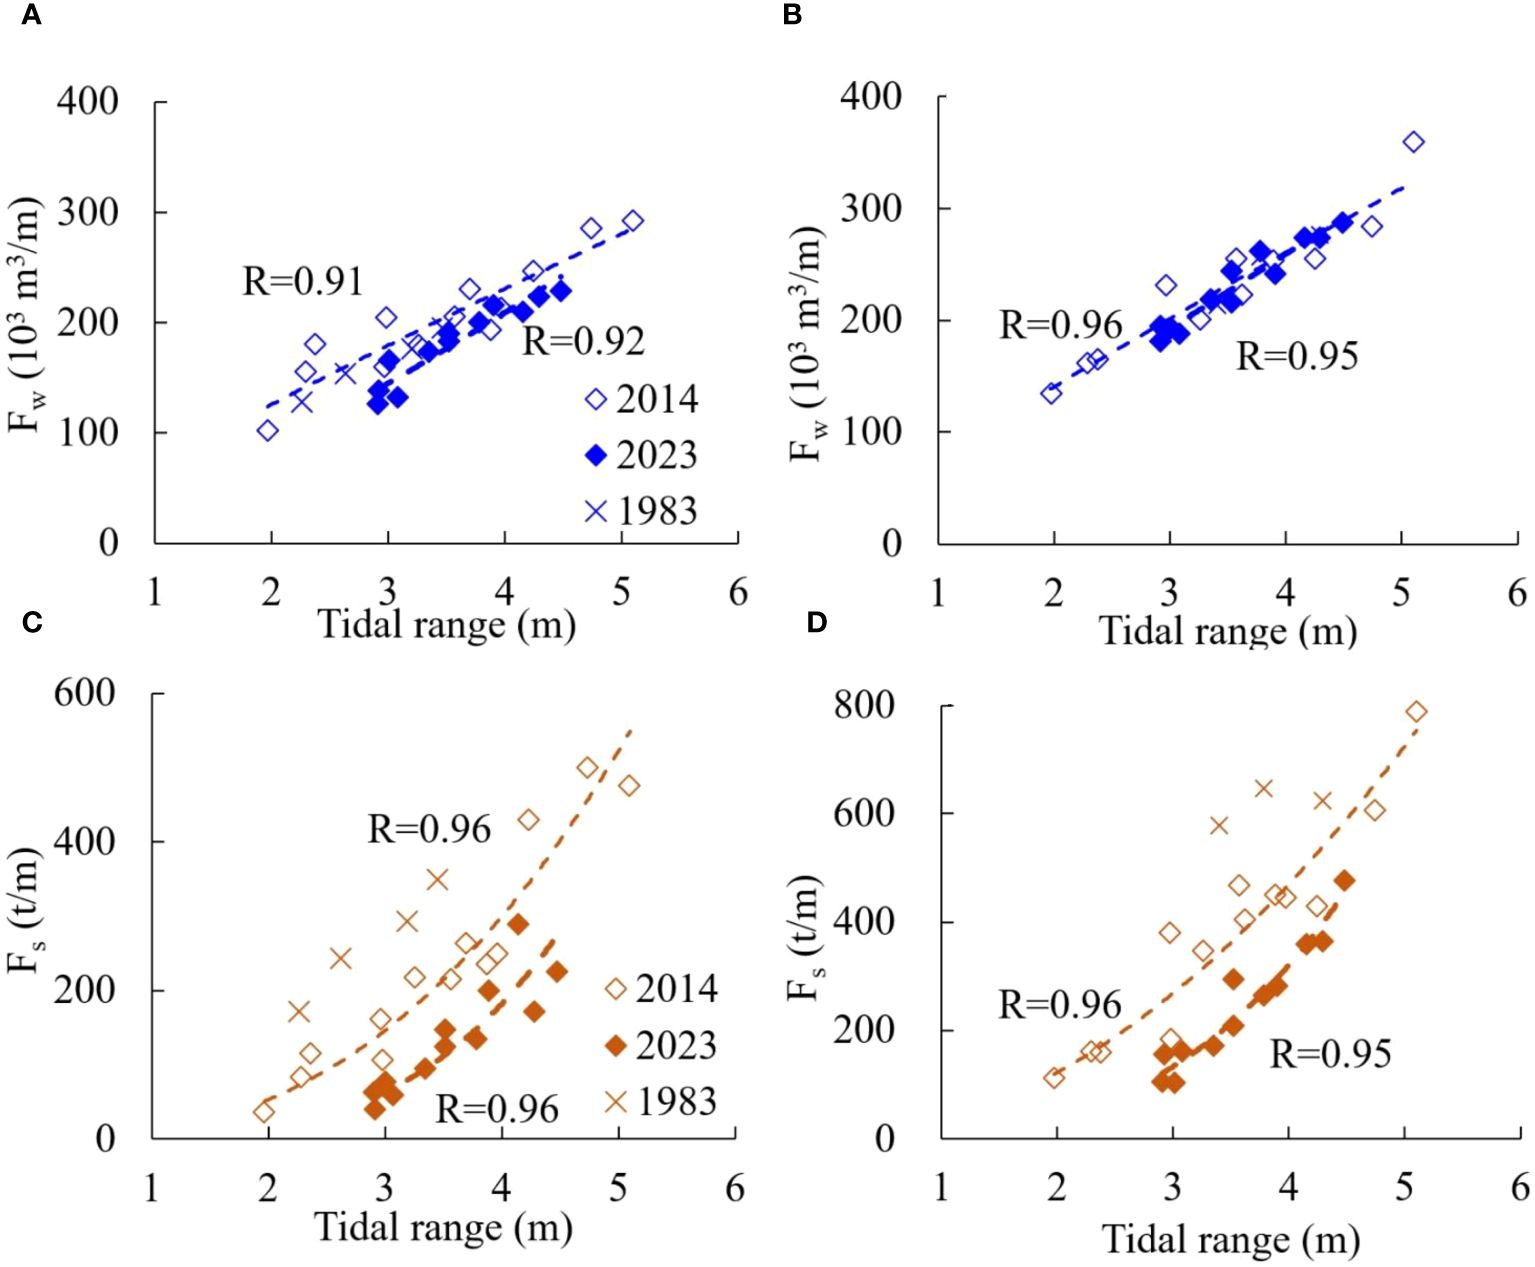
Figure 13. The correlations between flood or ebb - averaged water (A, B) and sediment (C, D) fluxes at LCG and HZW and the corresponding tidal ranges during the cruises of 1983, 2014 and 2023.
From 1983 to 2014, the changes in water fluxes at the two stations were insignificant. From 2014 to 2023, the water fluxes at LCG and HZW decreased by 16% and 6%, respectively (Table 1). During 1983 - 2014, the sediment flux decreased by 41% and 44% at LCG and HZW, respectively. During 2014 - 2023, the sediment flux decreased further by 53% and 36%, respectively. Since 1983 the sediment fluxes at LCG and HZW have decreased by 73% and 64%, respectively. Apparently, the water and sediment exchanges in the transitional zone between the two large estuaries have been significantly weakened in the recent 10 years.
It has been found that during the period of 2014 - 2023, SSC in the transitional zone continued the decreasing trend during 1983 - 2014 (Table 1; Figures 6, 7, 10–12), although the sediment load reduction during 2014 - 2023 is insignificant (Figure 2). This is probably related to the recent morphological evolution of the Changjiang subaqueous delta. The Changjiang subaqueous delta became increasingly starved of sediment due to the sediment load reduction from the Changjiang River (Luo et al., 2017; Wei et al., 2019; Yang et al., 2020). Consequently, the subaqueous delta has transitioned to net erosion, with an erosion rate of 0.17 km3/a (Wu et al., 2023). Moreover the erosion has occurred in the delta-front area to help maintain the subarerial delta (Wei et al., 2019; Yang et al., 2020). In the Nanhui shoal area, most of the subaqueous delta also experienced severe erosion (Zhang et al., 2022). Assuming that the erosion rate between 2014 and 2023 is equal to that between 2010 and 2016, the vertical erosion is 0.65 m. The water depth at LCG was 9.1 m, 10.4 m and 11.0 m during the cruises of 1983, 2014 and 2023, respectively; and the water depth at HZW was 11.3 m, 11.5 m and 11.9 m during the three cruises (Table 1). The mean water level at Luchaogang tidal gauging station was around the mean sea level (0 m) during all the three cruises. Thus, it can be estimated that the bed level at LCG was eroded by 1.3 m and 0.6 m during 1983 - 2014 and 2014 - 2023, respectively; at HZW it was eroded by 0.2 m and 0.4 m during the two periods, respectively. The bed erosion results in a decrease in sediment supply from the subaqueous delta and accordingly reduces the SSC. This is consistent with the remote sensing analysis of Luo et al. (2022) that the surfacial SSC in the outer Changjiang Estuary has decreased by 20 - 30% during 2014 - 2020.
The sediment load at Datong is a direct sediment source for the Changjiang delta. The response of SSC in the inner Changjiang Estuary to the closure of TGD in 2003 was rapid, and the SSC only showed slightly changes afterwards due to the erosion of the riverbed in the middle and lower reaches of the Changjiang River (Dai et al., 2018; Wu et al., 2023). The average river discharges at Datong in January of 2014 and 2023 were comparable, being 330 × 108 m3 and 300 × 108 m3, respectively. The average sediment load at Datong in the same month were 220 × 104 t and 75×104 t (Ministry of Water Resources of the People's Republic of China (MWR), 2014, Ministry of Water Resources of the People's Republic of China (MWR), 2023). Accordingly, the average SSC at Datong was 0.067 kg/m3 and 0.025 kg/m3. The SSC at Datong in the winter of 2014 and 2023 was much smaller than the observed SSC at LCG and HZW stations, indicating that the direct riverine sediment input plays a minor role on sediment transport in the transitional zone between the Changjiang Estuary and Hangzhou Bay. The source material of suspended sediment in this area is predominantly from subaqueous delta erosion (Xie et al., 2017a; Dai et al., 2018; Yang et al., 2020).
Tidal flat is an important source for suspended sediment in the water column during winter when wind wave is relatively stronger (Zhu et al., 2016). The land reclamation significantly reduced the tidal flat areas (Wei et al., 2017, 2019), and subsequently the source of the locally resuspended sediment. Based on GOCI images, Li et al. (2019) found the surface SSC in Hangzhou Bay showed a decrease trend from 1984 to 2015, because tidal flat reclamation around the bay changed the hydrodynamics and reduced sediment source (Xie et al., 2017b). Similarly, the reclamation at the Nanhui shoal induced a decrease in sediment source and changes the local hydrodynamics.
In the last decades, a number of reclamation projects have been implemented in the Changjiang Estuary area. Generally, siltation promotion projects were implemented prior to reclamation in the Changjiang Estuary (Liu et al., 2018; Li et al., 2020). Figure 14 shows the siltation promotion projects of about 30 km2 at the Nanhui flat during 2010 - 2023, extracted from the Landsat images. During 2013 - 2019 several groins that stretched into deep water were built and shoals above water gradually emerged. In 2023, the border of the newborn flats was near the seaward ends of the groins. The groins have collectively led to substantially increased shoreline stability and channel - shoal structure, and reduced deltaic morphodynamic activities (Fan et al., 2017; Wei et al., 2019). Subsequently, the fine sediment which can be resuspended and transported by tidal currents and wind waves in winter has significantly decreased. Moreover, the accretion projects enclosed some sediments that could have been dispersed into Hangzhou Bay.
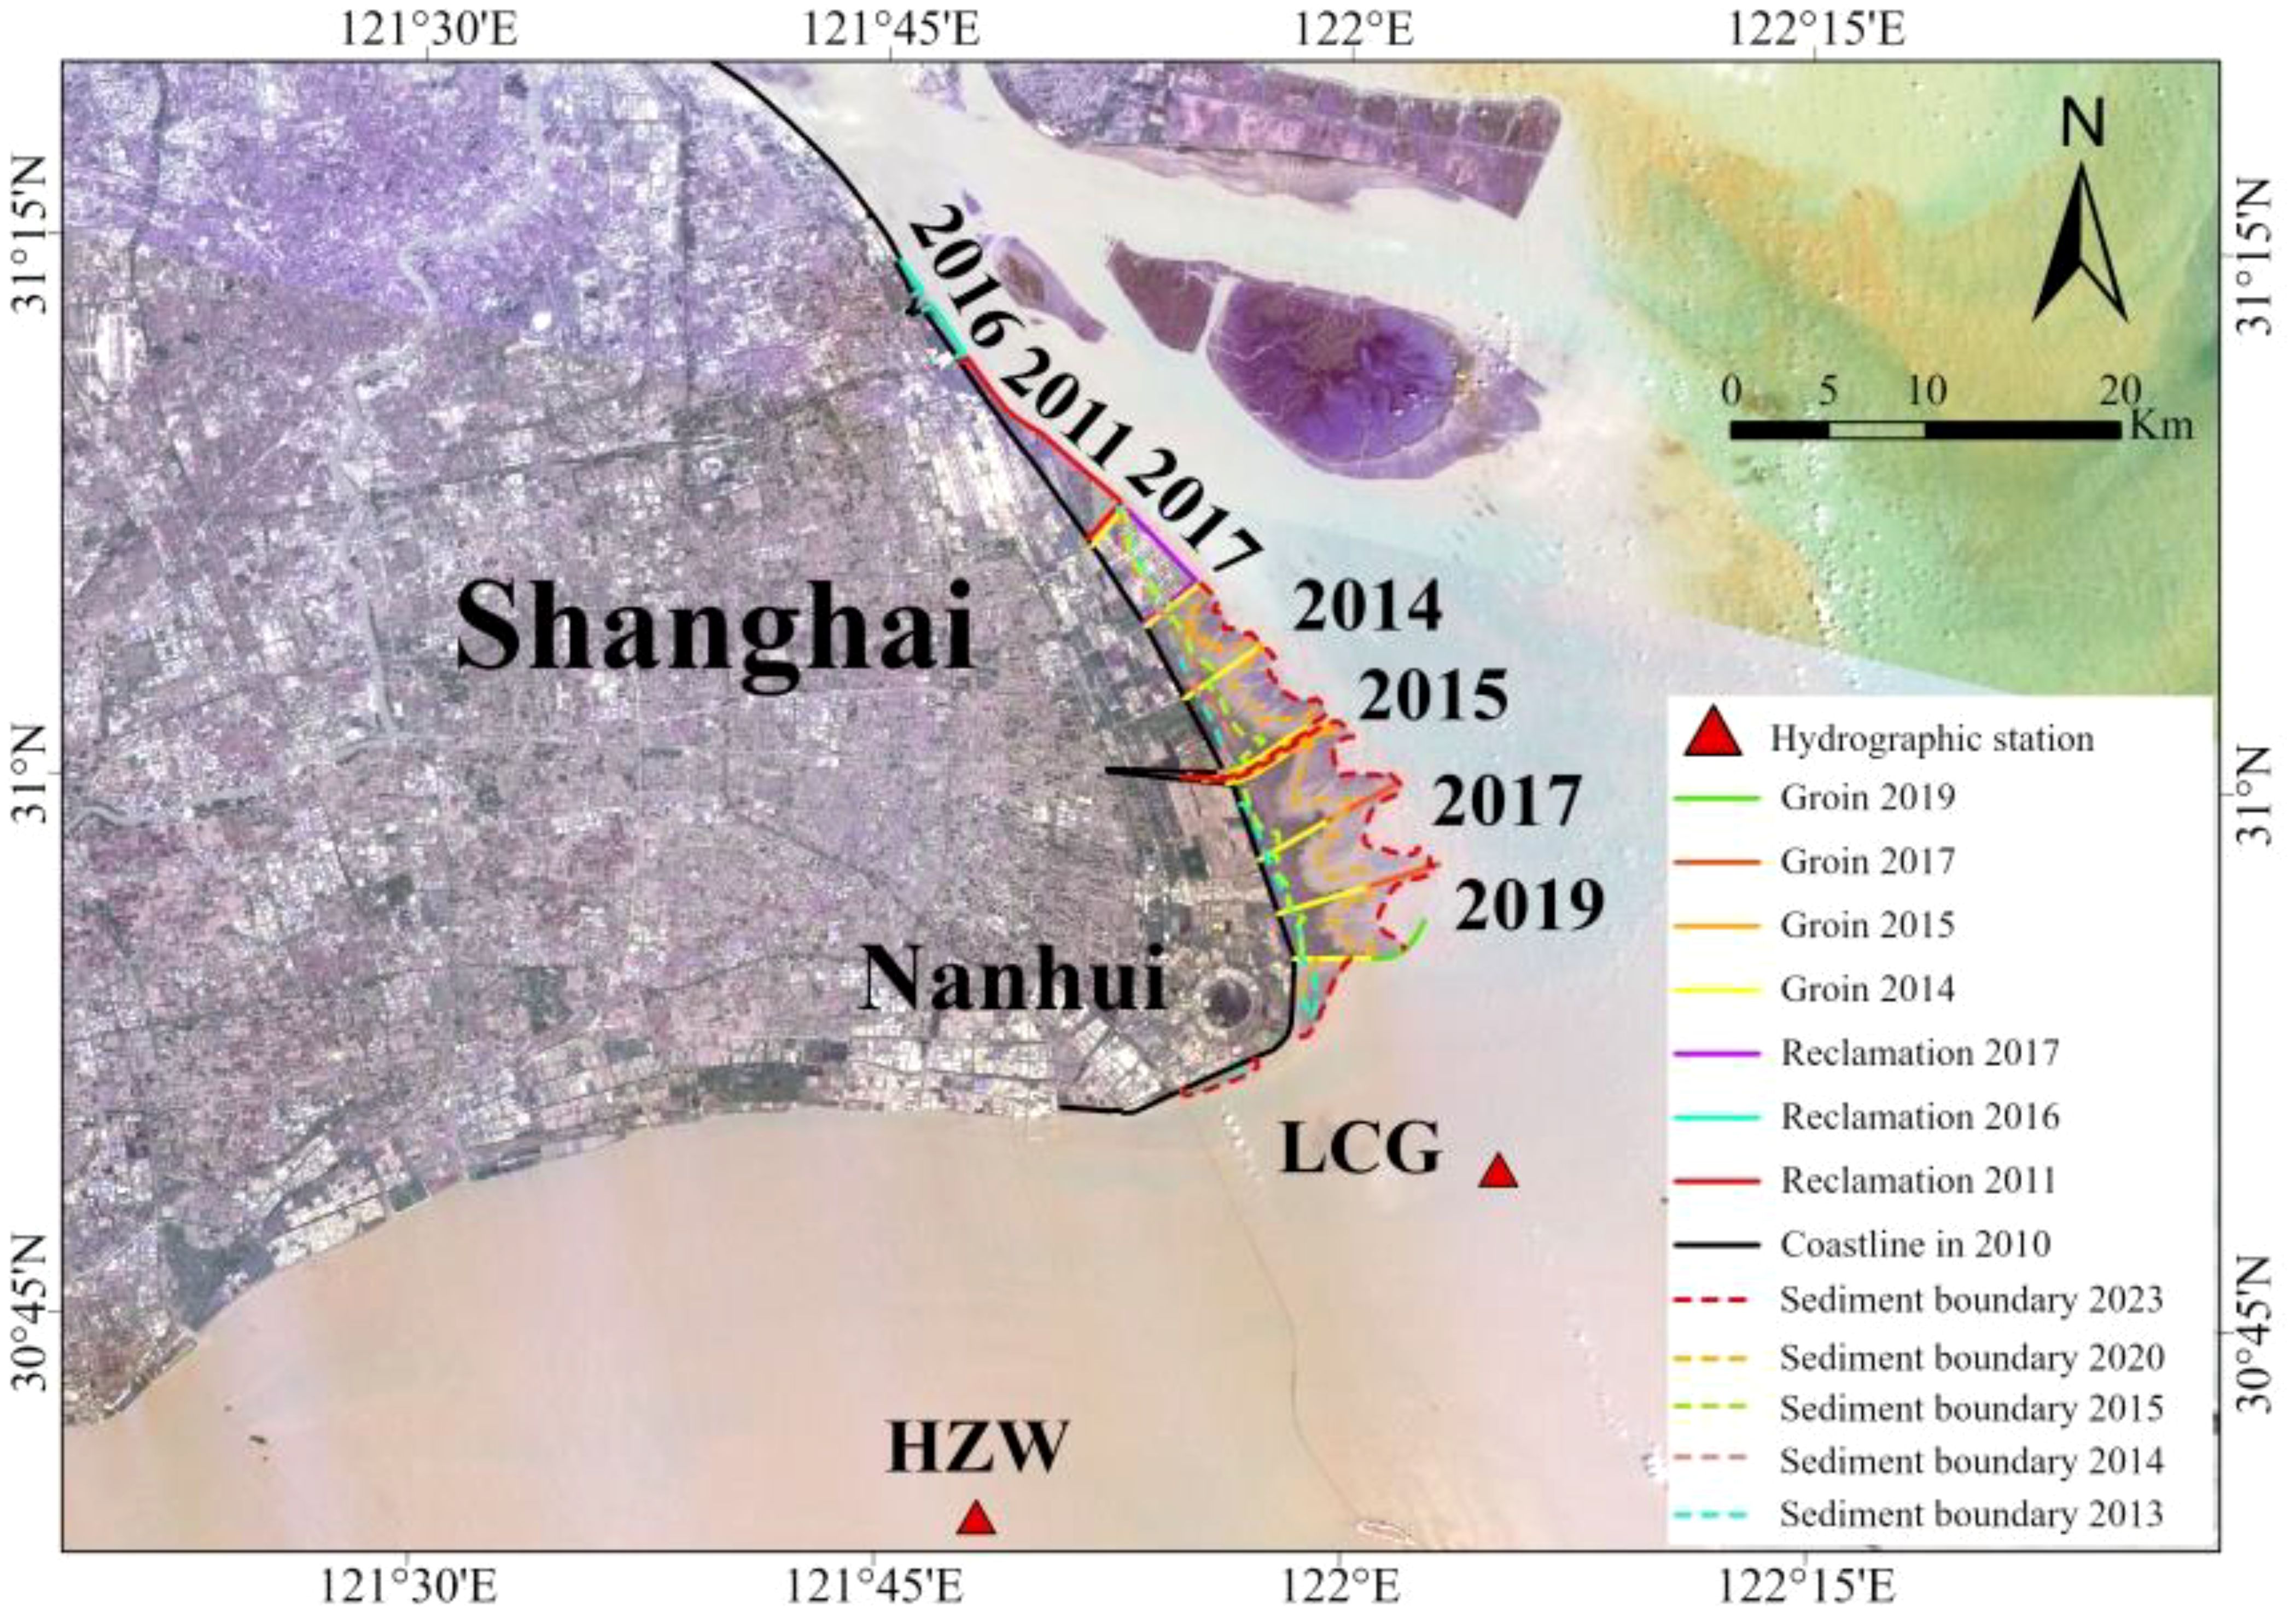
Figure 14. The Nanhui siltation promotion project and the changes of the sediment boundaries since 2010.
The siltation promotion project also changed the local hydrodynamic condition. It is suggested that there exists a sediment passage around the -5 m and -7 m contours along which the sediment of the Changjiang Estuary transported southerly into Hangzhou Bay (Chen et al., 2001), as shown in Figure 1B. The eastward advance of the Nanhui coast has decreased the current velocity at LCG and HZW by 21% and 8%, respectively (Figures 6–-9), due to the shelter effect of the tidal currents from the Changjiang Estuary. Because the sediment resuspension depends on current velocity, the SSC at LCG was decreased accordingly.
Severe erosion have occurred throughout most of the outer Changjiang Estuary during 2010 - 2016 with the net erosion rate being 7.2 cm/a (Zhang et al., 2022), whereas considerable deposition occurred in this area before 1986. Xie et al. (2017b) found that the northern Hangzhou Bay mouth has been eroded since 2010, with the erosion rate being 2 - 4 cm/a. It would be valuable to explain physical mechanisms from an viewpoint of sediment dynamics.
The amount of sediment transported for the given flow and boundary conditions can be calculated using the sediment carrying capacity (Zhang, 2008):
where is sediment carrying capacity, is the depth - averaged current velocity, is the gravitational acceleration (9.81 m/s2), K and m are empirical constants. is sediment settling velocity, which can be calculated from the modified formulation based on Stokes’ law (Stokes, 1851):
where D is the median grain size of the suspended sediment, and v is the kinematic viscosity of water (1.10×10⁻⁶ m2/s), and are the sediment and water densities, respectively. The result showed the sediment carrying capacity at LCG and HZW was comparable between 1983 and 2014, but it decreased by 27% and 9% at LCG and HZW, respectively, between 2014 and 2023 (Table 1), indicating that less sediment can be resuspended and transported. On the other hand, the decrease in SSC was more than the decrease in sediment carrying capacity. This explains the recent erosion in the outer Changjiang Estuary and the northern bay mouth.
The decrease in sediment transport per unit width also helps to explain the recent erosion in this region. It is difficult to compute the net sediment flux across the transects with any degree of accuracy because it is a very small difference between the very large flood and ebb fluxes (Townend and Whitehead, 2003). Combined historical bathymetrical and hydrographical data, Xie et al. (2017a) found that the net sediment fluxes at the Luchaogang transect and the bay mouth transect was 186 Mt/a and 122 Mt/a, respectively, and their directions were southward and westward, respectively. The sediment transport per unit width at HZW decreased by 44% during 1983 - 2014 and then decreased by 36% during 2014 - 2023 (Figure 13). Given the good correlation between the sediment transport at HZW and the sediment flux in the northern part of the bay mouth transect (Figure 3B), the sediment entering the northern Hangzhou Bay has decreased significantly. On the other hand, the change of the sediment flux across the middle Hangzhou Bay was insignificant (Xie et al., 2017b). Hence the net sediment accumulation in the northern mouth decreased and subsequently bed erosion occurred. A conceptual model of the sediment dynamics responding to human activities in the transitional zone of the two systems is summarized in Figure 15.
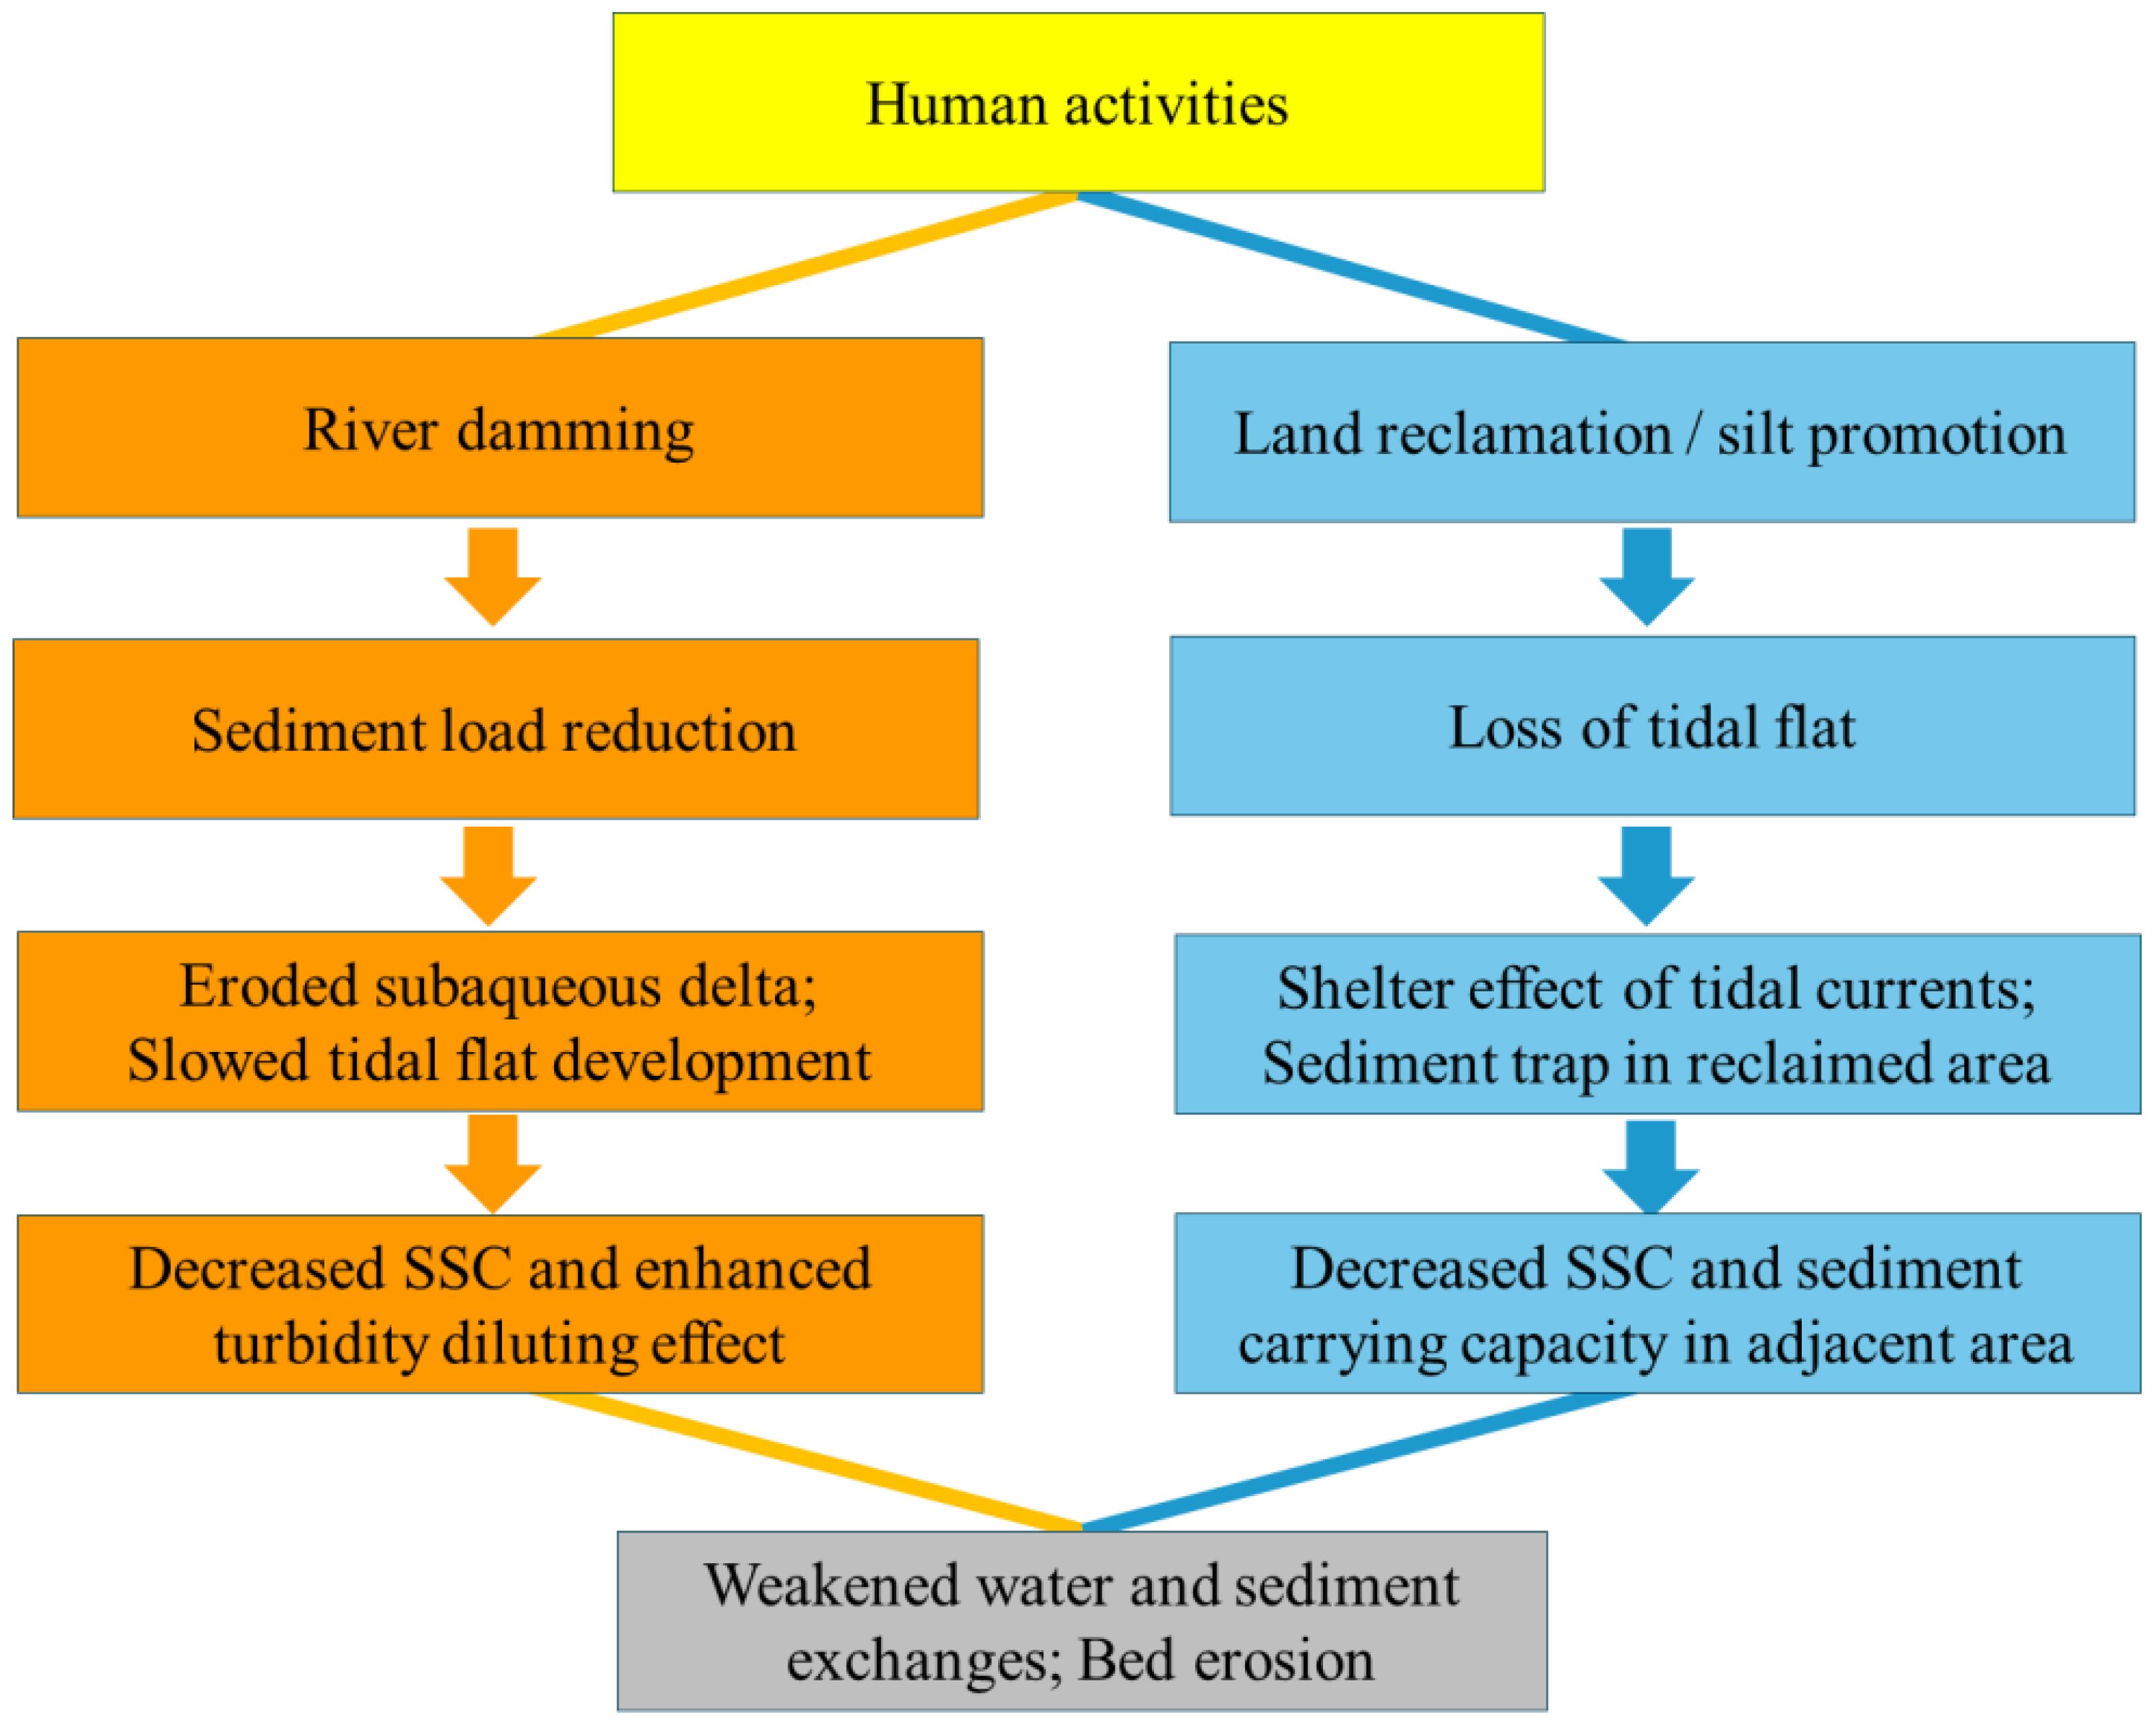
Figure 15. Conceptual model depicting the sediment dynamic response to human activities in the transitional zone between the Changjiang Estuary and Hangzhou Bay.
This study provided the direct evidence on how the decrease in sediment load and land reclamation affect the sediment budget in this region. Despite the meaningful exploration in this study, it is difficult to completely distinguish the impacts of local land reclamation, the riverine sediment load reduction and associated morphological evolutions. It would be helpful to conduct process - based morphodynamic modelling, remote sensing analysis from high resolution images, and even long - time monitoring using hydrographical measurements in future.
Based on the synchronous hydrographic data of the winter cruises in 2023, 2014 and 1983, suspended sediment dynamic response to human activities in recent years was analyzed in the transitional zone between the Changjiang Estuary and Hangzhou Bay. Good correlations have been found for the current velocity, SSC, water and sediment fluxes with the corresponding tidal range. In the recent ten years, the current velocity in the nearshore area of the Nanhui flat has been decreased by 21% and 8% at LCG and HZW, mainly due to the land reclamation implemented around 2016. The SSC has been decreased by 38% and 29%, respectively. This was related to the riverine sediment load reduction and the local land reclamation which enclosed a large amount of /sediment and altered the local hydrodynamics. Subsequently, the sediment carrying capacity decreased by 27% and 9% at the two stations, respectively. The sediment fluxes at the outer Changjiang Estuary transect and the northern bay mouth transect have decreased by 53% and 36%. The water and sediment exchanges in this region have been weakened significantly.
The findings in this study provide the direct evidence on how the riverine sediment load reduction and estuarine engineering affected the sediment budget in this region and explain the observed morphological evolutions in recent years. The findings are also relevant for future observations and suspended sediment dynamic research in other similar large - scale systems worldwide.
The original contributions presented in the study are included in the article/supplementary material. Further inquiries can be directed to the corresponding author.
DX: Conceptualization, Formal analysis, Funding acquisition, Writing – original draft, Writing – review & editing. YC: Formal analysis, Methodology, Writing – original draft. CP: Data curation, Investigation, Writing – original draft. SZ: Writing – original draft, Data curation, Investigation. WW: Formal analysis, Writing – original draft, Conceptualization, Writing – review & editing. ZW: Formal analysis, Software, Writing – original draft. JG: Formal analysis, Software, Writing – original draft. WD: Data curation, Investigation, Writing – original draft.
The author(s) declare financial support was received for the research, authorship, and/or publication of this article. This research was financed by the key project of Zhejiang Provincial Natural Science Foundation (No. LZJWZ23E090003), the National Natural Science Foundation of China (No. 42176170, 42276173, 42076178), National Key Research and Development Program of China (No. 2022YFC3106201). Special Project of Zhejiang Provincial Research Institutes (No. ZIHEYS23002).
The authors would like to thank Bingwei Zhang and Ting Wu for their help in the field observations. Reviewers and the academic editor are sincerely thanked for their valuable and constructive comments in improving the overall quality of this work.
The authors declare that the research was conducted in the absence of any commercial or financial relationships that could be construed as a potential conflict of interest.
All claims expressed in this article are solely those of the authors and do not necessarily represent those of their affiliated organizations, or those of the publisher, the editors and the reviewers. Any product that may be evaluated in this article, or claim that may be made by its manufacturer, is not guaranteed or endorsed by the publisher.
Allen G. P., Salomon J. C., Bassoulet P., Du Penhoat Y., De Grandpre C. (1980). Effect of tides on mixing and suspended sediment transport in macrotidal estuaries. Sedimentary Geology 26, 69–90. doi: 10.1016/0037-0738(80)90006-8
Chen J., Chen S., Ding P., Yang S. (2001). Sediment transport along the Nanhui submerged spit of the Yangtze Estuary. Resour. Environ. Yangtze Basin 10, 166–172.
Chen J., Liu C., Zhang C., Walker H. J. (1990). Geomorphological development and sedimentation in Qiantang estuary and Hangzhou Bay. J. Coast. Res. 6, 559–572.
Chen J., Zhu H., Dong Y. (1985). Development of the Changjiang Estuary and its submerged delta. Continental Shelf Res. 4, 47–56. doi: 10.1016/0278-4343(85)90021-4
Dai Z., Chu A., Li W., Li J., Wu H. (2013). Has suspended sediment concentration near the mouth bar of the Yangtze (Changjiang) Estuary been declining in recent years? J. Coast. Res. 29, 809–818. doi: 10.2112/JCOASTRES-D-11-00200.1
Dai Z., Mei X., Stephen E. D., Lou Y., Li W. (2018). Fluvial sediment transfer in the Changjiang (Yangtze) river-estuary depositional system. J. Hydrology 566, 719–734. doi: 10.1016/j.jhydrol.2018.09.019
Fan D., Wu Y., Zhang Y., Burr G., Huo M., Li J. (2017). South flank of the Yangtze Delta: past, present and future. Mar. Geology 392, 78–93. doi: 10.1016/j.margeo.2017.08.015
Fan D., Xu J., Wu Y., Lee G. (2019). Coastal environmental changes under increasing anthropogenic impacts: an introduction. Anthropocene Coasts 2, v–xii. doi: 10.1007/BF03654774
Gao S., Wang Y. P. (2008). Material fluxes from the Changjiang River and their implications on the adjoining continental shelf ecosystem. Continental Shelf Res. 28, 1490–1500. doi: 10.1016/j.csr.2007.02.010
Grabemann I., Krause G. (1989). Transport processes of suspended matter derived from time series in a tidal estuary. J. Geophysical Res. 94, 14373–14379. doi: 10.1029/JC094iC10p14373
Guo L., Zhu C., Xie W., Xu F., Wu H., Wan Y., et al. (2021). Changjiang Delta in the Anthropocene: Multi-scale hydro-morphodynamics and management challenges. Earth-Science Rev. 223, 103850. doi: 10.1016/j.earscirev.2021.103850
Han Z. C., Dai Z. H., Li G. B. (2003). Regulation and exploitation of qiantang estuary (in chinese) (Beijing: China Water Power Press).
Li J. (1991). The rule of sediment transport on the Nanhui tidal flat in the Changjiang Estuary. Acta Oceanologica Sin. 10, 117–127.
Li P., Yang S. L., Milliman J. D., Xu K. H., Qin W. H., Wu C. S., et al. (2012). Spatial, temporal, and human-induced variations in suspended sediment concentration in the surface waters of the Yangtze Estuary and adjacent coastal areas. Estuaries Coasts 35, 1316–1327. doi: 10.1007/s12237-012-9523-x
Li L., Ye T., Wang X. H., Xia Y. (2019). Tracking the multidecadal variability of the surface turbidity maximum zone in Hangzhou Bay, China. Int. J. Remote Sens. 40, 1–22. doi: 10.1080/01431161.2019.1633701
Li X., Zhang X., Qiu C. Y., Duan Y. Q., Liu S. A., Chen D., et al. (2020). Rapid loss of tidal flats in the Yangtze River Delta since 1974. Int. J. Environ. Res. Public Health 17, 1636. doi: 10.3390/ijerph17051636
Liu L., Xu W., Yue Q., Teng X., Hu H. (2018). Problems and countermeasures of coastline protection and utilization in China. Ocean Coast. Manage. 153, 124–130. doi: 10.1016/j.ocecoaman.2017.12.016
Liu J. H., Yang S. L., Zhu Q., Zhang J. (2014). Controls on suspended sediment concentration profiles in the shallow and turbid Yangtze Estuary. Continental Shelf Res. 90, 96–108. doi: 10.1016/j.csr.2014.01.021
Luan H. L., Ding P. X., Wang Z. B., Yang S. L., Lu J. Y. (2018). Morphodynamic impacts of large-scale engineering projects in the Yangtze River delta. Coast. Eng. 141, 1–11. doi: 10.1016/j.coastaleng.2018.08.013
Luo W., Shen F., He Q., Cao F., Zhao H., Li Y. (2022). Changes in suspended sediments in the Yangtze River Estuary from 1984 to 2020: Responses to basin and estuarine engineering constructions. Sci. Total Environ. 805, 150381. doi: 10.1016/j.scitotenv.2021.150381
Luo X. X., Yang S. L., Wang R. S., Zhang C. Y., Li P. (2017). New evidence of Yangtze delta recession after closing of the three Gorges Dam. Sci. Rep. 7, 1–10. doi: 10.1038/srep41735
Milliman J. D., Farnsworth K. L. (2011). River discharge to the coastal ocean: A global synthesis. (Cambridge, New York: Cambridge University Press). doi: 10.1017/CBO9780511781247
Milliman J. D., Shen H. T., Yang Z. S., Robert H. M. (1985). Transport and deposited of river sediment in the Changjiang estuary and adjacent continental shelf. Continental Shelf Res. 4, 37–45. doi: 10.1016/0278-4343(85)90020-2
Ministry of Water Resources of the People's Republic of China (MWR). (2014). Chinese River sediment bulletin. Available online at: http://www.mwr.gov.cn/sj/tjgb/zghlnsgb/201612/t20161222_776069.html.
Ministry of Water Resources of the People's Republic of China (MWR). (2023). Chinese River sediment bulletin. Available online at: http://www.mwr.gov.cn/sj/tjgb/zghlnsgb/202405/t20240521_1711640.html.
Oliveira M. L. S., Dotto G. L., Pinto D., Alcindo N., Silva L. F. O. (2021). Nanoparticles as vectors of other contaminants in estuarine suspended sediments: Natural and real conditions. Mar. pollut. Bull. 168, 112429. doi: 10.1016/j.marpolbul.2021.112429
Postma H. (1961). Transport and accumulation of suspended matter in the Dutch Wadden Sea. Netherlands J. Sea Res. 1, 148–190. doi: 10.1016/0077-7579(61)90004-7
Shen F., Zhou Y. X., Li J. F., He Q., Verhoef W. (2013). Remotely sensed variability of the suspended sediment concentration and its response to decreased river discharge in the Yangtze estuary and adjacent coast. Continental Shelf Res. 69, 52–61. doi: 10.1016/j.csr.2013.09.002
Shi J. Z. (2011). Tide-induced fine sediment resuspension in the well-mixed Hangzhou Bay, East China Sea, China. Earth Environ. Sci. Trans. R. Soc. Edinburgh 102, 25–34. doi: 10.1017/S1755691011010061
Stokes G. G. (1851). On the effect of the internal friction of fluids on the motion of pendulums. Trans. Cambridge Philos. Soc. 8, 8–106.
Su J., Wang K. (1989). Changjiang River plume and suspended sediment transport in Hangzhou Bay. Continental Shelf Res. 9, 93–111. doi: 10.1016/0278-4343(89)90085-X
Syvitski J. P. M., Vörösmarty C. J., Kettner A. J., Green P. (2005). Impact of humans on the flux of terrestrial sediment to the global coastal ocean. Science 308, 376–380. doi: 10.1126/science.1109454
Tian M., Yang H., Zhang W., Xu K., Shi B., Wang Y., et al. (2024). Sediment resuspension and transport in the offshore subaqueous Yangtze Delta during winter storms. Front. Mar. Sci. 11. doi: 10.3389/fmars.2024.1420559
Townend I., Whitehead P. (2003). A preliminary net sediment budget for the Humber Estuary. Sci. Total Environ. 314-316, 755–767. doi: 10.1016/S0048-9697(03)00082-2
Wan X. N., Li J. F., shen H. T. (2009). Distribution and fluxes of suspended sediment in the offshore waters of the Changjiang (Yangtze Estuary). Acta Oceanologica Sin. 28, 86–95.
Wang Z. B., van Maren D. S., Ding P. X., Yang S. L., van Prooijen B. C., De Vet P. L. M., et al. (2015). Human impacts on morphodynamic thresholds in estuarine systems. Continental Shelf Res. 11, 174–183. doi: 10.1016/j.csr.2015.08.009
Wei W., Dai Z. J., Mei X. F., Gao S., Liu J. P. (2019). Multi-decadal morpho-sedimentary dynamics of the largest Changjiang estuarine marginal shoal: Causes and implications. Land Degradation Dev. 30, 2048–2063. doi: 10.1002/ldr.3410
Wei W., Dai Z., Mei X., Liu J. P., Gao S., Li S. (2017). Shoal morphodynamics of the Changjiang (Yangtze) estuary: influences from river damming, estuarine hydraulic engineering and reclamation projects. Mar. Geology 386, 32–43. doi: 10.1016/j.margeo.2017.02.013
Wu X., Yue Y., Borthwick A. G. L., Slater L. J., Syvitski J., Bi N., et al. (2023). Mega-reservoir regulation: A comparative study on downstream responses of the Yangtze and Yellow rivers. Earth-Science Rev. 245, 104567. doi: 10.1016/j.earscirev.2023.104567
Xie D., Pan C., Gao S., Wang Z. B. (2018). Morphodynamics of the Qiantang Estuary, China: Controls of river flood events and tidal bores. Mar. Geology 406, 27–33. doi: 10.1016/j.margeo.2018.09.003
Xie D., Pan C., Wu X., Gao S., Wang Z. (2017a). The variations of sediment transport patterns in the outer Changjiang Estuary and Hangzhou Bay over the last 30 years. J. Geophysical Research: Oceans 122, 2999–3020. doi: 10.1002/2016JC012264
Xie D., Pan C., Wu X., Gao S., Wang Z. (2017b). Local human activities overwhelm decreased sediment supply from the Changjiang River: Continued rapid accumulation in the Hangzhou Bay-Qiantang Estuary system. Mar. Geology 392, 66–77. doi: 10.1016/j.margeo.2017.08.013
Yang S. L., Luo X., Temmerman S., Kirwan M., Bouma T., Xu K., et al. (2020). Role of delta-front erosion in sustaining salt marshes under sea-level rise and fluvial sediment decline. Limnology Oceanography 65, 1990–2009. doi: 10.1002/lno.11432
Yang S. L., Milliman J. D., Li P., Xu K. (2011). 50 000 dams later: Erosion of the Yangtze River and its delta. Global Planetary Change 2011 (75), 14–20. doi: 10.1016/j.gloplacha.2010.09.006
Yang Y. P., Zhang M. J., Li Y. T., Zhang W. (2015). The variations of suspended sediment concentration in Yangtze River Estuary. J. Hydrodynamics 27, 845–856. doi: 10.1016/S1001-6058(15)60547-9
Zhang X., Dalrymple R. W., Yang S. Y., Lin C. M., Wang P. (2015). Provenance of Holocene sediments in the outer part of the Paleo-Qiantang River estuary, China. Mar. Geology 366, 1–15. doi: 10.1016/j.margeo.2015.04.008
Zhang D., Xie W., Shen J., Guo L., Chen Y., He Q. (2022). Sediment dynamics in the mudbank of the Yangtze Estuary under regime shift of source and sink. Int. J. Sediment Res. 37, 97–109. doi: 10.1016/j.ijsrc.2021.07.005
Zhang B., Zhang Z., Chen F., He K. (2023). Study on the morphological evolution of the Oujiang Estuary, China, in the 21st Century. J. Mar. Sci. Eng. 11, 378. doi: 10.3390/jmse11020378
Keywords: sediment dynamics, land reclamation, sediment load reduction, Changjiang Estuary, Hangzhou Bay
Citation: Xie D, Chen Y, Pan C, Zhang S, Wei W, Wang ZB, Gu J and Duan W (2024) Response of suspended sediment dynamics to human activities in the transitional zone between Changjiang Estuary and Hangzhou Bay. Front. Mar. Sci. 11:1440754. doi: 10.3389/fmars.2024.1440754
Received: 30 May 2024; Accepted: 22 July 2024;
Published: 12 August 2024.
Edited by:
Yang Yang, Nanjing Normal University, ChinaReviewed by:
Xiao Wu, Ocean University of China, ChinaCopyright © 2024 Xie, Chen, Pan, Zhang, Wei, Wang, Gu and Duan. This is an open-access article distributed under the terms of the Creative Commons Attribution License (CC BY). The use, distribution or reproduction in other forums is permitted, provided the original author(s) and the copyright owner(s) are credited and that the original publication in this journal is cited, in accordance with accepted academic practice. No use, distribution or reproduction is permitted which does not comply with these terms.
*Correspondence: Dongfeng Xie, ZG9uZ2ZlbmcueGllQGhvdG1haWwuY29t
Disclaimer: All claims expressed in this article are solely those of the authors and do not necessarily represent those of their affiliated organizations, or those of the publisher, the editors and the reviewers. Any product that may be evaluated in this article or claim that may be made by its manufacturer is not guaranteed or endorsed by the publisher.
Research integrity at Frontiers
Learn more about the work of our research integrity team to safeguard the quality of each article we publish.