
94% of researchers rate our articles as excellent or good
Learn more about the work of our research integrity team to safeguard the quality of each article we publish.
Find out more
CORRECTION article
Front. Mar. Sci. , 05 July 2024
Sec. Marine Biology
Volume 11 - 2024 | https://doi.org/10.3389/fmars.2024.1440395
 Christine Gawinski1*
 Malin Daase1,2
 Raul Primicerio1
 Martí Amargant-Arumí1
 Oliver Müller3
 Anette Wold4
 Mateusz Roman Ormańczyk5
 Slawomir Kwasniewski5
 Camilla Svensen1
A Corrigendum on
Response of the copepod community to interannual differences in sea-ice cover and water masses in the northern Barents Sea
By Gawinski C, Daase M, Primicerio R, Amargant-Arumí M, Müller O, Wold A, Ormańczyk MR, Kwasniewski S and Svensen C (2024). Front. Mar. Sci. 11:1308542. doi: 10.3389/fmars.2024.1308542
Error in Figure/Table
In the published article, there was an error in Figure 2 as published. Because of a typing error in the R code to calculate copepod secondary production, the formula for juvenile broadcast-spawning copepods was wrongly applied to calculate the secondary production of all copepod species, instead of using the respective formulas for sac-spawning and broadcast-spawning adult and juvenile copepods. The corrected Figure 2 and its caption appear below.
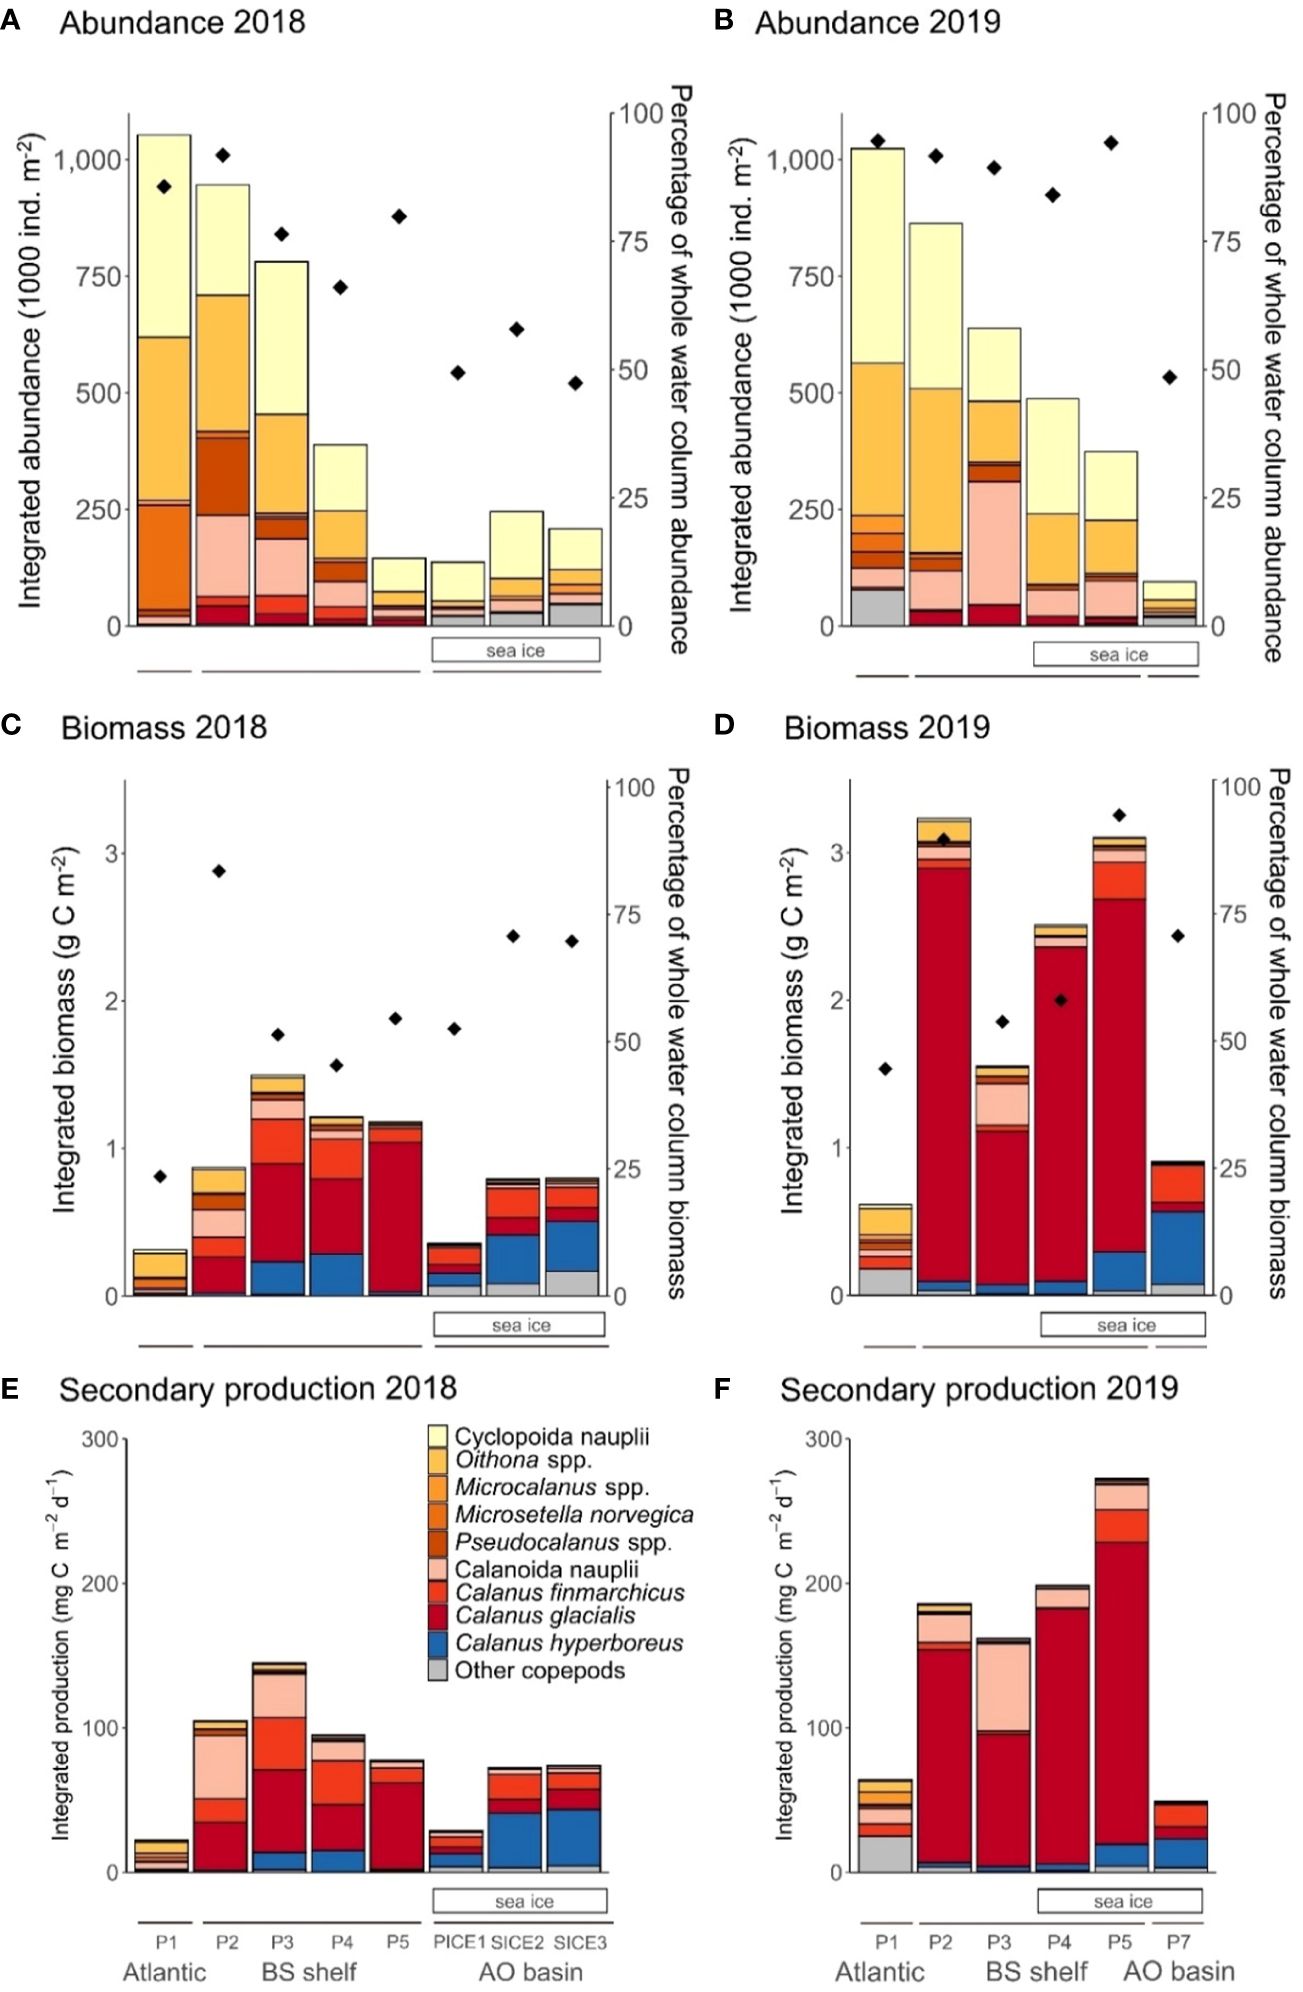
Figure 2 Abundance (upper panels), biomass (middle panels) and secondary production (lower panels) of dominating copepods within the upper 100 m layer at the southernmost station P1 (Atlantic), on the Barents Sea shelf (BS shelf) and in the Arctic Ocean basin (AO basin) in 2018 (left side graphs) and 2019 (right side graphs). Integrated abundance (1000 ind. M-2) in 2018 (panel (A)) and 2019 (panel (B)), integrated biomass (g C m-2) in 2018 (panel (C)) and 2019 (panel (D)) and integrated secondary production (mg C m-2 d-1) in 2018 (panel (E)) and 2019 (panel (F)) with proportions for individual copepod groups shown in the legend. Diamonds represent the percentage of the copepod community abundance (panels (A, B)) and biomass (panels (C, D)) that was located in the upper 100 m. Solid lines below the figure panels indicate the respective regions of the study section. Sea-ice cover is indicated with white rectangles under the graphs.
In the published article, there was an error in Figure 3 as published. Because of a typing error in the R code to calculate copepod secondary production, the formula for juvenile broadcast-spawning copepods was wrongly applied to calculate the secondary production of all copepod species, instead of using the respective formulas for sac-spawning and broadcast-spawning adult and juvenile copepods. The corrected Figure 3 and its caption appear below.
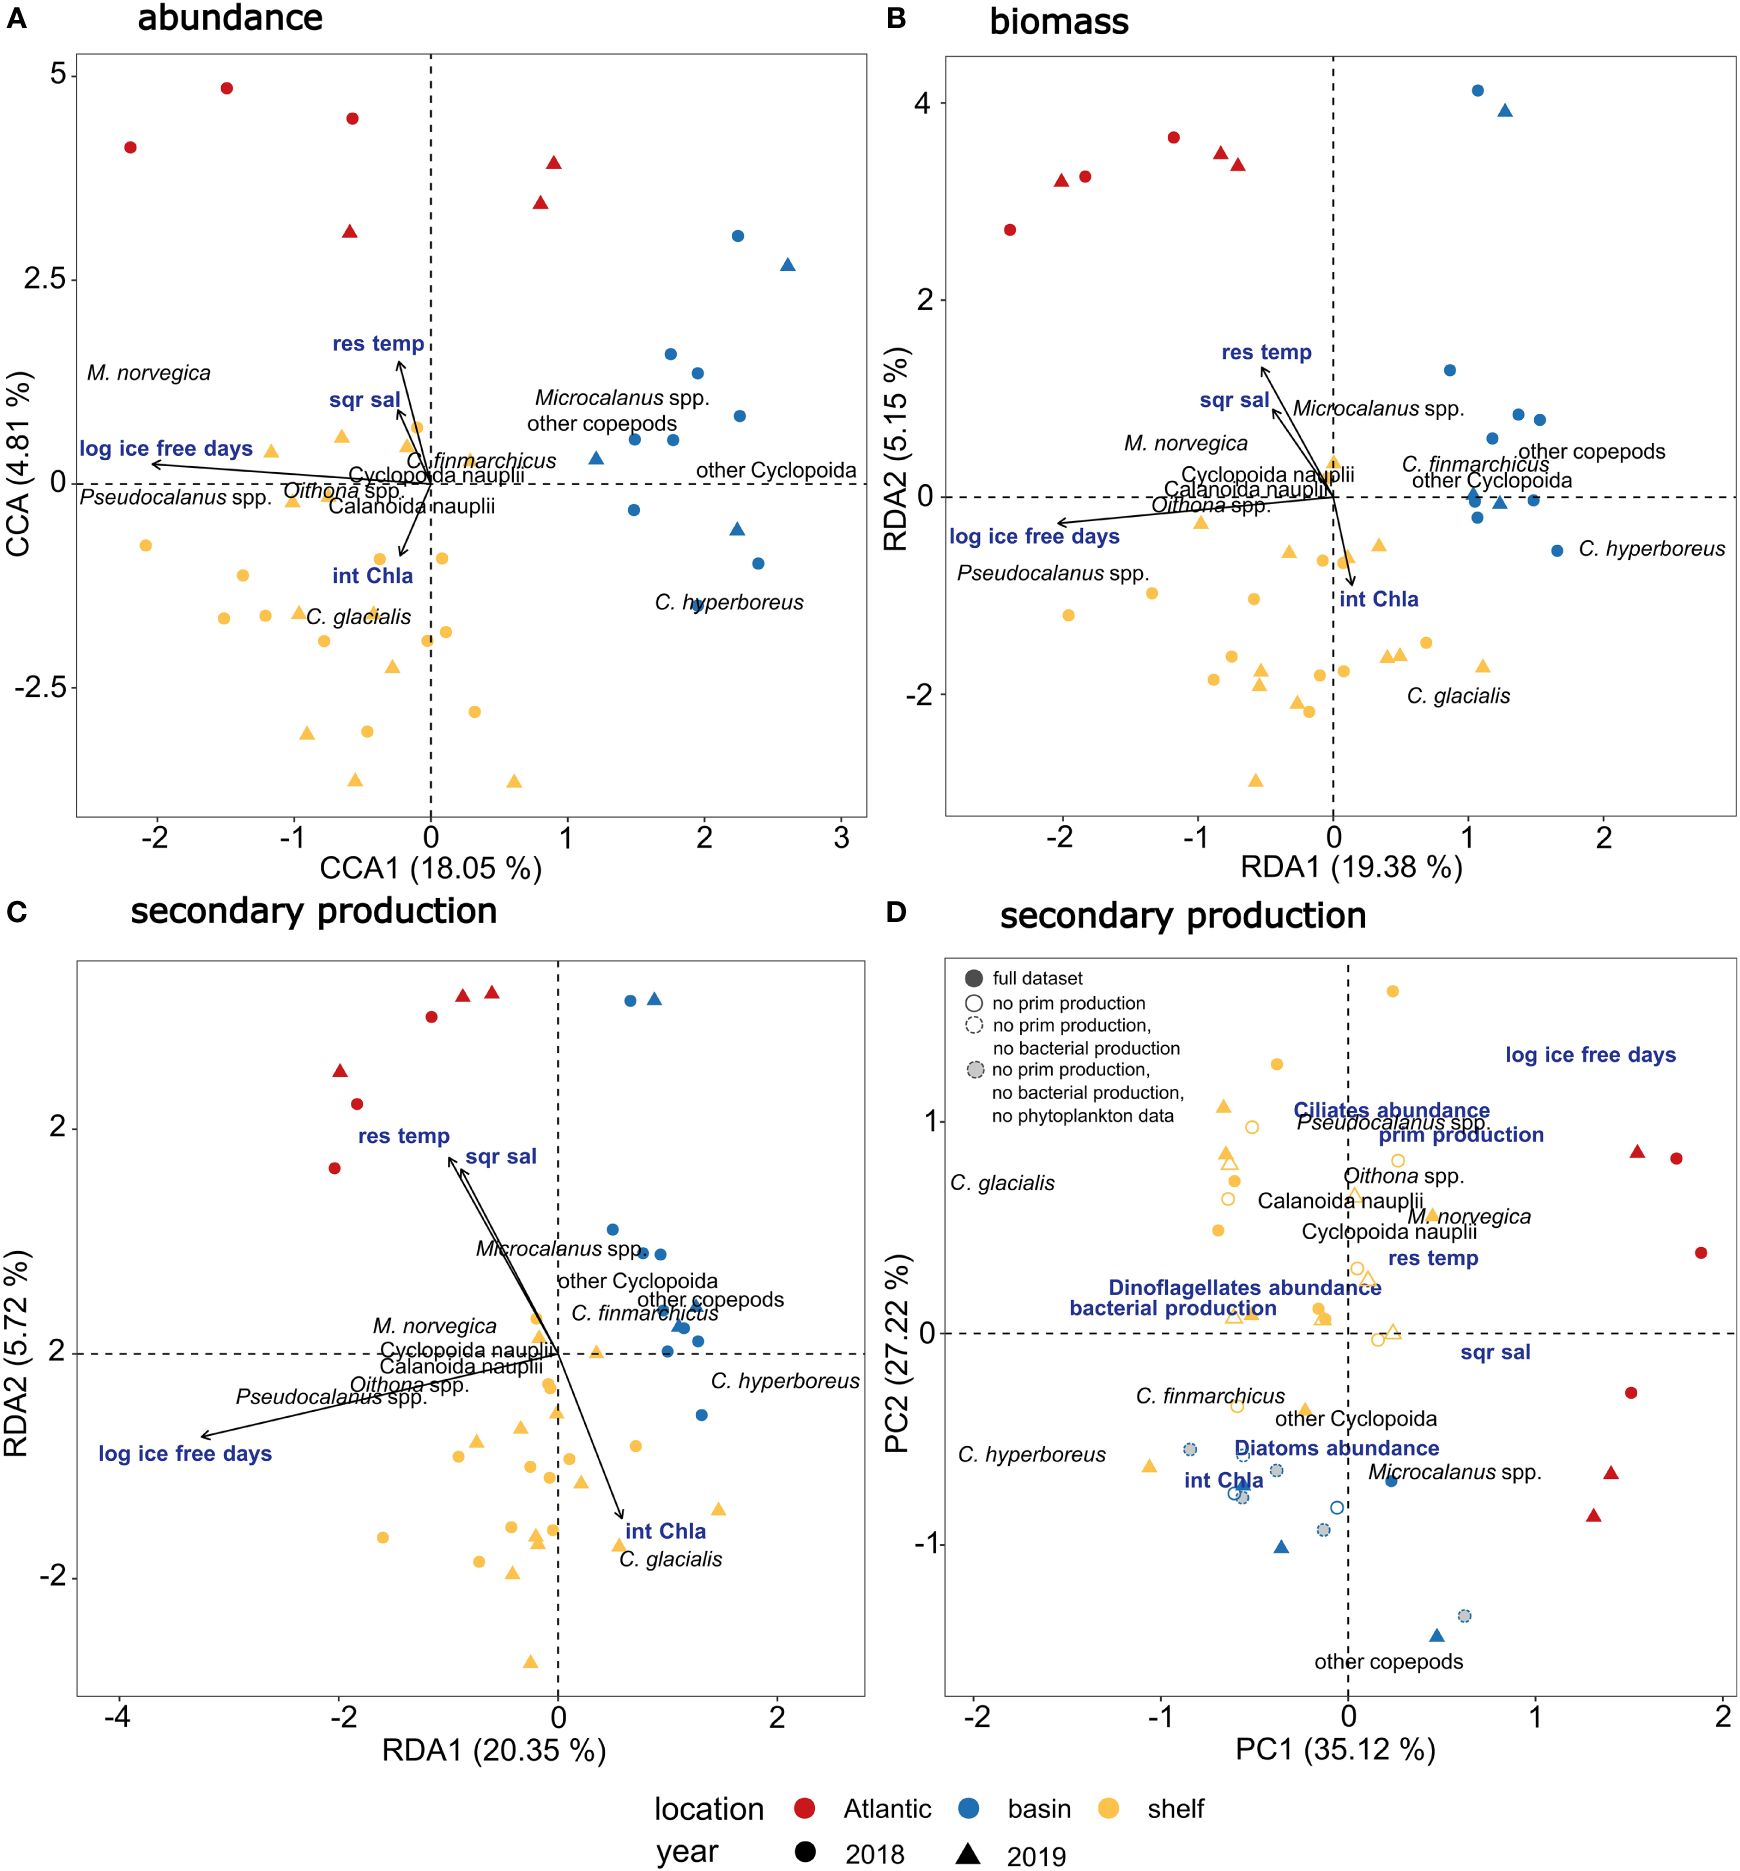
Figure 3 Multivariate analyses of copepod communities in relation to environmental and biological factors. (A) Triplot showing relationship between copepod abundance (based on fourth root transformed abundance data expressed as ind. M-2 in three depth strata from 0-20, 20-50, 50-100 m) and environmental factors (int Chl a = integrated chlorophyll a concentration, sqr sal = square root transformed salinity, res temp = residuals of temperature and log ice free days = log transformed number of ice-free days) using Constrained Correspondence Analysis (CCA). (B) Triplot showing relationship between copepod biomass (based on log10(x+1) transformed biomass data expressed as μg C m-2) and environmental factors using Redundancy Analysis (RDA). (C) Triplot showing relationship between copepod secondary production (based on log10(x+1) transformed secondary production data expressed as μg C m-2 d-1) and environmental factors using Redundancy Analysis (RDA). (D) Biplot showing Principal Component Analysis of copepod secondary production with overlaid potential drivers of secondary production, including log-transformed number of ice-free days, square root transformed salinity, residuals of temperature, integrated chlorophyll a concentration, bacterial production, primary production, abundance of ciliates, dinoflagellates, and diatoms. Solid filled symbols indicate samples with full dataset of environmental and biological variables, symbols with solid lines indicate that primary production was not measured, symbols with dashed lines indicate that primary production and bacterial production were not measured, grey-filled symbols with dashed lines indicate that primary production, bacterial production, and phytoplankton community composition were not measured.
In the published article, there was an error in Table 4 as published. Because of a typing error in the R code to calculate copepod secondary production, the formula for juvenile broadcast-spawning copepods was wrongly applied to calculate the secondary production of all copepod species, instead of using the respective formulas for sac-spawning and broadcast-spawning adult and juvenile copepods. The corrected Table 4 and its caption appear below.

Table 4 Results of permutation testing of the copepod community in the upper 100 m (three depth strata 0-20, 20-50, 50-100 m) in relation to the two study years (2018 and 2019) and locations (stations P1-P5).
In the published article, there was an error in Table 5 as published. Because of a typing error in the R code to calculate copepod secondary production, the formula for juvenile broadcast-spawning copepods was wrongly applied to calculate the secondary production of all copepod species, instead of using the respective formulas for sac-spawning and broadcast-spawning adult and juvenile copepods. The corrected Table 5 and its caption appear below.
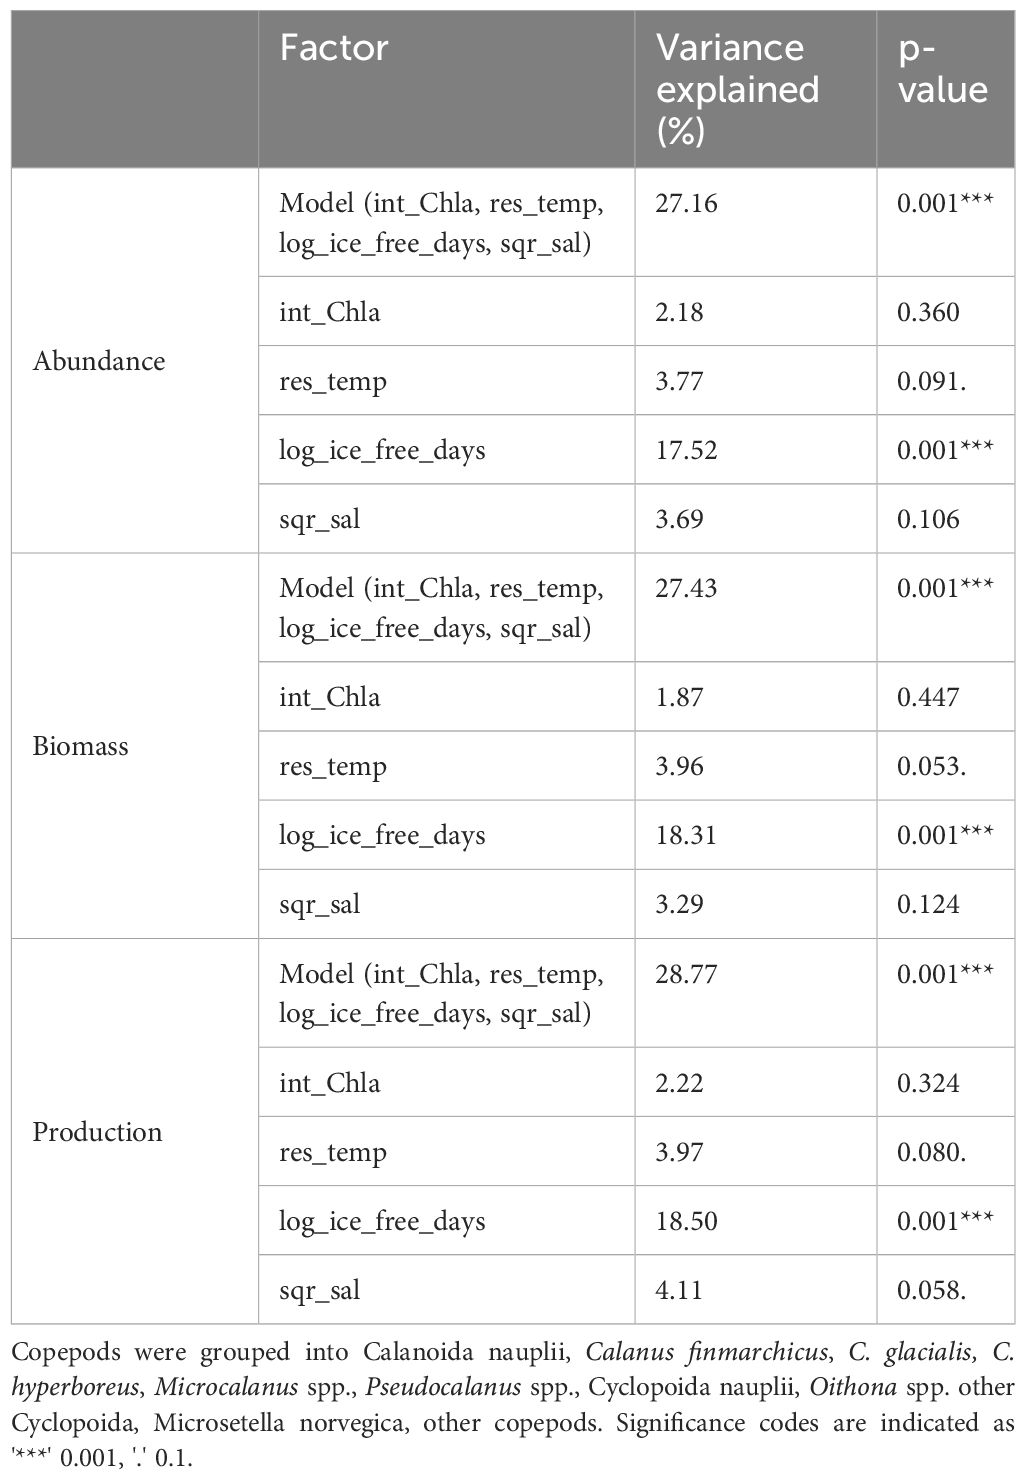
Table 5 Results of permutation testing of the copepod community in the upper 100 m (three depth strata 0-20, 20-50, 50-100 m) at stations P1-5, P7, PICE1, SICE2 and SICE3 in relation to environmental and biological variables (int_Chla = integrated chlorophyll a concentration, res_temp = residuals of temperature, log_ice_free_days = log transformed number of ice-free days and sqr_sal = square root transformed salinity.
The authors apologize for these errors and state that this does not change the scientific conclusions of the article in any way. The original article has been updated.
Incorrect Supplementary Material
In the published article, there was an error in Supplementary Table 2. Because of a typing error in the R code to calculate copepod secondary production, the formula for juvenile broadcast-spawning copepods was wrongly applied to calculate the secondary production of all copepod species, instead of using the respective formulas for sac-spawning and broadcast-spawning adult and juvenile copepods. The correct Table 2 appears below.
In the published article, there was an error in Supplementary Figure 1. Because of a typing error in the R code to calculate copepod secondary production, the formula for juvenile broadcast-spawning copepods was wrongly applied to calculate the secondary production of all copepod species, instead of using the respective formulas for sac-spawning and broadcast-spawning adult and juvenile copepods. The correct Figure 1 appears below.
In the published article, there was an error in Supplementary Figure 4. Because of a typing error in the R code to calculate copepod secondary production, the formula for juvenile broadcast-spawning copepods was wrongly applied to calculate the secondary production of all copepod species, instead of using the respective formulas for sac-spawning and broadcast-spawning adult and juvenile copepods. The correct Figure 4 appears below.
The authors apologize for these errors and state that this does not change the scientific conclusions of the article in any way. The original article has been updated.
Text Correction
In the published article, there was an error. Because of a typing error in the R code to calculate copepod secondary production, the formula for juvenile broadcast-spawning copepods was wrongly applied to calculate the secondary production of all copepod species, instead of using the respective formulas for sac-spawning and broadcast-spawning adult and juvenile copepods.
A correction has been made to Abstract, Paragraph 1. This sentence previously stated:
“Our results show how pelagic communities might function in a future ice-free Barents Sea, in which the main component of the communities are smaller copepods, and the secondary production they generate is available in energetically less resource-rich portions.”
The corrected sentence appears below:
“Our results show how pelagic communities might function in a future ice-free Barents Sea, in which the main component of the communities are smaller-sized copepod species (including smaller-sized Calanus and small copepods), and the secondary production they generate is available in energetically less resource-rich portions.”
The authors apologize for this error and state that this does not change the scientific conclusions of the article in any way. The original article has been updated.
A correction has been made to Results, 3.2.4. Copepod secondary production, Paragraph 1, 2, 3. This paragraph previously stated:
“The secondary production of copepods in the upper 100 m was highest on the Barents Sea shelf, lower at the Atlantic station P1 and the lowest at stations in the Arctic Ocean basin. At the Atlantic station P1, total estimated secondary production was 99.7 and 142.7 mg C m-2 d-1 in 2018 and 2019, respectively. Small copepods (72.5 and 82.9 mg C m-2 d-1 2018 and 2019, respectively) and their nauplii (20.4 and 16.2 mg C m-2 d-1 2018 and 2019, respectively) contributed most to the total copepod secondary production (Figures 2E, F). The production of large copepods at the Atlantic station was only 2.0 mg C m-2 d-1 in 2018 while it was 32.7 mg C m-2 d-1 in 2019.
The total estimated secondary production on the Barents Sea shelf ranged between 79.1-175.2 mg C m-2 d-1 in 2018 and 144.6- 222.7 mg C m-2 d-1 in 2019. There was a change between years in the relative contribution of different groups to total secondary production of copepods on the Barents Sea shelf. In 2018, copepod nauplii and small copepods accounted for most of the production in the southern part of the Barents Sea shelf (stations P2 and P3), while Calanus spp. accounted for the majority of production in the northern part (stations P4 and P5). In 2019, Calanus spp. accounted for most of the copepod secondary production at all stations except station P3, where calanoid nauplii had a higher share in production of 36.7% (Figures 2E, F). C. finmarchicus made up 13-39% of Calanus spp. production on the Barents Sea shelf in 2018 and 0.5-12% in 2019. C. glacialis made up 41-85% in 2018 and 79-95% in 2019. C. hyperboreus made up 2-19% in 2018 and 2-9% in 2019 (Figures 2C, D).
The secondary production of copepods in the Arctic Ocean basin ranged from 25.4-50.0 mg C m-2 d-1 in 2018 to 48.7 mg C m-2 d-1 in 2019 and resulted mainly from the production of Calanus spp. (45-53% in 2018, 74% in 2019) and small copepods and their nauplii (Figures 2E, F).”
The corrected sentence appears below:
“The secondary production of copepods in the upper 100 m was highest on the Barents Sea shelf and lower at the Atlantic station P1 and at stations in the Arctic Ocean basin. At the Atlantic station P1, total estimated secondary production was 22.3 and 64.3 mg C m-2 d-1 in 2018 and 2019, respectively. Small copepods (13.8 and 19.3 mg C m-2 d-1 2018 and 2019, respectively) and their nauplii (1.8 and 1.4 mg C m-2 d-1 2018 and 2019, respectively) contributed considerably to the total copepod secondary production (Figures 2E, F). The production of large copepods at the Atlantic station was only 1.9 mg C m-2 d-1 in 2018 while it was 32.7 mg C m-2 d-1 in 2019.
The total estimated secondary production on the Barents Sea shelf ranged between 77.6-144.8 mg C m-2 d-1 in 2018 and 162.1-272.2 mg C m-2 d-1 in 2019. There was a change between years in the relative contribution of different groups to total secondary production of copepods on the Barents Sea shelf. In 2018, copepod nauplii and small copepods accounted for a large part of the production in the southern-most part of the Barents Sea shelf (station P2), while Calanus spp. accounted for the majority of production in the remaining northern part (stations P3, P4, P5). In 2019, Calanus spp. accounted for most of the copepod secondary production at all stations except station P3, where calanoid nauplii had a higher share in production, amounting to 37.2% (Figures 2E, F). C. finmarchicus made up 13-39% of Calanus spp. production on the Barents Sea shelf in 2018 and 0.2-9% in 2019. C. glacialis made up 41-83% in 2018 and 83-97% in 2019. C. hyperboreus made up 2-19% in 2018 and 2-6% in 2019 (Figures 2C, D).
The secondary production of copepods in the Arctic Ocean basin ranged from 28.9-74.0 mg C m-2 d-1 in 2018 to 49.2 mg C m-2 d-1 in 2019 and resulted mainly from the production of Calanus spp. (72-89% in 2018, 89% in 2019) (Figures 2E, F).”
A correction has been made to Results, 3.3.1 Differences in bulk abundance, biomass, and secondary production, Paragraph 2. This sentence previously stated:
“The only copepod species for which significant interannual differences were found was C. finmarchicus. The mean abundance, biomass, and secondary production of C. finmarchicus were significantly different between the two years (abundance, p <0.001; biomass, p = 0.007; secondary production, p <0.001, Supplementary Table 2) and the interaction between year and location had a significant effect (abundance, p = 0.018; biomass, p = 0.003; secondary production, p = 0.003, Supplementary Table 2).”
The corrected sentence appears below:
“The only copepod species for which significant interannual differences were found was C. finmarchicus. The mean abundance, biomass, and secondary production of C. finmarchicus were significantly different between the two years (abundance, p <0.001; biomass, p = 0.007; secondary production, p = 0.001, Supplementary Table 2) and the interaction between year and location had a significant effect (abundance, p = 0.018; biomass, p = 0.003; secondary production, p = 0.002, Supplementary Table 2).”
A correction has been made to Results, 3.3.1 Differences in bulk abundance, biomass, and secondary production, Paragraph 3. This sentence previously stated:
“The mean bulk abundance, biomass, and secondary production of Oithona spp., Pseudocalanus spp., Microcalanus spp., Microsetella norvegica and remaining small copepods combined were significantly different between locations (abundance, p = 0.006; biomass, p = 0.003, secondary production, p = 0.003, Supplementary Table 2).”
The corrected sentence appears below:
“The mean bulk abundance, biomass, and secondary production of Oithona spp., Pseudocalanus spp., Microcalanus spp., Microsetella norvegica and remaining small copepods combined were significantly different between locations (abundance, p = 0.006; biomass, p = 0.003, secondary production, p < 0.001, Supplementary Table 2).”
A correction has been made to Results, 3.3.1 Differences in bulk abundance, biomass, and secondary production, Paragraph 3. This sentence previously stated:
“The mean abundance, biomass, and secondary production of the small copepods O. similis and M. norvegica varied significantly with location (O. similis abundance, p = 0.038; O. similis biomass, p = 0.020; O. similis secondary production, p = 0.021 and M. norvegica abundance, p = 0.013; M. norvegica biomass, p = 0.013; M. norvegica production, p = 0.010, Supplementary Table 2).”
The corrected sentence appears below:
“The mean abundance, biomass, and secondary production of the small copepods O. similis and M. norvegica varied significantly with location (O. similis abundance, p = 0.038; O. similis biomass, p = 0.020; O. similis secondary production, p = 0.018 and M. norvegica abundance, p = 0.013; M. norvegica biomass, p = 0.013; M. norvegica production, p = 0.002, Supplementary Table 2).”
A correction has been made to Results, 3.3.2 Copepod community composition, Paragraph 1. This sentence previously stated:
“Mean abundance, biomass, and secondary production of the copepod community differed significantly when testing for the interaction between year and location simultaneously (CCA abundance, p = 0.004; RDA biomass, p = 0.011; RDA production, p = 0.008, Table 4).”
The corrected sentence appears below:
“Mean abundance, biomass, and secondary production of the copepod community differed significantly when testing for the interaction between year and location simultaneously (CCA abundance, p = 0.004; RDA biomass, p = 0.011; RDA production, p = 0.049, Table 4).”
A correction has been made to Results, 3.3.2 Copepod community composition, Paragraph 2. This sentence previously stated:
“The RDA accounted for 27.21% of total variation in the secondary production data (Table 5), with the first axis accounting for 18.46% and the second axis for 5.54% of the explained variability.”
The corrected sentence appears below:
“The RDA accounted for 28.77% of total variation in the secondary production data (Table 5), with the first axis accounting for 20.35% and the second axis for 5.72% of the explained variability.”
A correction has been made to Discussion, 4.1 Effect of interannual variation of sea-ice cover on copepod secondary production, Paragraph 1. This sentence previously stated:
“Integrated bulk copepod secondary production for the upper 100 m ranged between 99.7-142.7 mg C m-2 d-1 in the Atlantic region, 79.1-222.7 mg C m-2 d-1 on the Barents Sea shelf and 25.4-50.0 mg C m-2 d-1 in the Arctic Ocean basin (Figures 2E, F).”
The corrected sentence appears below:
“Integrated bulk copepod secondary production for the upper 100 m ranged between 22.3-64.3 mg C m-2 d-1 in the Atlantic region, 77.6-272.2 mg C m-2 d-1 on the Barents Sea shelf and 28.9-74.0 mg C m-2 d-1 in the Arctic Ocean basin (Figures 2E, F).”
A correction has been made to Discussion, 4.2 Higher water temperature and the specific structuring of the microbial food web promoted secondary production of small copepods, Paragraph 1. This sentence previously stated:
“Daily secondary production rates of 5.6-73.3 mg C m-2 d-1 for small copepods on the Barents Sea shelf are in good agreement with secondary production rates previously recorded in other Arctic regions.”
The corrected sentence appears below:
“Daily secondary production rates of 1.0-9.7 mg C m-2 d-1 for small copepods on the Barents Sea shelf are in good agreement with secondary production rates previously recorded in other Arctic regions.”
A correction has been made to Discussion, 4.2 Higher water temperature and the specific structuring of the microbial food web promoted secondary production of small copepods, Paragraph 1. This sentence previously stated:
“When comparing the integrated secondary production of small copepods reported in the present study to the integrated primary production in 2018, it becomes apparent that small copepods played an important role for carbon transport to higher trophic levels. At the Atlantic station P1, the integrated primary production in the upper 100 m was 632 mg C m-2 d-1 (Amargant-Arumí et al., 2024) and secondary production of small copepods was 72.5 mg C m-2 d-1, which equals an energy transfer of 12%. On the Barents Sea shelf, integrated primary production was between 652-710 mg C m-2 d-1 (stations P4 and P2, respectively, Amargant-Arumí et al., 2024) and secondary production of small copepods was 22.9-73.3 mg C m-2 d-1 (stations P4 and P2, respectively), equal to an energy transfer of 4-10%.”
The corrected sentence appears below:
“When comparing the integrated secondary production of small copepods reported in the present study to the integrated primary production in 2018, it becomes apparent that small copepods played a moderate role for carbon transport to higher trophic levels. At the Atlantic station P1, the integrated primary production in the upper 100 m was 632 mg C m-2 d-1 (Amargant-Arumí et al., 2024) and secondary production of small copepods was 13.8 mg C m-2 d-1, which equals an energy transfer of 2.2%. On the Barents Sea shelf, integrated primary production was between 652-710 mg C m-2 d-1 (stations P4 and P2, respectively, Amargant-Arumí et al., 2024) and secondary production of small copepods was 4.3-9.7 mg C m-2 d-1 (stations P4 and P2, respectively), equal to an energy transfer of 0.6-1.4%.”
A correction has been made to Discussion, 4.3 Water mass distribution shaped the spatial pattern of secondary production of Calanus finmarchicus. Paragraph 1. This sentence previously stated:
“The daily secondary production rates of large copepods in the range of 50.8-144.6 mg C m-2 d-1 for the Barents Sea shelf reported in this study are in good agreement with secondary production previously recorded in other Arctic regions.”
The corrected sentence appears below:
“The daily secondary production rates of large copepods in the range of 50.8-250.7 mg C m-2 d-1 for the Barents Sea shelf reported in this study are in good agreement with secondary production previously recorded in other Arctic regions.”
A correction has been made to Discussion, 4.3 Water mass distribution shaped the spatial pattern of secondary production of Calanus finmarchicus. Paragraph 1. This sentence previously stated:
“On the Barents Sea shelf, integrated primary production in the upper 100 m was 261-551 mg C m-2 d-1 (stations P5 and P4, respectively) and secondary production of large copepods was 105-125 mg C m-2 d-1 (stations P4 and P5, respectively), equivalent to an energy transfer of 19-55%. At the Atlantic station P1, energy transfer only equaled 10%, based on an integrated primary production of 340 mg C m-2 d-1 and secondary production of large copepods of 32.7 mg C m-2 d-1.”
The corrected sentence appears below:
“On the Barents Sea shelf, integrated primary production in the upper 100 m was 261-551 mg C m-2 d-1 (stations P5 and P4, respectively) and secondary production of large copepods was 182.8-250.7mg C m-2 d-1 (stations P4 and P5, respectively), equivalent to an energy transfer of 33.2-96.1%. At the Atlantic station P1, energy transfer only equaled 10%, based on an integrated primary production of 340 mg C m-2 d-1 and secondary production of large copepods of 32.7 mg C m-2 d-1.”
A correction has been made to Discussion, 4.5 Changes in copepod secondary production and the marine food web. Paragraph 1. This sentence previously stated:
“Similar to the observed trends in other regions of the Arctic, we hypothesize that the recruitment of commercially and ecologically important fish species in the Barents Sea, such as polar cod, capelin, and Atlantic herring, may be lower in years with increased water temperature and reduced summer sea-ice, due to a shift towards a more generalist diet based on small, less lipid-rich copepods.”
The corrected sentence appears below:
“Similar to the observed trends in other regions of the Arctic, we hypothesize that the recruitment of commercially and ecologically important fish species in the Barents Sea, such as polar cod, capelin, and Atlantic herring, may be lower in years with increased water temperature and reduced summer sea-ice, due to a shift towards a more generalist diet based on smaller-sized, less lipid-rich copepods.”
A correction has been made to Discussion, 4.5 Changes in copepod secondary production and the marine food web. Paragraph 2. This sentence previously stated:
“A shift of the copepod community towards smaller species will possibly be reflected in a compositional and quantitative change of the vertical flux in the Barents Sea.”
The corrected sentence appears below:
“A shift of the copepod community towards smaller-sized species will possibly be reflected in a compositional and quantitative change of the vertical flux in the Barents Sea.”
A correction has been made to Conclusion. Paragraph 1. This sentence previously stated:
“Copepod secondary production on the Barents Sea shelf was overall highest and mainly driven by large Calanus spp., while copepod production in the Arctic Ocean basin was comparatively low.”
The corrected sentence appears below:
“Copepod secondary production on the northern Barents Sea shelf, the study focus area, was overall highest and mainly driven by large Calanus spp.”
A correction has been made to Conclusion. Paragraph 2. This sentence previously stated:
“The results of our study confirm the observations that, as a result of Arctic warming and reduced sea ice, large copepods may become less important and small copepods more important components of pelagic communities, which will have consequences for the secondary production of copepods, as well as for the role of copepods in bio-geochemical cycles, the carbon pump and other functions performed by the ecosystem. The development and growth of small copepods, and therefore their production, appear to depend more directly and unambiguously on water temperature than on food-availability. This implies that a large part of the future secondary production in the Barents Sea may be related to the prevalence of smaller copepods, which represent a food source that is less rich in energy and lipids.”
The corrected sentence appears below:
“The results of our study confirm the observations that, as a result of Arctic warming and reduced sea ice, large copepods may become less important and smaller-sized copepod species (including smaller-sized Calanus and small copepods) more important components of pelagic communities, which will have consequences for the secondary production of copepods, as well as for the role of copepods in food webs, bio-geochemical cycles, including the biological carbon pump, and other functions performed by them in the ecosystem.”
The authors apologize for all the errors that needed to be corrected and state that this does not change the scientific conclusions of the article in any way. The original article has been updated.
All claims expressed in this article are solely those of the authors and do not necessarily represent those of their affiliated organizations, or those of the publisher, the editors and the reviewers. Any product that may be evaluated in this article, or claim that may be made by its manufacturer, is not guaranteed or endorsed by the publisher.
Keywords: sea-ice cover, copepod community composition, secondary production, northern Barents Sea, interannual variability, sea-ice melt
Citation: Gawinski C, Daase M, Primicerio R, Amargant-Arumí M, Müller O, Wold A, Ormańczyk MR, Kwasniewski S and Svensen C (2024) Corrigendum: Response of the copepod community to interannual differences in sea-ice cover and water masses in the northern Barents Sea. Front. Mar. Sci. 11:1440395. doi: 10.3389/fmars.2024.1440395
Received: 29 May 2024; Accepted: 19 June 2024;
Published: 05 July 2024.
Edited and Reviewed by:
Letterio Guglielmo, Anton Dohrn Zoological Station Naples, ItalyCopyright © 2024 Gawinski, Daase, Primicerio, Amargant-Arumí, Müller, Wold, Ormańczyk, Kwasniewski and Svensen. This is an open-access article distributed under the terms of the Creative Commons Attribution License (CC BY). The use, distribution or reproduction in other forums is permitted, provided the original author(s) and the copyright owner(s) are credited and that the original publication in this journal is cited, in accordance with accepted academic practice. No use, distribution or reproduction is permitted which does not comply with these terms.
*Correspondence: Christine Gawinski, Q2hyaXN0aW5lLmdhd2luc2tpQHVpdC5ubw==
Disclaimer: All claims expressed in this article are solely those of the authors and do not necessarily represent those of their affiliated organizations, or those of the publisher, the editors and the reviewers. Any product that may be evaluated in this article or claim that may be made by its manufacturer is not guaranteed or endorsed by the publisher.
Research integrity at Frontiers
Learn more about the work of our research integrity team to safeguard the quality of each article we publish.