- 1Key Laboratory of Ministry of Natural Resources for Marine Environmental Information Technology, National Marine Data and Information Service, Ministry of Natural Resources, Tianjin, China
- 2Key Laboratory of Ocean Circulation and Waves, Institute of Oceanology, Chinese Academy of Sciences, Qingdao, China
- 3Center for Ocean Mega-Science, Chinese Academy of Sciences, Qingdao, China
- 4Pilot National Laboratory for Marine Science and Technology, Qingdao, China
Subsurface eddies (SSEs) are a particular type of oceanic eddy that is a common feature in the ocean. The biogeochemical properties of the SSEs differ from those of surface eddies (SEs) and surrounding water, due to their unique physical processes. The biogeochemical property of SSEs in the east of the Philippines were investigated using numerical simulations, including their statistical characteristics, three-dimensional biogeochemical structures and transports, as well as contribution to changes in biogeochemical variables. A total of 501 subsurface anticyclonic eddies (SSAE) and 345 subsurface cyclonic eddies (SSCE) were identified during 2019–2022. Compared with the SEs, the temperature, nitrate (NO3) and dissolved oxygen (DO) anomalies of the SSEs east of the Philippines have two significant anomalous cores of opposite phase: at 200–400 m and 600–800 m, respectively, with the location of the largest meridional velocity (~400 m) being the boundary between positive and negative anomalies. SSEs also play an essential role in influencing chlorophyll (CHL) distribution, with SSAE (SSCE) causing an increase (decrease) in CHL at the euphotic zone (~110 m). In addition, the SSEs-induced NO3, DO and CHL transport and their contributions to the changes in biogeochemical variables were also illustrated for the first time. In more than half of the investigated region, there was a net westward transport of DO and a predominant eastward transport of NO3, primarily attributed to SSAE. Regarding CHL transport in the euphotic zone, SSAE is the primary contributor, with a notable westward CHL transport observed in the study area, and mainly a northward transport occurring north of 12°N. In particular, the NO3 concentration in the euphotic zone was considerably increased by SSAE (up to 12.6%) under average conditions, contributing to primary productivity, which can be critical for biological processes.
1 Introduction
Mesoscale eddies are prevalent in the oceans and encompass a series of different interactions between physical, chemical, and biological processes that affect ocean circulation, climate change, and carbon cycling on long time scales. Based on the vertical structure and core depth, mesoscale eddies are classified into surface-intensified eddies (SEs) and subsurface-intensified eddies (SSEs, Zhang et al., 2017). The surface cyclonic (anticyclonic) eddies exhibit maximum velocities and isopycnal deformation at the sea surface or upper mixed layer, accompanied by convex (concave) isopycnal surfaces, which induce cooling (warming) of the sea surface at the center of the eddy. Subsurface cyclonic (anticyclonic) eddies, on the other hand, exhibit a concave (convex) lens structure, warming (cooling) the sea surface at the eddy center, with temperature and salinity cores and maximum velocities below the mixed layer (Shapiro and Meschanov, 1991; Thomsen et al., 2016; Lin et al., 2017; Nan et al., 2017; Yang et al., 2019; Zhu et al., 2021). The SSEs have also been referred to as intrathermocline eddies (Gordon et al., 2002; Qiao et al., 2023; Liu and Jing, 2024) or subthermocline eddies (Chiang and Qu, 2013; Chiang et al., 2015), depending on the depth at which their cores are located and the position with respect to the thermocline.
SEs can be easily identified from satellite remote sensing data (e.g., sea level anomaly, sea surface temperature, etc.) and are well understood (Chelton et al., 2007, 2011; Dong et al., 2011; Faghmous et al., 2015; Dong et al., 2022), whereas SSEs are relatively less known because they rely on in-situ measurements or model output. Despite their lower occurrence frequency than SEs, SSEs are prevalent in the western North Pacific, with some regions having higher frequencies than SEs (e.g., east of the Philippines, North Equatorial Current). Their significance is comparable to that of SEs, as demonstrated by recent studies (Xu et al., 2019, 2020; Nan et al., 2022). With the gradual accumulation of ocean profile observations, more and more studies on SSEs have been carried out (Yang et al., 2019; Belkin et al., 2020; Zhu et al., 2021; Song et al., 2022; Sun et al., 2022; Wang et al., 2023a).
As mentioned above, the east of the Philippines, situated in the northwest Pacific and characterized by a complex three-dimensional ocean current system, provides favorable conditions for the formation of SSEs. Various observational studies have highlighted important oceanographic features and SSEs in the region. Song et al. (2017) suggested the existence of a quasi-permanent subsurface anticyclonic eddy east of Mindanao, which is closely associated with the Mindanao Undercurrent. Using data collected from moorings and buoys, Nan et al. (2019) found that a subsurface eddy located east of the Philippines acts as an ‘underwater mixer’ of intermediate waters from the north and south Pacific. More recently, Song et al. (2022) identified two subsurface anticyclonic lenses through multi-instrumental measurements in east of the Philippines. Mooring measurements imply that one of the lenses17 probably originates from the south or southeast along the western boundary. These studies collectively underscore the dynamic and intricate nature of the ocean currents in this region, which play a crucial role in the formation and behavior of SSEs.
As is well known, the thermal and salt transport induced by eddies is crucial for global climate change. The transport of volume, heat, and salt by mesoscale eddies has been quantified based on satellite data and Argo floats (Zhang et al., 2014; Dong et al., 2014, 2017; Mo et al., 2024). Moreover, climate change depends on many important processes related to SSEs, such as how much heat, nutrient and carbon fluxes are induced by SSEs, and how this process responds to global warming. A fuller understanding of their structural and dynamical properties is needed to answer these questions. Xu et al. (2020) and Zhang et al. (2024) statistically analyzed the SSEs in the northwest Pacific Ocean based on model data, as well as gave their vertical thermohaline structure, volume and thermohaline transport. This serves as an effective supplement to the eddy-induced volume and thermohaline transport.
Meanwhile, eddies play a crucial role in the regional marine ecosystem. They transport nutrients, larvae, and other marine organisms between different habitats, supporting a rich biodiversity of fish, mammals, invertebrates, and microorganisms. In addition to this, the east of Philippines is an important spawning ground for Japanese eels, which has practical socio-economic effects (Yu, 1992). An intriguing question may immediately come to mind, that of what the role of active SSEs in biogeochemical transport in the east of Philippines. However, previous studies do not reveal the structure and transport of biogeochemical variables caused by SSEs.
Multiple-platform observations and the availability of BGC-Argo with an optical probe provide an opportunity to unravel the biogeochemical characteristics of SSEs. As a result, some SSE case studies have emerged. Using multiple-platform observations and reanalysis products, the characteristics of temperature, salinity and dissolved oxygen of a subsurface anticyclonic eddy was investigated in the eastern equatorial Indian Ocean (Hu et al., 2022). The 3D biogeochemical structure of a long-lived subsurface anticyclonic eddy was investigated using BGC-Argo and model data in the Northwest Pacific (Ding et al., 2022). Due to the special lens-shaped structure, SSEs can be equally important sources of nutrients to the euphotic zone, greatly enhancing carbon uptake and primary productivity from the atmosphere to the deep ocean (McGillicuddy et al., 2007; Schütte et al., 2016). Therefore, it is of great significance to obtain the 3D biogeochemical structure of SSEs and to assess their role in marine biogeochemical cycling processes.
Overall, previous studies have investigated the biogeochemical spatial structure of individual SSE using observations and numerical models, and obtained the composite vertical thermohaline structures and thermohaline transport of SSEs. However, the distribution of SSEs’ 3D biogeochemical structures, biogeochemical transport, and their contributions to biogeochemical cycles still remain to be investigated, which is what we try to address in this paper. The remaining sections are organized as follows. A brief description of the data and methods, as well as comparisons between observations and model output are given in Section 2. The composite vertical structure of the SSEs in terms of temperature, salinity, velocity, chlorophyll (CHL), nitrate (NO3), and dissolved oxygen (DO) anomalies are presented in Section 3.1, which are compared to the SEs. The contribution of SSEs to changes in the biogeochemical variables is investigated in Section 3.2. Eddy-induced biogeochemical transport is analyzed in Section 3.3. Finally, a summary and discussion are given in Section 4.
2 Data and method
2.1 Copernicus global ocean analysis
Copernicus Marine Environmental Monitoring Service (CMEMS) (http://marine.copernicus.eu/) is an important global observation and monitoring program organized by the European Union. This study used global ocean physical analysis and forecasting product GLOBAL_ANALYSISFORECAST_PHY_001_024 provided by CMEMS (https://catalogue.marine.copernicus.eu/documents/PUM/CMEMS-GLO-PUM-001-024.pdf). The Mercator Global Ocean forecasting system (Lellouche et al., 2018) is produced by Mercator Océan (France). The model includes multivariate data assimilation, incorporating a singular extended Kalman (SEEK) filter analysis of along-track satellite sea level anomaly (SLA) and sea surface temperature (SST), along with in situ temperature and salinity profiles. This product contains 3D potential temperature, salinity and currents information from top to bottom over the global ocean. The global ocean output files are displayed with a 1/12-degree horizontal resolution with regular longitude/latitude equirectangular projection and on 50 standard levels. The quality of the Global Ocean Physics Analysis and Forecast Product has been described in the Quality Information Document (Lellouche et al., 2024, https://catalogue.marine.copernicus.eu/documents/QUID/CMEMS-GLO-QUID-001-024.pdf).
Copernicus Marine Service global biogeochemical analysis and forecast product GLOBAL_ANALYSIS_FORECAST_BGC_001_028(https://catalogue.marine.copernicus.eu/documents/PUM/CMEMS-GLO-PUM-001-028.pdf) was used to obtain subsurface mesoscale eddy biogeochemical structures. This product is produced at Mercator Ocean International (Toulouse, France). It provides biogeochemical fields of CHL concentration, NO3, phosphate, silicate, DO, dissolved iron, primary production, phytoplankton, pH, dissolved inorganic carbon, total alkalinity, surface partial pressure of carbon dioxide and light attenuation coefficient. The global ocean output files are displayed with a 1/4-degree horizontal resolution with regular longitude/latitude equirectangular projection and 50 vertical levels are ranging from 0 to 5500 meters. This product is based on the PISCES biogeochemical model. It is forced offline at a daily frequency by GLOBAL_ANALYSISFORECAST_PHY_001_024 coarsened at 1/4 degree, with SEEK-based Data Assimilation of OCEANCOLOUR_GLO_BGC_L4_NRT_009_102. The PISCES biogeochemical model is available on the NEMO (https://www.nemo-ocean.eu/) modelling platform. The quality of the global biogeochemical system has been assessed using an 11-year hindcast simulation (2008–2018), as described in the quality information document (https://catalogue.marine.copernicus.eu/documents/QUID/CMEMS-GLO-QUID-001-028.pdf) and synthesis quality overview document(https://catalogue.marine.copernicus.eu/documents/SQO/CMEMS-GLO-SQO-001-028.pdf).
This study utilizes daily 3D temperature, salinity, zonal and meridional velocity, CHL, NO3 and DO from 2019 to 2022, covering the latitudinal range of 120°E to 140°E and 0°N to 20°N, and the depth range of 0 m to 1941 m.
2.2 Identification of subsurface eddy
The difference between SSEs and SEs is that SSEs cannot be accurately identified based on altimeter data alone. Therefore, the authors use the Okubo-Weiss parameter method (Okubo, 1970; Weiss, 1991), which is most widely used in mesoscale eddy automatic detection and is particularly suitable for high-resolution numerical models, to detect eddies at individual depths in the model data. In this study, a SSE identification method proposed by the authors based on the high-resolution model data was utilized (Xu et al., 2019, 2020), and firstly, the 3D W parameter distribution was obtained by using the 3D current data, and the Okubo-Weiss parameter was defined as , where represents the shear rate of deformation, given by ; and represents the stretching rate of deformation, calculated as ; and represents relative vorticity, which is . In this context, u and v denote the zonal and meridional velocity components, respectively. The symbols and signify the partial derivatives of a function with respect to longitude and latitude, respectively.
The W-field was smoothed with half-power filters of 1° × 1° to reduce the W-noise. Following this, a sensitivity analysis was conducted on the threshold parameter W0, which determines the boundary of eddies. The results indicated that the most effective threshold value for eddy identification was 0.2. Consequently, the eddy boundary was determined by extracting the threshold contour W0=-0.2σw, where σw denotes the standard deviation of W. Despite the definition of a fixed threshold of 0.2, it is important to highlight that the threshold parameter σw was calculated at every time step, covering the specified domain and depth. Furthermore, vorticity was used to differentiate cyclonic and anticyclonic eddies. In addition, a screening of the eddy shape and velocity at the eddy center was carried out. As the W0 contour wrapped region may be extremely irregular, eddy shape errors greater than 70% and anomalous identification regions with velocity greater than 0.2 m/s near the eddy center were excluded. Kurian et al. (2011) provided a detailed description of eddy shape test, as well as more specific SSE identification process references to the authors’ previous work (Xu et al., 2019).
2.3 Subsurface eddy tracking method
SSEs were detected daily in the form of snapshots, and once the daily eddy fields were identified, continuous trajectories of a given eddy were obtained by tracking them continuously in time for individual eddies. For facilitating the calculation, 0 is used in the 3D matrix to represent the background flow field, 1 for the anticyclonic eddy, and -1 for the cyclonic eddy. Subsequently, the connecting region marking method is employed to identify contiguous areas in the above 3D matrix, where each contiguous area represents an eddy. Based on the marking results, the precise spatial location of the eddy in each layer is determined, and the radius of each eddy is computed. In order to distinguish SEs from SSEs, in this study, only eddies with the overall structure of the contiguous region below 50 m are identified as subsurface mesoscale eddies.
2.4 Comparison between observations and models
The Copernicus Global Ocean Analysis products have been widely used for the study of mesoscale eddies, as they are in good agreement with observations (Qian et al., 2018; Mason et al., 2019; Potter et al., 2021; Wang et al., 2023a). To verify the accuracy of the model outputs, the surface velocity was first compared with the mean eddy kinetic energy (EKE) calculated from satellite data (Supplementary Figure S1). EKE is the perturbation kinetic energy of the instantaneous sea water motion relative to the mean flow field. Its distribution is directly related to mesoscale eddy activity and is one of the most direct factors characterizing the intensity of eddy activity. As illustrated in the figure, the Kuroshio Extension region, Taiwan, and the east of the Ryukyus are the latitudinal high value zones of EKE. Notably, with the exception of the equatorial area, where the model’s EKE exceeds that of the satellite data, both datasets exhibit remarkably similar distribution patterns of EKE in the northwest Pacific. Therefore, it is feasible to identify the SSEs with the current data of this model outputs.
To study the biogeochemical structure of the SSEs, comparisons with existing observations were made to validate the accuracy of the model outputs. The surface and vertical distributions of the modelled CHL, NO3, and DO fields show a good agreement with both satellite data and BGC-Argo measurements (Lamouroux and Perruche, 2023). And the depth of the CHL maximum is well reproduced in the model (Ding et al., 2022). Lamouroux and Perruche (2023) also quantified errors for each biogeochemical variable using BGC-Argo: the model and float CHL concentrations with a correlation coefficient of 0.81, a positive bias of 0.26 log10(mg m-3) and an RMSD of 0.59 log10(mg m-3); the NO3 correlation coefficient of model and float is 0.98, with a negative bias of -0.91 mmol m-3 and an RMSD of 2.81 mmol m-3; for DO, a correlation coefficient of 0.96, a positive bias of 7.44 mmol m-3 and an RMSD of 16.61 mmol m-3. Based on our previous work (Ding et al., 2022), from April to November 2019, Argo2902754 was captured by a cyclonic eddy and the isopycnal was significantly elevated, and the model responded well to this mesoscale eddy. Therefore, it is reasonable to use the model data to study the biogeochemical effects of the mesoscale eddy. It is worth noting that for each eddy, the anomalies of each variable are subtracted from the regional mean within a 5°x5° box centered on the eddy. Consequently, the product error does not affect the composite structures of mesoscale eddy.
3 Result
3.1 3D structure of subsurface eddy
A total of 501 subsurface anticyclonic eddies (SSAEs) and 345 subsurface cyclonic eddies (SSCEs) were detected in the east of the Philippines during 01 Jan. 2019−31 Dec. 2022, of which SSAEs are numerically dominant. The distribution of the trajectories of SSE is depicted in Figure 1, SSEs is similar to SEs, moving westwards as a whole, with a meridional movement near the western boundary due to the Philippine coast. And SSEs originated at ~140°E (the research area is limited only to the west of 140°E) and travelled westward before terminating or originated off the coast of the Philippines (Chiang and Qu, 2013; Chiang et al., 2015). The mean radius and lifespan of SSCEs (SSAEs) are 70.7 km (76.8 km) and 49 (47) days, respectively, which is generally in agreement with previous research (Xu et al., 2019; Zhang et al., 2024). The mean radius of SSCEs is smaller than that of SSAEs, with the maximum (minimum) radius occurring in summer for SSCEs (SSAEs). The mean westward propagation speed of SSCEs (SSAEs) is about 6.2 (7.2) cm/s, which is slightly larger than the speed (~6 cm/s) recently reported by Zhang et al. (2024), and is also closer to the phase speed of the second mode baroclinic Rossby wave at low latitudes.
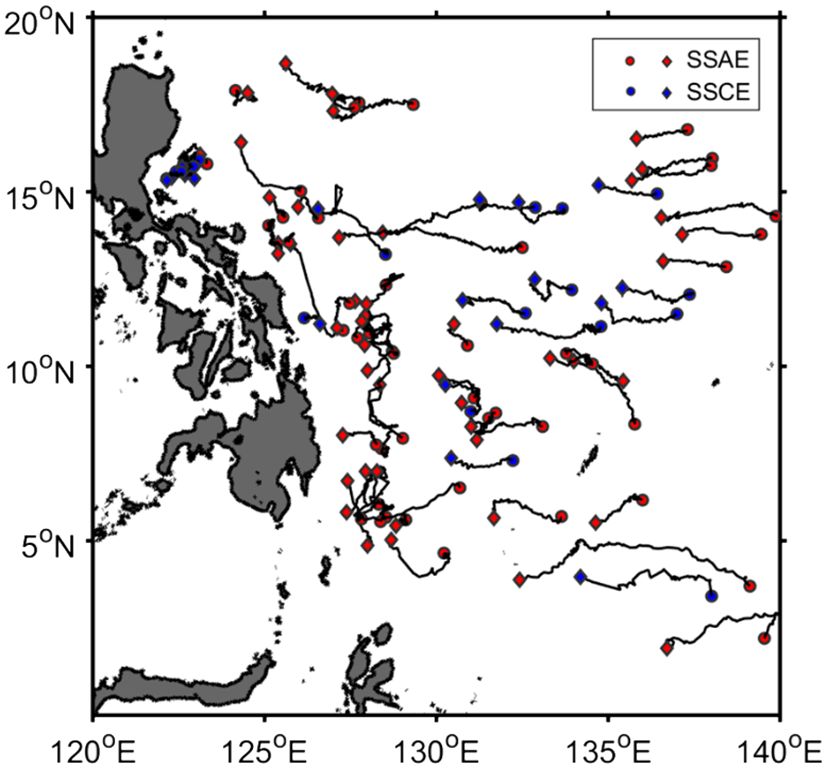
Figure 1. Trajectories of SSAE (red) and SSCE (blue) during period 2019–2022 with lifespan longer than 30 days. The red (blue) dots denote the origins of eddies, and the red (blue) diamonds denote their destinations.
To characterize the vertical structure of SSEs, composite maps of eddy anomalies (e.g. temperature, salinity, CHL, NO3 and DO) under the eddy coordinate system (Δx, Δy) were constructed for all identified SSEs. The eddies induced anomaly for a specific field at a particular time and depth was computed by subtracting the regional mean properties within a 5° × 5° box centered around the eddy. The vertical sections of temperature, salinity, and meridional velocity for the composite SSE along the zonal direction at Δy=0 are shown in Figure 2. As depicted in the Figures 2A, B, the composite temperature structure of SSAE and SSCE in the east of the Philippines has two significant anomalous cores: one located between 200−400 m and the other at 600−800 m. The location of the maximum velocity at 400 m is the separation of the positive and negative temperatures anomalies, and the structure of the double cores of such temperature anomalies is determined by the unique lens-shaped structure of ‘upper-convex and lower-concave (SSAE)’ or ‘upper-concave and lower-convex (SSCE)’.
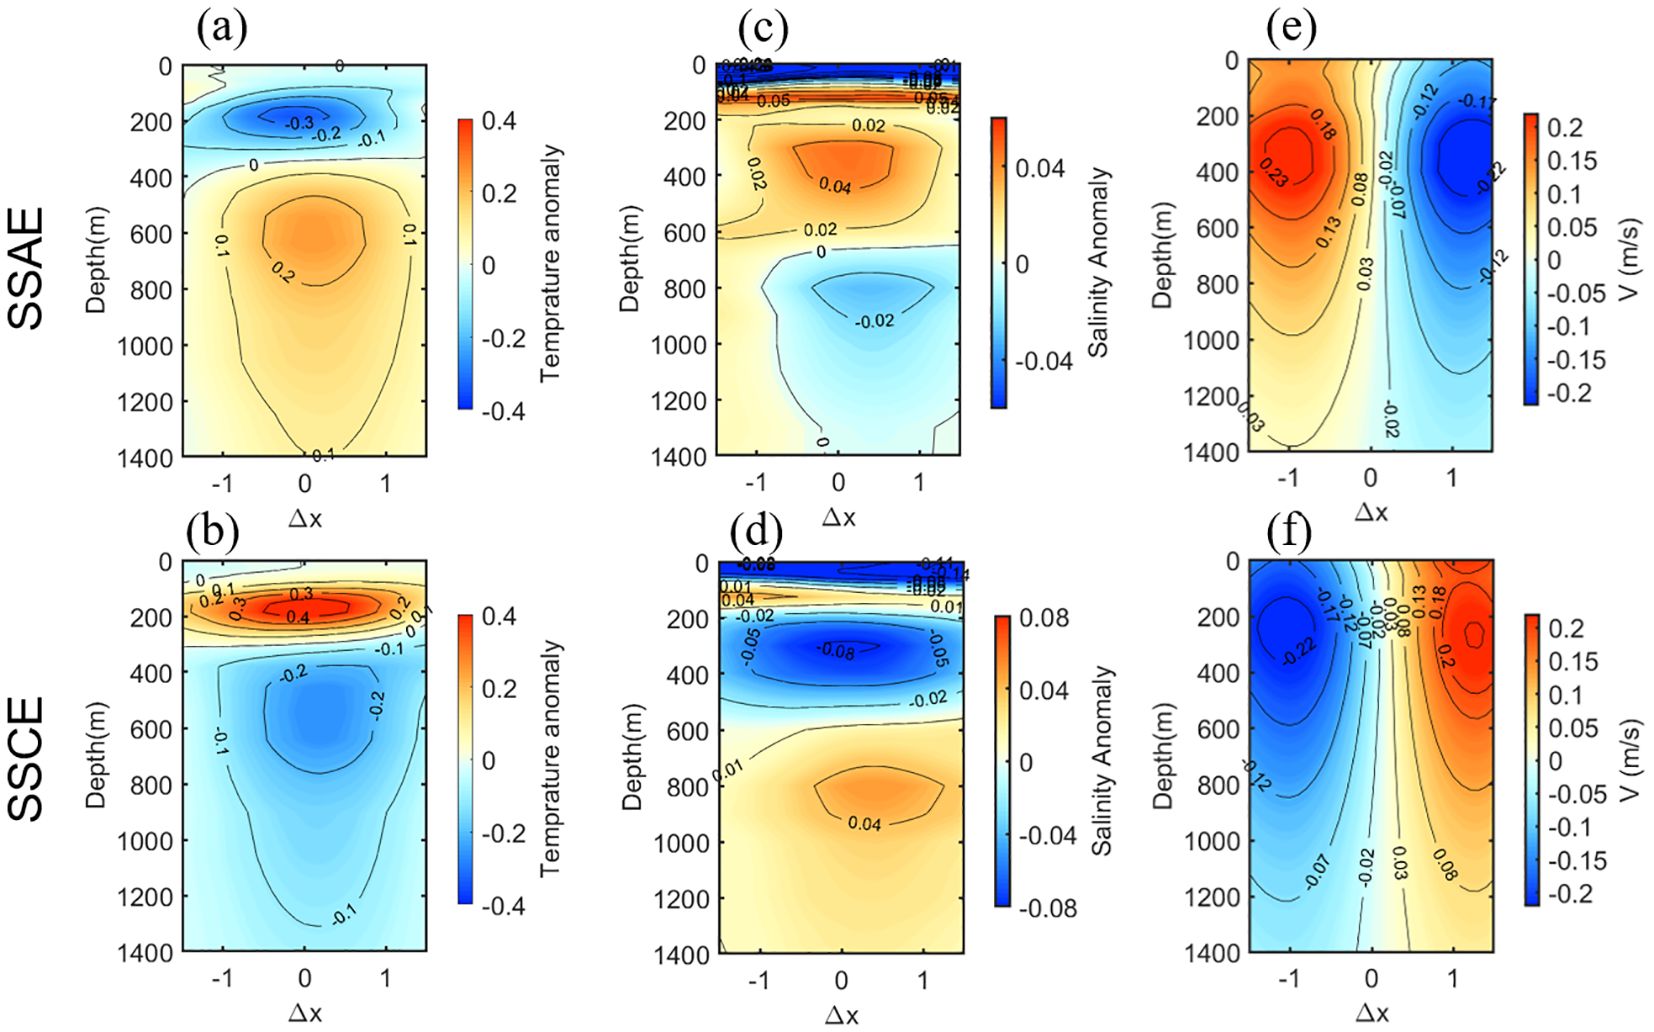
Figure 2. Vertical sections of zonal (A, B) temperature anomalies (unit: °C), (C, D) salinity anomalies and (E, F) meridional velocity of the composite SSAE and SSCE at Δy = 0 in the east of the Philippines. The horizontal coordinates are the normalized west (negative) and east (positive) distances from the eddy core.
In terms of the salinity composite structure, the salinity anomaly in the upper layer is more complex, and both the SSAE and the SSCE below 200 m have a double-core structure with the opposite spatial distribution characteristics of their vertical structures (Figures 2C, D). The velocity core of the SSE is located between ~200−600 m, with a maximum meridional velocity of ~0.23 m/s. The location of the maximum core is generally consistent with previous studies (Figures 2E, F, Wang, 2017; Xu et al., 2020; Zhang et al., 2024), and the meridional velocity extremes are larger than before.
To better compare the difference between the vertical structure of SSE and SE, the distribution of temperature anomalies, salinity anomalies and meridional velocity of composite SE east of the Philippines is given along the zonal direction at Δy=0 (Figure 3). Different from the SSE, which has two opposite anomalous cores, there is only one negative or positive temperature anomalous core due to the upward or depressing downward doming of the isopycnals in the SCE and SAE, as shown in Figures 3A, B. The extreme value of temperature anomaly caused by the SCE is -1.41°C, which is stronger than the 0.78°C caused by SAE. Both the salinity anomaly observed in the SAE and in the SCE above 400 m have a double-core structure (Figures 3C, D). The composite meridional velocity of both SAE and SCE peak at the surface, with the maximum speed of 0.4–0.5 m/s (Figures 3E, F).
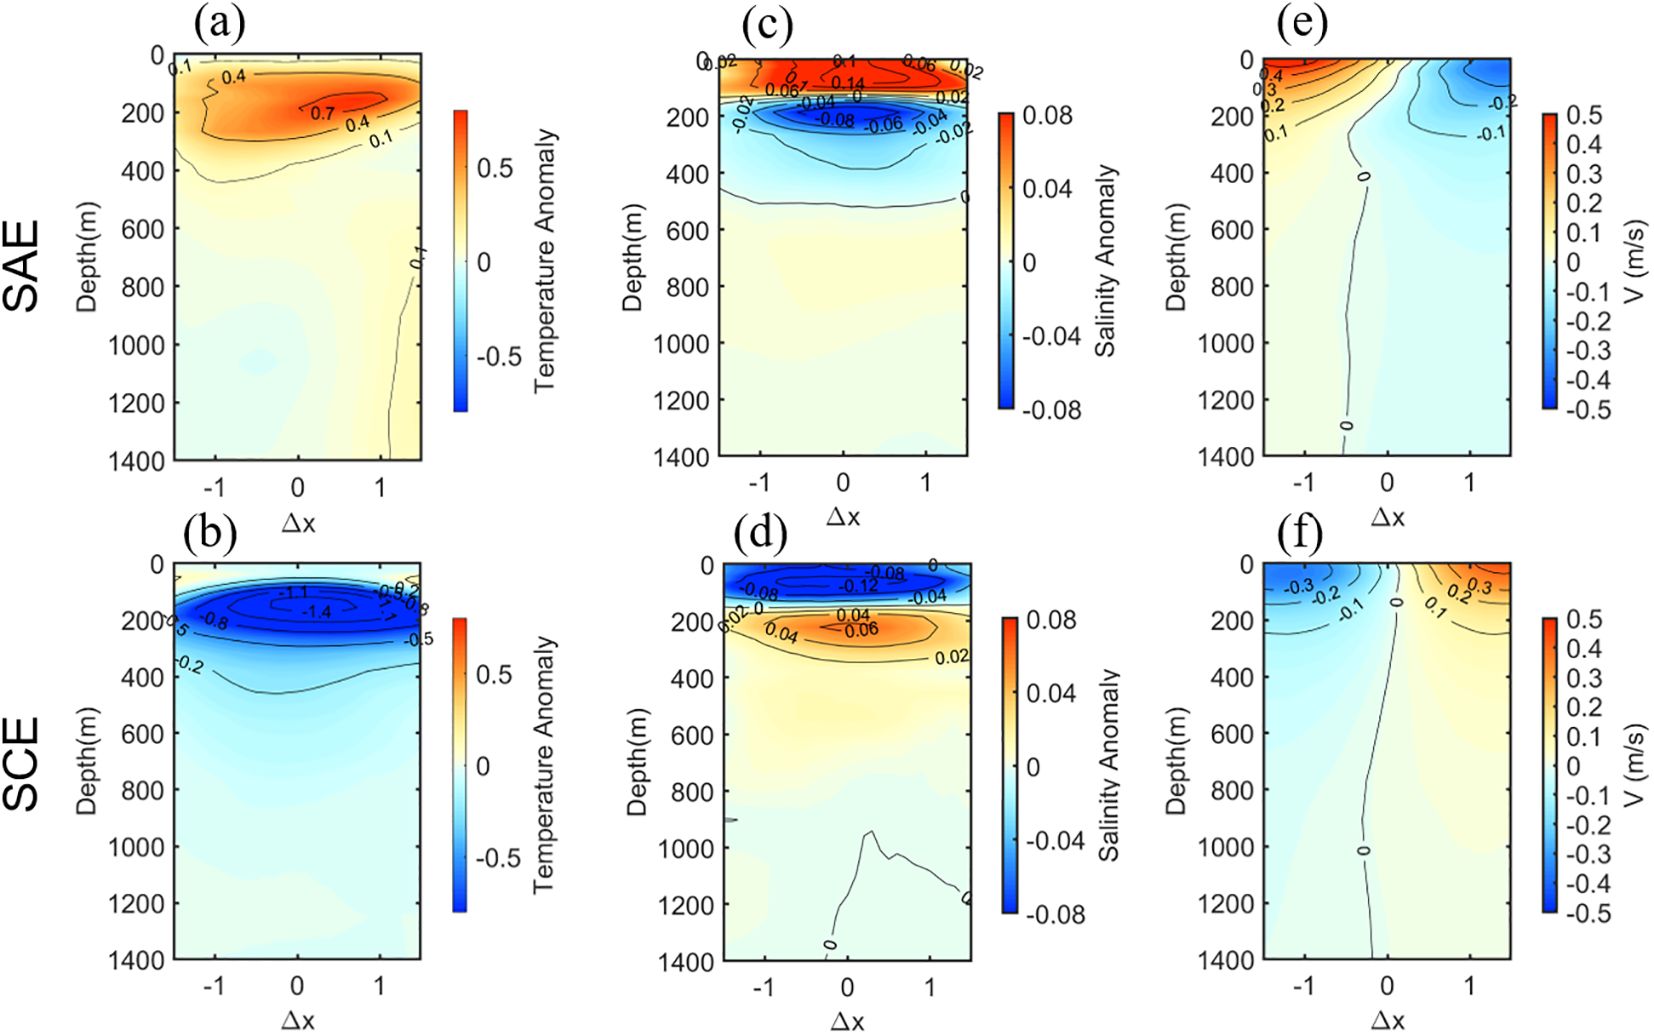
Figure 3. Vertical sections of zonal (A, B) temperature anomalies (unit: °C), (C, D) salinity anomalies and (E, F) meridional velocity of the composite SAE and SCE at Δy = 0 in the east of the Philippines.
The vertical structures of composite NO3 and DO are given for the SSAE and SSCE, respectively (Figure 4). It is noted from the figure that, corresponding to the temperature anomalies, the DO and NO3 anomaly structures exhibit two prominent cores: located at 200–400 m and 600–800 m, respectively. In the SSCE, the DO anomaly shows negative (positive) anomalies deeper (shallower) than 400 m, while the NO3 anomalies show positive (negative) anomalies below (above) 400 m, respectively. Conversely, in the SSAE, these patterns are reversed. The formation of this anomaly structure is associated with the unique lens-shaped characteristic of SSEs. Without the eddy effects, there was a decreasing trend in the DO concentration as depth increases (Supplementary Figure S2B). Specifically, inside the SSAEs, due to the doming of the isopycnal, the DO-rich water mass above 400 m has been replaced by the lower DO water, resulting in a negative DO anomaly in the upper layer. At the same time, the deeper SSAEs are positively influenced by the relative abundance of DO downwelling. The concentration of NO3, in the absence of eddy influence, exhibits increasing trend with depth (Supplementary Figure S2C), which leads to a phase opposition to DO in SSAEs. For SSCEs, the situation is reversed.
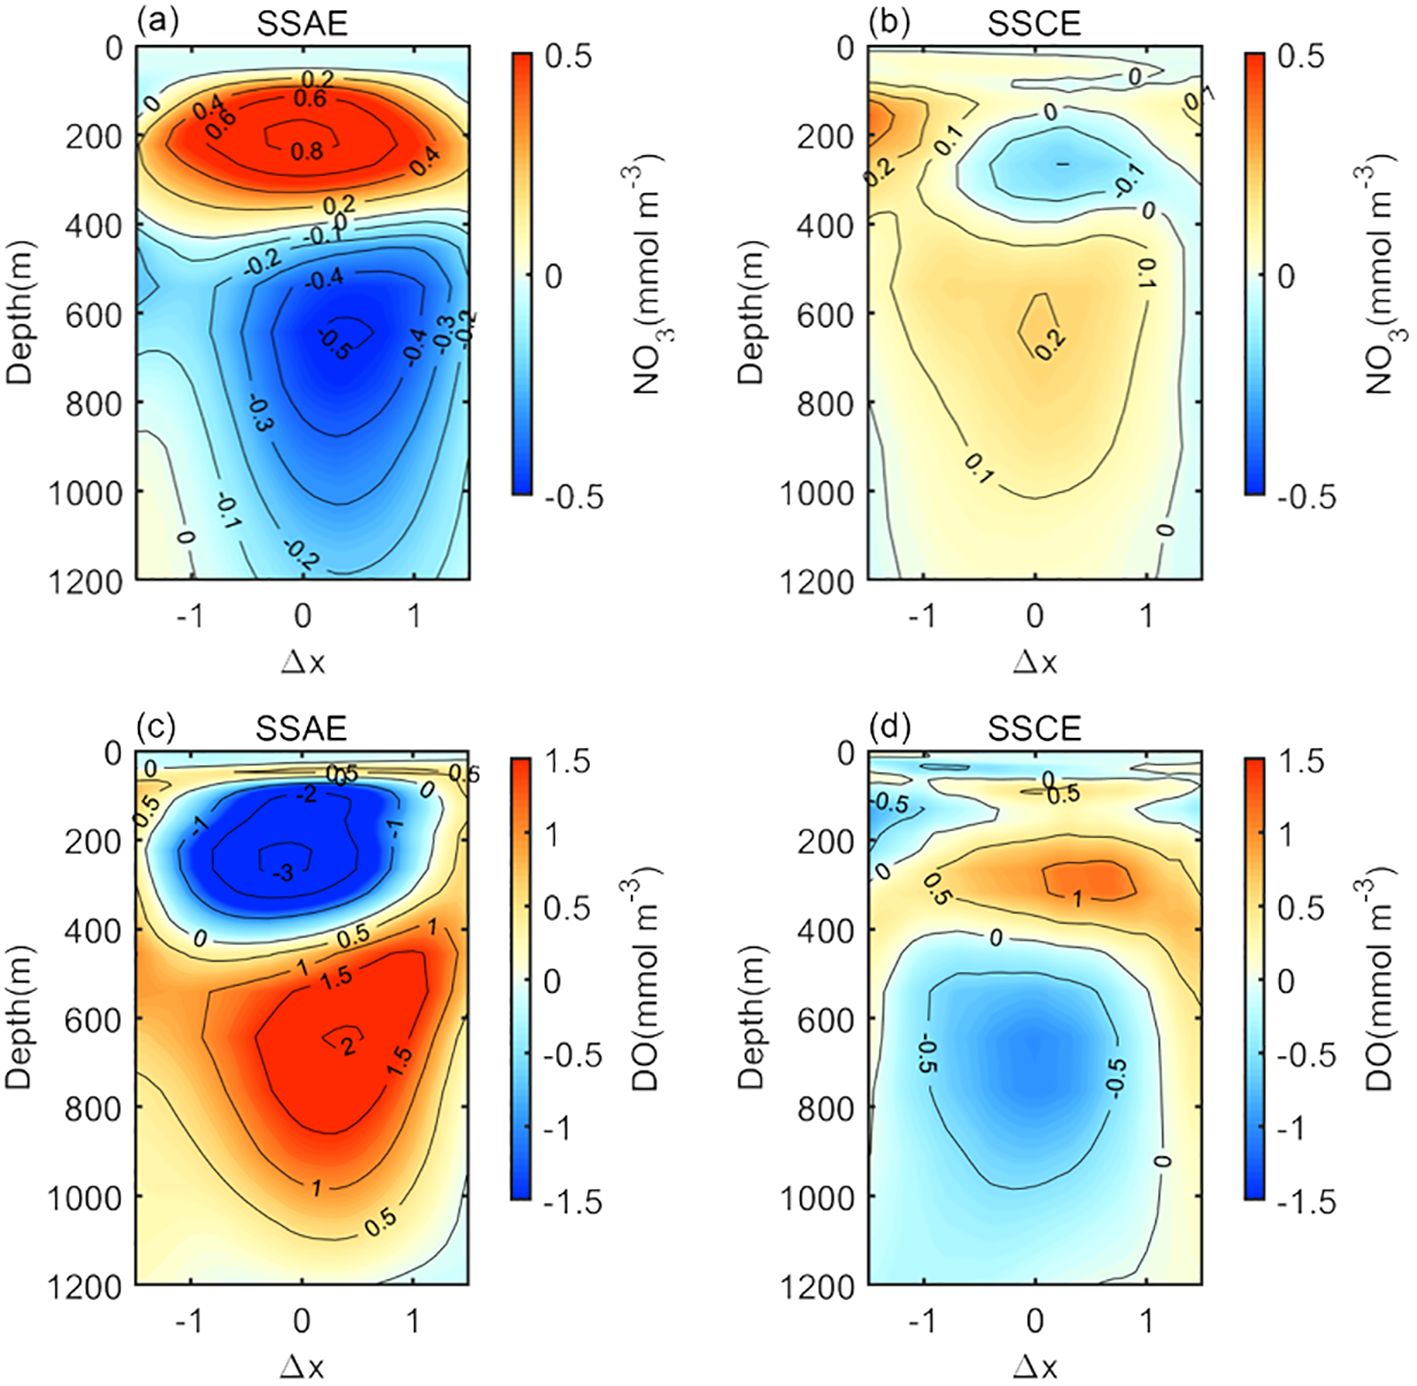
Figure 4. Vertical sections of zonal (A, B) NO3 and (C, D) DO anomalies (unit: mmol m-3) of the composite SSAE and SSCE at Δy = 0 in the east of the Philippines.
The NO3 and DO anomalies caused by the SSAE are more pronounced than those associated with the SSCE. Specifically, in the upper layer, the SSAE (SSCE) exhibits a maximum positive NO3 anomaly (minimum negative anomaly) of approximately 0.83 mmol m-3 (-0.19 mmol m-3). Conversely, in the lower layer, the minimum negative anomaly (maximum positive anomaly) value of NO3 is about -0.54 mmol m-3 (0.21 mmol m-3) for SSAE (SSCE). The minimum negative anomaly (maximum positive anomaly) of DO in the upper layer is approximately -3.86 mmol m-3 (1.41 mmol m-3) for SSAE (SSCE), while the maximum positive anomaly (minimum negative anomaly) of lower-layer DO is approximately 2.32 mmol m-3 (-0.76 mmol m-3) for SSAE (SSCE).
Correspondingly, the vertical structures of composite NO3 and DO in the SAE and SCE is given (Figure 5). Similar to the temperature anomalies, the anomaly structures of NO3 and DO have only one core located at 200–400 m. The DO in the SCE (SAE) shows negative (positive) anomalies, while the NO3 anomalies, in contrast, exhibit positive (negative) anomalies. In comparison to the SSE, the anomalies in both NO3 and DO associated with the SCE are more significant than those linked to the SAE. In detail, the minimum negative anomaly (maximum positive anomaly) value of NO3 in the SAE (SCE) is approximately -0.83 mmol m-3 (1.41 mmol m-3). Conversely, for DO, the SAE shows a maximum positive anomaly of about 2.69 mmol m-3, whereas the SCE demonstrates a minimum negative anomaly value of -3.38 mmol m-3.
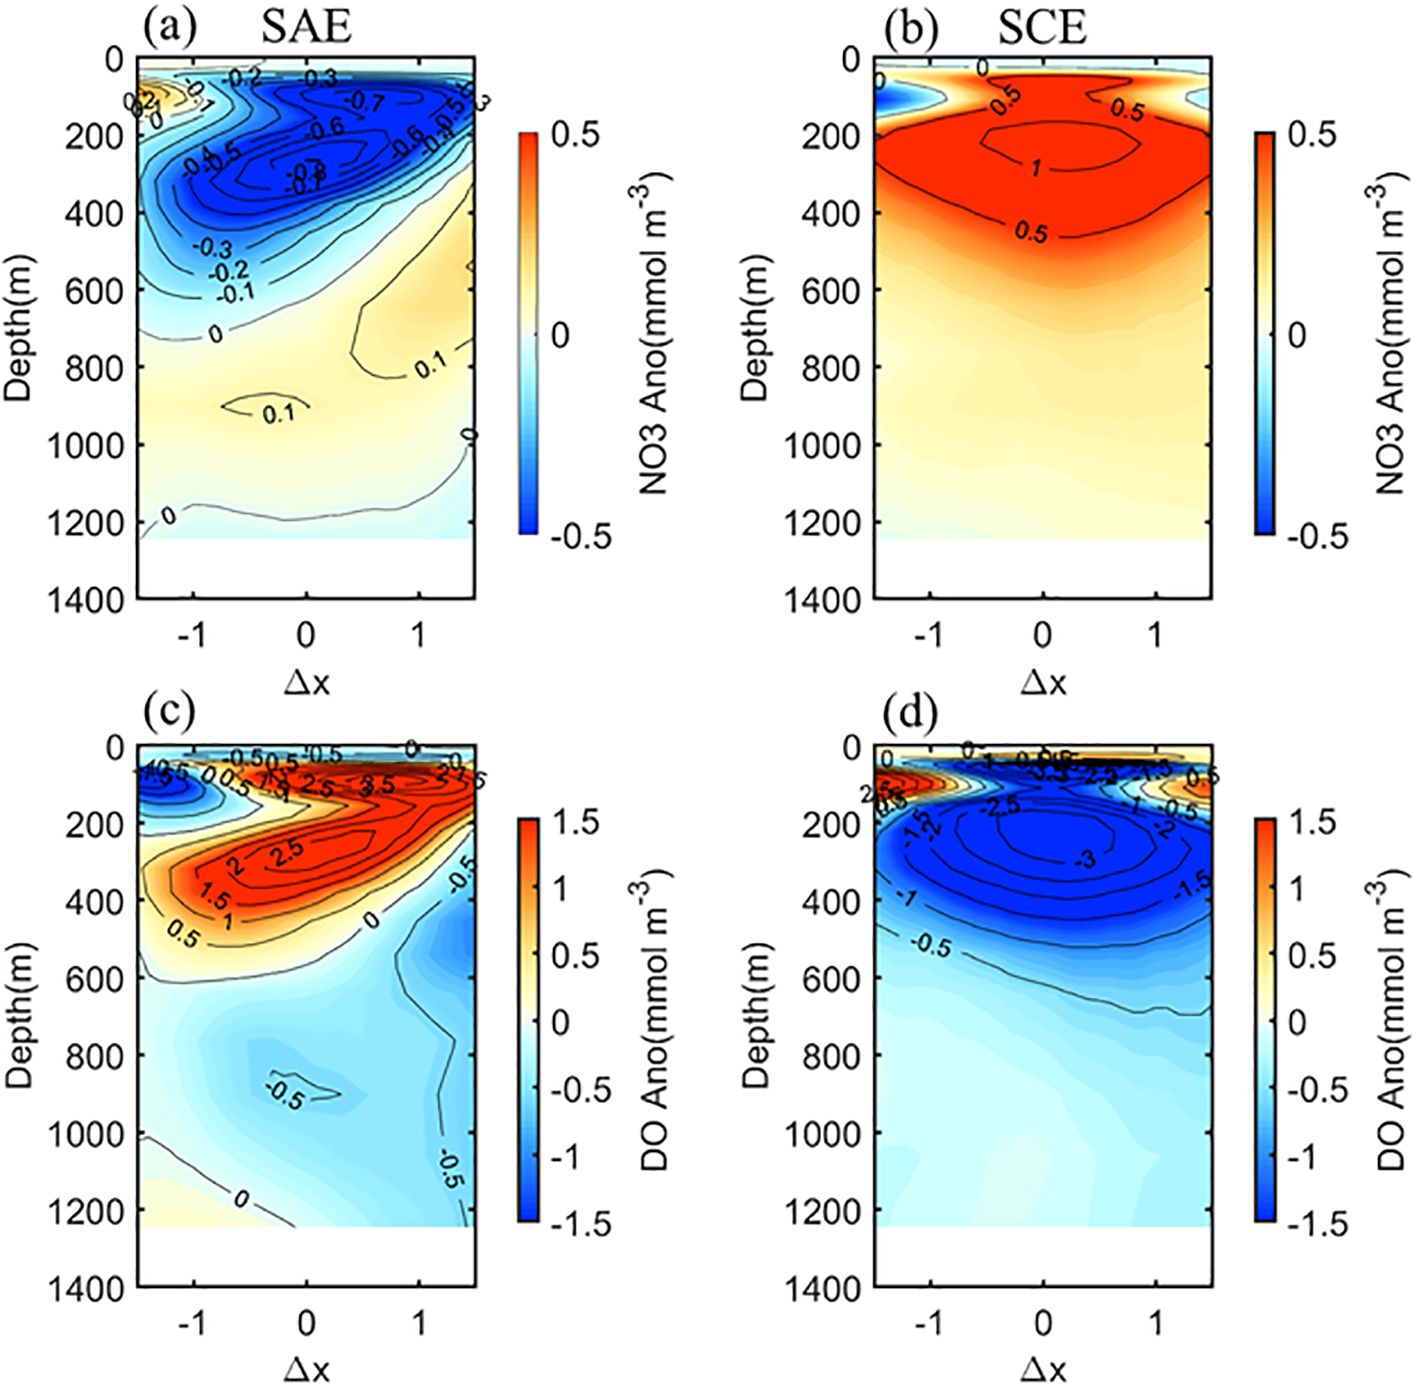
Figure 5. Vertical sections of zonal (A, B) NO3 and (C, D) DO anomalies (unit: mmol m-3) of the composite SAE and SCE at Δy = 0 in the east of the Philippines.
The euphotic zone is the most biogeochemically active region in the ocean, where the most important of which is phytoplankton photosynthesis, i.e., the conversion of dissolved inorganic carbon into biological organic carbon, which is the fundamental and most important beginning of the marine food chain. The euphotic zone depth, defined as the depth where photosynthetically active radiation (PAR) diminishes to 1% of its surface value, exhibits a close correlation with variations in the vertical distribution of CHL. Based on the empirical formula proposed by Morel and Berthon (1989), the euphotic zone depth was calculated from the total CHL concentration within this zone. The distribution of CHL composites of the SSE at the depth of the euphotic layer (~110 m) is given in Figure 6, with positive CHL anomalies occupying more than 70% of the eddy area in the SSAE, especially on the southeastern side; negative CHL anomalies are much weaker, and take up a very small area on the western side. For the SSCE, negative (positive) CHL values are found on the northeastern (southwestern) side. The sloping topography may be one of the possible reasons for the eastward deflection of the eddy, given that most of the SSE east of the Philippines is near the coast.
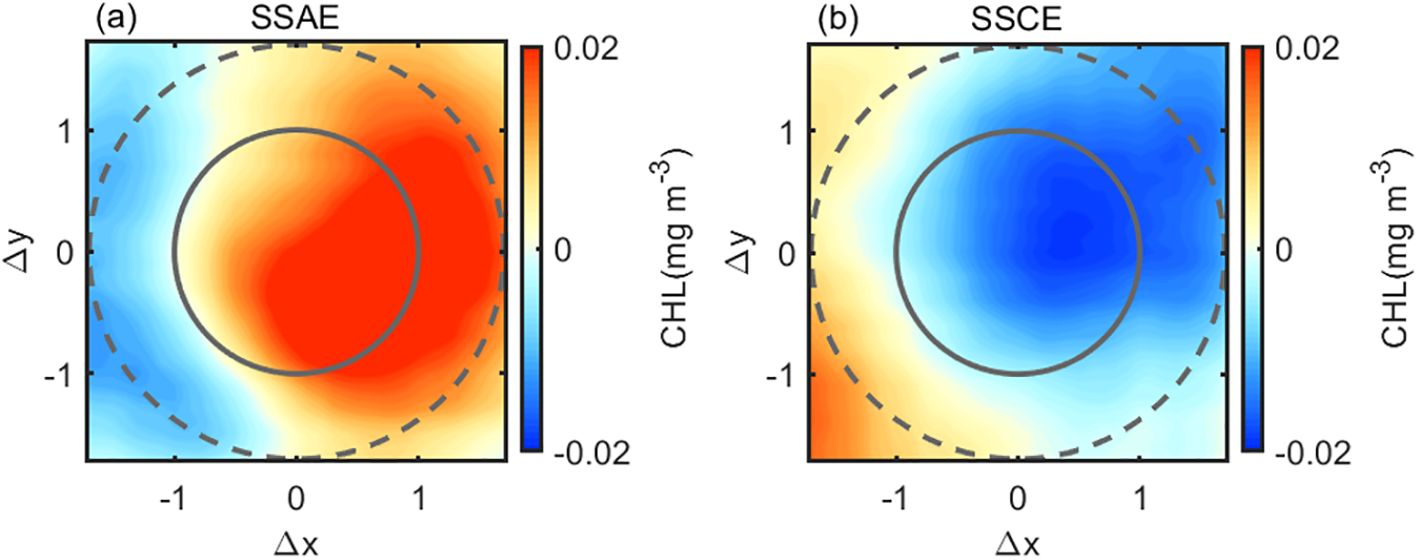
Figure 6. Average CHL anomaly for composite (A) SSAE and (B) SSCE in the base of the euphotic zone (~ 110 m).
The vertical composite structure of CHL in the SSE is depicted in Figure 7. In this illustration, the SSAE, characterized by its convex isopycnal in the upper layer, here resembles the role of the SCE. This similarity facilitates the upward movement of nutrient-rich cold water, which is conducive to photosynthesis by phytoplankton. Consequently, this process leads to increase of CHL concentrations in the euphotic zone. Conversely, the downward compression of the subsurface chlorophyll maximum (SCM) in the SSCE contributes to a reduction in CHL concentration in the euphotic zone. As CHL concentration can reflect phytoplankton biomass to a certain extent, and photosynthesis of phytoplankton plays a crucial role in the ocean carbon cycle as well as in the change of global carbon fluxes, potential CHL changes will lead to the redistribution of carbon in the ocean (Zhao et al., 2020). Therefore, changes in CHL concentrations due to special structure of SSAE are not negligible.

Figure 7. Vertical sections of zonal CHL anomalies (unit: mg m-3) of the composite (A) SSAE and (B) SSCE at Δy = 0 in the east of the Philippines.
Similar to the SSAE, the SCE, due to the consistent upward convex isopycnal in the eddy, allows the uplift of nutrient-rich cold water, favoring phytoplankton photosynthesis, leading to increased CHL values in the euphotic zone; whereas in SAE the SCM is suppressed downward, resulting in a negative CHL anomaly at the sea surface (Figure 8).

Figure 8. Vertical sections of zonal CHL anomalies (unit: mg m-3) of the composite (A) SAE and (B) SCE at Δy = 0 in the east of the Philippines.
3.2 Contribution of subsurface eddies to changes in biogeochemical variables
The impact of SSEs on biogeochemical variables such as CHL, NO3 and DO remains unclear. To gain a visual understanding of the changes in biogeochemical variables induced by SSEs, the composite anomaly structures of the eddies were divided by the vertical profile outside the eddy (Supplementary Figure S2) to obtain the contribution ratios of NO3, DO, and CHL changes caused by SSE (Figures 9, 10). Here the averaged vertical profiles over all time periods, excluding the impact areas of all eddies (including SEs and SSEs), were used. It can be observed that, on average, the contribution ratio induced by SSAEs is higher than that induced by SSCE in the east of the Philippines. The NO3 change induced by the center of SSAE reaches up to 12.6% at 100 m, with a negative anomaly of about 2% at 600 m. The contribution ratios of NO3 change induced by the center of SSCE are -1.5% (0.8%) at depths of 200 m (600 m), respectively. The contribution ratios of the DO change induced by the center of the SSAE (SSCE) are -2.5% (1.1%) at 200 m and 2.4% (-1.6%) at 600 m.
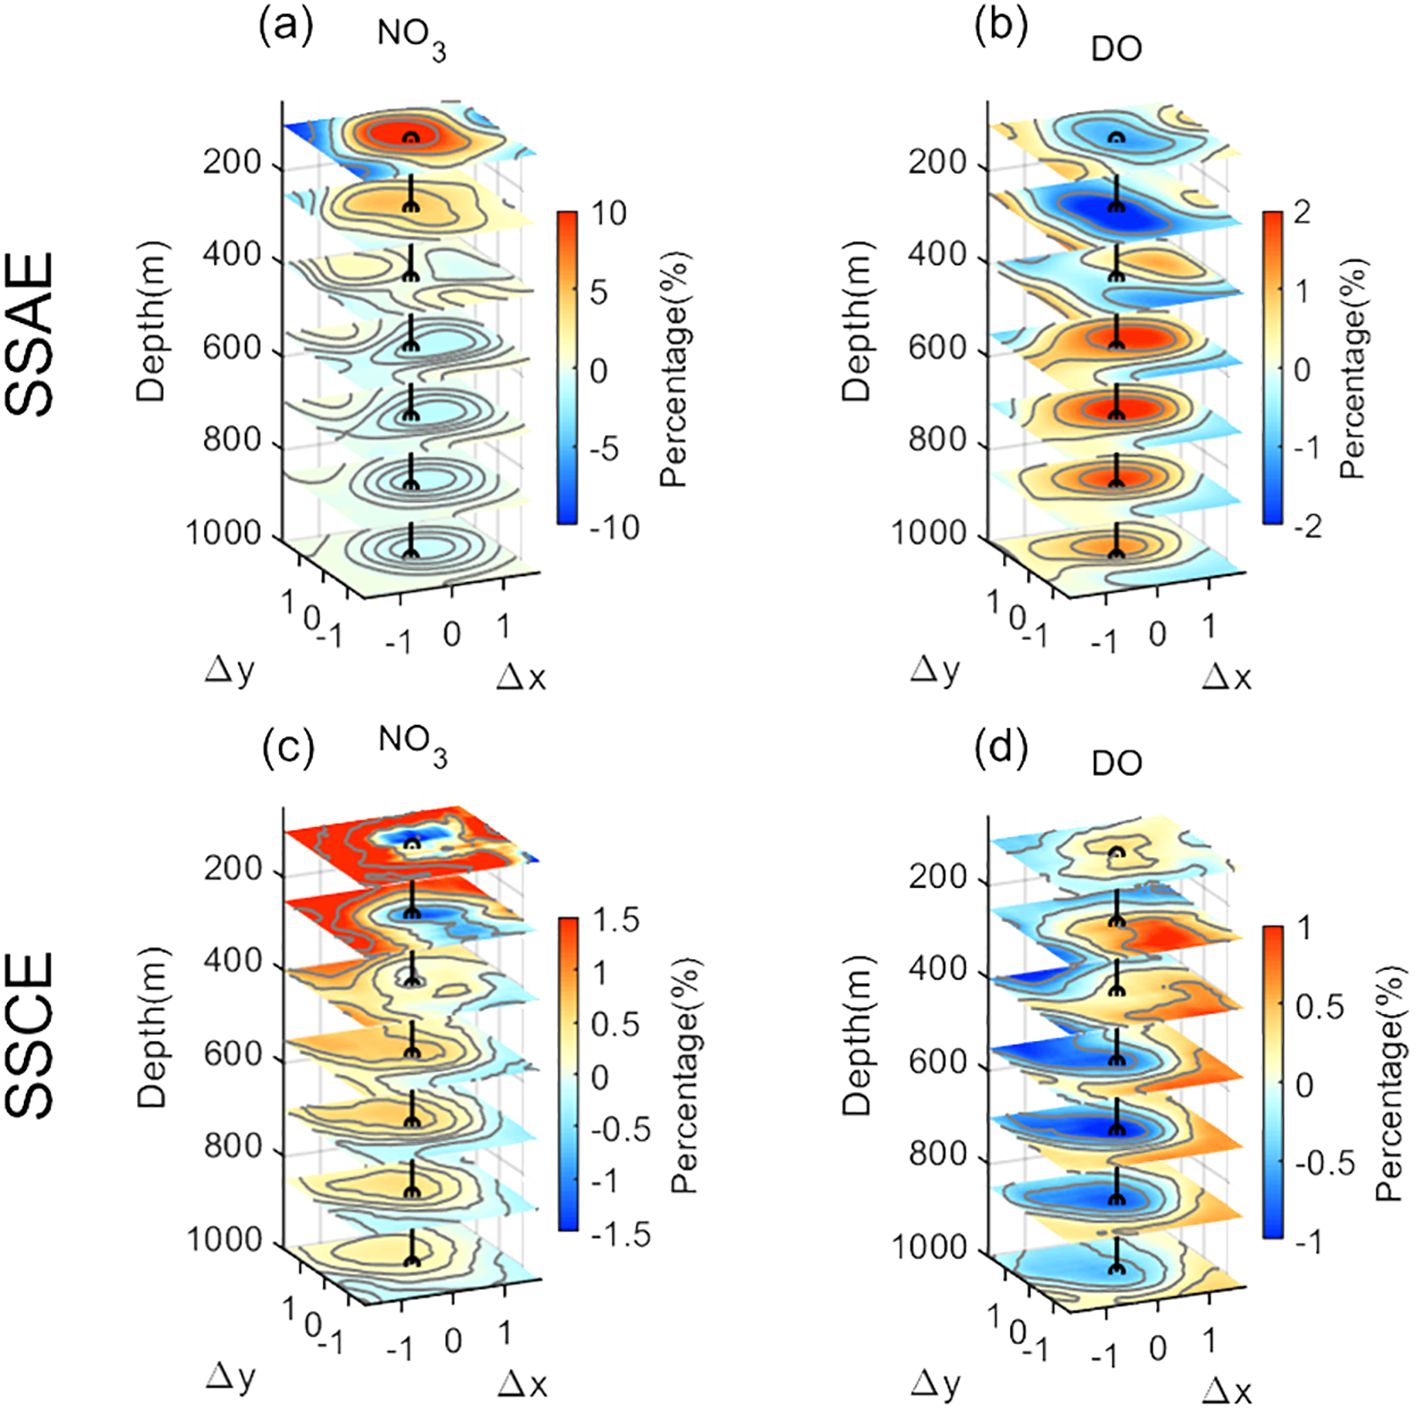
Figure 9. Composite 3D percent of contribution structure of the (A, C) NO3 and (B, D) DO caused by SSAE and SSCE in the east of the Philippines. Black dotted line is the z-axis of the coordinate.
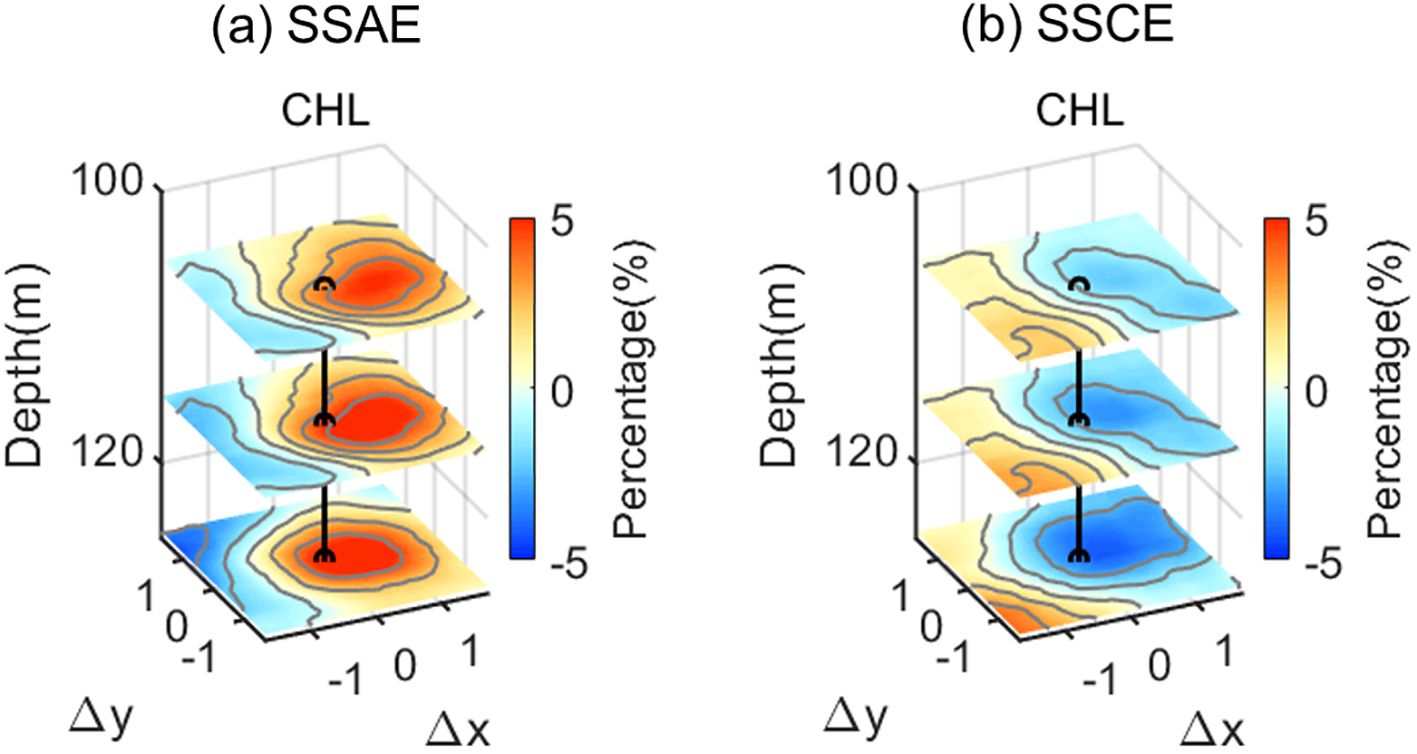
Figure 10. Composite 3D percent of contribution structure of CHL in euphotic zone caused by (A) SSAE and (B) SSCE in the east of the Philippines. Black dotted line is the z-axis of the coordinate.
The contribution of the center of SSAE (SSCE) to the CHL change exceeds 6.7% (-4.5%) in euphotic zone (Figure 10). While these contributions are relatively small overall, they are not negligible in oligotrophic regions with active SSEs. Notably, the SSAE contributes to a substantial increase in NO3 concentration by up to 12.6% in the euphotic zone at mean state, thereby enhancing primary productivity and playing a critical role in biotic processes. It is worth noting that the position of the composite eddy center is shifted from that of the DO/CHL center both horizontally and vertically, probably due to the eddy vertical tilt induced by ocean stratification (Li et al., 2022) and the asymmetry of mesoscale eddies induced by eddy–eddy interactions (Wang et al., 2023b; Zhang et al., 2024).
3.3 Biogeochemical transport induced by subsurface eddies
The CHL, NO3 and DO transport induced by the SSE movement east of the Philippines (120°E to 140°E and 0°N to 20°N) was calculated for 2019−2022. Taking a cue from previous studies on calculating heat transport by eddies. For a single SSE, the CHL anomaly was calculated as:
Where is CHL anomaly, r is the eddy radius within a given layer and z is the depth layer thickness within the SSE. Using a similar calculation method to CHL, the NO3 and DO anomaly for a single SSE was calculated as:
Where is the NO3 and DO anomaly, n stands for molar mass. An average bin of 0.5° meridional width (Dlat) and 0.5° zonal length (Dlon) was created around each grid point. The total SSE-induced biogeochemical transport within each bin was calculated for the whole period from 2019 to 2022 and divided it by Dlon, Dlat, and the number of snapshots (N). The average SSE-induced zonal biogeochemical transport is given by
Similar to , the SSE-induced meridional biogeochemical transport was calculated:
Where and are the zonal and meridional propagation speeds of individual SSE, respectively. Instead of using statistically averaged eddy propagation speeds to calculate eddy transport, eddy trajectories were used to calculate transport by eddy movements.
The biogeochemical transport patterns were closely related to how the eddies distributed and moved. The zonal NO3, DO and CHL transport induced by SSAEs and SSCEs tended in opposite directions (Supplementary Figures S3-S5). The spatial distribution of biogeochemical transport irregularities induced by SSEs depicted in the figures is attributable to an insufficient number of eddy samples. The distribution of meridional NO3 transport (in the order of 105 mg/m) is much smaller than that of the zonal NO3 transport (in the order of 106 mg/m), due to differences in propagation characteristics. With distinct isopycnals displacement patterns, the meridional integration of zonal NO3 and DO transport induced by SSAEs and SSCEs tended to partially counterbalance each other (Figure 11). The zonal NO3 transport associated with SSAEs peaks at 128°N, with a magnitude of up to ~5×10⁷ mg. As shown in Figure 11A, the total SSEs result in a net westward NO3 transport between 131°E−137°E, with the SSCEs being the major contributor. And a significant net eastward NO3 transport at 127°E, with a magnitude of up to 3 × 10⁷ mg. In terms of zonal DO transport, the total zonal DO transport induced by the SSEs peaks at 127°E (~9×10⁷ mg) and 139°E (~5×10⁷ mg) as a result of the reversed transport roles of SSAEs and SSCEs.
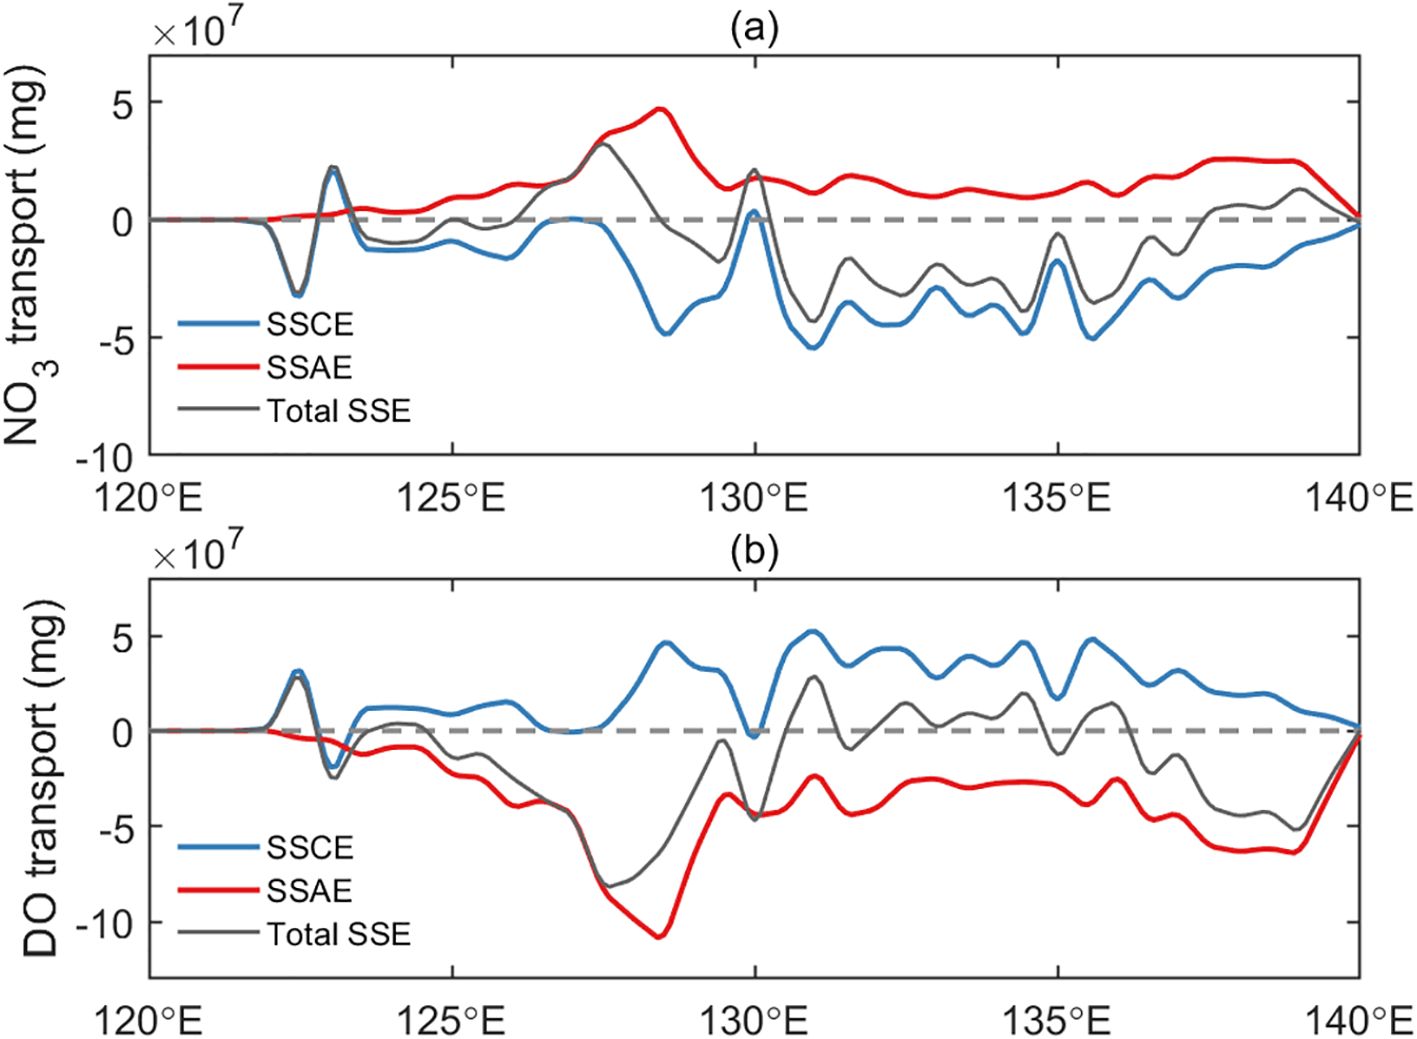
Figure 11. The meridionally integrated zonal (A) NO3 and (B) DO transport induced by SSAEs and SSCEs.
As illustrated in Figure 12A, the zonally integrated meridional NO3 transport of SSEs is quite variable, with alternating north-south distributions south of 12°N, while exhibiting a net northward transport resulting from SSCEs between 12°N−17°N. Similarly, the zonally integrated meridional DO transport of SSEs is quite variable (Figure 12B), and the combined effect of the two largely depends on the SSAEs between 5°N−12°N, and on the SSCE north of 12°N.
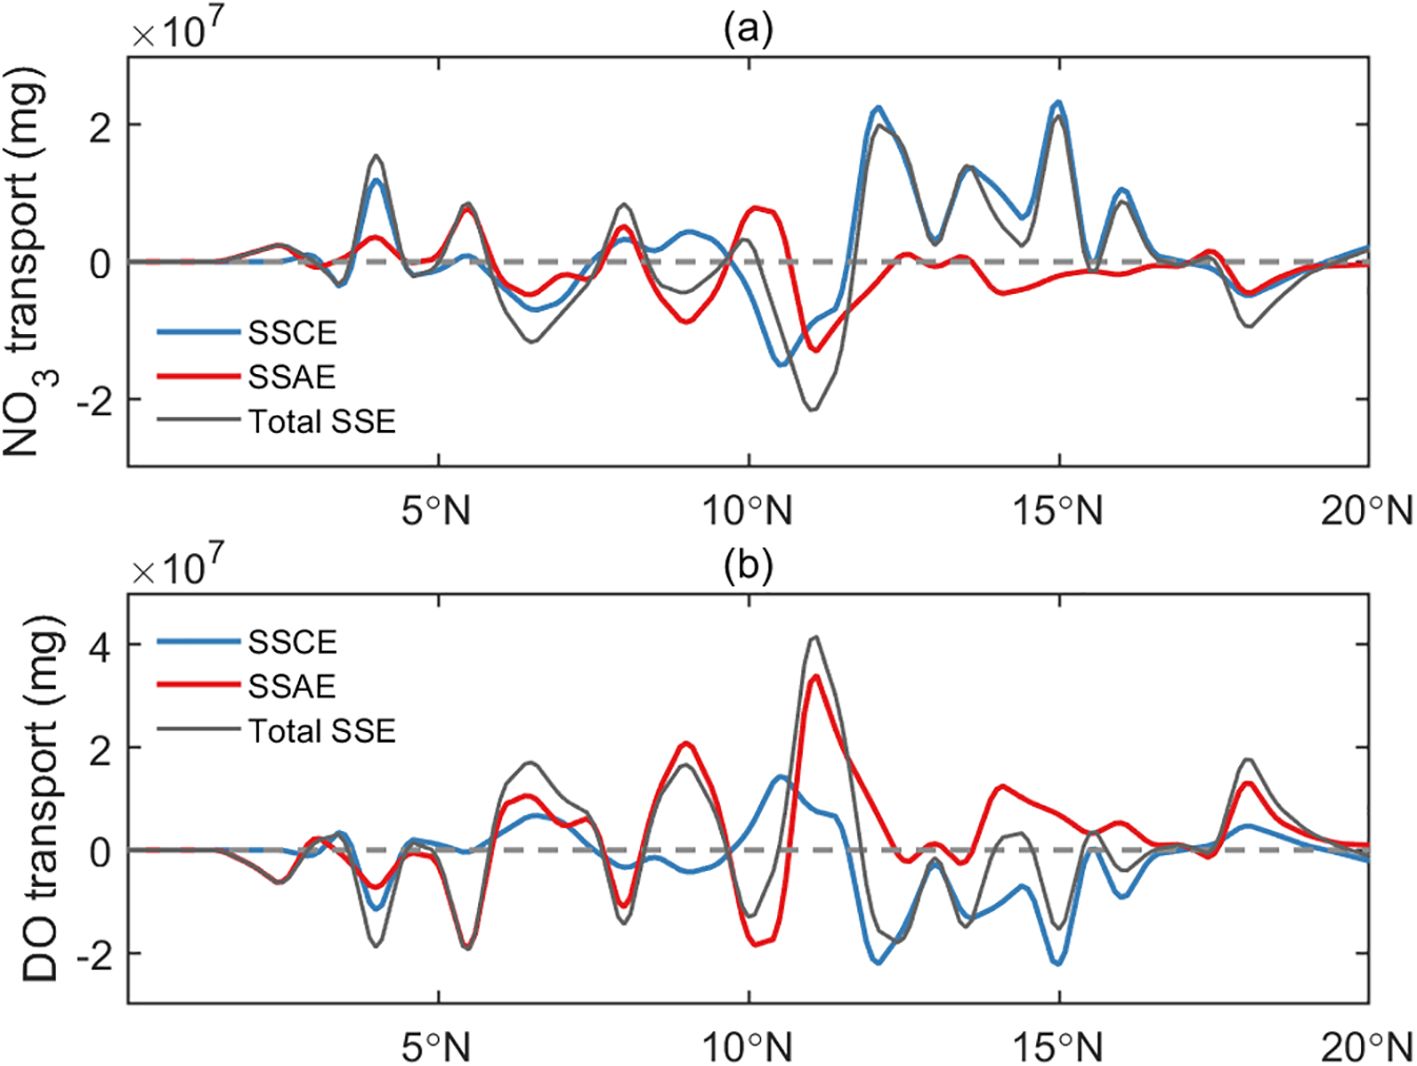
Figure 12. The zonally integrated meridional (A) NO3 and (B) DO transport induced by SSAEs and SSCEs.
The meridionally integrated zonal CHL transport induced by SSAEs and SSCEs tended to cancel each other out (Figure 13A), and the final effect is a net westward transport in the 125°E−131°E and 136°E−140°E with a magnitude up to about 2−4×10³ mg. However, the zonally integrated meridional CHL transport of SSAEs is much larger than that of SSCEs (Figure 13B). As shown in Figure 13B, Supplementary Figure S5C, along the Philippine coast, a significant net northward CHL transport of up to 103 mg, except for a few latitudes.
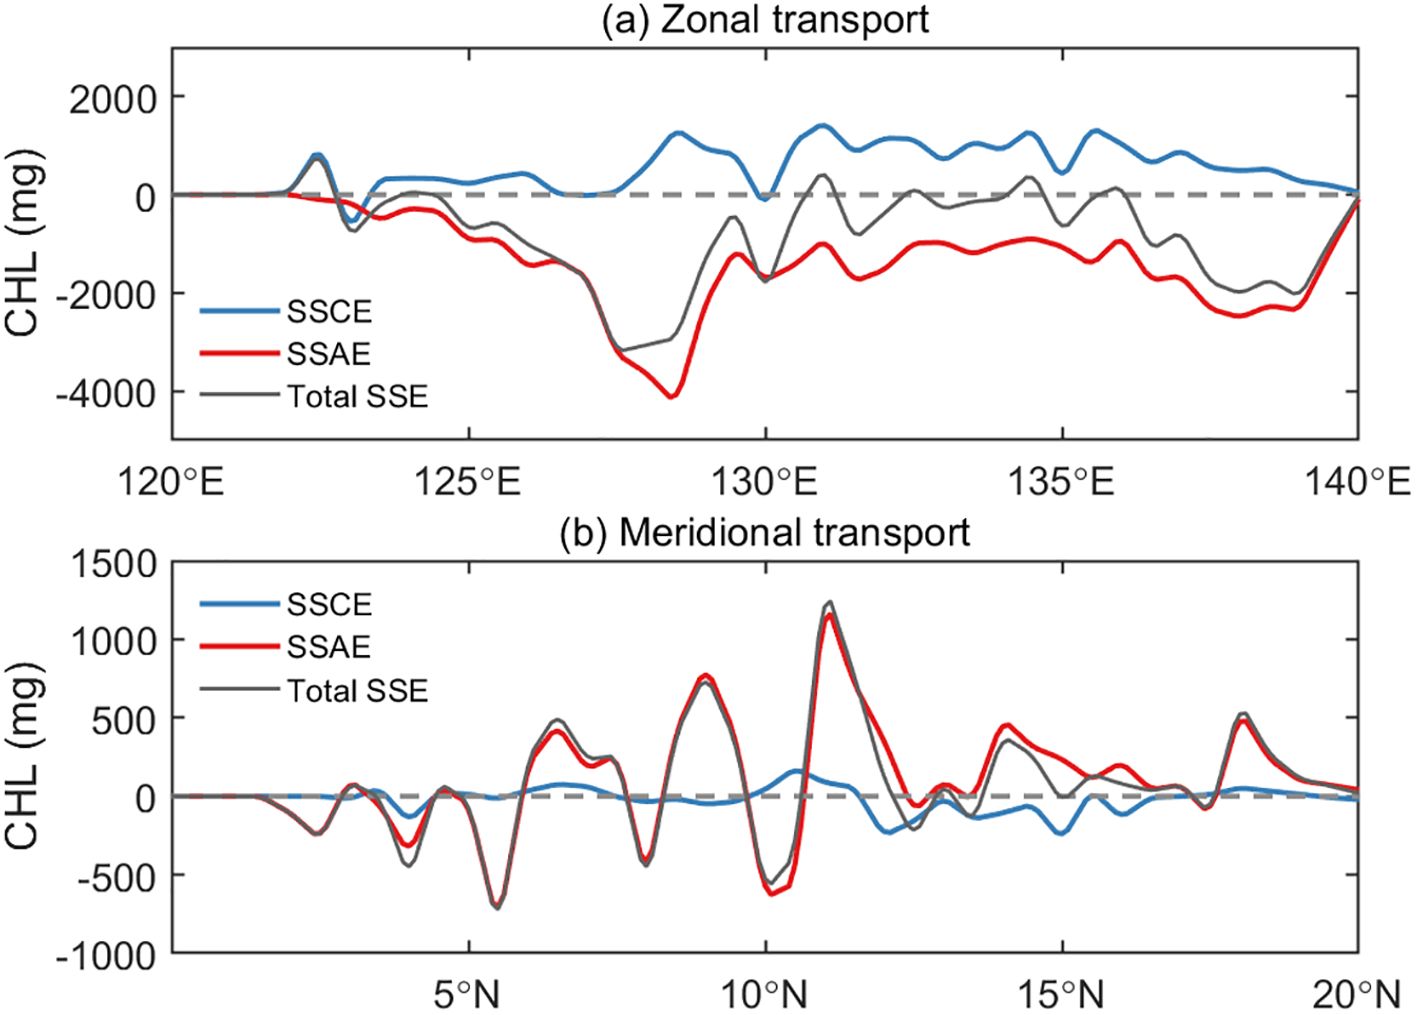
Figure 13. (A) Meridionally integrated zonal CHL transport in the base of the euphotic zone induced by SSEs as a function of longitude, and (B) zonal integrated meridional transport induced by SSEs as a function of latitude.
4 Summary and discussion
In this study, the 3D biogeochemical structures and transports of SSEs and their contributions to the changes in the biogeochemical variables, were investigated for the first time by analyzing the numerical simulations. Compared to the SEs, the SSEs have two significant cores with opposite phases of temperature, NO3, and DO anomalies: one at 200–400 m and the other at 600–800 m, with the maximum meridional velocity at 400 m being the boundary between positive and negative anomalies. SSEs also play a crucial role in influencing the CHL distribution, with more than 70% of the area in the SSAE (SSCE) at the euphotic zone (~110 m) occupied by positive (negative) CHL anomalies. On average, the anomalous NO3, DO and CHL changes induced by SSAEs are found to be stronger than those induced by SSCEs, with contributions from both being less than 10%. While the overall contribution may be relatively small, it is significant in oligotrophic regions where SSEs are active. In particular, the substantial increase in NO3 concentration caused by SSAEs in the euphotic zone at mean state (up to 12.6%) promotes primary productivity and is even considered critical for biological processes.
Previous studies have demonstrated that SSEs are highly non-linear, suggesting a significant impact on subsurface biogeochemical transport, particularly in regions where SSEs are abundant (Gaube et al., 2013; Xu et al., 2019; Xiu and Chai, 2020; Zhao et al., 2020). Here, for the first time, the NO3, DO and CHL transports resulting from SSEs movements east of the Philippines were calculated. The meridionally integrated zonal transports of NO3, DO and CHL for both SSAEs and SSCEs largely offset each other, leading to overall weak zonal transports. In the region from 125°E–131°E and 136°E–140°E, there is a net westward transport of DO and CHL, accompanied by a predominant eastward transport of NO3. In addition, the total SSE leads to a net westward transport of NO3 between 131°E–137°E due to the contribution of the SSCE. For the SSE-induced meridional transport, a net northward of NO3/CHL and a net southward of DO were observed north of 12°N. The SSE-induced meridional CHL transport occurs mainly off the Philippines and Mindanao coasts, and the SSAEs are the major contributor (Supplementary Figure S5).
The distribution of CHL and NO3 in the subsurface layer, as well as the depth of the maximum dissolved oxygen layer, are critical to understanding the near-surface biogeochemical response to the eddies. Therefore, in future studies, the vertical structure of the entire upper ocean should be taken into account when interpreting satellite observations, especially distinguishing between the roles of the two types of eddies with different structures. It is worth noting that this study only estimated the contribution of SSEs to biogeochemistry in the composite state. To have a more comprehensive understanding of how SSEs affect biogeochemical changes, in the future, the authors will calculate SSEs induced changes in CHL, NO3 and DO throughout the ocean, aiming to understand the impact of SSEs on biogeochemical cycling. In addition, the seasonal variation of subthermocline EKE within the study area is evident (Zhang et al., 2021), and the seasonal changes in biogeochemical impacts are also issues of considerable concern, to which we will pay more attention in the future. As more and more BGC-Argo floats and gliders are deployed globally, model output will no longer be the only resource, and more researches on the effects of mesoscale eddies on the biogeochemical elements will emerge. Authors will also use this data in the future to further delve into the physical-biogeochemical processes associated with SSEs.
Data availability statement
Publicly available datasets were analyzed in this study. This data can be found the following link: http://marine.copernicus.eu.
Author contributions
YD: Data curation, Writing – original draft. AX: Methodology, Writing – review & editing. SS: Project administration, Writing – review & editing, Supervision. KL: Supervision, Writing – review & editing. ZG: Formal analysis, Writing – review & editing. XW: Funding acquisition, Writing – review & editing. FN: Formal analysis, Methodology, Writing – review & editing. FY: Conceptualization, Project administration, Writing – review & editing, Supervision.
Funding
The author(s) declare financial support was received for the research, authorship, and/or publication of this article. This work was funded by the National Key Research and Development Program of China under Grant Numbers 2021YFC3101602, and supported by the National Natural Science Foundation of China Grant (No. 42306024; No. 41976019; No.42405048). The Tianjin Natural Science Foundation (No. 23JCYBJC01120) also supported this study.
Conflict of interest
The authors declare that the research was conducted in the absence of any commercial or financial relationships that could be construed as a potential conflict of interest.
The reviewer WZ declared a shared affiliation with the authors YD, AX, FN, FY to the handling editor at the time of review.
Publisher’s note
All claims expressed in this article are solely those of the authors and do not necessarily represent those of their affiliated organizations, or those of the publisher, the editors and the reviewers. Any product that may be evaluated in this article, or claim that may be made by its manufacturer, is not guaranteed or endorsed by the publisher.
Supplementary material
The Supplementary Material for this article can be found online at: https://www.frontiersin.org/articles/10.3389/fmars.2024.1439787/full#supplementary-material
References
Copernicus Marine Service global biogeochemical analysis and forecast product GLOBAL_ANALYSIS_FORECAST_BGC_001_028. E.U. Copernicus Marine Service Information (CMEMS) (Marine Data Store (MDS) (Accessed 12 Mar 2023).
Global Ocean Physics Analysis and Forecast product GLOBAL_ANALYSISFORECAST_PHY_001_024. E.U. Copernicus Marine Service Information (CMEMS) (Marine Data Store (MDS) (Accessed 21 Oct 2023).
Belkin I., Foppert A., Rossby T., Fontana S., Kincaid C. (2020). A double-thermostad warm-core ring of the gulf stream. J. Phys. Oceanography. 50, 489–507. doi: 10.1175/JPO-D-18-0275.1
Chelton D. B., Schlax M. C., Samelson R. M. (2011). Global observations of nonlinear mesoscale eddies. Prog. Oceanography. 91, 167–216. doi: 10.1016/j.pocean.2011.01.002
Chelton D. B., Schlax M. C., Samelson R. M., Szoeke R. A. D. (2007). Global observations of large oceanic eddies. Geophys. Res. Letters. 34, L15606. doi: 10.1029/2007GL030812
Chiang T. L., Qu T. D. (2013). Subthermocline eddies in the western equatorial Pacific as shown by an eddy-resolving OGCM. J. Phys. Oceanography. 43, 1241–1253. doi: 10.1175/JPO-D-12-0187.1
Chiang T. L., Wu C. R., Qu T. D., Hsin Y. C. (2015). Activities of 50-80 day subthermocline eddies near the Philippine coast. J. Geophysical Res. 120, 3606–3623. doi: 10.1002/2013jc009626
Ding Y., Ren Q., Yu F., Nan F., Wang R., Liu Y., et al. (2022). The physical-biogeochemical responses to a subsurface anticyclonic eddy in the Northwest Pacific. Front. Mar. Sci. 8. doi: 10.3389/fmars.2021.766544
Dong D., Brandt P., Chang P., Schutte F., Yang X., Yan J., et al. (2017). Mesoscale eddies in the Northwestern Pacific Ocean: Three-dimensional eddy structures and heat/salt transports. J. Geophysical Research: Oceans. 122, 9795–9813. doi: 10.1002/2017JC013303
Dong C., Liu L., Nencioli F., Bethel B. J., Liu Y., Xu G., et al. (2022). The near-global ocean mesoscale eddy atmospheric-oceanic-biological interaction observational dataset. Sci. Data. 9, 436. doi: 10.1038/s41597-022-01550-9
Dong C., McWilliams J. C., Liu Y., Chen D. (2014). Global heat and salt transports by eddy movement. Nat. Commun. 5, 3294. doi: 10.1038/ncomms4294
Dong C., Nencioli F., Liu Y., Mcwilliams J. (2011). An automated approach to detect oceanic eddies from satellite remotely sensed sea surface temperature data. IEEE Geosci. Remote Sens. Letters. 8, 1055–1059. doi: 10.1109/LGRS.2011.2155029
Faghmous J. H., Frenger I., Yao Y., Warmka R., Lindell A., Kumar V. (2015). A daily global mesoscale ocean eddy dataset from satellite altimetry. Sci. data. 2, 150028. doi: 10.1038/sdata.2015.28
Gaube P., Chelton D. B., Strutton P. G., Behrenfeld M. J. (2013). Satellite observations of chlorophyll, phytoplankton biomass and Ekman pumping in nonlinear mesoscale eddies. J. Geophys. Res: Oceans. 118, 6349–6370. doi: 10.1002/2013JC009027
Gordon A., Giulivi C., Lee C. M., Talley L. (2002). Japan/east sea intrathermocline eddies. J. Phys. Oceanography. 32, 1960–1974. doi: 10.1175/1520-0485(2002)032<1960:JESIE>2.0.CO;2
Hu Z., Ma X., Peng Y., Tian D., Meng Q., Zeng D., et al. (2022). A large subsurface anticyclonic Eddy in the eastern equatorial Indian ocean. J. Geophysical Research: Oceans. 127, 1–13. doi: 10.1029/2021JC018130
Kurian J., Colas F., Capet X., McWilliams J. C., Chelton D. B. (2011). Eddy properties in the California Current system. J. Geophysical Res. 116, C08027. doi: 10.1029/2010jc006895
Lamouroux J., Perruche C. (2023). Synthesis Quality Overview Document, Associated to extended quality information document (QUID): CMEMS-GLO-QUID-001-028. doi: 10.48670/moi-00015
Lellouche J.-M., Greiner E., Le Galloudec O., Garric G., Regnier C., Drevillon M., et al. (2018). Recent updates to the Copernicus marine service global ocean monitoring and forecasting real-time 1/12° High-resolution system. Ocean Sci. 14, 1093–1126. doi: 10.5194/os-14-1093-2018
Lellouche J.-M., Le Galloudec O., Regnier C., Van Gennip S., Law Chune S., Levier B., et al. (2024). QUID for Global Sea Physical Analysis and Forecasting Product GLOBAL_ANALYSISFORECAST_PHY_001_024 (Accessed 12 Agu 2024).
Li H., Xu F. H., Wang G. H. (2022). Global mapping of Mesoscale Eddy vertical tilt. J. Geophysical Research: Oceans 127, e2022JC019131. doi: 10.1029/2022JC019131
Lin H., Hu J., Liu Z., Belkin I. M., Sun Z., Zhu J. (2017). A peculiar lens-shaped structure observed in the South China Sea. Sci. Rep. 7, 1–11. doi: 10.1038/s41598-017-84100593-y
Liu Y., Jing Z. (2024). Intrathermocline eddy with lens-shaped low potential vorticity and diabatic forcing mechanism in the south China sea. J. Phys. oceanography 54, 929–948. doi: 10.1175/JPO-D-23-0149.1
Mason E., Simón R., Bourdalle-Badie R., Reffray G., Marcos G., Pascual A. (2019). New insight into 3-d mesoscale eddy properties from cmems operational models in the western mediterranean. Ocean Sci. 15, 1111–1131. doi: 10.5194/os-15-1111-2019
McGillicuddy D. J., Anderson L. A., Bates N. R. (2007). Eddy/Wind interactions stimulate extraordinary mid-ocean plankton blooms. Science 316, 1021–1026. doi: 10.1126/science.1136256
Mo D., He Q., Zhan W., He Y., Zhan H. (2024). A global assessment of eddy-induced salinity anomalies and salt transport by eddy movement. J. Geophysical Research: Oceans. 129, e2023JC020382. doi: 10.1029/2023JC020382
Morel A., Berthon J. (1989). Surface pigments, algal biomass profiles, and potential production of the euphotic layer: relationships reinvestigated in view of remote-sensing applications. Limnology oceanography. 34, 1545–1562. doi: 10.2307/2837038
Nan F., Yu F., Wei C., Ren Q., Fan C. (2017). Observations of an extra-large subsurface anticyclonic eddy in the northwestern Pacific subtropical gyre. J. Mar. Science: Res. Dev. 7, 1–11. doi: 10.4172/2155-9910.1000234
Nan F., Yu F., Wei C., Ren Q., Wei C., Liu Y., Sun S. (2019). Isopycnal mixing of interhemispheric intermediate waters by subthermocline eddies east of the philippines. Scientific Rep. 9, 1−10. doi: 10.1038/s41598-019-39596-2
Nan F., Yu F., Xu A., Ding Y. (2022). Progress and prospect of subsurface-intensified eddies in the northwestern Pacific Ocean. Adv. Earth Science. 37, 1–12. doi: 10.11867/j.issn.1001-8166.2022.061
Okubo A. (1970). Horizontal dispersion of floatable particles in the vicinity of velocity Singularities such as convergences. Deep Sea Res. Oceanographic Abstracts. 17, 445–454. doi: 10.1016/0011-7471(70)90059-8
Potter H., Hsu C. Y., Dimarco S. F. (2021). Rapid dissipation of a loop current eddy due to interaction with a severe gulf of Mexico hurricane. Ocean Dynamics. 71, 911–922. doi: 10.1007/s10236-021-01471-y
Qian S., Wei H., Xiao J. G., Nie H. (2018). Impacts of the Kuroshio intrusion on the two eddies in the northern South China Sea in late spring 2016. Ocean Dynamics. 68, 1695–1709. doi: 10.1007/s10236-018-1224-y
Qiao J., Qiu C., Wang D., Huang Y., Zhang X. (2023). Multi-stage development within anisotropy insight of an anticyclone eddy in northwestern South China Sea in 2021. Geophysical Res. Lett. 50, e2023GL104736. doi: 10.1029/2023GL104736
Schütte F., Karstensen J., Krahmann G., Hauss H., Fiedler B., Brandt P., et al. (2016). Open Ocean dead zone in the tropical North Atlantic Ocean. Biogeosciences 13, 5865–5881. doi: 10.5194/bg-13-5865-2016
Shapiro G. I., Meschanov S. L. (1991). Distribution and spreading of Red Sea Water and salt lens formation in the northwest Indian Ocean. Deep Sea Res. Part A Oceanographic Res. Papers. 38, 21–34. doi: 10.1016/0198-0149(91)90052-H
Song L., Li Y., Liu C., Wang F. (2017). Subthermocline anticyclonic gyre east of Mindanao and its relationship with the Mindanao Undercurrent. Chin. J. Oceanology Limnology 35, 1303–1318. doi: 10.1007/s00343-017-6111-8
Song W., Zhang L., Hu D. (2022). Observed subsurface lens-like features east of the Philippines. Deep Sea Res. Part I. 190, 103901. doi: 10.1016/j.dsr.2022.103901
Sun Z., Zhang Z., Qiu B., Zhou C., Zhao W., Tian J. (2022). Subsurface mesoscale eddies observed in the northeastern south China Sea: dynamic features and water mass transport. J. Phys. oceanography. 52, 841–855. doi: 10.1175/JPO-D-21-0177.1
Thomsen S. T., Kanzow G., Krahmann R. J., Greatbatch M., Dengler, Lavik G. (2016). The formation of asubsurface anticyclonic eddy in the Peru-Chile Undercurrent and its impacton the near-coastal salinity, oxygen, and nutrient distributions. J. Geophys.Res. Oceans. 121, 476–501. doi: 10.1002/2015JC010878
Wang Q. Y. (2017). Three-dimensional structure of mesoscale eddies in the western tropical Pacific as revealed by a high-resolution ocean simulation. Sci. China Earth Sci. 60, 1719–1731. doi: 10.1007/s11430-016-9072-y
Wang X., Du Y., Zhang Y., Wang T., Wang M., Jing Z. (2023a). Subsurface anticyclonic eddy transited from Kuroshio shedding eddy in the northern south China sea. J. Phys. oceanography. 53, 841–861. doi: 10.1175/JPO-D-22-0106.1
Wang H., Qiu B., Liu H., Zhang Z. (2023b). Doubling of surface oceanic meridional heat transport by non-symmetry of mesoscale eddies. Nat. Commun. 14, 1–10. doi: 10.1038/s41467-023-41294-7
Weiss (1991). The dynamics of enstrophy transfer in two-dimensional hydrodynamics. Nonlinear Phenomena. 48, 273–294. doi: 10.1016/0167-2789(91)90088-Q
Xiu P., Chai F. (2020). Eddies affect subsurface phytoplankton and oxygen distributions in the North Pacific Subtropical Gyre. Geophysical Res. Letters. 47, e2020GL087037. doi: 10.1029/2020GL087037
Xu A., Yu F., Nan F. (2019). Study of subsurface eddy properties in northwestern Pacific Ocean based on an eddy-resolving OGCM. Ocean Dynamics. 69, 463–474. doi: 10.1007/s10236-019-01255-5
Xu A., Yu F., Nan F. (2020). Characteristics of subsurface mesoscale eddies in the northwestern tropical Pacific Ocean from an eddy-resolving model. J. Oceanology Limnology. 38, 1421–1434. doi: 10.1007/s00343-020-9313-4
Yang G. B., Zheng Q., Xiong X. J., Yuan Y., Zhuang Z., Hui Z., et al. (2019). Subsurface cyclonic eddies observed in the southeastern tropical Indian Ocean. J. Geophysical Research: Oceans. 124, 7247–7260. doi: 10.1029/2019jc015381
Yu Y. (1992). Confirmation of the spawning grounds of Japanese eel (Anguilla japonica) in the eastern seas of the Philippines. Guowai Shuichan (in Chinese). 2, 32.
Zhang L., Hui Y., Qu T., Hu D. (2021). Seasonal variability of subthermocline eddy kinetic energy east of the Philippines. Am. Meteorological Society. 42, 685–699. doi: 10.1175/JPO-D-20-0101.1
Zhang L., Song W., Song W., Hui Y., Wang Z., Hu D. (2024). Subsurface eddies east of the Philippines: Geographic characteristics, vertical structures, volume and thermohaline transport. Prog. Oceanography. 222, 103228. doi: 10.1016/j.pocean.2024.103228
Zhang Z., Wang W., Qiu B. (2014). Oceanic mass transport by mesoscale eddies. Science 345, 322–324. doi: 10.1126/science.1252418
Zhang Z., Zhang Y., Wang W. (2017). Three-compartment structure of subsurface-intensified mesoscale eddies in the ocean. J. Geophys. Res. Oceans. 122, 1653–1664. doi: 10.1002/2016JC012376
Zhao D., Xu Y., Zhang X., Huang C. (2020). Global chlorophyll distribution induced by mesoscale eddies. Remote Sens. Environment. 254, 112245. doi: 10.1016/j.rse.2020.112245
Keywords: subsurface eddy, east of the Philippines, biogeochemical properties, composite structures, transports by eddy movement
Citation: Ding Y-n, Xu A, Shi S, Liu K, Gao Z, Wu X, Nan F and Yu F (2024) Subsurface mesoscale eddies in the east of the Philippines: three-dimensional biogeochemical structures and transports. Front. Mar. Sci. 11:1439787. doi: 10.3389/fmars.2024.1439787
Received: 28 May 2024; Accepted: 30 October 2024;
Published: 21 November 2024.
Edited by:
Baptiste Mourre, Spanish National Research Council (CSIC), SpainReviewed by:
Wuchang Zhang, Chinese Academy of Sciences (CAS), ChinaHuabin Mao, South China Sea Institute of Oceanology, Chinese Academy of Sciences (CAS), China
Anna Teruzzi, National Institute of Oceanography and Applied Geophysics, Italy
Copyright © 2024 Ding, Xu, Shi, Liu, Gao, Wu, Nan and Yu. This is an open-access article distributed under the terms of the Creative Commons Attribution License (CC BY). The use, distribution or reproduction in other forums is permitted, provided the original author(s) and the copyright owner(s) are credited and that the original publication in this journal is cited, in accordance with accepted academic practice. No use, distribution or reproduction is permitted which does not comply with these terms.
*Correspondence: Suixiang Shi, c3N4QG5tZGlzLm9yZy5jbg==; Fei Yu, eXVmQHFkaW8uYWMuY24=
 Ya-nan Ding
 Anqi Xu2
 Kexiu Liu
 Feng Nan
 Fei Yu