- 1Department of Biosciences, Durham University, Durham, United Kingdom
- 2Marine Directorate, Aberdeen, United Kingdom
Introduction: Ocean habitat characteristics change with depth. This is due to physical properties such as light, temperature and hydrostatic pressure, but also species community. In some cases, this generates a boundary (e.g. when light is lost in the bathypelagic), and in others it varies continuously (e.g. for hydrostatic pressure). Various studies have noted general morphometric adaptations to living at different depths seen among species, even though vertical migration can cause their ranges to overlap. However, few have looked at intraspecific changes.
Methods: Here we investigate intraspecific variation for four species of demersal fish that inhabit a broad range of depths (200 m to over 2000 m). We test the hypothesis that intraspecific morphological variation will be similar to that seen among species.
Results: We find that there are significant phenotypic differences between fish taken at different habitat depths, especially associated with mouth gape size, eye size, body shape and organ mass, despite the potential for vertical migration. However, we find that these patterns vary among species.
Discussion: We consider the possible drivers and implications for maintaining intraspecific phenotypic differences.
1 Introduction
Habitat characteristics in the oceans are often thought of as relatively constant over broad geographic distances. Circulation patterns, thermoclines and haloclines define oceanographic regions, but these are often not hard barriers to movement. However, while environmental transitions over geographic ranges can be gradual, change by habitat depth is relatively rapid. The deep sea can be divided into zones defined especially by light penetration and hydrostatic pressure (see Sutton, 2013). To a depth of 200m we define the epipelagic zone, where there is sufficient light penetration to support photosynthesis. From 200m to 1000m is the mesopelagic zone that still receives some light. Illumination is sufficient for visual predators, but too low for photosynthesis, and the zone is critical for the vertical transport of carbon through the water column (the biological carbon pump; see Stefanoudis et al., 2019). From 1000m to 4000m is the bathypelagic zone, where light penetration stops and nutrients falling from above (“marine snow”) become more important. The bathypelagic zone is the largest ecosystem on the planet, comprising almost 75% of ocean volume (Ramirez-Llodra et al., 2010). For every 10m of water depth, pressure increases by about 1 atmosphere (0.098 MPa), and pressure is slightly higher at a given depth at higher latitudes (see Rumble, 2023). At 2000m depth and a latitude of 45°, the pressure is 20.26 MPa (equivalent to 2,939 pounds per square inch). Oxygen is produced by photosynthesizing phytoplankton and atmospheric absorption, enhanced by turbulence, in the epipelagic zone, which can then be redistributed, accumulating in colder deep water. In the North Atlantic, the ‘North Atlantic Deep Water’ (NADW) is a region of high salinity and high oxygen, below the oxygen minimum layer, starting at about 1500m (see Talley et al., 2011).
The environmental differences are therefore extreme between oceanic zones, especially with respect to light and pressure. Even so, there are marine vertebrates that live across different zones in this habitat range, and four of these species are the subject of this study. They are all deep demersal fish species, the roundnose grenadier (RNG; Coryphaenoides rupestris), the spear-snouted grenadier (SSG; Coelorinchus labiatus), the cut-throat eel (CTE; Synaphobranchus kaupii) and the smooth head (SMO; Alepocephalus bairdii). We chose these four as they are all common in the same geographic area near the Hebrides in the Northeast Atlantic. Many species in the ocean migrate vertically in the water column either seasonally or on a diel pattern, often to shallower waters at night to forage, and to deeper waters during the day to avoid predation (Bandara et al., 2021). Little is known about diel vertical migration (DVM) for our subject species. Evidence can be based on the inclusion of pelagic prey species in the diets of deep-water demersal species. For RNG, a recent study indicated that ‘although the importance of pelagic prey was found, a diel vertical migration pattern could not be confirmed’ (Stenseng Høie, 2017). Consumption of pelagic prey had been reported earlier for this species (e.g. especially euphausids off Norway; Bergstad et al., 2003). Stenseng Høie (2017) proposed that pelagic prey may be taken by RNG at the deeper range of the prey’s diel migrations (and euphausids are known to migrate into deep water; Tremblay et al., 2020). One deep-sea shark species found down to 700m (Hexanchus griseus) shows a diel pattern, with consistent habitat depth during each daytime and nighttime period (Coffey et al., 2020). If typical, this would suggest that sampling at any time during the daytime period would give similar results. For a number of deep-sea demersal species, ontogenic migration has also been documented, with larvae found in shallower water and juveniles migrating to deeper water where they remain as adults (see Lin et al., 2012). Here we restrict our analyses to mature fish (based on size, or sexual maturity when possible).
In another study of RNG, genome re-sequencing showed non-synonymous fixed differences at coding loci above compared to below 1500 m, though there was no evident differentiation at neutral genetic markers (Gaither et al., 2018). This relationship was consistent across the geographic distribution range in the North Atlantic whenever samples had been collected (indicating a pattern that was not disrupted by DVM). Some of the fixed changes may be associated with loci with metabolic function, but most were associated with development (Gaither et al., 2018). Comparing among species has identified various morphological trends. For example, Kaariainen and Bett (2006) showed that average body size of large and small macrofauna, mesofauna and meiofauna all decreased with depth when comparing communities sampled at 150m and 1600m. Rex et al. (2006) also found evidence to support this trend, reporting that body size decreases across meiofauna, macrofauna and megafauna with increasing depth across all zones. This is predicted by Thiel’s (1975; 1979) size-structure hypothesis, which suggested that despite higher relative metabolic cost, the lower individual food demands of smaller individuals would promote a decrease in body size as food availability becomes limited with depth. However, the trend is not consistent. Collins et al. (2005) showed that for 76 demersal fish species trawled from between 800 and 4800 m, the mean body size of scavenging fish species increased with depth, while the size of non-scavenging fish decreased. They suggested that larger sizes in scavengers permitted higher swimming speeds and endurance, as well as improved mass-specific metabolic efficiency, allowing improved survival on sporadic scavenged food items.
Proportional morphometrics also show patterns among species predominantly inhabiting different depths. Neat and Campbell (2013) observed a trend for increased body elongation at greater habitat depths in c. 266 fish species found across the meso- and bathypelagic zones in the Northeast Atlantic. This change was linked to improved efficiency of anguilliform swimming. This form of locomotion is observed in long, slender fish such as eels, and involves wave-like side-to-side undulations across the body’s length, a movement best suited to light-deficient environments where the requirement for high-speed prey pursuit is redundant and predation pressure is reduced. Anguilliform swimming is more energy efficient in more viscous water, and water viscosity increases slightly with hydrostatic pressure and therefore depth (Likhachev, 2003). Another depth-associated pattern linked with feeding ecology is the trend for increased mouth gape size with depth, allowing bathypelagic species whose food is more limited to fill a more generalized predatory niche and access a wider range of food resources (Drazen and Sutton, 2017). For example, among 31 meso- and bathypelagic lanternfish and big-scale species, it was shown that mouth size increased among bathypelagic species independent of body size (Ebeling and Cailliet, 1974). Orbit (eye) size is another morphometric characteristic seen to vary with depth. The general trend in the literature is for reduction in eye size in the bathypelagic zone as compared to the mesopelagic (Warrant et al., 2003). No sunlight reaches the bathypelagic zone, with the only sources of light radiating from small bioluminescent organisms. According to Warrant (2000), increasing eye size in the bathypelagic merely improves long-distance sensitivity to bioluminescent point signals.
Relative organ mass shows some trends among species that inhabit different depths. The swim bladder is a gas-filled organ essential for maintaining buoyancy and therefore energy-efficient swimming. In many deep sea teleosts, the swim bladder contains lipids comprised mostly of cholesterol and phospholipids, which are saturated with oxygen bubbles thus providing buoyancy (Phleger, 1991, 1998). These oxygen bubbles are delivered to the swim bladder by the Root effect, which is a phenomenon observed in fish hemoglobin wherein decreasing pH and increased blood carbon dioxide concentration decrease the hemoglobin’s oxygen carrying capacity, resulting in oxygen dissociation and offloading into the swim bladder (Pelster and Weber, 1991). There has been some suggestion that the Root effect becomes limited at high hydrostatic pressures and is therefore not responsible for swim bladder inflation in deep sea species. This led to the belief that the lipids in the swim bladder themselves might aid oxygen dissociation and swim bladder inflation (Scholander, 1954; Phleger, 1998). If this were the case, a greater mass of lipids could be expected with increasing habitat depth. Changes in proportional liver mass may also be associated with habitat depth. Energy storage in three Coryphaenoides species (C. armatus, C. yaquinae and C. acrolepis) was shown to be mainly in the form of neutral lipids in the liver (Drazen, 2002). Large lipid energy stores in deep sea fish are associated with long periods of fasting (Musick and Cotton, 2015); indeed, Smith (1978) showed that the liver lipid stores of the highly food limited abyssal grenadier C. armatus were sufficient for survival for c. 186 days without feeding.
There are few data on phenotypic variation by depth within a species, and that will be the focus of this study. Even if individuals move vertically in the water column, it is possible that they adapt to live predominantly or perform particular functions within a defined habitat depth range. There are three main mechanisms by which intraspecific (ecotype) differences may be sustained, namely phenotypic plasticity, balanced polymorphism and reproductive isolation. Individuals that develop in different environments may exhibit morphological differences by plastic changes that occur during ontogenesis. Adaptive phenotypic plasticity has been proposed for a number of fish species, such as the differentiation between lake and river populations of the African cichlid Astatotilapia burtoni (Rajkov et al., 2018) and differentiation between pumpkinseed sunfish (Lepomis gibbosus) in static as compared to flowing water (Yavno and Fox, 2013). For some species, common garden experiments can be used to help determine the degree to which the difference is plastic (divergent phenotype with the same genetic background) or if it has a genetic component. The second mechanism for sustaining intraspecific variation is a balanced polymorphism. A genetic polymorphism sustained among male reproductive strategists in the bluegill sunfish (Lepomis macrochirus) was famously proposed by Dominey (1980). The fixed genetic differences by habitat depth in RNG (Gaither et al., 2018) were seen in spite of the fact that all appear to mate together in midwater (around 1000m; Neat, 2017; Gaither et al., 2018) which could be sustained by balanced polymorphism. The third mechanism involves reproductive isolation either through assortative mating or some physical boundary to dispersal. This should result in some level of differentiation due to genetic drift, not observed for RNG (Gaither et al., 2018).
Phenotypic variation within a species (either plastic or based on genotype) contributes significantly to direct and indirect ecological responses within an ecosystem community (Des Roches et al., 2018). Therefore, understanding intraspecific patterns of variation is critical to understanding and conserving ecosystem function. It is also important towards the effective management of stocks for deep water species. All four species included in this study are affected by fisheries; RNG and SMO are vulnerable to direct fisheries and SSG and CTE as large-scale bycatch (IUCN Redlist). In the eastern North Atlantic the regulatory body (NEAFC) recognizes only two of the species in our study, and for SMO this is only at category ‘4’ (to complement EEZ measures in order to ensure that total catches remain within e.g. catch limits advised by ICES). The one species for which there is an extensive direct catch (RNG) is listed as Critically Endangered by the IUCN Red list. Conspecific stocks for independent management are not currently identified by habitat depth, however, our data suggests that this should be an essential aspect of effective management for these species.
In this study we compare phenotypic variation by depth in four species of deep sea demersal fishes, all of which are found in habitats over a depth range from ~200m to 2km or more. We test the hypothesis that any variation will reflect environmental challenges. We find significant variation for adults across the sampled habitat depth ranges, but the patterns were not always consistent with expectations based on comparisons among species (e.g. Neat and Campbell, 2013; Drazen and Sutton, 2017).
2 Methods and methods
2.1 Sample collection & measurements
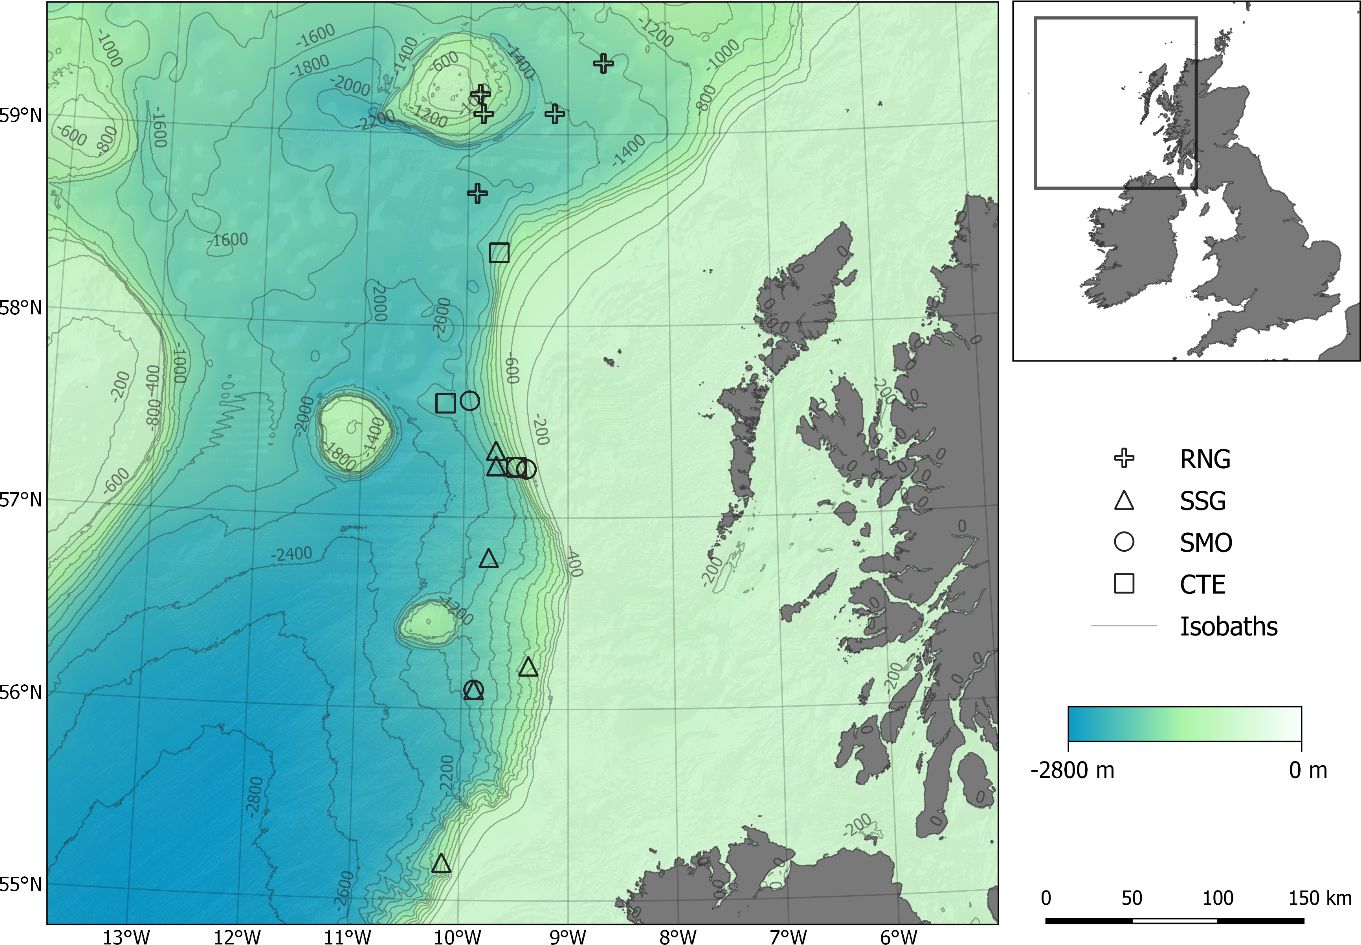
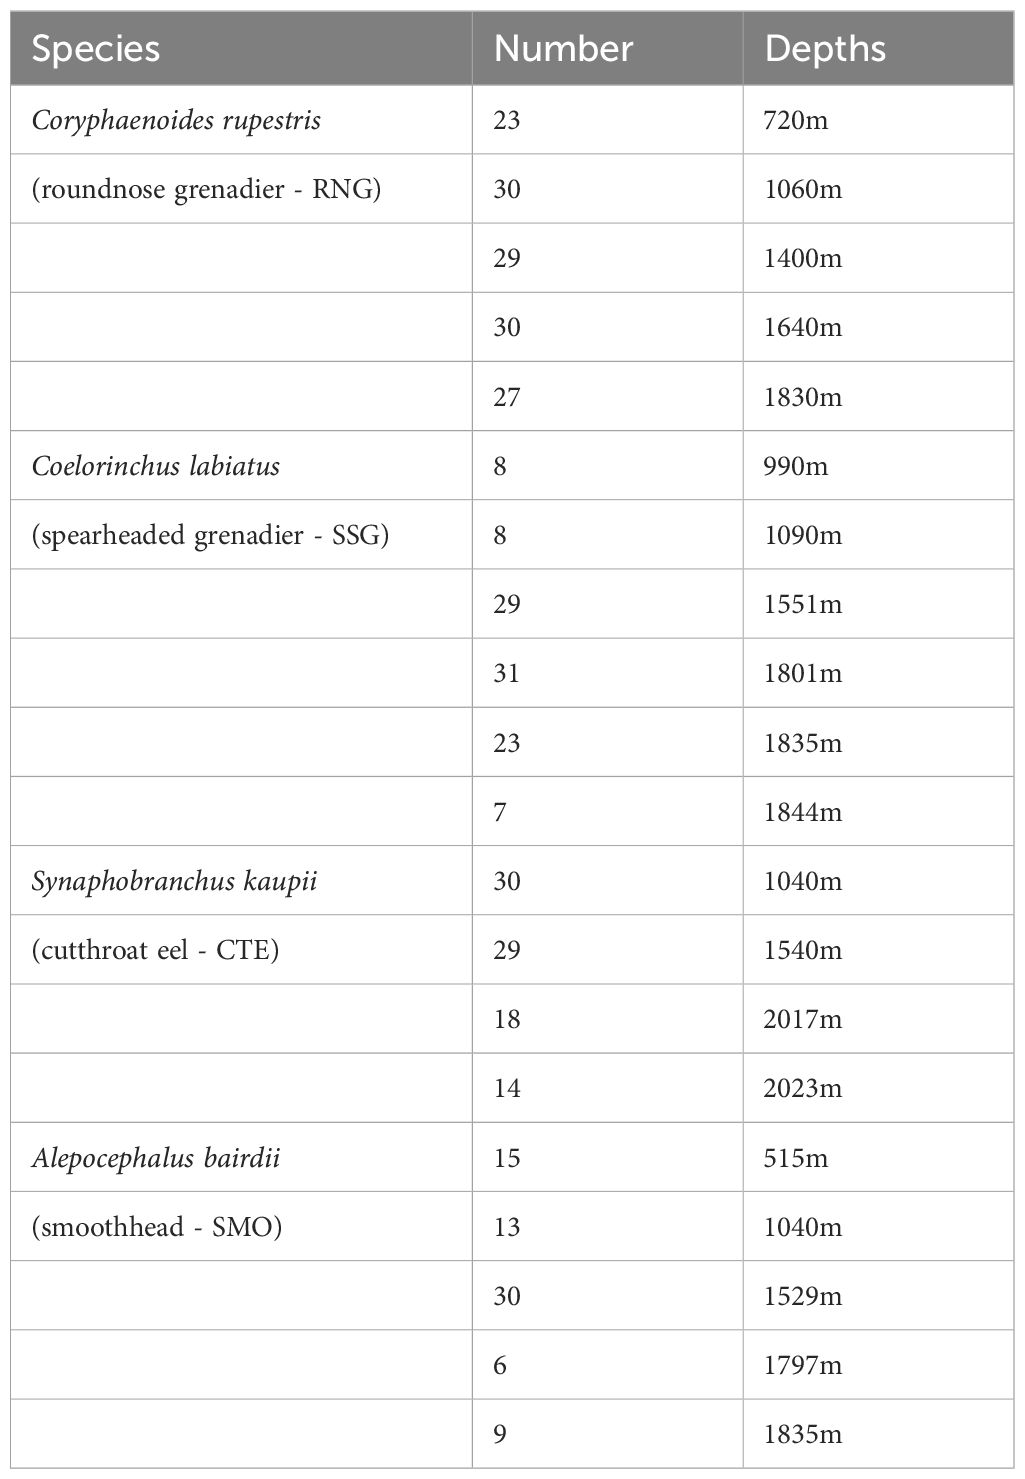
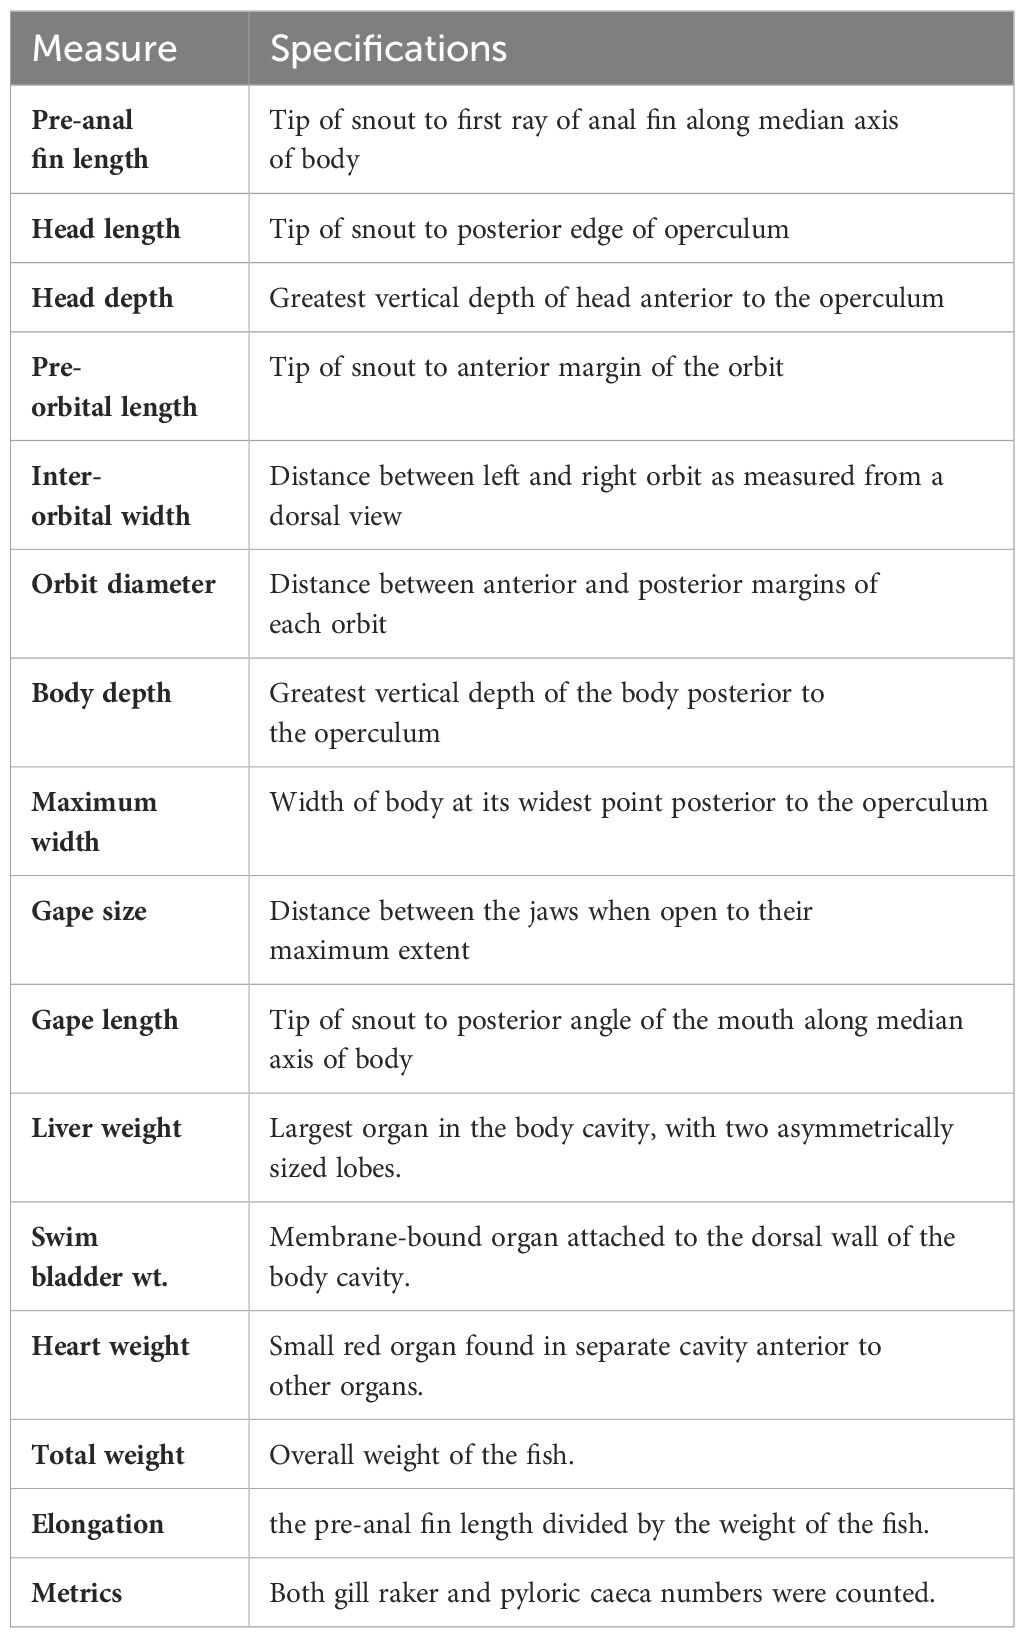
Four deep-sea species were investigated: RNG, SSG, CTE and SMO (Figure 1). All were captured by trawl fishing from the Northeast Atlantic, west of the Scottish Hebrides region (Figure 2) over a short period of time. Their sympatry and relative abundance was the reason for choosing these four species. Sample collection depths and numbers per species are shown in Table 1. The relationship between sampling depth and time of sampling had no consistent pattern (Supplementary Figure S1), and all sampling was during daylight hours (when species exhibiting DVM are expected to be in deep water). Fish were weighed (total weight ± 0.01g) immediately after capture before being tagged with unique identification numbers and frozen. Fish were measured when thawed, and all measurements (Table 2) were taken from the left side of all specimens, replicated 3 times and the average used for further analyses. Our measure of ‘elongation’ standardized length against weight to provide a single metric that could reflect both width and depth of the fish. To help control for possible ontogenic patterns, no juvenile samples were included, only those judged to be mature (based on size and gonadal development). To further check for this possible bias, metrics were re-measured using only the largest fish (upper half of the size range), and the morphotypic pattern comparing shallow and deep habitat ranges remained the same for all comparisons (data not shown). Sizes smaller than 120 mm were measured to the nearest 0.1 mm using dial Vernier calipers. Larger sizes were measured to the nearest 1 mm using either large Vernier calipers, spring joint calipers, or a tape measure. Due to damage incurred on the specimens during trawling, not all measurements were possible on every individual. The most common form of damage was to the tails, some of which were missing or broken. For this reason, total length measurements were not possible for all individuals, and pre-anal fin lengths (PAFL) were used as a substitute overall length measure (Savvatimsky, 1985; O’Hea et al., 2013).
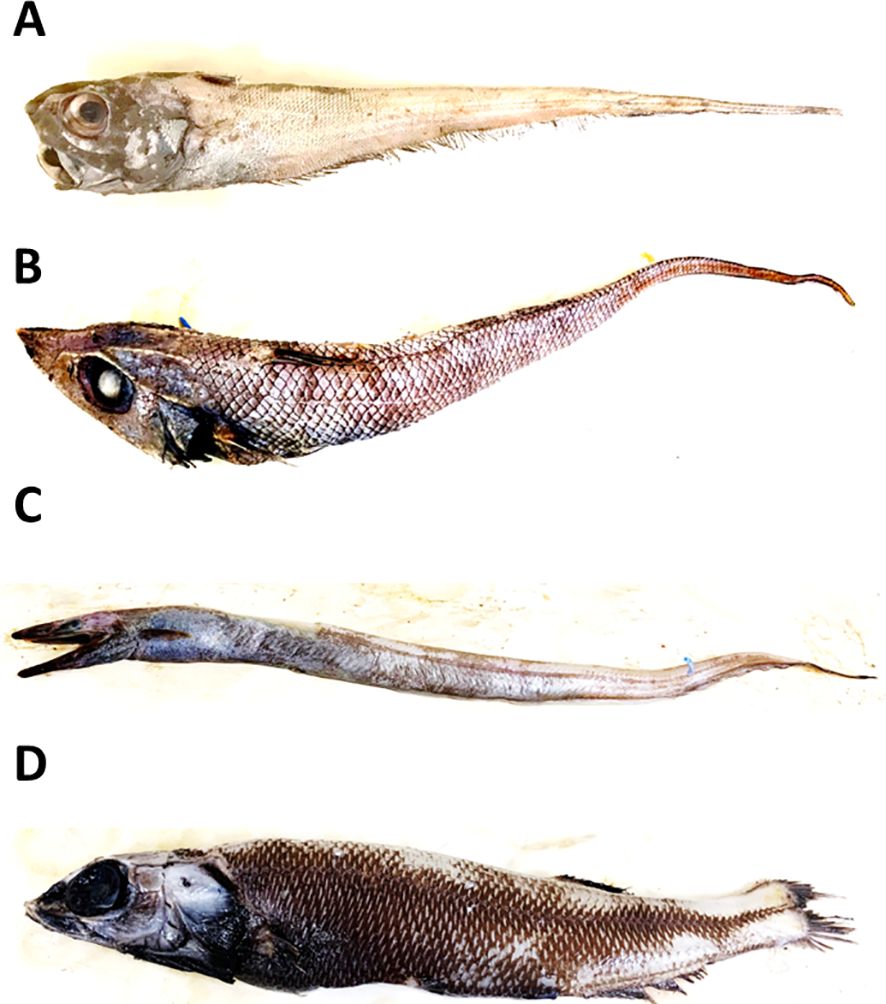
Figure 1. (A) roundnose grenadier (RNG: Coryphaenoides rupestris); (B) spear-snouted grenadier (SSG: Coelorinchus labiatus); (C) cut-throut eel (CTE: Synaphobranchus kaupii); (D) smoothhead (SMO: Alepocephalus bairdii).
After the external measurements were recorded, the left operculum was removed with scissors and the first gill arch removed. The number of gill rakers on the upper and lower limb of the gill arch were counted. The liver, swim bladder, gonads and heart were removed and weighed (wet after draining on absorbent paper) to the nearest 0.1 g, or, for organs weighing less than 1 g, to the nearest 0.001 g. The digestive tract was identified and removed. The change in pressure experienced when specimens are captured and brought to the surface can cause fish to regurgitate their stomachs and further components of the digestive system, so these organs were often found, to varying degrees, either in the main body cavity, or everted into the mouth. The pyloric caeca bundle was removed from the digestive tract, and the number of fingers counted. Prior to comparison between individuals, all length measurements and organ weights were standardized to correct for allometry (after Costa et al., 2003). First, all length measurements were log transformed and regressed against log PAFL and log weight measurements against log total weight. Individuals were checked to be within three standard deviations of the regression line, and regressions were checked for significance. We used the allometric formula described in Costa et al. (2003) to adjust for size or weight bias. This was, ACi = logOCi – [β x (log PAFLi – log MPAFL)] where Aci is the logarithmic character measurement for the ith specimen, OCi is the unadjusted character measurement, β is the common group regression coefficient (for the character against PAFL or total weight), and MPAFL is the mean PAFL for that species (PFAL is replaced by total weight for the relevant measures).
Sex could not be confidently determined from all specimens, thus gonad weight was excluded from multivariate analyses in case of sex bias by depth. When sex was estimated by gonadal weight and just the most common sex sampled was included, the same morphotypic patterns between habitat depth ranges were seen as when all samples were included (data not shown). Bergstad et al. (2021) found little or no sexual dimorphism for growth for six deep-sea fish species at the mid-Atlantic ridge (including RNG).
2.2 Statistical analyses
Tests for normality (Shapiro-Wilk test) and equal variance (Levene’s test) showed that some sample sets violated these assumptions, and so all comparisons of individual measures were done using the non-parametric Mann Whitney U-test. Significance was assessed correcting for type one errors using the Bonferroni correction. We compared individual characters between two depth ranges, below and above 1,500m. This permitted each range to include a sufficient sample size. It is also consistent with potential ecological and environmental drivers of differentiation, associated with light penetration, oxygen saturation, temperature, hydrostatic pressure, species community, etc. A pairwise correlation matrix was generated using the Spearman correlation among individual characters to guide character selection for the Random Forest analysis. For reference, we calculated the student’s t statistic for these comparisons, and note that for each species the number of comparisons (91) meant that the threshold for significance after Bonferonni correction was 0.0005 (t = 3.65 or higher). Random Forest is robust in isolating the influence of redundant, highly correlated predictors (Hanberry, 2023). However, the usual practice in dealing with collinearity is to minimize its potential effect by selecting variables whose correlation coefficients are below a certain threshold (e.g., |r| <0.7 in Dormann et al. (2013)). Here we chose a threshold of 0.6.
To estimate the ability of morphological features to discriminate between individuals collected at different depths, two approaches were considered, a supervised approach consisting of Random Forest classification, and an unsupervised approach consisting of clustering based on Random Forest generated distances. In Random Forest classification, the model is trained to recognize multivariate differences in morphological traits between two depth ranges (<1500m and >1500m) and the outputs is a measure of accuracy by which individuals can be assigned to their true depth range based on a selected combination of traits. The Random Forest clustering takes a different approach and performs clustering (based on a generated distance matrix) without considering sampling depth. The identified clusters are then confronted to actual sampling depths to identify depths patterns in morphology and assess the relevant depths (amongst the depths sampled in this study) at which such patterns occur.
For both approaches, covariates were first selected based on their degree of correlation (correlation less than 0.6; Supplementary Tables S1–S4) and variables were kept if their mean decrease in classification accuracy (a measure of variable importance in Random Forest) was positive (i.e. their inclusion improved classification accuracy). As Random Forest classification is sensitive to class imbalance, a sample of individuals from two depth categories (<1500m and >1500m) was drawn at random (40 per depth category for RNG and SSG, and 25 for CTE and SMO), and the Random Forest classification was run on this sample repeated 100 times. Each iteration consisted of a random Forest of 1000 trees. Classification accuracy for each forest was calculated using cross-validation as Random Forest builds a tree using 66% of the data (In Bag sample, IB) and assess classification accuracy on the 33% of the data not used to build that tree (Out Of Bag sample, OOB). All data are used as for each tree IB and OOB samples are drawn at random. Overall classification accuracy and variable importance were calculated as the average of the 100 iterations. The clustering analysis was performed by first generating a distance matrix between individuals using unsupervised Random Forest and applying partitioning around medoid (Kaufman and Rousseeuw, 1990) to the distance matrix (Shi and Horvath, 2006; Gibb et al., 2017; Régnier et al., 2017). For each species considered, the distance matrix was generated from 100 forests each consisting of 2000 trees. The number of clusters was then determined using both the Gap statistic (Tibshirani et al., 2001) and the Dunn index (Halkidi et al., 2001). Assessment based on all variables was also examined using the Permutation MANOVA non-parametric multivariate test, with 1,000 iterations.
3 Results
Because of the small geographic range among sampling sites for each species (see Figure 2), we assumed that there would be no population variation associated with geographic distance. The log transformations of all measurements had significant regressions with PAFL or total weight, and just one SMO individual was removed as an outlier. There were no significant differences found from pairwise comparisons of morphological features in SMO found at the two different depth categories (above and below 1500m; Supplementary Table S5), however there were significant differences for RNG, SSG and CTE (Tables 3, 4). The pattern was not consistent among species. Figure 3 shows the relative changes for five representative characteristics that showed the a strong effect (gape size, orbit diameter, elongation, liver weight and swim bladder weight; see Tables 3, 4 for the full set of characters). Swim bladder weight showed a significant difference within all three of these species, and the pattern was not consistent (Figure 3). Swim bladder weight was proportionally heavier at depth for RNG but lighter for SSG and CTE. Orbit diameter (relative size of the eye) showed the same pattern of increasing with depth for all three species, significant for all three species. For the other 3 characteristics (gape size, elongation and liver weight), SSG and CTE showed the same trend with increased depth while RNG showed the opposite, though not all of these trends were significant (Tables 3, 4). There were no significant differences for either of the meristic measures (gill raker number and number of pyloric caeca) across all species by depth. Some characteristics showed a high correlation with others, and this is shown in Supplementary Tables S1–S4.
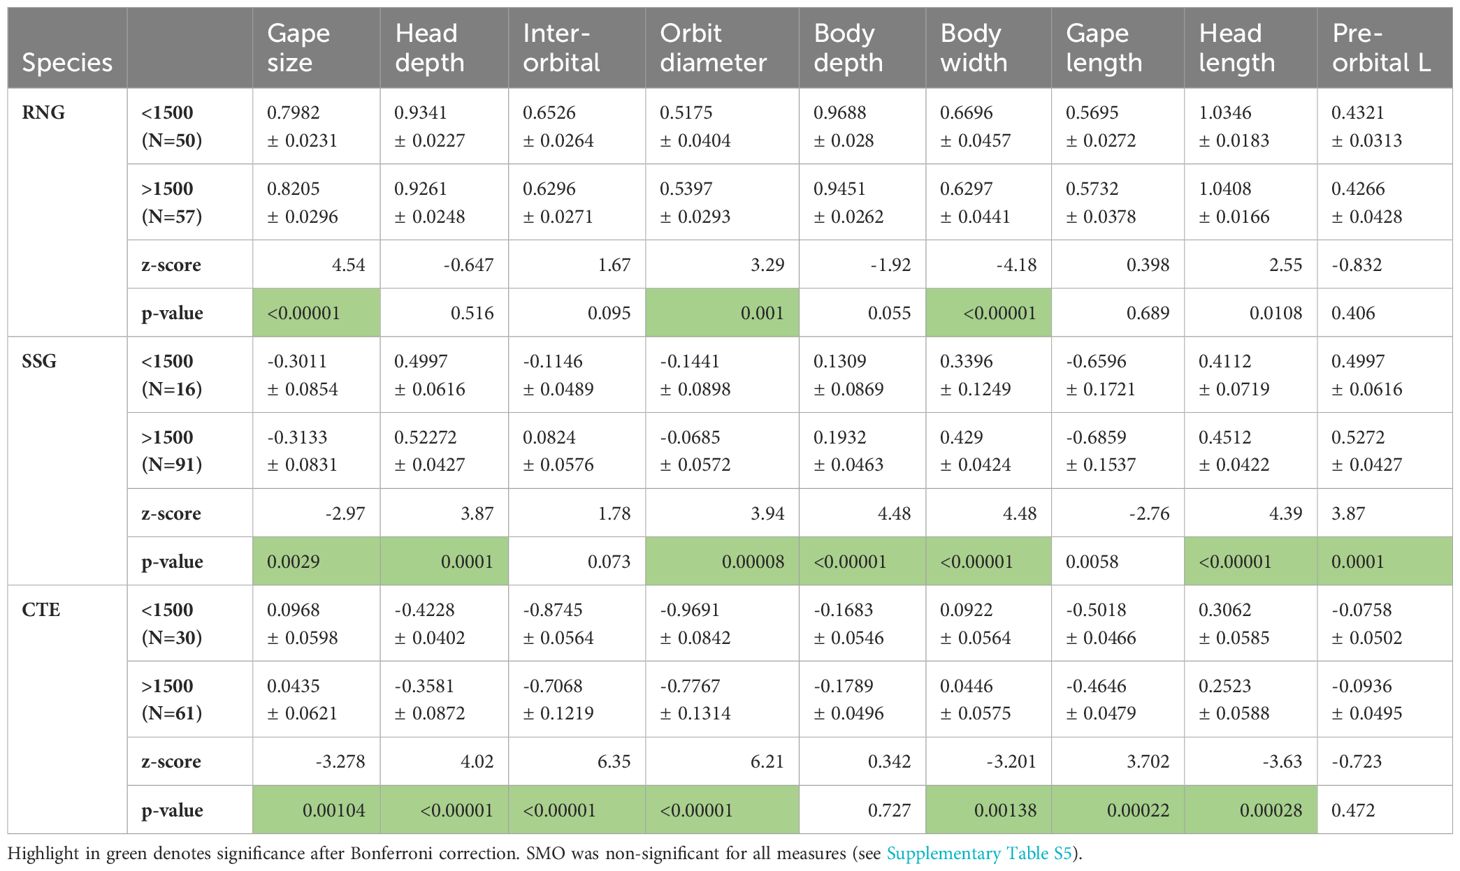
Table 3. Body dimensions for RNG (round-nosed grenadier), SSG (spear-snouted grenadier) and CTE (cut-throat eel), all log transformed and adjusted for allometry (see methods).
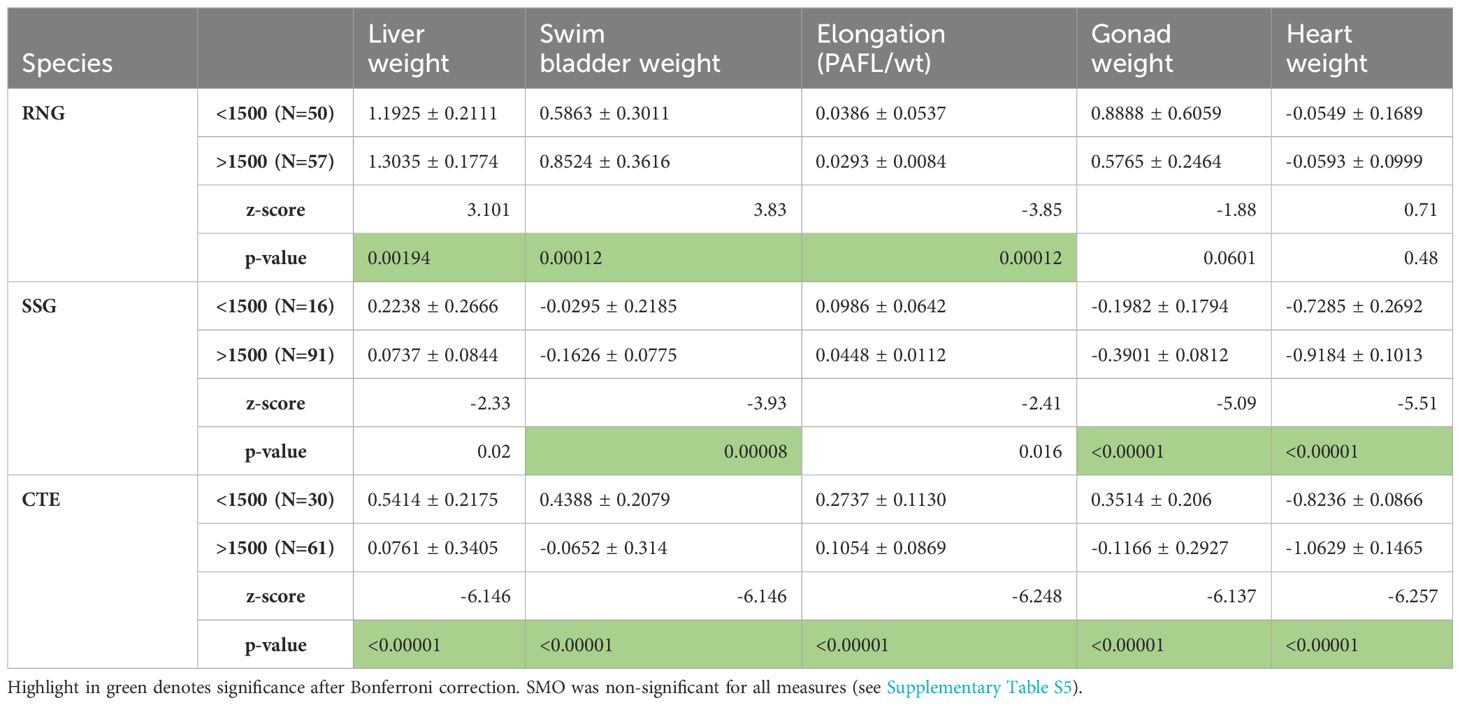
Table 4. Organ weights for RNG (round-nosed grenadier), SSG (spear-snouted grenadier) and CTE (cut-throat eel), all were log transformed and adjusted for allometry (see methods).
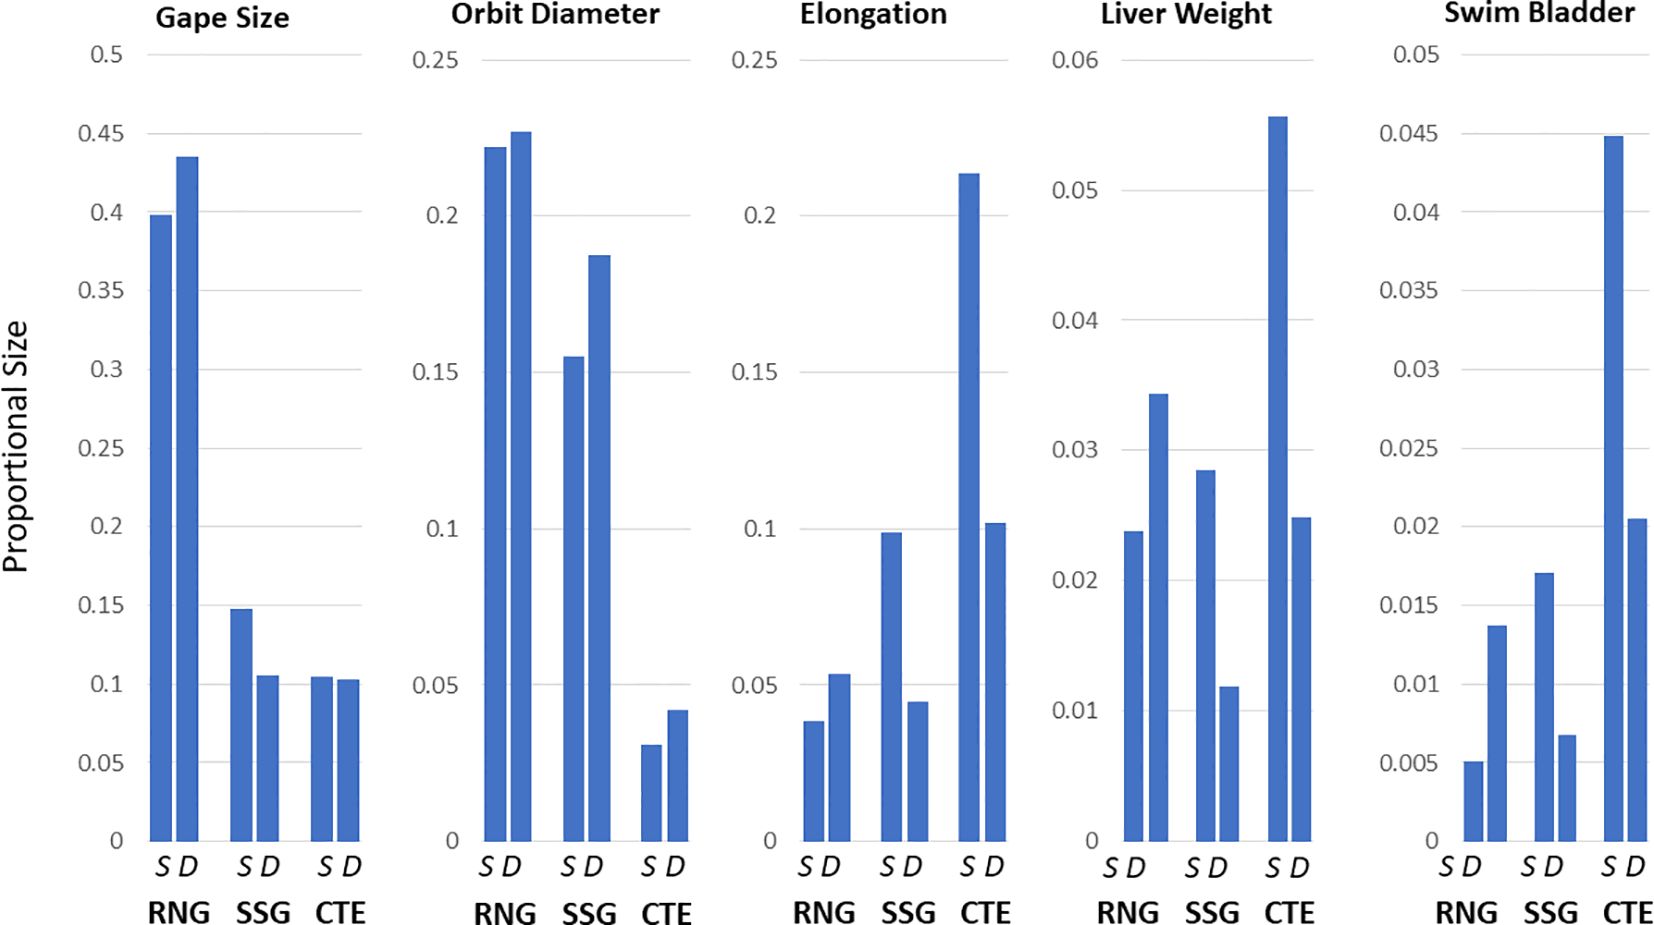
Figure 3. Morphological variation comparing shallow (S) and deep (D) fish collected below or above 1500m. The 5 measures shown are among those that differ with the greatest significance. For this illustration, linear measures are divided by pre-anal fin length, while mass is divided by overall weight.
In random forest classification, the 3 most important variables for RNG were gape size, maximum width and swim bladder weight. For SSG, the 3 most important variables were gape length, orbit diameter and swim bladder weight. Orbit diameter, head depth and gape size were the 3 most important variables for CTE. Finally, the 3 most important variables for SMO were gape size, head depth and pre-orbital length. Overall classification accuracy was 80.24% for RNG, 68.39% in SSG, 87.61% in CTE and 57.84% in SMO. Cross-validated classification accuracy for each depth category is presented in Table 5. The permutation MANOVA test was significant for RNG (p=0.0009), SSG (p=0.0059, and CTE (p=0.0009), but not for SMO (p=0.209).
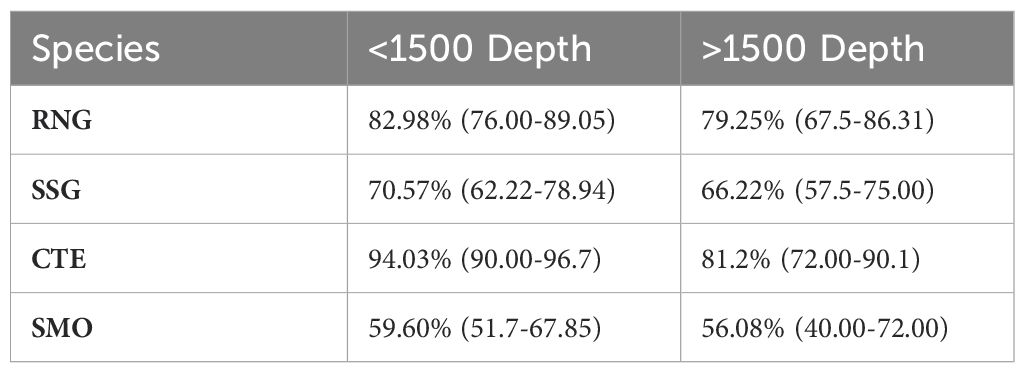
Table 5. Percentage of individuals of each species assigned to shallow (< 1500 m) and deep (> 1500 m) regions, based on a supervised Random Forest classification of morphological features.
For the cluster composition analysis, the results were largely consistent with the other assessments. For RNG, there was one cluster (white in Figure 4) well represented at the shallower depths of 720m (40.9%) and 1060m (50%) and in lower proportions at lower depths (0% at 1400m, 17.2% at 1640m and 29.6% at 1830m). Another cluster (black in Figure 4) dominated between 1640m and 1830m (68.9% and 44.4% respectively) and a third cluster was represented at all depths (grey in Figure 4). This suggests deep and shallow morphotypes with considerable overlap at intermediate depths. For SSG, there is a dominant cluster (white in Figure 4) present at all depths but representing 100% of individuals at the shallow depths of 990m, 87.5% of individuals at 1090m and 58.62% of individuals at 1551m and in lower proportions at higher depths (6.45% at 1801m, 30.43% at 1835m and 14.28% at 1844m). Black and grey clusters (Figure 4) dominated the higher depths between 1801m and 1844m, suggesting a deep morphotype. For CTE while the shallower depth was represented by a mixture of four clusters, one cluster (black in Figure 4) dominated the range 1540-2023m, suggesting a deep morphotype. For SMO the pattern is unclear, since there seem to be clusters of the same type in both the shallowest and deepest samples. This is consistent with the lower random forest assignment in this species, and the lack of significant differences in pairwise comparisons either side of 1500m.
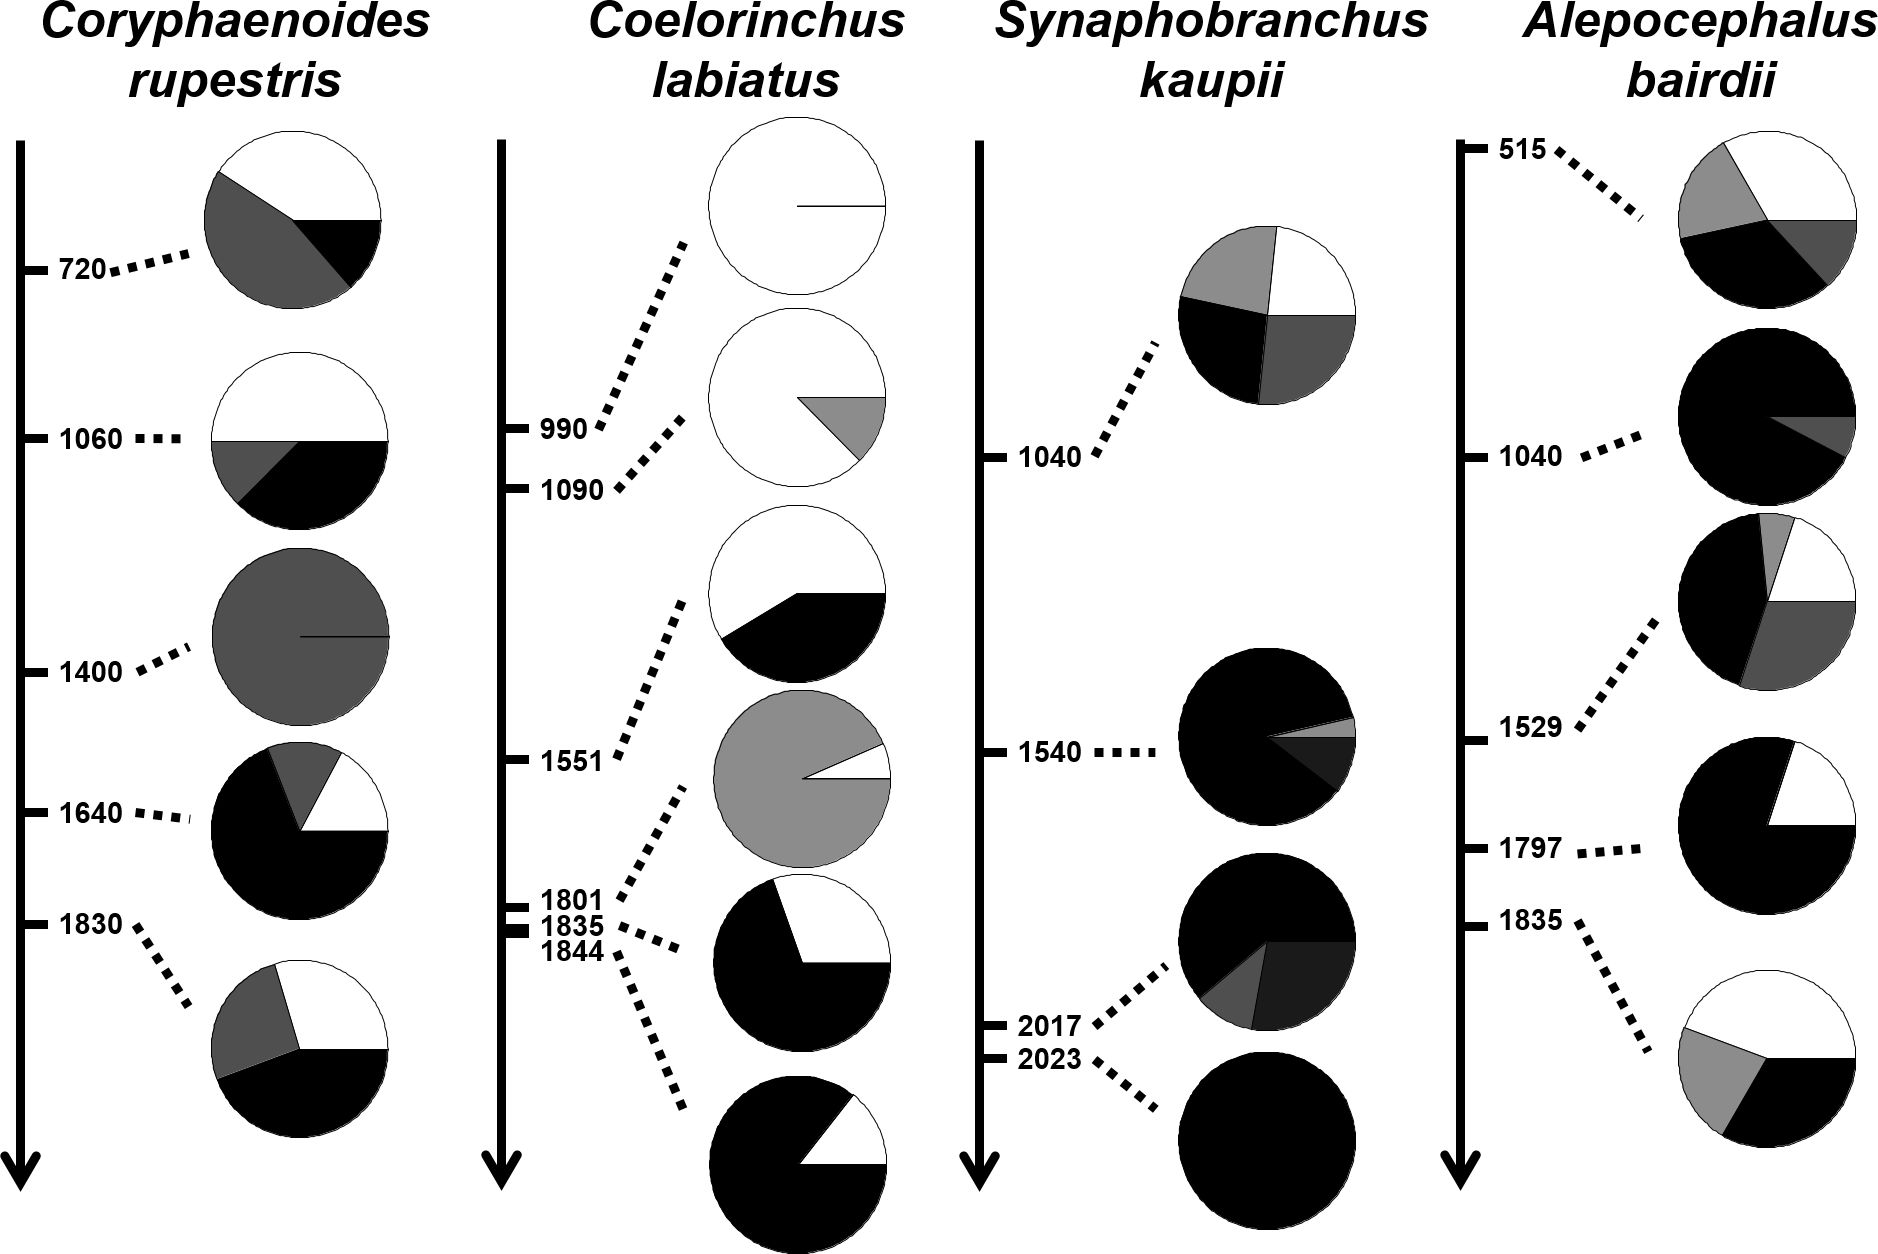
Figure 4. Cluster composition for each species and sampling depth (RNG, SSG, CTE and SMO from left to right). The shading represents different proportions of clusters at each depth (see text for further details).
4 Discussion
Three of the four deep water species studied showed significant phenotypic variation with depth, and all of these three had a similar, elongated, body form. SMO, which is a fusiform fish, did not show significant pairwise variation. All show correct random forest assignment to depth category at some level, though this is weakest in SMO. If the driver of phenotypic variation was differential plastic growth in different environments, it may be expected that all would show the trends associated with inter-specific variation with habitat depth (e.g. Neat and Campbell, 2013), and so all would vary in a similar way. Instead, there was considerable variation in the pattern seen for different species. Among the 15 morphometrics measured, only the meristic measures showed no significant variation. Inter-orbital width, body depth and gape length were only significant in one of the three species (Table 3). Of the measurements that showed significant variation in two or more species, some were strongly correlated for most species, such as gape size and length, liver weight and swim bladder weight. However, this was less so for RNG, which showed lower correlations among all measures than for the other species (Supplementary Tables S1–S4). SSG and CTE had the most characteristics significantly different between depth ranges. In the random forest analysis gape size or length appeared as one of the most important variables in all of the 4 species considered and orbit diameter important for two of them. Data were consistent with shallow and deep water morphotypes for all species except for SMO, where the interpretation would need to be more complicated (Figure 4).
In general, SSG and CTE shared similar patterns, while RNG showed the opposite pattern. The only exception was orbit diameter, with all three at least trending to a proportionally larger eye in deep water habitat. This was the opposite as seen when compared among some species (Warrant et al., 2003) but may be expected if individuals captured at depth spend time in shallower depths where there is some penetration of light, but not as much as for those captured in shallower depths. Larger eyes in deeper water has also been reported for Halobatrachus toadfishes (Collette et al., 2006). The RNG showed the pattern seen or predicted from interspecific comparisons for all other characteristics in Figure 3. The other two species showed the opposite pattern for each of these characters. Taken together these results indicate little consistency, suggesting that a common plastic response to similar environments is unlikely. It is possible that some pattern of diel or ontogenic vertical migration is disrupting the pattern of difference by depth, and perhaps differently in different species. However, we didn’t generate any particular bias based on when we collected samples (Supplementary Figure S1), and all samples were collected during the day (when predator species are expected to be at depth). Genetic data for RNG indicates a consistent segregation by depth, and for all species, the emergence of a pattern with depth suggests a real pattern, as vertical migration may be expected to disrupt rather than generate such a pattern. Furthermore, all samples measured were adults (minimizing any ontogenic effect). It may be that for species inhabiting depths below a certain threshold, there is segregation either side of that threshold. Here we took that potential boundary to be around 1500m, based on environmental characteristics (see methods), and consistent with results from the earlier genomic study (Gaither et al., 2018).
The other potential mechanisms to generate phenotypic variation are population differentiation and incipient speciation, or a balanced polymorphism. Population differentiation was evidently not the case for the RNG based on genome re-sequencing data. Gaither et al. (2018) used 44,650 neutral loci, sufficient to detect an FST of 0.0007 with a power of 0.86, and found no significance between sample sets taken at 750m compared to 1,800m. There were, however, fixed non-synonymous differences at loci especially associated with morphology and muscle function comparing 1,800m to all other sample depths. Together with indications that RNG mate together at ~1000m (Neat, 2017), the more likely explanation for phenotypic variation in this species would seem to be a balanced polymorphism. There are no genetic data available for SSG and CTE, but various aspects distinguish them from RNG. They both show more significant changes associated with depth than RNG and both include benthic crustaceans in their diet (Saldanha and Bauchot, 1986; Cohen et al., 1990). All three eat fish and some cephalopods, but RNG likely take more pelagic crustaceans (Cohen et al., 1990; Stowasser et al., 2009). The fact that SSG and CTE show the opposite of the trends seen in inter-specific comparisons, suggests that the driver may again be balanced polymorphism rather than population differentiation. Perhaps this is associated with different strategies at different depths such that in shallower habitats the ecotype requires a smaller mouth, greater elongation and more energy storage associated with the swim bladder and liver. Diet differences with depth have been reported for other related deep sea fish species, such as Coryphaenoides armatus showing different fatty acid profiles below and above 3000m, and for Antimora rostrata either side of 2000m (Stowasser et al., 2009).
With respect to the conservation and management of deep sea species, either population differentiation or a balanced polymorphism associated with habitat depth implies a need for separate management of allowable catches at different depths. The retention of evolutionary potential will likely depend on forms suited to different depths, given that there is significant phenotypic variation across the range. For a given species the proportional need for different ecotypes will likely depend on environmental changes over time, which may be affected by climate change and other processes. Under current management, there is a ban against trawling in over 800m in UK waters. Under regulation (EU) 2016/2336, the EU fleet will be banned from bottom fishing in all EU waters >400m depth, apart from within the 2009-2011 fishing footprint. Even within the 2009-2011 fishing footprint, EU vessels will be prohibited from bottom fishing in any areas that may be closed to protect VMEs (vulnerable marine ecosystems). However, protecting only deep water habitats would risk depletion of the shallow water phenotypes. We investigated four species, and find that they show phenotypic variation in different habitats, a finding that should be of concern to management. Future genetic work will likely reveal the true nature of these differences, and determine if there are genetic differences at different depths for SMO, even though no strong phenotypic differences were found. These results have broader implications for understanding the evolution of biodiversity in the sea, and the importance of variance with habitat depth.
Data availability statement
The original contributions presented in the study are included in the article/Supplementary Material. Further inquiries can be directed to the corresponding author.
Ethics statement
The animal study was approved by Ethics review at Marine Scotland Science. The study was conducted in accordance with the local legislation and institutional requirements.
Author contributions
NS: Investigation, Writing – original draft, Methodology. ZZ: Writing – review & editing, Methodology, Investigation. TR: Resources, Formal analysis, Writing – review & editing, Methodology, Investigation. FG: Resources, Writing – review & editing, Investigation. DS: Writing – review & editing, Resources, Investigation. AH: Writing – original draft, Supervision, Methodology, Formal analysis, Conceptualization.
Funding
The author(s) declare financial support was received for the research, authorship, and/or publication of this article. Natural Environment Research Council grant#: NE/K005359/1.
Acknowledgments
We thank Marine Directorate colleagues and the crew of MRV Scotia for their help in the collection of fish samples. We thank the technical support staff in Durham for help with access to facilities.
Conflict of interest
The authors declare that the research was conducted in the absence of any commercial or financial relationships that could be construed as a potential conflict of interest.
Publisher’s note
All claims expressed in this article are solely those of the authors and do not necessarily represent those of their affiliated organizations, or those of the publisher, the editors and the reviewers. Any product that may be evaluated in this article, or claim that may be made by its manufacturer, is not guaranteed or endorsed by the publisher.
Supplementary material
The Supplementary Material for this article can be found online at: https://www.frontiersin.org/articles/10.3389/fmars.2024.1437952/full#supplementary-material
References
Bandara K., Varpe Ø., Wijewardene L., Tverberg V., Ketil Eiane K. (2021). Two hundred years of zooplankton vertical migration research. Biol. Rev. 96, 1547–1589. doi: 10.1111/brv.12715
Bergstad O. A., Hunter R. H., Cousins N. J., Bailey D. M., Jørgensen T. (2021). Notes on age determination, size and age structure, longevity and growth of co-occurring macrourid fishes. J. Fish Biol. 99, 1032–1043. doi: 10.1111/jfb.14801
Bergstad O. A., Wik A. D., Hidre O. (2003). Predator-prey relationships and food sources of the Skagerrak deep-water fish assemblage. J. Northwest Atl. Fish. Sci. 31, 165–180.
Coffey D. M., Royer M. A., Meyer C. G., Holland K. N. (2020). Diel patterns in swimming behavior of a vertically migrating deepwater shark, the bluntnose sixgill (Hexanchus griseus). PloS One 15, e0228253. doi: 10.1371/journal.pone.0228253
Cohen D. M., Inada T., Iwamoto T., Scialabba N. (1990). FAO species catalogue. Vol. 10. Gadiform fishes of the world (Order Gadiformes). An annotated and illustrated catalogue of cods, hakes, grenadiers and other gadiform fishes known to date. FAO Fish. Synop. 125.
Collette B. B., Greenfield D. W., Costa J. L. (2006). Are there one or two species of Halobatrachus toadfishes (Teleostei: Batrachoidiformes)in the eastern Atlantic? Proc. California Acad. Sci. 57, 937–943.
Collins M. A., Bailey D. M., Ruxton G. D., Priede I. G. (2005). Trends in body size across an environmental gradient: a differential response in scavenging and non-scavenging demersal deep-sea fish. Proc. R. Soc. B: Biol. Sci. 272, 2051–2057. doi: 10.1098/rspb.2005.3189
Costa J. L., De Almeida P. R., Costa M. J. (2003). A morphometric and meristic investigation of Lusitanian toadfish Halobatrachus didactylus (Bloch and Schneider, 1801): evidence of population fragmentation on Portuguese coast. Sci. Mar. 67, 219–231.
Des Roches S., Post D. M., Turley N. E., Bailey J. K., Hendry A. P., Kinnison M. T., et al. (2018). The ecological importance of intraspecific variation. Nat. Ecol. Evol. 2, 57–64. doi: 10.1038/s41559-017-0402-5
Dominey W. J. (1980). Female mimicry in male bluegill sunfish—a genetic polymorphism? Nature 284, 546–548. doi: 10.1038/284546a0
Dormann C. F., Elith J., Bacher S., Buchmann C., Carl G., Carré G., et al. (2013). Collinearity: A review of methods to deal with it and a simulation study evaluating their performance. Ecography 36, 27–46. doi: 10.1111/j.1600-0587.2012.07348.x
Drazen J. C. (2002). A seasonal analysis of the nutritional condition of deep-sea macrourid fishes in the north-east Pacific. J. Fish Biol. 60, 1280–1295. doi: 10.1111/j.1095-8649.2002.tb01720.x
Drazen J. C., Sutton T. T. (2017). Dining in the deep: the feeding ecology of deep-sea fishes. Annu. Rev. Mar. Sci. 9, 337–366. doi: 10.1146/annurev-marine-010816-060543
Ebeling A. W., Cailliet G. M. (1974). “November. Mouth size and predator strategy of midwater fishes,” in Deep Sea Research and Oceanographic Abstracts, 21, 959–968.
Gaither M. R., Gkafas G. A., de Jong. M., Sarigol F., Neat F., Regnier T., et al. (2018). Genomics of habitat choice and adaptive evolution in the deep sea. Nat. Ecol. Evol. 2, 680–687. doi: 10.1038/s41559-018-0482-x
Gibb F. M., Régnier T., Donald K., Wright P. J. (2017). Connectivity in the early life history of sandeel inferred from otolith microchemistry. J. Sea Res. 119, 8–16. doi: 10.1016/j.seares.2016.10.003
Halkidi M., Batistakis Y., Vazirgiannis M. (2001). On clustering validation techniques. J. Intell. Inf. Syst. 17, 107–145. doi: 10.1023/A:1012801612483
Hanberry B. (2023). Practical guide for retaining correlated climate variables and unthinned samples in species distribution modelling, using random forests. Ecol. Inform. 79, 102406. doi: 10.1016/j.ecoinf.2023.102406
Kaariainen J. I., Bett B. J. (2006). Evidence for benthic body size miniaturization in the deep sea. J. Mar. Biol. Assoc. United Kingdom 86, 1339–1345. doi: 10.1017/S0025315406014366
Kaufman L., Rousseeuw P. J. (1990). Finding Groups in Data: An Introduction to Cluster Analysis (New York: John Wiley & Sons).
Likhachev E. R. (2003). Dependence of water viscosity on temperature and pressure. Tech. Phys. 48, 514–515. doi: 10.1134/1.1568496
Lin H.-Y., Shiao J.-C., Chen Y.-G., Iizuka Y. (2012). Ontogenetic vertical migration of grenadiers revealed by otolith microstructures and stable isotopic composition. Deep-Sea ResearchI 61, 123–130. doi: 10.1016/j.dsr.2011.12.005
Musick J. A., Cotton C. F. (2015). Bathymetric limits of chondrichthyans in the deep sea: a re-evaluation. Deep Sea Res. Part II: Top. Stud. Oceanogr. 115, 73–80. doi: 10.1016/j.dsr2.2014.10.010
Neat F. C. (2017). Aggregating behaviour, social interactions and possible spawning in the deep-water fish Coryphaenoides rupestris. J. fish Biol. 91, 975–980. doi: 10.1111/jfb.2017.91.issue-3
Neat F. C., Campbell N. (2013). Proliferation of elongate fishes in the deep sea. J. fish Biol. 83, 1576–1591. doi: 10.1111/jfb.2013.83.issue-6
O’Hea B., Johnston G., White J., Dransfeld L. (2013). Length-weight relations for seven grenadier species (Actinopterygii: Gadiformes: Macrouridae) to the west of Ireland. Acta Ichthyol. Piscatoria 43, 285–291. doi: 10.3750/AIP2013.43.4.04
Pelster B., Weber R. E. (1991). “The physiology of the Root effect,” in Advances in comparative and environmental physiology, vol. 51-77. (Springer, Berlin, Heidelberg).
Phleger C. F. (1991). “Biochemical aspects of buoyancy in fishes,” in Biochemistry and molecular biology of fishes, vol. 1. (New York: Elsevier), 209–247.
Phleger C. F. (1998). Buoyancy in marine fishes: direct and indirect role of lipids. Am. Zool. 38, 321–330. doi: 10.1093/icb/38.2.321
Rajkov J., Weber A. A.-T., Salzburger W., Egger B. (2018). Adaptive phenotypic plasticity contributes to divergence between lake and river populations of an East African cichlid fish. Ecol. Evol. 8, 7323–7333. doi: 10.1002/ece3.2018.8.issue-15
Ramirez-Llodra E. Z., Brandt A., Danovaro R., De Mol B., Escobar E., German C. R., et al. (2010). Deep, diverse and definitely different: unique attributes of the world’s largest ecosystem. Biogeosciences 7, 2851–2899. doi: 10.5194/bg-7-2851-2010
Régnier T., Augley J., Devalla S., Robinson C. D., Wright P. J., Neat F. C. (2017). Otolith chemistry reveals seamount fidelity in a deepwater fish. Deep-Sea Res. Part 1 121, 183–189. doi: 10.1016/j.dsr.2017.01.010
Rex M. A., Etter R. J., Morris J. S., Crouse J., McClain C. R., Johnson N. A., et al. (2006). Global bathymetric patterns of standing stock and body size in the deep-sea benthos. Mar. Ecol. Prog. Ser. 317, 1–8. doi: 10.3354/meps317001
Rumble J. R. (Ed.) (2023). Handbook of Chemistry & Physics. 104th edition (London: CRC Press, Taylor & Francis Group).
Saldanha L., Bauchot M.-L. (1986). “Synaphobranchidae (including Nettodaridae and Simenchelyidae),” in Fishes of the north-eastern Atlantic and the Mediterranean, vol. 2 . Eds. Whitehead P. J. P., Bauchot M.-L., Hureau J.-C., Nielsen J., Tortonese E. (UNESCO, Paris), 586–592.
Savvatimsky P. I. (1985). On correlation between total length and preanal length of roundnose grenadier in the north Atlantic. NAFO Sci. Council Stud. 8, 61–65.
Scholander P. F. (1954). Secretion of gases against high pressures in the swimbladder of deep sea fishes. II. The rete mirabile. Biol. Bull. 107, 260–277. doi: 10.2307/1538612
Shi J., Horvath S. (2006). Unsupervised learning with random forest predictors. J. Comput. Graph. Stat 15, 118–138. doi: 10.1198/106186006X94072
Smith K. L. (1978). Metabolism of the abyssopelagic rattail Coryphaenoides armatus measured in situ. Nature 274, 362. doi: 10.1038/274362a0
Stefanoudis P. V., Rivers M., Ford H., Yashayaev I. M., Rogers A. D., Woodall L. C. (2019). Changes in zooplankton communities from epipelagic to lower mesopelagic waters. Mar. Environ. Res. 146, 1–11. doi: 10.1016/j.marenvres.2019.02.014
Stenseng Høie J. (2017). Comparative feeding ecology of roundnose grenadier (Coryphaenoides rupestris) in Norwegian fjords. Department of Biology University of Bergen, Bergen, Norway.
Stowasser G., McAllen R., Pierce G. J., Collins M. A., Moffat C. F., Priede I. G., et al. (2009). Trophic position of deep-sea fish - Assessment through fatty acid and stable isotope analyses. Deep-Sea Res. I 56, 812–826. doi: 10.1016/j.dsr.2008.12.016
Sutton T. T. (2013). Vertical ecology of the pelagic ocean: classical patterns and new perspectives. J. Fish Biol. 83, 1508–1527. doi: 10.1111/jfb.2013.83.issue-6
Talley L. D., Pickard G. L., Emery W. J., Swift J. H. (2011). Descriptive Physical Oceanography; and Introduction (Amsterdam: Elsievier).
Thiel H. (1975). The size structure of the deep-sea benthos. Intern. Rev. der gesamten Hydrobiol. 60, 575–606. doi: 10.1017/CBO9781139163637.012
Tibshirani R., Walther G., Hastie T. (2001). Estimating the number of clusters in a data set via the gap statistic. J. R. Stat. Soc. Ser. B 63, 411–423. doi: 10.1111/1467-9868.00293
Tremblay N., Hünerlage K., Werner T. (2020). Hypoxia tolerance of 10 euphausiid species in relation to vertical temperature and oxygen gradients. Front. Physiol. 11, 248. doi: 10.3389/fphys.2020.00248
Warrant E. (2000). The eyes of deep-sea fishes and the changing nature of visual scenes with depth. Philos. Trans. R. Soc. Lond. B. Biol. Sci. 355, 1155–1159.
Warrant E. J., Collin S. P., Locket N. A. (2003). “Eye design and vision in deep-sea fishes,” in Sensory processing in aquatic environments (New York, NY: Springer), 303–322.
Keywords: morphology, habitat depth, intraspecific variation, deep-sea, adaptation
Citation: Steeds N, Zulqurnain Z, Regnier T, Gibb F, Stirling D and Hoelzel AR (2024) Intraspecific phenotypic differentiation by habitat depth in deep demersal fish species. Front. Mar. Sci. 11:1437952. doi: 10.3389/fmars.2024.1437952
Received: 24 May 2024; Accepted: 21 November 2024;
Published: 09 December 2024.
Edited by:
Meilin Wu, Chinese Academy of Sciences (CAS), ChinaReviewed by:
Michael Vecchione, National Oceanic and Atmospheric Administration (NOAA), United StatesJosé Lino Vieira De Oliveira Costa, University of Lisbon, Portugal
Copyright © 2024 Steeds, Zulqurnain, Regnier, Gibb, Stirling and Hoelzel. This is an open-access article distributed under the terms of the Creative Commons Attribution License (CC BY). The use, distribution or reproduction in other forums is permitted, provided the original author(s) and the copyright owner(s) are credited and that the original publication in this journal is cited, in accordance with accepted academic practice. No use, distribution or reproduction is permitted which does not comply with these terms.
*Correspondence: A. Rus Hoelzel, YS5yLmhvZWx6ZWxAZHVyLmFjLnVr
†These authors have contributed equally to this work
 Natasha Steeds1†
 Fiona Gibb
 David Stirling
 A. Rus Hoelzel