 Peng Li1
 Shenliang Chen
 Hongyu Ji
 Yinghai Ke
- 1College of Harbour and Coastal Engineering, Jimei University, Xiamen, China
- 2State Key Laboratory of Estuarine and Coastal Research, East China Normal University, Shanghai, China
- 3College of Computer and Information Engineering, Xiamen University of Technology, Xiamen, China
- 4College of Resource Environment and Tourism, Capital Normal University, Beijing, China
Suspended particulate matter (SPM) concentrations and associated estuarine high turbidity zones (HTZ) play crucial role in maintaining delta land building, coastal wetlands and marine ecosystems. In the background of new water-sediment delivery regime and major geomorphological transition in delta, the long-term change characteristics and driving mechanisms of SPM and HTZ in the Yellow River Estuary (YRE) are not clarified. In this study, it was found that the existing SPM models could not be adapted to the extremely turbid YRE, for which a novel SPM retrieval algorithm and HTZ extraction method were developed. Spatiotemporal dynamics of SPM and HTZ in YRE from 1984 to 2023 were investigated using 798 Landsat TM/ETM+/OLI imageries. Results indicated that our proposed SPM algorithm outperformed all the previous models of YRE (R2 > 0.95, relative percentage difference (RPD)< 22%), and high accuracies were achieved for both satellite-derived SPM (RPD = 33.01%) and HTZ (overall accuracy = 94%). Over the last four decades, both SPM concentration and HTZ distribution area in YRE had demonstrated an increasing and then decreasing trend, reaching a peak around 1996. HTZ experienced four morphological transformations involving the circular shape surrounding coast (1984–1993), the enlarged southeasterly ovoid shape (1994–2007), the circle-like shape (2007–2017) and the thin northeasterly ovoid shape (2018–2023). Riverine sediment load and strong-wind frequency controlled 67% of interannual SPM variability in the study area, and the former contributed more. Moreover, combination of weakening ocean dynamics and coastal erosion, coarsening of sediments, and coastal defense structures led to an exponential decline of SPM concentrations in northern subregion. High sediment discharge and rapid accretion of estuarine spit in 1984–1996 resulted in increased SPM concentrations in southern subregion and a quick expansion of HTZ into Laizhou Bay. With the geomorphological evolution of new and old estuaries, the high velocity zone and strong bottom shear stress zone were consequently adjusted, which explained the interannual variability of SPM and HTZ in the region. This study will contribute to understanding of the long-term evolutionary patterns of the coupled system consisting of runoff-tidal dynamics, sediment transport and geomorphological development in the estuary.
1 Introduction
Distribution and sedimentation of suspended particulate matter (SPM) play an important role in ecosystem functions, morphological dynamics and biogeochemical cycles in offshore environments (Allison and Pratt, 2017; Hou et al., 2024). SPM acts as a primary carrier of organic and inorganic matter to promote carbon, oxygen, and nutrient cycles, and as raw materials that continuously reconstruct estuarine geomorphology (Ji et al., 2018; Wang et al., 2022). It directly controls light penetration into the water column, weakens the effective photosynthetic radiation in seawater, limits primary production, and thus exerts pressure on marine ecosystems (Li et al., 2022; Wang et al., 2022). However, SPM and associated high turbidity zone (HTZ) in estuaries are characterized by high variability and susceptible to factors such as river inputs, tidal currents, wind and waves, ocean circulation and human engineering (Qiu et al., 2017; Luo et al., 2022; Hou et al., 2024). Therefore, it is of great significance to accurately understand the spatiotemporal dynamics of SPM/HTZ and their driving mechanism for marine environmental conservation and resource planning (Normandin et al., 2019; Dethier et al., 2022; Luo et al., 2022).
The Yellow River Estuary (YRE) is well known worldwide for its high turbidity, owing to the large amount of sediment discharged (Qiu et al., 2017; Li et al., 2019). More than 90% of the sediment in Yellow River comes from the erodible Loess Plateau in the middle reaches, and the sediment content in the flood season often exceeds 10 g/L (Wu et al., 2023; Qiu et al., 2024). Since the 1970s, the water and sediment delivery patterns of Yellow River have experienced dramatic variations due to the intensified human activities, including the water-soil conservation practices, the construction of large reservoirs, and the Water-Sediment Regulation Scheme (WSRS) (Ji et al., 2018; Xu et al., 2022). Under the influence of new water-sediment discharge regime, the geomorphological pattern of the Yellow River Delta (YRD, including both the subaerial and subaqueous deltas) has been in transition, thereby driving a shift in the hydrodynamic environment, which inevitably has implications for the spatiotemporal distributions of SPM and HTZ (Fu et al., 2021; Ji et al., 2024). However, existing researches usually neglected this important factor (Zhang et al., 2014; Qiu et al., 2017; Li et al., 2019; Yu et al., 2023). Thus, it is urgent to investigate the long-term variability of SPM and HTZ in YRE and its adjacent seas under the integrated impacts of riverine inputs, geomorphology of YRD and ocean dynamics.
Remote sensing technology has proven to be an effective approach for monitoring SPM variations on a large scale (Hou et al., 2024; Qiu et al., 2024). Ocean color satellite sensors (e.g. Sea-viewing Wide Field of View Sensor, Moderate Resolution Imaging Spectroradiometer, Medium Resolution Imaging Spectrometer and Geostationay Ocean Color Imager) have spectral bands dedicated to observing the bio-optical features of aquatic elements, but their low spatial resolution (>250 m) restricts their ability to investigate riverine or near-estuarine areas, where high SPM tends to occur (Luo et al., 2020; Li et al., 2021a). Landsat satellites, with high spatial resolution and providing a continuous record of Earth’s land surface since 1972, are capable of meeting the requirements for long-term investigations of estuarine SPM, and have been applied to several world’s great estuaries (Li et al., 2019; Dethier et al., 2022; Yu et al., 2023; Zhou et al., 2023; Sun et al., 2024). For the YRE, a number of studies have been carried out on the SPM variations based on satellite data (Zhang et al., 2014; Qiu et al., 2017; Zhan et al., 2020; Yu et al., 2023). Seasonal variability of SPM induced by the East Asian monsoon has been commonly accepted, whereas the distribution characteristics and driving mechanism of the long-term SPM are still controversial, especially in the two HTZs, which might be related to the accuracies of SPM retrieval models, the time scales of investigation, and the identification of influencing factors in their studies (Qiu et al., 2017; Li et al., 2019; Zhan et al., 2020).
Numerous SPM retrieval models for estuaries and offshore have been proposed in recent years, the highly turbid YRE being no exception (Yu et al., 2019; Zhou et al., 2023; Sun et al., 2024). The number of published SPM algorithms for YRE reaches more than ten, most of which are empirical models, and the major differences are in the applied satellite sensors and the bands and their combinations used in models (Fan et al., 2007; Bi et al., 2011; Zhang et al., 2014; Liu et al., 2018; Zhou et al., 2018; Yao et al., 2020). Although these algorithms have been reported with high accuracies in their articles, the robustness and transferability of these models are not yet known (Novoa et al., 2017; Yu et al., 2019). Therefore, there is still need to evaluate the performances of these algorithms in YRE using more sample datasets with larger range of SPM, especially in extremely turbid waters, as improving model accuracy is essential for the investigations of SPM and HTZ in estuaries with high turbidity and intense variability (Dethier et al., 2020).
The objectives of this research are to: (1) evaluate all existing SPM retrieval models for YRE based on our in-situ datasets and develop new SPM algorithms for Landsat TM/ETM+/OLI; (2) obtain the spatiotemporal dynamics of SPM and HTZ from 1984 to 2023 based on numerous Landsat satellite data; and (3) analyze the effects of riverine inputs, ocean dynamics and deltaic geomorphology on SPM and HTZ.
2 Materials and methods
2.1 Study area
Our study area is located in the YRE and its adjacent seas, covering the present river mouth, the south of Bohai Bay and the entire Laizhou Bay (Figure 1). It experiences a warm temperate continental monsoon climate, with an annual average temperature of 11.5–12.4°C and an annual average rainfall of 590.9 mm. Mild southerly winds (3–6 m/s) prevail in summer and strong northerly winds (>10 m/s) predominate in winter. The offshore tides in YRE are mainly irregular semi-diurnal, with an average tidal range of 0.6–0.8 m. The tidal current is parallel to coast, with the flood tide towards southeast and the ebb tide towards northwest (Ji et al., 2024). The seabed surface sediments in the study area mainly consist of silt and clay, with a median size of 5–8 μm (Wang et al., 2014). Over the past 70 years, three major channel shifts had happened, from Shenxiangou course to Diaokouhe course in 1964, then to Qingshuigou course in 1976, and finally to Qingba channel in 1996 (Figure 1C) (Fu et al., 2021). Sediment discharge from Yellow River is concentrated in summer, especially during WSRS which brings large amounts of additional sediment to the estuary by scouring Xiaolangdi Reservoir and downstream riverbed. In winter, high-energy waves and tidal currents lead to strong resuspension and seaward spreading of sediment (Li et al., 2019; Wu et al., 2022).
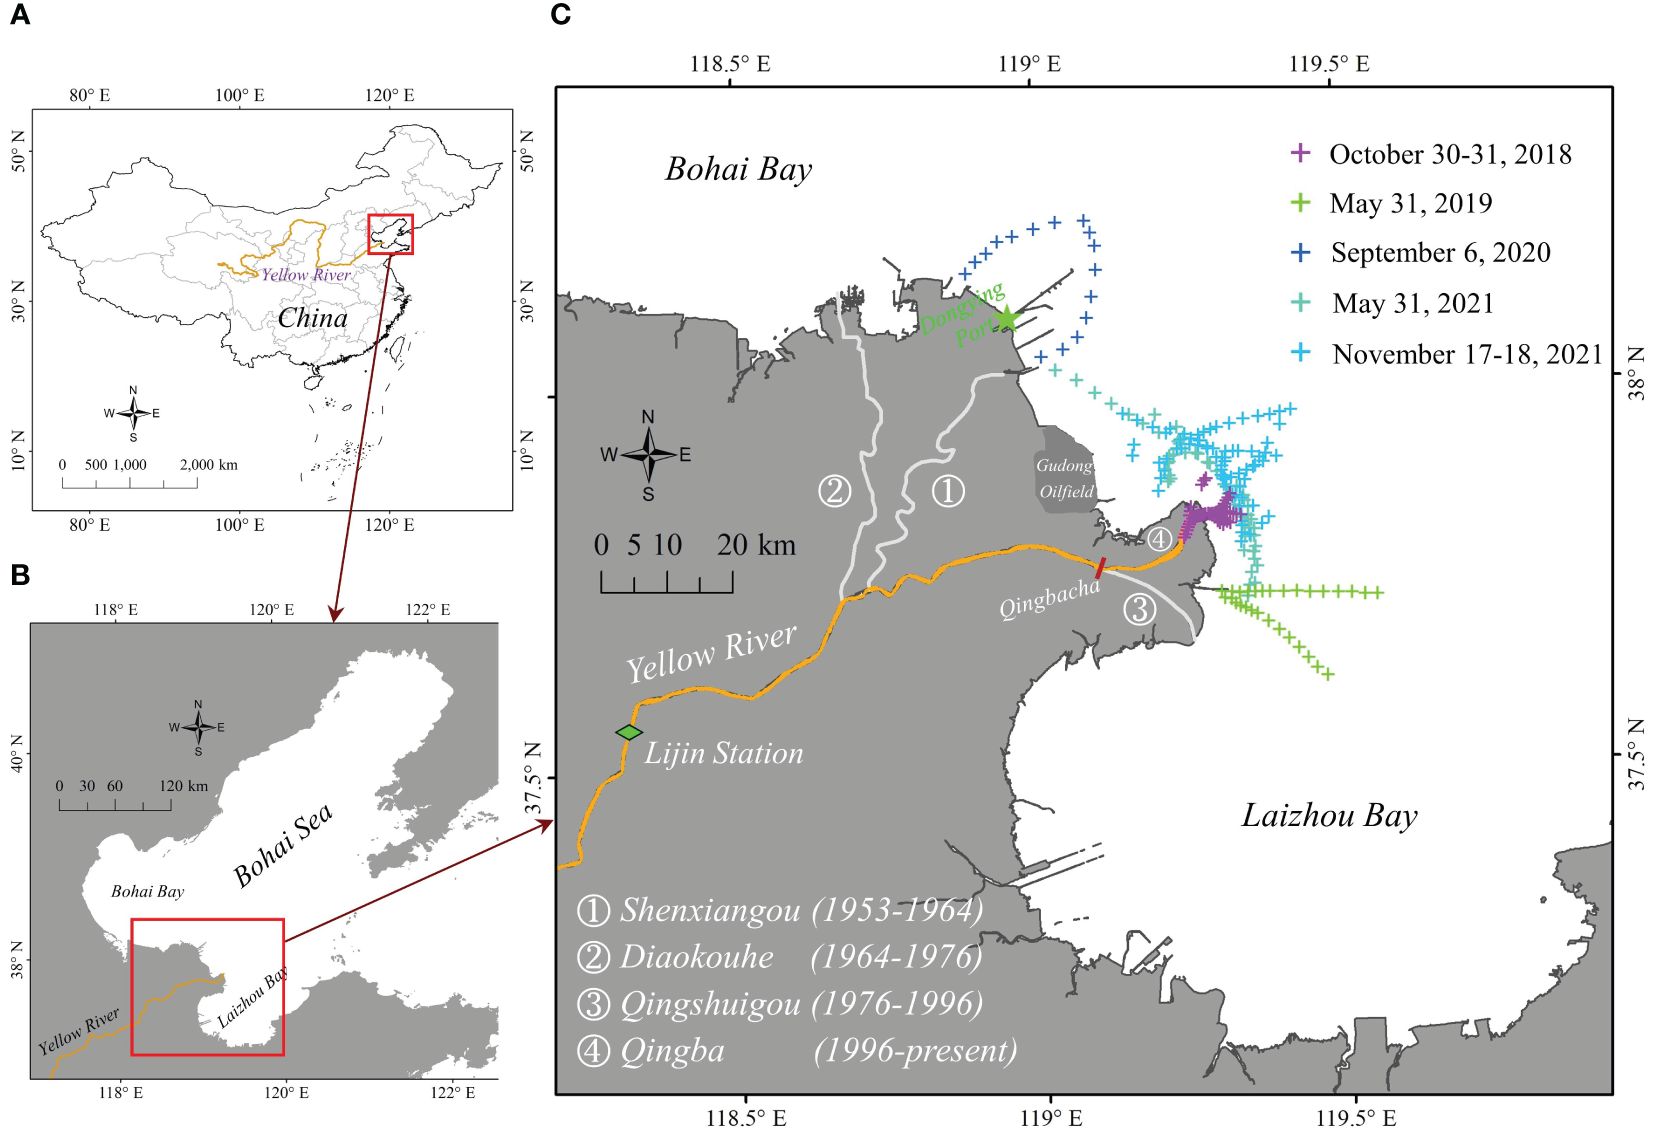
Figure 1 Geographic location of (A) the Yellow River Basin and (B) Bohai Sea, with the study area depicted by red box. (C) locations of the in-situ sampling stations.
2.2 Datasets
2.2.1 In situ datasets
Five research cruises were carried out during 2018–2021, collecting a total of 214 datasets of SPM concentrations as well as synchronized hyperspectral remote sensing reflectance (Rrs) (Figure 1 and Supplementary Figure S1 in the Supplementary Material). In order to collect SPM and Rrs data for high turbidity waters, we conducted intensive sampling in lowermost channel and river mouth (Figure 1C). The number of samples and the range of SPM concentrations (4.65 – 5728.5 mg/L) both exceeded that of existing studies. The measurements of SPM concentrations involved the processes of sample collection, laboratory filtration and weighing, and calculation (Li et al., 2019). Rrs was measured using above-surface spectrometry with the ASD FieldSpec 4 Hi-Res spectrometer and the Hyperspectral Surface Acquisition System (HyperSAS, Sea-Bird Scientific Inc) according to the NASA Ocean Color measurement protocol (Mobley, 1999). Detailed measurement procedures and calculation methods for Rrs were described in (Li et al., 2019) and (Li et al., 2024).
2.2.2 Remotely sensed data and preprocessing
A total of 798 satellite imageries with cloud cover<20% were used in this study, including 317 Landsat-5 TM, 311 Landsat-7 ETM+ and 170 Landsat-8/9 OLI (see Supplementary Figure S2 in the Supplementary Material). Level-1b Landsat TM/ETM+/OLI images from 1984 to 2023 with 30-m spatial resolution and 16-day revisit period were downloaded from the United States Geological Survey (USGS) Earth Explorer website (https://earthexplorer.usgs.gov/). Clouds and sea ice in the imageries were masked using the Quality Assessment (QA) bands of the Landsat datasets. All Landsat TM/ETM+/OLI images were atmospherically corrected using the dark spectrum fitting (DSF) algorithm (Vanhellemont, 2019) embedded in the ACOLITE software package (https://odnature.naturalsciences.be/remsem/acolite/). The excellent performance of this algorithm in the coastal waters of YRD has been validated in our previous research using in-situ measurements (Relative Percentage Difference< 11% for visible bands and< 32% for near-infrared band) (Li et al., 2019).
2.2.3 Additional data and processing
The annual water discharge and sediment load data of Yellow River from 1980 to 2022 were collected from the Lijin station, the closest hydrological gauging stations to the estuary (Figure 1C). The data were obtained from the China River Sediment Bulletin (http://www.mwr.gov.cn/sj/tjgb/zghlnsgb/). Hourly wind speeds with the spatial resolution of 0.25° × 0.25° were obtained from the fifth-generation Global Climate and Atmospheric Reanalysis Tool developed by the European Centre for Medium-Range Weather Forecasts (https://cds.climate.copernicus.eu/).
In addition, the bathymetric surveying data and sediment grain size data in the study area were collected. The bathymetric data were precisely measured in 1985, 1992, 2000, 2007 and 2015, by SDH-13D digital echo sounder in 71 transects involved more than 10000 observation sites. The two-period bathymetry shared a similar transection range with a spatial resolution of 250 m (Ji et al., 2018). Moreover, seabed surface sediment samples, evenly distributed in the study area, were collected in 1992, 2000, 2007 and 2015, and were analyzed using a laser particle sizer. Kriging spatial interpolation approach was used to obtain underwater DEM and distributions of median particle size (Supplementary Figures S3, S4).
2.3 SPM retrieval models
2.3.1 Development of SPM algorithm for YRE
Yu et al. (2019) developed an empirical model for global SPM retrieval with weighted band ratios based on numerous measured datasets in the estuarine and nearshore waters (denoted as Yu_2019), which has been evidenced to provide excellent potential applications in turbid estuaries (Yu et al., 2019; Wei et al., 2021; Yunus et al., 2022; Zhou et al., 2023). However, the algorithm involves too many spectral bands (blue band to near-infrared band) and parameters (up to six), meaning that a sufficient amount of in-situ data is needed to recalibrate this model for the target region. Moreover, the original Yu_2019 algorithm added the term to the model because of considering the effect of chlorophyll-a in clear waters. However, the chlorophyll-a concentration in the turbid YRE is poor (Zhang et al., 2017) and the present atmospheric correction algorithms are inadequate for the blue band, which will have an obvious influence on the accuracy of satellite inversion (Mélin et al., 2016; Li et al., 2019; Maciel and Pedocchi, 2022). Therefore, in this study we improved the algorithm by deleting the term in the original model and changing the original form to an exponential form. The final model is much more concise, containing only three bands and three parameters, and is as follows:
where , and are the remote sensing reflectance in the green, red and near-infrared (NIR) bands of Landsat TM/ETM+/OLI, respectively. , and denote empirical coefficients. and are the weighting factors for and , respectively. According to the spectral response functions of Landsat TM/ETM+/OLI, the corresponding Rrs for each band were simulated, and then , and were obtained based on the least-squares method using all 214 SPM concentrations and simulated Rrs datasets (Table 1).

Table 1 Empirical coefficients for the proposed algorithm calibrated by all in-situ datasets.
2.3.2 Other SPM algorithms in YRE
In this study, the performances of SPM retrieval algorithms developed for YRE and its adjacent sea over the last 20 years were evaluated using our measured SPM-Rrs datasets. As illustrated in Supplementary Table S1 (see the Supplementary Material), a total of 15 empirical models were selected. The existing SPM algorithms for YRE were all nonlinear forms, and the main differences lied in the combination of bands used, including the red band (Zhang et al., 2014), combinations of red and green bands (Cui et al., 2009), red-green band ratio (Fan et al., 2007; Bi et al., 2011; Qiu, 2013; Qiu et al., 2017), NIR-green band ratio (Yao et al., 2020), combinations of red-green band ratio and NIR band (Zhou et al., 2018; Li et al., 2021a), combinations of NIR-green band ratio and red band (Li et al., 2021b), and combinations of red-green band ratio and NIR-green band ratio (Liu et al., 2018).
2.3.3 Performance metrics
The 4-fold cross-validation method was adopted to evaluate the above 15 models and the model proposed in this study. The 214 SPM-Rrs measurements were divided into four groups, and combinations of any three were used to recalibrate the coefficients of these models, while the remaining one was used to validate the accuracy of the models. Considering that all selected SPM models were developed in this study area, we also assessed the differences in performances between the original models and the recalibrated models. The results were evaluated by comparing the model-estimated SPM with the in-situ SPM in terms of the correlation coefficient (R2), the root mean square error (RMSE) and relative percentage difference (RPD). RMSE and RPD are described as follows:
where and are the estimated value and measured value of the ith element, respectively, and N is the number of elements.
3 Results
3.1 Evaluation of SPM algorithms
Figure 2 illustrated the results of performance evaluation of existing SPM models for YRE based on our 214 measured SPM-Rrs datasets. It could be found that although these models were established with data from YRE and its adjacent seas, the performance of original models differed considerably and was mostly not directly adaptable to our dataset (Supplementary Table S2), which might be related to the errors of measurement process and instrumentation, the amount and validity of field data used for modelling, etc (Bi et al., 2011; Qiu, 2013; Zhang et al., 2014; Yu et al., 2019). The performances of recalibrated models also varied significantly depending on the model structure (Figure 2). The model that did not involve red band and the model that included only red band behaved poorly (RPD > 40%) (Figures 2G, H, L) (Zhang et al., 2014; Yao et al., 2020). The combination of red and green bands improved the performance of models, but underestimation still occurred at high SPM (Figures 2A–F, I) (Fan et al., 2007; Cui et al., 2009; Bi et al., 2011; Qiu, 2013; Qiu et al., 2017). Models incorporating green, red and NIR bands performed better (Zhou et al., 2018; Li et al., 2021a, 2021b), especially the dual-band-ratio models (Liu et al., 2018), which demonstrated the importance of NIR band for SPM inversion in high turbidity waters (Qiu et al., 2024).
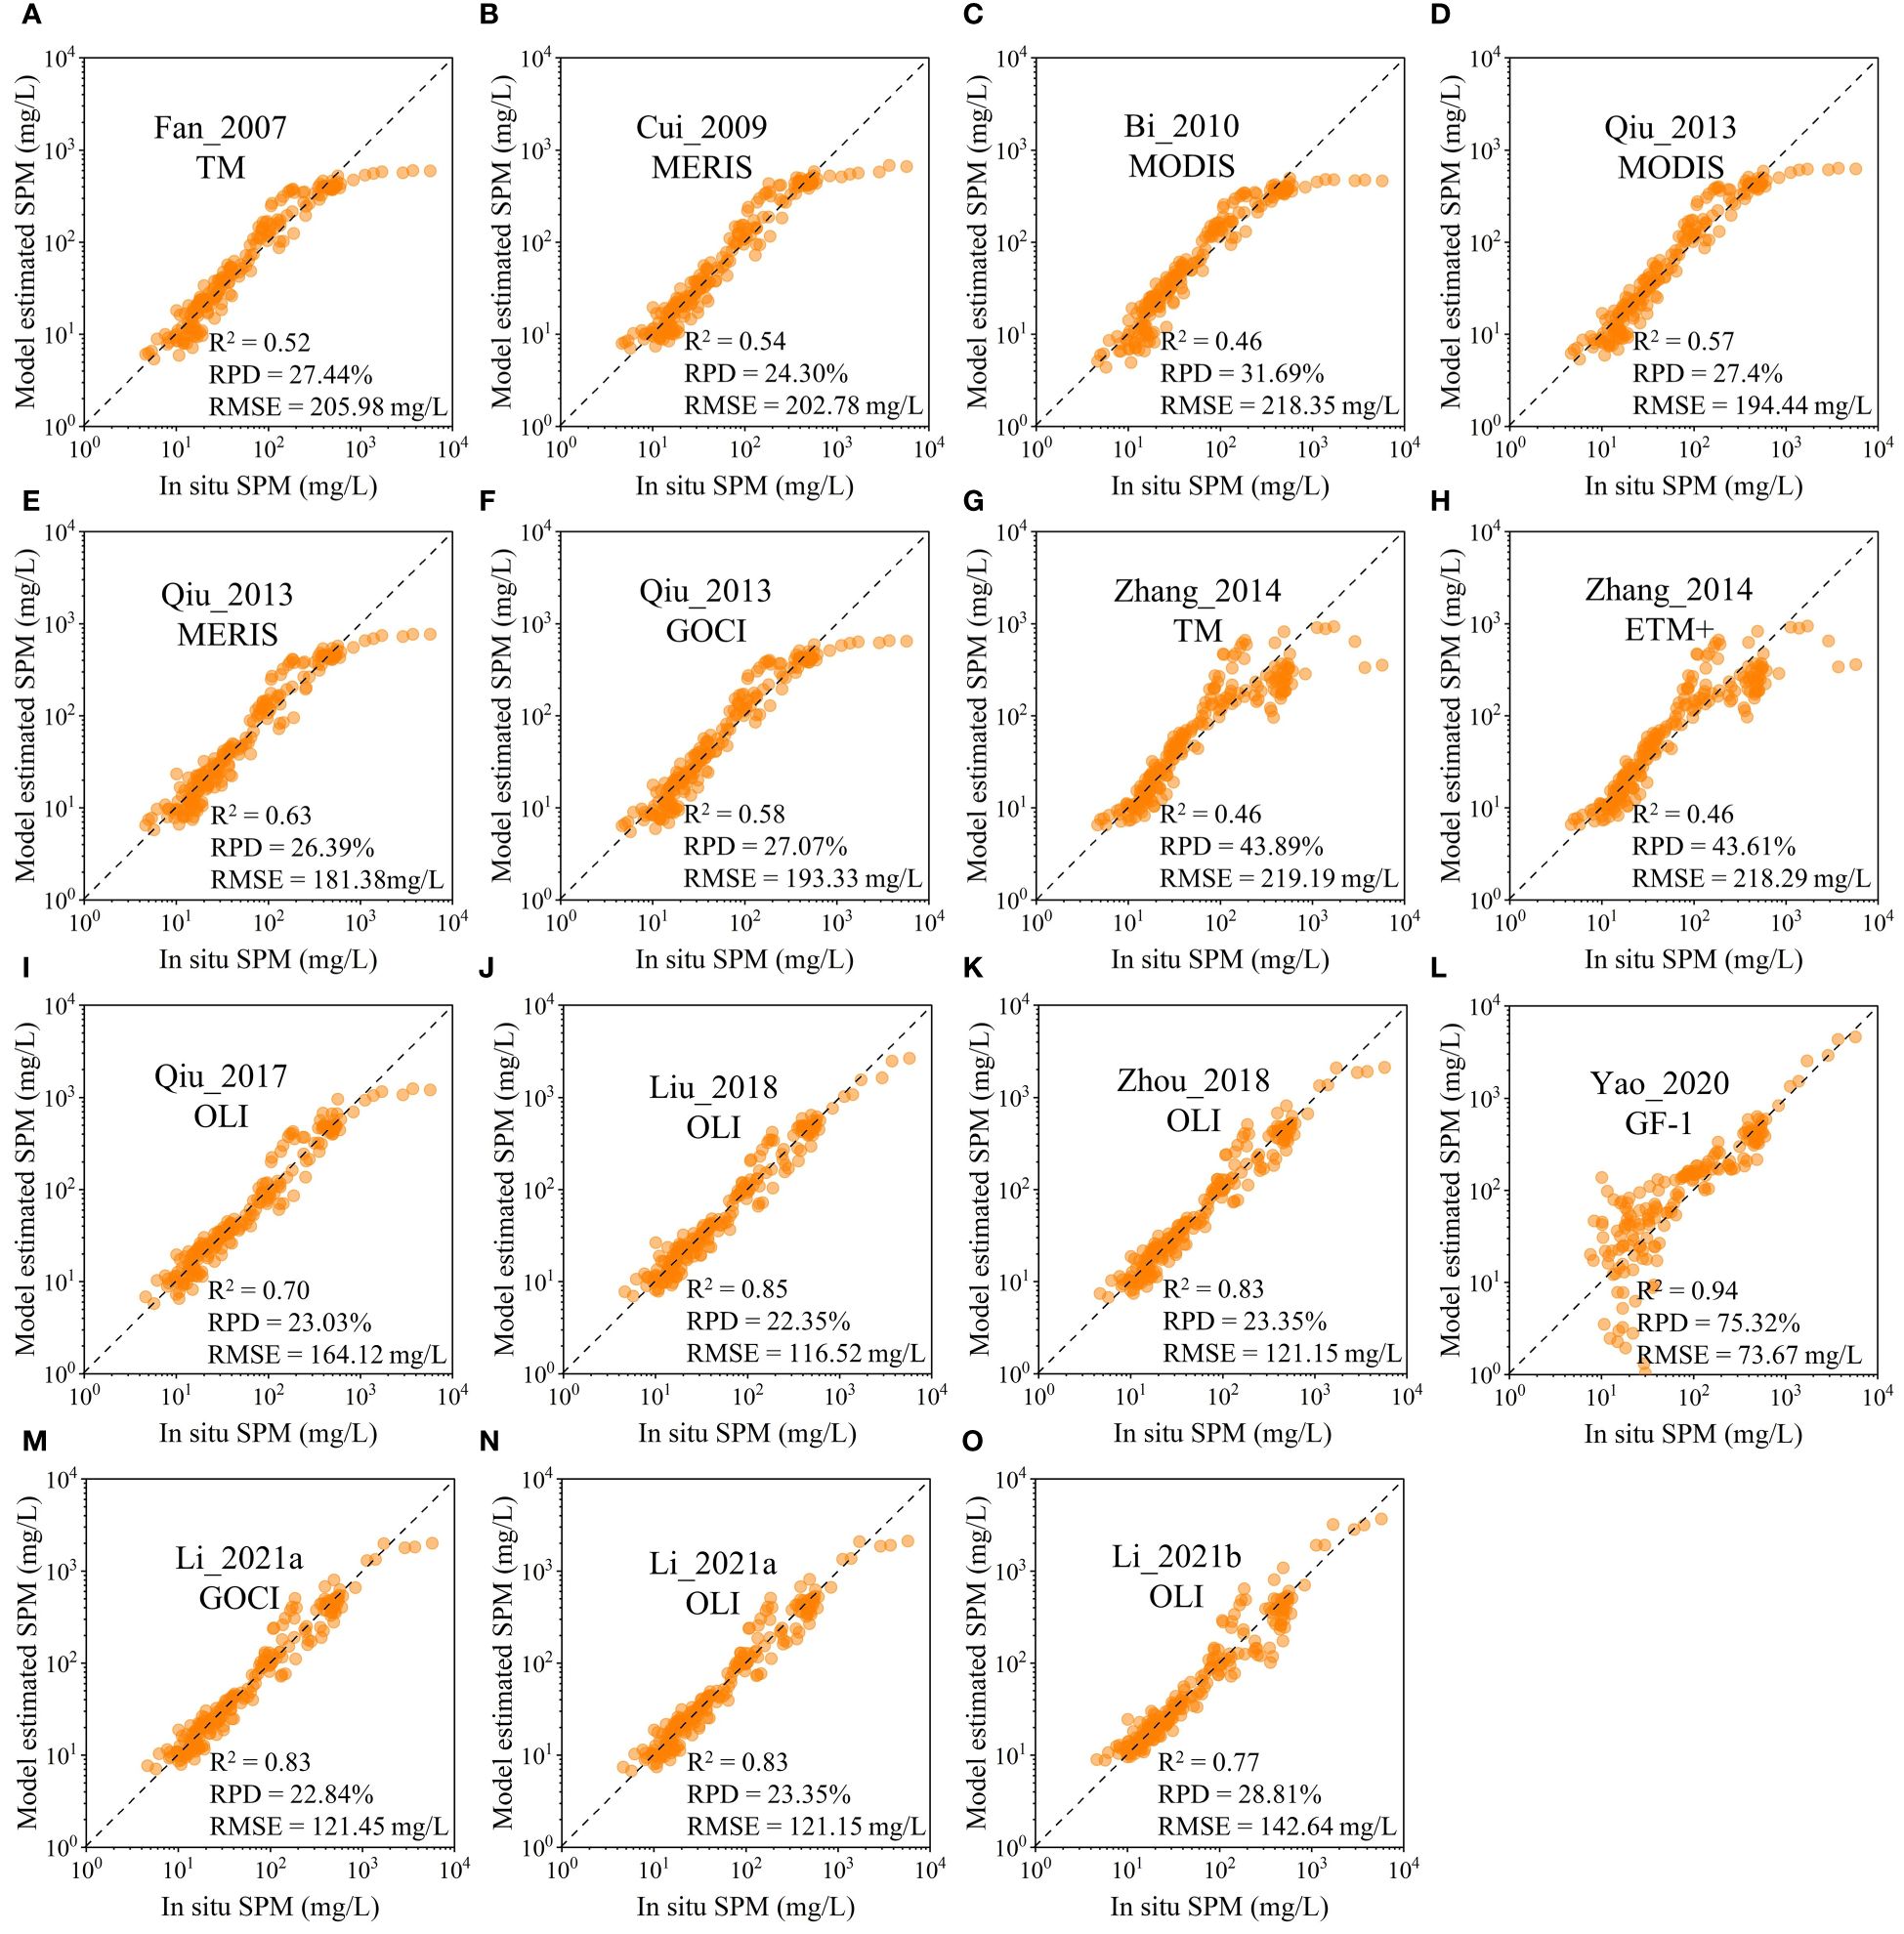
Figure 2 Validation and inter-comparison of the recalibrated (A) Fan_2007 model, (B) Cui_2009 model, (C) Bi_2010 model, (D-F) Qiu_2013 models, (G, H) Zhang_2014 models, (I) Qiu_2017 model, (J) Liu_2018 model, (K) Zhou_2018 model, (L) Yao_2020 model, (M, N) Li_2021a models, and (O) Li_2021b model.
The same approach was used to assess the SPM retrieval algorithm proposed in this study (Figure 3). The results indicated that SPM estimated by our algorithm agreed well with in-situ SPM, with R2 > 0.95, RMSE< 100 mg/L and RPD< 22% for Landsat TM/ETM+/OLI, which was significantly better than the existing SPM models. The model-estimated and in-situ SPM were distributed along 1:1 line and slopes and intercepts of linear regression equations were close to 1 and 0, indicating robustness of the model. Furthermore, the simplified SPM model of this study still achieved similar performance to the recalibrated Yu_2019 model (Supplementary Figure S5).
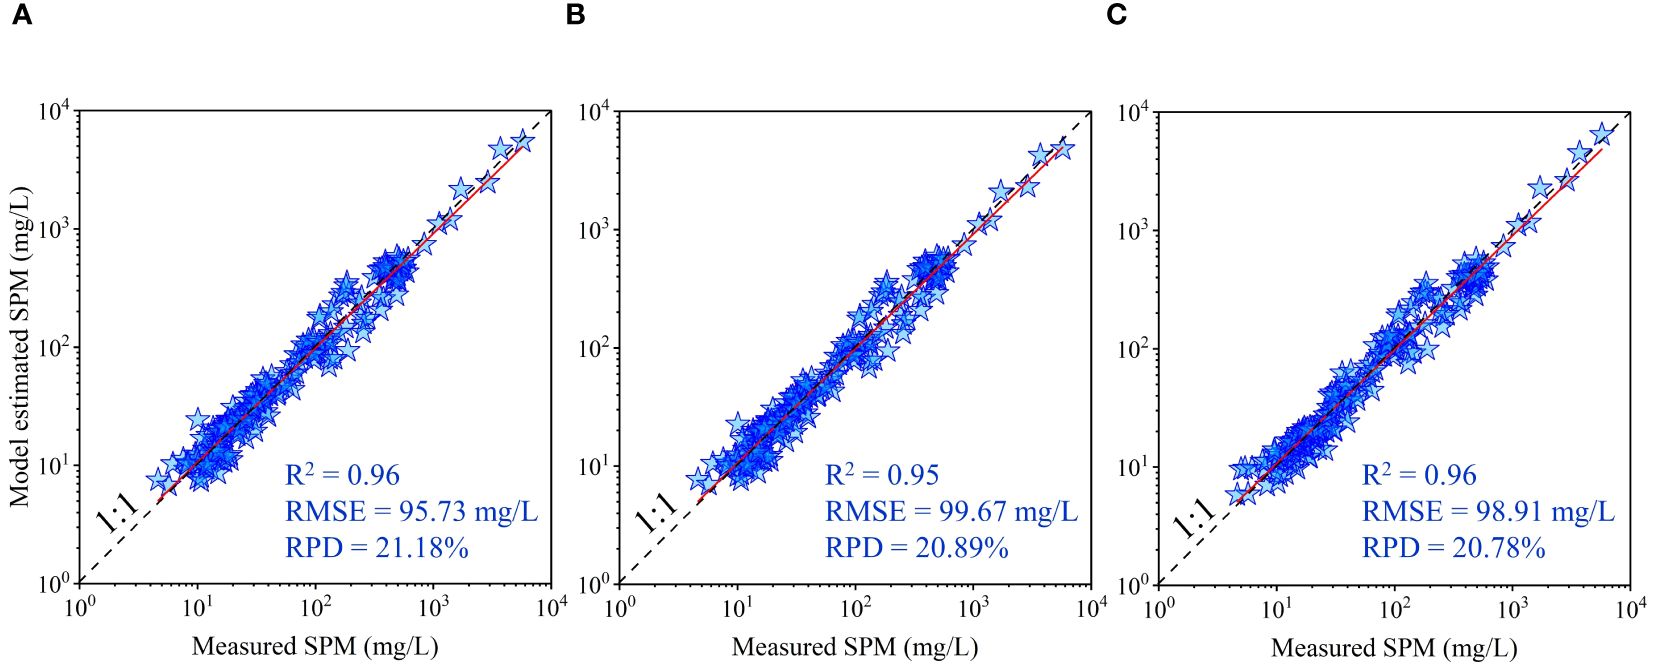
Figure 3 Scatterplots of SPM concentrations estimated from the proposed models versus the in-situ measurements for (A) Landsat TM, (B) Landsat ETM+ and (C) Landsat OLI.
3.2 Accuracy of satellite-derived SPM
The accuracy of satellite-derived SPM was verified with the simultaneous in-situ SPM measurements collected within ±1 h time window of satellite overpass. To minimize the effects of positioning and satellite spatial resolution, satellite-derived SPM concentrations were calculated by averaging over a 3×3 pixel box centered on the in-situ location. The results revealed that the Landsat-8 OLI-derived SPM concentrations were in excellent agreement with the in-situ measurements, with RMSE = 64.13 mg/L and RPD = 33.01% (Figure 4), demonstrating that our model was well tuned for the extremely turbid YRE. Furthermore, compared with the recalibrated Yu_2019 algorithm, our algorithm effectively improved the accuracy of satellite inversion due to fewer bands required and excluding the unstable blue band (Mélin et al., 2016; Maciel and Pedocchi, 2022). Note that the accuracies of Landsat-5 TM and Landsat-7 ETM+ were not evaluated in this study due to their failure to match sufficient measured data.
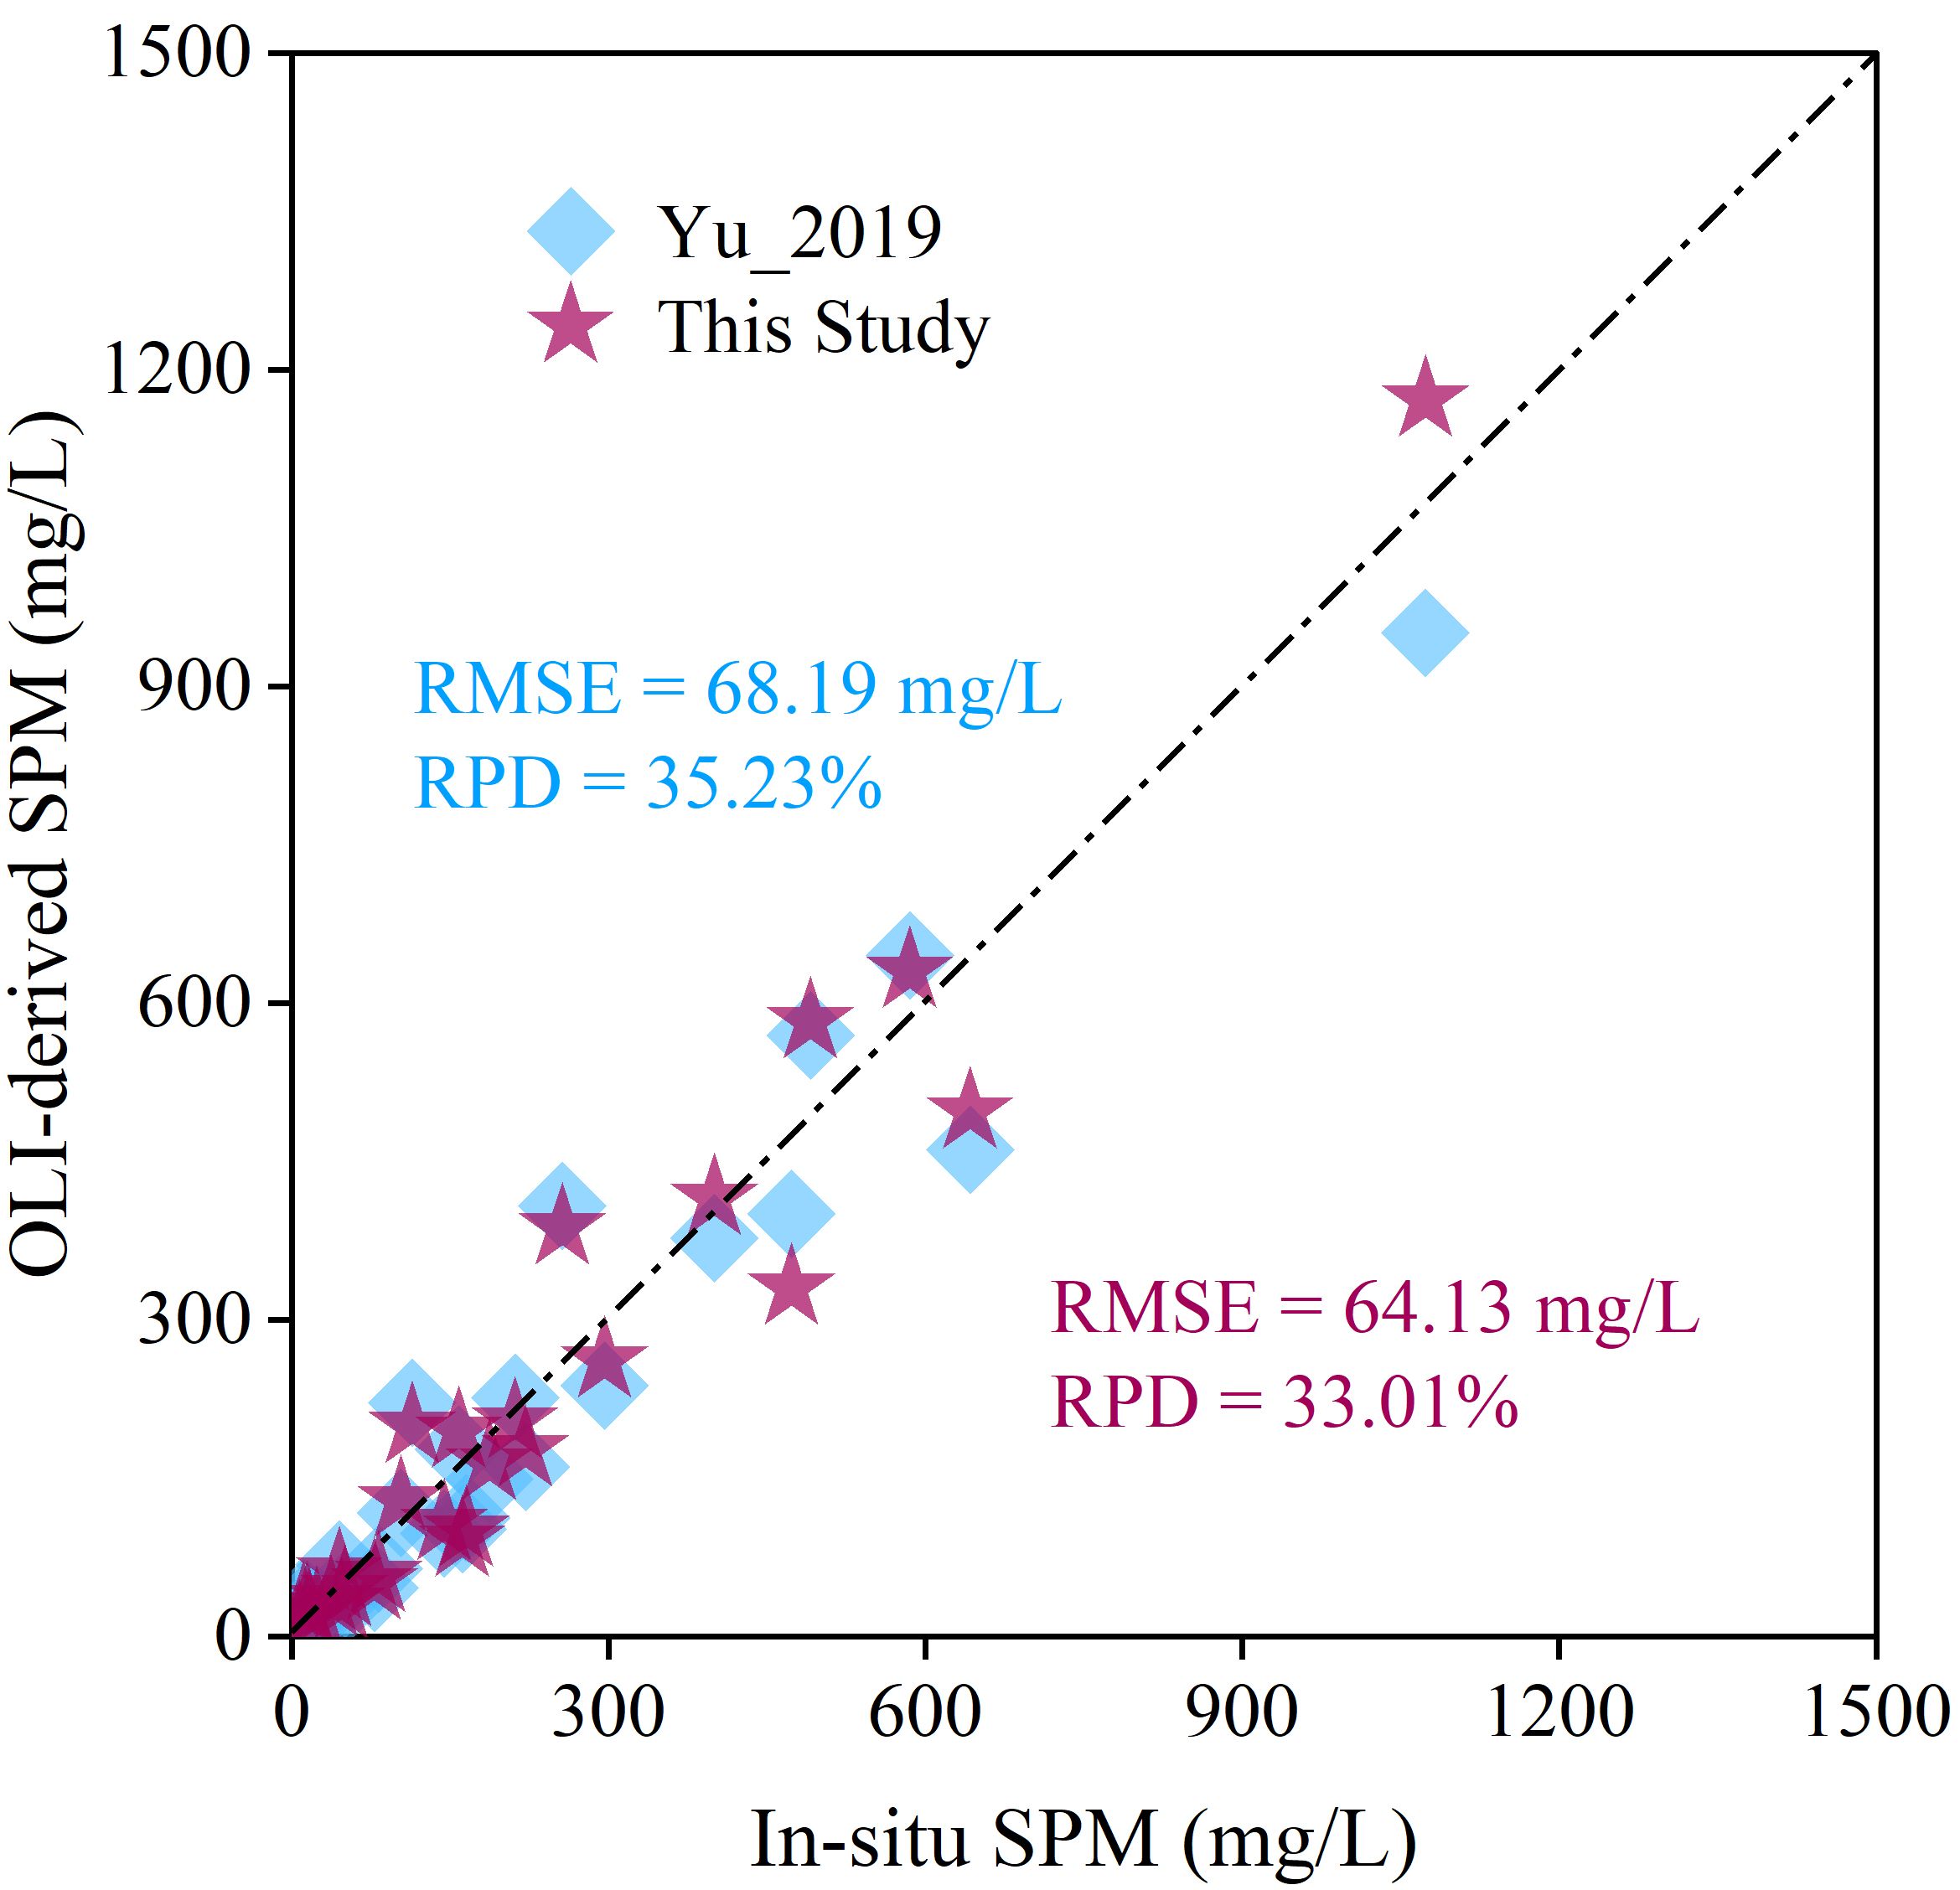
Figure 4 Scatterplots of Landsat OLI-derived SPM based on Yu_2019 model and our model versus in-situ SPM measurements.
The proposed SPM algorithm and several representative SPM algorithms above were applied to two typical areas involving the present estuary covered by Landsat-8 OLI on 3 October 2018 and the abandoned Qingshuigou estuary covered by Landsat-7 ETM+ on 18 March 2001 (Figure 5). It could be observed that our algorithm was able to capture the maximum range of SPM variations, and clearly demonstrated the characteristics of estuarine plume, the location of yellow-blue demarcation off river mouth (Li et al., 2023), and the turbidity maximum zone (TMZ) off Qingshuigou mouth (Figures 5a2, b2). Algorithms using a single red band or red-green band ratio significantly underestimated the SPM in the lowermost channel and estuarine high turbidity zones (Figures 5a3–a7, b3–b7), were unable to accurately capture the variability characteristic of estuarine SPM (Bi et al., 2011; Zhang et al., 2014). The model incorporating NIR band showed significant improvement for extremely high turbidity waters, but the single NIR band might produce large uncertainties in low turbidity waters (Figures 5a5, b5) (Zhou et al., 2018; Li J, et al., 2021). The dual-band-ratio algorithm could also characterize SPM variations, although it gave lower results than our algorithm in extremely turbid waters including river channel and TMZ (Figures 5C, D) (Liu et al., 2018).
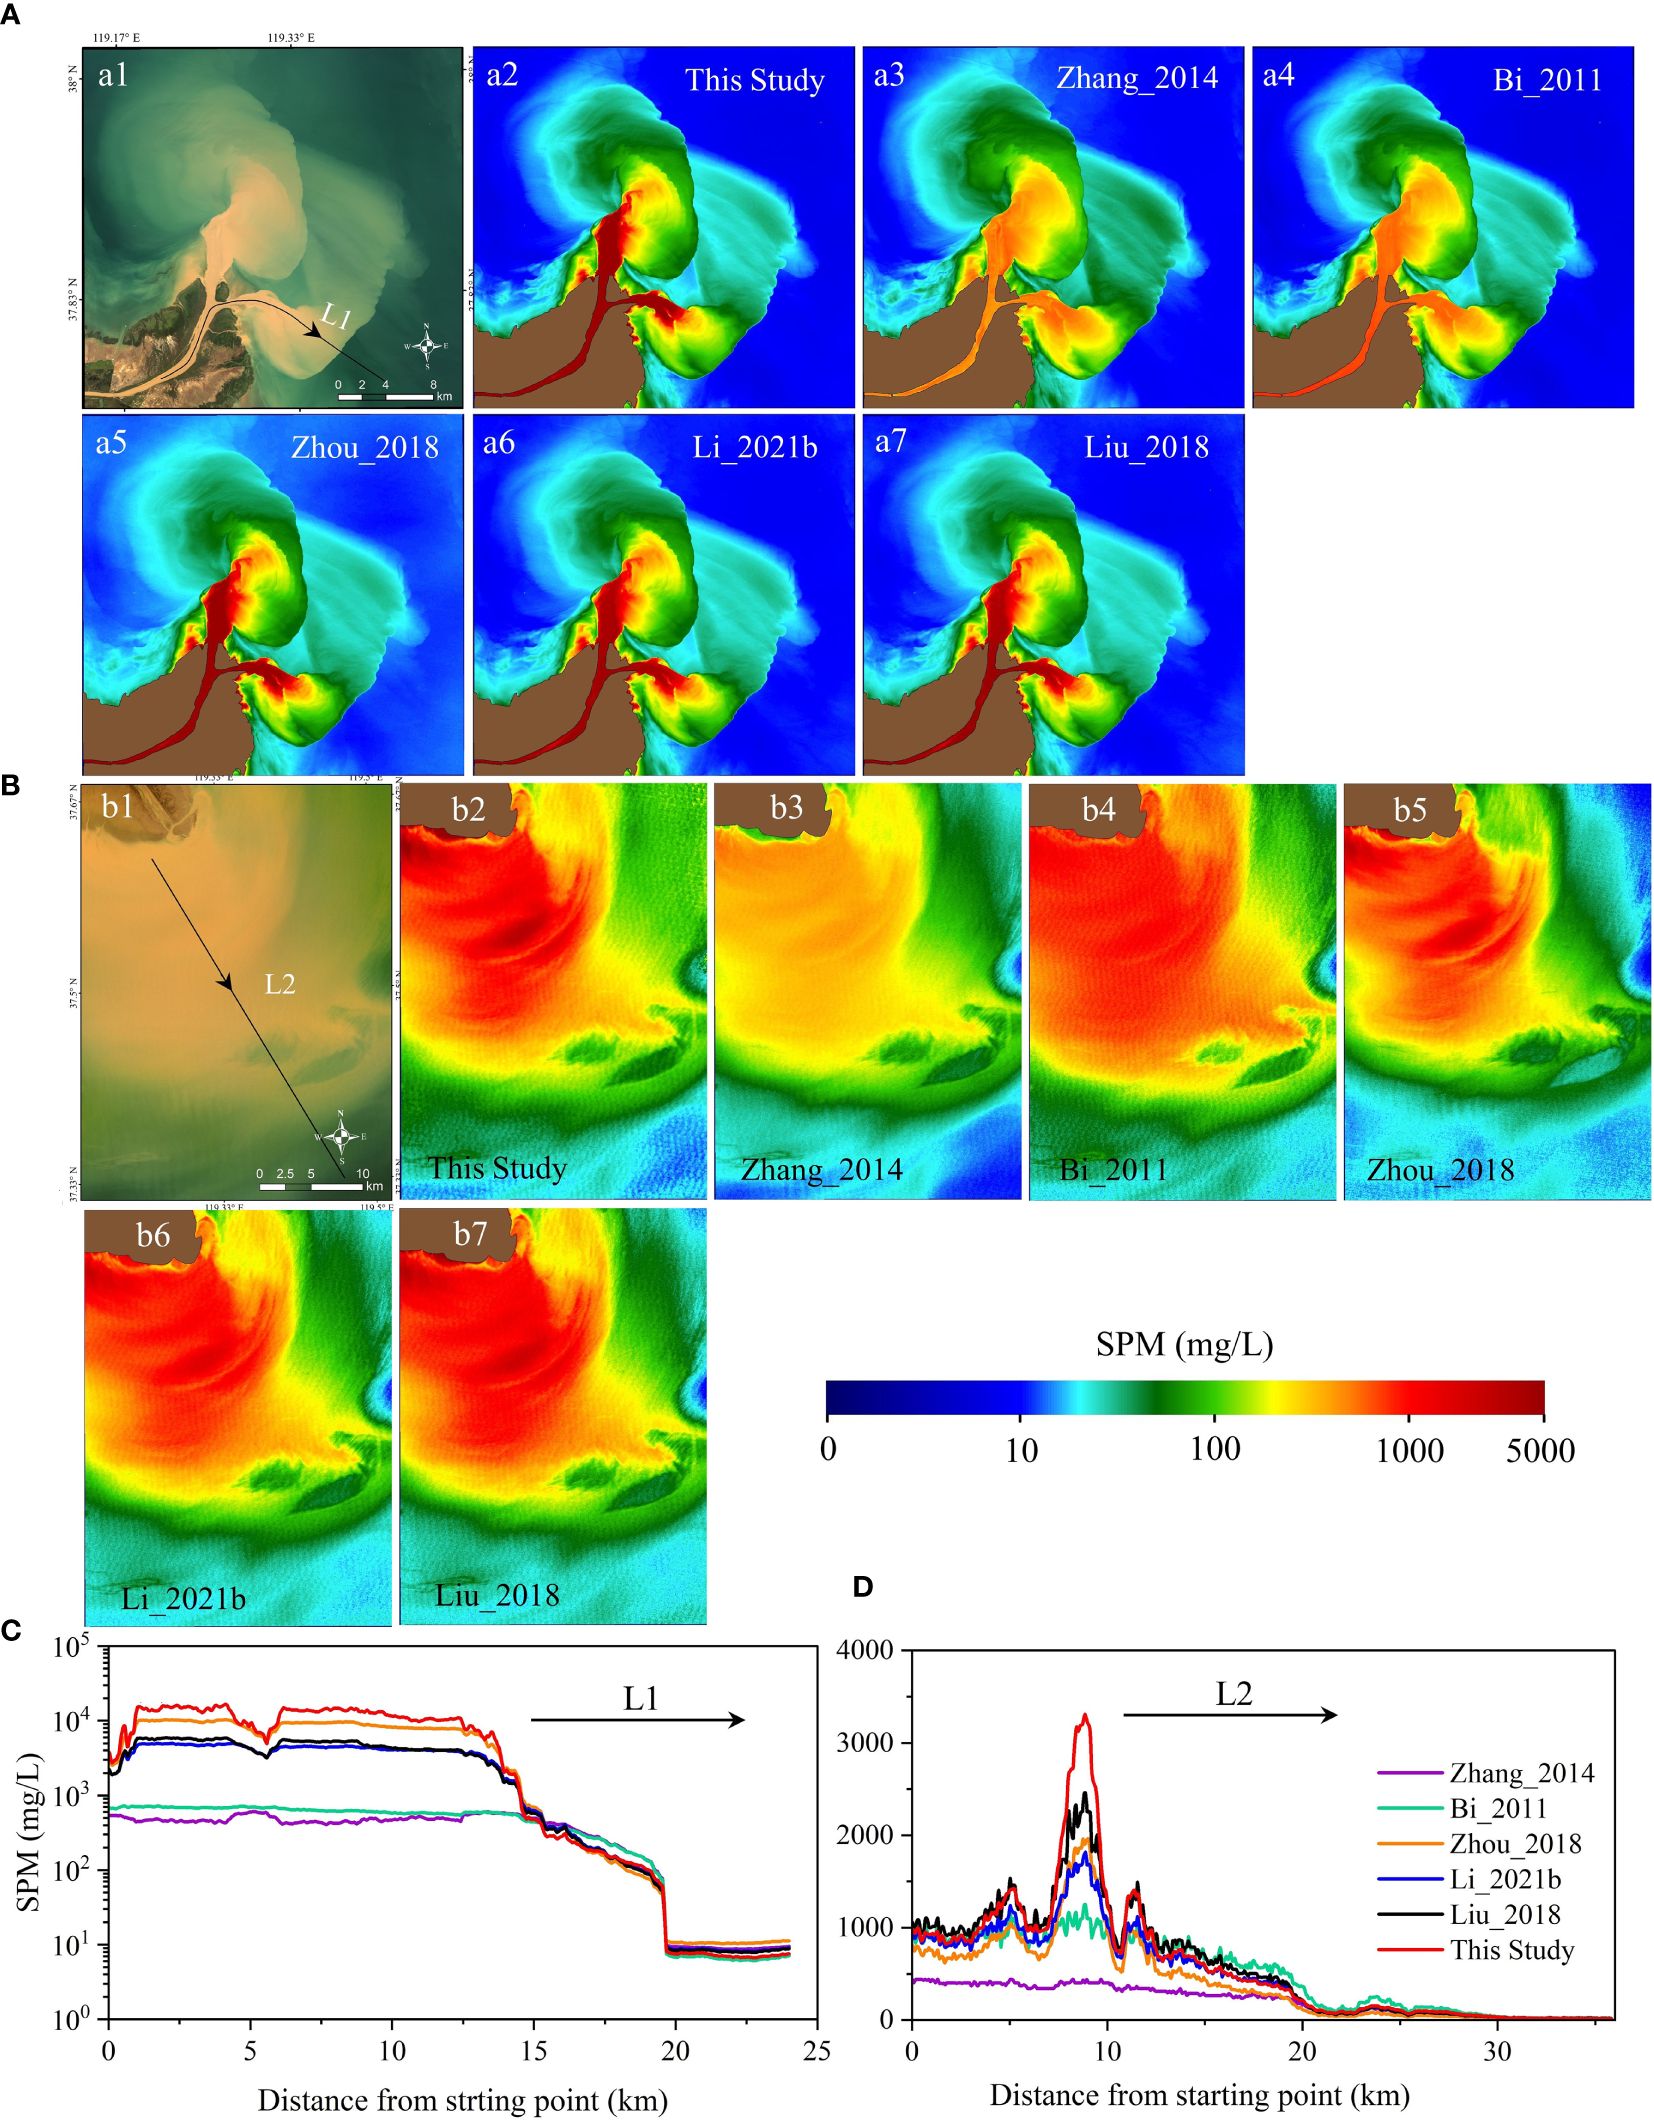
Figure 5 Inter-comparisons of satellite-derived SPM based on our algorithm and other typical algorithms. (A, B) are the quasi-true color imageries and retrieved SPM distributions of Landsat-8 OLI on 3 October 2018 and Landsat-7 ETM+ on 18 March 2001, respectively. a2-a7 and b2-b7 are SPM distributions retrieved from satellite data based on our algorithm, Zhang_2014, Bi_2011, Zhou_2018, Li_2021b, and Liu_2018 models, respectively. (C, D) indicate the variations in SPM concentration along L1 in Figure a1 and L2 in Figure b1, respectively.
3.3 Inter-annual changes of SPM
Although Landsat satellites have high spatial resolution and long operational periods, their low temporal resolution (16 days) may have an impact on the interannual trend of satellite-derived SPM. Therefore, in order to increase the credibility of results derived from satellite (Luo et al., 2022), an averaging every three years was used, and the time nodes of historical channel shifts (July 1996 and July 2017) and WSRS (2002–2015 and 2018–2023) were taken into account to finally obtain 14 sets of annual average SPM distributions in YRE (Figure 6). It could be observed that the SPM in YRE generally exhibits a distribution pattern of high nearshore and low offshore. There are two high SPM centres in the study area, one located in the coastal waters of northern YRD and the other in the Qingshuigou estuary (covering both the present mouth and the old abandoned mouth). The two high SPM centres are distant from each other and are clearly separated in the sea off Gudong Oilfield, so this boundary further divides the study area into northern subregion and southern subregion (Figure 6a1).
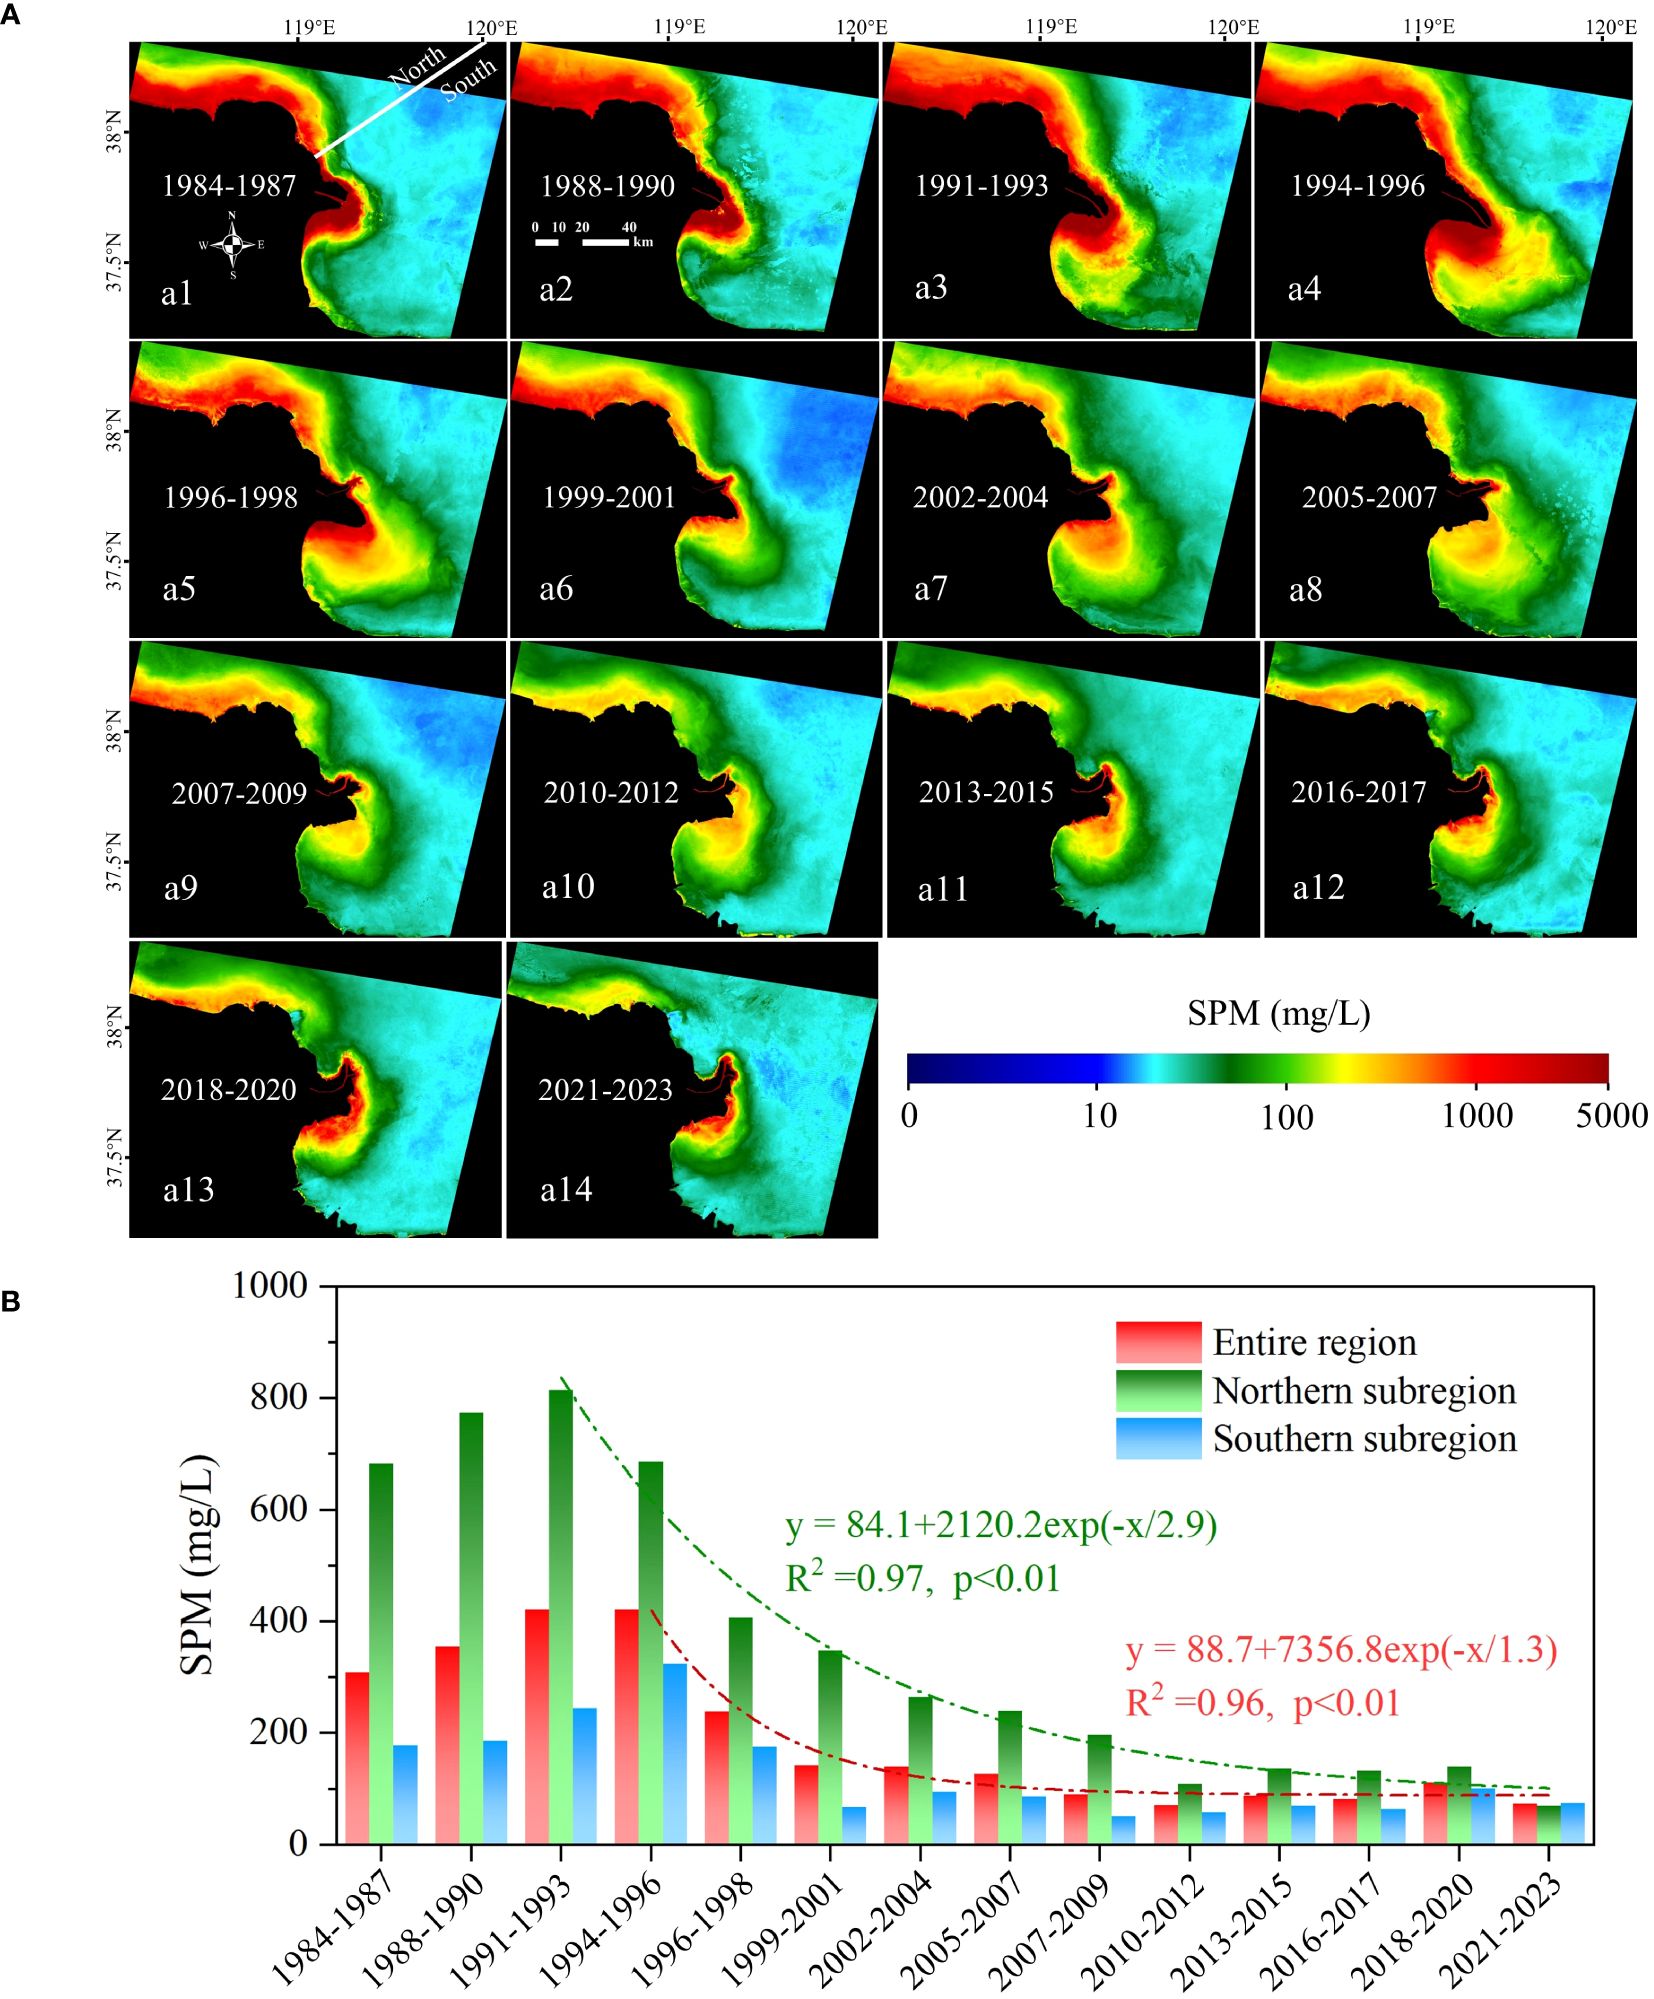
Figure 6 SPM variations in the study area from 1984 to 2023. (A) Distributions of annual average SPM; (B) Statistics of annual changes in SPM.
Generally, the annual average SPM in YRE has demonstrated a declining trend over the past 40 years, which could be divided into two main phases, with a slight increase from 1984 to 1996 and an exponential decrease after 1996 (Figure 6B). In the early period (1984–1996), SPM concentrations in the YRE were maintained at high levels with the mean exceeding 300 mg/L and the extremum exceeding 4000 mg/L, and the distribution area of extremely turbid waters (SPM > 200 mg/L) reached the largest in 1993–1996 (3478 km2), accounting for 32.3% of the study area (Supplementary Figure S6 in Supplementary Materials). After 1996, and also after the channel shifted to Qing 8, the mean SPM in YRE decreased rapidly, reaching a minimum in 2010–2012 (70.68 mg/L), which was less than one-fifth of the peak value. The average SPM in YRE had not changed significantly over the last 10 years, and the distribution area of extremely turbid waters did not exceed 10% of the study area. The high SPM waters in the northern subregion have gradually shrunk towards the shore in the last 40 years, while those in the southern region have changed dramatically due to shifts of the river mouth (Figure 6A). The mean SPM concentrations in the northern region were much higher than that in the southern waters, especially during the early period (1984–1996). The average SPM concentrations in the northern region reached a maximum in 1991–1993, when the distribution area of extremely turbid waters also peaked, and then showed a significant exponential decline (Figure 6B). In the early period, as the estuary continued to advance into Laizhou Bay, the mean SPM concentrations and the distribution area of extremely turbid waters in the southern subregion gradually increased, both reaching a maximum in 1994–1996 (Supplementary Figure S6). After a short period of rapid decline (1994–2001), SPM concentrations in the southern region have remained at relatively low levels (<100 mg/L) in the last 20 years.
3.4 Inter-annual changes of high turbidity zones
As illustrated in Figure 6, there are two high turbidity zones in the coastal waters off the YRD, respectively located in the southern subregion and northern subregion. Given that satellite imagery does not completely cover the northern high turbidity zone and that the high turbidity zone in this region has shown a single trend of gradual decrease over the last 40 years, this study focuses on the dramatically variable high-turbidity zone located in the southern region and close to the estuary. Threshold segmentation method based on SPM concentrations is a common approach to extract HTZ from satellite images (Abascal-Zorrilla et al., 2020; Teng et al., 2021). In this study, it was found that the boundary of HTZ could be accurately characterized when the SPM concentration was 44.6 mg/L (Supplementary Figure S7 in Supplementary Materials). Edge point pairs and confusion matrices were used to evaluate the accuracy of the HTZ extracted in this study (Jia et al., 2021). The results indicated that the thresholding method was able to accurately extract the HTZ in Landsat-5 TM/ETM+/OLI images with an overall accuracy of 94% and a kappa coefficient of 0.88 (Supplementary Table S3). Based on the above methods, the inter-annual variations in frequencies and distribution area of HTZ from 1984 to 2023 were obtained (Figure 7). It should be noted that the frequency distributions of HTZ were derived in this study by dividing the count of HTZ occurrences by the number of images, taking into account the differences in the amount of satellite imagery used in each period.
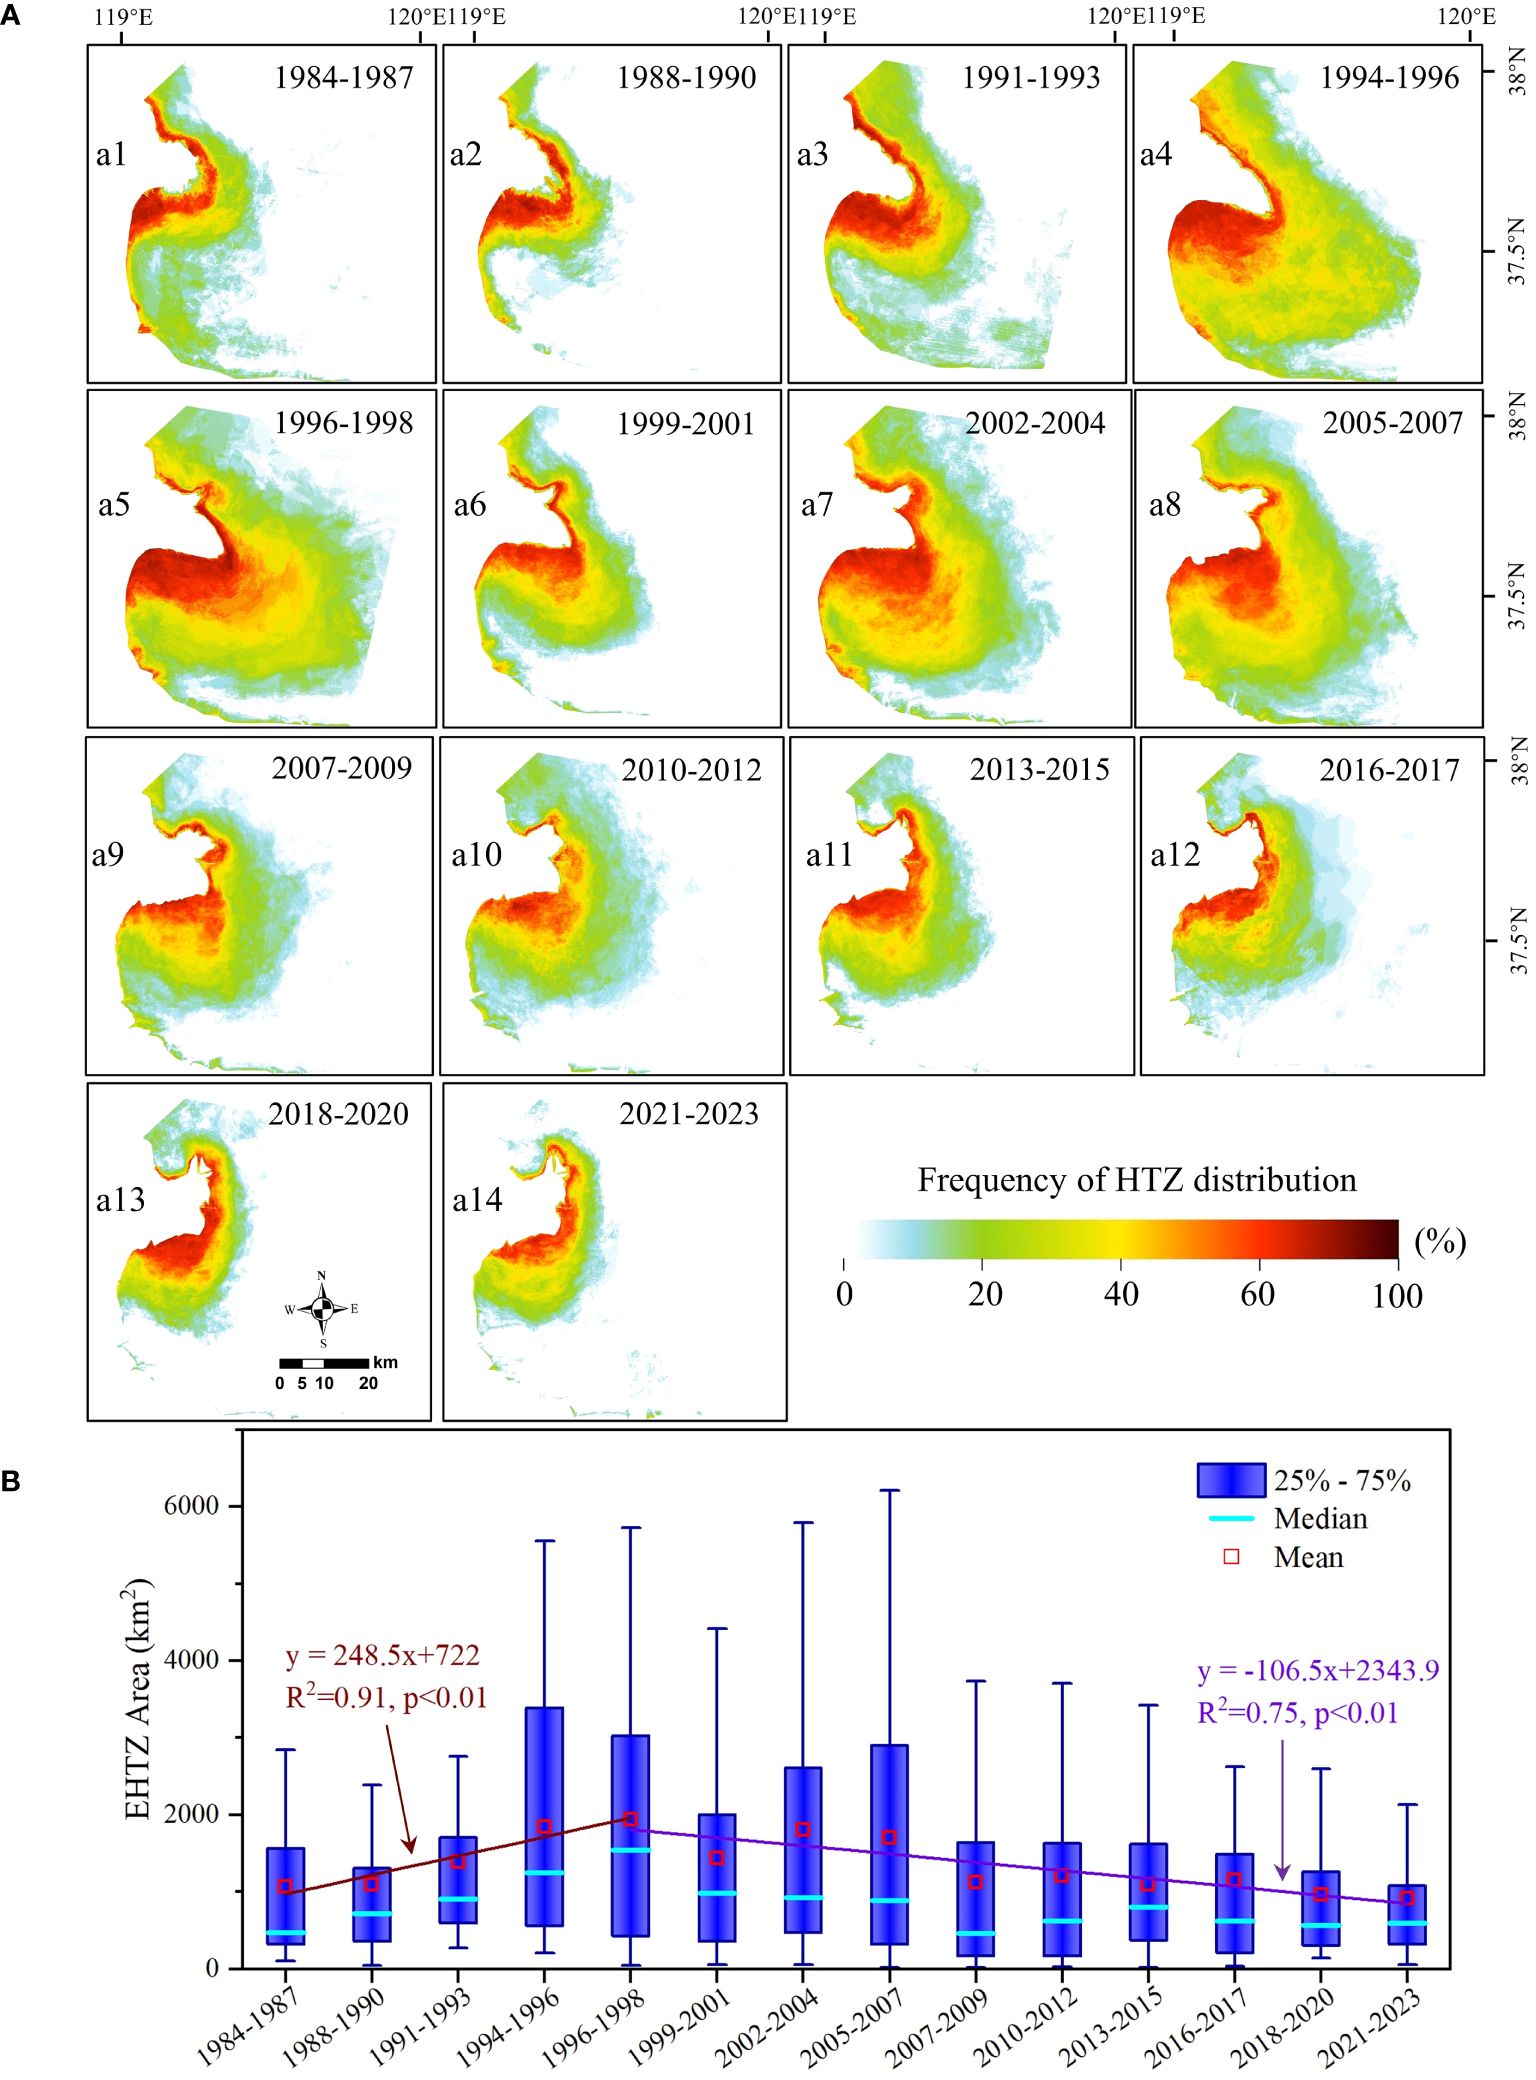
Figure 7 HTZ variations in the Southern subregion from 1984 to 2023. (A) Distributions of annual HTZ frequencies; (B) Boxplots of annual HTZ areas.
It could be found that the HTZ had changed dramatically over the last four decades, and the distribution frequency was usually significantly higher in the south of Qingshuigou lobe than that in the north. The average distribution area of HTZ generally experienced a trend of rapidly increasing and then slowly decreasing in the last 40 years, with the maximum occurring in 1996–1998 (1917.7 km2) and the minimum occurring in 2021–2023 (901.22 km2) (Figure 7B). In the early period (1984–1993), the HTZ mainly appeared near the Qingshuigou estuary with a circular distribution along the coast and limited seaward expansion (Figures 7a1, a2). After 1991, as the riverine mouth continued to advance seaward, the sediments from river were allowed to be transported further out to sea, resulting in a gradual extension of HTZ towards the centre of Laizhou Bay, eventually forming a south-east orientated ovoid pattern (Figures 7a3–a5). This pattern continued until 2007, during which time the distribution area of HTZ was not only maintained at a high level (annual mean >1700 km2), but also experienced the most dramatic changes, with intra-annual variability of more than 5000 km2. Although a new mouth was developed after artificial diversion in 1996, the frequency of HTZs near the old Qingshuigou estuary was still relatively high.
After 2007, there was a slow decline in the area of HTZ and a shift in the distribution pattern from the previous ovoid shape (1994–2007) to a circle-like shape (2007–2017) and then to a smaller northeastward ovoid shape (2018–2023). During this period, it could be distinctly observed that HTZ gradually contracted from the southeastern Laizhou Bay to the northwestern Laizhou Bay and the newly developed estuary continued to pushed HTZ northwards (Figures 7I–N). The average distribution area of HTZ did not change significantly during 2007–2017, remaining at 1000 km2 - 1200 km2, but the intra-annual variability in this period was higher than that in 2018–2023. In general, the distribution frequency of HTZ in coastal waters during 2007–2023 was considerably lower than that in the previous period (1984–2007), especially in the old Qingshuigou mouth. Moreover, the HTZ also appeared at high frequency along the northern nearshore in the early period, but has weakened markedly in the last decade. In recent years, as the present estuary continues to accrete northwards, the distribution frequency of HTZ in the offshore waters of Gudong Oilfield has remarkably decreased, and has almost disappeared in the last three years (Figure 7a14).
4 Discussion
4.1 Performances of SPM retrieval models
Evaluations of existing SPM algorithms of YRE using in-situ data revealed that the models incorporating both visible and NIR bands performed better in the highly turbid YRE than models with only visible bands (Figure 2). 214 measured Rrs-SPM datasets were divided into four groups with 0–20 mg/L, 20–60 mg/L, 60–200 mg/L, and >200 mg/L and correlations between Rrs and SPM concentrations were analyzed for separate SPM ranges (Figure 8). It could be found that in low turbidity waters (SPM< 60 mg/L), there was a strong correlation between Rrs(red) or Rrs(red)/Rrs(green) and SPM concentrations, whereas the correlation weakened in high turbidity waters (SPM > 60 mg/L), especially in the single Rrs(red), which was mainly attributed to the fact that reflectance signal of visible saturated rapidly for highly turbid waters, and therefore the models using only visible bands would be underestimated at high SPM (Bi et al., 2011; Zhang et al., 2014; Novoa et al., 2017; Luo et al., 2018). Moreover, Rrs(NIR) and Rrs(NIR)/Rrs(green) had low correlations with SPM concentration at low turbidity waters, therefore the models using these bands would produce large errors at low SPM (Yao et al., 2020). The correlation increased rapidly at high turbidity waters, but the low signal-to-noise ratio of satellite sensors in NIR band and the incomplete atmospheric correction led to a large uncertainty in the model containing single NIR band, which could be effectively reduced by the band ratio (Mélin et al., 2016; Luo et al., 2018).
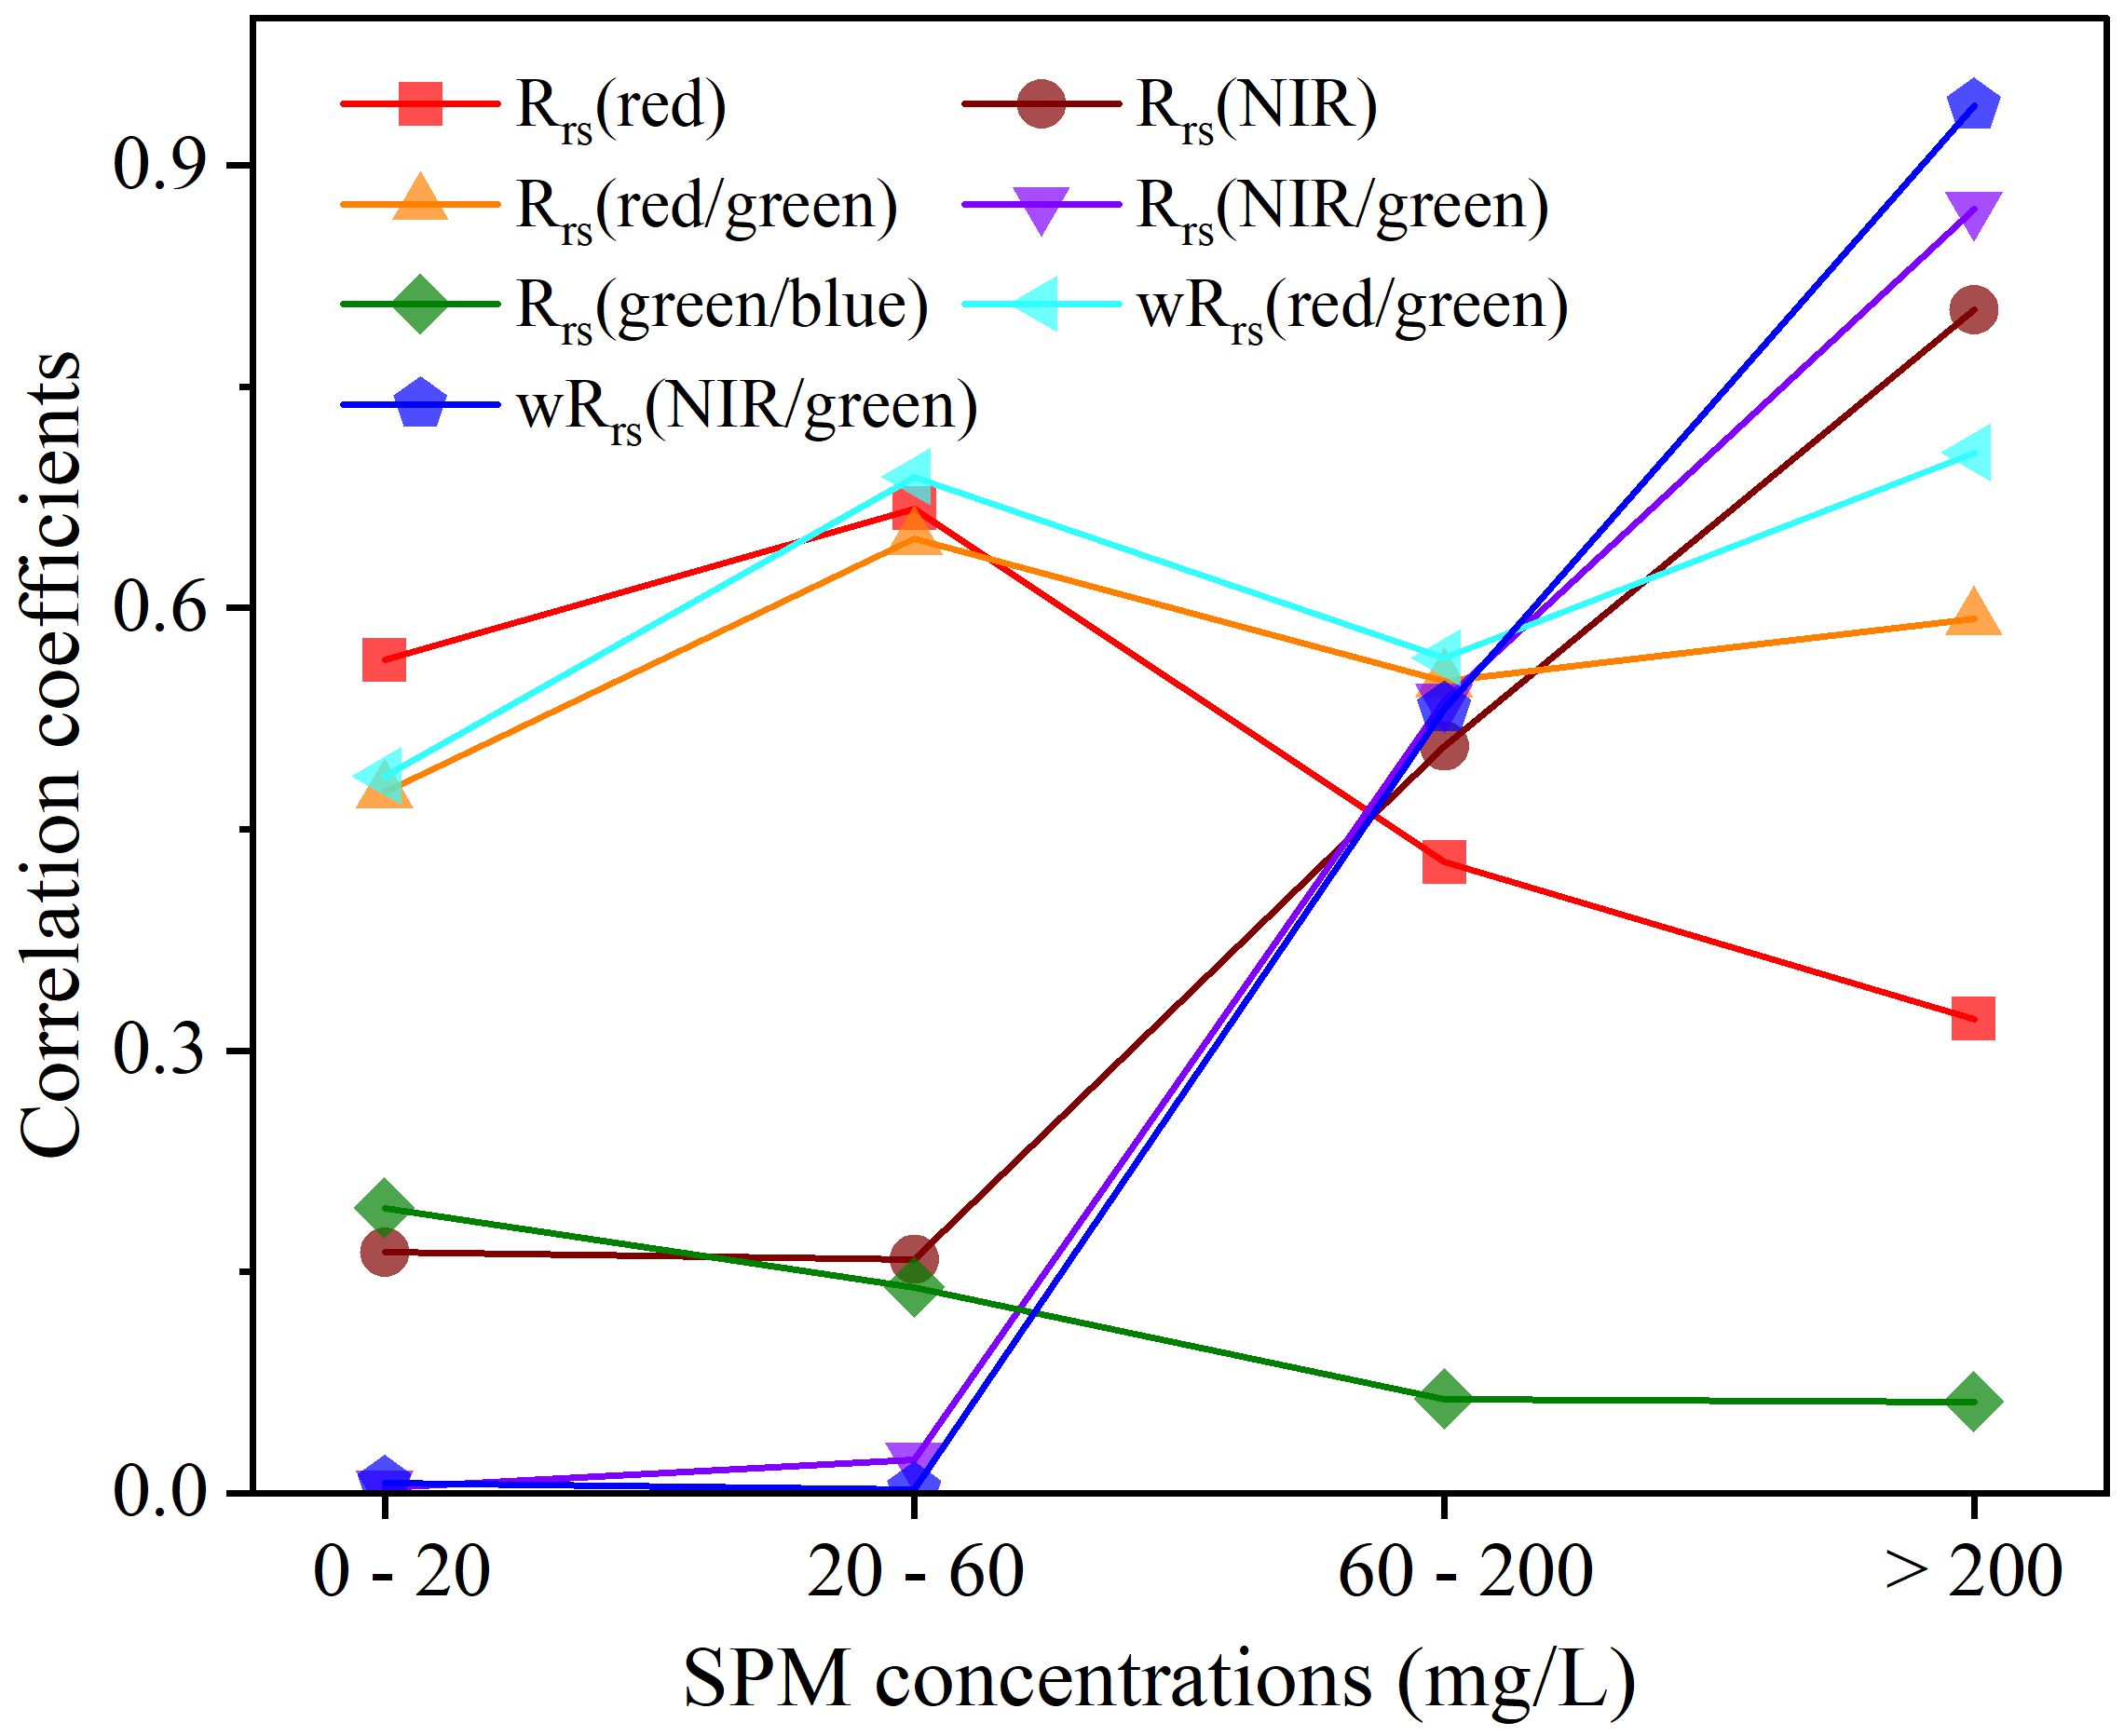
Figure 8 Correlation coefficients between field Rrs or its ratios and SPM concentrations for separate SPM ranges. wRrs denotes weighted Rrs.
Regardless of SPM range, the correlation between Rrs(green)/Rrs(blue) and SPM concentration was weak, thus the inclusion of this item brought little enhancement to model’s performance, but instead introduced additional errors from satellite sensors and atmospheric radiations (Figure 3 and Figure 8) (Mélin et al., 2016; Vanhellemont, 2019; Yu et al., 2019). It was evident that red and NIR bands played a dominant role in low and high turbidity waters, respectively, and thus the model combining these two bands was able to accommodate a larger range of SPM (Long and Pavelsky, 2013; Novoa et al., 2017). Furthermore, relative contributions of the dominant bands above were increased by weighting, and the correlation with SPM was also improved compared to single band and band ratio, which allowed our algorithm to accurately retrieve SPM concentration in extremely turbid waters (Figure 3).
4.2 Driving mechanisms of SPM changes
4.2.1 Impacts of river inputs
The terrigenous inputs, resuspension of shallow water sediments, coastal erosion, and transport from other areas are the main sources of SPM in estuaries and nearshore (Li et al., 2020, 2022; Ji et al., 2024). In the YRE, high sediment discharge intensively occurred in flood periods, especially during WSRS, and most of sediment was deposited near river mouth. And in winter, the previously deposited sediment is transformed into a source of SPM, which is re-suspended and spread around by the interaction of strong wind-wave-currents dynamics and shallow topography (Ji et al., 2022; Wu et al., 2022). As a result, the large amount of sediment (2.93 1010 t, from Lijin hydrological gauging station) that was once poured into the sea through the Shenxiangou channel (1953–1964) and the Diaokou channel (1964–1976), as well as the sediment discharge (1.33 1010 t) through the Qingshuigou channel (1976–1996), provided the material basis for the formation and development of the two subsequent high SPM centers (Li et al., 2021c, 2022). It was found that there was a significant linear relationship between the annual mean sediment discharge and SPM in YRE (R2 = 0.61, p<0.01), especially in the southern subregion covering the estuary (R2 = 0.65, p<0.01), indicating that the sediment delivery of Yellow River had a remarkable effect on the inter-decadal variation of SPM in YRE (Figure 9C). This was not consistent with the findings of several published studies, mainly because this study adequately considered extremely turbid waters near estuary, where interannual variability of SPM concentrations was dramatic, up to 10000 mg/L or more, which has an important dominant role in the time-series trends of SPM (Zhou et al., 2017; Li et al., 2019; Yu et al., 2023).
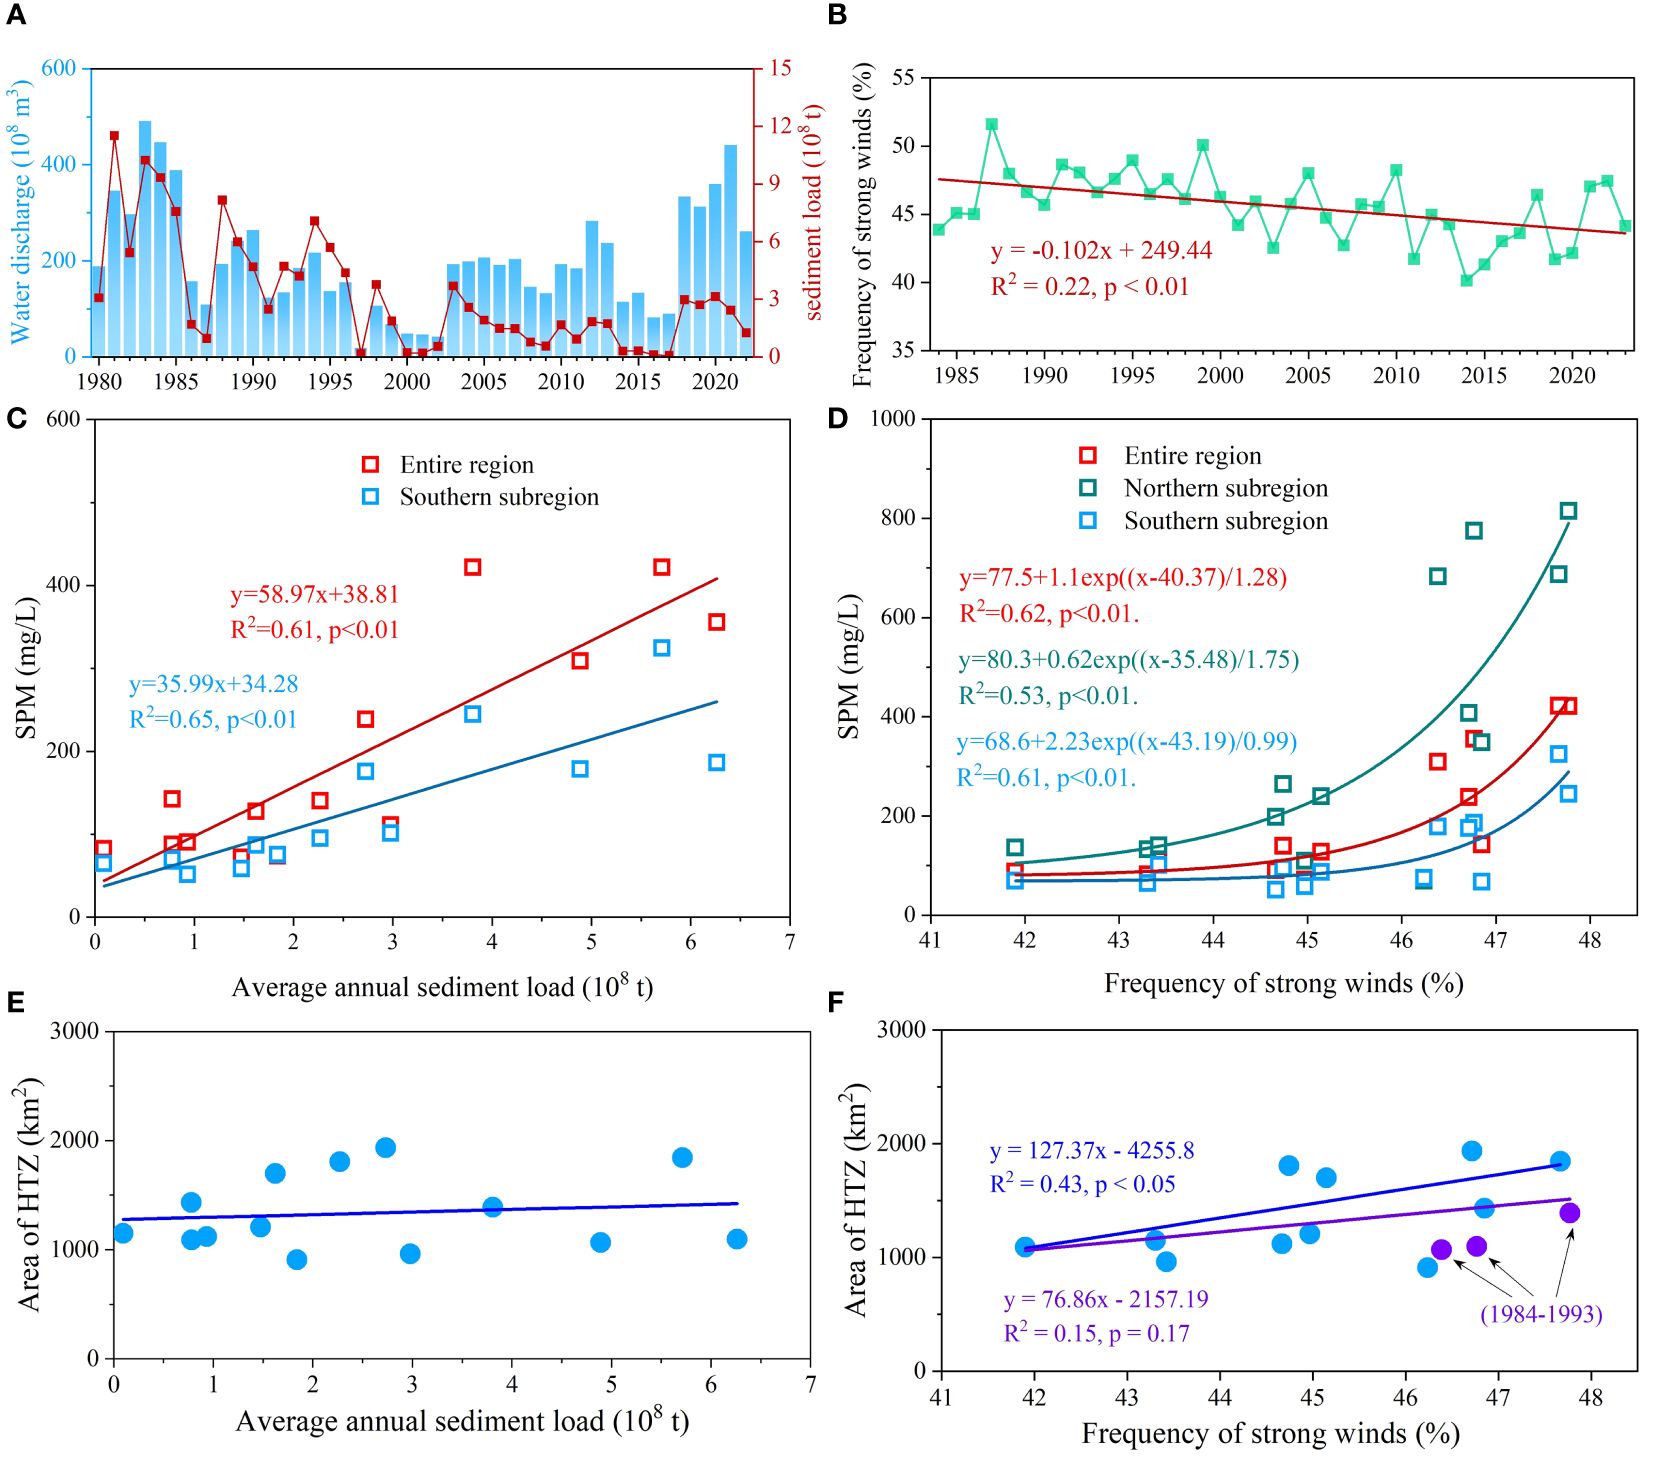
Figure 9 Annual SPM and HTZ area in relation to riverine sediment load and frequency of strong winds. (A) Annual Water discharge and sediment delivery of Yellow River from 1980 to 2022; (B) Annual strong wind frequencies from 1984 to 2023; Relationship between mean SPM concentrations and (C) sediment discharge from river and (D) strong wind frequencies; Relationship between distribution area of HTZ and (E) riverine sediment load and (F) strong wind frequency.
In fact, there was a generally decreasing trend of sediment discharge from the Yellow River in the last 40 years, which coincided with the trend of annual mean SPM obtained in this study (Figures 6O, 9A). During 1984–1996, the annual average sediment delivery of Yellow River was more than 3.8 108 t, and the mean sediment concentration was greater than 25000 mg/L, which not only led to the rapid accretion of estuarine spits into the Laizhou Bay, but also resulted in the emergence of extremely turbid waters near the mouth. It eventually gave rise to an increase of SPM concentrations in the entire region during this phase, and a gradual transformation of HTZ distribution to a larger southeasterly ovoid (Figures 6, 7). In July 1996, the Yellow River was diverted to Qingba channel and began delivering sediments to the northeast. However, extensive high SPM was maintained in the abandoned Qingshuigou estuary, primarily due to resuspension of sediments driven by ocean dynamics (Li et al., 2020; Ji et al., 2024). In the 21st century, although the runoff of Yellow River was relatively high, the sediment load and sediment concentration were low, which made the SPM concentrations in the entire area and its southern subregion to be maintained at a low level (Figure 9A). In the early years of WSRS (2002–2004 and 2018–2020), the average SPM concentrations in the southern subregion experienced a slight increase, followed by a decline as riverine sediment discharge decreased (Figure 6B). In addition, it was found that the distribution of HTZ was not significantly related to river inputs (Figure 9E), which was mainly due to the fact that sediment discharged from the river was mostly concentrated near the mouth, where SPM concentrations were high but the distribution area of HTZ was small.
4.2.2 Impacts of marine dynamics
Ocean dynamics, including wind, waves and tidal currents, are the primary drivers of sediment re-suspension and transport in the nearshore (Li et al., 2020; Ji et al., 2024). In this study, wind speed was used to characterize the strength of wind-wave forces, as wind speed and wave height were closely related, and strong winds were regarded as those exceeding the 40-year average (Li et al., 2022). Statistical analyses revealed that the frequency of strong winds in YRE had a significant decreasing trend in the last 40 years (R2 = 0.22, p<0.05) (Figure 9B), and there were remarkable nonlinear regression relationships between the strong wind frequencies and the annual mean SPM concentrations (R2 > 0.53, p<0.01) in both the northern and the southern subregions (Figure 9D). The exponential best-fit function implicated a high sensitivity of SPM concentrations in study area to variations in strong wind-wave forces. Moreover, the distribution of HTZ was also significantly correlated with the frequency of strong winds as well, which could explain 43% of the interannual variations (1994–2023) in HTZ distribution area (Figure 9F).
It was obvious from the above that sediment load and strong wind frequency were the main factors controlling the interannual variations of SPM in YRE. To quantify the contributions of the two drivers, sediment delivery and strong wind frequency were normalized, and then multiple regression equations were constructed with SPM concentrations. It was found that riverine sediment delivery and strong wind frequency together explained 67% of the interannual variations of SPM in this study area, and the contribution of sediment discharge was higher than that of strong wind frequency. In the southern subregion, these two factors together could explain 73% of the interannual SPM variability, and the contribution of sediment delivery was increased and that of strong wind frequency was decreased.
where and denoted the normalized SPM concentrations in the entire area and southern subregion, respectively. and indicated the normalized annual mean sediment load and strong wind frequency.
The coastal waters off YRD are mainly dominated by irregular semidiurnal tides, and it was widely believed that the tidal currents mainly controlled the intra-day SPM variations, and had little influence on the monthly or annual mean SPM (Qiu et al., 2017; Zhou et al., 2017; Li et al., 2022). However, the geomorphology of YRD has experienced drastic changes over a time scale of up to 40 years, which would have important influences on the regional hydrodynamic field, conducting impacts on variations of SPM and HTZ (Fu et al., 2021; Ji et al., 2024; Wang et al., 2024). By combining the bathymetric data and boundary conditions, the tidal currents during the flood maximum in 1992, 2000, 2007, 2015 and 2020 were simulated by the numerical hydrodynamic model embedded in the TELEMAC suite (Figures 10A–E). Moreover, the distributions of bottom shear stress fields in the study area were obtained by coupling the wave module and the hydrodynamic module in TELEMAC (Figures 10F–J) (Ji et al., 2024). The total bottom shear stresses (BSS) are able to induce sediment resuspension, and the tidal current field dominates the spreading of suspended sediment (Li et al., 2020; Wang et al., 2024). It could be found that there are two high-velocity zones and two strong BSS regions in the offshore of YRD, explaining the perennial existence of two high SPM centers (Figure 6). There was a weakening trend in the current velocities and BSS in the northern coastal region during 1992–2007, which might be related to the gradual gentle topography of the region due to the erosion by ocean dynamics (Wang et al., 2017; Li et al., 2021b). Thus, this was another important factor contributing to the rapid decline of SPM in the region during this period. After 2007, coastal structures in Dongying Port not only significantly altered the hydrodynamic environment in the region, but also had an intercepting effect on the transport of suspended sediments from the northwest, resulting in a low SPM in the coastal area from Dongying Port to Gudong Oilfield (Figure 6) (Li et al., 2021b; Ji et al., 2024).
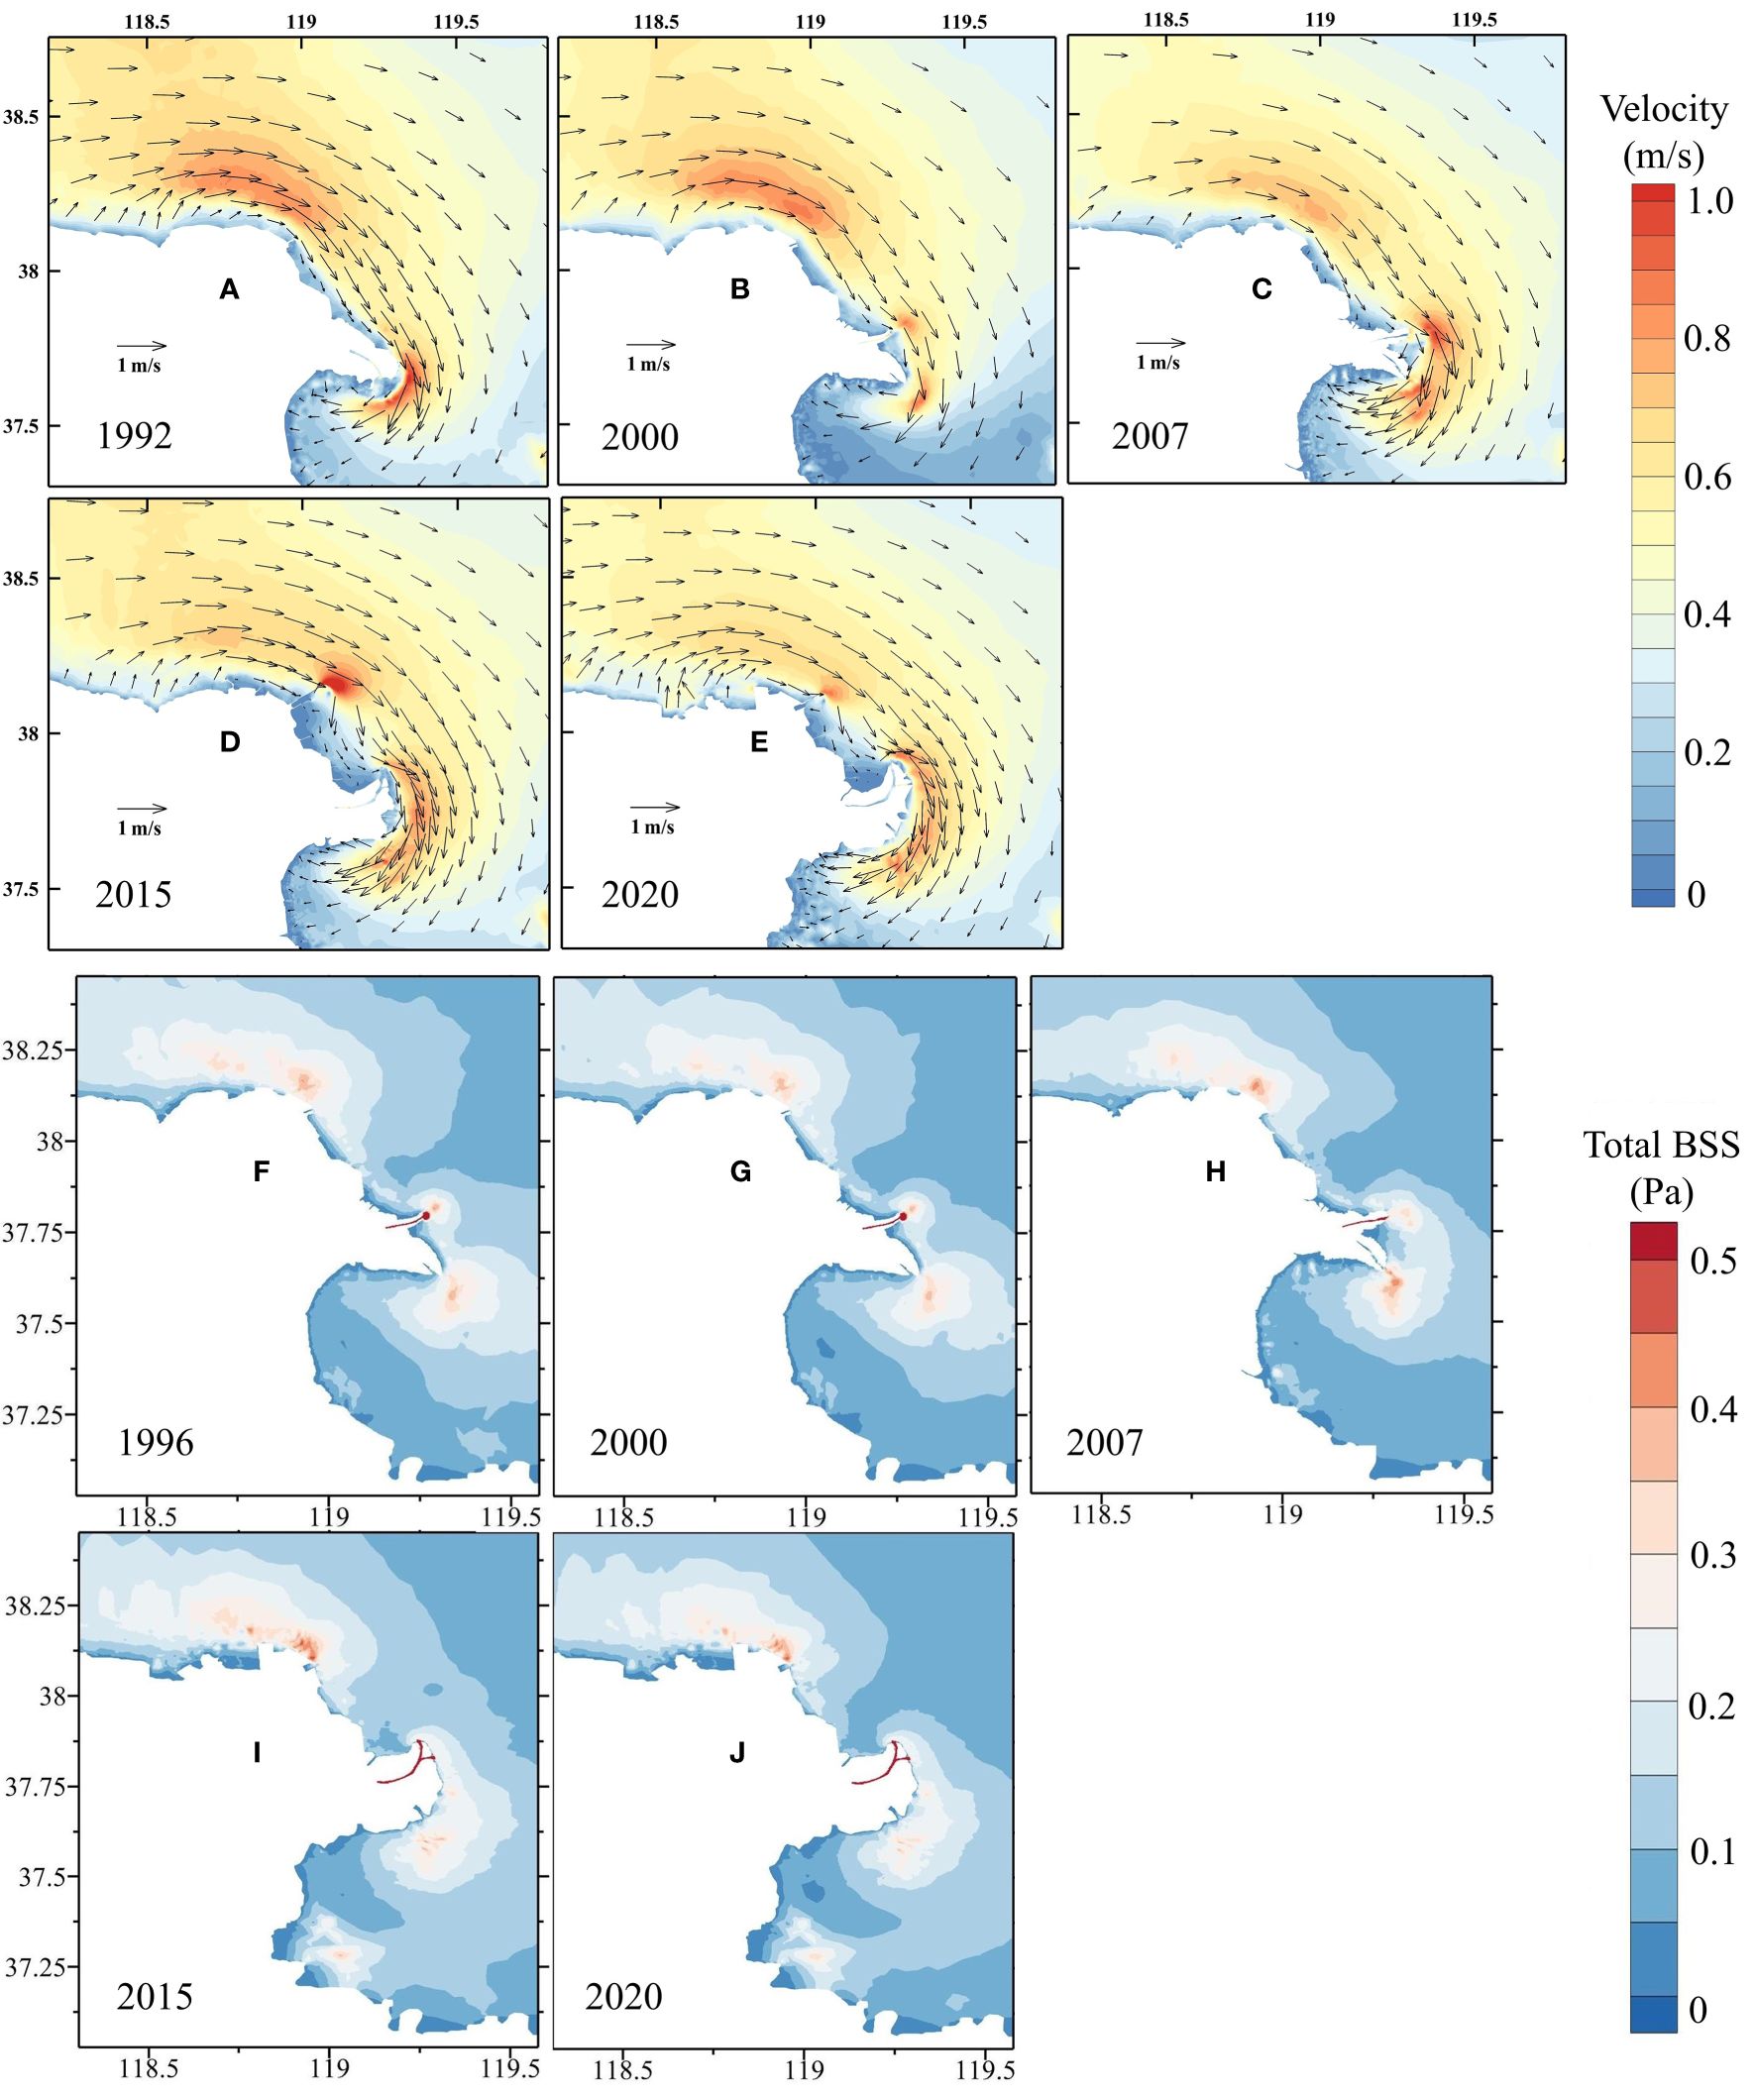
Figure 10 Tidal currents during the flood maximum in (A) 1992, (B) 2000, (C) 2007, (D) 2015 and (E) 2020. Distributions of total bottom shear stress in (F) 1996, (G) 2000, (H) 2007, (I) 2015 and (J) 2020.
The geomorphological evolution of Qingshuigou lobe was the most dramatic in entire YRD, and the hydrodynamic environment around it was significantly influenced by the development of two river mouths (present river mouth and abandoned old mouth) (Figure 10) (Fu et al., 2021; Ji et al., 2024). Wang et al. (2017) indicated that the rapid accretion of estuarine spits in 1976–1996 significantly increased the velocities of tidal currents and residual currents, and enhanced BSS and shifted the strong shear stress zone to the southeast (Wang et al., 2017). This explained the gradual increase of SPM concentrations in the Qingshuigou estuary and the wide spread of HTZ into Laizhou Bay from 1984 to 1996 (Figures 6, 7). After 1996, with the shrinkage of old estuary, the current velocity around it weakened and BSS zones receded, allowing the shape of HTZ to change from a southeasterly ovoid to a circle-like shape (Figures 7, 10). In addition, the gradual development of new estuary to the east resulted in enhanced current velocities and BSS at the front of spit, creating a double-driven pattern in 2007 that controlled the general variability of SPM and HTZ in the southern subregion. River mouth shifted to the north in 2007, and the two high-velocity regions and strong BSS zones gradually merged, eventually producing a northeasterly ovoid distribution pattern along the coast, which was consistent with the distributions of high SPM and HTZ during this period (Figures 10D, E, I, J). Furthermore, the present estuary constantly advancing northwards was obstructed by increasingly strong tidal shear fronts, causing the sediment discharged from river not to spread further out to sea, but to be transported southwards mainly along the coast (Ji et al., 2022; Wang et al., 2024), thus resulting in high SPM between the old and new estuaries in the last 5 years (Figures 6a13–a14).
4.2.3 Impacts of deltaic geomorphology and wetland vegetation
The above findings revealed that geomorphological evolution of YRD and the artificial constructs along coast affected the distribution patterns of SPM and HTZ by controlling the changes of hydrodynamic field (Figure 10). However, the dynamics of nearshore SPM are also related to factors such as underwater topography, sediment type, erosion/accretion of coast and seabed (Zhang et al., 2020; Li et al., 2022). By analyzing the relationships between bathymetry, sediment median grain size, and erosion volume with annual average SPM concentrations in the two high turbidity centres (Supplementary Figure S8 in the Supplementary Material), it could be found that the seabed in the northern coastal zone had been experiencing erosion from 1985 to 2015, but the rate of scour has been decreasing (Supplementary Figure S8F). In fact, the terrestrial land loss rate in this region has also been declining (Li et al., 2021b). This meant that the sediment supplied into water would be reduced, which together with progressively increasing water depths and coarsening sediments contributed to a decrease of surface SPM concentrations in this area (Supplementary Figures S8B, D).
In the Qingshuigou estuary, the riverine inputs before 1996 not only provided a large amount of sediment, but also allowed for rapid accretion of seabed, which made it easier to resuspend bottom sediments (Li et al., 2020). After river diversion, the sediment supply was cut off and the coast and seabed in the region had been undergoing erosion and sediment had been slightly coarsened, which was associated with the interannual decline in SPM (Supplementary Figures S8E, G) (Ji et al., 2018; Fu et al., 2021). The erosion/accretion dynamics of subaqueous delta of Qingshuigou lobe in 1985–2015 were obtained using underwater DEM calculations in different periods (Supplementary Figure S9). It was found that strong siltation zones occurred mainly at present river mouths, and intense erosion was observed in abandoned estuaries. The areas of intense scouring and siltation were in good agreement with the distributions of high-frequency HTZ (>40%), suggesting that the erosion/accretion patterns of offshore seabed, in addition to the geomorphology of terrestrial delta, also had an effect on the HTZ distributions.
In the early development of Qingshuigou lobe, there was frequent river flooding and even multiple branch mouths, leading to the lateral transport of terrigenous materials (Han et al., 2020). Moreover, the edges of nascent lobe were vulnerable to scouring by ocean dynamics. These ultimately led to extremely high SPM surrounding the Qingshuigou lobe during 1984–1996 (Figures 6a1–a4). As the river channel was naturally regulated and artificial bank protection was constructed, the phenomenon of lateral sediment transport was gradually reduced, coupled with the increasing wetland vegetation cover, especially the colonization and large-scale dispersal of the invasive species S. alterniflora, which reduced the source of SPM on both sides of sub-deltaic lobe. Salt marsh vegetation can not only weaken wave energy to stabilize the shoreline, but also has a filtering effect on laterally transported particulate matter (Saintilan et al., 2022). However, the large-scale S. alterniflora had been successively removed in the last three years, resulting in the re-exposure of coastal mudflats to ocean dynamics, which might have an impact on coastal SPM in the future (Min et al., 2023).
5 Conclusions
In this study, all the published SPM models for YRE were evaluated using our datasets, and the necessity of red and NIR bands for SPM retrieval in highly turbid waters was highlighted. Based on the results, a novel SPM retrieval algorithm (R2 > 0.95, RPD< 22%) and HTZ extraction method (overall accuracy = 94%) for Landsat TM/ETM+/OLI were developed. Not only satellite-derived SPM concentrations had high accuracy (RMSE=64.13 mg/L, RPD=33.01%) using our algorithm, but also the dynamics of SPM and HTZ in YRE could be more precisely characterized.
A total of 798 Landsat TM/ETM+/OLI imageries were used to investigate the spatiotemporal dynamics of SPM and HTZ in YRE from 1984 to 2023. The results revealed that there were two high SPM centers in study area, located in the offshore of northern YRD and Qingshuigou estuary, which regulated the SPM variations in entire YRE. Sediment discharge from river and strong-wind frequency controlled 67% of the interannual SPM variability in the study area, and the former contributed more. There were differences in SPM dynamics and influencing factors in the southern and northern subregions over the last 40 years. The exponential decrease of SPM concentrations in northern region was attributed to weakened marine dynamics, increased bathymetry, coarsened bottom sediments, reduced erosion efficiency, and the construction of Dongying Port. In southern subregion, increased SPM concentrations and rapid expansion of HTZ into the Laizhou Bay were caused by huge sediment discharge and enhanced ocean dynamics induced by estuarine spit accretion in 1984–1996. After the diversion of Yellow River, with the development of new mouth and the shrinkage of old mouth, the high velocity zone and strong bottom shear stress zone were subsequently readjusted, which, together with the reduced sediment delivery and strong-wind frequency, led to an exponential decrease in SPM concentration and a linear decline in HTZ distribution area. HTZ morphology also gradually shifted from a southeasterly ovoid shape (1994–2007) to a circle-like shape (2007–2017) and eventually shrank to a northeasterly ovoid shape (2018–2023). Furthermore, the evolution of underwater topography, the rate of coastal erosion, the type of sediment, and the spreading and removal of wetland vegetation also had impacts on SPM dynamics. This study will contribute to the understanding of long-term evolutionary patterns of the coupled system comprising runoff-tide dynamics, sediment transport and geomorphological evolution in YRE, and also provide a reference for the integrated management and National Park construction of YRD.
Data availability statement
The original contributions presented in the study are included in the article/Supplementary Material. Further inquiries can be directed to the corresponding authors.
Author contributions
PL: Conceptualization, Investigation, Methodology, Software, Visualization, Writing – original draft, Writing – review & editing. SC: Conceptualization, Data curation, Funding acquisition, Project administration, Writing – review & editing. HJ: Investigation, Methodology, Software, Visualization, Writing – review & editing. XZ: Data curation, Investigation, Supervision, Validation, Writing – review & editing. JQ: Resources, Supervision, Validation, Writing – review & editing. XG: Data curation, Software, Visualization, Writing – review & editing. PY: Investigation, Supervision, Validation, Writing – review & editing. YK: Conceptualization, Data curation, Funding acquisition, Resources, Writing – review & editing.
Funding
The author(s) declare financial support was received for the research, authorship, and/or publication of this article. This study was supported by the National Natural Science Foundation of China (NSFC) (No. U1706214), the State Key Program of National Natural Science Foundation of China (NO. U2243207), and the National Natural Science Foundation of China (No. 42071396).
Conflict of interest
The authors declare that the research was conducted in the absence of any commercial or financial relationships that could be construed as a potential conflict of interest.
Publisher’s note
All claims expressed in this article are solely those of the authors and do not necessarily represent those of their affiliated organizations, or those of the publisher, the editors and the reviewers. Any product that may be evaluated in this article, or claim that may be made by its manufacturer, is not guaranteed or endorsed by the publisher.
Supplementary material
The Supplementary Material for this article can be found online at: https://www.frontiersin.org/articles/10.3389/fmars.2024.1437675/full#supplementary-material
References
Abascal-Zorrilla N., Vantrepotte V., Huybrechts N., Ngoc D. D., Anthony E. J., Gardel A. (2020). Dynamics of the estuarine turbidity maximum zone from landsat-8 data: the case of the Maroni river estuary, French Guiana. Remote Sens. 12, 2173. doi: 10.3390/rs12132173
Allison M. A., Pratt T. C. (2017). Discharge controls on the sediment and dissolved nutrient transport flux of the lowermost Mississippi River: Implications for export to the ocean and for delta restoration. J. Hydrology 555, 1–14. doi: 10.1016/j.jhydrol.2017.10.002
Bi N., Yang Z., Wang H., Fan D., Sun X., Lei K. (2011). Seasonal variation of suspended-sediment transport through the southern Bohai Strait. Estuarine Coast. Shelf Sci. 93, 239–247. doi: 10.1016/j.ecss.2011.03.007
Cui T., Zhang J., Ma Y., Zhao W., Sun L. (2009). The study on the distribution of suspended particulate matter in the Bohai Sea by remote sensing. Acta Oceanologica Sinica. 31, 10–18.
Dethier E. N., Renshaw C. E., Magilligan F. J. (2020). Toward improved accuracy of remote sensing approaches for quantifying suspended sediment: implications for suspended-sediment monitoring. J. Geophysical Research: Earth Surface 125. doi: 10.1029/2019JF005033
Dethier E. N., Renshaw C. E., Magilligan F. J. (2022). Rapid changes to global river suspended sediment flux by humans. Science 376, 1447–1452. doi: 10.1126/science.abn7980
Fan H., Huang H., Tang J. (2007). Spectral signature of waters in Huanghe Estuary and estimation of suspended sediment concentration from remote sensing data. Geomatics Inf. Sci. Wuhan University. 4, 601–604. doi: 10.13203/j.whugjs.2007.07.009
Fu Y., Chen S., Ji H., Fan Y., Li P. (2021). The modern Yellow River Delta in transition: Causes and implications. Mar. Geology 436, 106476. doi: 10.1016/j.margeo.2021.106476
Han S., Zheng S., Tan G., Wang K. (2020). Analysis of river course evolution and diversion risk assessment of Qingshuigou channel in the Yellow River Delta. Eng. J. Wuhan University. 53, 659–666. doi: 10.14188/j.1671–8844.2020–08-001
Hou X., Xie D., Feng L., Shen F., Nienhuis J. H. (2024). Sustained increase in suspended sediments near global river deltas over the past two decades. Nat. Commun. 15. doi: 10.1038/s41467-024-47598-6
Ji H., Chen S., Li P., Pan S., Gong X., Jiang C. (2024). Spatiotemporal variability of suspended sediment concentration in the coastal waters of Yellow River Delta: Driving mechanism and geomorphic implications. Mar. Geology 470, 107266. doi: 10.1016/j.margeo.2024.107266
Ji H., Chen S., Pan S., Xu C., Jiang C., Fan Y. (2018). Morphological variability of the active Yellow River mouth under the new regime of riverine delivery. J. Hydrology 564, 329–341. doi: 10.1016/j.jhydrol.2018.07.014
Ji H., Chen S., Pan S., Xu C., Tian Y., Li P., et al. (2022). Fluvial sediment source to sink transfer at the Yellow River Delta: Quantifications, causes, and environmental impacts. J. Hydrology 608, 127622. doi: 10.1016/j.jhydrol.2022.127622
Jia M., Wang Z., Mao D., Ren C., Wang C., Wang Y. (2021). Rapid, robust, and automated mapping of tidal flats in China using time series Sentinel-2 images and Google Earth Engine. Remote Sens. Environ. 255, 112285. doi: 10.1016/j.rse.2021.112285
Li P., Ke Y., Bai J., Zhang S., Chen M., Zhou D. (2019). Spatiotemporal dynamics of suspended particulate matter in the Yellow River Estuary, China during the past two decades based on time-series Landsat and Sentinel-2 data. Mar. Pollut. Bull. 149, 110518. doi: 10.1016/j.marpolbul.2019.110518
Li B., Jia Y., Liu J. P., Liu X., Wang Z. (2020). Effect of wave, current, and lutocline on sediment resuspension in yellow river delta-front. Water 12, 845. doi: 10.3390/w12030845
Li J., Hao Y., Zhang Z., Li Z., Yu R., Sun Y. (2021). Analyzing the distribution and variation of Suspended Particulate Matter (SPM) in the Yellow River Estuary (YRE) using Landsat 8 OLI. Regional Stud. Mar. Sci. 48, 102064. doi: 10.1016/j.rsma.2021.102064
Li P., Ke Y., Wang D., Ji H., Chen S., Chen M., et al. (2021a). Human impact on suspended particulate matter in the Yellow River Estuary, China: Evidence from remote sensing data fusion using an improved spatiotemporal fusion method. Sci. Total Environ. 750, 141612. doi: 10.1016/j.scitotenv.2020.141612
Li P., Chen S., Ji H., Ke Y., Fu Y. (2021b). Combining Landsat-8 and Sentinel-2 to investigate seasonal changes of suspended particulate matter off the abandoned distributary mouths of Yellow River Delta. Mar. Geology 441, 106622. doi: 10.1016/j.margeo.2021.106622
Li P., Chen S., Ke Y., Ji H., Li P., Fan Y. (2022). Spatiotemporal dynamics of suspended particulate matter in the Bohai Sea, China over the past decade from the space perspective. Sci. Total Environ. 851, 158210. doi: 10.1016/j.scitotenv.2022.158210
Li P., Chen S., Ji H., Fan Y., Fu Y., Ran B., et al. (2023). Detecting the magical yellow-blue demarcation off the Yellow River Estuary from the space. Front. Mar. Sci. 10. doi: 10.3389/fmars.2023.1234631
Li M., Shen F., Organelli E., Luo W., Li R., Sun X., et al. (2024). Disentangling particle composition to improve space-based quantification of POC in optically complex estuarine and coastal waters. IEEE Trans. Geosci. Remote Sens. 62, 1–15. doi: 10.1109/TGRS.2024.3425608
Liu Z., Cui T., Li J., Zhao J. (2018). Suspended particle concentration retrieval in Yellow River Estuary using multi-band of Landsat8 OLI. Acta Sci. Circumst. 38, 1579–1585. doi: 10.13671/j.hjkxxb.2017.0450
Long C. M., Pavelsky T. M. (2013). Remote sensing of suspended sediment concentration and hydrologic connectivity in a complex wetland environment. Remote Sens. Environ. 129, 197–209. doi: 10.1016/j.rse.2012.10.019
Luo Y., Doxaran D., Vanhellemont Q. (2020). Retrieval and validation of water turbidity at metre-scale using pléiades satellite data: A case study in the gironde estuary. Remote Sens. 12, 946. doi: 10.3390/rs12060946
Luo Y., Doxaran D., Vanhellemont Q. (2018). Saturation of water reflectance in extremely turbid media based on field measurements, satellite data and bio-optical modelling. Optics Express 26, 10435. doi: 10.1364/OE.26.010435
Luo W., Shen F., He Q., Cao F., Zhao H., Li M., et al. (2022). Changes in suspended sediments in the Yangtze River Estuary from 1984 to 2020: Responses to basin and estuarine engineering constructions. Sci. Total Environ. 805, 150381. doi: 10.1016/j.scitotenv.2021.150381
Maciel F. P., Pedocchi F. (2022). Evaluation of ACOLITE atmospheric correction methods for Landsat-8 and Sentinel-2 in the Río de la Plata turbid coastal waters. Int. J. Remote Sens. 43, 215–240. doi: 10.1080/01431161.2021.2009149
Mélin F., Sclep G., Jackson T., Sathyendranath S. (2016). Uncertainty estimates of remote sensing reflectance derived from comparison of ocean color satellite data sets. Remote Sens. Environ. 177, 107–124. doi: 10.1016/j.rse.2016.02.014
Min Y., Cui L., Li J., Han Y., Zhuo Z., Yin X., et al. (2023). Detection of large-scale Spartina alterniflora removal in coastal wetlands based on Sentinel-2 and Landsat 8 imagery on Google Earth Engine. Int. J. Appl. Earth Observation Geoinformation 125, 103567. doi: 10.1016/j.jag.2023.103567
Mobley C. D. (1999). Estimation of the remote-sensing reflectance from above-surface measurements. Appl. Opt 38, 7442–7455. doi: 10.1364/AO.38.007442
Normandin C., Lubac B., Sottolichio A., Frappart F., Ygorra B., Marieu V. (2019). Analysis of suspended sediment variability in a large highly turbid estuary using a 5-year-long remotely sensed data archive at high resolution. J. Geophysical Research: Oceans 124, 7661–7682. doi: 10.1029/2019JC015417
Novoa S., Doxaran D., Ody A., Vanhellemont Q., Lafon V., Lubac B., et al. (2017). Atmospheric corrections and multi-conditional algorithm for multi-sensor remote sensing of suspended particulate matter in low-to-high turbidity levels coastal waters. Remote Sens. 9, 61. doi: 10.3390/rs9010061
Qiu Z. (2013). A simple optical model to estimate suspended particulate matter in Yellow River Estuary. Optics Express 21, 27891. doi: 10.1364/OE.21.027891
Qiu Z., Xiao C., Perrie W., Sun D., Wang S., Shen H., et al. (2017). Using Landsat 8 data to estimate suspended particulate matter in the Yellow River estuary. J. Geophysical Res. 122, 276–290. doi: 10.1002/2016JC012412
Qiu Z., Liu D., Duan M., Chen P., Yang C., Li K., et al. (2024). Four-decades of sediment transport variations in the Yellow River on the Loess Plateau using Landsat imagery. Remote Sens. Environ. 306, 114147. doi: 10.1016/j.rse.2024.114147
Saintilan N., Kovalenko K. E., Guntenspergen G., Rogers K., Lynch J. C., Cahoon D. R., et al. (2022). Constraints on the adjustment of tidal marshes to accelerating sea level rise. Science 377, 523–527. doi: 10.1126/science.abo7872
Sun Q., Luo W., Dong X., Lei S., Mu M., Zeng S., et al. (2024). Landsat observations of total suspended solids concentrations in the Pearl River Estuary, China, over the past 36 years. Environ. Res. 249, 118461. doi: 10.1016/j.envres.2024.118461
Teng L., Cheng H., de Swart H. E., Dong P., Li Z., Li J., et al. (2021). On the mechanism behind the shift of the turbidity maximum zone in response to reclamations in the Yangtze (Changjiang) Estuary, China. Mar. Geology 440, 106569. doi: 10.1016/j.margeo.2021.106569
Vanhellemont Q. (2019). Adaptation of the dark spectrum fitting atmospheric correction for aquatic applications of the Landsat and Sentinel-2 archives. Remote Sens. Environ. 225, 175–192. doi: 10.1016/j.rse.2019.03.010
Wang X., Bai J., Yan J., Cui B., Shao D. (2022). How turbidity mediates the combined effects of nutrient enrichment and herbivory on sea grass ecosystems. Front. Mar. Sci. 9. doi: 10.3389/fmars.2022.787041
Wang N., Li G., Qiao L., Shi J., Dong P., Xu J, et al. (2017). Long-term evolution in the location, propagation, and magnitude of the tidal shear front off the Yellow River Mouth. Continental Shelf Res. 137, 1–12. doi: 10.1016/j.csr.2017.01.020
Wang N., Li K., Song D., Bi N., Bao X., Liang S., et al. (2024). Impact of tidal shear fronts on terrigenous sediment transport in the Yellow River Mouth: Observations and a synthesis. Mar. Geology 469, 107222. doi: 10.1016/j.margeo.2024.107222
Wang H., Wang A., Bi N., Zeng X., Xiao H. (2014). Seasonal distribution of suspended sediment in the Bohai Sea, China. Continental Shelf Res. 90, 17–32. doi: 10.1016/j.csr.2014.03.006
Wei J., Wang M., Jiang L., Yu X., Mikelsons K., Shen F. (2021). Global estimation of suspended particulate matter from satellite ocean color imagery. J. Geophysical Research: Oceans 126. doi: 10.1029/2021JC017303
Wu X., Wang H., Saito Y., Syvitski J., Bi N., Yang Z., et al. (2022). Boosting riverine sediment by artificial flood in the Yellow River and the implication for delta restoration. Mar. Geology 448, 106816. doi: 10.1016/j.margeo.2022.106816
Wu G., Wang K., Liang B., Wu X., Wang H., Li H., et al. (2023). Modeling the morphological responses of the yellow river delta to the water-sediment regulation scheme: the role of impulsive river floods and density-driven flows. Water Resour. Res. 59. doi: 10.1029/2022WR033003
Xu M., Wang G., Wang Z., Hu H., Kumar Singh. D., Tian S. (2022). Temporal and spatial hydrological variations of the Yellow River in the past 60 years. J. Hydrology 609, 127750. doi: 10.1016/j.jhydrol.2022.127750
Yao R., Cai L., Liu J., Zhou M. (2020). GF-1 satellite observations of suspended sediment injection of yellow river estuary, China. Remote Sens. 12, 3126. doi: 10.3390/rs12193126
Yu X., Lee Z., Shen F., Wang M., Wei J., Jiang L., et al. (2019). An empirical algorithm to seamlessly retrieve the concentration of suspended particulate matter from water color across ocean to turbid river mouths. Remote Sens. Environ. 235, 111491. doi: 10.1016/j.rse.2019.111491
Yu D., Bian X., Yang L., Zhou Y., An D., Zhou M., et al. (2023). Monitoring suspended sediment concentration in the Yellow River Estuary from 1984 to 2021 using landsat imagery and Google Earth Engine. Int. J. Remote Sens. 44, 3122–3145. doi: 10.1080/01431161.2023.2216849
Yunus A. P., Masago Y., Boulange J., Hijioka Y. (2022). Natural and anthropogenic forces on suspended sediment dynamics in Asian estuaries. Sci. Total Environ. 836, 155569. doi: 10.1016/j.scitotenv.2022.155569
Zhan C., Dong C., Wang T., Li B., Liu Y., Yu X. (2020). Remotely sensed retrieval of extreme high surface suspended sediment concentration in the yellow river estuary from 1996 to 2017. J. Coast. Res. 99, 221. doi: 10.2112/SI99-032.1
Zhang M., Dong Q., Cui T., Xue C., Zhang S. (2014). Suspended sediment monitoring and assessment for Yellow River estuary from Landsat TM and ETM+ imagery. Remote Sens. Environ. 146, 136–147. doi: 10.1016/j.rse.2013.09.033
Zhang X., Fichot C. G., Baracco C., Guo R., Neugebauer S., Bengtsson Z., et al. (2020). Determining the drivers of suspended sediment dynamics in tidal marsh-influenced estuaries using high-resolution ocean color remote sensing. Remote Sens. Environ. 240, 111682. doi: 10.1016/j.rse.2020.111682
Zhang H., Qiu Z., Sun D., Wang S., He Y. (2017). Seasonal and interannual variability of satellite-derived chlorophyll-a, (2000–2012) in the Bohai Sea, China. Remote Sens. 9, 582. doi: 10.3390/rs9060582
Zhou Z., Bian C., Wang C., Jiang W., Bi R. (2017). Quantitative assessment on multiple timescale features and dynamics of sea surface suspended sediment concentration using remote sensing data. J. Geophysical Research: Oceans 122, 8739–8752. doi: 10.1002/2017JC013082
Zhou T., Cao B., Qiu J., Cai S., Ou H., Fan W., et al. (2023). Mapping suspended sediment changes in the Western Pacific coasts. Remote Sens. 15, 5192. doi: 10.3390/rs15215192
Keywords: suspended particulate matter, estuarine high turbidity zone, Yellow River estuary, river inputs, ocean dynamics, deltaic geomorphology
Citation: Li P, Chen S, Ji H, Zhong X, Qi J, Gong X, Yu P and Ke Y (2024) Remote sensing of suspended particulate matter concentrations in the Yellow River Estuary, China: algorithm development, long-term dynamics and driving mechanisms. Front. Mar. Sci. 11:1437675. doi: 10.3389/fmars.2024.1437675
Received: 24 May 2024; Accepted: 16 July 2024;
Published: 08 August 2024.
Edited by:
Haosheng Huang, Louisiana State University, United StatesReviewed by:
Feng Liu, Sun Yat-sen University, ChinaZhigang Cao, Chinese Academy of Sciences (CAS), China
Copyright © 2024 Li, Chen, Ji, Zhong, Qi, Gong, Yu and Ke. This is an open-access article distributed under the terms of the Creative Commons Attribution License (CC BY). The use, distribution or reproduction in other forums is permitted, provided the original author(s) and the copyright owner(s) are credited and that the original publication in this journal is cited, in accordance with accepted academic practice. No use, distribution or reproduction is permitted which does not comply with these terms.
*Correspondence: Shenliang Chen, c2xjaGVuQHNrbGVjLmVjbnUuZWR1LmNu; Yinghai Ke, eWtlQGNudS5lZHUuY24=