 Alexandra N. Loginova1*
 Urban J. Wünsch2
 Monika Zabłocka1
 Aleksandra Cherkasheva1
 Beata Szymczycha1
 Karol Kuliński1
 Aleksandra Winogradow1
 Piotr Kowalczuk1
- 1Institute of Oceanology Polish Academy of Sciences, Sopot, Poland
- 2National Institute of Aquatic Resources, Technical University of Denmark, Lyngby, Denmark
The release of dissolved organic matter (DOM) from sediments serves as an important part of the carbon cycle. Here, we address pore water DOM quality and its release from shallow sediments (0–10 cm) of the central and southern Baltic Sea - Gdansk, Bornholm, and Eastern Gotland Basins - using excitation–emission matrix spectroscopy and size-exclusion chromatography. DOM release from sediments displayed spatial variability, with diffusive DOC fluxes ranging from 0.02 to 1.06 mmol m−2 d−1, and basin-averaged fluxes increased in the order Gotland < Bornholm < Gdansk. DOM qualitative characteristics also varied among investigated basins. In the oxygen-limited study sites from the Gdansk Basin, we observed elevated abundances of low apparent molecular weight DOM fraction and proteinaceous-like fluorescent DOM, while in the Bornholm Basin, pore water DOM was generally more humic-like and of higher apparent molecular weight. Pore waters from the deepest study sites in the Gotland Basin were qualitatively very similar to those of the pore waters from the upper sediment layers (0–4 cm) from all other investigated sites, suggesting little organic matter reworking at depth at those stations. Our results suggest that the spatial variability in the magnitude of DOM release may be linked to the qualitative differences of DOM in sediments.
1 Introduction
The Baltic Sea is a brackish water system, whose large area is strongly influenced by periodic or permanent oxygen deficit in the bottom water layers (Carstensen et al., 2014; Kuliński et al., 2022). Major oxygen supply to deep water layers is limited to episodic inflow events supplying oxygenated North Sea water, the so-called Major Baltic Inflows (MBIs), and the dissolved oxygen (DO) supplied via MBIs is shown to be fully utilized in the time frame of approximately 2 years (Meier et al., 2018). The rates of DO consumption are amplified likely due to the recently occurring eutrophication (Meier et al., 2018; Piontek et al., 2019). Consequently, oxygen-deficient areas (with <0.2 mg L−1 DO) have expanded in recent years in the Baltic Sea (Carstensen et al., 2014; Schmidt et al., 2021). Water column oxygenation state affects biogeochemical cycling of elements within and near the sediments, i.e., redox conditions. Thus, the effect of water renewal by MBIs has been inferred on the magnitude of, for instance, sediment fluxes of dissolved inorganic carbon (DIC) and ammonium (NH4+), as they are found to be enhanced during oxygen-limited or “pre-inflow” periods, compared to oxygenated “post-inflow” periods (Lengier et al., 2021). DIC and inorganic nutrients, such as NH4+, are the main products of particulate organic matter (POM) decomposition in sediments. The POM decomposition in sediments goes through the production of dissolved organic matter (DOM) in the process of microbial uptake (e.g., Komada et al., 2013). Thus, it has been previously shown that up to 10% of particulate organic carbon (POC) undergoing degradation may accumulate in the form of dissolved organic carbon (DOC) (Alperin et al., 1999; Burdige and Komada, 2015; Komada et al., 2016). The efflux of DOC into the overlying waters may, therefore, serve as an important escape mechanism of organic carbon from sediments (Ludwig and Probst, 1996; Burdige et al., 1999; Loginova et al., 2020). Previously, DOM efflux from sediments has been recognized to serve as an important source of recalcitrant DOM for the water column (Chen et al., 2016), and also DOM released by sediments is shown to contain geologically young DOC (Burdige et al., 2016; Komada et al., 2016) and to potentially support heterotrophic respiration (Burdige et al., 2016; Komada et al., 2016; Loginova et al., 2020) and, thus, e.g., deoxygenation and nitrogen loss (Kalvelage et al., 2013; Loginova et al., 2020). In the Baltic Sea, the release of DOC from sediments has been shown to constitute an important fraction (approximately 4% to 6%) of the total carbon budget during stagnation or pre-inflow period (Winogradow and Pempkowiak, 2014), and, similar to DIC, DOC fluxes are largely reduced during the post-inflow periods (Lengier et al., 2021). The quality of the DOM in sediments of the Baltic Sea has been, however, scarcely studied, although it is suggested that sedimentary-derived DOM may contain a large proportion of bioavailable substances, as inferred from very recent long-term pilot incubation (Lengier et al., 2024).
As DOM consists of a broad mixture of organic molecules of different stoichiometry and structure, which is still to be fully chemically characterized (Burdige and Komada, 2015; Repeta, 2015), the ultraviolet (UV)–visible absorption and fluorescence properties of DOM are shown to serve as reliable proxies for assessing the transformations in DOM quality in the water column (Coble, 1996; Zsolnay et al., 1999; Jørgensen et al., 2011; Kowalczuk et al., 2015; Catalá et al., 2016; Loginova et al., 2016) as well as in the sediment pore waters (Chen et al., 2016; Loginova et al., 2020). The light-absorbing, colored fraction of DOM is commonly referred to as chromophoric DOM (CDOM), while the fluorescent subfraction is referred to as fluorescent DOM (FDOM). Although fluorescent DOM fraction is not constant across the study areas, characterization of FDOM has previously recommended itself facilitating the distinction between proteinaceous (amino acid-like) and humic and fulvic-like DOM pools (Coble, 1996; Zsolnay et al., 1999; Jørgensen et al., 2011; Catalá et al., 2016; Loginova et al., 2016; Muller et al., 2024). In the Baltic Sea, FDOM characterization has revealed an accumulation of humic-like substances in deep water suggesting sediment release of recalcitrant DOM to the water column (Kowalczuk et al., 2015); another study from coastal sediments has suggested that protein-like FDOM may also likely be released from sediments in the southern Baltic Sea (Reader et al., 2019).
DOM molecular weight (MW) distribution is also an important indicator of DOM quality, i.e., degradability (Tranvik, 1990; Amon and Benner, 1994, 1996; Benner and Amon, 2015); as microbial communities assimilate small peptides and monomers, they primarily would hydrolyze larger molecules (Arnosti et al., 2005). Thus, the molecular size is inferred to be inversely related to ageing and reactivity of DOM (Tranvik, 1990; Amon and Benner, 1994; Benner and Amon, 2015; Asmala et al., 2016). In contrast, studies of plant-derived material degradation suggest that MW increase can go hand in hand with increasing recalcitrance (Cuss and Guéguen, 2015). The assessment of the molecular size distribution in sediment pore waters is shown to improve understanding of the mechanisms of DOM cycling in sediments during early diagenesis and is presented as the pore water size/reactivity (PWSR) model, where MW is shown to decrease with sediment depth as it goes through remineralization (Chin and Gschwend, 1991; Dang et al., 2014; Burdige and Komada, 2015). It is noteworthy also that the diffusion coefficient of natural DOM is dependent on its molecular size, and this dependence is expressed as a power function (Balch and Guéguen, 2015). In the Baltic Sea, DOM MW distributions, however, have been little studied. Therefore, the evaluation of DOM MW might further improve our understanding of processes influencing pore water DOM cycling and release in the Baltic Sea.
In this study, we aim to infer DOM release in central and southern Baltic Sea sediments from the measurements of MW and DOC gradients. By combining the pore water profiles of DOM, DOM MW, and FDOM pools, we also aim to characterize the quality of sedimentary DOM.
2 Methods
2.1 Study area description
Sample collection was carried out during six research cruises onboard RV Oceania between September 2020 and April 2021 (2020_Sept_Chem, 2020_Sept_opt, 2020_Oct_opt, 2021_Jan_Chem, 2021_Feb_opt, and 2021_Apr_Chem). The current study focused on three areas of the central and southern Baltic Sea, which are characterized by either temporary or sustained oxygen limitation in deep waters, i.e., Bornholm Basin (54.9–55.7°N/15.0–16.5°E) where average maximum depth was ~92 m, Gdansk Basin (54.3–55.0°N/18.5–20.0°E) with an average maximum depth of ~97 m, and Eastern Gotland Basin (56.0–57.5°N/18.5–21.0°E) where the deepest sampled station was 230 m deep and the average maximum depth was ~185 m (Supplementary Table S1). Those sites are characterized by distinct hydrological regimes and biogeochemical characteristics (Figure 1). Shortly, the Bornholm Basin is located in the vicinity of the shallow connection through the Danish Straits between the Baltic and North Seas. This area is the most affected by the deep-water renewal events, e.g., via major and minor episodic inflows, which are forced by the barotropic conditions induced by storm events in both winter and summer (Leppäranta and Myrberg, 2009), and, therefore, was characterized by relatively high water-column salinities, pH, and oxygen concentrations. The southernmost focus area, the Gdansk Basin, is mainly affected by the inflow discharge of the Vistula River. The river with a catchment exceeding 200,000 km2 and an average flow of approximately 1,000 m3 s−1 has been shown not only to freshen the waters of the Gdansk Basin but also to supply terrestrially derived POM, DOM, and inorganic nutrients, stimulating primary and secondary productivity, and thus, resulting in active bacterial growth and respiration (Wielgat-Rychert et al., 2013). It is notable that one of the stations in the Gdansk Basin, P1 (Supplementary Table S1), has been previously identified as an active methane seep site (Brocławik et al., 2020). Therefore, the presence of gas bubbles could potentially disrupt the sediment, impacting the solute gradients. Our northernmost study area, the eastern Gotland Basin, in turn, is a part of the Open Sea or the Baltic Propper; it is the deepest (>200 m) and the most remote from land, meaning that the influence of the rivers and the North Sea water inflow could be assumed to be minimal compared to the other two focus areas of this study, and therefore, the production of fresh organic matter in the area could be assigned primarily to autochthonous processes and deep-water transport of resuspended particles (Cisternas-Novoa et al., 2019).
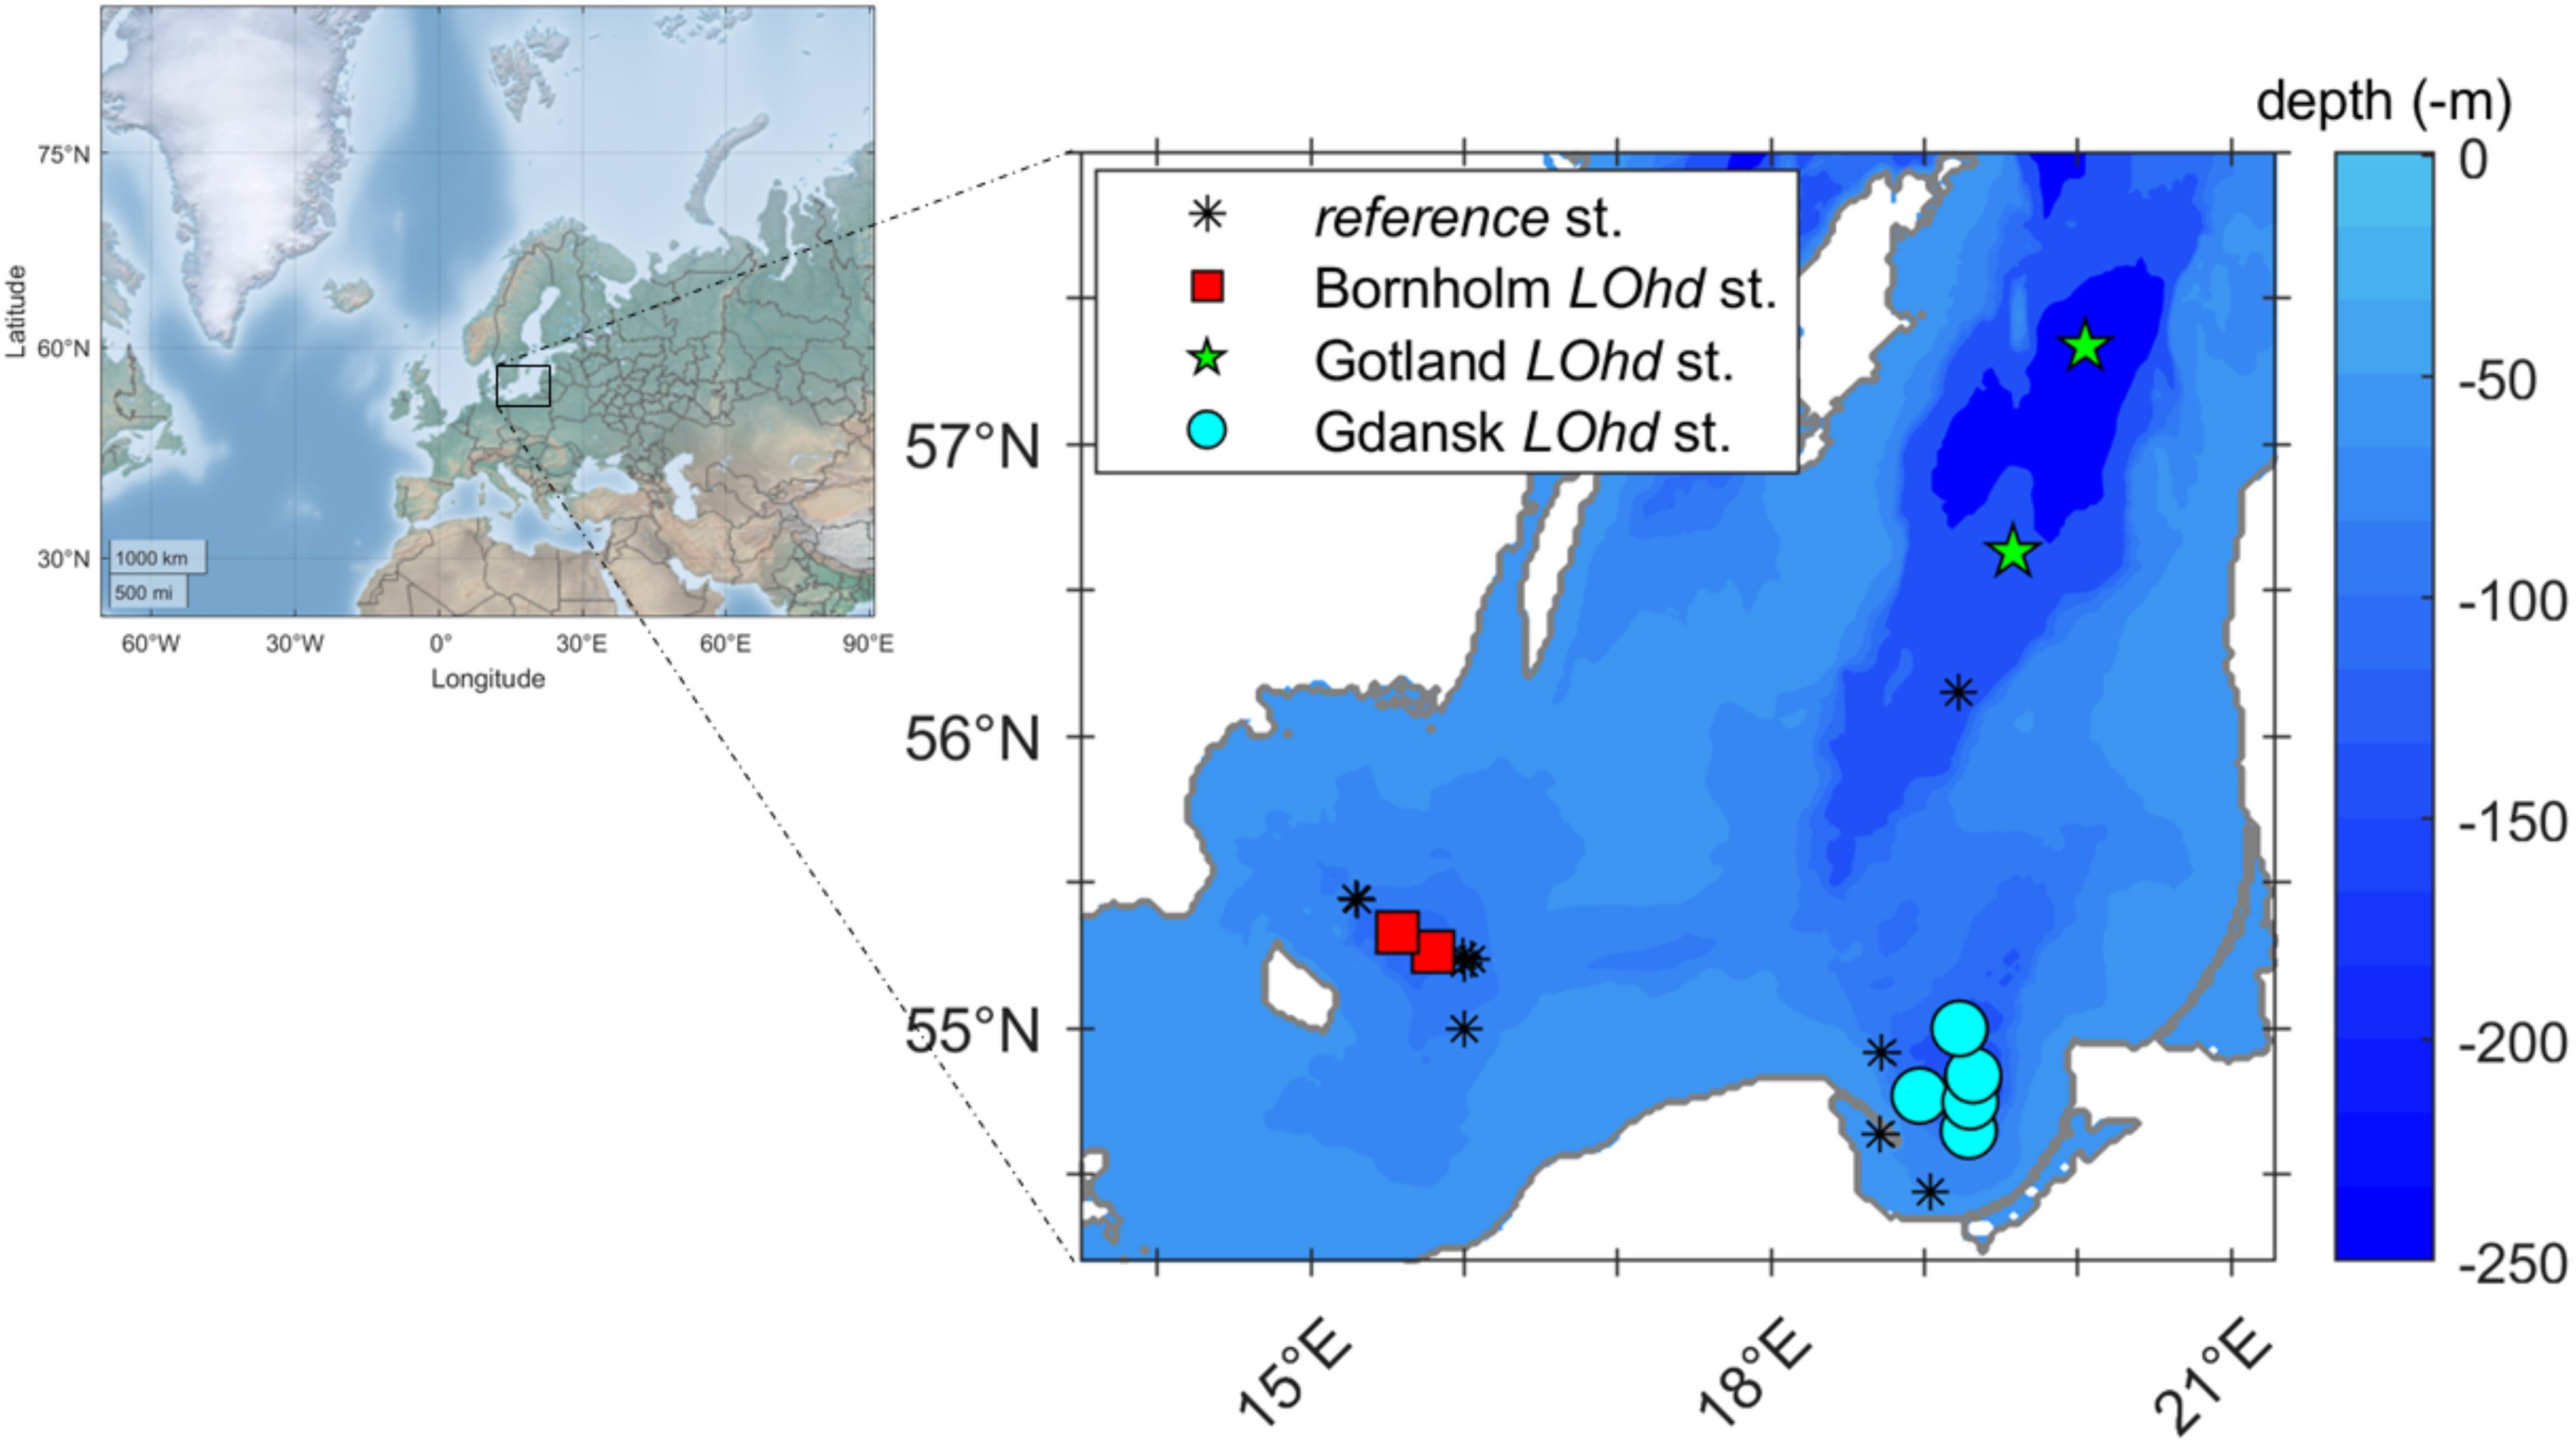
Figure 1. Sampling locations, i.e., Bornholm (red squares), Gdansk (cyan circles), and Gotland (green pentagrams) LOhd stations, respectively. Black stars represent reference stations. Baltic Sea bathymetry and landmark files were obtained from www.io-warnemuende.de (i.e., iow2_z_water and iow2_landmask) and are marked as the background color and gray line on the figure; maps were built using mapping toolbox for MATLAB (The MathWorks Inc.).
Furthermore, previous reports have indicated that the highest sediment linear accumulation rates are found in the Gdansk Basin (0.19 ± 0.04 cm yr−1), while the Gotland Basin is characterized by the lowest linear accumulation rates among our focus areas (0.07 ± 0.02 cm yr−1) (Winogradow and Pempkowiak, 2014), although a highly variable sedimentation rate of 0.09 ± 0.06 cm yr−1 has been also reported depending on the spatial coverage of sampling (Hille et al., 2006). In turn, POC accumulation rates are not significantly diverse among our study areas (Winogradow and Pempkowiak, 2014). In our study, the sediments showed no evidence of mixing by bioturbation; however, they were densely colonized by bacterial mats (nearly 100%), which have been previously shown to enhance inorganic matter fluxes (Noffke et al., 2016), and, potentially, reworking of organic matter released from sediments at the sediment–water interface (Lengier et al., 2024).
To separate stations that are likely affected by different environmental settings, for instance, the coastal-most stations P115 and MilPOM (Supplementary Table S1) strongly influenced by terrigenous input (Wielgat-Rychert et al., 2013; Szymczycha et al., 2020) and stations influenced by deep-water exchange with the North Sea (Ferry2 and Ideal1) (Döös et al., 2004; Porz et al., 2023) from deeper stations (BO1, M78, P1, P1a, P116, and BY15; Supplementary Table S1) that are likely affected by more stagnant deep waters at each of the investigated Basins, we classified investigated stations considering station depth, bottom water characteristics, and sediment porosity. Thus, DO in the near-bottom waters (2 cm above the sediment—measured immediately after sediment core recovery above the core water), bottom water pH (2 cm above sediment), and bottom water salinity and porosity of the uppermost sediment slice (0–2 cm) as indicated in Supplementary Table S1 were analyzed by principal component analysis (PCA) for each basin. In the Gdansk Basin, the variability was driven mainly by DO concentrations, station depth, salinity, and porosity (Supplementary Figure S1); in the Bornholm Basin, the variability was mainly driven by DO concentrations and station depth (Supplementary Figure S2). The stations that were isolated on the PCA (i.e., characterized by lower DO concentrations and were generally deeper) were therefore referred to as “Low Oxygen high depth (LOhd)” stations. The stations that did not group with LOhd stations on PCA were then treated and referred to as “reference” stations. An additional criterion was used for the isolation of LOhd stations in the Gotland Basin, as due to the small number of stations (three), PCA was not representative. There, LOhd stations were also isolated on the basis of nutrient profile similarity down the sediment core (Supplementary Figures S3A–F), meaning that two LOhd stations would undergo similar biogeochemical processes during diagenesis. Thus, all measured pore water parameters from the investigated LOhd stations were used for comparison between Bornholm, Gdansk, and Gotland Basins, and reference stations were used for comparison of DOM properties to LOhd stations in the Bornholm, Gdansk, and Gotland Basins, respectively.
2.2 Field sampling and sample preparation
The distribution and properties of DOM in the pore water, its fluxes, and nutrient composition were evaluated using analyses of DOC, CDOM, FDOM, and apparent MW, as well as nitrate and nitrite (NOx-), phosphate (PO43-), and NH4+ in sediment pore waters from cores obtained using the GeMax gravity corer (Winterhalter, 2001). In general, four sediment cores were recovered at each sampling station for pore water sampling. Sediment pore waters were collected using noninvasive Rhizon samplers (0.2 µm pore size; Rhizosphere Research Products B.V.) connected to polypropylene syringes with plungers immediately after recovery of sediment cores (Supplementary Figure S4). Noninvasive samplers were chosen to avoid the possibility of pore water DOM overestimation, which is characteristic of other procedures, such as centrifugation or whole core squeezing (Alperin et al., 1999; Komada et al., 2004). It is noteworthy that some of the syringes with plungers are pre-greased, which may affect DOM sample concentrations. For inferring the effect of syringes on DOM measurements in our study, we incubated those for approximately three to five times longer (1–2 h) than they could have been in contact with samples during the sample collection. The CDOM absorption measurements did not reveal any significant signal after the incubation; DOC was measured at 10 ± 2 (µmol/L) for n = 7, which was very close to the signal from syringes without plungers (13 ± 1 µmol/L for n = 3). We assumed both values as negligible compared to sample absorption and concentrations measured in our study (Supplementary Figure S5).
Pore waters were sampled from the upper 10 cm of the sediment with a 2-cm interval (at 0–2, 2–4, 4–6, 6–8, and 8–10 cm). The above-the-sediment core waters or bottom waters (BW) were also collected using the same sampling system 1–3 cm above the sediment–water interface simultaneously with the sediment pore water sampling. A sample pulled from the four sediment cores and BW was collected for every sampling interval and every parameter at each station. DOC samples were collected into 20-mL pre-combusted (8 h at 450°C) amber glass vials, acidified until pH=2 by adding 50 µL of HCl (36%, Suprapur, Merck) and stored in the dark and cold (+4°C) upon analyses. Forty-milliliter pre-combusted (8 h at 450°C) amber glass vials were used for storage of MW, CDOM, and FDOM samples. The latter were placed in the dark and cold (+4°C) immediately after sampling and were analyzed within 3 weeks after sampling, which is in agreement with the previously suggested procedure (Mannino et al., n.d). Nutrient samples were collected into 15-mL conical polypropylene tubes and shock-frozen immediately upon sampling (−80°C) and then placed in a freezer (−20°C) pending analyses. Additionally, one sediment core was collected at each station for slicing for further analysis of porosity and determination of POM content by ignition. For this, the upper 10 cm of sediments was sliced with a resolution similar to pore water sampling, that is, every 2 cm (0–2, 2–4, 4–6, 6–8, and 8–10 cm), packed in zip-lock bags and frozen (−20°C) until analysis.
DO, salinity, and temperature were recorded in the BW (~2 cm above the sediment surface) to characterize the initial conditions, using a ProfiLine Multi 197i meter (WTW, Germany), LF12 (SCHOTT® Instruments, SI Analytics GmbH), and pH11 electrodes (SCHOTT® Instruments, SI Analytics GmbH), respectively. It is noteworthy that a fully anoxic deep-water column in the Gotland Basin has been reported in a study, which is based on in situ profiling for a similar time frame (Kuliński et al., 2022). Therefore, one should keep in mind that our electrode DO measurements were generally restricted by the electrode’s detection limit and could overestimate the actual DO concentrations in anoxic waters. However, this likely overestimation did not influence our further approach to distinguishing between LOhd and reference stations.
2.3 Discrete sample analyses
DOC samples were analyzed by high-temperature catalytic oxidation (Pt) (680°C) using a total organic carbon analyzer (TOC-L, Shimadzu) equipped with a nondispersive infrared detector. The quality of the results was confirmed by daily analyses of certified reference material (CRM) (North Atlantic water) obtained from the Hansell Laboratory, University of Miami (recovery: 98.9%, RSD: 0.9%).
Nutrient analyses were performed after Hansen and Koroleff (2007) using the SEAL AA500 AutoAnalyzer (Seal Analytical). The quality of the measurements was controlled by repeated measurements of two different CRMs, QC3179 (Sigma Aldrich) and HAMIL-20.2 (Environment Canada). Therefore, the detection limits of 0.33 µmol L−1 for NOx-, 0.27 µmol L−1 for NH4+, and 0.1 µmol L−1 for PO43- were determined with an accuracy of 98.6%, 98.8%, and 99.0% and a precision of 0.7%, 1.1%, and 0.5% for NOx-, NH4+, and PO43-, respectively.
The porosity of the sediment cores was calculated by the loss of water during drying (80°C) for ~24 h (or until the complete loss of moisture). The exact procedure is described elsewhere (Zaborska et al., 2008), and the POM content was determined by weight loss through ignition (4 h at 450°C) and was evaluated as loss of ignition index (LOI) in percent.
CDOM absorbance was measured using a Perkin Elmer Lambda 600 UV–vis double beam spectrophotometer using a 2-cm Quartz precision cell (Perkin Elmer). Absorbance spectra were recorded at 1-nm wavelength intervals from 230 to 750 nm against Milli-Q water as a reference. CDOM absorbance spectra were corrected for particle scattering (Nelson and Siegel, 2013) and recalculated to absorbance equivalent to 1-cm path length, which was then used for corrections of FDOM intensity recordings.
FDOM was analyzed via the A-TEEM™ technique using the AQUALOG optical spectrometer (HORIBA Scientific). Fluorescence measurements for samples were done in a four‐optical-window 1-cm Quartz precision cell (Perkin Elmer). Blank and water Raman scans were performed daily using an ultrapure water standard sealed cell (3/Q/10/WATER; Starna Scientific Ltd). The experimental wavelength range for samples and ultrapure water was 241 to 550 nm in increments of 3 nm at excitation and 250 to 828 nm at emission (resolution, 2.389 nm). Water Raman scan tests were recorded daily (Murphy et al., 2013). All fluorescence measurements were performed at room temperature at medium speed with a 2-s integration time. The fluorescence excitation–emission matrixes (EEMs) were corrected for spectral bias, background signals, and inner filter effects, and normalized to the Raman-peak area of ultrapure water. The resulting 213 EEMs were analyzed by parallel factor analysis—PARAFAC (Stedmon and Bro, 2008)—and validated by split-half analysis using the drEEM toolbox for MATLAB (The MathWorks Inc.) after Murphy et al. (2013). The resulting seven-peak model was then compared against the OpenFluor database (Murphy et al., 2014). The components that were excited at the UV–visible light spectrum and emitted light at the visible spectrum (H1–H4) were referred to as humic-like FDOM components, as similar by spectral properties components have been referred to as humic-like and fulvic-like in numerous studies (Coble, 1996; Stedmon et al., 2003; Aiken, 2014; Osburn et al., 2015; Wauthy et al., 2018; Yang et al., 2024). The fluorescent components that were excited and also emitted light in the UV spectrum, AA1 and AA2, have been previously classified as amino acid-like components (e.g., Coble, 1996; Guéguen et al., 2015; D’Andrilli et al., 2017; Bernal et al., 2018), and therefore, we referred to them as likely bioavailable proteinaceous DOM. A component that was excited at the UV spectrum and emitted light at 390 nm had similar optical properties to the marine humic-like fluorescent Peak M first found in the ocean and has been previously referred to as microbially derived humic-like DOM (e.g., Coble, 1996; DeFrancesco and Guéguen, 2021); we, therefore, referred to it as microbial humic-like component (MH1). The intensities of the seven FDOM components (H1–4, AA1–2, and MH1) that were identified during the PARAFAC (Supplementary Figure S6) are further expressed in Raman units (RU).
2.4 Size-exclusion chromatography
Size-exclusion chromatography (SEC) was performed using a Shimadzu Nexera X2 UFLC system equipped with a TSKgel SuperAWM-H column. DOM was eluted with 0.15 M ammonium acetate (pH 7), and two sequential detectors were used. Absorbance was measured between 240 and 600 nm at 2-nm intervals using a Shimadzu SPD-M30. Retention times were converted to apparent molecular size on the basis of a calibration curve using polystyrene sulfonate standards. It is notable that the hydrodynamic characteristics of polystyrene sulfonate may not fully reflect those of natural DOM; therefore, the molecular sizes calculated from the calibration with polystyrene sulfonate should be viewed as operational and the reported values should be interpreted as rather an apparent molecular size, as different calibration standards may result in different size-distribution patterns (Egeberg and Alberts, 2003; Peuravuori et al., 2005; Wünsch et al., 2017).
2.5 Data analyses
Publicly available primary production (PP) data (in mg C m−2 d−1) of Global Ocean Color (Copernicus-GlobColour: Bio-Geo-Chemical, Level 4 global, monthly and interpolated) from Satellite Observations were used to evaluate mean summer primary production in the investigated areas for periods from June to August for the years 2020–2022 using the Antoine and Morel (Antoine and Morel, 1996) algorithm (Supplementary Figure S7). The PP was estimated for the Bornholm Basin, defined as the area between 54.9–55.7°N and 15.0–16.5°E; the Gdansk Basin, defined as the area between 54.3–55.0°N and 18.5–20.0°E; and the eastern Gotland Basin, defined as the area between 56.0–57.5°N and 18.5–21.0°E.
For diffusive flux calculations of DOC, DOC concentrations in BW and pore water DOC concentrations from the uppermost sampling interval of the sediment core (0 to 2 cm depth) were used. The fluxes (JDOC) were evaluated according to Fick’s first law of diffusion:
where ϕ is the sediment porosity, is the gradient of DOC concentration over the investigated depth interval (0 to 2 cm), and Ds is a bulk sediment diffusion coefficient. Ds has been previously demonstrated to be dependent on the sediment formation resistivity factor (F) (Ullman and Aller, 1982). In this study, we calculated Ds using F that equals ϕ −3, as ϕ measured at our area of study exceeded 0.8–0.9 (Ullman and Aller, 1982). Ds has also been shown to negatively depend on an average MW of DOM (Burdige et al., 1992; Balch and Guéguen, 2015). In this study, a weighted average MW (AMW) was calculated from SEC chromatograms for each sample, and the AMW evaluated for the pore water at 0–2 cm at each station was incorporated into Ds after Balch and Guéguen (2015):
where AMW is the weighted average apparent MW.
The calculated fluxes were then presented as individual bubbles and an average value for the LOhd and reference stations, and the error bars of the fluxes were estimated as the standard deviation of the evaluated fluxes for stations within these areas. In this study, fluxes directed out of sediment were reported as positive values.
For AMW, the spectral slope value between 275 and 295 nm (S275-295) was evaluated for each absorbance spectrum using log-transformed linear regression during SEC analyses at every second of retention time. The retention time was then converted into apparent MW after calibration and AMW was inferred. Furthermore, absorbance at 350 nm recorded at each second of the SEC analyses was used for further fractionation of apparent MW (Asmala et al., 2021). For this, each SEC–absorbance chromatogram was fitted with three Gaussian peaks using the “peakfit” function (Tom O’Haver, 2023) in MATLAB (The MathWorks Inc.); no baseline correction was performed, as it gave the least relative fit error and the highest determination coefficient compared to methods where baseline corrections were used (Supplementary Figure S8). The three peaks were referenced as low molecular weight (LMW) for peaks centered at retention times equivalent to an apparent MW of ~100–500 Da, medium molecular weight (MMW) for peaks centered at retention times equivalent to an apparent MW of ~500 Da to 1 kDa, and high molecular weight (HMW) for peaks centered at retention times equivalent to an apparent MW of greater than 1 kDa for further analyses. The areas under the Gaussian peaks were referred to as abundances of corresponding MW fractions and are indicated as aLMW, aMMW, and aHMW, for apparent LMW, MMW, and HMW fractions, respectively.
PCA for pore water samples utilizing DOM parameters, such as abundances of apparent MW fractions, FDOM components (H1–4, AA1–2, and MH1) and DOC, and nutrients and LOI, was performed using the “FactorMiner” package in R (Sebastien et al., 2008). PCA was applied to better characterize the linkages between MW, DOM optical properties, and remineralization at areas of interest.
3 Results
3.1 Study area
Our sampling was carried out in three distinct depositional areas of the central and southern Baltic Sea, which are influenced by either permanent or temporary oxygen deficit, that is, Bornholm Basin (54.9–55.7°N/15.0–16.5°E), Gdansk Basin (54.3–55.0°N/18.5–20.0°E), and eastern Gotland Basin, hereafter referred to as Gotland Basin (56.0–57.5°N/18.5–21.0°E) (Figure 1). The closest to the Danish Straights, Bornholm Basin was relatively less productive (Supplementary Figure S1) and was generally most impacted by the influence of the water inflow from the North Sea (Rak et al., 2020), obtaining the highest BW salinities compared to the other two study areas. The LOhd stations in the Bornholm Basin were the ones that exhibited lower BW DO concentrations (0.5 ± 0.1 mg L−1; Supplementary Table S1; Figure 1), compared to reference stations (1.3 ± 0.3 mg L−1; Supplementary Table S1). In the Gdansk Basin, LOhd stations BW exhibited DO concentrations of 0.8 ± 0.5 mg L−1 (Supplementary Table S1), while reference stations’ DO was measured at 3.4 ± 0.5 mg L−1 (Supplementary Table S1). BW DO concentrations at the Gotland Basin were generally low, compared to the two other study areas. Thus, we measured 0.4 ± 0.1 mg L−1 DO (Supplementary Table S1) in the BW at Gotland LOhd stations, while at the Gotland reference station, DO concentration was 0.7 mg L−1. All the LOhd stations were characterized by dark-olive muddy sediments with porosities larger than 0.94, while the reference stations consisted of muddy and muddy to sandy sediments with porosities ranging from 0.81 to 0.97 (Supplementary Table S1).
We observed the highest accumulation of NH4+ in the Gdansk Basin (Supplementary Figures S3E, F) in the pore waters of the upper 10 cm of sediment, suggesting the most active remineralization of organic matter within the study sites. The fast disappearance of NOx- (Supplementary Figures S3C, D) indicates rapidly reached anoxic conditions along the sediment profiles at LOhd stations. The slight increase in NOx- at the sediment–water interface at the Gdansk and Bornholm LOhd stations and Gdansk and Gotland reference stations (Supplementary Figures S3C, D) suggests the presence of redoxcline in the bottom waters close to the sediment surface. This is not the case for the Gotland LOhd stations, where little presence of oxidized forms of nitrogen indicates that the redoxcline was likely located in the water column, and also for Bornholm reference stations, at some of which NOx- could be traced down to maximum sampling depth (10 cm). Profiles of PO43- (Supplementary Figures S3A, B) exhibited a typical shape for the anoxic and organic matter-rich sediments, suggesting PO43- being released to the water column. Notably, the sediment POM evaluated as LOI (%) in our study (Supplementary Figures S3G, H) was the most abundant at the Gotland LOhd stations, which exhibited the lowest concentrations for all the other parameters (Supplementary Figure S3G), suggesting the likely increased preservation of POM within shallow sediments at those sites, compared to other LOhd stations.
3.2 Sediment release of DOM
DOC concentrations ranged from 136 µmol L−1 to 1.8 mmol L−1. At all three basins, at LOhd and reference stations, we observed an accumulation of DOC concentrations with increasing sediment depth (Figures 2A–C). The highest concentrations of DOC were observed in the Gdansk Basin (Figure 2B), followed by the Bornholm (Figure 2A) and Gotland (Figure 2C) Basins, respectively. Generally, the distribution of DOC in LOhd and reference stations did not show major differences.
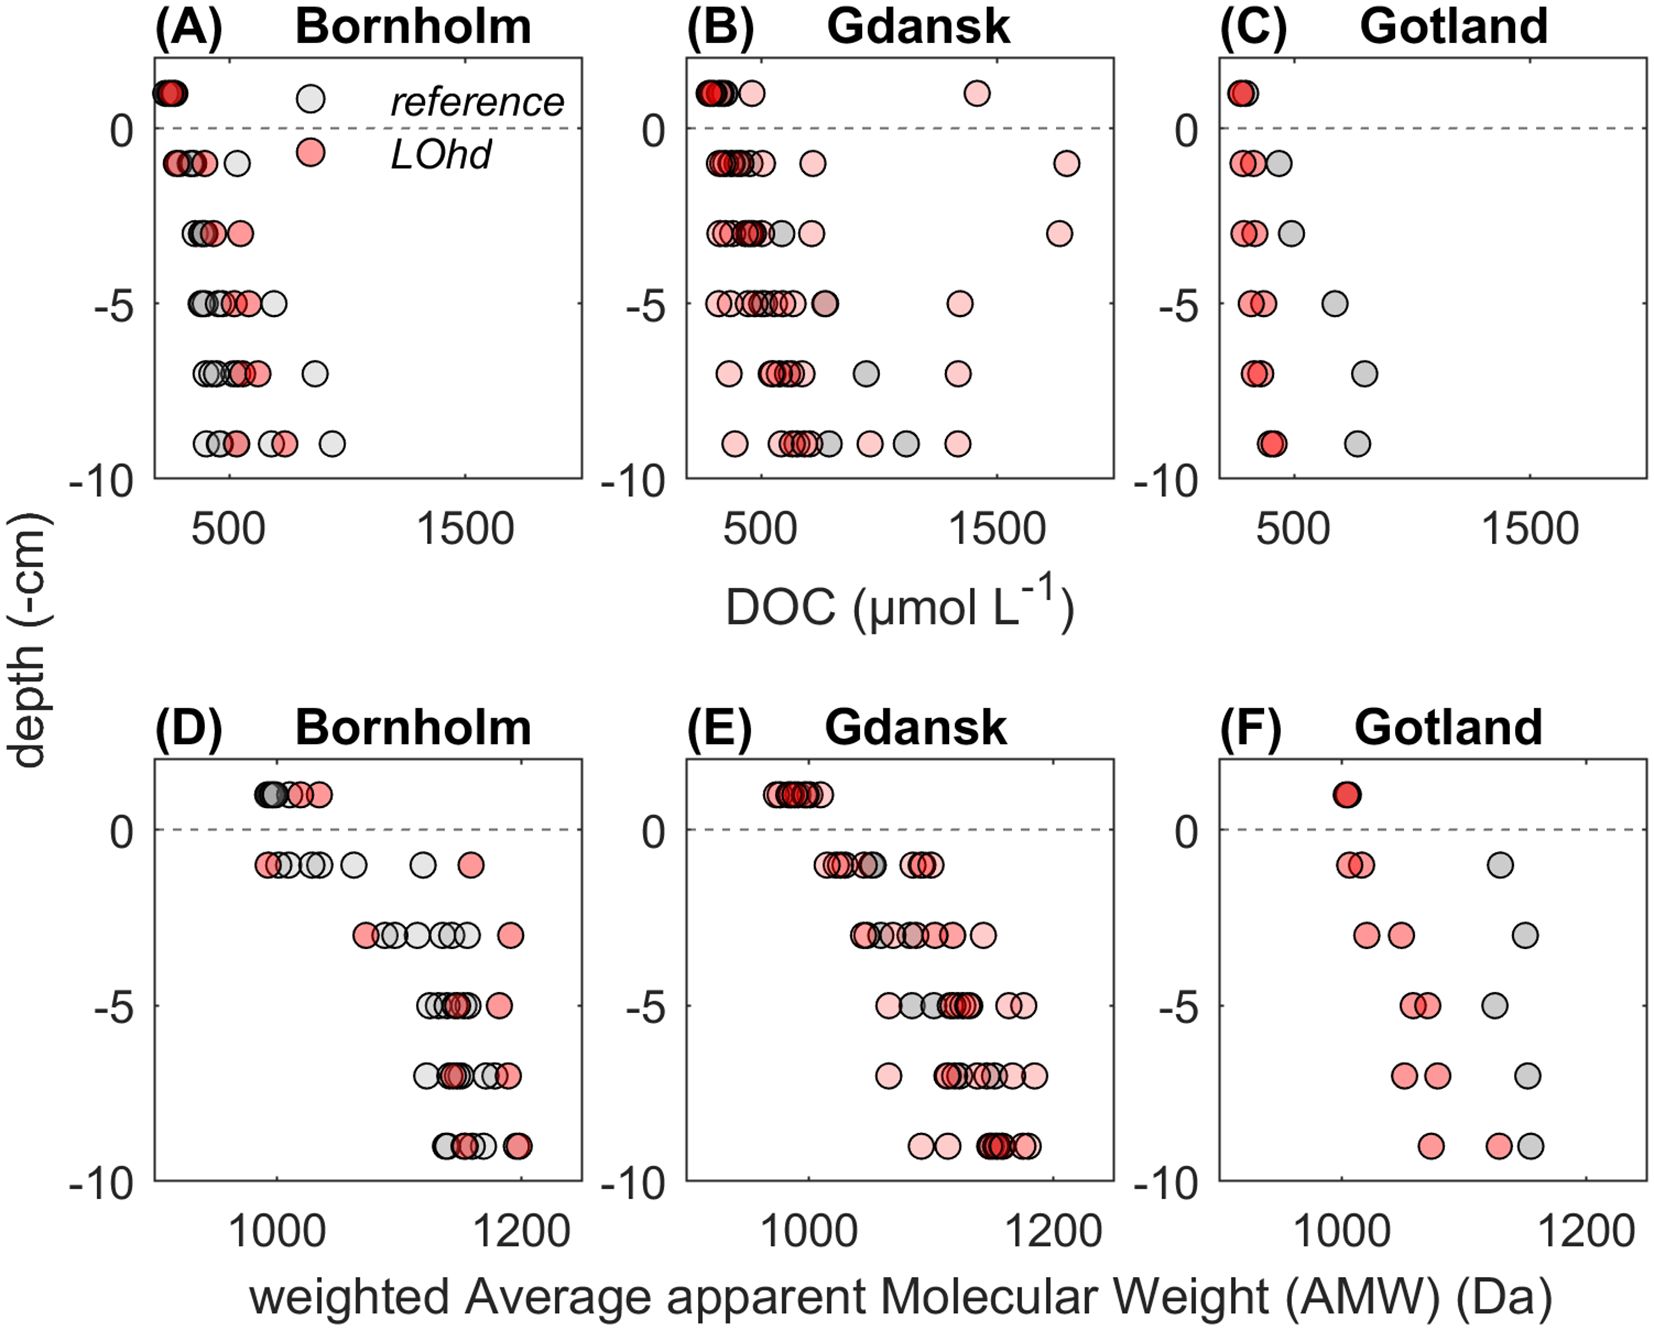
Figure 2. DOC (in µmol L−1) concentrations in sediment pore waters and bottom water (BW) in LOhd (in red) and reference (in gray) stations at Bornholm (A), Gdansk (B), and Gotland (C) Basins, and AMW (in Da) in sediment pore waters and BW in LOhd (in red) and reference (in gray) stations at Bornholm (D), Gdansk (E), and Gotland (F) Basins.
The AMW in our study ranged from 0.9 to 1.2 kDa with consistent increases towards deeper sediment layers (Figures 2D–F). On average, AMW did not seem to differ largely between LOhd and reference stations, and we could notice differences in the Gotland Basin, where reference station pore water DOM was generally larger than that of LOhd stations; however, this difference might have been caused by the low number of compared stations.
Sediment diffusive fluxes of DOM (JDOC) evaluated by Equation 1 exhibited highly variable rates among investigated sites (Figure 3A), allowing us to elucidate not statistically significant but apparent differences between averaged JDOC estimates. In Gotland and Bornholm Basins, the reference stations exhibited higher JDOC, compared to those of the LOhd stations (Figure 3B). In LOhd stations, the maximum JDOC (1.06 mmol m−2 d−1) and the highest mean JDOC were found in the Gdansk Basin, followed by the JDOC of the Bornholm Basin. In turn, the minimum JDOC (0.02 mmol m−2 d−1) and the lowest mean JDOC were measured at the Gotland LOhd stations.
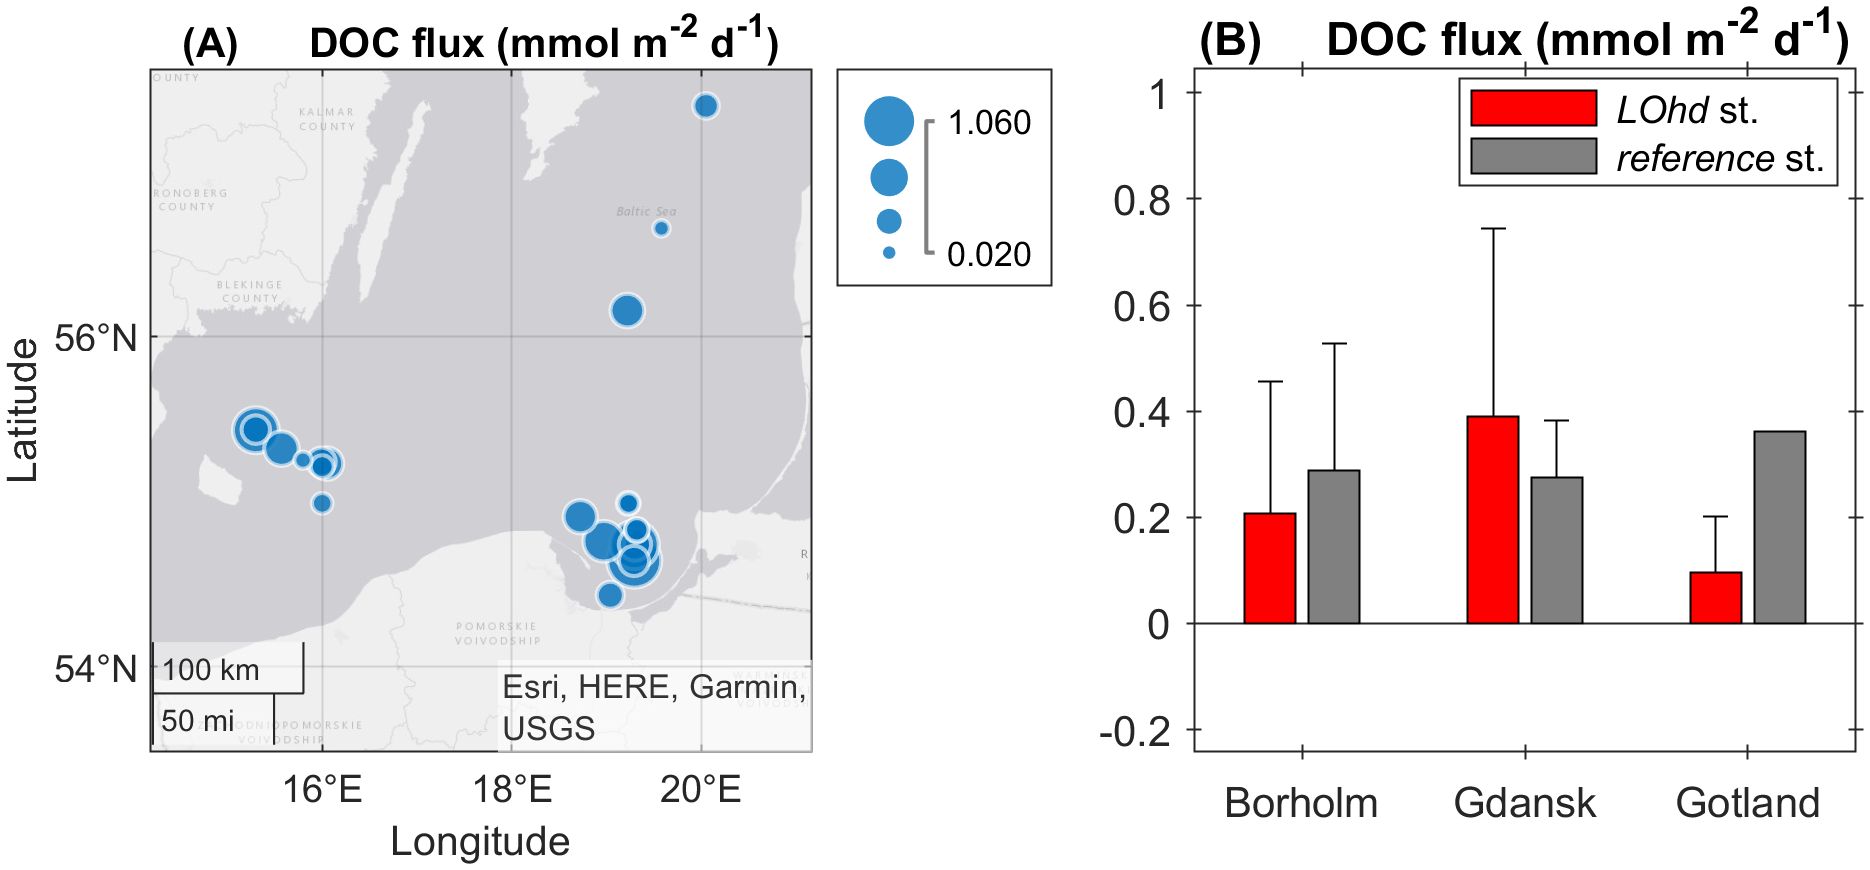
Figure 3. DOC diffusive fluxes (JDOC) at the investigated sites, the magnitude presented as bubble size (A) and area-averaged JDOC in Bornholm, Gdansk, and Gotland LOhd (red) and reference (gray) stations (B). The error bars represent the standard deviation of the JDOC in the corresponding area.
3.3 Regional differences in DOM properties
The seven-FDOM-component model was validated using PARAFAC (Stedmon and Bro, 2008); fingerprints of four humic-like (H1–4) (Supplementary Figures S4A, B, E, F), one microbial humic-like (MH1) (Supplementary Figure S4C), and two amino acid-like (AA1–2) (Supplementary Figures S4D, G) FDOM components could be inferred. Regardless of classification, all FDOM components displayed higher intensities with increasing sediment depth (Figures 4A–N). Notably, we observed regional differences in FDOM distribution between the three LOhd stations. Intensities of humic-like (H1-3) and marine humic-like (MH1) fluorescence increased at a comparable rate in the Bornholm and Gdansk LOhd stations (Figures 4A, C, E, I). We found a similar pattern for the AMW distribution in pore waters (Figure 4O). In comparison, humic-like H4 (Figures 4M, N) behaved differently; it was relatively enriched in the Gdansk LOhd and reference stations and depleted at the LOhd and reference stations of the Gotland Basin. A first amino acid-like FDOM component—AA1—was enriched in Gdansk LOhd stations compared to Bornholm LOhd stations and Gotland LOhd stations, suggesting more proteinaceous characteristics of DOM in that area (Figure 4G). Gotland LOhd stations showed generally lower fluorescence intensities and lower fluorescence intensification with depth of the abovementioned FDOM components compared to the other two areas of the study (Figures 4A, C, E, G, I). In comparison, reference stations exhibited little regional differences for the abovementioned FDOM components and AMW between Gotland and the other two basins (Figures 4B, D, F, H, J, P). Amino acid-like AA2 (Figures 4K, L) was relatively enriched in reference compared to LOhd stations. Basin-wise, AA2 showed little regional differences at LOhd and reference stations.
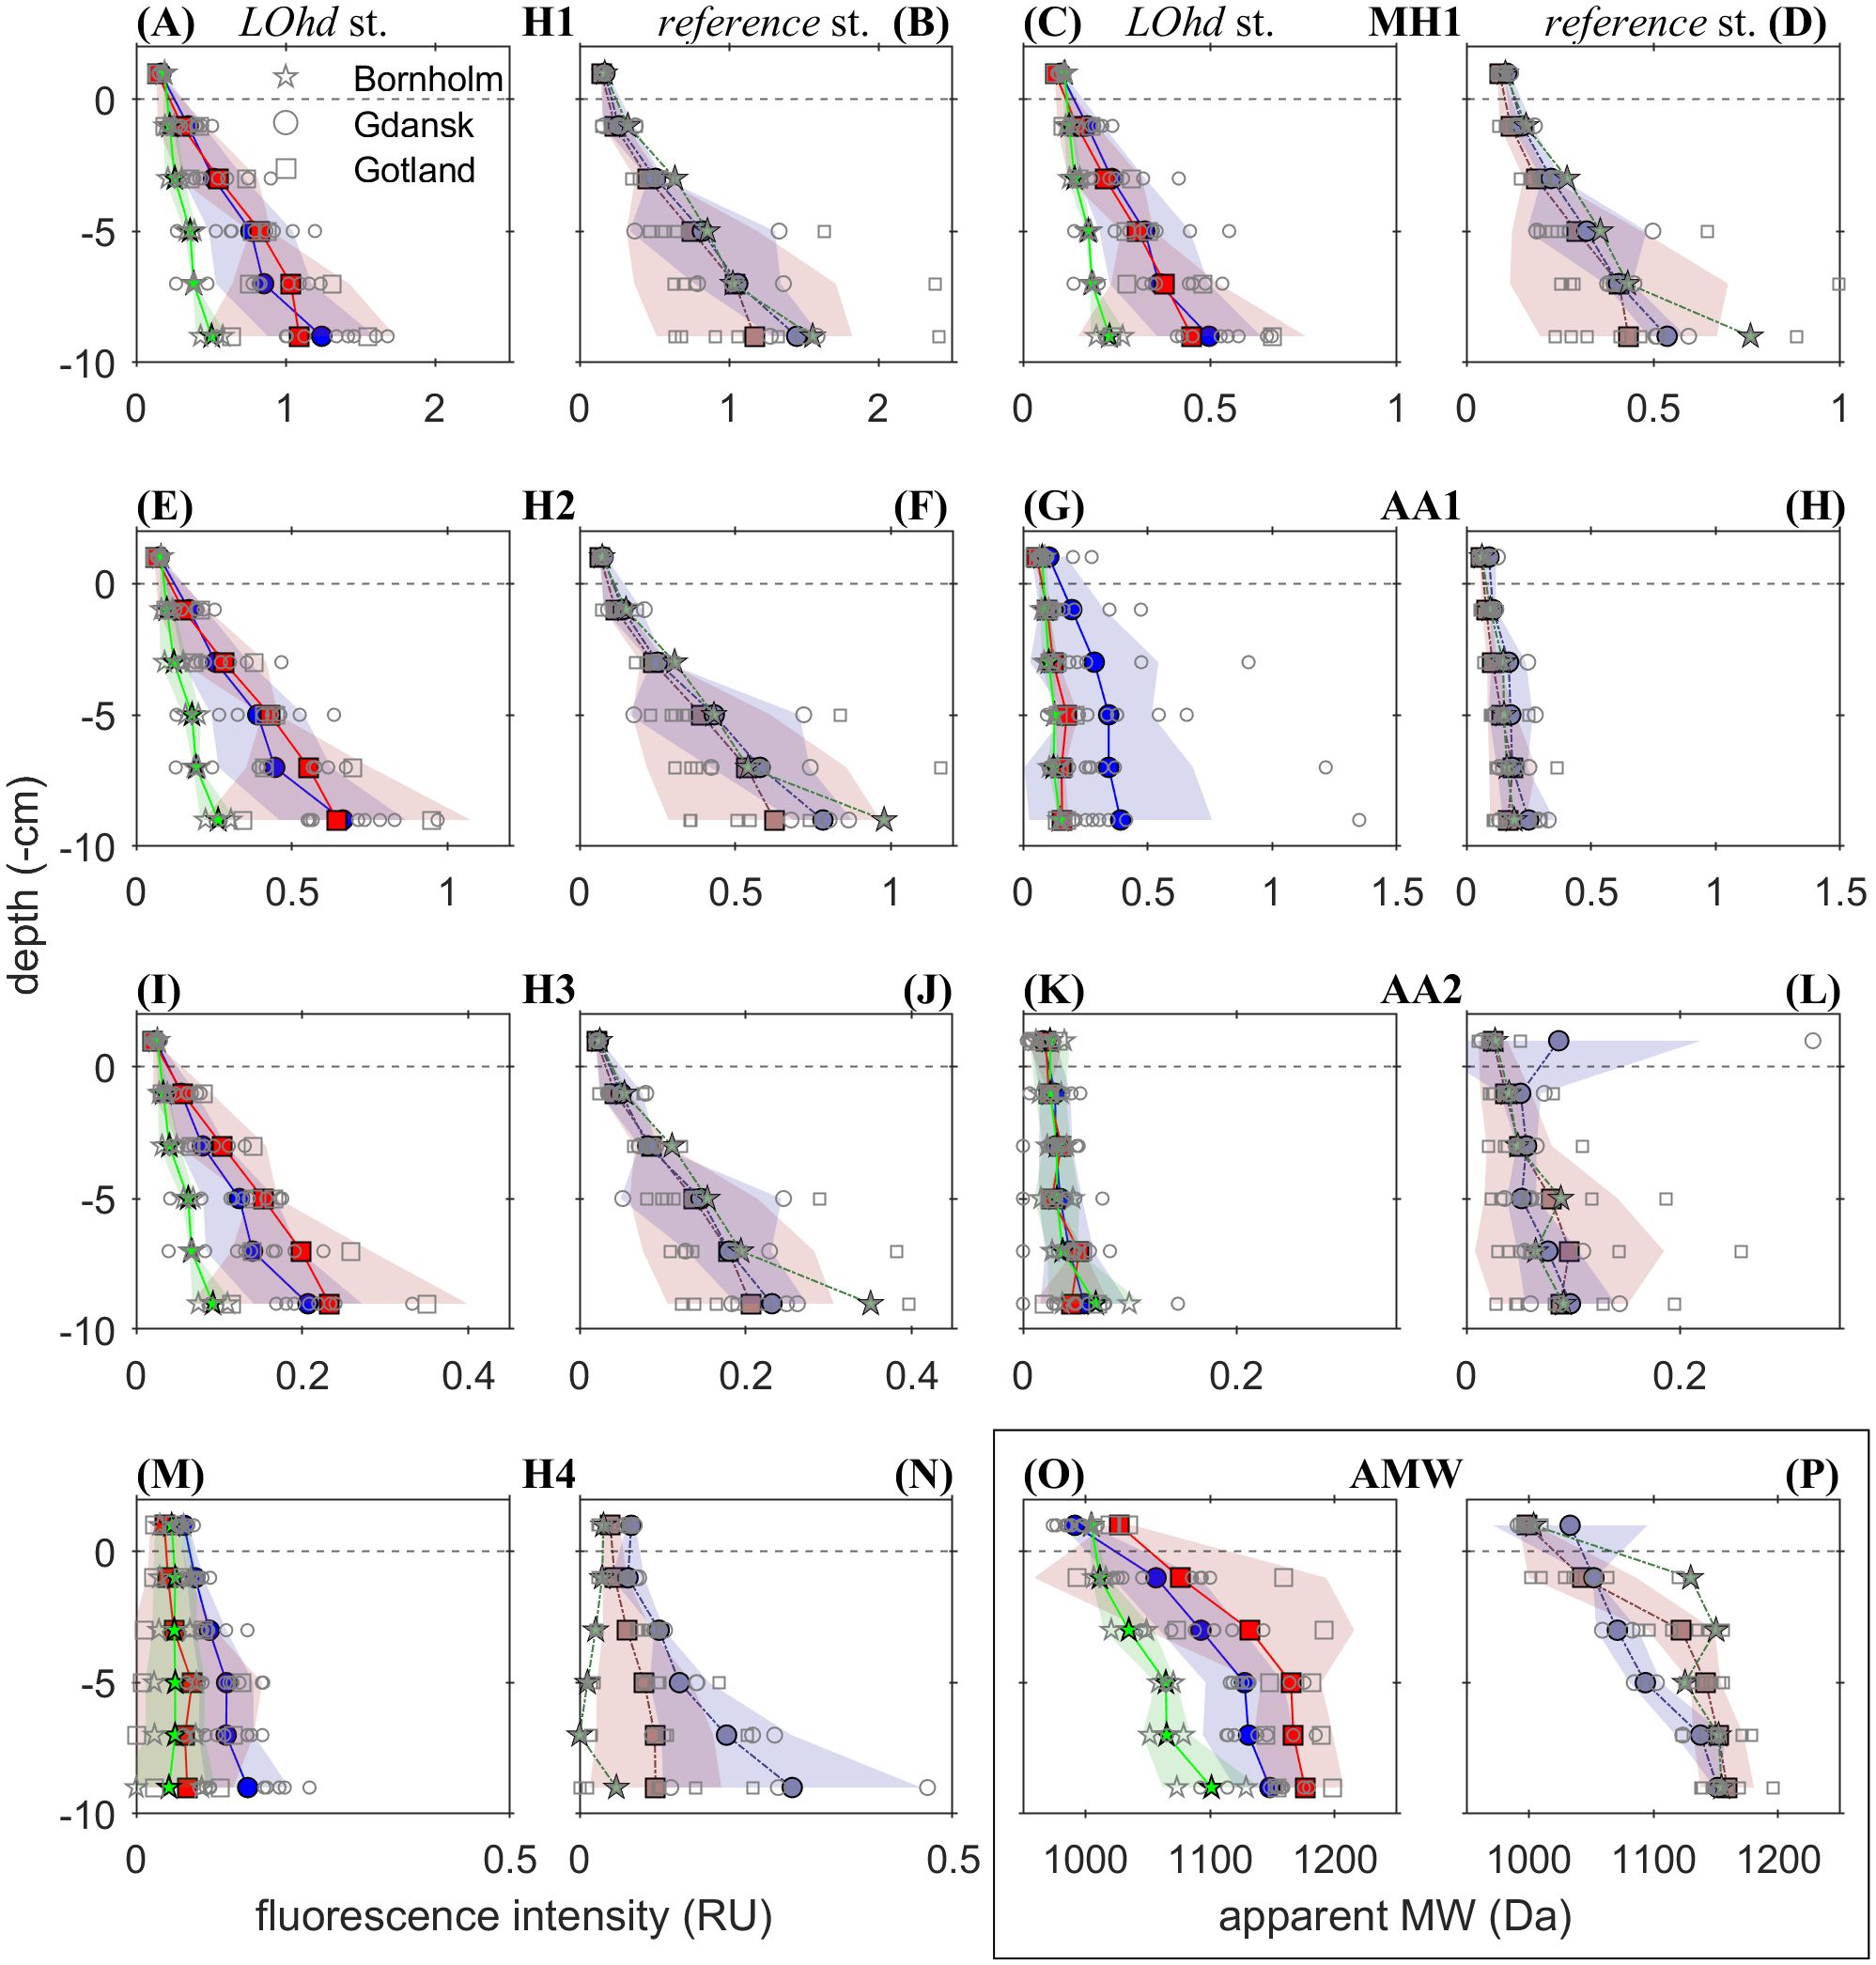
Figure 4. The distribution of FDOM intensity in Raman units (RU) of components resulting from PARAFAC analyses, namely, humic-like components H1, H2, H3, and H4 at stations referred to as LOhd (A, E, I, M, respectively) and reference (B, F, J, N, respectively), microbial humic-like component MH1 at stations referred to as LOhd (C) and reference (D), and also amino acid-like components AA1 and AA2 at stations referred to as LOhd (G, K, respectively) and reference (H, L, respectively). Subplots (O) and (P) show the averaged AMW within sediment pore waters at the LOhd and reference stations, respectively. The colored symbols and lines present the mean value calculated for Bornholm (in red squares), Gdansk (in blue circles), and Gotland (in green pentagrams) LOhd stations, and for Bornholm (in gray-red squares), Gdansk (in gray-blue circles), and Gotland (in green-gray pentagrams) reference stations. The shaded areas of the corresponding color represent the standard deviation of the corresponding average estimate. The dotted gray line represents the sediment–water interface. Scatter plots with open circles, squares, and stars represent individual profiles of corresponding parameters from Gdansk, Bornholm, and Gotland LOhd and reference stations on each plot, respectively.
Generally, at reference stations, the integrated over sediment column of 10 cm weighted average values of aLMW, aMMW, and aHMW were distributed in the order Bornholm > Gdansk > Gotland. A similar distribution pattern was observed for the integrated over sediment column of 10 cm weighted average aHMW DOM at LOhd stations (Figure 5A). Similar calculations performed for aLMW and aMMW, in turn, suggested that MMW DOM abundance was similar at Gdansk and Bornholm LOhd stations, and LMW DOM was more abundant at LOhd stations of the Gdansk Basin compared to the other two LOhd study sites (Figure 5A).
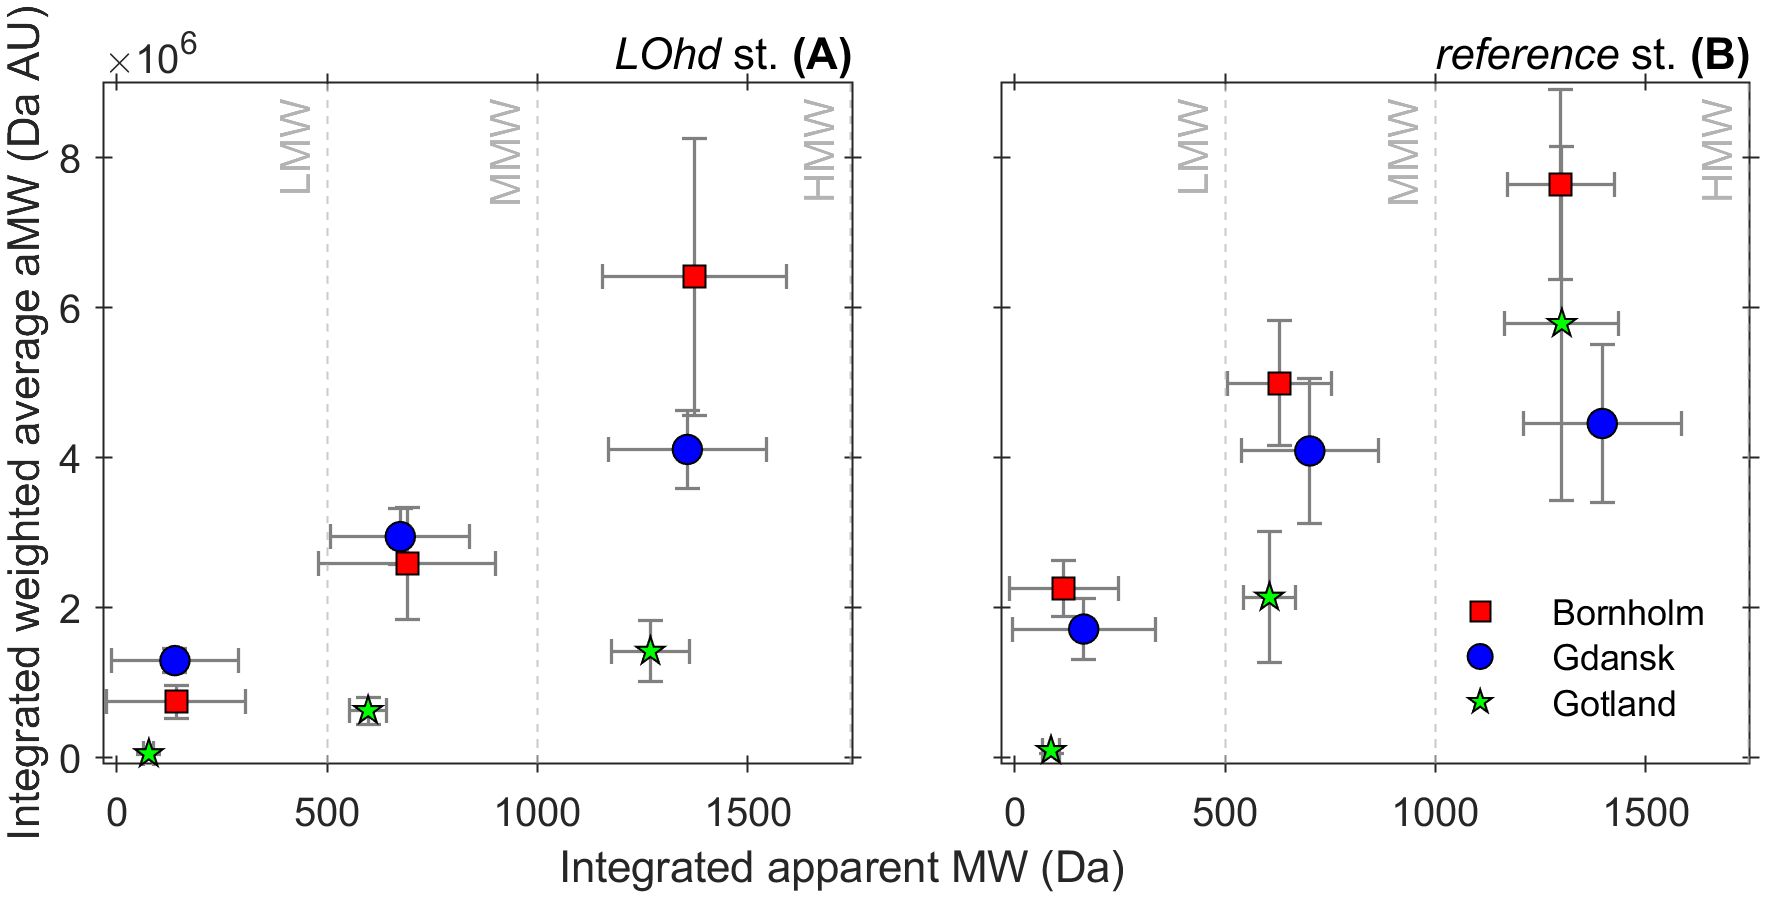
Figure 5. Sediment column averaged apparent MW in Da and their variability (error bars on the x-axis calculated as standard deviation from the mean), versus their abundances presented as sediment column weighted averaged aMWs and variability (error bars on the y-axis, calculated as standard deviation from the mean) for Bornholm (in red squares), Gdansk (in blue circles), and Gotland (in green stars) LOhd stations (A) and reference stations (B). The sediment column averages were calculated for stations by including all investigated depth intervals from 0 to 10 cm. The apparent MW from <100 to ~500 Da was referred to as low molecular weight (LMW); ~500 Da to 1 kDa, medium molecular weight (MMW); and MW larger than 1 kDa, high molecular weight (HMW) DOM.
As follows, PCAs showed that the aMMW and humic-like DOM accumulation were major contributors to the first principal component (PC1). This component could explain 53% of the variance in the dataset (Figure 6), whereas the loadings of aLMW, NOx- concentrations, and amino acid-like AA1 and AA2 were higher on the second PC (PC2), suggesting that PC2 (explaining ~11% of variability) was driven by variance in proteinaceous organic matter (Figure 6). In turn, the variance of LOI, aHMW, NH4+, DOC, and humic-like H4 had a combined effect on PC1 and PC2. The highest individual variance on PC1 was observed for Gdansk and Bornholm Basin samples of the pore waters of the greatest sediment depths, while the separation of samples from LOhd and reference stations at each basin, as well as the distinction between Gdansk and Bornholm Basins on PC2, is rather driven by the aHMW and aLMW and two amino acid-like fluorescent components. This highlights the qualitative differences between those areas. In turn, the individual variance of samples collected from pore waters at the Gotland LOhd stations grouped with the individual variance of samples collected from Gdansk and Bornholm Basins’ pore waters from the uppermost sampling intervals (0–4 cm) on both PCs. This similarity hints at relatively limited organic matter in situ transformations within the Gotland LOhd sediments at depth (Figure 6).
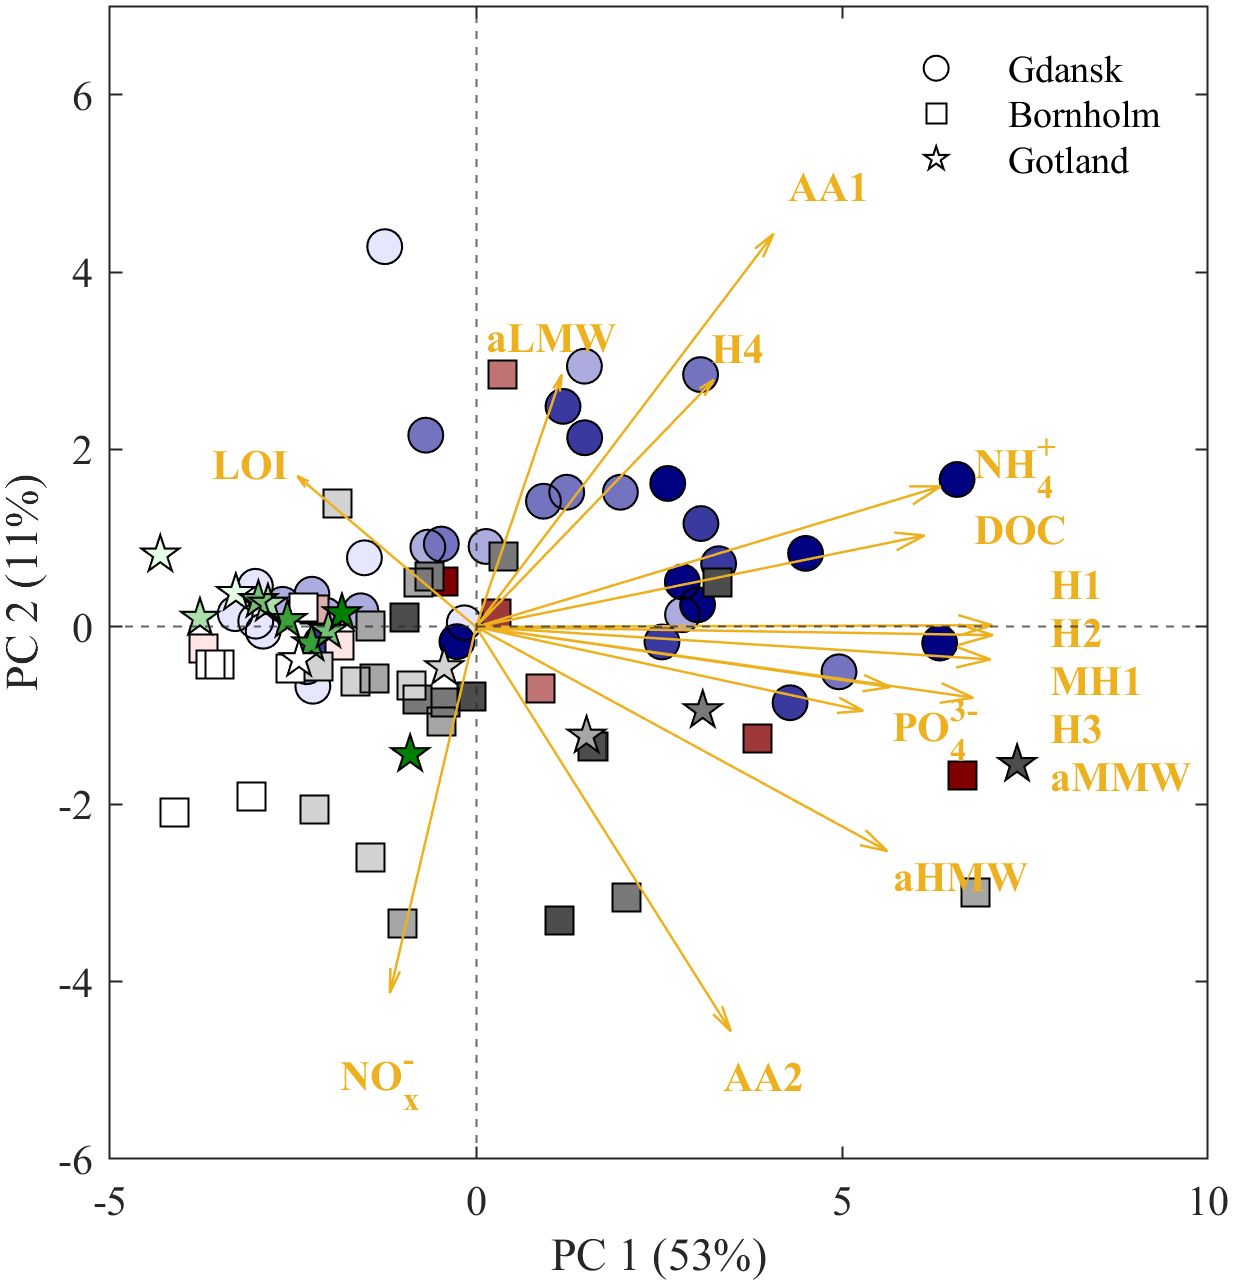
Figure 6. Principal component analysis biplot illustrating variance in DOM quality between sample locations. Symbols depict individual variance of samples (n = 99) from Bornholm (red squares), Gdansk (blue circles), and Gotland (green pentagrams) LOhd stations and Bornholm (gray squares), Gdansk (gray circles), and Gotland (gray pentagrams) from reference stations. The intensity of the shade of the color depicts the sediment depths at which samples were collected [the darker the shade, the deeper the depth interval, where the sample was collected (0–10 cm)]. Yellow arrows represent the strength of variability induced by variables aLMW, aMMW, and aHMW, H1–4, AA1–2, MH1, LOI, and NOx-, PO43-, and NH4+ on PC1 and PC2.
4 Discussion
Although highly variable, our estimated DOC fluxes (0.02–1.06 mmol m−2 d−1) generally agreed with sediment DOC release reported from other areas affected by the oxygen deficit in the water column, i.e., eastern tropical North and South Pacific (−0.3 to 4.4 mmol m−2 d−1) (Burdige et al., 1992, 1999; Burdige and Komada, 2015; Loginova et al., 2020), and fall within the range of previously reported estimates of DOC release in the coastal area of the Southern Baltic Sea (−41.8 to 28.3 mmol m−2 d−1) (Silberberger et al., 2022). They also generally agreed with those reported for depositional and transitional areas of the Baltic Sea (−0.02 to 0.44 mmol m−2 d−1) (Winogradow and Pempkowiak, 2014; Lengier et al., 2021), but being on the higher end of, to slightly exceeding, than those reported. This could be attributed to differences in the DOM diffusion coefficient estimation (see Equation 2). Furthermore, the fluxes reported by Lengier and colleagues were measured during one of the most recent MBIs (Mohrholz, 2018), when the water column was characterized by higher salinity and DO and the magnitude of sedimentary solute release (Lengier et al., 2021) was significantly reduced, while our measurements were made after several years of stagnation.
The spatial variation in the rates of organic matter decomposition within marine sediments is a common phenomenon observed in oceans (Arndt et al., 2013). This spatial diversity is inherently associated with the efficiency of the downward flux of POM to the sediment surface (Marsay et al., 2015; Engel et al., 2017). The elevated concentrations of NH4+ found in the pore waters of the Bornholm and especially Gdansk LOhd stations compared to the Gotland LOhd stations suggest enhanced organic matter remineralization (Liu and Kaplan, 1984; Dale et al., 2015) in the former. The enhanced remineralization may, therefore, hint at the elevated supply of bioavailable organic matter to the sediment–water column interface at those sites compared to that of Gotland LOhd stations, from, e.g., allochthonous sources, and also, at least partially, explain the regional differences in the sedimentary organic matter content indicated by the LOI measured in our study. The differences in organic matter content between LOhd stations are in agreement with the regional differences between linear sediment vs. POC accumulation rates reported elsewhere (Winogradow and Pempkowiak, 2014) for the sites of our interest, supporting the idea of POM being less efficiently mineralized within the sediments of Gotland LOhd stations, compared to sediments of the two other LOhd sites that we studied.
The Gdansk Basin area and its microbial communities have previously been documented to be largely influenced by the inflow of POM, DOM, and nutrients from the Vistula River (Wielgat-Rychert et al., 2013). These fluxes are likely to be responsible for the elevated productivity in the area (e.g., Supplementary Figure S1) and, as a result, for the supply of relatively fresh and bioavailable organic matter at the sediment-water column interface. Our measurements of DOM optical properties in the pore waters suggest the presence of fresher and more bioavailable organic matter at the Gdansk LOhd stations, as one of the amino acid-like FDOM fractions (AA1) was notably enriched in the pore waters of the latter compared to the pore waters of LOhd stations from the other two basins. Furthermore, similar to AA1 proteinaceous FDOM was previously associated with related to microbial deoxyribose nucleic acids and, thus, with in situ microbial catabolism (Xu et al., 2021). Therefore, the enrichment in AA1 in the Gdansk LOhd stations suggests enhanced remineralization/decomposition of organic matter in sediments, which could explain the apparently elevated area-averaged diffusive fluxes of DOM into the water column in this study site.
Conversely, despite the relatively high productivity (Supplementary Figure S1) and therefore the relative freshness of exported particles in the upper water column (e.g., Cisternas-Novoa et al., 2019), as well as sub- and anoxia in the water column (Kuliński et al., 2022), potentially affecting the mineralization rates of settling particles (Engel et al., 2017), organic matter in Gotland LOhd stations seemingly undergoes limited organic matter remineralization/decomposition within sediments. This is evident from the low concentrations of NH4+ in the pore water and the relatively sparse rates of DOM release. This phenomenon may likely be linked to the extended residence time of particles in the water column as Gotland Basin stations are considerably deeper than those from Gdansk and Bornholm Basins (Supplementary Table S1). This may, in turn, facilitate a more altered nature of particles arriving at the surface sediment (Le Moigne et al., 2017) at the Gotland LOhd stations and also hints at the importance of the bioavailability of supplied organic matter for organic matter remineralization rates, which have been suggested elsewhere (Pantoja et al., 2009; Le Moigne et al., 2017). Our qualitative DOM measurements suggest that the pore water samples from sediment profiles (0–10 cm) in the investigated LOhd stations at the Gotland Basin displayed highly similar characteristics to samples collected in the uppermost sediment slices in other investigated sites. This similarity may, therefore, imply that DOM in the pore waters of the Gotland LOhd stations undergoes limited qualitative in situ changes, when compared to other investigated LOhd stations, despite the highest sediment pore water age, if inferred from sampling depth (in cm) to sediment accumulation rate ratio (Winogradow and Pempkowiak, 2014).
At LOhd stations of the Bornholm Basin, relative enrichment in humic-like FDOM compared to the proteinaceous FDOM component, AA1, may likely be explained by the relatively lower productivity (Supplementary Figure S1) and selective uptake of nitrogen-rich, e.g., proteinaceous, materials within the water column (Le Moigne et al., 2017). The relative enrichment in the abundance of apparent HMWDOM fraction and the relatively lower abundance of apparent LMWDOM fraction compared to those of LOhd stations of the Gdansk Basin may, in turn, explain the larger AMW found in our study, which, in turn, could contribute to the apparent differences in the magnitude of sediment DOM release between the study sites.
Furthermore, the spatial variability of the quality of DOM in pore waters and the rates of sediment DOM release could possibly be influenced by differences in the input and decomposition rates of terrestrial organic matter (Wielgat-Rychert et al., 2013). Thus, the distinct signatures of humic-like H4 between the three investigated basins, as well as its heightened fluorescence intensities at the Gdansk reference stations, compared to that of the LOhd stations, suggest that H4 might have originated from the terrestrial sources, e.g., Vistula River. Furthermore, methanogenesis and the release of methane might also affect the gradients of pore water solutes investigated in the study and, thus, the magnitude of sediment release (Finke et al., 2007). Although purely speculatory, we also further note that particle transport in the Baltic Sea was shown to be affected by surface and bottom density-driven currents (Porz et al., 2021, 2023). In the spirit of the latter, density-driven deep particle supply may facilitate the settlement of resuspended (e.g., altered) material from shallower locations to the deeper stations, so-called “focusing”. This, in turn, could contribute to the difference in apparent enrichment in HMWDOM fraction and protein-like AA2 at reference stations compared to LOhd stations at the investigated sites. Thus, despite the absence of apparent regional differences between investigated basins, the relative enrichment in likely bioavailable DOM fraction, i.e., proteinaceous FDOM component AA2, covariant with aHMW on PCA, could contribute to relatively more bioavailable DOM release at reference stations compared to those in LOhd stations. The association of this proteinaceous fluorescence with HMWDOM fraction is in line with previous findings of Dang et al. (2014), which suggested that a high proportion of both LMWDOM and HMWDOM fractions is likely to be dominated by protein-like fluorophores.
Furthermore, the consistent increase in the molecular size of the DOM of the pore water with the depth of the sediment challenges the traditional PWSR model (Burdige and Gardner, 1998; Megonigal et al., 2013; Dang et al., 2014; Burdige and Komada, 2015); however, the range of MW found in our study is generally lower than the cutoff of 3 kDa for HMWDOM that was used in previous studies (Burdige and Gardner, 1998; Dang et al., 2014). Herewith, the increase of MW along the sediment cores was observed previously in various environmental settings (Chin and Gschwend, 1991; Loginova et al., 2020; Xu et al., 2021). The increase of pore water MW with sediment depth, therefore, might be attributed to abiotic polymerization (Hedges et al., 1988), complexation (Finke et al., 2007), and/or the formation of supramolecular assemblies (Sutton and Sposito, 2005), which are likely supported by the simultaneous production of DOM and increasing long-term hydrostatic pressure in pore waters in deeper sediment layers.
The intensification of the amino acid-like FDOM (AA1) along the sediment cores and its association with aLMW on the PCA indicate that a part of amino acid-like DOM might be present in sediments in the form of, e.g., short-chain oligomers. This suggestion is in line with previous findings from the Pearl River Estuary (Xu et al., 2021), where enrichment in protein fluorescence fraction with similar spectral properties to AA1 and associated with in situ microbial catabolism was correlated to the decrease in the relative MW of pore water DOM. Structures, such as small oligomers and free amino acids, are commonly the most bioavailable forms of proteinaceous molecules for heterotrophic respiration (Benner and Amon, 2015) and are likely to be utilized rapidly, resulting in generally lower intensities of AA1 compared to other protein-like FDOM fractions (AA2) found in our study. In turn, the accumulation of potentially bioavailable DOM in surface sediments (0–10 cm) may be associated with the decrease in microbial abundance with the increasing sediment depth and age (Kallmeyer et al., 2012), inhibition of microbial activity (Aller and Aller, 1998; D’Hondt et al., 2004), limitations in electron acceptors in the pore waters (Emerson, 1985; Canfield, 1994), inclusion of labile substances to the structure of humic molecules during geopolymerization (Sutton and Sposito, 2005; Finke et al., 2007), and/or encapsulation by humic substances (Tomaszewski et al., 2011; Giachin et al., 2017). Our result also suggests that the accumulation of those amino acid-like structures covariant with enrichment in aLMW seems to be enhanced in nitrogen-rich depositional areas, such as Gdansk LOhd stations, compared to nitrogen-limited depositional areas.
Data availability statement
The datasets presented in this study can be found online. The names of the repository and accession numbers can be found below: Loginova, Alexandra; Kowalczuk, Piotr (2024): Optical properties of porewater dissolved organic matter and bulk characteristics of bottom waters and sediments of the Baltic Sea. PANGAEA, https://doi.pangaea.de/10.1594/PANGAEA.967075; Loginova, Alexandra; Kowalczuk, Piotr; Wünsch, Urban (2024): Molecular weight of dissolved organic matter in sediments of the Baltic Sea. PANGAEA, https://doi.pangaea.de/10.1594/PANGAEA.967076; Loginova, Alexandra; Kowalczuk, Piotr; Szymczycha, Beata; Kulinski, Karol (2024): Dissolved organic carbon and dissolved inorganic nutrients in the pore waters of the Baltic Sea. PANGAEA, https://doi.pangaea.de/10.1594/PANGAEA.967079; Loginova, Alexandra; Kowalczuk, Piotr (2024): Sediment Dissolved Organic Carbon Release in the Baltic Sea. PANGAEA, https://doi.pangaea.de/10.1594/PANGAEA.967081.
Author contributions
AL: Conceptualization, Data curation, Formal analysis, Funding acquisition, Investigation, Methodology, Resources, Validation, Visualization, Writing – original draft, Writing – review & editing. UW: Data curation, Formal analysis, Methodology, Writing – original draft, Writing – review & editing. MZ: Investigation, Writing – original draft, Writing – review & editing, Methodology. AC: Writing – original draft, Writing – review & editing, Formal analysis, Visualization. BS: Writing – original draft, Writing – review & editing, Data curation, Resources, Methodology. KK: Data curation, Resources, Writing – original draft, Writing – review & editing. AW: Data curation, Writing – original draft, Writing – review & editing. PK: Writing – original draft, Writing – review & editing, Conceptualization, Funding acquisition, Investigation, Project administration, Supervision.
Funding
The authors declare financial support was received for the research, authorship, and/or publication of this article. The research leading to these results has received funding from the Polish National Science Foundation (NCN) OPUS17 project DiSeDOM (2019/33/B/ST10/01232) granted to PK and the Norwegian Financial Mechanism 2014-2021 project DOMUSe (2020/37/K/ ST10/03018) granted to AL. PK, MZ, and UW were supported by the DiSeDOM project of NCN under OPUS17 program (2019/33/B/ST10/01232). AL was supported by DiSeDOM (2019/33/B/ST10/01232) and Norwegian Financial Mechanism 2014-2021 via DOMUSe (2020/37/K/ST10/03018). AC were supported by Norwegian Financial Mechanism 2014-2021 via MOPAR (2020/37/K/ST10/03254) and by the European Union’s Horizon Europe Research and Innovation programme under Grant Agreement No. 101136748 (BioEcoOcean). BS and AW were supported by the IDEAL (2019/34/E/ST10/00217) project of NCN under SONATA BIS program.
Acknowledgments
We acknowledge the ship master and crew of RV Oceania for their help during sampling, as well as cruise leaders and scientific crews that have been taking part in the six research cruises between September 2020 and April 2021 (2020_Sept_Chem, 2020_Sept_opt, 2020_Oct_opt, 2021_Jan_Chem, 2021_Feb_opt, and 2021_Apr_Chem). The authors extend their gratitude to Agata Zaborska for her valuable advice and guidance during bulk sediment analyses, Marta Borecka for nutrient analyses, as well as to the laboratory leaders and scientists of the Marine Physics and Marine Chemistry and Biochemistry Departments at the Institute of Oceanology, Polish Academy of Sciences, for their occasional support during research cruise preparations and laboratory work.
Conflict of interest
The authors declare that the research was conducted in the absence of any commercial or financial relationships that could be construed as a potential conflict of interest.
Publisher’s note
All claims expressed in this article are solely those of the authors and do not necessarily represent those of their affiliated organizations, or those of the publisher, the editors and the reviewers. Any product that may be evaluated in this article, or claim that may be made by its manufacturer, is not guaranteed or endorsed by the publisher.
Supplementary material
The Supplementary Material for this article can be found online at: https://www.frontiersin.org/articles/10.3389/fmars.2024.1433199/full#supplementary-material
References
Aiken G. (2014). “Fluorescence and Dissolved Organic Matter,” in Aquatic Organic Matter Fluorescence (32 Avenue of the Americas, New York, NY, USA: Cambridge University Press), 35–74. doi: 10.1017/CBO9781139045452.005
Aller R. C., Aller J. Y. (1998). The effect of biogenic irrigation intensity and solute exchange of diagenetic reaction rates in marine sediments. J. Mar. Res. 56 (4), 905–936. doi: 10.1357/002224098321667413
Alperin M. J., Martens C. S., Albert D. B., Suayah I. B., Benninger L. K., Blair N. E., et al. (1999). Benthic fluxes and porewater concentration profiles of dissolved organic carbon in sediments from the North Carolina continental slope. Geochim. Cosmochim. Acta 63, 427–448. doi: 10.1016/S0016-7037(99)00032-0
Amon R. M. W., Benner R. (1994). Rapid cycling of high-molecular-weight dissolved organic matter in the ocean. Nature 369, 549–552. doi: 10.1038/369549a0
Amon R. M. W., Benner R. (1996). Bacterial utilization of different size classes of dissolved organic matter. Limnol. Oceanogr. 41 (1), 41–51. doi: 10.4319/lo.1996.41.1.0041
Antoine D., Morel A. (1996). Oceanic primary production: 1. Adaptation of a spectral light-photosynthesis model in view of application to satellite chlorophyll observations. Global Biogeochem. Cycles 10 (1), 43–55. doi: 10.1029/95GB02831
Arndt S., Jørgensen B. B., LaRowe D. E., Middelburg J. J., Pancost R. D., Regnier P. (2013). Quantifying the degradation of organic matter in marine sediments: A review and synthesis. Earth Sci. Rev. 123, 53–86. doi: 10.1016/j.earscirev.2013.02.008
Arnosti C., Durkin S., Jeffrey W. H. (2005). Patterns of extracellular enzyme activities among pelagic marine microbial communities: Implications for cycling of dissolved organic carbon. Aquat. Microbial. Ecol. 38, 135–145. doi: 10.3354/ame038135
Asmala E., Kaartokallio H., Carstensen J., Thomas D. N. (2016). Variation in riverine inputs affect dissolved organic matter characteristics throughout the estuarine gradient. Front. Mar. Sci. 2, 125. doi: 10.3389/fmars.2015.00125
Asmala E., Massicotte P., Carstensen J. (2021). Identification of dissolved organic matter size components in freshwater and marine environments. Limnol. Oceanogr. 66, 1–13. doi: 10.1002/lno.11692
Balch J., Guéguen C. (2015). Effects of molecular weight on the diffusion coefficient of aquatic dissolved organic matter and humic substances. Chemosphere 119, 498–503. doi: 10.1016/j.chemosphere.2014.07.013
Benner R., Amon R. M. W. (2015). The size-reactivity continuum of major bioelements in the Ocean. Ann. Rev. Mar. Sci. 7, 185–205. doi: 10.1146/annurev-marine-010213-135126
Bernal S., Lupon A., Catalán N., Castelar S., Martí E. (2018). Decoupling of dissolved organic matter patterns between stream and riparian groundwater in a headwater forested catchment. Hydrol. Earth Syst. Sci. 22, 1897–1910. doi: 10.5194/hess-22-1897-2018
Brocławik O., Łukawska-Matuszewska K., Brodecka-Goluch A., Bolałek J. (2020). Impact of methane occurrence on iron speciation in the sediments of the Gdansk Basin (Southern Baltic Sea). Sci. Total Environ. 721, 137718. doi: 10.1016/j.scitotenv.2020.137718
Burdige D. J., Alperin M. J., Homstead J., Martens C. S. (1992). The role of benthic fluxes of dissolved organic carbon in oceanic and sedimentary carbon cycling. Geophys. Res. Lett. 19, 1851–1854. doi: 10.1029/92GL02159
Burdige D. J., Berelson W. M., Coale K. H., McManus J., Johnson K. S. (1999). Fluxes of dissolved organic carbon from California continental margin sediments. Geochim. Cosmochim. Acta 63, 1507–1515. doi: 10.1016/S0016-7037(99)00066-6
Burdige D. J., Gardner K. G. (1998). Molecular weight distribution of dissolved organic carbon in marine sediment pore waters. Mar. Chem. 62, 45–64. doi: 10.1016/S0304-4203(98)00035-8
Burdige D. J., Komada T. (2015). “Chapter 12 - Sediment Pore Waters,” in Biogeochemistry of Marine Dissolved Organic Matter, 2nd ed. Academic Press, 535–577.
Burdige D. J., Komada T., Magen C., Chanton J. P. (2016). Modeling studies of dissolved organic matter cycling in Santa Barbara Basin (CA, USA) sediments. Geochim. Cosmochim. Acta 195, 100–119. doi: 10.1016/j.gca.2016.09.007
Canfield D. E. (1994). Factors influencing organic carbon preservation in marine sediments. Chem. Geol. 114, 315–329. doi: 10.1016/0009-2541(94)90061-2
Carstensen J., Andersen J. H., Gustafsson B. G., Conley D. J. (2014). Deoxygenation of the baltic sea during the last century. Proc. Natl. Acad. Sci. U.S.A. 111, 5628–5633. doi: 10.1073/pnas.1323156111
Catalá T. S., Álvarez-Salgado X. A., Otero J., Iuculano F., Companys B., Horstkotte B., et al. (2016). Drivers of fluorescent dissolved organic matter in the global epipelagic ocean. Limnol. Oceanogr. 61, 1101–1119. doi: 10.1002/lno.10281
Chen M., Kim J. H., Nam S., Niessen F., Hong W. L., Kang M. H., et al. (2016). Production of fluorescent dissolved organic matter in Arctic Ocean sediments. Sci. Rep. 6, 39213. doi: 10.1038/srep39213
Chin Y.p., Gschwend P. M. (1991). The abundance, distribution, and configuration of porewater organic colloids in recent sediments. Geochim. Cosmochim. Acta 55, 1309–1317. doi: 10.1016/0016-7037(91)90309-S
Cisternas-Novoa C., Le Moigne F. A. C., Engel A. (2019). Composition and vertical flux of particulate organic matter to the oxygen minimum zone of the central Baltic Sea: Impact of a sporadic North Sea inflow. Biogeosciences 16, 927–947. doi: 10.5194/bg-16-927-2019
Coble P. G. (1996). Characterization of marine and terrestrial DOM in seawater using excitation-emission matrix spectroscopy. Mar. Chem. 51, 325–346. doi: 10.1016/0304-4203(95)00062-3
Cuss C. W., Guéguen C. (2015). Relationships between molecular weight and fluorescence properties for size-fractionated dissolved organic matter from fresh and aged sources. Water Res. 68, 487–497. doi: 10.1016/j.watres.2014.10.013
D’Andrilli J., Foreman C. M., Sigl M., Priscu J. C., McConnell J. R. (2017). A 21 000-year record of fluorescent organic matter markers in the WAIS Divide ice core. Climate Past 13, 533–544. doi: 10.5194/cp-13-533-2017
D’Hondt S., Jørgensen B. B., Miller D. J., Batzke A., Blake R., Cragg B. A., et al. (2004). Distributions of microbial activities in deep subseafloor sediments. Sci. (1979) 306, 2216–2221. doi: 10.1126/science.1101155
Dale A. W., Sommer S., Lomnitz U., Montes I., Treude T., Liebetrau V., et al. (2015). Organic carbon production, mineralisation and preservation on the Peruvian margin. Biogeosciences 12, 1537–1559. doi: 10.5194/bg-12-1537-2015
Dang D. H., Lenoble V., Durrieu G., Mullot J. U., Mounier S., Garnier C. (2014). Sedimentary dynamics of coastal organic matter: An assessment of the porewater size/reactivity model by spectroscopic techniques. Estuar. Coast. Shelf Sci. 151, 100–111. doi: 10.1016/j.ecss.2014.10.002
DeFrancesco C., Guéguen C. (2021). Long-term trends in dissolved organic matter composition and its relation to sea ice in the Canada basin, Arctic Ocean, (2007–2017). J. Geophys. Res. Oceans 126, e2020JC016578. doi: 10.1029/2020JC016578
Döös K., Meier H. E. M., Döscher R. (2004). The Baltic haline conveyor belt or the overturning circulation and mixing in the baltic. AMBIO: A J. Hum. Environ. 33, 261–266. doi: 10.1579/0044-7447-33.4.261
Egeberg P. K., Alberts J. J. (2003). Hpsec as a prepative fractionation technique for studies of natural organic matter (nom). Environ. Technol. (United Kingdom) 24, 309–318. doi: 10.1080/09593330309385563
Emerson S. (1985). “Organic carbon preservation in marine sediments,” in The Carbon Cycle and Atmospheric CO2: Natural Variations Archean to Present, 78–87. doi: 10.1029/gm032p0078
Engel A., Wagner H., Le Moigne F. A. C., Wilson S. T. (2017). Particle export fluxes to the oxygen minimum zone of the eastern tropical North Atlantic. Biogeosciences 14, 1825–1838. doi: 10.5194/bg-14-1825-2017
Finke N., Hoehler T. M., Jørgensen B. B. (2007). Hydrogen “leakage” during methanogenesis from methanol and methylamine: Implications for anaerobic carbon degradation pathways in aquatic sediments. Environ. Microbiol. 9, 1060–1071. doi: 10.1111/j.1462-2920.2007.01248.x
Giachin G., Nepravishta R., Mandaliti W., Melino S., Margon A., Scaini D., et al. (2017). The mechanisms of humic substances self-assembly with biological molecules: The case study of the prion protein. PloS One 12, e0188308. doi: 10.1371/journal.pone.0188308
Guéguen C., Itoh M., Kikuchi T., Eert J., Williams W. J. (2015). Variability in dissolved organic matter optical properties in surface waters in the Amerasian Basin. Front. Mar. Sci. 2. doi: 10.3389/fmars.2015.00078
Hansen H. P., Koroleff F. (2007). “Determination of nutrients,” in Methods of Seawater Analysis: Third, Completely Revised and Extended Edition, 159–228. doi: 10.1002/9783527613984.ch10
Hedges J. I., Clark W. A., Come G. L. (1988). Fluxes and reactivities of organic matter in a coastal marine bay. Limnol. Oceanogr. 33. doi: 10.4319/lo.1988.33.5.1137
Hille S., Leipe T., Seifert T. (2006). Spatial variability of recent sedimentation rates in the Eastern Gotland Basin (Baltic Sea). Oceanologia 48, 297–317.
Jørgensen L., Stedmon C. A., Kragh T., Markager S., Middelboe M., Søndergaard M. (2011). Global trends in the fluorescence characteristics and distribution of marine dissolved organic matter. Mar. Chem. 126, 139–148. doi: 10.1016/j.marchem.2011.05.002
Kallmeyer J., Pockalny R., Adhikari R. R., Smith D. C., D’Hondt S. (2012). Global distribution of microbial abundance and biomass in subseafloor sediment. Proc. Natl. Acad. Sci. U.S.A. 109, 16213–16216. doi: 10.1073/pnas.1203849109
Kalvelage T., Lavik G., Lam P., Contreras S., Arteaga L., Löscher C. R., et al. (2013). Nitrogen cycling driven by organic matter export in the South Pacific oxygen minimum zone. Nat. Geosci 6, 228–234. doi: 10.1038/ngeo1739
Komada T., Burdige D. J., Crispo S. M., Druffel E. R. M., Griffin S., Johnson L., et al. (2013). Dissolved organic carbon dynamics in anaerobic sediments of the Santa Monica Basin. Geochim. Cosmochim. Acta 110, 253–273. doi: 10.1016/j.gca.2013.02.017
Komada T., Burdige D. J., Li H. L., Magen C., Chanton J. P., Cada A. K. (2016). Organic matter cycling across the sulfate-methane transition zone of the Santa Barbara Basin, California Borderland. Geochim. Cosmochim. Acta 176, 259–278. doi: 10.1016/j.gca.2015.12.022
Komada T., Reimers C. E., Luther G. W., Burdige D. J. (2004). Factors affecting dissolved organic matter dynamics in mixed-redox to anoxic coastal sediments. Geochim. Cosmochim. Acta 68 (20), 4099–4111. doi: 10.1016/j.gca.2004.04.005
Kowalczuk P., Sagan S., Zabłocka M., Borzycka K. (2015). Mixing anomaly in deoxygenated Baltic Sea deeps indicates benthic flux and microbial transformation of chromophoric and fluorescent dissolved organic matter. Estuar. Coast. Shelf Sci. 163, 206–217. doi: 10.1016/j.ecss.2015.06.027
Kuliński K., Rehder G., Asmala E., Bartosova A., Carstensen J., Gustafsson B., et al. (2022). Biogeochemical functioning of the Baltic sea. Earth System Dynamics 13 (1), 633–685. doi: 10.5194/esd-13-633-2022
Le Moigne F. A. C., Cisternas-Novoa C., Piontek J., Maßmig M., Engel A. (2017). On the effect of low oxygen concentrations on bacterial degradation of sinking particles. Sci. Rep. 7, 16722. doi: 10.1038/s41598-017-16903-3
Lengier M., Koziorowska-Makuch K., Szymczycha B., Kuliński K. (2024). Bioavailability and remineralization rates of sediment-derived dissolved organic carbon from a Baltic Sea depositional area. Front. Mar. Sci. 11, 1359563. doi: 10.3389/fmars.2024.1359563
Lengier M., Szymczycha B., Brodecka-Goluch A., Kłostowska Ż., Kuliński K. (2021). Benthic diffusive fluxes of organic and inorganic carbon, ammonium and phosphates from deep water sediments of the Baltic Sea. Oceanologia 63. doi: 10.1016/j.oceano.2021.04.002
Leppäranta M., Myrberg K. (2009). “Topography and hydrography of the Baltic Sea,” in Physical Oceanography of the Baltic Sea, 41–88. doi: 10.1007/978-3-540-79703-6_3
Liu K. K., Kaplan I. R. (1984). Denitrification rates and availability of organic matter in marine environments. Earth Planet Sci. Lett. 68 (1), 88–100. doi: 10.1016/0012-821X(84)90142-0
Loginova A. N., Dale A. W., Le Moigne F. A. C., Thomsen S., Sommer S., Clemens D., et al. (2020). Sediment release of dissolved organic matter to the oxygen minimum zone off Peru. Biogeosciences 17 (18), 4663–4679. doi: 10.5194/bg-17-4663-2020
Loginova A. N., Thomsen S., Engel A. (2016). Chromophoric and fluorescent dissolved organic matter in and above the oxygen minimum zone off Peru. J. Geophys. Res. Oceans 121, 7973–7990. doi: 10.1002/2016JC011906
Ludwig W., Probst J. L. (1996). Predicting the oceanic input of organic carbon by continental erosion. Global Biogeochem. Cycles 10 (1), 23–41. doi: 10.1029/95GB02925
Mannino A., Novak M. G., Nelson N. B., Belz M., Berthon J.-F., Blough N. V., et al. MEASUREMENT PROTOCOL OF ABSORPTION BY CHROMOPHORIC DISSOLVED ORGANIC MATTER (CDOM) AND OTHER DISSOLVED MATERIALS by the CDOM working group. Available online at: http://www.ioccg.org. (accessed [November 1, 2023])
Marsay C. M., Sanders R. J., Henson S. A., Pabortsava K., Achterberg E. P., Lampitt R. S. (2015). Attenuation of sinking particulate organic carbon flux through the mesopelagic ocean. Proc. Natl. Acad. Sci. U.S.A. 112 (4), 1089–1094. doi: 10.1073/pnas.1415311112
Megonigal J. P., Hines M. E., Visscher P. T. (2013) “Anaerobic Metabolism: Linkages to Trace Gases and Aerobic Processes,” in Treatise on Geochemistry, 2nd ed., 317–424. doi: 10.1016/B978-0-08-095975-7.00808-1
Meier H. E. M., Väli G., Naumann M., Eilola K., Frauen C. (2018). Recently accelerated oxygen consumption rates amplify deoxygenation in the Baltic sea. J. Geophys. Res. Oceans 123 (5), 3227–3240. doi: 10.1029/2017JC013686
Mohrholz V. (2018). Major Baltic inflow statistics - Revised. Front. Mar. Sci. 5, 385391. doi: 10.3389/fmars.2018.00384
Muller F. L. L., Tankéré-Muller S. P. C., Tang C.-H. (2024). Terrigenous humic substances regulate the concentrations of dissolved Fe and Cu (but not Al, Mn, Ni or Zn) in the Gaoping River plume. Sci. Total Environ. 906, 167374. doi: 10.1016/j.scitotenv.2023.167374
Murphy K. R., Stedmon C. A., Graeber D., Bro R. (2013). Fluorescence spectroscopy and multi-way techniques. PARAFAC. Analytical Methods 5, 6541–6882. doi: 10.1039/c3ay41160e
Murphy K. R., Stedmon C. A., Wenig P., Bro R. (2014). OpenFluor– an online spectral library of auto-fluorescence by organic compounds in the environment. Anal. Methods 6, 658–661. doi: 10.1039/C3AY41935E
Nelson N. B., Siegel D. A. (2013). The global distribution and dynamics of chromophoric dissolved organic matter. Ann. Rev. Mar. Sci. 5, 447–476. doi: 10.1146/annurev-marine-120710-100751
Noffke A., Sommer S., Dale A. W., Hall P. O. J., Pfannkuche O. (2016). Benthic nutrient fluxes in the Eastern Gotland Basin (Baltic Sea) with particular focus on microbial mat ecosystems. J. Mar. Syst. 158, 1–12. doi: 10.1016/j.jmarsys.2016.01.007
O’Haver T. (2023). peakfit. peakfit.m. Available online at: https://www.mathworks.com/matlabcentral/fileexchange/23611-peakfit-m. accessed on 01.01.2022
Osburn C. L., Mikan M. P., Etheridge J. R., Burchell M. R., Birgand F. (2015). Seasonal variation in the quality of dissolved and particulate organic matter exchanged between a salt marsh and its adjacent estuary. J. Geophys. Res. Biogeosci. 120, 1430–1449. doi: 10.1002/2014JG002897
Pantoja S., Rossel P., Castro R., Cuevas L. A., Daneri G., Córdova C. (2009). Microbial degradation rates of small peptides and amino acids in the oxygen minimum zone of Chilean coastal waters. Deep Sea Res. 2 Top. Stud. Oceanogr. 56 (11), 1055–1062. doi: 10.1016/j.dsr2.2008.09.007
Peuravuori J., Monteiro A., Eglite L., Pihlaja K. (2005). Comparative study for separation of aquatic humic-type organic constituents by DAX-8, PVP and DEAE sorbing solids and tangential ultrafiltration: Elemental composition, size-exclusion chromatography, UV-vis and FT-IR. Talanta 65 (2), 408–422. doi: 10.1016/j.talanta.2004.06.042
Piontek J., Endres S., Le Moigne F. A. C., Schartau M., Engel A. (2019). Relevance of nutrient-limited phytoplankton production and its bacterial remineralization for carbon and oxygen fluxes in the Baltic sea. Front. Mar. Sci. 6, 470920. doi: 10.3389/fmars.2019.00581
Porz L., Zhang W., Schrum C. (2021). Density-driven bottom currents control development of muddy basins in the southwestern Baltic Sea. Mar. Geol. 438, 106523. doi: 10.1016/j.margeo.2021.106523
Porz L., Zhang W., Schrum C. (2023). Natural and anthropogenic influences on the development of mud depocenters in the southwestern Baltic Sea. Oceanologia 65, 182–193. doi: 10.1016/j.oceano.2022.03.005
Rak D., Walczowski W., Dzierzbicka-Głowacka L., Shchuka S. (2020). Dissolved oxygen variability in the southern Baltic Sea in 2013–2018. Oceanologia 62, 525–537. doi: 10.1016/j.oceano.2020.08.005
Reader H. E., Thoms F., Voss M., Stedmon C. A. (2019). The influence of sediment-derived dissolved organic matter in the vistula river estuary/gulf of gdansk. J. Geophys. Res. Biogeosci. 124 (1), 115–126. doi: 10.1029/2018JG004658
Repeta D. J. (2015) “Chemical Characterization and Cycling of Dissolved Organic Matter,” in Biogeochemistry of Marine Dissolved Organic Matter, 2nd ed., 21–63. doi: 10.1016/B978-0-12-405940-5.00002-9
Schmidt B., Wodzinowski T., Bulczak A. I. (2021). Long-term variability of near-bottom oxygen, temperature, and salinity in the Southern Baltic. J. Mar. Syst. 213, 103462. doi: 10.1016/j.jmarsys.2020.103462
Sebastien L., Josse J., Husson F. (2008). FactorMiner. J. Stat. Softw 23, 1–18. doi: 10.18637/jss.v025.i01
Silberberger M. J., Koziorowska-Makuch K., Borawska Z., Szczepanek M., Kędra M. (2022). Disentangling the drivers of benthic oxygen and dissolved carbon fluxes in the coastal zone of the Southern Baltic sea. Estuaries Coasts 45, 2450–2471. doi: 10.1007/s12237-022-01074-w
Stedmon C. A., Bro R. (2008). Characterizing dissolved organic matter fluorescence with parallel factor analysis: A tutorial. Limnol. Oceanogr. Methods 6 (11), 572–579. doi: 10.4319/lom.2008.6.572
Stedmon C. A., Markager S., Bro R. (2003). Tracing dissolved organic matter in aquatic environments using a new approach to fluorescence spectroscopy. Mar. Chem. 82 (3–4), 239–254. doi: 10.1016/S0304-4203(03)00072-0
Sutton R., Sposito G. (2005). Molecular structure in soil humic substances: The new view. Environ. Sci. Technol. 39 (23), 9009–9015. doi: 10.1021/es050778q
Szymczycha B., Borecka M., Białk-Bielińska A., Siedlewicz G., Pazdro K. (2020). Submarine groundwater discharge as a source of pharmaceutical and caffeine residues in coastal ecosystem: Bay of Puck, southern Baltic Sea case study. Sci. Total Environ. 713, 136522. doi: 10.1016/j.scitotenv.2020.136522
Tomaszewski J. E., Schwarzenbach R. P., Sander M. (2011). Protein encapsulation by humic substances. Environ. Sci. Technol. 45 (14), 6003–6010. doi: 10.1021/es200663h
Tranvik L. J. (1990). Bacterioplankton growth on fractions of dissolved organic carbon of different molecular weights from humic and clear waters. Appl. Environ. Microbiol. 56 (6), 1672–1677. doi: 10.1128/aem.56.6.1672-1677.1990
Ullman W. J., Aller R. C. (1982). Diffusion coefficients in nearshore marine sediments. Limnol. Oceanogr. 27 (3), 552–556. doi: 10.4319/lo.1982.27.3.0552
Wauthy M., Rautio M., Christoffersen K. S., Forsström L., Laurion I., Mariash H. L., et al. (2018). Increasing dominance of terrigenous organic matter in circumpolar freshwaters due to permafrost thaw. Limnol. Oceanogr. Lett. 3, 186–198. doi: 10.1002/lol2.10063
Wielgat-Rychert M., Ameryk A., Jarosiewicz A., Kownacka J., Rychert K., Szymanek L., et al. (2013). Impact of the inflow of Vistula river waters on the pelagic zone in the Gulf of Gdańsk. Oceanologia 55 (4), 859–886. doi: 10.5697/oc.55-4.859
Winogradow A., Pempkowiak J. (2014). Organic carbon burial rates in the Baltic Sea sediments. Estuar. Coast. Shelf Sci. 138, 27–36. doi: 10.1016/j.ecss.2013.12.001
Winterhalter B. (2001). Gemax —the ultimate corer for soft sediments (Espoo, Finland: Geol. Surv. Finland), 9.
Wünsch U. J., Murphy K. R., Stedmon C. A. (2017). The one-sample PARAFAC approach reveals molecular size distributions of fluorescent components in dissolved organic matter. Environ. Sci. Technol. 51 (20), 11900–11908. doi: 10.1021/acs.est.7b03260
Xu Y., Li P., Zhang C., Wang P. (2021). Spectral characteristics of dissolved organic matter in sediment pore water from Pearl River Estuary. Sci. China Earth Sci. 64, 52–61. doi: 10.1007/s11430-020-9671-9
Yang L., Chen L., Zhuang W.-E., Zhu Z. (2024). Unveiling changes in the complexation of dissolved organic matter with Pb(II) by photochemical and microbial degradation using fluorescence EEMs-PARAFAC. Environ. pollut. 341, 122982. doi: 10.1016/j.envpol.2023.122982
Zaborska A., Carroll J. L., Papucci C., Torricelli L., Carroll M. L., Walkusz-Miotk J., et al. (2008). Recent sediment accumulation rates for the Western margin of the Barents Sea. Deep Sea Res. 2 Top. Stud. Oceanogr. 55 (20-21), 2352–2360. doi: 10.1016/j.dsr2.2008.05.026
Keywords: dissolved organic matter, porewater DOM, DOM molecular weight, sediment release, Baltic Sea, FDOM
Citation: Loginova AN, Wünsch UJ, Zabłocka M, Cherkasheva A, Szymczycha B, Kuliński K, Winogradow A and Kowalczuk P (2024) Qualitative variability of dissolved organic matter in the Baltic Sea sediments apparent from fluxes and optical properties. Front. Mar. Sci. 11:1433199. doi: 10.3389/fmars.2024.1433199
Received: 05 June 2024; Accepted: 15 August 2024;
Published: 17 September 2024.
Edited by:
Liyang Yang, Fuzhou University, ChinaReviewed by:
Francois L. L. Muller, National Sun Yat-sen University, TaiwanPatricia Elizabeth Garcia, National Scientific and Technical Research Council (CONICET), Argentina
Copyright © 2024 Loginova, Wünsch, Zabłocka, Cherkasheva, Szymczycha, Kuliński, Winogradow and Kowalczuk. This is an open-access article distributed under the terms of the Creative Commons Attribution License (CC BY). The use, distribution or reproduction in other forums is permitted, provided the original author(s) and the copyright owner(s) are credited and that the original publication in this journal is cited, in accordance with accepted academic practice. No use, distribution or reproduction is permitted which does not comply with these terms.
*Correspondence: Alexandra N. Loginova, YWxvZ2lub3ZhQGlvcGFuLnBs; bG9naW5vdmFhbGVrc2FuZHJhQGdtYWlsLmNvbQ==