 Bita Sabbaghzadeh
 Guenther Uher
 Robert Upstill-Goddard
- 1Department of Marine Chemistry, Leibniz Institute for Baltic Sea Research, Rostock, Germany
- 2School of Natural and Environmental Sciences, Newcastle University, Newcastle, United Kingdom
We report on the spatial distributions and optical characteristics of chromophoric dissolved organic matter (CDOM) in the sea surface microlayer (SML), subsurface seawater (SSW), and water column profiles down to 500 m across a range of Atlantic Ocean biogeochemical provinces during two cruises of the UK Atlantic Meridional Transect program (AMT24 and AMT25). We measured the CDOM absorption coefficient at 300 nm, aCDOM(300), and determined CDOM spectral slopes across two UV wavelength ranges: S1 (275-295 nm) and S2 (350-400 nm). We used spectral slope ratios (SR: S1/S2) to infer CDOM source characteristics and transformation history. During both cruises, SML aCDOM(300) was highest in the Northern Hemisphere, particularly in the North Atlantic Drift Region (NADR). CDOM was always enriched in the SML, with enrichment factors (SML aCDOM(300) / SSW aCDOM(300)) ranging from 1.03 to 2.00, reflecting preferential accumulation of CDOM in the SML. We also found a significant inverse correlation between aCDOM(300) and S1 in both the SML (Spearman’s rank correlation coefficient, r2 = -0.75, p < 0.001, n = 114) and water column profiles (r2 = -0.74, p < 0.001, n = 845). Biogeochemical province-dependent variations in the relationships between CDOM and chlorophyll a were also observed. In high-latitude regions, elevated aCDOM(300) and low SR values indicated a dominance of terrestrially-derived CDOM, whereas oligotrophic subtropical areas showed lower aCDOM(300) and higher SR values, suggestive of aged, refractory, and photodegraded biologically-derived CDOM. Taken together, these findings reveal a complexity of drivers affecting CDOM distributions and spectral properties, which may limit the use of CDOM in predictive relationships in the oceans. However, the potential use of chlorophyll a as a CDOM proxy may prove most successful in open ocean regions devoid of terrestrial inputs, where biological production predominates.
1 Introduction
Chromophoric dissolved organic matter (CDOM) strongly influences the optical characteristics of the water column, impacting ocean color and contributing to photochemical and photobiological processes, particularly in the UV range. It affects photosynthesis and light availability for ocean color remote sensing. CDOM absorption is comparable to, or even exceeds, light absorption attributable to phytoplankton pigments. CDOM thus has significant implications for monitoring and understanding aquatic ecosystems (e.g., Siegel et al., 2002; Twardowski et al., 2004; Siegel et al., 2005). Marine CDOM arises from diverse sources and subsequently undergoes complex transformations. Two broad principal hypotheses regarding marine CDOM production have been posited. In the first, CDOM is predominantly produced in situ from marine organic matter, as supported by correlations with apparent oxygen utilization (AOU) (e.g., Coble, 2007; Nelson and Siegel, 2013). The second proposes significant contributions from terrestrial “humic-like” components, consistent with spectral and chemical analyses (Andrew et al., 2013; Nelson and Gauglitz, 2016). In coastal waters, CDOM is primarily allochthonous, deriving directly from river input, but autochthonous production by phytoplankton and bacteria also contributes (e.g., Blough and Del Vecchio, 2002; D’Sa and DiMarco, 2009). In open ocean waters away from significant terrestrial influence, CDOM is primarily autochthonous, deriving from primary production (e.g., Iuculano et al., 2019) and the microbial reworking of productivity-derived DOM. Bacterial degradation and photochemical bleaching are significant marine CDOM sinks. The modification of CDOM composition and light absorption characteristics via these processes gives rise to a “reactive” CDOM pool in the upper ocean, contrasting markedly with the “aged refractory CDOM” in deep waters where photochemical degradation is absent and microbial processing is comparatively very slow (Stedmon and Markager, 2001; Kitidis et al., 2006; Hansell and Carlson, 2014). Even so, much remains unknown about the origins, cycling, and precise chemical structure of oceanic CDOM, prompting a need for further enquiry. The interplay of CDOM production, cycling, and removal processes, both in surface and deep ocean waters, is heavily influenced by advection and vertical mixing (Nelson et al., 2007; Bracchini et al., 2010; Nelson and Siegel, 2013; Yamashita et al., 2013). Of particular note in this regard is the sea surface microlayer (SML), a highly dynamic environment (Carlson, 1983; Galgani and Engel, 2016) characterized by pronounced physical and biogeochemical gradients (Hardy, 1982; Cunliffe et al., 2013), and which maintains its integrity even under conditions of high surface turbulence (Wurl et al., 2011; Cunliffe et al., 2013).
Indeed, it is this high surface turbulence that actively maintains strong SML biogeochemical enrichments relative to underlying waters (Sabbaghzadeh et al., 2017). CDOM enrichment of the SML was first observed some time ago (Carlson and Mayer, 1980) and subsequently linked to phytoplankton production (Whitehead and Vernet, 2000). Hardy (1982) proposed that SML organic films promote the accumulation of biological exudates, and Whitehead and Vernet (2000) demonstrated a dinoflagellate response to sunlight exposure, manifested in the release of phenolics to the SML. Maximal bacterial and viral activity during phytoplankton blooms leads to further CDOM release (Wurl et al., 2011; Cunliffe et al., 2013). CDOM enrichment of the SML has also been shown to confer photoprotective properties for phytoplankton, which is particularly important in regions subject to high UV (Tilstone et al., 2010). A valuable means of investigating broad CDOM composition, and hence its likely origins and potential reactivity, is through variations in its optical properties expressed through changes in spectral slope (S). This is most commonly interrogated across two absorption wavelength intervals: S1 (S275-295) and S2 (S350-400) (Helms et al., 2008). In regions dominated by biologically-derived CDOM (e.g., the open ocean), S1 exceeds S2, while in regions with predominantly photodegraded, terrestrially derived CDOM (e.g., coastal waters), S2 exceeds S1 (e.g., Helms et al., 2008; Yamashita and Tanoue, 2009). The ratio of these spectral slopes (SR: S1/S2) thus diagnoses the extent of biologically and photochemically-induced changes in CDOM molecular weight. Low SR indicates high molecular weight CDOM, e.g., from terrestrial sources, while high SR signifies low molecular weight CDOM, e.g., from photodegradation of autochthonous open ocean sources (e.g., Helms et al., 2008; Kowalczuk et al., 2013; Galgani and Engel, 2016). Prolonged light exposure leads to a loss of optical activity and the continued accumulation of refractory CDOM (e.g., Twardowski and Donaghay, 2002; Helms et al., 2008).
In this work, we examined the variability of CDOM spectral characteristics through the uppermost 500 m of the Atlantic Ocean water column, including the deep chlorophyll maximum (DCM), and incorporating specialized sampling of the SML. Eleven “biogeographic provinces” representing three Longhurst biomes (Coastal, Westerly, and Trade wind) (Longhurst, 1995) were sampled during the boreal summer/autumn and austral spring. We used CDOM spectral characteristics to examine regionality in CDOM source characteristics and potential transformations, and we specifically contrasted the spectral characteristics of the SML with subsurface seawater (SSW).
2 Material and methods
2.1 Study area
Samples were collected on two cruises of RRS James Clark Ross during the UK Atlantic Meridional Transect (AMT) program (https://www.pml.ac.uk/science/Projects/Atlantic-Meridional-Transect-(AMT)). Cruise AMT24 (21.09 – 06.11.2014) extended from Immingham (UK) to Punta Arenas (Chile), while cruise AMT25 (11.09 – 04.11.2015) extended from Immingham to the Falkland Islands (Figure 1). Sampling of the SML and SSW is described in detail in Sabbaghzadeh et al. (2017). In brief, we sampled the SML twice daily, during predawn and solar noon hydrocasts, using a Garrett Screen (mesh 16; wire diameter 0.36 mm; effective surface area 2025 cm2) (Garrett, 1965). SSW samples were collected simultaneously via a hull-mounted “nontoxic” seawater inlet at 7 m depth. To examine vertical CDOM profiles, we sampled using the ship’s conductivity, temperature, and depth (CTD) rosette at a total of 27 stations during both cruises. Sampling always encompassed five specified light penetration depths (97%, 55%, 33%, 14%, and 1%), the base of the mixed layer, the DCM, and the depths corresponding to maximum and minimum dissolved oxygen (O2) saturation. Samples were transferred into previously rinsed 250 ml borosilicate volumetric flasks (analytical-grade glassware, SCHOTT, GL 45, 250 ml, Fisher brand). Prior to use, all glassware used in sampling and subsequent analysis was pre-combusted at 450°C for 8 hours to eliminate any residual organic matter (Stubbins et al., 2006).
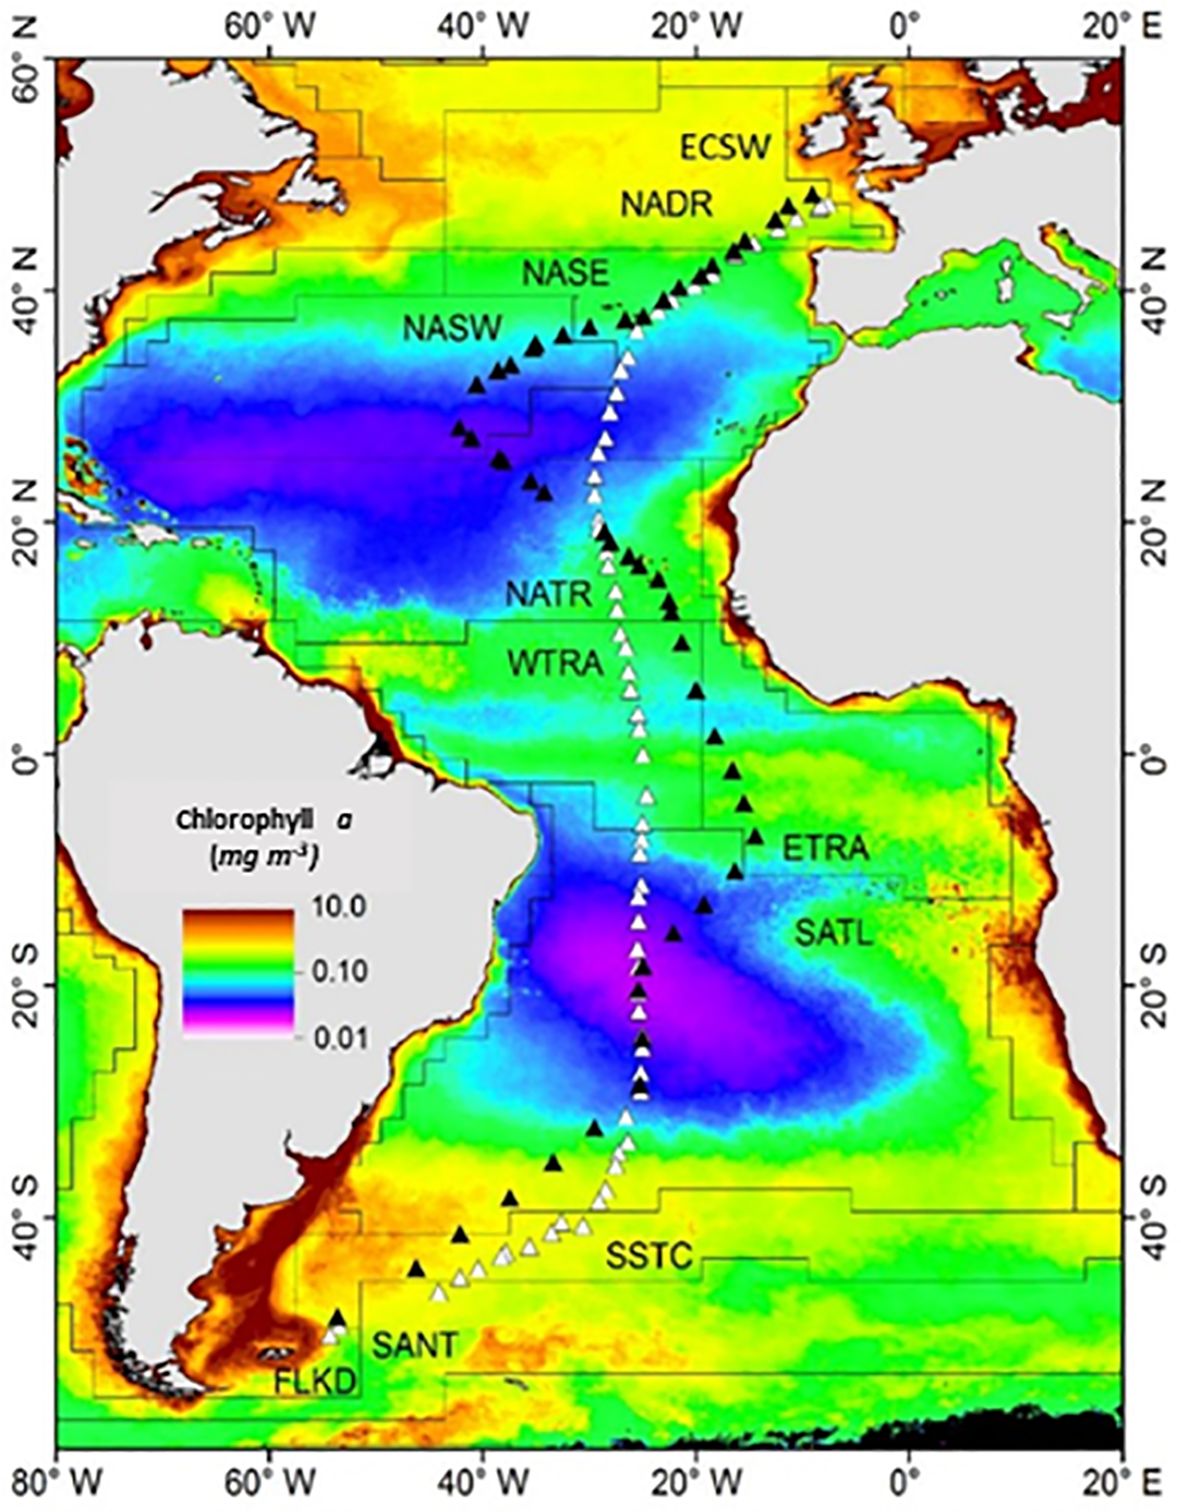
Figure 1 Cruise transects and sampling sites during AMT24 (white triangles) and AMT25 (black triangles). Oceanic provinces (Longhurst, 1995; Reygondeau et al., 2013) indicated are: European Continental Shelf Water (ECSW); North Atlantic Drift Region (NADR); Eastern and Western North Atlantic Subtropical (NAST (E), NAST (W)); North Atlantic Tropical (NATR); Western and Eastern Tropical Atlantic (WTRA, ETRA); South Atlantic Gyre (SATL); South Subtropical Convergence Zone (SSTC); and Falkland Islands (FKLD). The monthly climatology of sea surface chlorophyll a for October was obtained from NASA MODIS-Aqua (https://modis.gsfc.nasa.gov/data/dataprod/chlor_a.php).
2.2 CDOM determination
Immediately following collection, 20 ml subsamples were transferred into a ground glass syringes (SAMCO) and gently filtered (10 ml min-1) through 0.22 µm surfactant-free single use Luer-Lok syringe filters (MILLEX GP, Millipore, PES membrane). To minimize contamination during the filtration process, syringes, filters, and glassware were initially rinsed with pure laboratory water (18.2 Ω Milli-Q, Millipore System Inc., USA, hereinafter referred to as Milli-Q) followed by a small aliquot of the sample (~ 3 ml).
CDOM spectra were captured using a single-beam UV-Visible high-performance liquid core waveguide (LCW) spectrophotometer (Ultrapath UV, World Precision Instruments, USA). On AMT25, the LCW had an effective optical pathlength of 204.01 ± 1.0 cm. On AMT24, a shorter effective optical pathlength of 33.70 ± 0.5 cm, determined according to Miller et al. (2002), was used due to previous instrument damage. Detection limits were 0.0092 m-1 and 0.0023 m-1 for AMT25 and AMT24, respectively. After the LCW was flushed by drawing < 10 ml of filtered seawater from its sample container using a peristaltic pump, absorbance spectra of the samples were recorded over the wavelength range 275–700 nm at 1nm resolution against 36 g L-1 sodium chloride (NaCl) (hereinafter referred to as reference solution; Miller et al., 2002). This reference solution was prepared using granular NaCl (Fisher Scientific, CAS: 7647–14-5, ≥ 99.0) pre-combusted at 400°C for 6 - 8 hours to eliminate any potential organic contamination (Miller et al., 2002; Helms et al., 2008).
To avoid artefacts arising from temperature differences between seawater samples and the reference solution, the samples were stored in the dark at laboratory temperature for 1 hour prior to analysis (e.g., Pegau and Zaneveld, 1993). To monitor for instrument drift and LCW contamination, absorbance spectra of Milli-Q were recorded before and after processing of a CTD cast. The baselines of Milli-Q recorded on the same day usually agreed to within ± 0.0005 absorbance units at 275 nm. To avoid artefacts from sample residue, wetted Ultrapath components were cleaned daily with 1 ml of Ultrapath Waveguide cleaning solution (WPI, USA) followed by 20 ml Milli-Q, and cleaning was repeated until Milli-Q absorbance returned to the expected base level.
All spectra were corrected for dark current, recorded 3 times, and averaged for further processing. We used a reference solution of constant salinity because high sample numbers precluded the use of reference solutions with matching salinities for refractive index correction (Nelson et al., 2007). Sample salinities ranged from 34 to 37.6, with most samples falling between 35 and 37. To account for the effects of salinity variations, we compared the apparent absorbance spectra of our NaCl reference solution against Milli-Q to those of salinity 35 and 37 artificial seawater (Dickson, 1990; Grasshoff et al., 2009). This comparison revealed spectra similar to those reported in Nelson et al. (2007), with apparent absorbance increasing towards shorter wavelengths. Our artificial seawater solution showed slightly higher apparent absorbances at wavelengths below 600 nm, increasing to 0.055 absorbance units at 275 nm.
To address variations in sample salinity, we calculated salinity-dependent spectral correction factors from the apparent absorbance spectra of the NaCl reference solution, A(λ)NaCl,36, and artificial seawater, A(λ)ref,SS, at sample salinity, SS (Equation 1):
Following Nelson et al. (2007), A(λ)ref,SS was obtained from linear extrapolation of the apparent absorbance spectra of salinity 35 and 37 artificial seawater, A(λ)ref,35 and A(λ)ref,37, respectively (Equation 2):
Sample absorbance spectra were then corrected for refractive index effects by subtracting F(λ). Absorbance spectra exhibited minor yet perceptible offsets (< ± 0.01 AUs) at longer wavelengths, where CDOM absorbance is expected to be negligible. These small offsets could plausibly be explained by a combination of instrument drift and residual errors in our refractive index correction (e.g. Kitidis et al., 2006; Nelson et al., 2007; Matsuoka et al., 2012; Organelli et al., 2014). Offset-corrected Napierian CDOM absorption coefficients at wavelength λ, aCDOM(λ), were calculated by subtracting the average absorbance between 675 and 695 nm from the absorbance spectrum (Equation 3):
where 2.303 is a conversion factor and l is the effective optical pathlength of the LCW in meters.
For this study, the absorption coefficient at a wavelength of 300 nm, aCDOM(300), was selected as a proxy for CDOM because CDOM absorbance dominates in the UV-B region and is notably above the detection limit (Kitidis et al., 2006; Stubbins et al., 2006). To further characterize CDOM, we determined spectral slopes in the shortwave (275–295 nm, S1) and long-wave UV (350–400 nm, S2) by linear regression of log-transformed absorption coefficient spectra (Helms et al., 2008).
The spectral slope ratio, SR = S1/S2, was used to infer CDOM source characteristics and transformation history. Any accumulation or depletion patterns of compounds in the SML relative to the corresponding SSW were investigated by quantifying enrichment factors (EFs) (Equation 4). EF is calculated as follows:
where EF > 1 indicates compound enrichment in the SML, whereas EF < 1 represents compound depletion in the SML compared to the corresponding SSW. Additional ancillary data, including temperature, salinity, and oxygen, were obtained from the CTD rosette (Seabird Electronics (SBE) 9 plus underwater unit). Chlorophyll a depth profiles were calibrated against fluorometric chlorophyll a measurements of Niskin bottle samples (Welschmeyer, 1994). These data were obtained from the British Oceanographic Data Centre (BODC) (www.BODC.ac.uk). Wind speeds were measured from the ship’s anemometer located on the top of the foremast at ~ 20.8 m height above sea level and logged on the ship’s computer every 10 minutes. The true wind speed and direction were corrected for the ship’s heading by the respective vector. Wind speeds were finally corrected to U10n, the corresponding wind speed at a reference height of 10 m corrected to neutral stability (Nightingale et al., 2000).
3 Results
3.1 CDOM and its optical properties in the SML of the Atlantic Ocean: consistency of the enrichment pattern
Mean SML aCDOM(300) showed no significant difference (t–test; p = 0.128) between the two cruises (AMT 24; ± SD: 0.47 ± 0.28 m-1, range: 0.16 – 1.52 m-1; AMT 25; ± SD: 0.41 ± 0.13 m-1, range: 0.24 – 0.82 m-1) (Supplementary Table S1). During both cruises, we observed a significant decrease in SML aCDOM(300) from NADR towards NAST (t–test; p < 0.05), to around nearly half its initial value ( ± SD: 0.44 ± 0.27 m-1), reflecting a transition to low CDOM waters of the oligotrophic Northern Atlantic gyre. Conversely, higher S1 in NAST than in NADR (t–test; p < 0.05) was consistent with an inverse relationship between SML aCDOM(300) and S1.
We also observed an increase in SML aCDOM(300) across the productive and nutrient-enriched tropical regions (NATR) on both cruises, with a mean of ± SD: 0.48 ± 0.22 m-1 (Supplementary Table S1). Further interhemispheric comparison showed mean SML aCDOM(300) in the Northern Hemisphere (AMT24; ± SD: 0.58 ± 0.34 m-1; AMT25; ± SD: 0.43 ± 0.13 m-1) to be higher than in the Southern Hemisphere (AMT24; ± SD: 0.35 ± 0.11 m-1; AMT25; ± SD: 0.36 ± 0.13 m-1). However, this interhemispheric difference was statistically significant only during AMT24 (t–test, p < 0.05) (Figure 2).
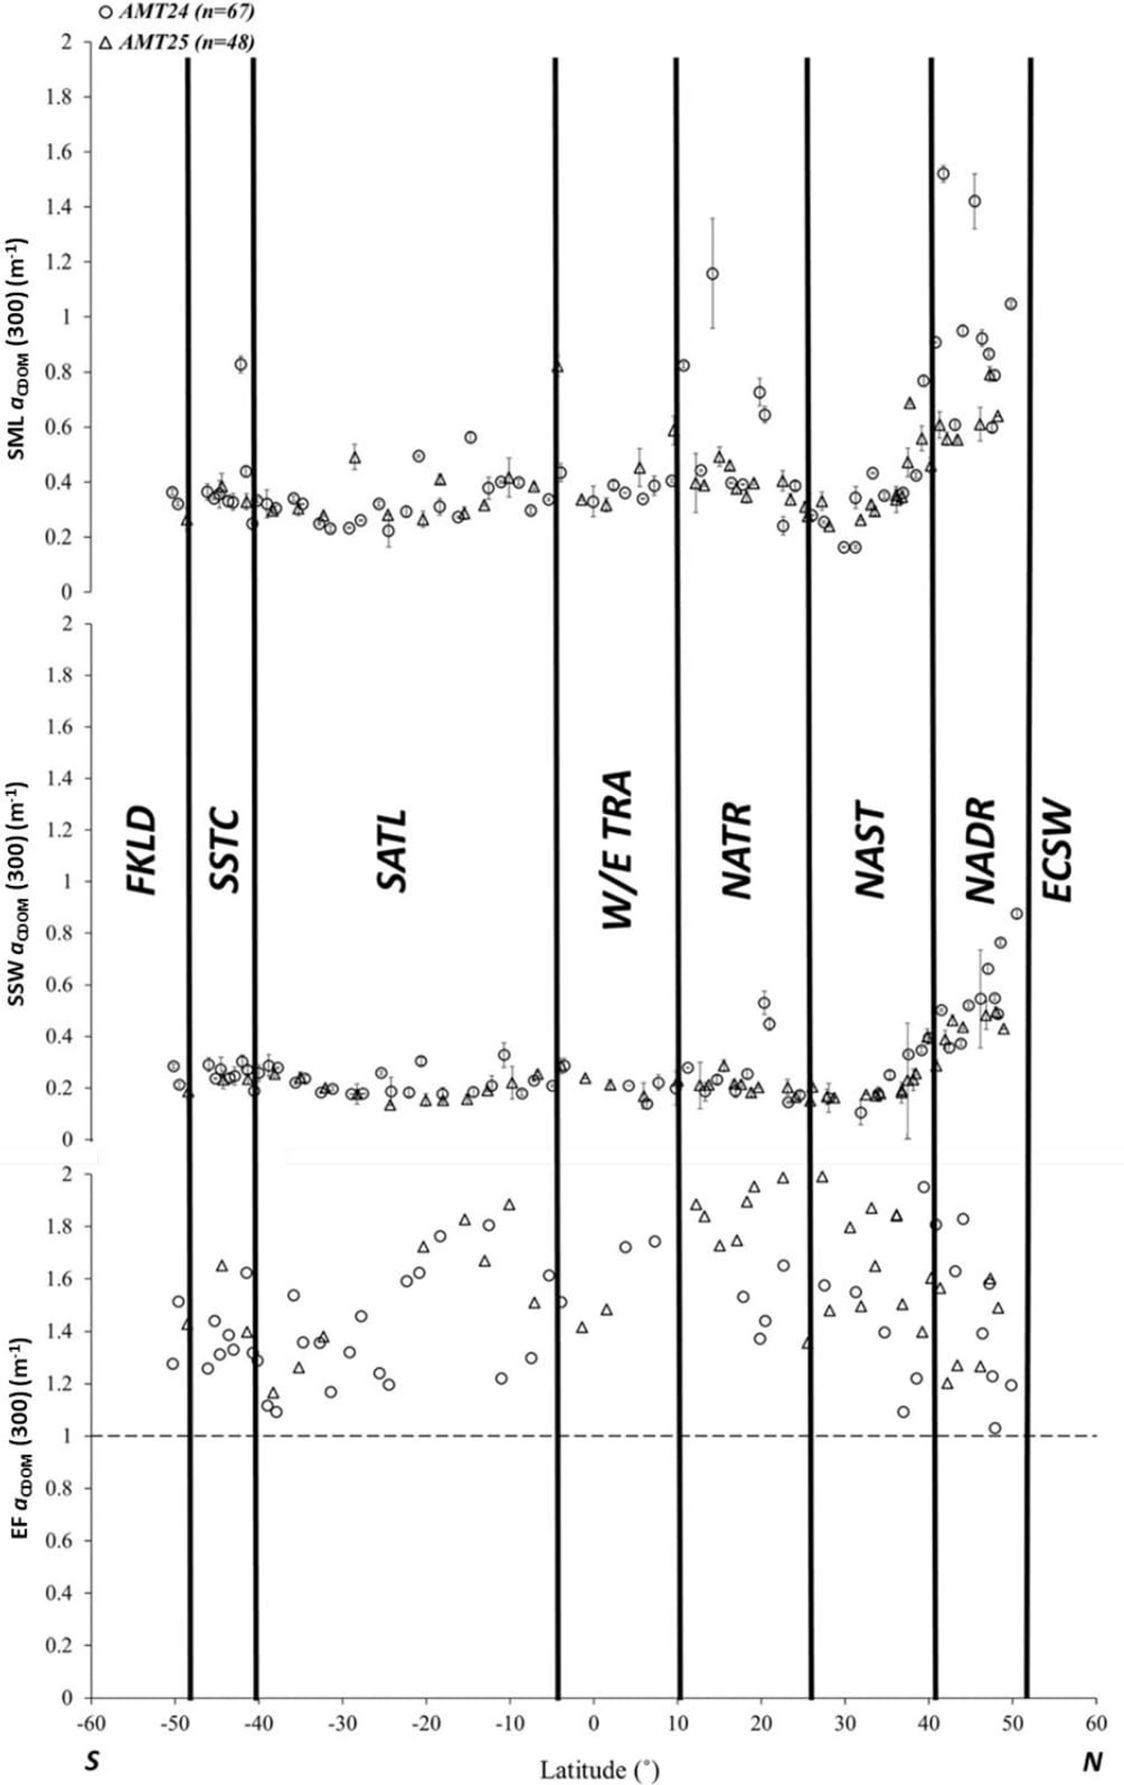
Figure 2 Latitudinal distribution of aCDOM(300) in the SML (top) and in the SSW at 7 m depth (middle), and the aCDOM(300) Enrichment Factor (EF aCDOM(300), bottom) during AMT24 (circles) and AMT25 (triangles). Error bars for aCDOM(300) are the standard deviation of the mean for each sample. The horizontal dashed line represents no SML enrichment in aCDOM(300) (EF=1).
The latitudinal data for both cruises revealed notable features. Distinct maxima in SML aCDOM(300) were observed in NADR (AMT24; ± SD: 0.96 ± 0.30 m-1; AMT25; ± SD: 0.60 ± 0.10 m-1) and in NATR (AMT24; 0.65 ± 0.27 m-1; AMT25; 0.40 ± 0.05 m-1). The subtropical gyres (NAST and SATL) had the lowest SML aCDOM (300), reflecting oligotrophic water masses in these less productive regions. SSW aCDOM(300) distribution mirrored that in the SML, ranging from 0.18 to 1.5 m-1, being maximal in NADR (Figure 2).
Significantly higher SSW aCDOM(300) occurred in the Northern Hemisphere than in the Southern Hemisphere during both cruises (t–test, p < 0.05). Potential accumulation or depletion of CDOM in the SML relative to SSW is evidenced by EFs for aCDOM(300). We observed SML aCDOM(300) enrichment at all locations sampled (i.e., EF aCDOM(300) > 1) (Figure 2). In the Atlantic Ocean, EF aCDOM(300) ranged from 1.03 to 2.00. Notably, three regions with high EF aCDOM(300) were identified around ~ 42°N on NADR, 10°N on the WTRA, and 15°S on the SATL during AMT24, aligning with findings from AMT25 (Figure 2). Despite a robust positive correlation observed between SML aCDOM(300) and SSW aCDOM(300) in the Atlantic Ocean (i.e., SML aCDOM(300) = 1.12 SSW aCDOM(300) + 0.13, r2 = 0.64, n = 103), EF aCDOM (300) was not found to be significantly associated with SML aCDOM(300) (i.e., SML aCDOM(300) = 0.57 EF aCDOM(300) + 1.43, r2 = 0.05, n = 103).
Additionally, we investigated the relationship between EF aCDOM(300) and spectral absorption characteristics, revealing no significant linear regression between EF aCDOM(300), S1, and SR (p > 0.05). The latitudinal distribution of S1 in the SML revealed a contrasting pattern, with elevated S1 being observed at less productive northerly and southerly latitudes (Supplementary Figure S1). In the SML S1 varied between 0.02 and 0.04 nm-1 ( ± SD: 0.03 ± 0.01 nm-1). The oligotrophic gyres, centered around 30°N and 20°S, had the highest SML S1 ( ± SD: 0.04 ± 0.01nm-1). In contrast, the lowest SML S1 (< 0.03 nm-1) was consistently observed north of 40°N and south of 40°S on both cruises (Supplementary Figure S1).
Mean SR was ± SD: 1.65 ± 0.54 (range: 0.15 – 2.70) on AMT24, and ± SD: 2.11 ± 0.56 (range: 1.03 – 3.60) on AMT25. Maximum SR (i.e., SR > 2) occurred in the oligotrophic regions of NAST and SATL. In SML samples around 15°N, a distinct CDOM absorption shoulder between 325 and 350 nm (Supplementary Figure S2) was consistent with the findings of Tilstone et al. (2010), who reported a similar feature at short wavelengths in the dissolved optical fraction of organic matter off the Iberian Peninsula. Although Tilstone et al. (2010) suggested the presence of mycosporine-like amino acids (MAAs), our observations indicate that samples containing MAAs were primarily found in the SML of NATR during both cruises, but totaling only four samples. The presence of MAAs was less frequent in other oceanic provinces, where CDOM dominated the spectral absorbance within the SML at those locations. The aCDOM(300) was analyzed in relation to salinity, water temperature, and, wind speed across the SML. Although inverse correlations were observed between aCDOM(300) and both salinity and temperature in all studied samples, these correlations were not statistically significant (Supplementary Table S2). SML aCDOM(300) showed non-statistically significant increases at higher wind speeds (U10n) (p > 0.001) (Supplementary Table S3). Furthermore, no significant correlation was identified between EF aCDOM(300) and wind speed along the transects (Pearson’s correlation = -0.124, p = 0.213, n = 103).
3.2 Depth-cross sections of CDOM in the Atlantic Ocean
The depth-cross section of aCDOM(300) exhibited the average of ± SD: 0.30 ± 0.12 m-1 (range: 0.10 – 0.87 m-1) during AMT24 and the average of ± SD: 0.27 ± 0.10 m-1 (range of 0.13 – 0.55 m-1) during AMT25, with no statistically significant difference between the two cruises (p = 0.003). The latitudinal cross-section of chlorophyll a also indicates elevated concentrations in the Northern Hemisphere and equatorial zones compared to the Southern Hemisphere. The highest concentrations were observed north of 30°N, within the equatorial region, and south of 40°S. This trend is particularly pronounced in the data from AMT24 (Figure 3).
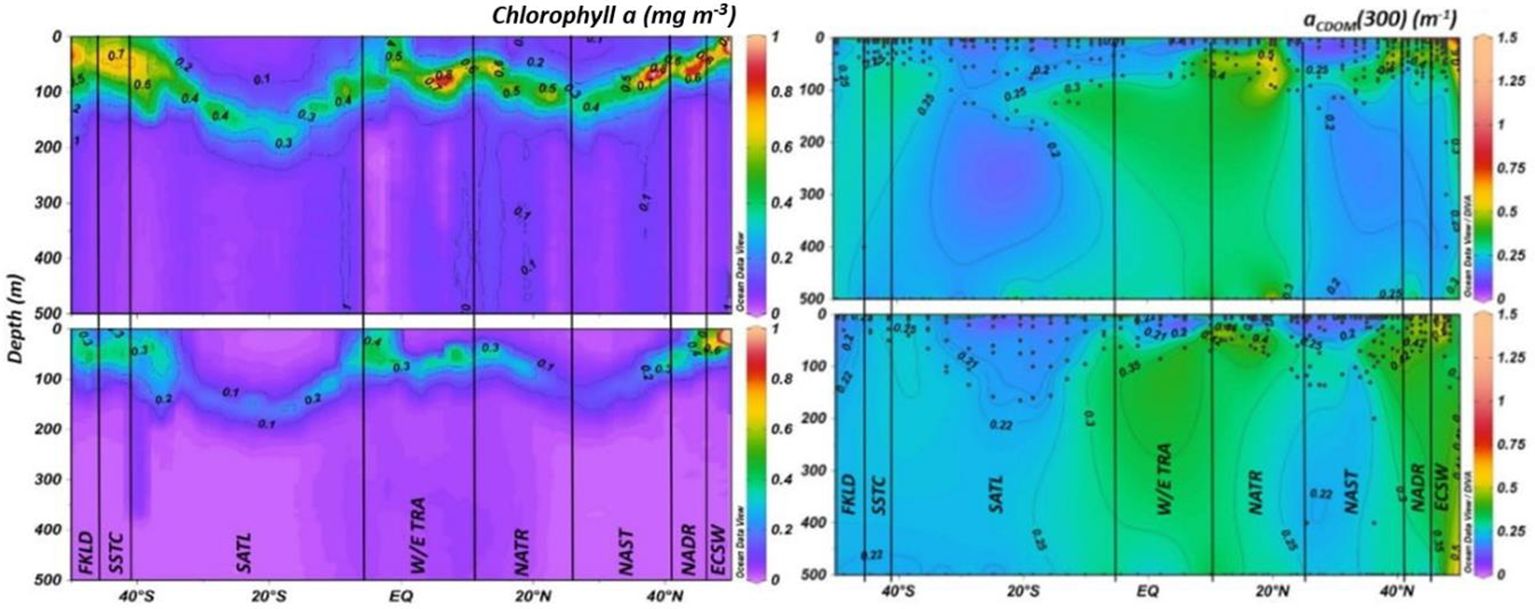
Figure 3 Latitudinal cross sections of chlorophyll a (mg m-3) (left panel) and depth-cross sections of aCDOM(300) (m-1) including the Atlantic SML (right panel) during AMT24 (top) and AMT25 (bottom). The chlorophyll data were derived from a fluorescence sensor fitted on the CTD rosette. Black dots represent latitude and depth of individual samples. Biogeochemical provinces are: European Continental Shelf Water (ECSW); North Atlantic Drift Region (NADR); North Atlantic Subtropical Region (NAST); North Atlantic Tropical Region (NATR); Western/Eastern Tropical Atlantic (W/E TRA); South Atlantic Gyre (SATL); South Subtropical convergence zone (SSTC); and Falkland Islands (FKLD), all bordered by solid black lines.
A peak in aCDOM(300) at the very end of transects in ECSW waters down to 150 m depth, observed during both AMT24 and AMT25, might be associated with regional chlorophyll a maxima. Additionally, the sustained higher levels of aCDOM(300) observed within the water column in ECSW and NADR could be attributed to the advection of terrestrially-derived material from the continental shelf, which was more pronounced during AMT25. The second set of regional/latitudinal maxima of aCDOM(300) was identified in the northern tropical region between NATR and W/E TRA, at depths greater than 20 m in NATR and around 50 m in W/E TRA, respectively (Figure 3). In the southern Hemisphere, aCDOM(300) was statistically lower than in the Northern Hemisphere (p < 0.001). At high Southern Hemisphere latitudes, specifically in SSTC and FKLD, aCDOM(300) was slightly elevated in upper layers compared to the lower latitudes of SATL, correlating with a shallower DCM at approximately 50 m (Figure 3 and Supplementary Table S4). aCDOM(300) minima on the other hand, exhibited less variability, characterized by a deep DCM and low surface chlorophyll a, as documented by Aiken et al. (2000), in both the northern and southern Atlantic gyres (NAST and SATL) (Figure 3). Additionally, within the upper 100 m of the water column in the oligotrophic SATL, aCDOM(300) showed more homogeneity and lower concentrations than in NAST (Supplementary Table S4). The S1 maxima coincided with DCM depths observed in NAST above ~ 50 m, above ~ 20 m in the equatorial region of NATR and W/E TRA, and in low latitudes in the SATL, consistently observed between the two expeditions. On the other hand, S1 minima were determined at the northern and southern ends of transects (specifically ECSW, NADR, SSTC, and FKLD (Figure 4).
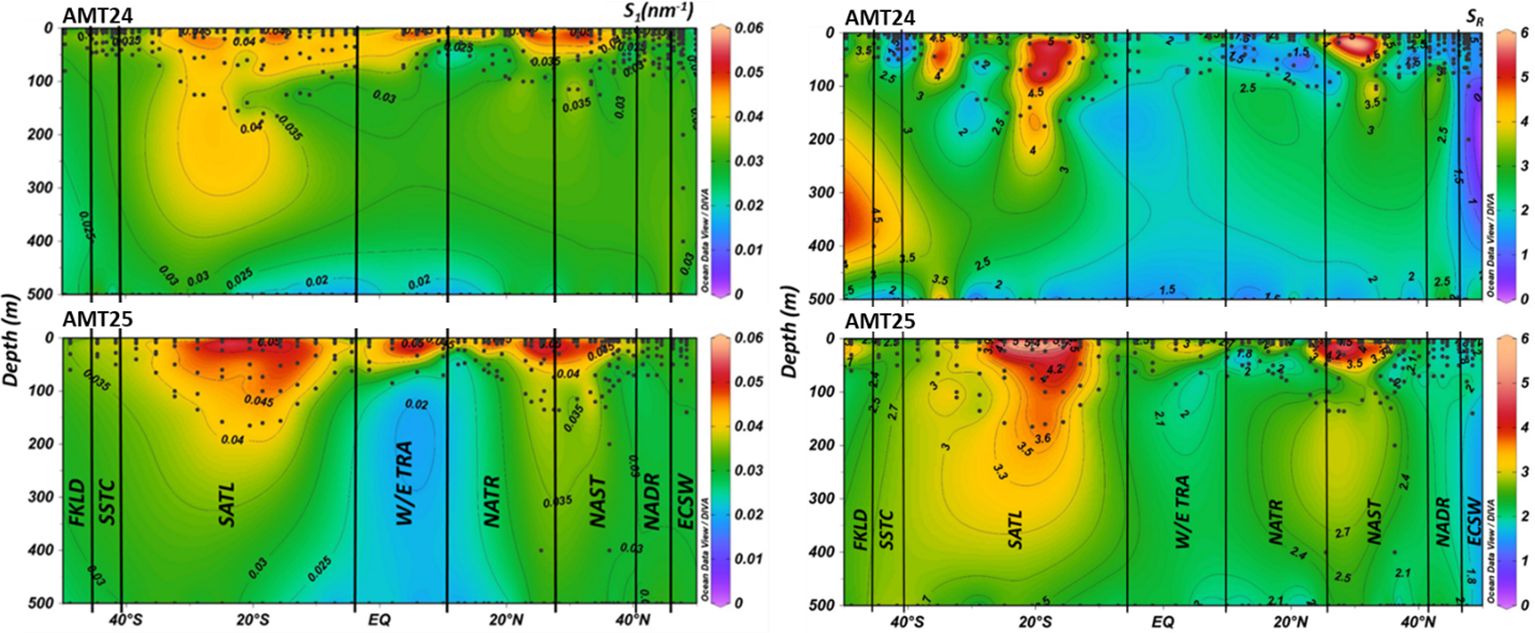
Figure 4 Distribution of S1 (left panel) and SR (right panel) in the depth-cross sections of the Atlantic Ocean during AMT24 (top) and AMT25 (bottom) expeditions. Black dots represent latitude and depth of individual sample locations. The black solid lines depict the borders between different water masses.
The lower S1 values were identified at depths exceeding 30 m in NATR and 80 m in W/E TRA, coinciding with aCDOM(300) maxima, while S1 minima were observed in these regions at depths exceeding ~ 50 m (Figures 3, 4). Following the S1 pattern, SR maxima were predominantly observed in the upper layers of the oligotrophic NAST, primarily at depths shallower than ~ 60 m, and in the SATL. Additionally, there was a notable high SR at depths below 200 m at the southern end of the transect, specifically FKLD, more prominently evident on AMT24 (Figure 4). Conversely, SR minima were identified at the northern end of the transects, i.e., ECSW, and in the tropical and equatorial regions at depths below 20 m, aligning with the S1 trend and in contrast to the aCDOM(300) distribution (Figures 3, 4).
Upon further investigation, we found the overall relationship between aCDOM(300) and S1 in the Atlantic Ocean to exhibit a significant inverse correlation, both in the SML (r = -0.80, p < 0.001, n = 114) and in depth profiles (r2 = -0.60, p < 0.001, n = 845) (Figure 5).
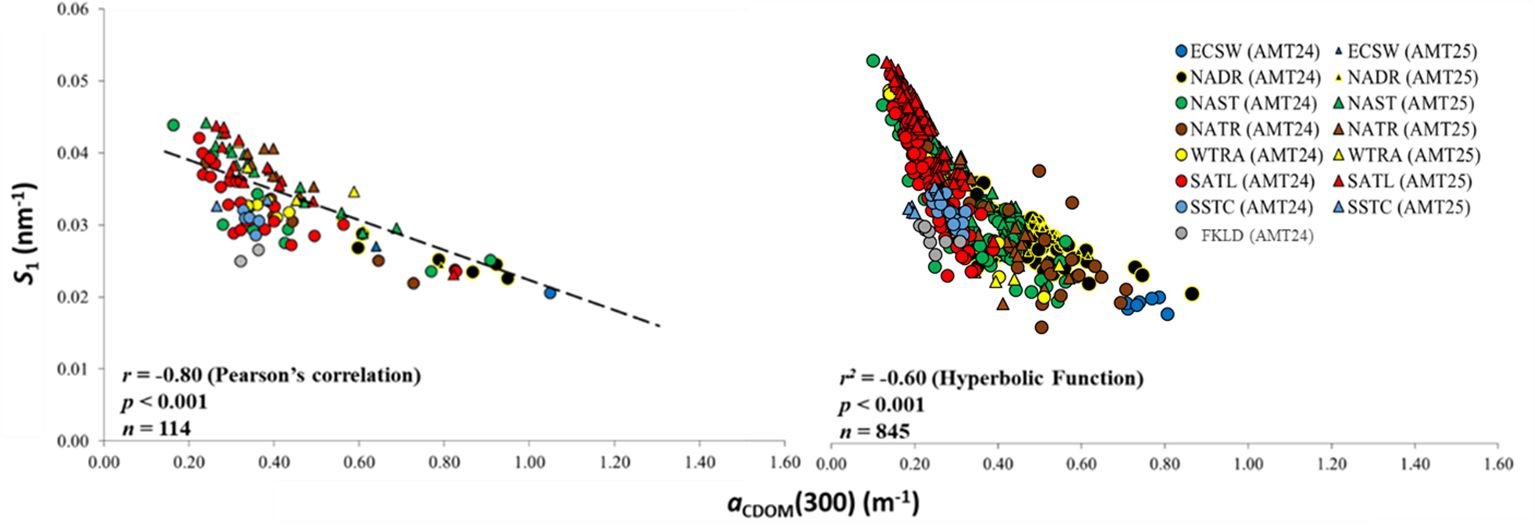
Figure 5 aCDOM (300) vs S1 in the SML (left) and in depth profiles (0 m ≤ depth ≤ 500 m) (right) during AMT24 and AMT25. The dashed line represents the best fit of the data to a linear model (left).
In general, S1 consistently showed an asymptotic decrease with increasing aCDOM(300) on both cruises, with the highest S1 coinciding with the lowest aCDOM(300) in both the SML and in depth profiles (Figure 5). The highest aCDOM(300), associated with the lowest S1, was observed in ECSW and NADR depth profiles, while the highest S1 associated with the lowest aCDOM(300) was observed in the oligotrophic waters of SATL during both AMT24 and AMT25. The overall trend displayed a less pronounced shift, and the regression curve exhibited a slight leveling off within the depth profiles in the tropical region (Figure 5).
3.3 CDOM-chlorophyll a association
Considering that CDOM in the open ocean is primarily derived from phytoplankton (e.g., Carder et al., 1989; Hansell and Carlson, 2014), we examined potential relationships between aCDOM(300) and chlorophyll a. For the depth profile data, we found no statistically significant correlations (Spearman rank order correlation coefficient; r2 = 0.45, p > 0.001, n = 661) (Figure 6).
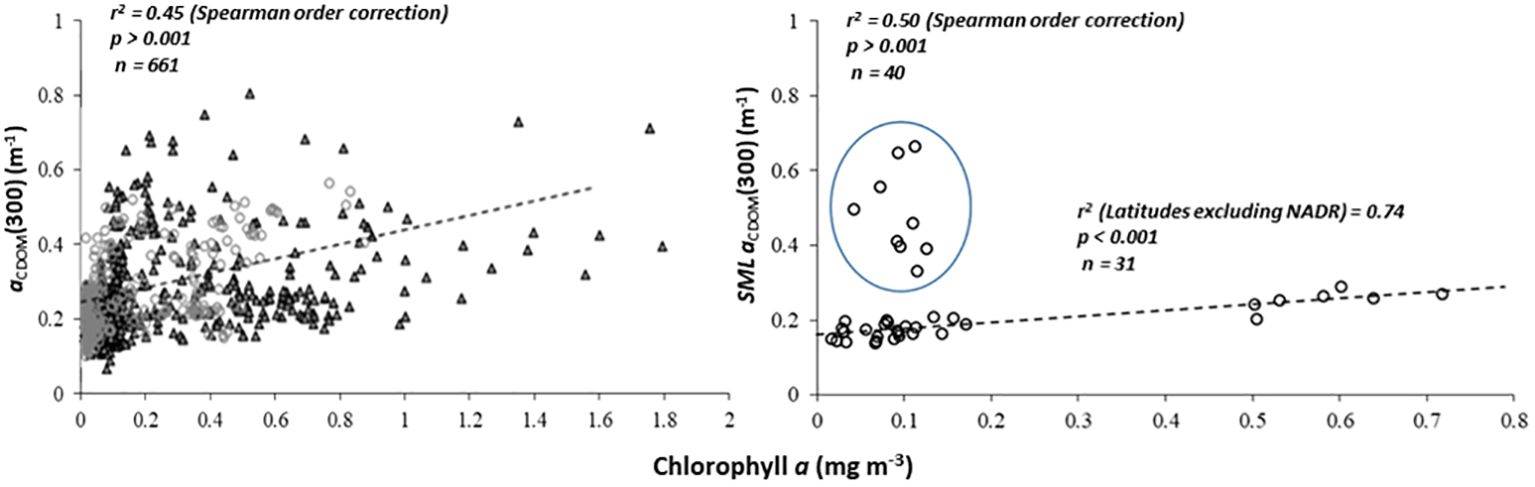
Figure 6 aCDOM(300) versus chlorophyll α for non-SML samples at depths ≤ 500 m (left panel), and for SML samples (right panel) during AMT24 and AMT25. Points circled in blue are high latitude samples from NADR.
We also found no significant correlations between SML aCDOM(300) and chlorophyll a (p > 0.001) for the complete dataset. Removing a group of high latitude samples (NADR circled in blue, Figure 6), improved the correlation (r2 = 0.74, p < 0.001, n = 31).
4 Discussion
SML aCDOM(300) in the Atlantic Ocean was maximal at high latitudes in NADR. Conversely, a significant decrease in SML aCDOM(300) was observed in the oligotrophic region of NAST during both transects. The elevated SML aCDOM(300) at higher latitudes has been previously attributed to increased regional productivity and biomass levels in continental shelf waters during sampling in boreal spring (Stubbins et al., 2006, unpublished data). However, further investigation during this study revealed no significant correlation between SML aCDOM(300) and chlorophyll a at high latitudes in the Northern Hemisphere, indicating the influence of other regional sources of CDOM such as terrestrial deposition. Additionally, the enrichment and removal of oceanic CDOM within the SML involves complex processes and multiple parameters, including photodegradation, bacterial production and consumption, and zooplankton grazing, which may camouflage any single relationship between chlorophyll a and CDOM (e.g., Carlson, 1983, 1993). Similarly, in our study, aCDOM(300) and chlorophyll a for water column samples down to a maximum depth of 500 m were not significantly correlated. This leads us to suggest that any association between CDOM and chlorophyll a might be biogeochemical province-dependent, with a stronger correlation observed towards lower latitudes where terrestrial CDOM sources are less diverse. On the other hand, instantaneous chlorophyll concentrations may not be suitable indicators of CDOM abundance, as CDOM production from phytoplankton-derived organic matter involves microbial processing over timescales of months (e.g., Nelson et al., 1998; Boss et al., 2001). In support of this, an earlier study conducted during the phytoplankton spring bloom in the Sargasso Sea reported no significant correlation between aCDOM(300) and chlorophyll a (r2 = 0.45, p > 0.05) (Nelson et al., 1998). In a recent study conducted during AMT26 (Dall’Olmo et al., 2017) a positive correlation was observed between chlorophyll and aCDOM(400) but with substantial variabilities in this relationship. These variabilities suggest that the dynamics of CDOM are influenced by processes distinct from those governing phytoplankton pigments. While acknowledging the correlation, the study implies that chlorophyll may not be an exclusive indicator of CDOM. The findings underscore the presence of additional factors beyond phytoplankton dynamics that contribute to shaping the distribution of CDOM in the Atlantic Ocean. Considering previous suggestions and the findings of our study, we propose that dynamics of CDOM optical properties in the SML may be better explained by a combination of both biological and non-biological factors. This supports the notion that CDOM is also produced as a degradation product of phytoplankton via zooplankton grazing and, primarily, bacterial degradation (e.g., Siegel and Michaels, 1996; Nelson et al., 1998). Consequently, we support the idea that chlorophyll is an inadequate proxy for estimating CDOM due to their temporal decoupling in the oceans.
The robust positive correlation between SML aCDOM(300) and SSW aCDOM(300), as identified in this study, aligns with previous research reporting statistically significant relationships between SML aCDOM(305), SML (DOC), and SML (DMS) concentrations and their corresponding subsurface waters in oceanic samples (e.g., Yang et al., 2006, 2009). The SML consistently exhibited enrichment in CDOM compared to the corresponding subsurface waters, with EF aCDOM(300) maxima observed in the Northern tropical region and EF aCDOM(300) minima in the Southern Hemisphere. These findings are consistent with those of Tilstone et al. (2010), who identified SML aCDOM(300) maxima with concentrations more than twice those of subsurface waters (2.0 m depth) in an active upwelling area off the Iberian Peninsula. In Jiazhou Bay, China, during autumn and winter, CDOM was also found to be enriched in the SML compared to the underlying waters, with an EF aCDOM(300) of 1.84 (Zhang and Yang, 2013).
A negative correlation between aCDOM(300) and salinity and temperature in SML samples was reported previously by Kitidis et al. (2006), who observed a decrease in aCDOM(350) with increasing salinity, indicating CDOM removal. Similarly, we also found a negative relationship between aCDOM(300) and these variables; however, the correlation was not statistically significant.
The “removal” of CDOM with increasing salinity may coincide with surface waters, where the rise in salinity driven by high solar irradiance correlates with photochemical removal.
Additionally, the observed positive correlation between aCDOM(300) and wind speed (U10n) during this study may support our previous suggestion that the enrichment of organic compounds in the SML occurs through wind-driven bubble scavenging, which facilitates the transport of these compounds from the SSW to the SML (Sabbaghzadeh et al., 2017). However, this study did not reveal a strong correlation between instantaneous wind speeds and CDOM EFs. Therefore, we propose that under conditions of high wind speeds, turbulence, and generated bubbles, the enrichment of the SML is a complex process that obscures any simple relationships between wind speed and the enrichment of CDOM in the SML. This proposition aligns with the insights of Wurl et al. (2011), who also suggested an intricate enrichment process at high wind speeds, impacting the simple relationship between organic matter enrichment in the SML and wind speeds in both coastal and oceanic samples.
UV-resistant phytoplankton exudates such as MAAs, which share many optical characteristics with CDOM, may be found in the SML (Tilstone et al., 2010). Tilstone et al. (2010) identified the presence of MAAs in the NATR, which recorded one of the highest EF aCDOM(300) in the Atlantic Northern Hemisphere. However, distinct CDOM absorption spectra related to the presence of MAAs were not frequently observed in our work. An alternative possibility is that photo-resistant CDOM derived from algae is transformed into an inactive form resistant to photodegradation (e.g., Nelson et al., 1998).
To further characterize CDOM, we determined CDOM spectral slope factors after Helms et al. (2008) and we found lower SML(SR) compared to SSW(SR). One possible explanation for the lower spectral slopes in the SML compared to underlying waters is the local microbial release of CDOM directly into the SML due to light exposure. Microbial processes, such as growth, exudation, and lysis in the euphotic zone, may lead to the production of CDOM with higher molecular weight, resulting in a lower spectral slope ratio (e.g., Helms et al., 2008; Kowalczuk et al., 2013; Galgani and Engel, 2016). Another possibility for the lower SML (SR) compared to underlying waters could be the terrestrial source of high molecular weight CDOM in the coastal waters. The maximum SML(SR) in NAST and SATL regions, associated with high S1 compared to other provinces, may indicate CDOM photodegradation in these clear, less productive water masses (Helms et al., 2008).
Our aCDOM(300) depth profiles concur with those previously reported for oceanic samples. A mean aCDOM(300)< 0.50 within the entire water column is close to values reported for the Mid-Atlantic Bight, the western tropical Atlantic, and the Sargasso Sea (e.g., Nelson et al., 1998; Del Vecchio and Blough, 2004). On AMT20, Kowalczuk et al. (2013) also measured aCDOM(305) with an average of = 0.23 m-1 to a depth of 300 m in the Atlantic Ocean.
The occurrence of aCDOM(300) maxima in ECSW and NADR in waters to about 150 m depth observed mostly on AMT24 was linked to regional chlorophyll a maxima. On AMT25, the high aCDOM(300) persisted throughout the water column to a depth of about 500 m. The observation that the DCM did not deepen further on AMT25 relative to AMT24 suggests that this elevated aCDOM(300) could be attributable to the advection of terrestrially-derived material from the continental shelf, warranting further investigation. Additionally, understanding the potential influence of increased mixing in coastal regions during AMT25 also requires further study. In regions such as NATR and W/E TRA, where high aCDOM(300) levels extended to deeper waters, we recognize the need for additional sampling to elucidate the reasons behind these observations. Given that our data predominantly cover the top 200 m, providing limited resolution in deeper waters, we recommend future studies to include sampling with better resolution to comprehensively investigate the potential causes of high-depth CDOM levels. Additionally, ECSW (SR) minima (i.e., ~ 1.5) concurred with the findings of Kowalczuk et al. (2013), who reported the lowest SR values (i.e., SR ~ 2.0) in the uppermost 100 m of the western European continental shelf, suggesting the presence of high molecular weight terrestrially-derived CDOM. Low CDOM in oligotrophic regions may result from reduced productivity alone or in combination with accelerated CDOM depletion due to photodegradation, leading to CDOM transformation in optically clear waters. This transformation is associated with elevated S1 (~ 0.05) and maximum SR values (e.g., Helms et al., 2008; Kowalczuk et al., 2013; Zhang and Yang, 2013). The observed high SR in NAST and SATL aligns with previous reports by Kowalczuk et al. (2013), indicating high SR (~ 3.0) in the Atlantic oligotrophic gyres, and thus suggestive of CDOM photodegradation in these less productive waters. Our data consistently show that SR is highest in the subtropical gyres, which receive the highest irradiance. This elevated SR is maintained throughout the two studied seasons, as evidenced by similar high SR values during both expeditions.
The earlier hypotheses proposed CDOM distribution to be primarily governed by CDOM production near the DCM and its subsequent upward transport through diffusion and biological transport, facilitated by the diurnal migration of plankton. Its removal has primarily been attributed to photooxidation, particularly during summer (e.g., Siegel and Michaels, 1996). However, our findings are suggestive of a province-dependent pattern of CDOM distributions in the upper 500 m of the Atlantic Ocean. In the low latitudes of NATR and W/E TRA, a distinct pattern of high aCDOM(300) and low SR indicates discharge of terrestrially-derived CDOM. In contrast, the oligotrophic subtropical regions of NAST and SATL exhibit lower aCDOM(300) and higher SR that presumably represent degraded and older ‘background’ (refractory) biologically-derived CDOM (e.g., Stedmon and Markager, 2001; Kitidis et al., 2006; Hansell and Carlson, 2014). While no strong correlation was identified between aCDOM(300) and chlorophyll a, either in the SML or in depth profiles, additional investigation revealed the potential for a linear regression model to predict CDOM absorption coefficient using chlorophyll a as a proxy with better than 70% accuracy in some regions (Figure 6). Notably, this predictive model exhibited province-dependent characteristics. We contend that predicting CDOM from chlorophyll a may potentially be of most value in open ocean waters where in-situ biological production is the predominant CDOM source, and where additional CDOM sources, such as terrestrially-derived material is absent.
5 Conclusion
Our broad findings regarding oceanic CDOM properties are consistent with those from previous studies. By combining these findings, we have identified a complex set of potential drivers of CDOM distribution and spectral properties, clearly reflected in the biogeochemical province-dependency we have observed. Of particular note is the strong province-dependency of CDOM vs chlorophyll a, which will likely confound any efforts to predict one from the other, especially in coastal waters where we consistently found the correlations to be weakest. An especially novel aspect of our work was the comparably complex behavior we observed for CDOM in the SML, which deviates from that characteristic of the underlying waters. The processes responsible for CDOM enrichment in the SML clearly challenge their adequate explanation via simple relationships, for example those dominated solely by wind-driven turbulence and bubble-mediated transport. To conclude, understanding the drivers of CDOM dynamics in the oceans remains a substantial challenge, which is further complicated by region-specific considerations. We believe that additional studies complementing the work we have described here will drive further advances in our understanding of the complex behavior of CDOM in the marine environment.
Data availability statement
The datasets presented in this study can be found in online repositories. The names of the repository/repositories and accession number(s) can be found below: British Oceanographic Data center (BODC) (www.BODC.ac.uk).
Author contributions
BS: Conceptualization, Data curation, Formal analysis, Investigation, Methodology, Resources, Validation, Visualization, Writing – original draft, Writing – review & editing. GU: Supervision, Visualization, Writing – review & editing. RU-G: Funding acquisition, Supervision, Writing – review & editing.
Funding
The author(s) declare financial support was received for the research, authorship, and/or publication of this article. This work was supported by the UK Natural Environment Research Council (NERC: grant NE/K00252X/1 to R.C.U.G.) and is a component of RAGNARoCC (Radiatively active gases from the North Atlantic Region and Climate Change), which contributes to NERC’s Greenhouse Gas Emissions and Feedbacks program (http://www.nerc.ac.uk/research/funded/programmes/greenhouse/). AMT contributes to the international IMBER initiative and is supported by NERC National Capability funding to PML and the National Oceanography Centre, Southampton. This is AMT contribution number 295. The author confirms that the publication fee was supported by funding from the Leibniz Open Access Publishing Fund (https://www.leibniz-gemeinschaft.de/en/research/open-science-and-digitalisation/open-access/journal-publishing-fund.html), Germany. Additionally, part of the publication fee was covered by the editorial board, with Professor Mostofa agreeing to cover the remaining portion of the fee for the editorial points.
Conflict of interest
The authors declare that the research was conducted in the absence of any commercial or financial relationships that could be construed as a potential conflict of interest.
Publisher’s note
All claims expressed in this article are solely those of the authors and do not necessarily represent those of their affiliated organizations, or those of the publisher, the editors and the reviewers. Any product that may be evaluated in this article, or claim that may be made by its manufacturer, is not guaranteed or endorsed by the publisher.
Supplementary material
The Supplementary Material for this article can be found online at: https://www.frontiersin.org/articles/10.3389/fmars.2024.1432133/full#supplementary-material
Abbreviations
CDOM, chromophoric dissolved organic matter; SML, sea surface microlayer; SSW, subsurface seawater; AMT, Atlantic Meridional Transect; aCDOM(300), CDOM absorption coefficient at 300 nm; S, spectral slope; S1, spectral slope across wavelength ranges of 275-295; S2, spectral slope across wavelength ranges of 350-400; SR, spectral slope ratio; NADR, North Atlantic Drift Region; EF, enrichment factor; r2, Spearman’s rank correlation coefficient; p, probability; n, sample number; AOU, apparent oxygen utilization; ECSW, European Continental Shelf Water; NAST, North Atlantic Subtropical; NAST (E), North Atlantic Subtropical (Eastern); NAST (W) North Atlantic Subtropical (Western); NATR, North Atlantic Tropical Region; WTRA, Western Tropical Atlantic; ETRA, Eastern Tropical Atlantic; SATL, South Atlantic Gyre; SSTC, South Subtropical Convergence Zone; FKLD, Falkland Islands; CTD, Conductivity, temperature, and depth; BODC, British Oceanographic Data Centre; U10n, wind speed at a reference height of 10 m corrected to neutral stability; MAAs, Mycosporine-like Amino Acids.
References
Aiken J., Rees N., Hooker S., Holligan P., Bale A., Robins D., et al. (2000). The Atlantic Meridional Transect: overview and synthesis of data. Prog. Oceanogr. 45, 257–312. doi: 10.1016/S0079-6611(00)00005-7
Andrew A. A., Walker S. L., Murray J. W., Codispoti L. A. (2013). Chromophoric dissolved organic matter in the eastern Atlantic Ocean. Mar. Chem. 148, 15–24. doi: 10.1016/j.marchem.2012.11.001
Blough N. V., Del Vecchio R. (2002). “Chromophoric DOM in the coastal environment,” in Biogeochemistry of marine dissolved organic matter. Eds. Carlson C. A., Hansell D. A. (Academic Press), 509–546. doi: 10.1016/B978-012323841-2/50012-9
Boss E., Pegau W. S., Zaneveld J. R. V., Barnard A. H. (2001). Spatial and temporal variability of absorption by dissolved material at a continental shelf. JGR: Oceans 106, 9499–9507. doi: 10.1029/2000JC900008
Bracchini L., Tognazzi A., Dattilo A. M., Decembrini F., Rossi C., Loiselle S. A. (2010). Sensitivity analysis of CDOM spectral slope in artificial and natural samples: an application in the central eastern mediterranean basin. Aquat. Sci. 72, 485–498. doi: 10.1007/s00027-0100150-y
Carder K. L., Steward R. G., Harvey G. R., Ortner P. B. (1989). Marine humic and fulvic acids: Their effects on remote sensing of ocean chlorophyll. Limnol. oceanogr. 34, 68–81. doi: 10.4319/lo.1989.34.1.0068
Carlson D. J. (1983). Dissolved organic materials in surface microlayers: Temporal and spatial variability and relation to sea state. Limnol. Oceanogr. 28, 415–431. doi: 10.4319/lo.1983.28.3.0415
Carlson D. J. (1993). “The early diagenesis of organic matter: reaction at the air-sea interface,” in The Organic geochemistry: principles and applications. Ed. Engel M. H. (Springer), 255–268.
Coble P. G. (2007). Marine optical biogeochemistry: the chemistry of ocean color. Chem. Rev. 107, 402–418. doi: 10.1021/cr050350+
Cunliffe M., Engel A., Frka S., Gašparović B., Guitart C., Murrell J. C., et al. (2013). Sea surface microlayers: A unified physicochemical and biological perspective of the air–ocean interface. Prog. Oceanogr. 109, 104–116. doi: 10.1016/j.pocean.2012.08.004
Dall’Olmo G., Brewin R. J., Nencioli F., Organelli E., Lefering I., McKee D., et al. (2017). Determination of the absorption coefficient of chromophoric dissolved organic matter from underway spectrophotometry. Optics express 25, A1079–A1095. doi: 10.1364/OE.25.0A1079
Del Vecchio R., Blough N. V. (2004). Spatial and seasonal distribution of chromophoric dissolved organic matter in the Middle Atlantic Bight. Mar. Chem. 89, 169–187. doi: 10.1016/j.marchem.2004.02.027
Dickson A. G. (1990). Thermodynamics of the dissociation of boric acid in synthetic seawater from 273.15 to 318.15 K. Deep-Sea Res. Part I: Oceanographic Res. Papers 37, 755–766. doi: 10.1016/0198-0149(90)90004-F
D’Sa E., DiMarco S. (2009). Seasonal variability and controls on chromophoric dissolved organic matter in a large river-dominated coastal margin. Limnol. Oceanogr. 54, 2233–2242. doi: 10.4319/lo.2009.54.6.2233
Galgani L., Engel A. (2016). Changes in optical characteristics of surface microlayers hint to photochemically and microbially mediated DOM turnover in the upwelling region off the coast of Peru. Biogeosci 13, 2453–2473. doi: 10.5194/bg-13-2453-2016
Garrett W. D. (1965). Collection of slick-forming materials from the sea surface. Limnol. Oceanogr. 10, 602–605. doi: 10.4319/lo.1965.10.4.0602
Hansell D. A., Carlson C. A. (2014). Biogeochemistry of marine dissolved organic matter (Academic Press).
Hardy J. T. (1982). The sea surface microlayer: Biology, chemistry and anthropogenic enrichment. Prog. Oceanogr. 11, 307–328. doi: 10.1016/0079-6611(82)90001-5
Helms J. R., Stubbins A., Ritchie J. D., Minor E. C., Kieber D. J., Mopper K. (2008). Absorption spectral slopes and slope ratios as indicators of molecular weight, source, and photobleaching of chromophoric dissolved organic matter. Limnol. Oceanogr. 53, 955–969. doi: 10.4319/lo.2008.53.3.0955
Iuculano F., Álverez-Salgado X. A., Otero. J., Catalá. T. S., Sobrino. C., Duarte C. M., et al. (2019). Patterns and drivers of UV absorbing chromophoric dissolved organic matter in the euphotic layer of the open ocean. Front. Mar. Sci. 6. doi: 10.3389/fmars.2019.00320
Kitidis V., Stubbins A. P., Uher G., Goddard R. C. U., Law C. S., Woodward E. M. S. (2006). Variability of chromophoric organic matter in surface waters of the Atlantic Ocean. Deep Sea Res. Part II: Topical Stud. Oceanogr. 53, 1666–1684. doi: 10.1016/j.dsr2.2006.05.009
Kowalczuk P., Tilstone G. H., Zabłocka M., Röttgers R., Thomas R. (2013). Composition of dissolved organic matter along an Atlantic Meridional Transect from fluorescence spectroscopy and Parallel Factor Analysis. Mar. Chem. 157, 170–184. doi: 10.1016/j.marchem.2013.10.004
Longhurst A. (1995). Seasonal cycles of pelagic production and consumption. Prog. Oceanogr. 36, 77–167. doi: 10.1016/0079-6611(95)00015-1
Matsuoka A., Bricaud A., Benner R., Para J., Sempéré R., Prieur L., et al. (2012). Tracing the transport of colored dissolved organic matter in water masses of the Southern Beaufort Sea: relationship with hydrographic characteristics. Biogeosci 9, 925–940. doi: 10.5194/bg-9-925-2012
Miller R. L., Belz M., Del Castillo C., Trzaska R. (2002). Determining CDOM absorption spectra in diverse coastal environments using a multiple pathlength, liquid core waveguide system. Continental Shelf Res. 22, 1301–1310. doi: 10.1016/S0278-4343(02)00009-2
Nelson N. B., Gauglitz J. M. (2016). Optical signatures of dissolved organic matter transformation in the global ocean. Front. Mar. Sci. 2, 118. doi: 10.3389/fmars.2015.00118
Nelson N. B., Siegel D. A. (2013). The global distribution and dynamics of chromophoric dissolved organic matter. Ann. Rev. Mar. Sci. 5, 447–476. doi: 10.1146/annurev-marine-120710-100751
Nelson N. B., Siegel D. A., Carlson C. A., Swan C., Smethie C.OMMAJr. W. M., Khatiwala S. (2007). Hydrography of chromophoric dissolved organic matter in the North Atlantic. Deep Sea Res. Part I: Oceanographic Res. Pap. 54, 710–731. doi: 10.1016/j.dsr.2007.02.006
Nelson N. B., Siegel D. A., Michaels A. F. (1998). Seasonal dynamics of colored dissolved material in the Sargasso Sea. Deep Sea Res. Part I: Oceanographic Res. Pap. 45, 931–957. doi: 10.1016/S0967-0637(97)00106-4
Nightingale P. D., Liss P. S., Schlosser P. (2000). Measurements of air-sea gas transfer during an open ocean algal bloom. Geophysical Res. Lett. 27, 2117–2120. doi: 10.1029/2000GL011541
Organelli E., Bricaud A., Antoine D., Matsuoka A. (2014). Seasonal dynamics of light absorption by chromophoric dissolved organic matter (CDOM) in the NW Mediterranean Sea (BOUSSOLE site). Deep Sea Res. Part I: Oceanographic Res. Papers 91, 72–85. doi: 10.1016/j.dsr.2014.05.003
Pegau W. S., Zaneveld J. R. V. (1993). Temperature-dependent absorption of water in the red and near-infrared portions of the spectrum. Limnol. Oceanogr. 38, 188–192. doi: 10.4319/lo.1993.38.1.0188
Reygondeau G., Longhurst A., Martinez E., Beaugrand G., Antoine D., Maury O. (2013). Dynamic biogeochemical provinces in the global ocean. Global Biogeochemical Cycles 27, 1046–1058. doi: 10.1002/gbc.20089
Sabbaghzadeh B., Upstill-Goddard R. C., Beale R., Pereira R., Nightingale P. D. (2017). The Atlantic Ocean surface microlayer from 50° N to 50° S is ubiquitously enriched in surfactants at wind speeds up to 13 m s– 1. Geophy. Res. Lett. 44, 2852–2858. doi: 10.1002/2017GL072988
Siegel D. A., Maritorena S., Nelson N. B., Behrenfeld M. J., McClain C. R. (2005). Colored dissolved organic matter and its influence on the satellite-based characterization of the ocean biosphere. Geophysical Res. Lett. 32. doi: 10.1029/2005GL024310
Siegel D. A., Michaels A. F. (1996). Quantification of non-algal light attenuation in the Sargasso Sea: Implications for biogeochemistry and remote sensing. Deep Sea Res. Part II: Topical Stud. Oceanogr. 43, 321–345. doi: 10.1016/0967-0645(96)00088-4
Siegel D. A., Maritorena S., Nelson N. B., Hansell D. A., Lorenzi-Kayser M. (2002). Global distribution and dynamics ofcolored dissolved and detrital organic materials. J. Geophys. Res. 107, 3228. doi: 10.1029/2001JC000965
Stedmon C. A., Markager S. (2001). The optics of chromophoric dissolved organic matter (CDOM) in the Greenland Sea: An algorithm for differentiation between marine and terrestrially derived organic matter. Limnol. Oceanogr. 46, 2087–2093. doi: 10.4319/lo.2001.46.8.2087
Stubbins A., Uher G., Law C. S., Mopper K., Robinson C., Upstill-Goddard R. C. (2006). Open-ocean carbon monoxide photoproduction. Deep Sea Res. Part II: Topical Stud. Oceanogr. 53, 1695–1705. doi: 10.1016/j.dsr2.2006.05.011
Tilstone G. H., Airs R. L., Vicente V. M., Widdicombe C., Llewellyn C. (2010). High concentrations of mycosporine-like amino acids and colored dissolved organic matter in the sea surface microlayer off the Iberian Peninsula. Limnol. Oceanogr. 55, 1835–1850. doi: 10.4319/lo.2010.55.5.1835
Twardowski M. S., Boss E., Sullivan J. M., Donaghay P. L. (2004). Modeling the spectral shape of absorption by chromophoric dissolved organic matter. Mar. Chem. 89, 69–88. doi: 10.1016/j.marchem.2004.02.008
Twardowski M. S., Donaghay P. L. (2002). Photobleaching of aquatic dissolved materials: Absorption removal, spectral alteration, and their interrelationship. JGR: Oceans 107, 6–1. doi: 10.1029/1999JC000281
Welschmeyer N. A. (1994). Fluorometric analysis of chlorophyll-a in the presence of chlorophyll-b and phaeopigments. Limnol. Oceanogr. 39, 1985–1992. doi: 10.4319/lo.1994.39.8.1985
Whitehead K., Vernet M. (2000). Influence of mycosporine‐like amino acids (MAAs) on UV absorption by particulate and dissolved organic matter in La Jolla Bay. Limno. Oceanog. 45, 1788–1796. doi: 10.4319/lo.2000.45.8.1788
Wurl O., Wurl E., Miller L., Johnson K., Vagle S. (2011). Formation and global distribution of sea-surface microlayers. Biogeosci 8, 121–135. doi: 10.5194/bg-8-121-2011
Yamashita Y., Nosaka Y., Suzuki K., Ogawa H., Takahashi K., Saito H. (2013). Photobleaching as a factor controlling spectral characteristics of chromophoricdissolvedorganicmatterinopenocean. Biogeosci 10, 7207–7217. doi: 10.5194/bg-10-7207-2013
Yamashita Y., Tanoue E. (2009). Basin scale distribution of chromophoric dissolved organic matter in the Pacific Ocean. Limnol. Oceanogr. 54, 598. doi: 10.4319/lo.2009.54.2.0598
Yang G. P., Jing W. W., Li L., Kang Z. Q., Song G. S. (2006). Distribution of dimethylsulfide and dimethylsulfoniopropionate in the surface microlayer and subsurface water of the Yellow Sea, China during spring. J. Mar. Systems 62, 22–34. doi: 10.1016/j.jmarsys.2006.04.003
Yang G. P., Levasseur M., Michaud S., Merzouk A., Lizotte M., Scarratt M. (2009). Distribution of dimethylsulfide and dimethylsulfoniopropionate and its relation with phytoneuston in the surface microlayer of the western North Atlantic during summer. Biogeochem 94, 243–254. doi: 10.1007/s10533-009-9323-y
Keywords: chromophoric dissolved organic matter (CDOM), Atlantic Ocean, biogeochemical provinces, optical complexity, environmental influences
Citation: Sabbaghzadeh B, Uher G and Upstill-Goddard R (2024) “Dynamics of chromophoric dissolved organic matter in the Atlantic Ocean: unravelling province-dependent relationships, optical complexity, and environmental influences”. Front. Mar. Sci. 11:1432133. doi: 10.3389/fmars.2024.1432133
Received: 13 May 2024; Accepted: 19 June 2024;
Published: 23 July 2024.
Edited by:
Khan M. G. Mostofa, Tianjin University, ChinaReviewed by:
Eurico D’Sa, Louisiana State University, United StatesShuting Liu, Kean University, United States
Copyright © 2024 Sabbaghzadeh, Uher and Upstill-Goddard. This is an open-access article distributed under the terms of the Creative Commons Attribution License (CC BY). The use, distribution or reproduction in other forums is permitted, provided the original author(s) and the copyright owner(s) are credited and that the original publication in this journal is cited, in accordance with accepted academic practice. No use, distribution or reproduction is permitted which does not comply with these terms.
*Correspondence: Bita Sabbaghzadeh, YnNhYmJhZ2hAYW5kcmV3LmNtdS5lZHU=