 Oleg Belyaev1*
 I. Emma Huertas1
 Gabriel Navarro1
 Silvia Amaya-Vías1
 Mercedes de la Paz2
 Erica Sparaventi1
 Sergio Heredia1
 Camila F. Sukekava3
 Luis M. Laglera3
 Antonio Tovar-Sánchez1
- 1Department of Ecology and Coastal Management, Institute of Marine Sciences of Andalusia (CSIC), Puerto Real, Cádiz, Spain
- 2Oceanography Department, Marine Research Institute (CSIC), Vigo, Pontevedra, Spain
- 3Chemistry Department, University of the Balearic Islands (UIB), Mallorca, Spain
Deception Island (DI) is an active volcanic caldera in the South Shetland Islands, Antarctica, with an inner bay, Port Foster, formed by an ancient eruption. The bay’s seafloor hydrofracture system contains hydrothermal seeps and submarine vents, which are a source of trace metals (TMs) like Fe, Ni, Co, V, and greenhouse gases (GHGs) such as CO2 and CH4. This study presents measurements of TMs and GHGs in Port Foster’s surface waters during January-February 2021 to characterize their spatial distribution. TMs concentrations in the northeastern region of the bay, particularly V (74 nM), Fe (361 nM), Co (3.9 nM) and Ni (17.2 nM), were generally higher than in the Southern Ocean, likely due to hydrothermal activity. As some TMs such as Fe are scarce in the SO and limit primary productivity, inputs of these nutrients from DI into surrounding waters may also regionally promote increased primary productivity. Higher surface temperature (ST), elevated partial pressure of CO2 (pCO2), and lower salinity were found near submarine fumaroles, with ST positively correlated with pCO2 and negatively with salinity. Although hydrothermal sites showed localized CO2 outgassing, the bay overall acted as a CO2 sink, with a median flux of -2.78 mol m-2 yr-1 with an interquartile range (IQR) of 3.84 mol m-2 yr-1. CH4 highest concentration levels were found in the southeastern sector. The median concentration was 8.9 nM with an IQR of 1.9 nM, making Port Foster a regional net CH4 source with a median flux of 9.7 μmol m-2 d-1 and an IQR of 3.4 μmol m-2 d-1. Ultimately, the analysis of spatial patterns of the measured variables suggested that fumaroles of DI may be playing a significant role in the alteration of regional seawater biogeochemistry.
1 Introduction
The cycling of chemical compounds in the Southern Ocean (SO) is a fundamental component of the functioning of Earth. By taking up atmospheric CO2 via biological and solubility pump processes and by releasing CO2 from the deep ocean (Gruber et al., 2019), the SO modulates Earth’s climate over seasonal-to-millennial timescales. Observational analyses and numerical models both indicate that the SO currently accounts for 40-50% of anthropogenic carbon uptake by the ocean (Terhaar et al., 2021). The biogeochemical cycling of carbon (C) and, in turn, of macronutrients (i.e., nitrate, nitrite, phosphate and silicate) and trace metals (TMs; e.g., iron (Fe), niquel (Ni), cobalt (Co) or vanadium (V), among others) in the SO has strong implications, not only for regional ecosystem functioning but also for primary production and carbon export throughout the world’s oceans.
The Southern Ocean exhibits substantial spatial and temporal variability in its biogeochemical processes, particularly between the Antarctic shelves and open ocean regions. This variability spans seasonal to decadal timescales, driven by diverse factors including climate change. The Western Antarctic Peninsula (WAP), for instance, has been significantly affected by climate changes over the last 50 years (Morley et al., 2020), with the continental shelf and surrounding areas such as Deception Island (62°57’S, 60°8’W, Figure 1A) showcasing unique environmental phenomena. In this dynamic context, TMs in the Southern Ocean play a relevant role, where they are primarily found in the dissolved phase, complexed with biological or terrestrial ligands that influence their solubility, reactivity, toxicity, and bioavailability. These metals transition from the water column into particulate forms through adsorption onto organic and inorganic suspended particles, processes that are crucial for functions such as carbon fixation, nutrient uptake, and synthesis of vital biomolecules. However, their concentrations must be carefully evaluated in the marine environment because while some metals, like mercury and lead, are inherently toxic at any concentration, others may become toxic in excess (Da Silva and Williams, 2001; Morel and Price, 2003) or in their ionic form, like Cu2+ which in seawater can impede phytoplankton growth (García-Veira et al., 2024). Understanding the roles of TMs in ocean biogeochemistry, particularly in polar regions, remains challenging due to uncertainties about their sources, sinks, and internal cycling. Despite traditionally low estimates of external TM sources to Antarctic waters, recent research indicates that these metals can also reach the ocean through advection of water masses from continental margins, atmospheric deposition, and hydrothermal vent inputs (Xu and Gao, 2014; Janssen et al., 2020). This highlights a more complex and dynamic biogeochemical cycle than previously understood (SCOR Working Group, 2007; Chever et al., 2010; Klunder et al., 2011, 2011). Additionally, locations like Deception Island, part of the South Shetland Islands archipelago, supports large colonies of penguins which are pivotal in local nutrient cycling. These penguins contribute significantly to the biogeochemical cycling of TMs by transferring nutrients from their krill diet into the ecosystem through their excretions. This action enriches the soil and releases substantial amounts of Cu, Fe, Mn, and Zn into the surrounding waters—estimated annually at 28, 521, 4, and 29 tons, respectively (Sparaventi et al., 2021; Belyaev et al., 2023). The role of these TMs in the local biogeochemistry is critical, impacting everything from plant growth to animal health within the ecosystem (Liu et al., 2013; Chu et al., 2019; Castro et al., 2021; Sparaventi et al., 2021; Belyaev et al., 2023).
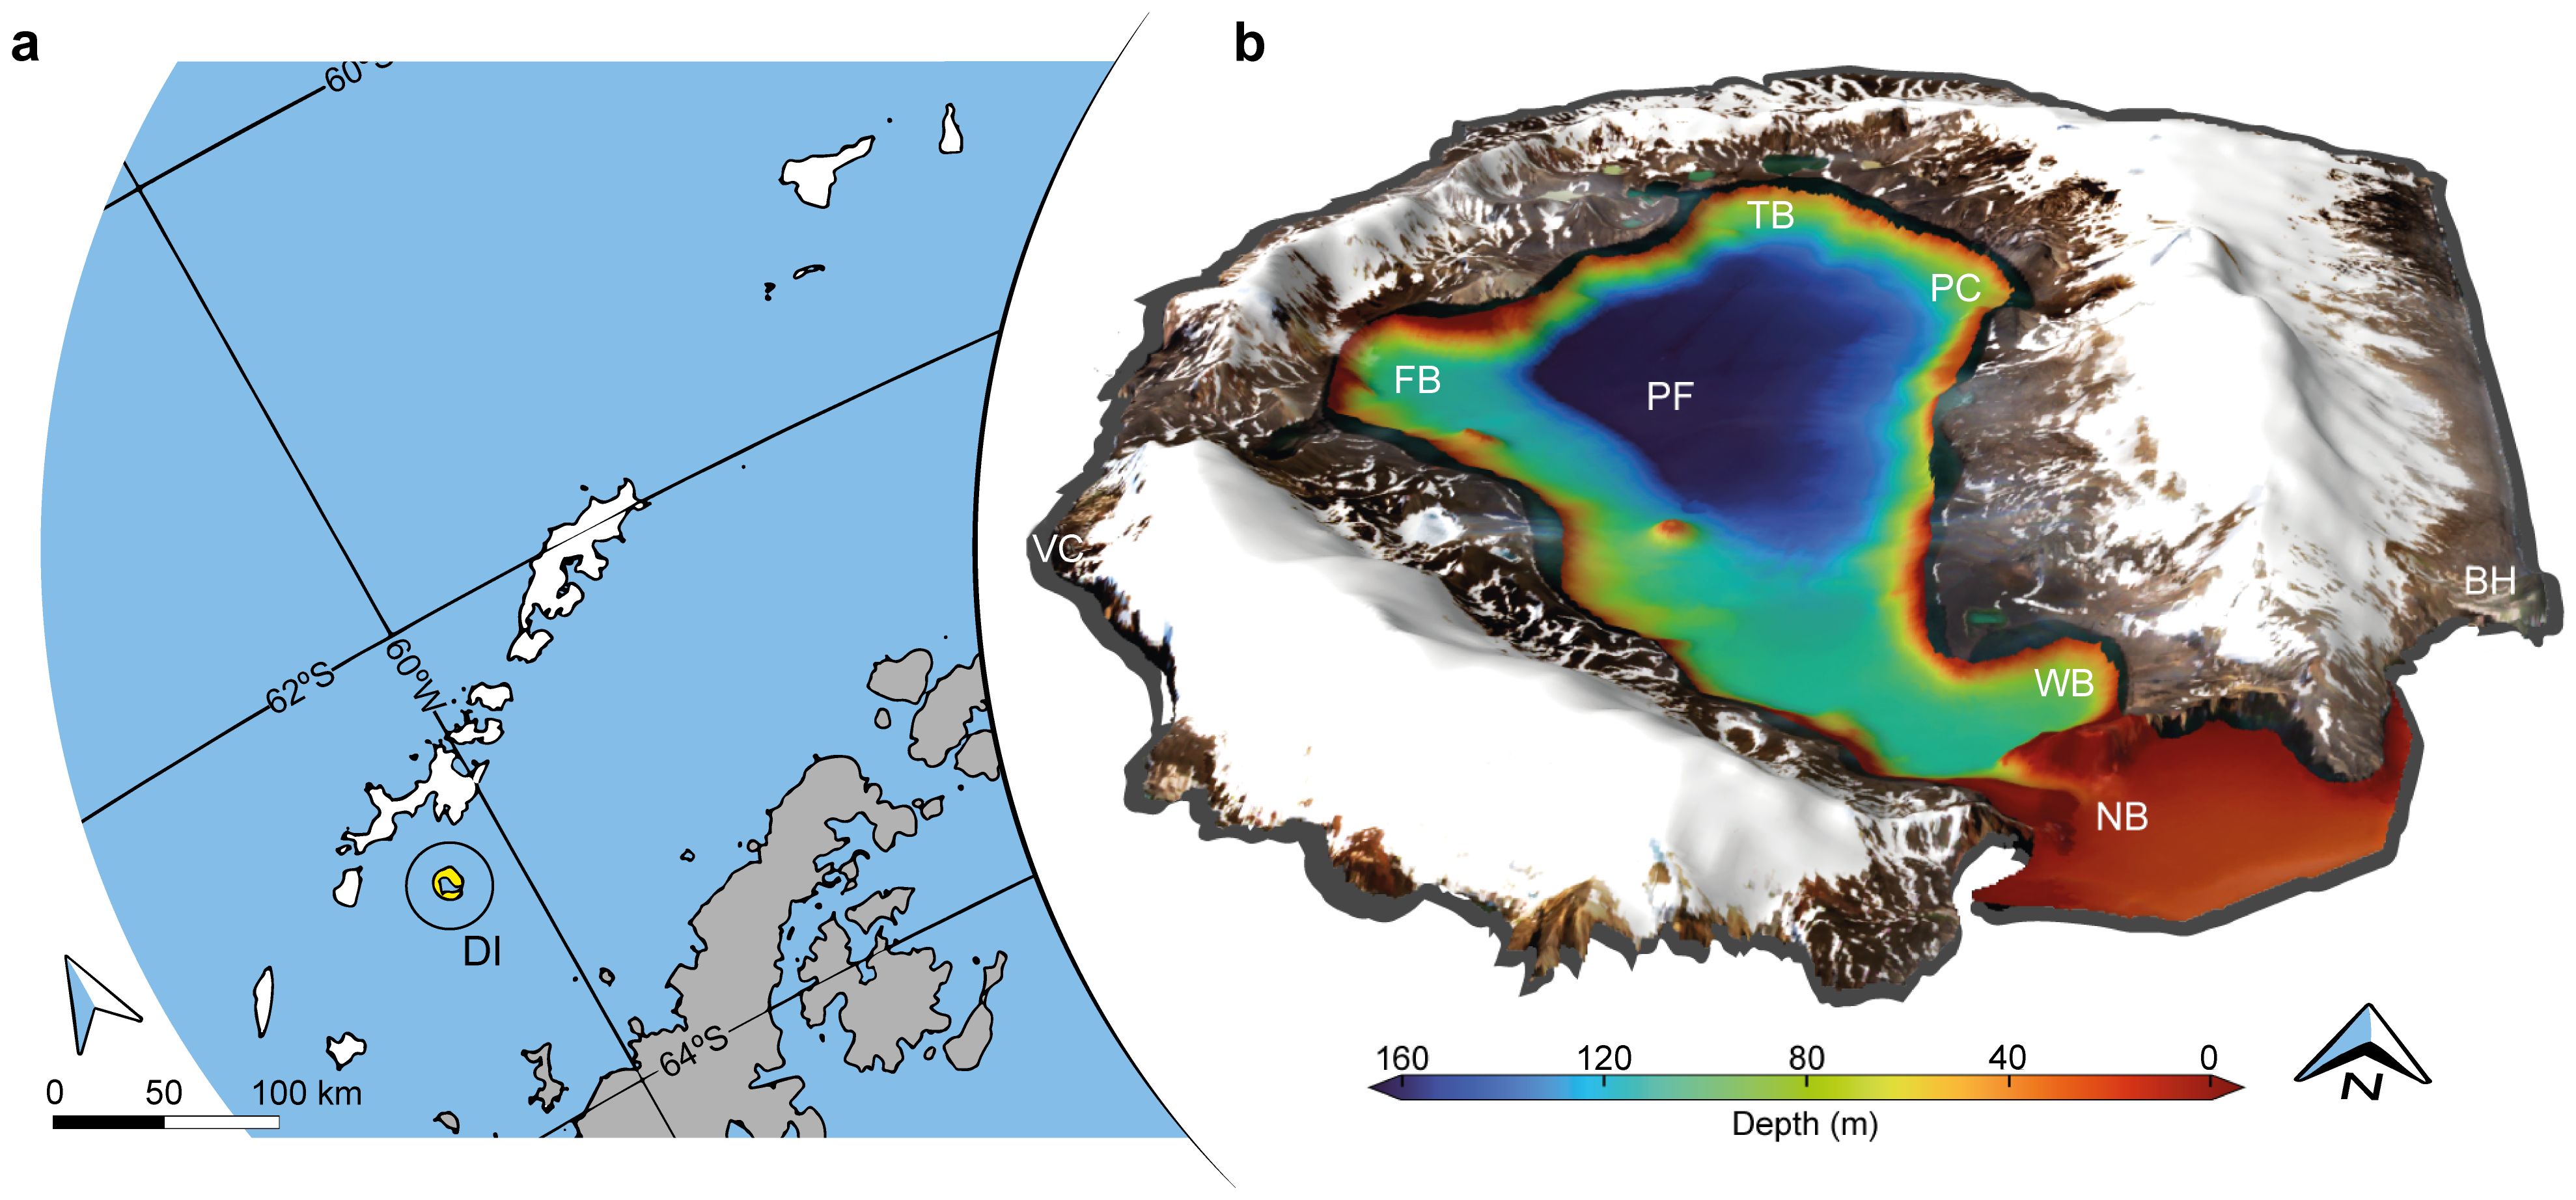
Figure 1. South Shetland Islands archipelago and Deception Island close-up view. (A) South Shetland Islands (highlighted in white) are located north of the West Antarctic Peninsula, with the Drake Passage in the north and the Bransfield Strait in the south. Deception Island (DI) is highlighted in yellow. (B) Sentinel-2 satellite merge with a digital elevation model of DI, displaying Port Foster (PF) bathymetry. VC, Vapor Col; BH, Baily Head; NB, Neptune’s Bellows; PC, Pendulum Cove; TB, Telefon Bay; FB, Fumarole Bay; WB, Whalers Bay.
An intense global effort to quantify marine sources and sinks of greenhouse gases (GHGs) is currently ongoing (Friedlingstein et al., 2020). Nevertheless, there are still certain areas where monitoring is minimal, such as vast regions of the Antarctic basin (Montzka et al., 2011) – leading to a significant lack of accurate measurements in the SO, mainly due to the logistical restrictions of performing oceanographic operations in such areas. In the latest climatology of oceanic CH4 emissions (Weber et al., 2019) no data were available between 0° and 90°W and south of 70°S, as only a few studies have reported surface distribution of CH4 in the SO and with contrasting patterns (Lamontagne et al., 1974; Tilbrook and Karl, 1994; Bates et al., 1996; Heeschen et al., 2004; Yoshida et al., 2011; Bui et al., 2018). The paucity of CO2 and CH4 observations in the SO and particularly over Antarctic sub-shelves, calls for a better documentation of their distribution. In this sense, DI stands out as a volcanic environment populated by numerous hydrothermal vents, which while being a source of TMs also releases a significant amount of gases. The gas mixture released is predominantly CO2 (75-90%), hydrogen sulfide (H2S, 0.3 – 0.9%; Somoza et al., 2004) and methane (CH4) to surrounding waters, therefore raising special interest as a potentially relevant contributor of these gases to this region of the SO.
We hypothesize that the inundated caldera of DI acted as a source of TMs and GHGs to seawater due to its active volcanic and hydrothermal activity. Therefore, the aim of this work was to characterize the spatial distribution of various trace elements (Fe, V, Co and Ni among others) and CO2 and CH4, in surface waters of Port Foster and provide new insights on the role of these geological processes on the occurrence of biogeochemical fertilizers in ocean waters of the SO.
2 Materials and methods
2.1 Study area
Deception Island is one of the most active Antarctic volcanoes, with several sites exhibiting a high geothermal activity, such as Pendulum Cove, Fumarola Bay, Telefon Bay and Whalers Bay (PC, FB, TB and WB respectively in Figure 1B). The island is crossed by three large fault systems (Rey et al., 1995), and many other smaller faults (Maestro et al., 2007). Seismic time series indicate noticeable long events associated to variations in the shallow hydrothermal system, along with earthquakes of a volcano-tectonic origin (Carmona et al., 2012). Port Foster, as the submerged part of the volcano (Figure 1B), experienced eruptive episodes in 1967, 1969 and 1970. During summer, water circulation in Port Foster can be approximated as a two-layers system, which is primarily forced by temperature and cause the upper layer (occupying the first 40-60 m of the water column) to move anticlockwise around the bay. Internal tides originated at the sill of Neptune’s Bellows radiate towards the western side of the bay, favoring mixing and leaving the eastern side in a shadow zone. Sea ice melting associated to hydrothermal activity modify local circulation at small scales (~1 km) (Flexas et al., 2017). During winter, surface cooling mixes the water column until fully homogeneous, with temperatures near freezing.
2.2 Sampling design
In-situ measurements of conductivity (further converted to salinity, S) and surface temperature (ST) combined with collection of water samples in the surface layer (50 cm – 1 m in depth) for further chemical analysis, were conducted using a small boat along a transect consisting of 20 sites for Transect 1 (Leg 1) (January, 29 – Figure 2A) and 15 sites for Transect 2 (Leg 2) (February, 19 – Figure 2B), extending from Neptune’s Bellows to the northernmost section of Port Foster. Due to meteorological and logistic limitations, data for CO2 and CH4 were taken on different sampling days, and with sampling tracks also differing. In selecting our sample sites, we considered that the main CH4 source at DI is related to fumarolic emissions, which are primarily concentrated near the coastline of the island, and that Port Foster is rich in dissolved oxygen which impedes CH4 production by methanogenesis within the bay.
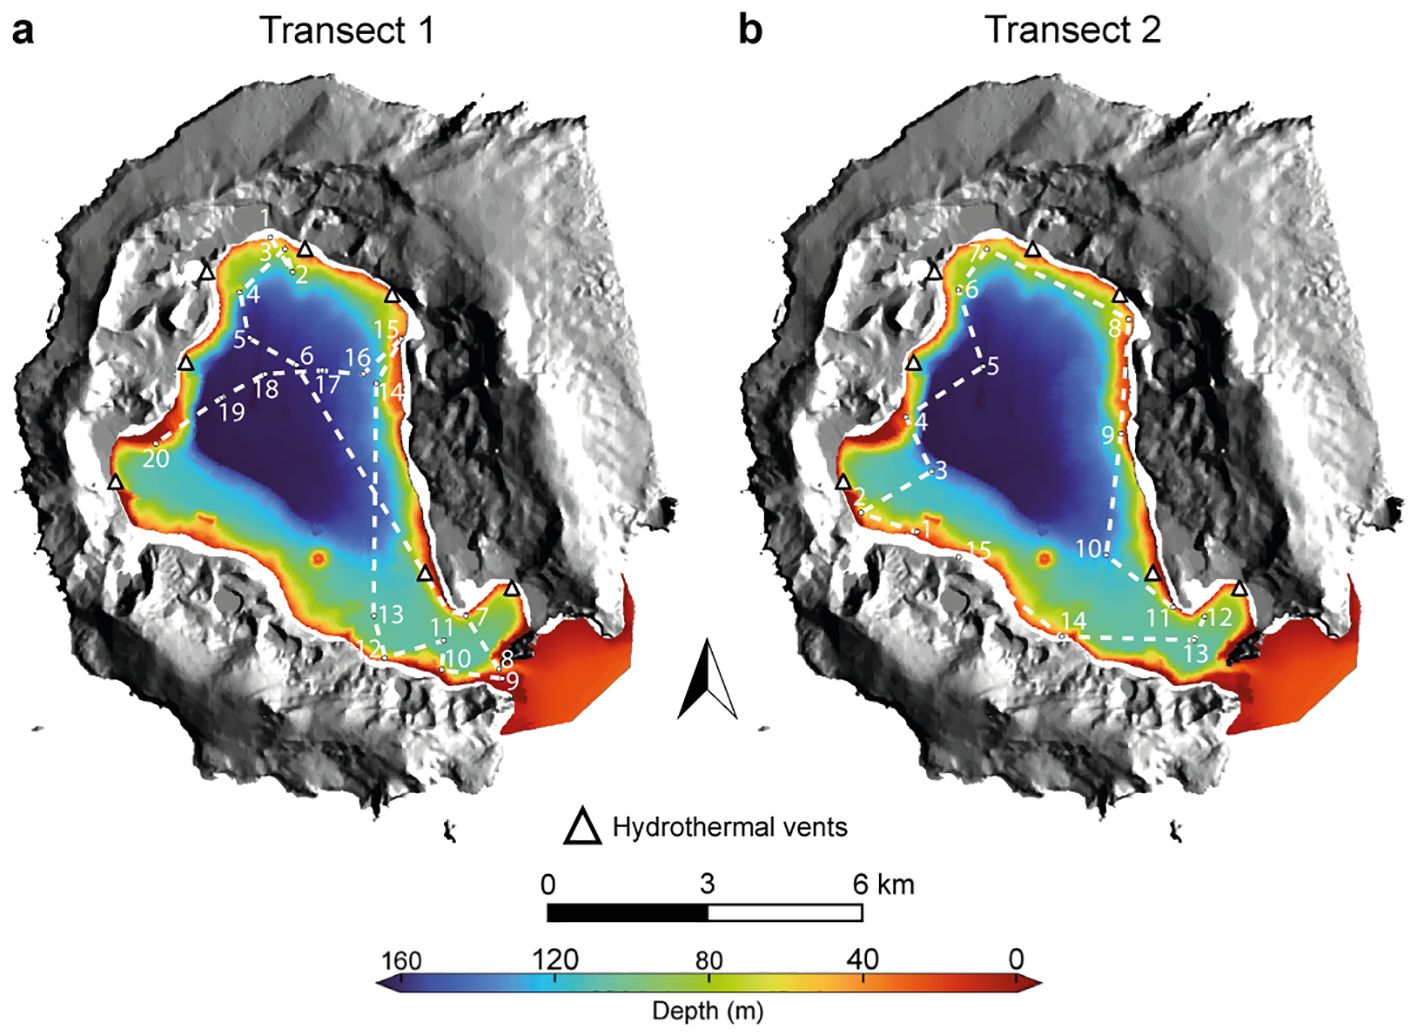
Figure 2. Transect 1 (A), with 20 stations, was carried out on January 29, 2021 and Transect 2 (B), with 15 stations was performed on February 19, 2021. Data on common variables was averaged for both samplings.
Geographic positions of all samples were recorded using a hand-held geographic positioning system (Magellan-Meridian-Platinum GPS, Magellan, USA, ± 5 m). The system was set to track positions at high resolution throughout the sampling campaigns and was later linked to measurement timestamps (care was taken to ensure times were synchronized) using linear interpolation, yielding individual positions for every sample. A single position for each set of vertical water parameter profiles was then derived as the center point of the cloud of positions, allowing factors such as boat drift to be accounted for. Communication with the GPS was facilitated by GPSBabel (https://www.gpsbabel.org).
2.3 Thermohaline properties
At each site conductivity and ST were quickly measured using a hand-held water quality multiprobe [YSI-6920V2, YSI Incorporated, USA (conductivity acc. - ± 0.5% of reading + 0.001 mS/cm; ST acc.: ± 0.15°C)] that was deployed by hand from the boat with the help of a winch.
2.4 Biogeochemical variables
Seawater samples were collected from a pneumatic boat at 50 cm - 1 m below the surface using a peristaltic pumping system equipped with acid-washed C-Flex tubing in the pump head and filtered in-situ through an acid-cleaned polypropylene cartridge filter (0.22 µm; MSI, Calyx). Once collected, a sub-sample was immediately transferred to a container where pH was measured (NBS scale), pH had an accuracy of ± 0.002 units and it was converted to pH at total scale (25°C) with the CO2SYS program (Version v3.2.0 for MATLAB) (Van Heuven et al., 2011; Sharp and Byrne, 2020). Conductivity was also converted to S PSU using an instrument specific conversion equation. The rest of the seawater sample was immediately processed for analysis of total alkalinity (TA), ammonium (NH4+), nitrite (NO2-), nitrate (NO3-), orthophosphate (PO43-), and silicate (SiO2) in the laboratory. In particular, samples for TA analysis were collected in 500-ml borosilicate bottles, and poisoned with 100 μl of HgCl2-saturated aqueous solution and stored until measurement onshore within 3 months upon collection. TA was measured by potential titration with a Titroprocessor (model Metrohm 794), with precision and accuracy of measurements being determined from certified reference material (CRMa batch #97 provided by Prof. Andrew Dickson, Scripps Institution of Oceanography, La Jolla, CA, USA) and equivalent to ±0.8 and ±4 μmol kg−1 respectively. For inorganic nutrient analysis, samples (5 mL, two replicates) were taken, filtered immediately (Whatman GF/F, 0.7 μm) and stored frozen. Nutrient concentrations were measured with a continuous flow auto-analyzer (Skalar San++ System) using standard colorimetric techniques (Hansen and Koroleff, 1999). The accuracy of the analysis was established using Reference Material for Nutrients in Seawater - KANSO CRM (Lot. CP). The recoveries for n=3 were 108 ± 3%, 124 ± 1%, 102 ± 2% and 99 ± 2% for NO2-, NO3-, PO43- and SiO2 respectively.
Concentrations of Co, Cu, Mo, Ni, Pb, Cd, Fe, V and Zn were analyzed by ICP-MS (iCAP, Thermo) after extraction and preconcentration using the APDC/DDDC organic extraction method (Bruland et al., 1979; Tovar-Sanchez, 2012). The accuracy of the analysis was established using Coastal Seawater References Material for trace metals ERM-CA403 (European Reference Material). The recoveries for n=1 ranged from ~81% for Pb to ~109% for Cd (see Supplementary Table S1 for recoveries). Blanks (acidified ultra-pure water) were preconcentrated following the same method as the samples.
Partial pressure of dissolved CO2 (pCO2, µatm) was subsequently calculated for each sampling station with the CO2SYS program using TA, pHT25, phosphate and silicate concentrations, S, ST, and P as input parameters. Proper dissociation constants for carbon (Mehrbach et al., 1973; Dickson and Millero, 1987), sulfate (KSO4) (Dickson et al., 1990) and fluorine (KF) (Perez and Fraga, 1987) were considered, and a borate-salinity ratio (Lee et al., 2010) was also used.
For CH4 measurements, samples (two replicates) were collected using 120 mL serum vials, sealed with grey-butyl rubber septa and aluminum crimps and preserved with 250 µL of saturated HgCl2 to inhibit microbial activity. Trace gas samples were stored upside down in the dark, until analysis in the laboratory. Dissolved CH4 was analyzed by static headspace equilibration gas chromatography (GC) according to De La Paz et al. (2015). In summary, the method uses a high-precision automated burette to introduce ultrapure N2 gas into a sample vial; once equilibrium is achieved overnight, the headspace is injected automatically into the gas chromatograph (Agilent GC 7890-A) which is subsequently separated using a Porapak Q-packed column and detected using a flame ionization detector. Overall, the accuracy of the method (the average coefficient of variation from the analysis of replicates), is assessed to be 5% for CH4, and the limit of detection is 1.5 parts per billion (ppb).
Chlorophyll-a surface concentrations were obtained from Copernicus Sentinel-2 satellites, where the images of Deception Island taken by Sentinel-2 on December 27, 2020, were acquired (https://scihub.copernicus.eu/ on August 15, 2023) and subsequently processed. This processing used the methodology outlined by Caballero et al. (2022). Originally, the images were in the Top of Atmosphere (TOA) Level 1C format, having undergone radiometric and geometric adjustments. These were then transformed into Bottom-of-Atmosphere (BOA) visuals using ACOLITE, a widely-used software for atmospheric correction. Corrections for sunglint effects were also applied to these images. Further, an OC3 product, essential for biogeochemical analysis, was derived from these images. The OC3 approach is a band ratio algorithm facilitating the assessment of chlorophyll-a levels in seawater, utilizing three spectral bands in the vicinity of blue, green, and red wavelengths (O'Reilley et al., 2000).
2.5 CH4 and CO2 saturation ratios and air-sea fluxes
2.5.1 Methane
Air-sea CH4 exchange in Port Foster, were calculated across the sampled stations according to the following equation:
where F is the atmosphere-ocean CH4 flux (in µmol m-2 d-1), k is the gas transfer velocity (in cm h-1), Cw is the CH4 concentration in water and CA is the equilibrium concentration of CH4 in the layer of air above the water. In Equation 1, k was estimated according to (Wanninkhof, 2014):
where a is a cost function used for gas transfer coefficient optimization (0.251), U10 is the in situ average winds (AEMET, 2021), averaged for 31 days (15 before and 15 after the sample was taken) and corrected for 10m height (m s-1) (Wanninkhof, 2014) and ScCH4 is the Schmidt number adjusted for temperature. The atmospheric equilibrium solubility of CH4 was derived following Equation 3 (Wiesenburg and Guinasso, 1979):
where fG is the molar fraction in dry air for methane (1.82×10⁻⁶ as of January, 2021 at Palmer Station), T is the temperature in Kelvin and S is the salinity in ppt. Ai and Bi are the constants for calculation of solubilities in nmol L-1: A1 = -415.2807; A2 = 596.8104; A3 = 379.2599; A4 = -62.0757; B1 = -0.059160; B2 = 0.032174; B3 = -0.0048198 (Wiesenburg and Guinasso, 1979). The fourth temperature dependent parameter [A4(T/100)] especially accounts for the vapor pressure of water. Additionally, methane saturation ratios expressed as percentage were calculated as CW/CA × 100.
2.5.2 Carbon dioxide
Air-sea CO2 exchange was calculated using the bulk flux equation of (Wanninkhof, 2014):
where F is the flux (in mol m-2 yr-1), k is the gas transfer velocity (in cm h-1), K’ is the CO2 atmospheric equilibrium solubility from moist air (in mol L-1 atm-1) and pCO2W and pCO2A denote the partial pressures of CO2 (in µatm) in equilibrium with surface water and the overlying air respectively. In the Equation 4, k was calculated as it was for CH4, using the Equation 2. K’ was obtained as:
T is the temperature in Kelvin and S is the salinity expressed in ppm. Ai and Bi are the constants (moist air) for calculation of solubilities in mol L-1 atm-1: A1 = -160.7333; A2 = 215.4152; A3 = 89.8920; A4 = -1.47759; B1 = 0.029941; B2 = -0.027455; B3 = 0.0053407 (Weiss and Price, 1980). To account for the CO2 partial pressure in air, molar fraction surface monthly average data for January 2021 was used in Equation 5, equivalent to 410.5 ppm (NOAA/GML). Finally, CO2 saturation ratios were calculated as pCO2W/pCO2A × 100.
3 Results
3.1 Hydrothermal venting shapes the biochemical composition of Port Foster
Chemical and physical variables measured in surface waters of Port Foster during both sampling legs (January 29 and February 19, 2021) showed an evident zonal distribution, possibly reflecting the presence of volcanic structures inside the bay (Figure 3). Hydrothermal vents whose inputs are expected to affect surface biogeochemistry in the caldera are mainly restricted to shallow areas of the Port Foster perimeter. Accordingly, special physicochemical features clearly different from those at the center of the bay were indeed found in surface waters located above the hydrothermally active areas of FB, TB, PC and WB (Figure 2). Hydrothermal activity tracers, such as elevated ST (Figure 3A) high pCO2 were observed in these shallow and coastal spots of Port Foster. Computed correlations (Supplementary Figure S1) indicated a direct and statistically significant relationship between ST and pCO2 levels (r=0.85, 95% CI, P<.001, n=20). Temperature was also inversely correlated with salinity (r=-0.73, 95% CI, P<.001, n=35), suggesting the presence of freshwater input from the underneath venting activity or coastal melting runoff. Additionally, the spatial distribution of CH4 sea surface concentrations was consistent with the location of the venting sites (Figure 4A), although significant correlations were not observed with the rest of hydrothermal tracers. Trace metals distribution within Port Foster Bay also revealed zonality associated to the volcanic structures inside the bay. V, Fe, Co and Ni exhibited the highest concentrations in surface waters of PC and TB, as well as slightly increased values near WB, peaking at 74 nM (Leg 1, St. 15), 361 nM (Leg 1, St. 1, white star), 3.9 nM (Leg 1, St. 1, white star) and 17.2 nM (Leg 1, St. 1, white star) respectively (Figures 3C–F).
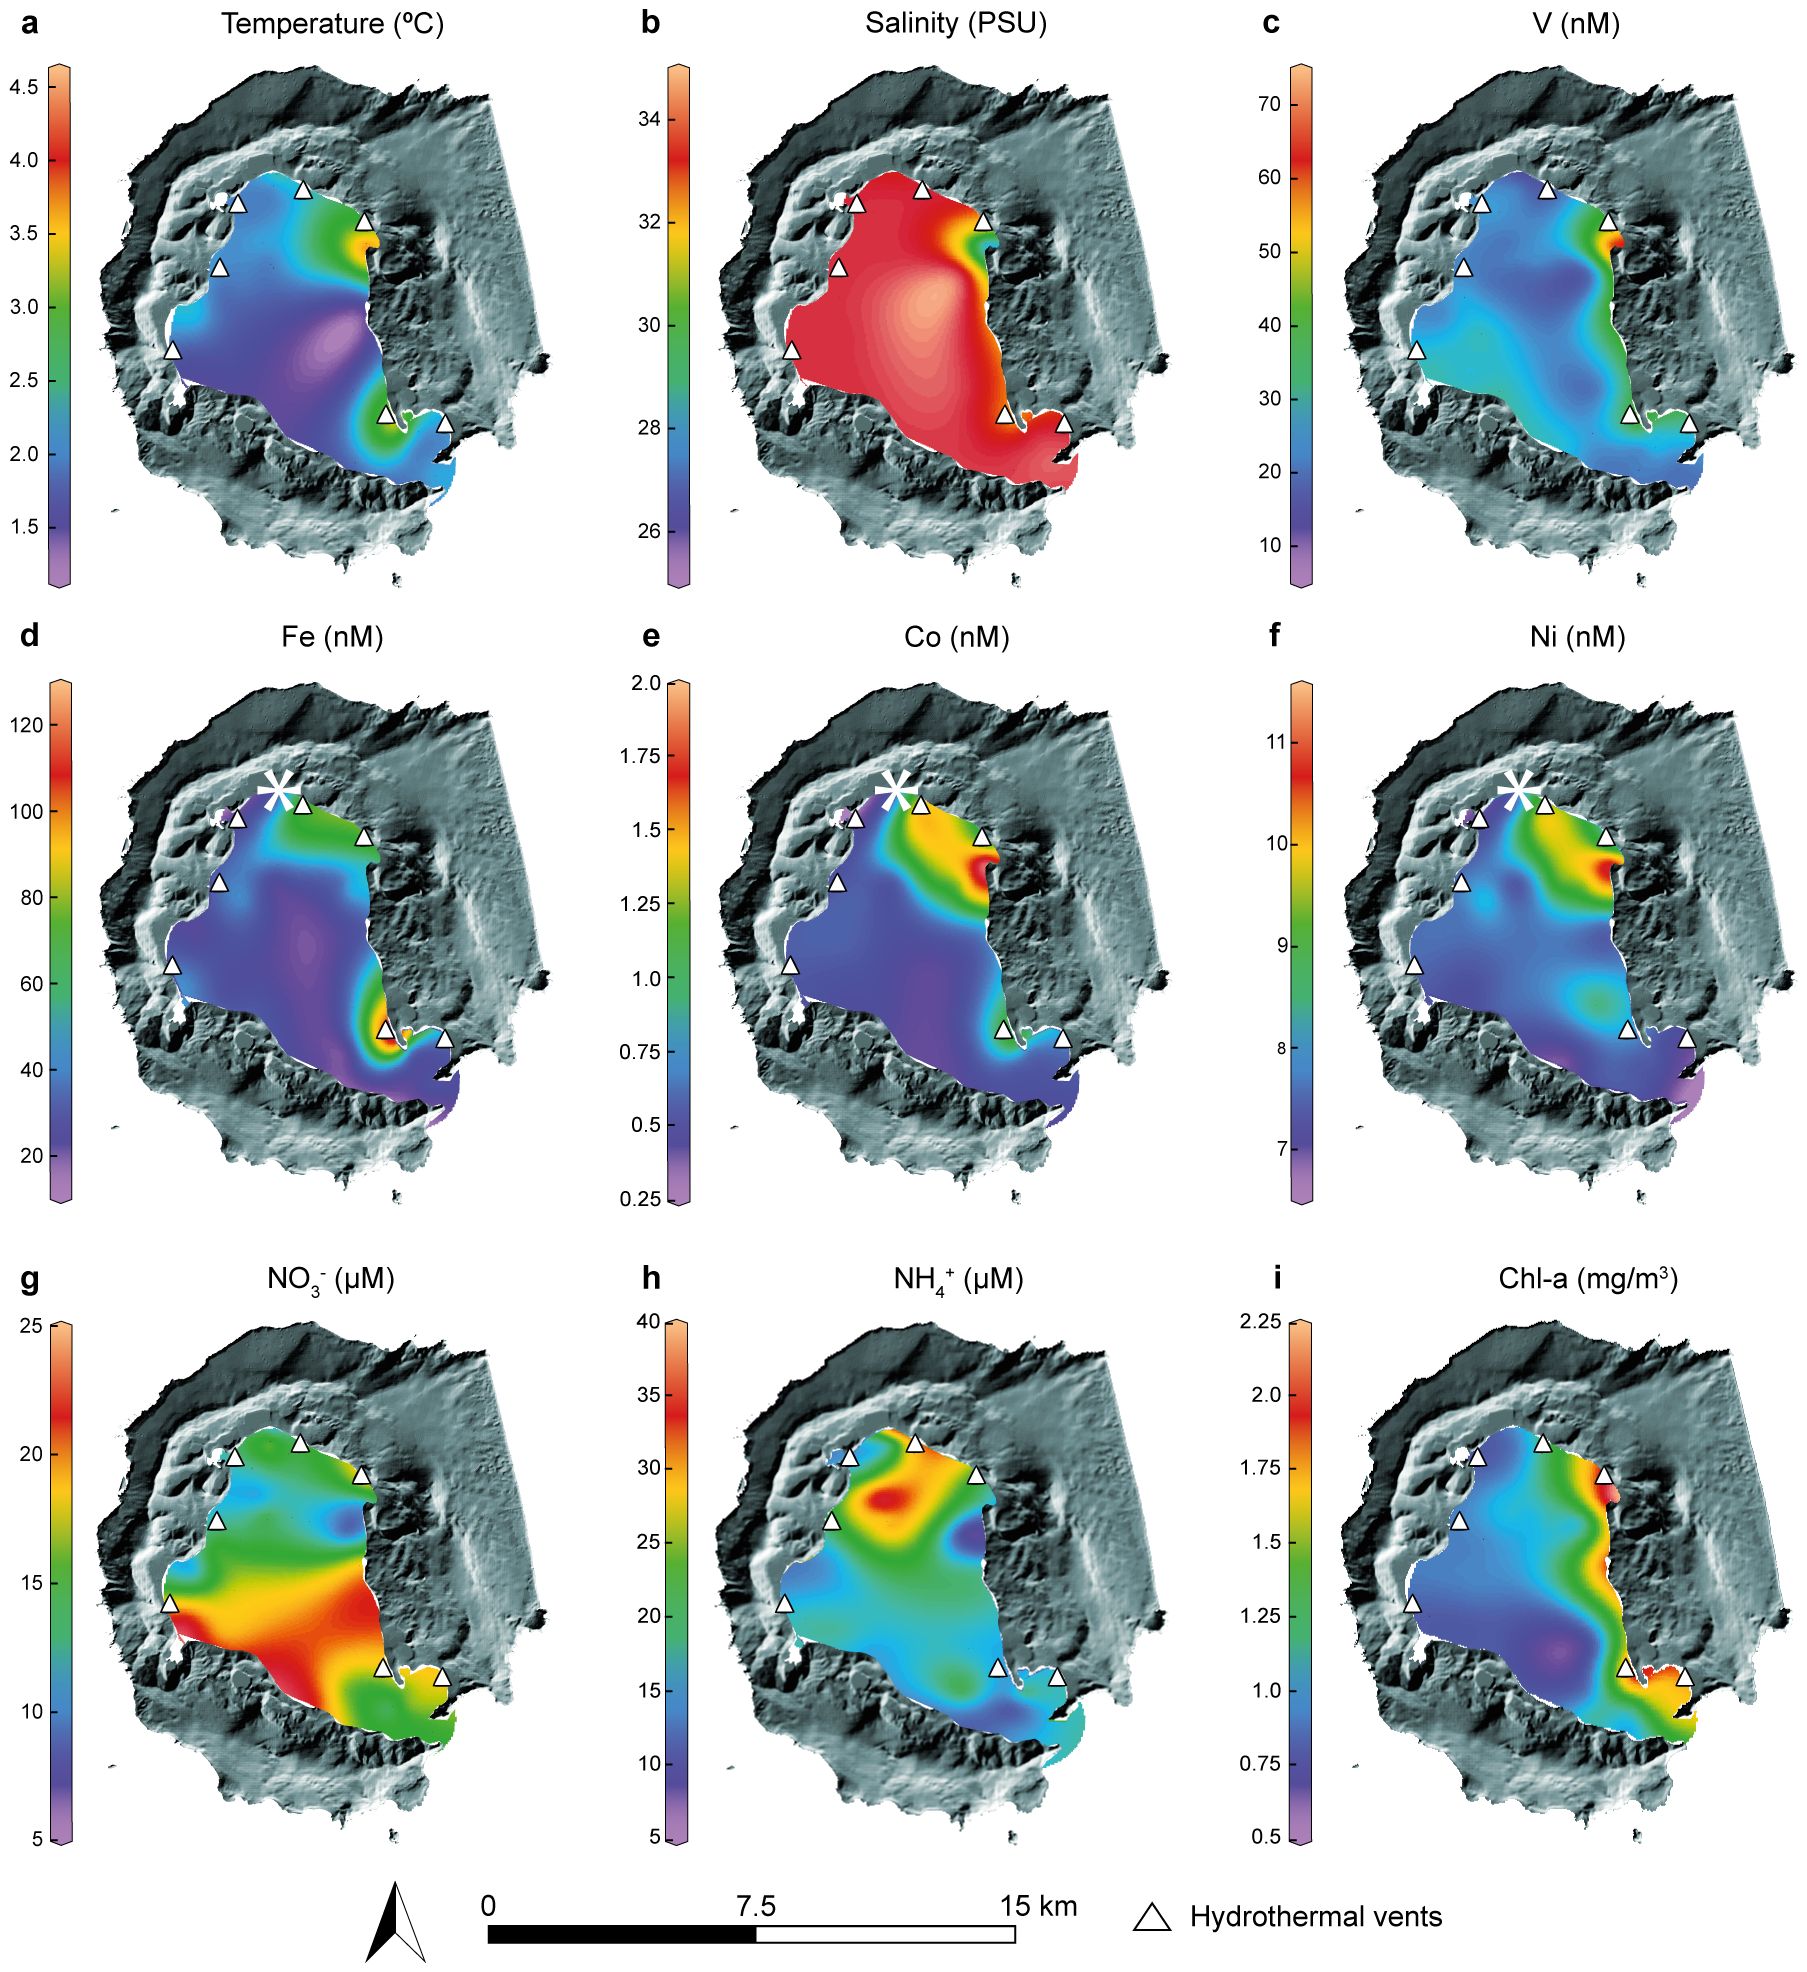
Figure 3. Spatial distribution of thermohaline properties (A, B), most relevant TMs (C, D, E, F), nutrients (G, H) and chlorophyll-a (I) in Port Foster Bay as obtained during the sampling campaigns. White star in Fe (D), Co (E) and Ni (F) indicates a sampling station (Leg 1, St. 1) where high concentrations of those trace metals were obtained (Fe = 361.13 Nm; Co = 3.89 nM; Ni = 17.19 nM). Concentrations observed at the white star were omitted from the interpolation for better visualization.

Figure 4. Characterization of CH4 presence and distribution within Port Foster Bay. Station number is indicated within Port Foster as 2.x (Transect 2 – station x). (A) Surface CH4 concentrations in nmol L-1 as collected during the second leg, on February 19, 2021. (B) Calculated CH4 sea-air flux expressed in µmol m-2 d-1 according to local wind speed, salinity and water ST (Weiss, 1970; Wiesenburg and Guinasso, 1979; Wanninkhof, 2014). (C) Methane sea-air saturation ratios calculated as CW/CA × 100, expressed in %.
3.1.1 Concentrations influenced by hydrothermal venting
Correlations with fumarolic inherent features (Supplementary Figure S1), such as ST, salinity or pCO2 showed that V was directly correlated with ST (r=0.47, 95% CI, P=.005, n=35) and pCO2 (r=0.71, 95% CI, P=.001, n=20), and inversely correlated with salinity (r= -0.84, 95% CI, P<.001, n=35), being also present in FB and towards the mouth of the bay. Cobalt and Ni showed very similar behavior, with r= 0.57, 95% CI, P<.001, n=35; and r=0.48, 95% CI, P=.004, n=35 respectively for ST, r= -0.44, 95% CI, P=.011, n=35; and r= -0.37, 95% CI, P=.028, n=35 respectively for salinity and r=0.67 and 0.65 respectively for pCO2. Averaged chlorophyll surface concentration was characterized by higher levels predominantly on the western side of PF and exhibited direct and statistically significant relationships with ST (r=0.5, 95% CI, P=.002, n=35) and V (r=0.53, 95% CI, P=.001, n=35), and an inverse correlation with salinity and surface pCO2 (r=-0.45, 95% CI, P=.006, n=35; r=0.29, 95% CI, P=.219, n=20, respectively).
3.1.2 Concentrations not restricted to hydrothermal venting sources
Fe exhibited weaker but still statistically significant relationships with ST (r=0.37, 95% CI, P=.027, n=35), but poorer correlation with salinity (r=-0.17, 95% CI, P=.341, n=35) and pCO2 (r=0.36, 95% CI, P=.122, n=20). In the other hand, TMs like Cd, Zn and Pb correlated inversely to hydrothermal indicators such as ST (r=-0.41, 95% CI, P=.034, n=35; r=-0.19, 95% CI, P=.048, n=35; r=-0.42, 95% CI, P=.317, n=13, respectively) or pCO2 (r=-0.14, 95% CI, P=.559, n=20; r=-0.17, 95% CI, P=.460, n=20; r=-0.3, 95% CI, P=.246, n=20, respectively). Molybdenum exhibited no correlation with ST and pCO2 (r=0.002, 95% CI, P=.99, n=35; r=0.12, 95% CI, P=.624, n=20, respectively). In the same way, Cu showed almost no correlation with ST and pCO2 (r=0.14, 95% CI, P=.405, n=35; r=0.1, 95% CI, P=.687, n=20, respectively). Regarding nutrient occurrence and distribution, an evident zonal pattern was not observed within the bay. The highest concentrations of NO3- and PO43- were primarily located in the south-western region of PF, peaking 23.0 ± 0.1 (Leg 2, St. 2) and 1.45 ± 0.00 µM (Leg 2, St. 2) respectively (Figure 3G, PO43- not shown). High levels of NH4+ were found in surface waters located in the northern central section of Port Foster, peaking 37.5 µM in Leg 1, St. 3. This nutrient was not significantly correlated with the hydrothermal tracers, and, as expected, inversely correlated with NO3- and PO43- (r=-0.41, 95% CI, P=.0244, n=35; r=-0.45, 95% CI, P=.013, n=35, respectively).
3.2 Distribution and fluxes of GHGs in Port Foster
The distribution of concentrations of CH4 found in the surface waters of Port Foster matches the localization of known sources of hydrothermal activity i.e., FB, TB, PC and WB (Figure 4A). The concentrations of CH4 found in Port Foster range from 6.69 to 15.93 nM (Supplementary Table S2). The highest levels of CH4 were observed in the vicinity of WB, for Leg 2, St. 13 and 14, with 15.93 and 13.47 nM respectively with the median concentration of CH4 in the bay resulting in 8.88 nM with an IQR of 1.90 nM. Surface waters of Port Foster were supersaturated with respect to atmospheric CH4, ranging from ~202% to ~465% (Figure 4C). Air-sea CH4 exchange in Port Foster presented a median flux of 9.68 μmol m-2 d-1 and an IQR of 3.43 μmol m-2 d-1, with the maximum effluxes of 22.38 and 17.93 µmol m-2 d-1 being obtained Leg 2, St. 12 and 13 respectively and a minimum flux of 6.36 µmol m-2 d-1 estimated in Leg 2, St. 11 (Figure 4B) (positive flux values indicating CH4 flux from water to atmosphere) (See median, Q1-Q3 and histograms in Supplementary Table S3). Hence, the inundated caldera behaved as a net source of CH4 to the atmosphere during the monitored period, with a regional water to atmosphere methane transport median (Q1-Q3) inequivalent to 0.002 (0.0016 – 0.0023) Gg yr-1 (considering a surface for the inner bay of approximately 36 km2). Despite the limitation of mid-bay data availability, it was considered that the major sources of CH4 were located in the fumarolic areas distributed in the shoreline of the bay.
An evident spatial pattern of both, the dissolved CO2 levels (Figure 5A) and the air-sea gradient of CO2 (ΔpCO2) was observed in Port Foster. Areas with the largest positive ΔpCO2 (∼ 400 µatm) were located on the north-eastern part of the bay, where a marked fumarolic activity in the vicinity of PC has been described. Overall, the CO2 surface-atmospheric equilibrium seems to be mostly displaced around PC and TB areas, possibly indicating a volcanic source-like nature in this coastal fringe. In contrast, the area with the largest negative ΔpCO2 was located in the center of the bay, which is characterized by an average depth of ~120m (peaking more than 160m) and lack of near-surface hydrothermal vents. Hence, this central zone acted as a local CO2 sink. Accordingly, air-water CO2 fluxes result in outgassing occurring mostly in the PC area, reaching 18.96 mol m-2 yr-1 in Leg 1, St. 15. Similarly, CO2 emissions towards the atmosphere were also measured at Leg 1, St. 1, 2, 14 and 16, all of them near the PC area (Figure 5B) where CO2 oversaturated waters were measured (Figure 5C). In particular, sampling stations of Leg 1, 1, 2, 14, 15 and 16 registered oversaturation values with respect to the atmospheric CO2 level equivalent to ~135%, ~120%, ~103%, ~221% and ~112% respectively. The median (Q1-Q3) flux across the entire Port Foster extension was calculated to be -2.78 (-3.58 – 0.26) mol m-2 yr-1, which correspond to an annual median (Q1-Q3) withdrawal from the atmosphere of 4.41 (5.69 – 0.42) Gg of CO2 (See Supplementary Table S4 for CO2 data) (See median, Q1-Q3 and histograms in Supplementary Table S3).
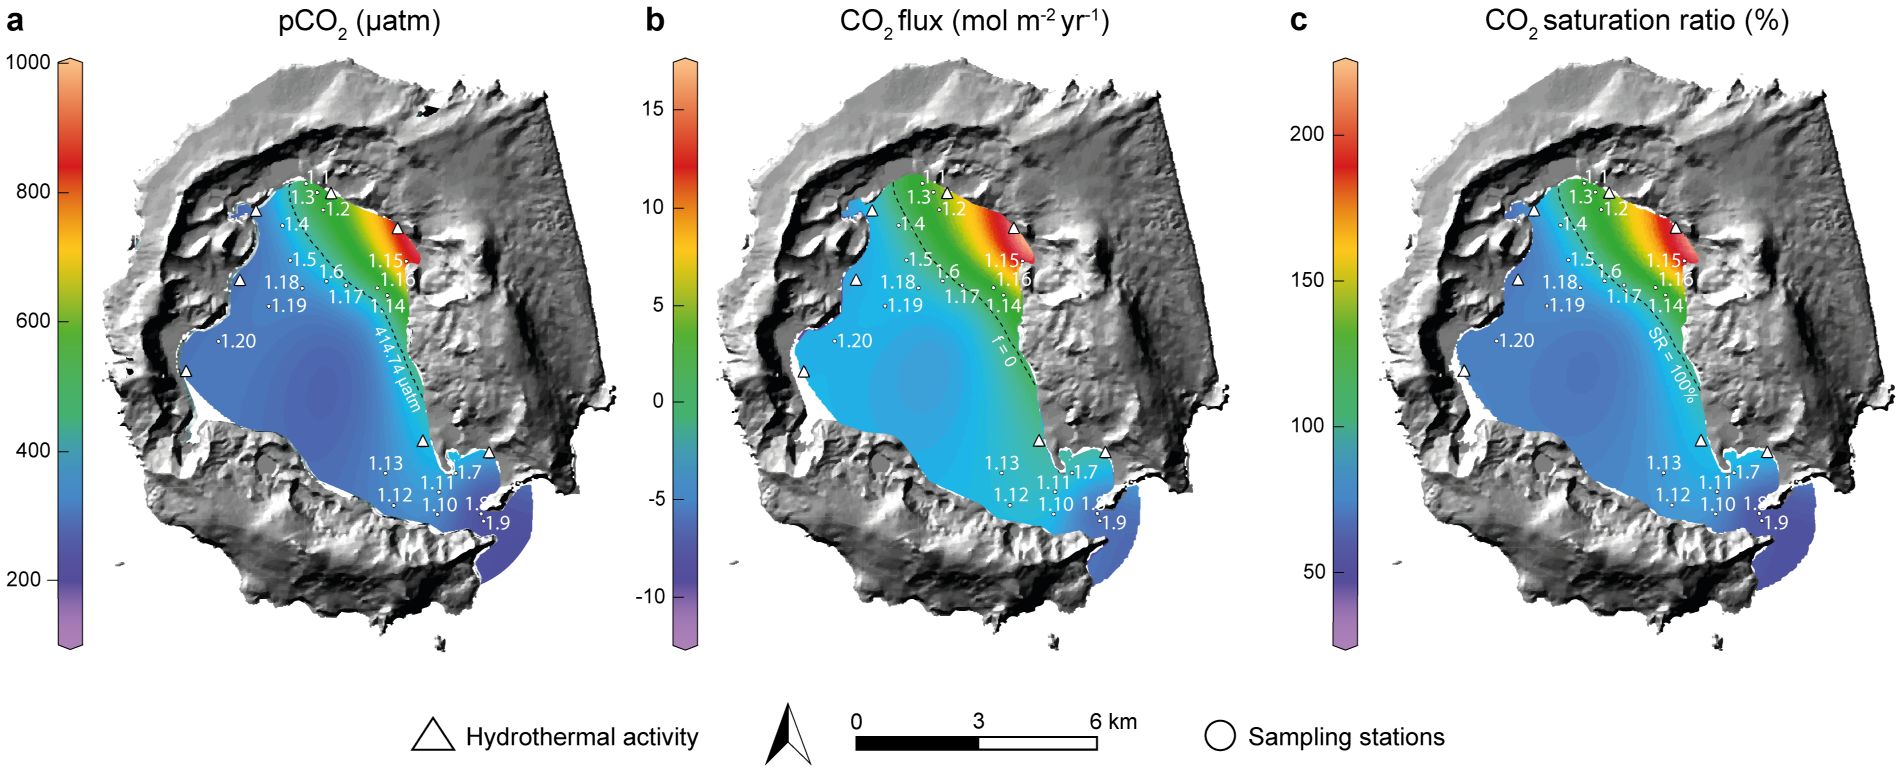
Figure 5. Characterization of CO2 distribution within Port Foster Bay. (A) Surface carbon dioxide partial pressures in µatm as collected during the first leg, on January 29, 2021. Black dashed line indicates where pCO2W/pCO2A = 1. (B) Calculated carbon dioxide sea-air flux expressed in mol m-2 yr-1 according to local wind speed, salinity and water ST (Wiesenburg and Guinasso, 1979; Weiss and Price, 1980; Wanninkhof, 2014). Black dashed line indicates where flux = 0. (C) Carbon dioxide sea-air saturation ratios calculated as pCO2W/pCO2A × 100, expressed in %. Black dashed line indicates where water saturation = 100%.
4 Discussion
Results presented in this work indicate that the spatial distribution of TMs, CO2 and CH4 in Port Foster seems to be related to the distinct geologic characteristics of the fumaroles present in DI. For CH4, although our studied transect has limited CH4 measurements at the bay’s center, nearby samples reveal a peripheral CH4 distribution near the shore, coinciding spatially with fumarole presence rather than in Port Foster’s center. While the presence of CH4 in Port Foster’s surface waters can also be attributed to biological production and organic matter (OM) degradation, oxygen levels throughout the basin are considerably high within the entire water column (Sturz et al., 2003), which does not favor OM methanogenesis and instead enhances available CH4 oxidation. While aerobic CH4 production can occur, it is less prevalent due to the preferential use of oxygen in bacterial respiration. It is still possible however that some CH4 near the fumaroles could have a mixed origin – hydrothermal and biotic – from small, localized anoxic zones near the coast (due to organic matter accumulation and microbial activity), influencing the biotic/abiotic ratios of methane production. Given the mentioned characteristics of Port Foster, we consider that the majority of CH4 detected in our study has hydrothermal origin. According to Caselli et al. (2004), PC and WB are considered as water vapor emanating fumaroles, with overall lower temperatures (20-70°C) as compared to the more sulfidic and hotter (90-100°C) FB fumaroles. CH4 emissions are known to be higher in low-temperature fluid vents (Von Damm and Lilley, 2004), which would explain the spatial distribution of the surface levels of CH4 observed in Port Foster in our study. In this regard, although mainly large and intense bubbling was observed in the fumarolic area, it is important to note that in shallow vent environments, the intensity of gas bubbling and the size of the gas bubbles may also influence CH4 concentrations due to variations in microbial oxidation rates. The CH4 concentrations reported here are consistent with previous early research performed under the RACER program in 1987, which investigated CH4 enrichments in Port Foster and providing an average concentration of 9.37 nM of CH4 within the bay, which is particularly high with respect to the levels of this gas found in the surrounding water masses in the Bransfield Strait, whose surface levels averaged 2-3 nM (Tilbrook and Karl, 1993). These low CH4 concentrations have been more recently confirmed as a mean value of 2.7 nM for the surface Southern Ocean layer (Polonik et al., 2021). Surface concentrations of CH4 obtained in the inner bay of DI are also considerably higher than the typical CH4 ranges reported across the Southern Ocean (Ye et al., 2023), which are characterized by a generally CH4 undersaturated waters. It is worthy to indicate that higher concentrations of CH4 (up to 10.95 nM) have also been detected in the Bransfield Strait, particularly in the south of the South Shetland Islands archipelago. Even though a more comprehensive assessment is required to fully discriminate the sources and sinks of CH4 in the SO, our data could be associated to the presence of such high levels of CH4 in the area close to the Bransfield Strait possibly due to the eastward transport of the gas from Port Foster through the Neptune Bellows (Kholmogorov et al., 2022), largely mediated by the hydrographic regime of the area. These authors report a transect next to DI with the highest levels of dissolved CH4, reaching 10 nM further east in the Bransfield Strait. Calculated effluxes obtained in our study indicate that Port Foster behaved almost entirely as a CH4 source for the SO, whose origin could lie on the hydrothermal activity present in the caldera. Although no significant correlation was obtained with other hydrothermal tracers like ST and pCO2, probably due to the oxidation processes affecting the gas in the water column from the source, our assessment suggests that Deception Island still plays a role as a contributor to CH4 SO budgets.
This was not the case for CO2, as our measurements showed a net uptake of this gas from the bay. Previous research conducted in the Bransfield Strait reveals varying patterns in dissolved CO2 concentrations across different locations and seasons. For instance, during Macro’95, a survey performed in the Bransfield Strait and Bellingshausen Sea, the western basin of the Bransfield Strait acted as a minor source of CO2 to the atmosphere, releasing an average of 0.44 mol C m-2 yr-1, while the Bellingshausen domain has been characterized by presenting a marked influx of CO2 equivalent to 7.3 mol C m-2 yr-1 (Álvarez et al., 2002). In other adjacent regions to DI such as the Gerlache Strait, the annual net sea-air CO2 flux from 2002 to 2017 averaged 0.45 ± 1.58 mol m-2 yr-1 (Monteiro et al., 2020). Similarly, Ito et al. (2018) observed between 2008 and 2010 that surface waters in the Bransfield Strait generally acted as a sink of atmospheric CO2 during the summers, except in 2009 when it became a weak CO2 source. Rodrigues et al. (2023) also reported that in the spring of 2018, the Bransfield Strait consistently functioned as a CO2 sink, with an average influx of 0.99 mol m-2 yr-1. Although Bransfield Strait presents similar heterogeneous CO2 flux dynamics than those found here in Port Foster, the drivers behind both systems can be different. In the Strait, CO2 air-sea exchange is mainly influenced by hydrodynamic factors such as the interaction of various cold and warm water masses from the Weddell Sea shelf and the Bellinghausen sea respectively, while the CO2 fluxes (mainly strong efflux) observed in Port Foster were primarily associated to active hydrothermal systems present in the perimeter of the bay. Deception Island, being situated in a back-arc system, exhibits a higher concentration of CO2 in the hydrothermal fluids when compared with other volcanically active geological systems with respect to the surrounding water masses (German and Seyfried, 2014). This is consistent with our measurements displaying higher levels of this gas in the northeastern section of the bay close to the proximities of the fumaroles (Leg 1, St 15 and 16), which clearly diminished towards the deeper center of the caldera where CO2 undersaturated waters were found. This spatial distribution is in line with earlier studies that revealed a regional variation in CO2 dynamics caused by localized fumarolic and hydrothermal activity (Shitashima, 1998).
To assess the origin of such gasses in Port Foster, while specific isotopic data about CO2 and CH4 was not analyzed in the present study, information is available on isotopic gas composition in DI, that allows to infer the origin of such gases within the bay. For instance, Kusakabe et al. (2009), while not specifically mentioning δ13C-CH4 values, provide δ13C values for CO2, which range from -5 to -6‰. These values indicate degassing from a mid-ocean ridge basalt (MORB)-type mantle source, suggesting a similar mantle origin for other carbon-containing gases, including CH4. Regarding helium isotopes, Kusakabe et al. shows the existence of high 3He/4He ratios and other noble gas data highlight the significant contribution of mantle-derived helium.
The volcanic nature of DI influenced the distribution of some TMs (V, Fe, Co, and Ni) near the active hydrothermal vents in the north-eastern side of Port Foster. However, this was not the case for Cu, Mo, Zn and Cd. It is not clear why the active flux of warmer and less saline water to Port Foster surface waters was enriched in some metals and not in others although coprecipitation to excess iron and biological uptake on the highly productive East half of Port Foster could have played a role. Our results for Fe, Co, V and Ni are in agreement with previous studies evidencing that hydrothermal activity represents a strong driver behind the availability of TMs in the ocean (German and Seyfried, 2014; Resing et al., 2015; Mei et al., 2022). Moreover, sediments in Port Foster have been found to be enriched in many of these TMs (Somoza et al., 2004) suggesting that the hydrothermal venting could contribute to its accumulation in the sea bottom after being released. Given the high concentrations of TMs found in Port Foster in this study relative to regional open ocean concentrations, DI emerges as a potentially important source of TMs to the Bransfield Strait and nearby oceanic regions. In this sense, Measures et al. (2013) showed evidence of transport of TMs from coastal waters of the Antarctic Peninsula into the Antarctic Circumpolar Current. This suggests that TMs from coastal regions, including volcanic islands like DI, are transported into the open ocean, influencing the biogeochemistry of larger oceanic areas. Additionally, reported Fe concentrations in the Weddell Sea show elevated levels particularly near the Antarctic Peninsula (Sañudo-Wilhelmy et al., 2002). The Fe levels (ranging from 4.5 to 31 nM) are attributed to natural processes such as resuspension of benthic sediments, upwelling and, by extension to the present study, hydrothermal activity from volcanic islands like DI. Similarly, a recent study by Sierpinski et al. (2023) also reported 18.9 ± 6.1 nM Fe concentrations in Admiralty Bay, King George Island, concentrations which while being high when compared to surrounding waters of the Bransfield Strait, Bellingshausen (De Jong et al., 2015) Sea or the Atlantic sector of the SO (Klunder et al., 2011), are considerably below the dissolved Fe concentrations found within Port Foster in this research. Other TMs like Co or Al reported by Sañudo-Wilhelmy et al. (2002) in the Bransfield Strait, reflect lower concentrations when compared to those found in DI highlighting the role of hydrothermal emissions in the pool of these elements in the SO. The Bransfield Current, particularly the Transitional Water with Bellingshausen Sea influence (TBW), is characterized by an eastward flow of water in the section where DI is located, possibly influencing the distribution of trace TMs (Measures et al., 2013). Data supports the observation that Chl-a concentrations are greater under the influence of TBW (Gonçalves-Araujo et al., 2015).
Unlike TMs, nutrients measured across Port Foster showed to be rather homogeneous, with slightly higher levels of both NO3- and PO43- being observed in the mid-southern bay, not restricted to specific areas such as those above the fumaroles, inversely correlated for example to hydrothermal tracers such as pCO2 or ST (Supplementary Figure S1). This pattern may indicate inputs of open ocean waters from the Bransfield Strait through the Neptune Bellows, according to other studies that provide NO3- concentrations ranging from 22.5 to 38 µM in the Bransfield Strait (Polukhin et al., 2021). Similarly, these authors measured silicate concentrations in the upper layer of the Strait, between 74 to 81 µM, a range that is consistent with our data in Port Foster. As expected, a correlation is found between the nutrients and all indicators of chl-a growth, highlighting their significant role in phytoplankton development, which is also supported by a study conducted by Sturz et al. (2003) further corroborating these values. However, the lack of significance between chl-a and the concentrations of NH4+, NO3-, and PO43- could suggest that the phytoplankton growth is being limited by another nutrient or TM in Port Foster, potentially leaving excess of NH4+, NO3-, and PO43- within the bay. This ultimately gives evidence of the need for contrasting studies in various locations of Port Foster that could provide further insights into the dynamics of phytoplankton growth. It is interesting to note that specifically, in Port Foster, a notably high concentration of NH4+ in surface waters was observed, exhibiting a slight negative correlation with chl-a, which suggested a possible consumption by phytoplankton. Ammonium production in the euphotic zone is often the result of heterotrophic metabolism, which is later subjected to removal processes including phytoplankton uptake and nitrification. Also, NH4+ can be produced via dinitrogen reduction by hydrogen sulfide at moderate temperatures in hydrothermal venting systems (Schoonen and Xu, 2001), however, more data is needed about the distribution of concentrations of hydrogen sulfide within Port Foster to draw any possible correlations. Nevertheless, Sturz et al. (2003) showed that snow and runoff around Port Foster Bay was characterized by NH4+ concentrations as high as 90 µM, suggesting that glacier meltwater may be flowing into the bay and in combination with waste from the marine biota (Laglera et al., 2020), would become not limiting for phytoplankton growth. In the Bransfield Strait NH4+ levels varying between 1 and 3.8 µM were measured (Polukhin et al., 2021) and Sturz et al. (2003) reported NH4+ concentrations in Port Foster’s mid bay and peripheral coves, which ranged from 0 to 4 µM. Our statistical analysis does not seem to support the runoff NH4+ source, as inverse correlation of NH4+ with salinity is not well correlated. Further analysis is thus required to elucidate the origin of the high levels of NH4+ found in Port Foster.
5 Conclusion
This study explores the connection between hydrothermal venting, the distribution of metals and inorganic nutrients, and the dynamics of CO2 and CH4 exchange in Port Foster. Increases in GHGs in the surface waters above the coastal fumarolic areas were identified, indicating that fumarolic activity plays a relevant role in influencing local GHGs sea-air budgets. This is in contrast to the broader patterns observed in Bransfield Strait, where hydrodynamic factors are more dominant in chemical distributions. These findings suggest that DI acts as both a net source of CH4 to the atmosphere and a sink of CO2. The distribution and concentration of certain TMs like V, Ni, Co, and to a lesser extent Fe, chlorophyll, and nutrients (NH4+, NO3-, PO43- and SiO2) also suggests that hydrothermal inputs enhance biogeochemical processes and primary productivity, which is essential for the marine food web, supporting higher trophic levels, including fish, birds, and mammals. Enhanced primary productivity can also lead to increased biological carbon sequestration, where CO2 is captured by phytoplankton and transported to the deep ocean through the biological pump, contributing to long-term carbon storage. Overall, this research highlights DI’s role as a volcanically active environment influencing local TMs cycling and GHGs emissions, and likely regional biogeochemical conditions in the Bransfield Strait, which has been shown to deliver TMs enriched waters to the typically TM-poor Drake passage.
Data availability statement
Publicly available datasets were analyzed in this study. This data can be found here: https://github.com/obkorolev/Port_Foster_Paper. Further inquiries can be directed to the corresponding author/s.
Author contributions
OB: Conceptualization, Data curation, Formal analysis, Investigation, Methodology, Software, Validation, Visualization, Writing – original draft, Writing – review & editing. IH: Conceptualization, Data curation, Formal analysis, Funding acquisition, Investigation, Methodology, Project administration, Resources, Supervision, Validation, Visualization, Writing – original draft, Writing – review & editing. GN: Conceptualization, Funding acquisition, Project administration, Resources, Supervision, Validation, Writing – review & editing. SA-V: Conceptualization, Data curation, Formal analysis, Investigation, Methodology, Software, Validation, Visualization, Writing – original draft, Writing – review & editing. MD: Conceptualization, Data curation, Formal analysis, Investigation, Methodology, Supervision, Validation, Visualization, Writing – review & editing. ES: Conceptualization, Data curation, Formal analysis, Investigation, Methodology, Validation, Visualization, Writing – review & editing. SH: Data curation, Methodology, Software, Writing – review & editing. CS: Data curation, Investigation, Methodology, Software, Writing – review & editing. LL: Investigation, Methodology, Software, Supervision, Validation, Visualization, Writing – review & editing. AT-S: Conceptualization, Funding acquisition, Investigation, Methodology, Project administration, Resources, Supervision, Validation, Writing – review & editing.
Funding
The author(s) declare that financial support was received for the research, authorship, and/or publication of this article. This research has been funded by the Spanish Government projects PIMETAN (ref. RTI2018-098048-B-I00), DICHOSO (PID2021-125783OB-I00), EQC2018-004275-P and EQC2019-005721-P funded by MCIN/AEI/10.13039/501100011033 and by “ERDF A way of making Europe”. OB is supported by a predoctoral grant PRE2022-103391, SA-V is supported by a pre-doctoral grant FPU19/04338 and ES is supported by a pre-doctoral grant PRE2019-089679, the three from the Spanish Ministry of Science, Innovation and Universities. Copernicus Sentinel data (2021) was obtained from Copernicus SciHub. Permissions to work in the study area were granted by the Spanish Polar Committee. This research is part of the POLARCSIC and TELEDETECT research initiative. CS participated thanks to a grant provided by the Coordenação de Aperfeiçoamento de Pessoal de Nível Superior (CAPES, 88882.182291/2007-01).
Acknowledgments
We thank the military staff of the Spanish Antarctic Base Gabriel de Castilla, the crew of the Sarmiento de Gamboa oceanographic vessel and the Marine Technology Unit (UTM-CSIC) for their logistic support, for making the XXXIV Spanish Antarctic campaign possible. We thank D. Roque for supporting data collecting operations, M. Agulló, I. Carribero and M. Ferrer for analytical assistance in the laboratory and P. Almaraz for advice on statistical analysis.
Conflict of interest
The authors declare that the research was conducted in the absence of any commercial or financial relationships that could be construed as a potential conflict of interest.
The author(s) declared that they were an editorial board member of Frontiers, at the time of submission. This had no impact on the peer review process and the final decision.
Publisher’s note
All claims expressed in this article are solely those of the authors and do not necessarily represent those of their affiliated organizations, or those of the publisher, the editors and the reviewers. Any product that may be evaluated in this article, or claim that may be made by its manufacturer, is not guaranteed or endorsed by the publisher.
Supplementary material
The Supplementary Material for this article can be found online at: https://www.frontiersin.org/articles/10.3389/fmars.2024.1432122/full#supplementary-material
References
AEMET (2021). Data from long observation series in Antarctica (at the Juan Carlos I and Gabriel de Castilla bases.
Álvarez M., Rı́os A. F., Rosón G. (2002). Spatio-temporal variability of air–sea fluxes of carbon dioxide and oxygen in the Bransfield and Gerlache Straits during Austral summer 1995–96. Deep Sea Res. Part II: Topical Stud. Oceanogr 49, 643–662. doi: 10.1016/S0967-0645(01)00116-3
Bates T. S., Kelly K. C., Johnson J. E., Gammon R. H. (1996). A reevaluation of the open ocean source of methane to the atmosphere. J. Geophys. Res. 101, 6953–6961. doi: 10.1029/95JD03348
Belyaev O., Sparaventi E., Navarro G., Rodríguez-Romero A., Tovar-Sánchez A. (2023). The contribution of penguin guano to the Southern Ocean iron pool. Available online at: https://zenodo.org/badge/latestdoi/506643010.
Bruland K. W., Franks R. P., Knauer G. A., Martin J. H. (1979). Sampling and analytical methods for the determination of copper, cadmium, zinc, and nickel at the nanogram per liter level in sea water. Analytica Chim Acta 105, 233–245. doi: 10.1016/S0003-2670(01)83754-5
Bui O. T. N., Kameyama S., Yoshikawa-Inoue H., Ishii M., Sasano D., Uchida H., et al. (2018). Estimates of methane emissions from the Southern Ocean from quasi-continuous underway measurements of the partial pressure of methane in surface seawater during the 2012/13 austral summer. Tellus B: Chem. Phys. Meteorol 70, 1478594. doi: 10.1080/16000889.2018.1478594
Caballero I., Roca M., Santos-Echeandía J., Bernárdez P., Navarro G. (2022). Use of the sentinel-2 and landsat-8 satellites for water quality monitoring: an early warning tool in the mar menor coastal lagoon. Remote Sens. 14, 2744. doi: 10.3390/rs14122744
Carmona E., Almendros J., Serrano I., Stich D., Ibáñez J. M. (2012). Results of seismic monitoring surveys of Deception Island volcano, Antarctica, from 1999–2011. Antarctic Sci. 24, 485–499. doi: 10.1017/S0954102012000314
Caselli A. T., Afonso M. S., Agusto M. (2004). The fumarolic gases at Deception Island (South Shetland Islands, Antarctica). Chemical changes and deposits related to seismic crisis of 1999.
Castro M. F., Neves J. C. L., Francelino M. R., Schaefer C. E. G. R., Oliveira T. S. (2021). Seabirds enrich Antarctic soil with trace metals in organic fractions. Sci. Total Environ. 785, 147271. doi: 10.1016/j.scitotenv.2021.147271
Chever F., Sarthou G., Bucciarelli E., Blain S., Bowie A. R. (2010). An iron budget during the natural iron fertilization experiment KEOPS (Kerguelen Islands, Southern Ocean). Biogeosciences 7, 455–468. doi: 10.5194/bg-7-455-2010
Chu Z., Yang Z., Wang Y., Sun L., Yang W., Yang L., et al. (2019). Assessment of heavy metal contamination from penguins and anthropogenic activities on Fildes Peninsula and Ardley Island, Antarctic. Sci. Total Environ. 646, 951–957. doi: 10.1016/j.scitotenv.2018.07.152
Da Silva J. F., Williams R. J. P. (2001). The biological chemistry of the elements: the inorganic chemistry of life (Oxford University Press, New York).
De Jong J. T. M., Stammerjohn S. E., Ackley S. F., Tison J.-L., Mattielli N., Schoemann V. (2015). Sources and fluxes of dissolved iron in the Bellingshausen Sea (West Antarctica): The importance of sea ice, icebergs and the continental margin. Mar. Chem. 177, 518–535. doi: 10.1016/j.marchem.2015.08.004
De La Paz M., Huertas I. E., Flecha S., Ríos A. F., Pérez F. F. (2015). Nitrous oxide and methane in Atlantic and Mediterranean waters in the Strait of Gibraltar: Air-sea fluxes and inter-basin exchange. Prog. Oceanogr 138, 18–31. doi: 10.1016/j.pocean.2015.09.009
Dickson A. G., Millero F. J. (1987). A comparison of the equilibrium constants for the dissociation of carbonic acid in seawater media. Deep Sea Res. Part A. Oceanogr Res. Papers 34, 1733–1743. doi: 10.1016/0198-0149(87)90021-5
Dickson A. G., Wesolowski D. J., Palmer D. A., Mesmer R. E. (1990). Dissociation constant of bisulfate ion in aqueous sodium chloride solutions to 250. degree. C. J. Phys. Chem. 94, 7978–7985. doi: 10.1021/j100383a042
Flexas M. M., Arias M. R., Ojeda M. A. (2017). Hydrography and dynamics of port foster, deception island, Antarctica. Antarctic Sci. 29, 83–93. doi: 10.1017/S0954102016000444
Friedlingstein P., O’Sullivan M., Jones M. W., Andrew R. M., Hauck J., Olsen A., et al. (2020). Global carbon budget 2020. Earth Syst. Sci. Data 12, 3269–3340. doi: 10.5194/essd-12-3269-2020
García-Veira D., Sukekava C. F., Sparaventi E., Navarro G., Huertas I. E., Tovar-Sánchez A., et al. (2024). A first estimation of the role of penguin guano on copper cycling and organic speciation in Antarctic coastal waters. Sci. Total Environ. 912, 169266. doi: 10.1016/j.scitotenv.2023.169266
German C. R., Seyfried W. E. (2014). Hydrothermal processes, in: treatise on geochemistry (Elsevier Science, AE Amsterdam, Netherlands), 131–233.
Gonçalves-Araujo R., De Souza M. S., Tavano V. M., Garcia C. A. E. (2015). Influence of oceanographic features on spatial and interannual variability of phytoplankton in the Bransfield Strait, Antarctica. J. Mar. Syst. 142, 1–15. doi: 10.1016/j.jmarsys.2014.09.007
Gruber N., Clement D., Carter B. R., Feely R. A., Van Heuven S., Hoppema M., et al. (2019). The oceanic sink for anthropogenic CO 2 from 1994 to 2007. Science 363, 1193–1199. doi: 10.1126/science.aau5153
Hansen H. P., Koroleff F. (1999). Determination of nutrients. in: Grasshoff K., Kremling K., Ehrhardt M. (Eds.), Methods of Seawater Analysis. Wiley, pp, 159–228. doi: 10.1002/9783527613984.ch10
Heeschen K. U., Keir R. S., Rehder G., Klatt O., Suess E. (2004). Methane dynamics in the Weddell Sea determined via stable isotope ratios and CFC-11. Global Biogeochem Cycles 18, 2003GB002151. doi: 10.1029/2003GB002151
Ito R. G., Tavano V. M., Mendes C. R. B., Garcia C. A. E. (2018). Sea-air CO2 fluxes and pCO2 variability in the Northern Antarctic Peninsula during three summer periods, (2008–2010). Deep Sea Res. Part II: Topical Stud. Oceanogr 149, 84–98. doi: 10.1016/j.dsr2.2017.09.004
Janssen D. J., Sieber M., Ellwood M. J., Conway T. M., Barrett P. M., Chen X., et al. (2020). Trace metal and nutrient dynamics across broad biogeochemical gradients in the Indian and Pacific sectors of the Southern Ocean. Mar. Chem. 221, 103773. doi: 10.1016/j.marchem.2020.103773
Kholmogorov A., Syrbu N., Shakirov R. (2022). Influence of hydrological factors on the distribution of methane fields in the water column of the bransfield strait: cruise 87 of the R/V “Academik mstislav keldysh”, 7 December 2021–5 April 2022. Water 14, 3311. doi: 10.3390/w14203311
Klunder M. B., Laan P., Middag R., De Baar H. J. W., van Ooijen J. C. (2011). Dissolved iron in the Southern Ocean (Atlantic sector). Deep Sea Res. Part II: Topical Stud. Oceanogr 58, 2678–2694. doi: 10.1016/j.dsr2.2010.10.042
Kusakabe M., Nagao K., Ohba T., Seo J. H., Park S.-H., Lee J. I., et al. (2009). Noble gas and stable isotope geochemistry of thermal fluids from Deception Island, Antarctica. Antarctic Sci. 21, 255–267. doi: 10.1017/S0954102009001783
Laglera L. M., Tovar-Sanchez A., Sukekava C. F., Naik H., Naqvi S. W. A., Wolf-Gladrow D. A. (2020). Iron organic speciation during the LOHAFEX experiment: Iron ligands release under biomass control by copepod grazing. J. Mar. Syst. 207, 103151. doi: 10.1016/j.jmarsys.2019.02.002
Lamontagne R. A., Swinnerton J. W., Linnenbom V. J. (1974). C1-C4 hydrocarbons in the north and south pacific1. Tellus A: Dynamic Meteorol Oceanogr 26, 71. doi: 10.3402/tellusa.v26i1-2.9738
Lee K., Kim T.-W., Byrne R. H., Millero F. J., Feely R. A., Liu Y.-M. (2010). The universal ratio of boron to chlorinity for the North Pacific and North Atlantic oceans. Geochim Cosmochim Acta 74, 1801–1811. doi: 10.1016/j.gca.2009.12.027
Liu X., Nie Y., Sun L., Emslie S. D. (2013). Eco-environmental implications of elemental and carbon isotope distributions in ornithogenic sediments from the Ross Sea region, Antarctica. Geochim Cosmochim Acta 117, 99–114. doi: 10.1016/j.gca.2013.04.013
Maestro A., Somoza L., Rey J., Martínez-Frías J., López-Martínez J. (2007). Active tectonics, fault patterns, and stress field of Deception Island: A response to oblique convergence between the Pacific and Antarctic plates. J. South Am. Earth Sci. 23, 256–268. doi: 10.1016/j.jsames.2006.09.023
Measures C. I., Brown M. T., Selph K. E., Apprill A., Zhou M., Hatta M., et al. (2013). The influence of shelf processes in delivering dissolved iron to the HNLC waters of the Drake Passage, Antarctica. Deep Sea Res. Part II: Topical Stud. Oceanogr 90, 77–88. doi: 10.1016/j.dsr2.2012.11.004
Mehrbach C., Culberson C. H., Hawley J. E., Pytkowicx R. M. (1973). MEASUREMENT OF THE APPARENT DISSOCIATION CONSTANTS OF CARBONIC ACID IN SEAWATER AT ATMOSPHERIC PRESSURE1. Limnol Oceanogr 18, 897–907. doi: 10.4319/lo.1973.18.6.0897
Mei K., Wang D., Jiang Y., Shi M., Chen C.-T. A., Zhang Y., et al. (2022). Transformation, fluxes and impacts of dissolved metals from shallow water hydrothermal vents on nearby ecosystem offshore of kueishantao (NE Taiwan). Sustainability 14, 1754. doi: 10.3390/su14031754
Monteiro T., Kerr R., MaChado E. D. C. (2020). Seasonal variability of net sea-air CO2 fluxes in a coastal region of the northern Antarctic Peninsula. Sci. Rep. 10, 14875. doi: 10.1038/s41598-020-71814-0
Montzka S. A., Dlugokencky E. J., Butler J. H. (2011). Non-CO2 greenhouse gases and climate change. Nature 476, 43–50. doi: 10.1038/nature10322
Morel F. M. M., Price N. M. (2003). The biogeochemical cycles of trace metals in the oceans. Science 300, 944–947. doi: 10.1126/science.1083545
Morley S. A., Abele D., Barnes D. K. A., Cárdenas C. A., Cotté C., Gutt J., et al. (2020). Global drivers on southern ocean ecosystems: changing physical environments and anthropogenic pressures in an earth system. Front. Mar. Sci. 7. doi: 10.3389/fmars.2020.547188
O'Reilley J. E., Maritorena S., O’Brien M. C., Siegel D. A., Toole D., Menzies D., et al. (2000). Volume 11, SeaWiFS Postlaunch Calibration and Validation Analyses, Part 3. (NASA Goddard Space Flight Center).
Perez F. F., Fraga F. (1987). Association constant of fluoride and hydrogen ions in seawater. Mar. Chem. 21, 161–168. doi: 10.1016/0304-4203(87)90036-3
Polonik N. S., Ponomareva A. L., Eskova A. I., Shakirov R. B., Obzhirov A. I., Morozov E. G. (2021). Distribution and sources of methane in the water layers of the antarctic straits: bransfield strait and antarctic sound. Oceanology 61, 892–898. doi: 10.1134/S0001437021060308
Polukhin A. A., Morozov E. G., Tishchenko P. P., Frey D. I., Artemiev V. A., Borisenko G. V., et al. (2021). Water structure in the bransfield strait (Antarctica) in january 2020: hydrophysical, optical, and hydrochemical features. Oceanology 61, 632–644. doi: 10.1134/S0001437021050106
Resing J. A., Sedwick P. N., German C. R., Jenkins W. J., Moffett J. W., Sohst B. M., et al. (2015). Basin-scale transport of hydrothermal dissolved metals across the South Pacific Ocean. Nature 523, 200–203. doi: 10.1038/nature14577
Rey J., Somoza L., Martínez-Frías J. (1995). Tectonic, volcanic, and hydrothermal event sequence on Deception Island (Antarctica). Geo-Marine Lett. 15, 1–8. doi: 10.1007/BF01204491
Rodrigues C. C. F., Santini M. F., Lima L. S., Sutil U. A., Carvalho J. T., Cabrera M. J., et al. (2023). Ocean-atmosphere turbulent CO2 fluxes at Drake Passage and Bransfield Strait. An Acad. Bras. Ciênc 95, e20220652. doi: 10.1590/0001-3765202320220652
Sañudo-Wilhelmy S. A., Olsen K. A., Scelfo J. M., Foster T. D., Flegal A. R. (2002). Trace metal distributions off the Antarctic Peninsula in the Weddell Sea. Mar. Chem. 77, 157–170. doi: 10.1016/S0304-4203(01)00084-6
Schoonen M. A. A., Xu Y. (2001). Nitrogen reduction under hydrothermal vent conditions: implications for the prebiotic synthesis of C-H-O-N compounds. Astrobiology 1, 133–142. doi: 10.1089/153110701753198909
SCOR Working Group (2007). GEOTRACES – An international study of the global marine biogeochemical cycles of trace elements and their isotopes. Geochemistry 67, 85–131. doi: 10.1016/j.chemer.2007.02.001
Sharp J. D., Byrne R. H. (2020). Interpreting measurements of total alkalinity in marine and estuarine waters in the presence of proton-binding organic matter. Deep Sea Res. Part I: Oceanogr Res. Papers 165, 103338. doi: 10.1016/j.dsr.2020.103338
Shitashima K. (1998). CO2 supply from deep-sea hydrothermal systems. Waste Manage. 17, 385–390. doi: 10.1016/S0956-053X(97)10046-0
Sierpinski S. F. D., Baquer L. M. L., Martins C. C., Grassi M. T. (2023). Exploratory evaluation of iron and its speciation in surface waters of Admiralty Bay, King George Island, Antarctica. An Acad. Bras. Ciênc 95, e20211520. doi: 10.1590/0001-3765202320211520
Somoza L., Martı́nez-Frı́as J., Smellie J. L., Rey J., Maestro A. (2004). Evidence for hydrothermal venting and sediment volcanism discharged after recent short-lived volcanic eruptions at Deception Island, Bransfield Strait, Antarctica. Mar. Geol 203, 119–140. doi: 10.1016/S0025-3227(03)00285-8
Sparaventi E., Rodríguez-Romero A., Barbosa A., Ramajo L., Tovar-Sánchez A. (2021). Trace elements in Antarctic penguins and the potential role of guano as source of recycled metals in the Southern Ocean. Chemosphere 285, 131423. doi: 10.1016/j.chemosphere.2021.131423
Sturz A. A., Gray S. C., Dykes K., King A., Radtke J. (2003). Seasonal changes of dissolved nutrients within and around Port Foster Deception Island, Antarctica. Deep Sea Res. Part II: Topical Stud. Oceanogr 50, 1685–1705. doi: 10.1016/S0967-0645(03)00086-9
Terhaar J., Frölicher T. L., Joos F. (2021). Southern Ocean anthropogenic carbon sink constrained by sea surface salinity. Sci. Adv. 7, eabd5964. doi: 10.1126/sciadv.abd5964
Tilbrook B. D., Karl D. M. (1993). RACER: methane enrichments in port foster, deception island. Antarctic J. United States 28, 165–166.
Tilbrook B. D., Karl D. M. (1994). Dissolved methane distributions, sources, and sinks in the western Bransfield Strait, Antarctica. J. Geophys. Res. 99, 16383–16393. doi: 10.1029/94JC01043
Tovar-Sanchez A. (Ed.) (2012). Comprehensive sampling and sample preparation: analytical techniques for scientists (Amsterdam: Elsevier).
Van Heuven S., Pierrot D., Rae J., Lewis E., Wallace D. (2011). CO2SYS v 1.1, MATLAB program developed for CO2 system calculations. ORNL/CDIAC-105b (Oak Ridge, TN: Oak Ridge National Laboratory).
Von Damm K. L., Lilley M. D. (2004). “Diffuse flow hydrothermal fluids from 9° 50′ N East Pacific Rise: Origin, evolution and biogeochemical controls,” in Geophysical Monograph Series. Eds. Wilcock W. S. D., DeLong E. F., Kelley D. S., Baross J. A., Craig Cary S. (American Geophysical Union, Washington, D. C.), 245–268. doi: 10.1029/144GM16
Wanninkhof R. (2014). Relationship between wind speed and gas exchange over the ocean revisited. Limnol Ocean Methods 12, 351–362. doi: 10.4319/lom.2014.12.351
Weber T., Wiseman N. A., Kock A. (2019). Global ocean methane emissions dominated by shallow coastal waters. Nat. Commun. 10, 4584. doi: 10.1038/s41467-019-12541-7
Weiss R. F. (1970). The solubility of nitrogen, oxygen and argon in water and seawater. Deep Sea Res. Oceanogr Abstracts 17, 721–735. doi: 10.1016/0011-7471(70)90037-9
Weiss R. F., Price B. A. (1980). Nitrous oxide solubility in water and seawater. Mar. Chem. 8, 347–359. doi: 10.1016/0304-4203(80)90024-9
Wiesenburg D. A., Guinasso N. L. (1979). Equilibrium solubilities of methane, carbon monoxide, and hydrogen in water and sea water. J. Chem. Eng Data 24, 356–360. doi: 10.1021/je60083a006
Xu G., Gao Y. (2014). Atmospheric trace elements in aerosols observed over the Southern Ocean and coastal East Antarctica. Polar Res. 33, 23973. doi: 10.3402/polar.v33.23973
Ye W., Arévalo‐Martínez D. L., Li Y., Wen J., He H., Zhang J., et al (2023). Significant methane undersaturation during austral summer in the Ross Sea (Southern Ocean). Limnol. Oceanogr. Letters 8, 305–312. doi: 10.1002/lol2.10315
Keywords: Deception Island, trace metals, fumaroles, biogeochemistry, hydrothermal vents, Southern Ocean, greenhouse gases emission
Citation: Belyaev O, Huertas IE, Navarro G, Amaya-Vías S, de la Paz M, Sparaventi E, Heredia S, Sukekava CF, Laglera LM and Tovar-Sánchez A (2024) Hydrothermal alteration of seawater biogeochemistry in Deception Island (South Shetland Islands, Antarctica). Front. Mar. Sci. 11:1432122. doi: 10.3389/fmars.2024.1432122
Received: 13 May 2024; Accepted: 29 July 2024;
Published: 16 August 2024.
Edited by:
Cecile Guieu, UMR7093 Laboratoire d’océanographie de Villefranche (LOV), FranceReviewed by:
Thomas Michael Holmes, Antarctic Climate and Ecosystems Cooperative Research Centre (ACE CRC), AustraliaCedric Boulart, UMR7144 Adaptation et diversité en milieu marin (AD2M), France
Copyright © 2024 Belyaev, Huertas, Navarro, Amaya-Vías, de la Paz, Sparaventi, Heredia, Sukekava, Laglera and Tovar-Sánchez. This is an open-access article distributed under the terms of the Creative Commons Attribution License (CC BY). The use, distribution or reproduction in other forums is permitted, provided the original author(s) and the copyright owner(s) are credited and that the original publication in this journal is cited, in accordance with accepted academic practice. No use, distribution or reproduction is permitted which does not comply with these terms.
*Correspondence: Oleg Belyaev, by5iZWx5YWV2QGNzaWMuZXM=