 Chuanjun Wang1
 Yixiong He
- 1Office of Ecological Environment Protection and International Cooperation, National Marine Environmental Monitoring Center, Dalian, China
- 2College of Economics and Management, Zhejiang Ocean University, Zhoushan, China
- 3Department of Marine Industry and Policy Innovation, Southern Marine Science and Engineering Guangdong Laboratory (Zhuhai), Zhuhai, China
- 4Division of Island Ecological Environment Protection, National Marine Environmental Monitoring Center, Dalian, China
Introduction: Coastal erosion is widely distributed globally, with sandy coasts being particularly prominent, causing significant economic losses to coastal areas. This study focuses on the coastal areas of Liaoning Province, China, which represent typical sandy beach erosion.
Methods: Based on the assessment of coastal erosion disaster losses, a multivariate variable-weight combination prediction model is utilized to predict the losses caused by coastal erosion disasters, providing an effective mathematical modeling approach for predicting such losses. Furthermore, the cluster analysis method is employed to delineate vulnerability risk zones for coastal erosion along the Liaoning Province coast.
Results and discussion: The research findings indicate the following: (1) From 2023 to 2025, the losses due to coastal erosion disasters in Liaoning Province are projected to decrease significantly from a scale of 36 million RMB yuan to 5 million RMB yuan; (2) Based on the magnitude of disaster vulnerability risk, the coastal areas of Liaoning Province are categorized into four risk zones: high-risk zones (Jinzhou District), moderately high-risk zones (Zhuanghe City, Wafangdian City, Ganjingzi District), medium-risk zones (Lvshunkou District, Bayuquan), and low-risk zones (Gaizhou City, Suizhong County, Xingcheng City). Recommendations are proposed accordingly: (1) Effective measures should be implemented to mitigate the losses incurred by coastal erosion on land, buildings, infrastructure, agricultural output; (2) In the selection of disaster prevention and control measures,economic factors should be carefully considered in line with the specific circumstances of the losses. Specifically, the economic efficiency of disaster prevention and mitigation measures should be taken into account; (3) Precise efforts should be made to implement coastal erosion disaster prevention and control measures in different regions.
1 Introduction
As the interface between the ocean, land, and air, the coastal zone accommodates over 60% of the world’s population, more than two-thirds of major cities, and over two-thirds economic belts. Most of the economically developed regions in the world are located in coastal areas, so are most populations, urban areas, and advanced infrastructure. Therefore, the environmental evolution of the coastal zone directly bears on human living space, quality of life, and societal sustainable development. However, continuous sea level rise, long-term reduction of sediment entering the sea, and intensified human activities have gradually made coastal erosion and coastline retreat the main threats to the sustainable development of coastal zones (Chen et al., 2010).
Coastal erosion is a geological disaster phenomenon where the coastline retreats and beaches erode due to the impact of seawater dynamics (Marchand, 2010). It is widely distributed worldwide (Cai et al., 2009), particularly prominent in sandy coasts (Mangor, 2004). Studies indicate that 70% of beaches globally have been threatened by coastal erosion disasters (Bird ECF, 1985). Over the past 100 years, approximately 86% of the U.S. East Coast has experienced coastal erosion disasters (Zhang et al., 2004). Among Japan’s 34,386 km of coastline, approximately 66% have erosion rates exceeding 1 m/year, and 47% of the total length of Japan’s coastline requires engineering measures for protection (Mimura and Kawaguchi, 1996). The Korean government discovered that the main causes of erosion were the construction of coastal structures, the extraction of marine sand, and disruptions to currents (Ministry of Oceans and Fisheries, 2014).Coastal erosion issues accounted for 70% of the 580 coastal maintenance projects submitted in 2008. A series of 120 erosion monitoring tests found erosion in 44% of the tested areas in 2005 and 73% in 2012. Video monitoring of the subject areas shows that beach width has shrunk by 3.5% (Chang and Yoon, 2016). Around 1349.3 km of Malaysia’s coastline is continuously eroding due to coastal development and sea-level rise. There are 44 places in the Critical Erosion category with a total length of approximately 55.4 km, 309 sites in the Significant Erosion category with a total length of around 376.1 km, and 2344 areas in the Acceptable Erosion category with a total length of ≈916.5 km (Wan et al., 2024). In Bekasi, a city in the province of West Java in Indonesia, Desa Pantai Bahagia is the most vulnerable area to coastal erosion, with a maximum rate of 132.55 m/year from 1990 to 2020. The combined extents of eroded and accreted shorelines along the coast of Muaragembong are approximately − 1,707.09 and + 512.14 hectares respectively (Tubagus et al., 2024). The erosion rate of China’s coastline exceeds one-third, with preliminary estimates indicating that 46% of the Bohai Sea coastline, 49% of the Yellow Sea coastline, 44% of the East China Sea coastline (including Taiwan Island coastline), and 21% of the South China Sea coastline (including Hainan Island coastline) are subject to erosion (Ji, 1996). In 2004, the EUROSION project research indicated that 15% of European coastlines were undergoing erosion (National Institute for Coastal and Marine Management of the Netherlands (RIKZ), 2004). As shown in Table 1, 50% of the coastline segments with protective structures have been experiencing erosion.
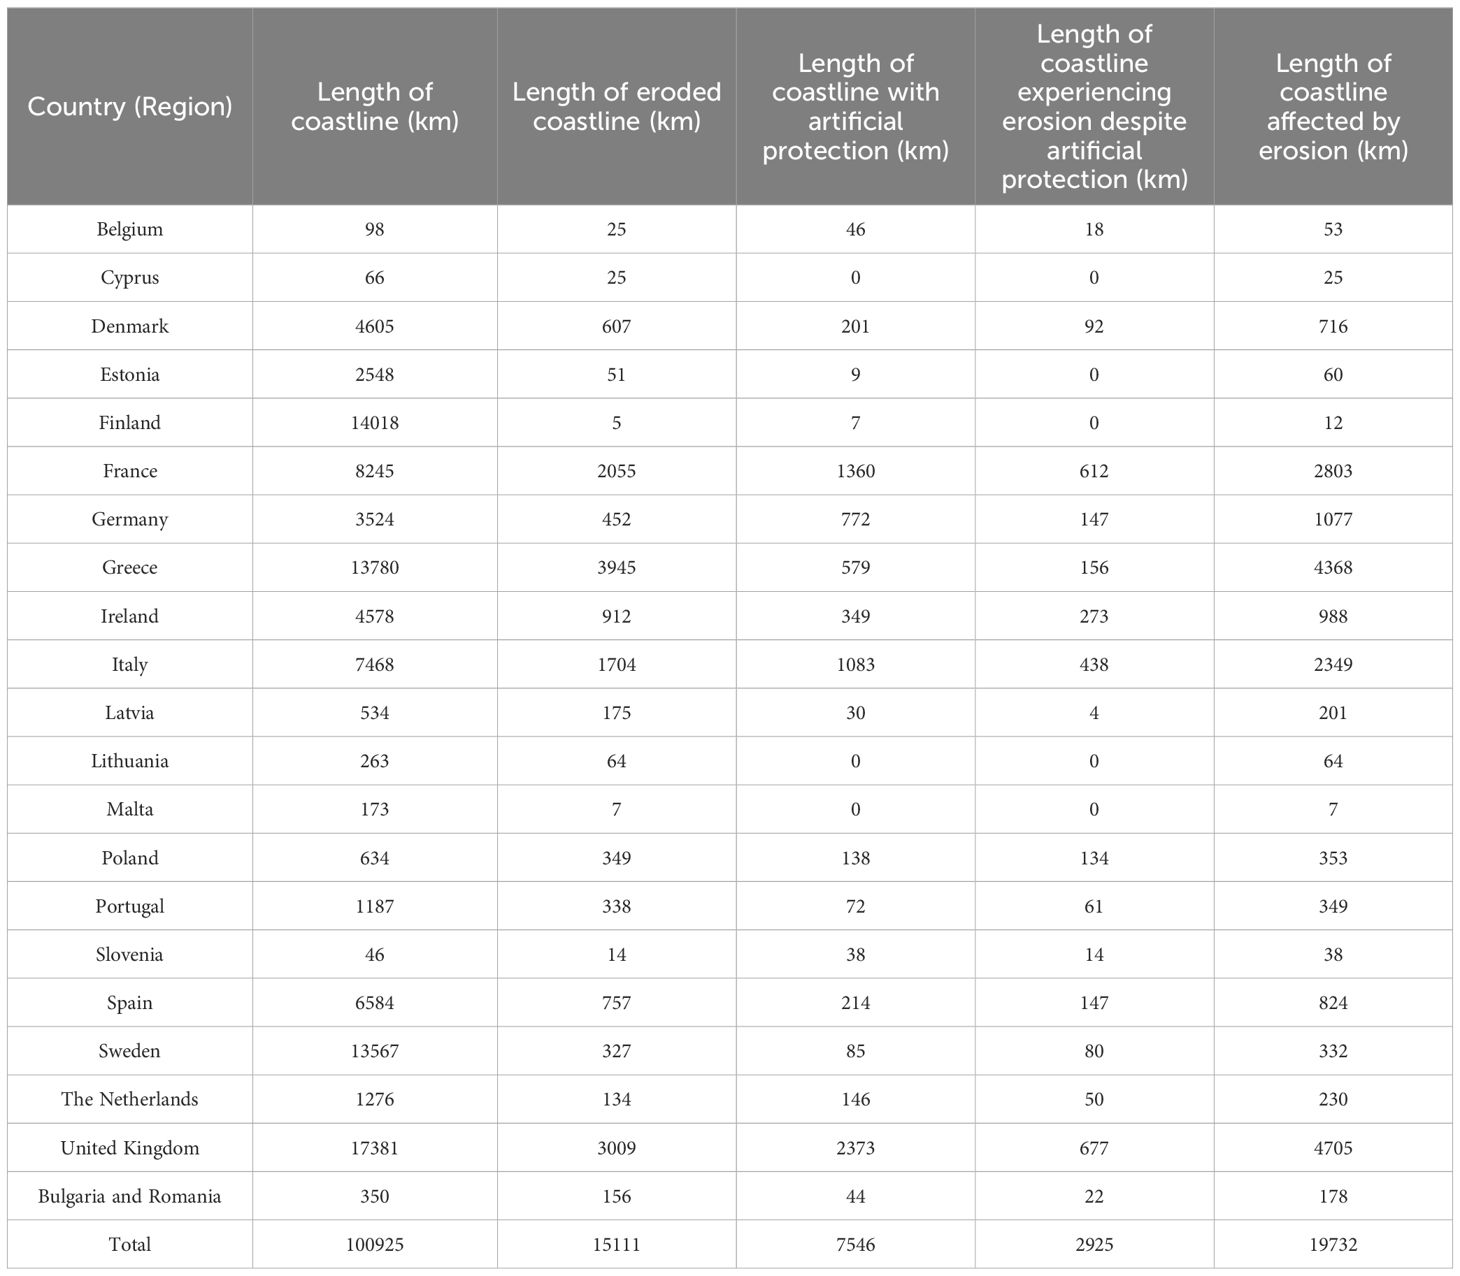
Table 1 Coastal erosion status in some european countries.
Coastal erosion, as a typical and common disaster in coastal zones, has long been widely studied and addressed by scholars from various perspectives. Currently, research on coastal erosion disasters mainly focuses on disaster assessment, causal mechanisms, and protective measures. In 1962, Bruun proposed a relevant rule for assessing coastal erosion caused by sea-level rise (Bruun, 1962). However, due to numerous assumptions made in this rule, it was found impractical for actual engineering applications. Subsequently, it was refined and improved by several scholars (Bruun, 1988; Bray and Hooke, 1997), and became successfully applicable in practical engineering (Tan and Yu, 2012). In 1968, Edelman proposed a method for predicting beach dune erosion, which was further enhanced by Graaff and others (Graaff, 1982). However, due to a scarcity of field measurement data, erosion prediction relied solely on rough assumptions. Since the mid-1980s, the European Union has successively implemented research programs such as CORIN, SEDMOC (1998–2002), HUMOR (2001–2005), and EUROSION (1999–2004), and conducted research on the long-term and short-term evolution laws of coastlines, sediment movement mechanisms, intensity and laws of coastal erosion, prediction models, and protective measures. In 2004, the EU EROSION project quantitatively evaluated coastal erosion risks in various regions of Europe based on the concept of the impact radius of coastal erosion and flood disasters. Subsequently, scientists from various countries carried out a lot of research on coastal erosion. Dean et al. determined the impact of waves on coastal erosion under breakwater wave action through years of observation on Plam Beach in the United States (Dean et al., 1997). Research by Japanese scholar Uda found that coastal erosion caused by port engineering was due to the obstruction of alongshore sediment transport (Uda et al., 2005; Uda, 2007). Barrie et al. studied the coastline of the Canadian Pacific region, elaborated on the mechanisms of sea-level change affecting the coast, and thought that sea-level change plays a dominant role in coastal evolution (Barrie and Conway, 2002). Pethick proposed that changes in coastal geomorphology are responses to dynamic factors both perpendicular and parallel to the coast (Pethick, 2001). Mimura et al. and Sakashita et al. respectively studied the effects of pure waves on offshore barrier morphology changes and the effects of breakwaters on coastline changes (Mimura et al., 2010; Sakashita et al., 2011). Guo (2018) revealed the evolution characteristics of coastlines and the erosion and deposition changes in sea areas with the application of technologies such as GIS, RS, and the Delft 3D mathematical model. Based on the hydrodynamic field, sediment sources, and sediment transport characteristics of the sea area, the mechanism of coastal deposition evolution was elucidated from multiple perspectives. Li (2018) explored the mechanisms and reasons for the impact of alongshore hard protection works, fishing port breakwater perpendicular structures, and offshore artificial island projects on the shoreline and profile morphology of adjacent beaches. In the field of coastal erosion protection and restoration research, numerical simulation and physical models have become hot topics for coastal erosion protection and restoration research (Yüksek et al., 1995). Raudkivi et al. used analysis of measured data and physical model simulation methods to discuss coastal protection methods such as artificial beach nourishment, construction of spur dikes, and embedded diaphragm walls (Raudkivi and Dette, 2002). As for specific technologies, beach nourishment is the most commonly used method for restoring sandy coasts, and relevant theories have matured and been widely applied in practice. In addition, protective afforestation, halophytic vegetation, etc., have shown significant effects on the restoration of erosion-prone coasts such as soft rock coasts (Lee, 2008; Walkden and Dickson, 2008). In recent years, in the application and practice of beach maintenance technology, Chinese scholars have innovatively proposed a large number of key innovative technologies such as the numerical simulation of strong tidal beach profile evolution (Shi et al., 2013), compound beach restoration for strongly eroded coasts (Zhu et al., 2021), capacity-boosting and silt-reducing for muddy coasts (Wen et al., 2021), and ecological design of beach maintenance ancillary projects (Yang et al., 2014). In terms of intelligent monitoring of coastal erosion, Hanying Li et al. combined multi-temporal remote sensing images with measured beach data to explore the impact of island engineering on coastal sedimentation (Li et al., 2019). McCarroll et al. used drone and satellite remote sensing technology to identify coastal erosion areas (McCarroll et al., 2024). Patel et al. monitored coastal erosion in the coastal region of Gujarat, India, using multi-temporal remote sensing and sea surface temperature data (Patel et al., 2024). Wan et al. identified the correlation between climate change and coastal erosion in Southeast Asia from aspects such as sea-level rise, storm surges, and monsoon patterns, and proposed the urgent need to establish robust adaptation strategies (Wan et al., 2024).In addition, scholars have also explored the factors affecting the vulnerability of coastal erosion and the constructed the evaluation indicators (Iwan et al., 2022; Badal et al., 2023),which helps in the selection and implementation of effective protective measures.
However, there is currently limited research on the socio-economic losses caused by coastal erosion disasters. Coastal erosion disasters receive significant attention because they often result in massive losses. Increased erosion will have a direct or indirect impact on coastal communities, such as coastal property loss, declining tourism activities (Wan et al., 2024). According to statistics, in 2001, European countries spent 3.2 billion euros to protect against coastal erosion (National Institute for Coastal and Marine Management of the Netherlands (RIKZ), 2004). This figure is quite astonishing, considering that Europe, where coastal erosion is not severe compared to other regions of the world. In 2017, China lost 14.3 hectares of land due to coastal erosion, resulting in economic losses of nearly 350 million yuan (Bulletin of China Marine Disaster in 2017, 2018). In Buenos Aires, Argentina, there has been erosional trends in 70% of the shoreline between 1965 and 2021 (Pedro et al., 2023).On the other hand, research on the vulnerability risk zoning of coastal erosion disasters is also very rare. The vulnerability risk zoning of coastal erosion disasters is based on the varying degrees of impact that coastal erosion disasters will have on society, economy, production, etc. In the target area, different risk areas are divided, which can help people intuitively understand the future erosion risk situation, and then efficiently and accurately take disaster prevention and reduction measures (Feng et al., 2022; Zhu et al., 2024).
Therefore, in light of the socio-economic development of coastal areas, comprehensive analysis and prediction of the potential losses caused by coastal erosion disasters in the future, revelation of the regional distribution of coastal erosion disaster risks from the perspective of economic vulnerability, as well as evaluation of the susceptibility of different regions to coastal erosion disasters, help to offer guidance for national economic development, promote rational production layout, and minimize the losses caused by disasters. This holds significant economic and strategic importance for regional sustainable development.
The authors selected the coastal areas of Liaoning Province, which are typical for sandy beach erosion in China, for research. Based on the evaluation of coastal erosion disaster losses, a combination prediction model is used to predict disaster loss values, and coastal erosion vulnerability risk zoning is conducted for each constituent area. The detailed research process is shown in Figure 1. The main contributions of this study are as follows: (1) In fully considering the influences of multiple factors, a variance reciprocal method is used to construct a variable weighting function, and a multivariate variable-weight combination prediction model is established on the basis of OGM(1,N), ARIMA model, and BP neural network. The established models are applied to predict the numerical losses of coastal erosion disasters in Liaoning Province, serving as an effective mathematical modeling method for predicting coastal erosion disaster losses. (2) Predictions of coastal erosion disaster losses in Liaoning Province for the years 2023–2025 are made to support the scientific implementation of regional coastal erosion disaster prevention and control management. (3) Through the cluster analysis method, entropy method, and grey relational analysis method, coastal erosion vulnerability risk zoning in Liaoning Province is carried out, which helps promote a rational layout of coastal development and utilization activities in the region and provides a reference for exploring the law of coastal erosion disaster vulnerability risk distribution.
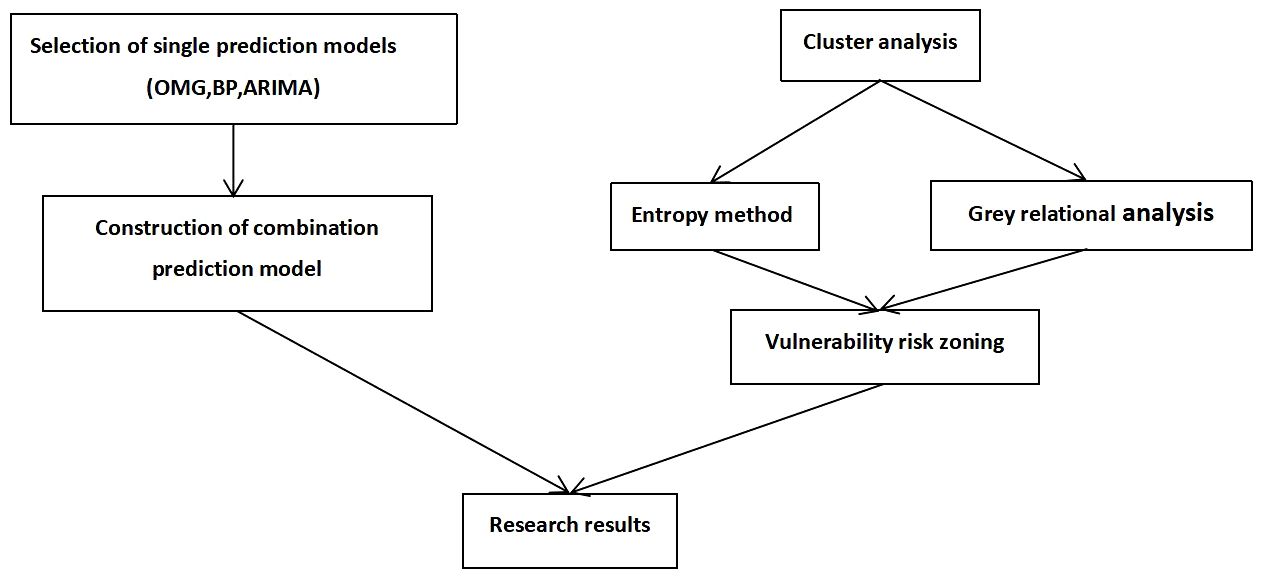
Figure 1 Research process.
The remainder of this study is structured as follows: Section 2 introduces the basic situation of Liaoning Province, elaborates on the reasons for selecting the research methods, and explains the composition of the indicator system and data sources. Section 3 compares and analyzes the results of economic loss prediction and vulnerability risk zoning for coastal erosion. Finally, Section 4 summarizes the research content of the study and proposes relevant policy recommendations based on this analysis.
2 Research area, methods, and data
2.1 Overview of the research area
Liaoning Province is located in the southernmost part of Northeast China, at the core area of the Northeast Asia Economic Circle. Its geographical coordinates range from 118°53′to 125°46′ east longitude and from 38°43′to 43°26′north latitude. It boasts a maximum width of 550 kilometers from east to west and an approximate length of around 550 kilometers from north to south. It shares borders with Jilin Province to the northeast and Inner Mongolia Autonomous Region to the northwest, serving as a vital link between North China and Northeast China. To the southwest, it adjoins Hebei Province, while to the southeast, the Yalu River serves as the boundary river with the Democratic People’s Republic of Korea, facing across the river. To the south, it borders the Bohai Sea and the Yellow Sea (Figure 2).
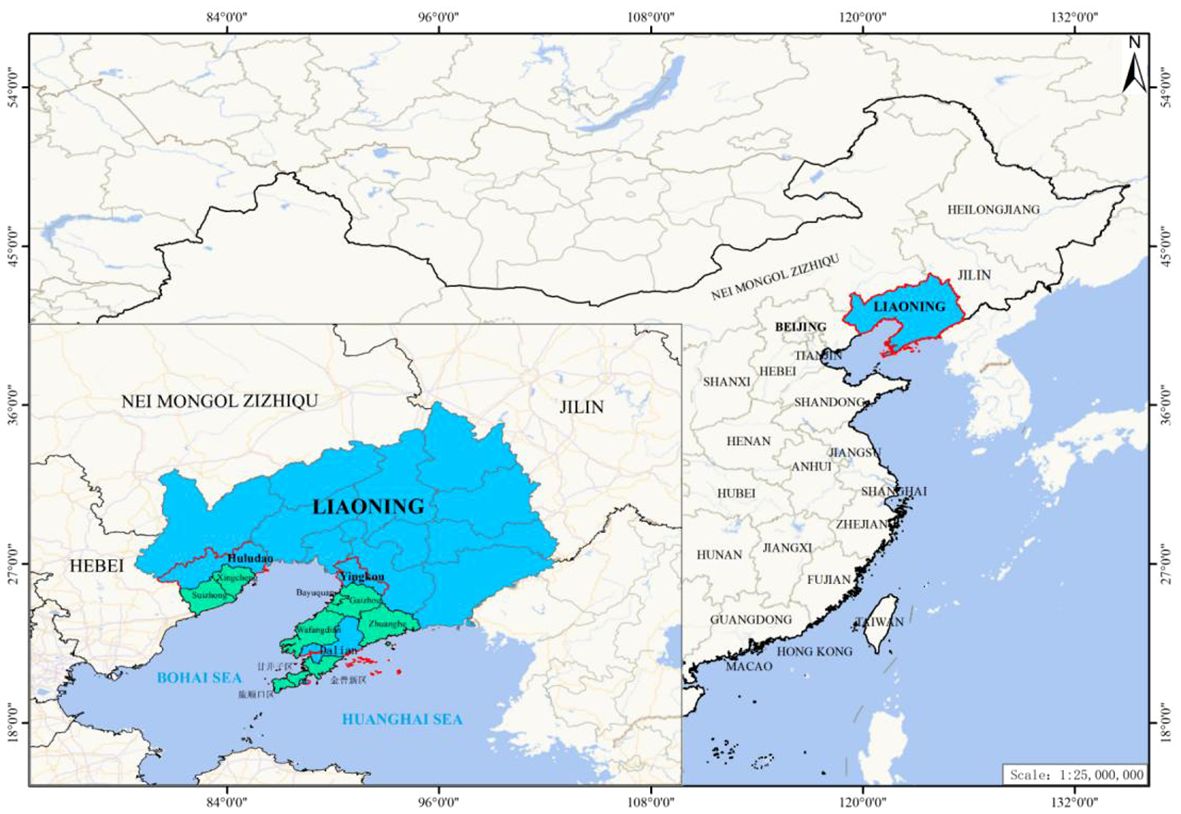
Figure 2 Location of Liaoning Province.
Liaoning Province has a land area of 148,600 square kilometers and a sea area of 41,300 square kilometers. To the west of the Liaodong Peninsula lies the Bohai Sea, while the east is bordered by the Yellow Sea. The total length of the coastline is 2,110 kilometers, stretching from the mouth of the Yalu River in the east to the Liaoning-Hebei border in the west. The terrain of the province can be summarized as “60% mountains, 10% water, and 30% plains”, with higher elevations in the north and lower elevations in the south. Mountainous and hilly areas are distributed in the eastern and western parts, gradually descending towards the central plain.
The province is divided into 14 prefecture-level cities and 100 counties and county-level cities, including 16 county-level cities, 25 counties, and 59 districts. As of the end of 2022, the permanent population of the province reached 41.97 million.
Under the influence of global climate change, Liaoning Province has experienced marine geological disasters such as coastal erosion, seawater intrusion, and soil salinization due to natural factors like rising sea levels and some human factors. In recent years, areas experiencing coastal erosion are mainly located along the sandy coasts of Suizhong County in Huludao City and Dalian City. In Suizhong County, the most eroded section of the coast has retreated 48.66 meters over seven years, with an average annual retreat of 6.95 meters. The beach has been eroded downwards by 420.98 centimeters, with an average annual downward erosion of 60.14 centimeters, making it one of the most severely affected areas by coastal erosion in China. Meanwhile, multiple rounds of beach restoration projects have been carried out along the coasts of Baisha Bay and Moon Bay in Yingkou City, effectively protecting the damaged coasts and mitigating coastal erosion disasters.
2.2 Selection of single prediction models
At present, prediction methods are mainly divided into three categories: econometric model prediction, time series prediction, and machine learning prediction. Each type of method has its own unique advantages. Therefore, based on the characteristics of the research object and the data situation, this study selects one of the research methods from each category as the single prediction model.
2.2.1 Optimized multivariate grey prediction model
Grey prediction is a prediction method that utilizes a small amount of incomplete information to develop mathematical models for prediction, which can effectively predict and describe the behavioral changes and development trends of uncertain systems(Deng, 2010).The grey prediction model (GM) is the fundamental model of grey prediction theory. It can be categorized into univariate grey prediction models and multivariate grey prediction models based on the number of variables involved in modeling. The multivariate grey prediction model addresses the limitations of the univariate model, such as its simplistic structure and restricted modeling capacity (Luo et al., 2020). However, traditional multivariate grey prediction models have shortcomings such as background value construction errors and a single model structure (Hsu, 2009).Hence, to ensure predictive accuracy, this study employs the optimized multivariate grey prediction model, specifically the OGM(1,N) model (Zeng et al., 2016), for establishing a combination prediction model. The OGM(1,N) model is represented as Equation 1:
Where x (0) 1 represents the original dependent variable sequence, and x (0) i (i = 2,3,…,n) represents the original independent variable sequence. x (1) 1 (k) and x (1) i (k) denote the first-order cumulative generation sequences of x (0) 1 and x (0) i respectively. Additionally, z (1) 1 (k) = 1/2(x (1) 1 (k) + x (1) 1 (k - 1)) (k = 1,2,…,n) represents the adjacent generation sequence.
2.2.2 ARIMA time series prediction
ARIMA, which stands for Autoregressive Integrated Moving Average, is a time series analysis method. It is an extension of the autoregressive moving average model. The fundamental concept of the ARIMA model involves establishing a model that describes the data’s characteristics through transformations such as autoregression, moving average, and differencing, to forecast future data changes(Box and Pierce, 1970). It can predict future trends and changes by analyzing and fitting historical data of time series, without the need for assumptions about the data (Siluyele and Jere, 2016).Thus, it’s extensively used for prediction and modeling to time series data (Lu and He, 2009).
The basic expression of the model is as Equation 2:
Where AR(p) represents the autoregressive model, I(d) represent the differencing model, and MA(q) represents the moving average model. Here, p is the autoregressive order, d is the differencing order, and q is the moving average order.
2.2.3 BP neural network prediction
Back Propagation (BP) neural network is a type of artificial neural network. It is a multi-layer feedforward neural network consisting of an input layer, a hidden layer, and an output layer. It is an algorithm model for exploratory learning. Each layer comprises several neurons, and each neuron transmits information from the hidden layer to the output layer through activation function operations. This facilitates the forward propagation of information from the input layer to the output layer, while error backpropagation is achieved based on the principle of minimizing the sum of squared errors. Through iterative forward and backward propagation, the neural network approximates the output based on the input layer features, resulting in a smaller mean square error. Therefore, it can map complex nonlinear relationships (Lu et al., 1993; Ma et al., 1993),which makes it find wide applications in the field of nonlinear prediction (Wen and Yuan, 2020).
2.3 Determination of combination prediction models and weights
Since Bates and Granger first proposed the combination prediction theory in 1969, which has attracted wide attention (Bates and Granger, 1969), breakthroughs have been made in the field of prediction. Different perspectives and levels can yield different prediction methods for the same issue. Single models may not encompass comprehensive prediction information. To fully leverage each model’s advantages and effectively extract more information from the original sequence, combining single models linearly or nonlinearly can maximize each model’s strengths and enhance prediction accuracy. Presently, the most commonly used combination model is the one constructed through the weighted average of single models, categorized into fixed-weight and variable-weight combination prediction models. Variable-weight combination models are more practical and suitable for time series data-based predictions (Zhang, 2018). Therefore, in consideration of multiple factors, this study employs the variance reciprocal method to construct a variable-weight function and establish a multivariate variable-weight combination prediction model based on optimized single models to yield superior prediction results.
2.3.1 Construction of combination prediction model
Assuming there are m different single prediction models for a certain prediction problem, let {yt, t = 1, 2,…, n} denote the actual observed data sequence, yit denote the predicted value of the i-th single prediction model at time t, and wit denote the variable weight coefficient of the i-th single prediction model at time t, where i = 1, 2,…, m, t = 1, 2,…, n. Then, the variable-weight combination prediction model composed of m single prediction models is represented as Equation 3:
The value of variable weight coefficient is as Equation 4
2.3.2 Variable weight method based on variance reciprocal
The focal point of the variable-weight combination model lies in determining the weights. The variance reciprocal method entails using the proportion of the reciprocal of the sum of squares of errors of each single prediction model within the total reciprocal of the sum of squares of errors to determine the weights. This method ensures the non-negativity of weights and assigns greater weights to single models with higher prediction accuracy, effectively improving prediction precision. However, single prediction models with smaller sums of squared errors cannot guarantee small errors at each time point. To address this deficiency, this study employs the variance reciprocal weighting method to assign weights to each single prediction model at each time point.
Let eit =(yt - yit) 2 denote the squared prediction error of the i-th single prediction model at time t. Then, the weight of the i-th single prediction model at time t within the combination model during the sample period is as Equation 5:
2.4 Vulnerability risk zoning method
Risk zoning is a comprehensive evaluation based on the causes of events, potential hazards, frequency, and other aspects to divide different risk areas (Zaid et al., 2022; Wang et al., 2024).Common zoning methods include comprehensive analysis and partition unit merging, or a combination of both. This study opts for the partition unit merging method, which consolidates various partition units into distinct coastal erosion vulnerability risk areas. To aggregate regions with significant disparities into different categories, cluster analysis is selected. Additionally, with reference to relevant research (Bagyarajm et al., 2023; Liang et al., 2024), entropy method and grey relational analysis are chosen as supplementary methods for cluster analysis.
Cluster analysis makes judgments based on the similarity of sample data. According to the clustering results, regions with similar vulnerability risks of coastal erosion can be classified into the same category. However, this method cannot quantify the risk magnitude of different categories of regions. Therefore, it is necessary to combine other comprehensive evaluation methods to rank regions of different categories by risk magnitude.
The entropy method determines the weight of each variable’s influence on coastal erosion vulnerability risk by calculating information entropy. The weighted sum of each variable multiplied by its corresponding original data yields the comprehensive score of the corresponding region. Combining the scoring results of cluster analysis and entropy method enables direct calculation of the average score of each category of regions and ranking. However, the entropy method makes weight judgments based on the information characteristics of sample data itself, lacking lateral comparison between indicators. Therefore, grey relational analysis is selected to make zoning results more reliable.
Grey relational analysis is primarily utilized for the comprehensive evaluation of systems with small sample spaces and ambiguous indicator relationships. By calculating the correlation coefficient θi(k) of the i-th object’s k-th indicator, an equal-weight grey relational degree is obtained. A higher degree of correlation indicates closer proximity to the optimal indicator value, resulting in a higher evaluation value for the area under evaluation. Coastal erosion vulnerability risk is a complex system characterized by the fuzziness of structural relationships, dynamic changes, incompleteness, and uncertainty of indicator data. Currently, coastal-related statistical data not only have few samples but also suffer from errors, omissions, and fuzziness. Therefore, using grey relational analysis to comprehensively evaluate coastal erosion vulnerability risk is appropriate.
2.5 Indicator selection
2.5.1 Loss prediction indicators
According to the Technical Specification for Coastal Erosion Monitoring and Disaster Losses Evaluation (GB/T 42435–2023) issued by the Chinese Ministry of Natural Resources in May 2023, coastal erosion disaster losses refer to the land loss caused by coastal erosion and its attached object loss, as well as the costs of coastal protection and restoration projects. Therefore, the economic losses of coastal erosion disasters mainly include economic losses of land, buildings, infrastructure, and agricultural output such as crops or trees caused by coastal erosion, and the costs of new coastal protection and restoration projects. Based on the above technical specifications, given that the economic losses of coastal erosion disasters are mainly influenced by the degree of coastal erosion, as well as economic factors such as land prices, output prices of goods, the value of buildings and infrastructure, and the construction costs of protection and restoration projects, the authors propose the following indicators for predicting economic losses from coastal erosion disasters (Table 2): (1) Coastal Erosion Intensity: Using indicators such as coastline retreat rate, beach erosion rate, and average sediment particle size change rate to analyze the disaster extent of coastal erosion in the region; (2) GDP: Refers to the gross domestic product in the region; (3) Per Capita Land Area: Calculated by dividing the total land area in the region by the total population; (4) Urbanization Level: Represents the proportion of the urban population to the total population in the region; (5) Agricultural Output Value: Represents the total value of all agricultural, forestry, animal husbandry, fishery, and sideline products in monetary terms, reflecting the total scale and results of agricultural production in the region. In the study, we select Suizhong County, Xingcheng City, Gaizhou City, Wafangdian City, Lvshunkou District, and Jinzhou District in Liaoning Province, where disaster losses occurred during the investigation period, for research to predict economic losses from coastal erosion disasters.

Table 2 Research indicators.
2.5.2 Vulnerability risk zoning indicators
According to the general understanding of disaster risk factors, the risk factors of coastal erosion disasters mainly include the hazard of causative factors, the vulnerability of exposed bodies, and disaster prevention and mitigation capabilities. Vulnerability (or fragility) of exposed bodies represents the potential harm of disasters to the risk-bearing subjects (Paul et al., 2019), revealing the extent of damage or loss that may occur to any property existing in hazard-prone areas due to potential hazard factors, and comprehensively reflecting the degree of loss that coastal erosion disasters may cause. Hazard of coastal erosion disasters refers to the degree of natural variability causing coastal erosion disasters, representing the characteristics such as frequency, intensity, and duration of causative factors triggering coastal erosion disasters (Chen, 2007). Disaster prevention and mitigation capabilities represent the extent to which the disaster-stricken area reduces losses from coastal erosion disasters in the long and short terms and recovers from them.
The purpose of coastal erosion disaster vulnerability risk zoning is to reveal the spatial regional differences in vulnerability risks of coastal erosion disasters. The zoning principles should be consistent with the zoning objectives. Combining the analysis of risk factors, this study proposes the following principles: (1) Relative Consistency of the Impact and Hazard Levels of Coastal Erosion Disasters on Various Regions: This principle is the basic principle of coastal erosion disaster risk zoning. The impact and hazard levels of coastal erosion depend on various factors, not only on natural factors but also on various social and economic factors; (2) Relative Consistency of the Difficulty of Resisting Coastal Erosion and the Measures for Coping with It: This principle is a supplement to the basic principle. The size of the impact and hazard levels of coastal erosion disasters in a certain region, as well as the level of prediction and defense capabilities, fundamentally determine the difficulty of resisting coastal erosion in that area and the measures that should be taken; (3) Relative Consistency of the Main Causative Factors of Coastal Erosion Disasters: This determines the various types of losses that coastal erosion disasters may cause.
Based on this, given that the hazard of coastal erosion disaster factors is mainly related to the stability of coastal terrain and geomorphology, the vulnerability of exposed bodies is mainly related to the area of regional seas and the intensity of coastal development, and disaster prevention and mitigation capabilities are mainly related to the level of regional economic and social development, this study proposes the following indicators for coastal erosion disaster vulnerability risk zoning (Table 2): (1) Stability of Coastal Terrain and Geomorphology: Generally inversely related to the severity of coastal disasters, and represented by the reciprocal of coastal erosion intensity; (2) Proportion of Coastal Development: Represented by the ratio of artificial coastline length to total coastline length; (3) Area of Seas: Refers to the area of seas under regional jurisdiction; (4) Urbanization Level: Represents the proportion of the urban population to the total population in the region; (5) Proportion of Primary Industry Output Value to Gross Domestic Product: Represents the proportion of agriculture (including forestry, animal husbandry, fisheries, etc.) to the gross domestic product of the region; (6) GDP: Represents the gross domestic product of the region. In this study, we select Suizhong County, Xingcheng City, Gaizhou City, Bayuquan, Wafangdian City, Ganjingzi District, Lvshunkou District, Jinzhou District, and Zhuanghe City in Liaoning Province for the analysis of coastal erosion disaster vulnerability risk zoning in areas where future coastal erosion disasters may occur (i.e., areas with sandy coastlines).
2.6 Data sources
The authors select the period from 2016 to 2022 as the research period. The data on coastal erosion intensity mainly came from on-site monitoring of key coastal sections conducted by the research group over the years as part of studies on the mechanism of coastal erosion disasters and assessments of the impact of sea level changes. According to the Technical Specification for Coastal Erosion Monitoring and Disaster Losses Evaluation (GB/T 42435–2023), the degree of erosion in coastal erosion areas was analyzed based on on-site monitoring data, including coastline retreat rate, beach erosion rate, and average sediment particle size change rate. Data on economic losses from coastal erosion disasters were mainly sourced from on-site investigations of coastal erosion disasters conducted in Liaoning Province. The data included coastline erosion distance, retreat area of key beach sections in Liaoning Province, as well as the destruction of buildings, infrastructure, output goods, and the situation of coastal engineering that needed repair or reconstruction due to coastal erosion disasters. Economic losses from coastal erosion disasters in various coastal sections were assessed based on the Technical Specification for Coastal Erosion Monitoring and Disaster Losses Evaluation (GB/T 42435–2023). The economic losses from coastal erosion disasters in each research area were then calculated. Data on the area of the sea in each research area were obtained from the official website of the Liaoning Provincial People’s Government(https://www.ln.gov.cn/web/zfsj/index.shtml). Data on land area, GDP, urbanization level, agricultural output value, etc., were sourced from various government department websites, such as the website of Liaoning Provincial Bureau of Statistics(https://tjj.ln.gov.cn/tjj/tjsj/index.shtml), the China County Statistical Yearbook, and Liaoning Statistical Yearbook. For missing data, interpolation methods were used for completion.
3 Results and analysis
3.1 Loss prediction results
3.1.1 OGM(1,N) model prediction results
According to the modeling principles of OGM(1,N), the loss values for the entire province and areas (areas with historically relatively large losses such as Suizhong County, Wafangdian City, Lvshunkou District, Jinzhou District are selected) from 2016 to 2022 were fitted, and the relative errors of the fitting were calculated. The results are shown in Tables 3 and 4. The fitted values and error data over the years indicate that the model is applicable(The average error for both of the province and the regions is 4.65%, with the maximum error occurring in Wafangdian City at 5.75%).
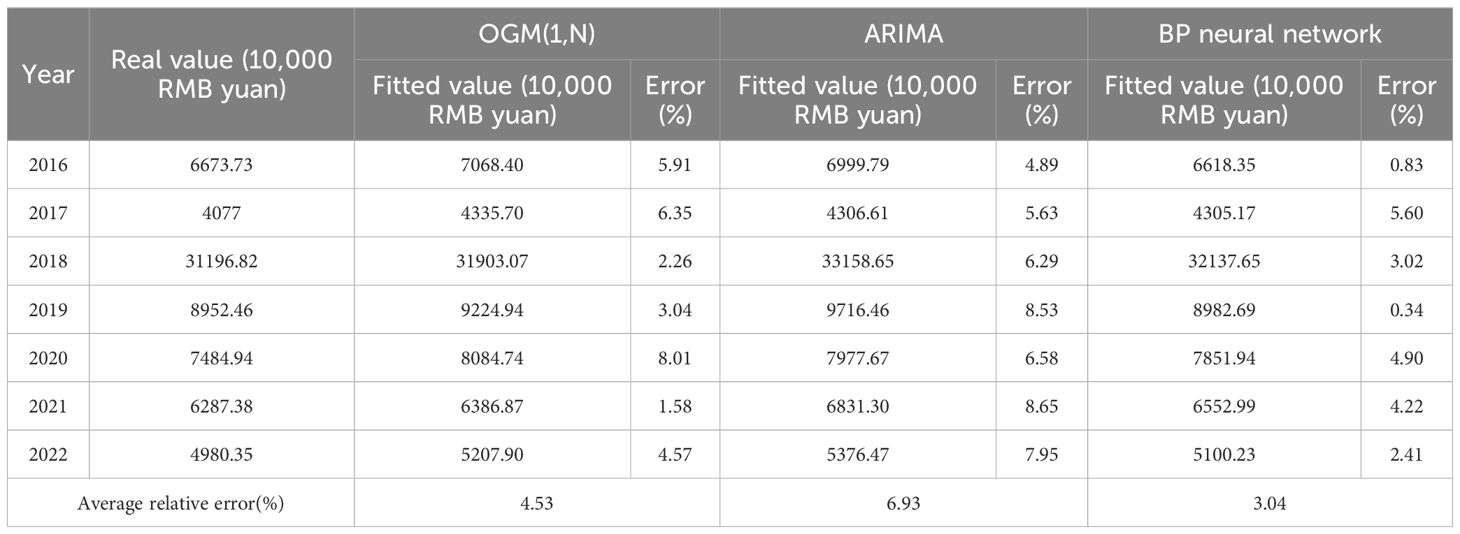
Table 3 Results of single model fitting.
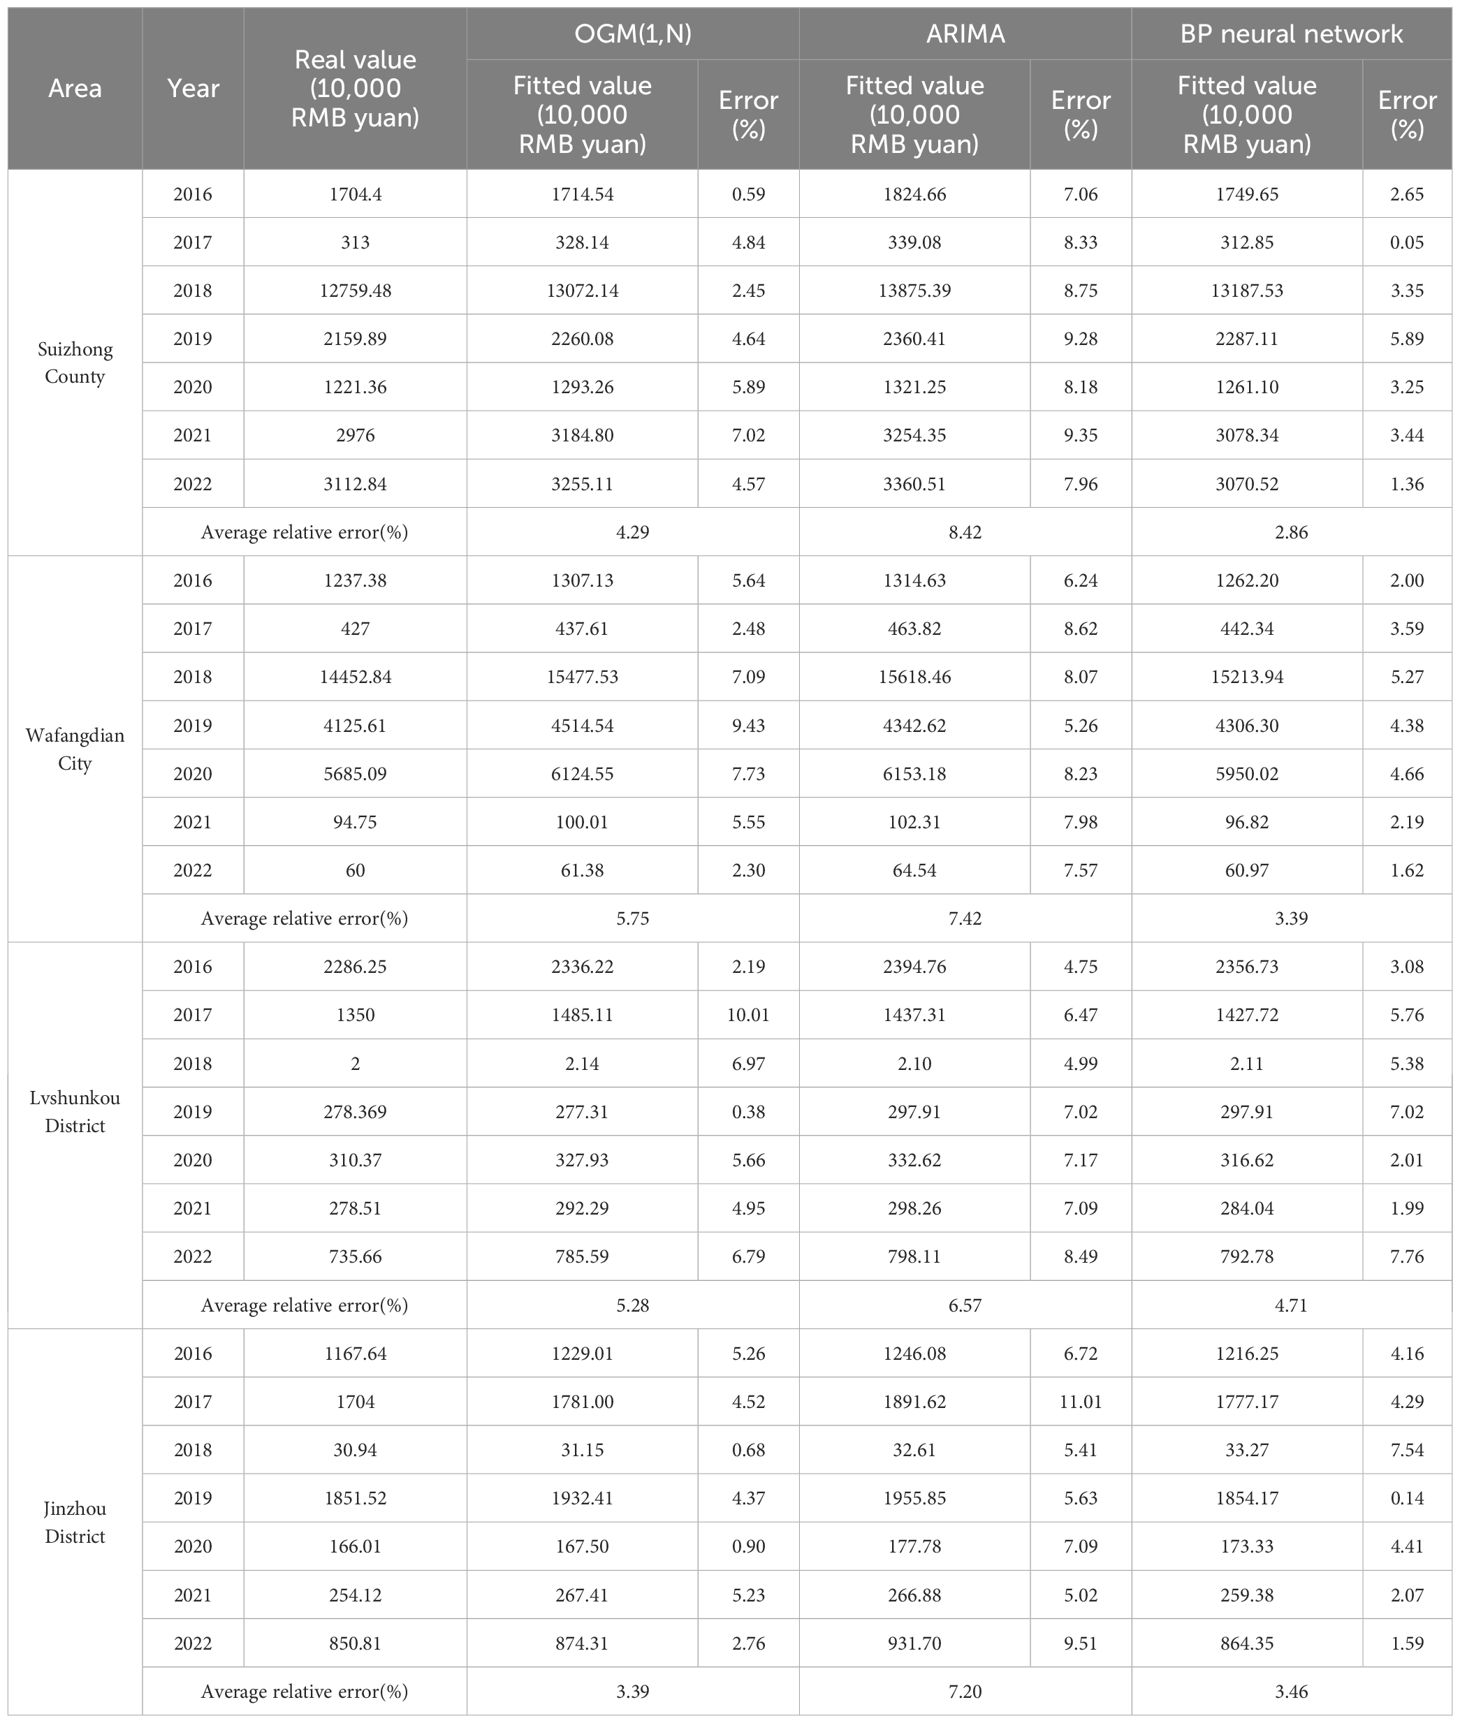
Table 4 Results of single model fitting by area.
Furthermore, the predicted loss values for the province for the years 2023 to 2025 were obtained, as shown in Table 5. The prediction results show a significant downward trend in losses, decreasing from a scale of 38 million RMB yuan in 2023 to 5 million RMB yuan in 2025.
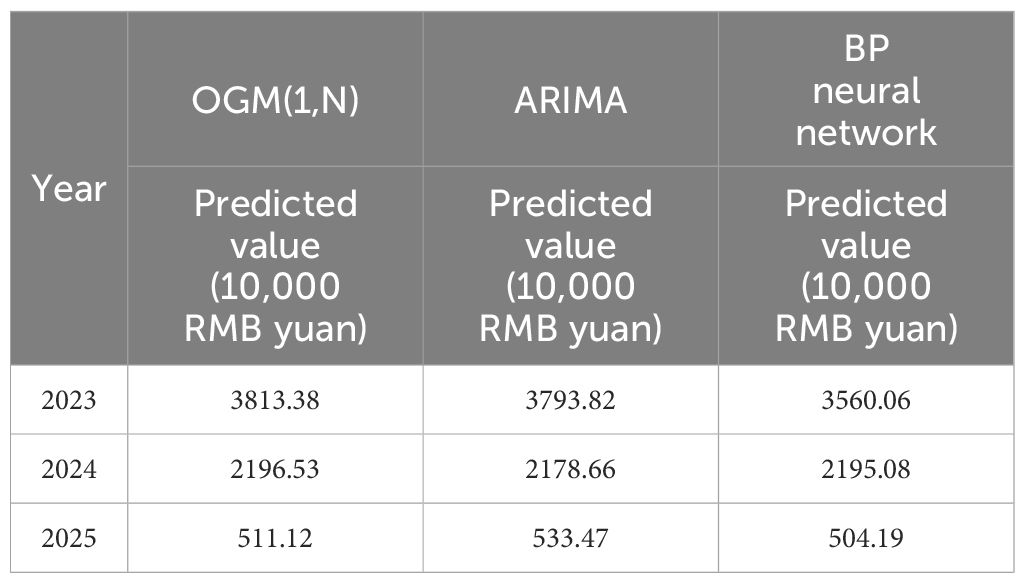
Table 5 Prediction results of single model.
3.1.2 ARIMA model prediction results
We fit the loss values from 2016 to 2022 for the entire province and areas (areas with historically relatively large losses such as Suizhong County, Wafangdian City, Lvshunkou District, Jinzhou District are selected) according to the modeling principles of ARIMA, and calculated the relative fitting errors. The results are shown in Tables 3 and 4. The fitted values and their error data over the years indicate that the model applicability is relatively good, but in both tables, the average relative error is the highest among the three single models(The average error for both of the province and the regions is as high as 7.32%, with the maximum error occurring in Suizhong County at 8.42%).
Furthermore, the predicted values of loss for the province from 2023 to 2025 are obtained, and the results are shown in Table 5. The prediction results indicate a significant decrease in losses from a scale of 38 million RMB yuan in 2023 to 5 million RMB yuan in 2025,same as the result of OGM (1, N) model.
3.1.3 BP neural network prediction results
Analysis is conducted through a three-layer BP neural network model with a Sigmoid transfer function. Since there are 5 factors influencing coastal erosion losses, and the prediction indicator is instantaneous, the input layer is set to 5 and the output layer to 1. The hidden layer is selected according to the relationship n=2m+1 (n is the number of neurons in the hidden layer, and m is the number of neurons in the input layer). However, considering the specific situation of the data, here the input layer is simplified to the independent variable, so the value is taken as 1, resulting in 3 layers. After repeated simulation training, the maximum training times are finally set to 1,000.
We fit the loss values from 2016 to 2022 for the entire province and areas (areas with historically relatively large losses such as Suizhong County, Wafangdian City, Lvshunkou District, Jinzhou District are selected) according to the modeling principles of BP neural network and calculated the relative fitting errors. The results are shown in Tables 3 and 4. The fitted values and their error data over the years indicate that the model applicability is the best, and overall, the average relative error is the lowest among the three single models in both tables(The average error for both of the province and the regions is only 3.5%, with the maximum error occurring in Lvshunkou District at 4.71%).
Furthermore, the predicted values of loss for the province from 2023 to 2025 are obtained, and the results are shown in Table 5. The prediction results also indicate a significant decrease in losses, which is from a scale of 35 million RMB yuan in 2023 to 5 million RMB yuan in 2025.
3.1.4 Combination model prediction results
The comparison of empirical results of OGM(1, N), ARIMA, and BP neural network models reveals that different models have certain differences in predicting coastal erosion disaster losses. The predicted values of some single models are greater than the actual values, while others are smaller. Different prediction methods have varying degrees of applicability, so it is necessary to utilize combination prediction to integrate the advantages of various methods. By comprehensively applying data from different information sources, we can effectively mitigate the disadvantages of single prediction models, thereby improving prediction accuracy.
The weights of each single prediction model for each year are calculated according to the formula of the variance reciprocal, and the weight calculation results are shown in Table 6.
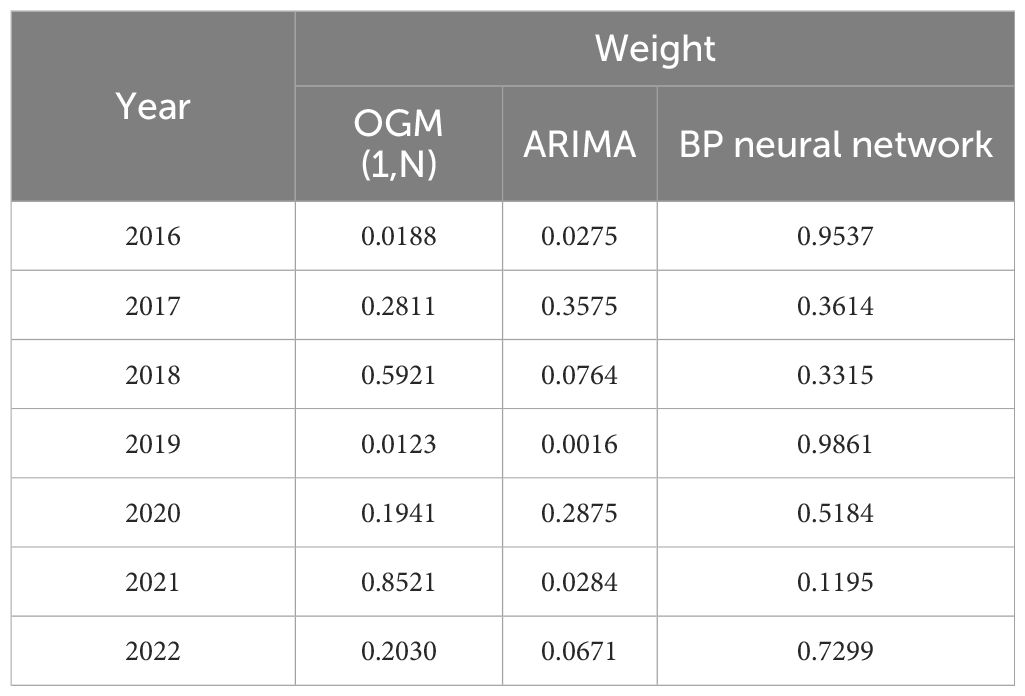
Table 6 Weights of each single model.
According to the formula of the combination prediction model, the results of the combination prediction model are obtained. We fit the loss values from 2016 to 2022, calculated the relative fitting errors, and obtained the predicted values of loss for the entire province from 2023 to 2025. The results are shown in Tables 7 and 8. The results show that from 2023 to 2025, the loss of coastal erosion disasters in Liaoning Province will be reduced from 36 million yuan to 5 million yuan, which is consistent with the conclusions of the aforementioned single prediction models. The possible reason is that since 2017, Liaoning has clearly set the goal of promoting the “Blue Bay” remediation action, such as returning reclaimed land to the sea and restoring beaches, focusing on the protection and restoration of typical marine ecosystems, to strengthen the protection of sandy shorelines. Based on ecological projects such as “Green Liaoning”, Yingkou, Dalian and other cities have successively carried out marine resource and environmental protection and restoration activities such as the protection and restoration of the coastal wetlands at the mouth of the Daliao River, and the enhancement of the ecological function of the Tuanshan National Protected Area, which have alleviated and reduced the degree of coastal erosion. The effectiveness of these engineering projects will be further demonstrated in the future. Therefore, the losses caused by coastal erosion disasters in Liaoning Province is showing a significant decrease in the future period.
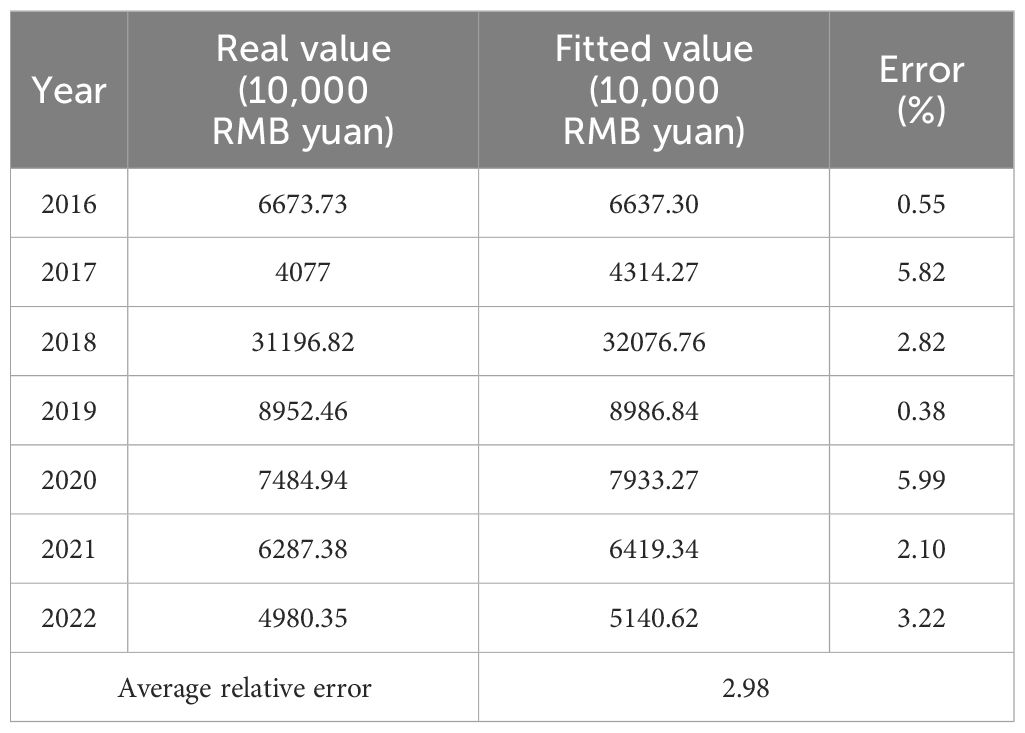
Table 7 Fitting results of the combination prediction model.
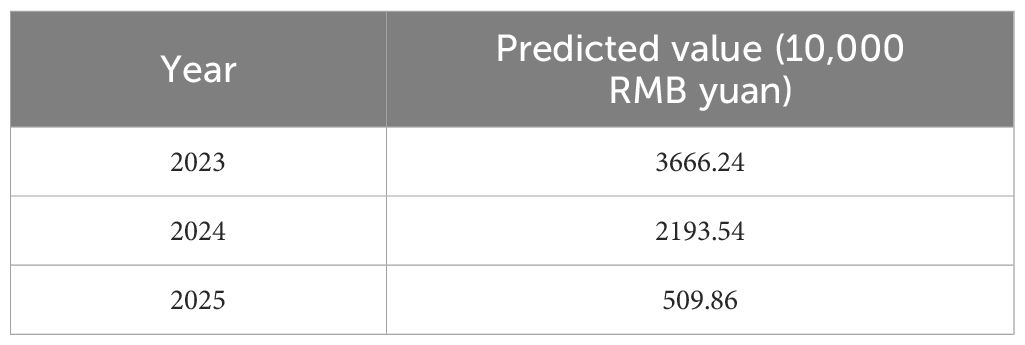
Table 8 Prediction results of the combination prediction model.
3.1.5 Comparison of model results
According to the results of the three single prediction models and the combination prediction model, it can be observed that the average fitting error of the combination prediction model established through the variance reciprocal method is only 2.98%, lower than the result of any single prediction model. This indicates that the combination prediction model can not only leverage the advantages of single prediction models but also improve prediction accuracy. Therefore, the variable-weighted multivariate combination prediction model constructed through the variance reciprocal method serves as an effective mathematical model for predicting losses from coastal erosion disasters.
3.2 Vulnerability risk zoning results
The dendrogram of cluster analysis for vulnerability risk zoning of coastal erosion disasters in Liaoning Province is shown in Figure 3. Based on the results of cluster analysis, Liaoning Province can be divided into four categories: Category I: Xingcheng City, Gaizhou City, Suizhong County; Category II: Bayuquan, Lvshunkou District; Category III: Wafangdian City, Zhuanghe City, Ganjingzi District; Category IV: Jinzhou District.
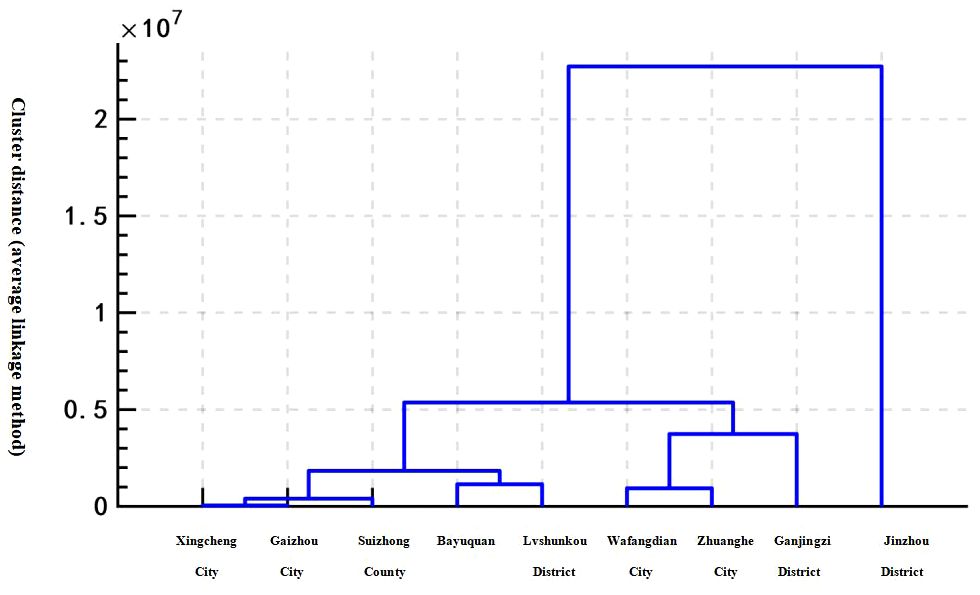
Figure 3 Cluster analysis results of vulnerability risk zoning for coastal erosion disasters in Liaoning Province.
To elucidate the disparities in vulnerability risk of coastal erosion disasters among these four categories, the entropy method and grey relational analysis are utilized to compute the comprehensive scores for each zoning unit. The scores obtained from the entropy method and grey relational analysis (shown in Table 9) reveal that the ranking of vulnerability risk of coastal erosion disasters in Liaoning Province generally aligns between the two methods. Based on the average scores calculated from the clustering analysis results (shown in Table 10), Liaoning’s coastal areas are segmented into four risk zones according to the magnitude of vulnerability risk from coastal erosion disasters: high-risk zones (Jinzhou District), moderately high-risk zones (Zhuanghe City, Wafangdian City, Ganjingzi District), medium-risk zones (Lvshunkou District, Bayuquan), and low-risk zones (Gaizhou City, Suizhong County, Xingcheng City)1.
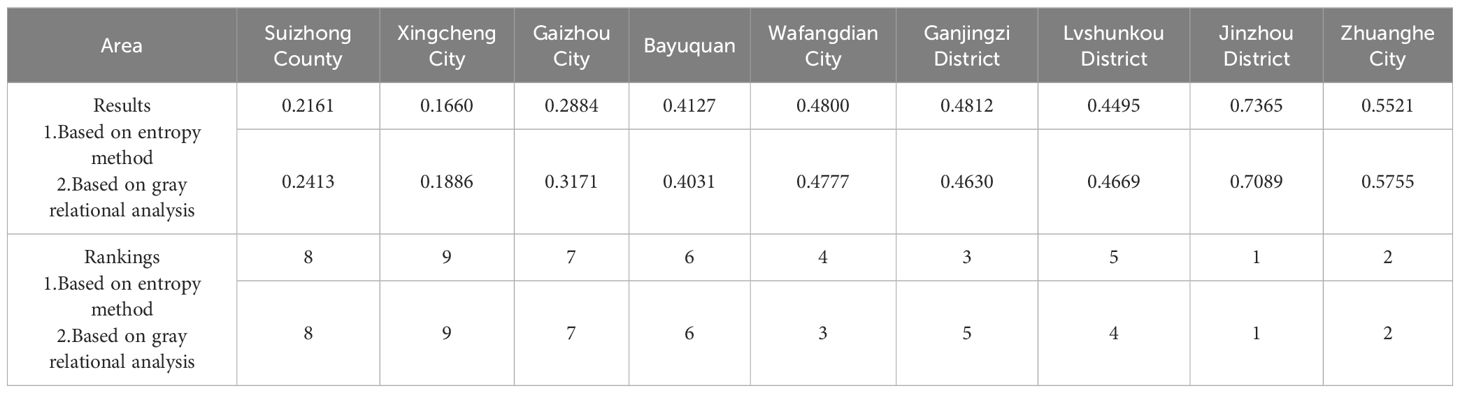
Table 9 Vulnerability risk assessment results of coastal erosion disasters in Liaoning based on two evaluation methods.
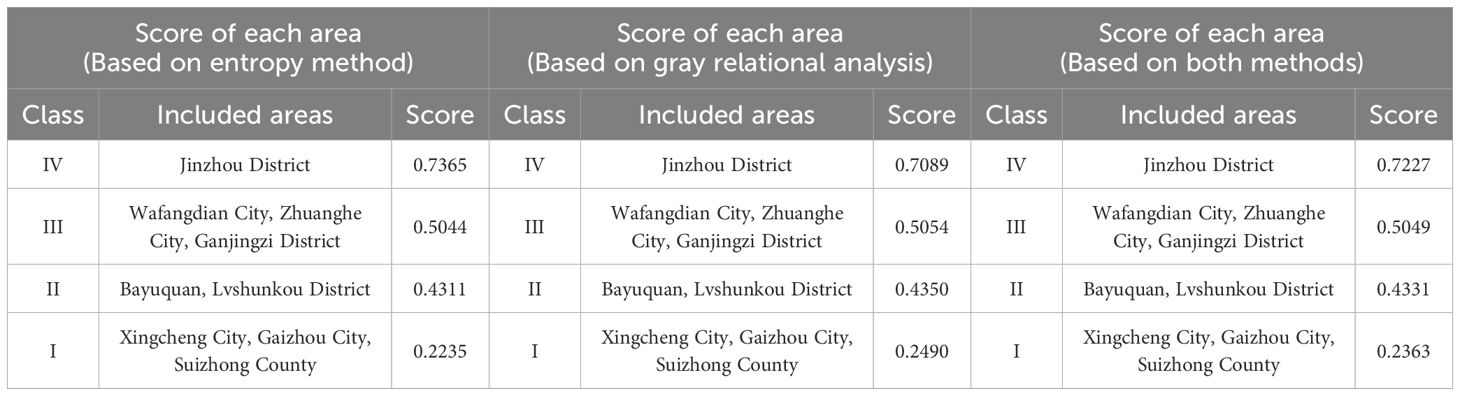
Table 10 Average scores of each area.
4 Conclusion and recommendations
The authors adopt the variance reciprocal method to construct a variable weighting function and establish a multivariate variable-weight combination prediction model based on OGM (1, N), ARIMA model, and BP neural network to compute the predicted values of coastal erosion losses in Liaoning Province from 2023 to 2025. Furthermore, utilizing cluster analysis, an analysis of regional coastal erosion vulnerability risk zoning was conducted. The findings are as follows: (1) Overall, the fitting error of the variable weighting multivariate combination prediction model proposed in this study is lower than that of single prediction models. This model not only capitalizes on the strengths of each model but also compensates for some of the shortcomings of the original models, thereby providing an effective mathematical model approach for predicting coastal erosion disaster losses. (2) From 2023 to 2025, the losses from coastal erosion disasters in Liaoning Province are projected to decrease significantly from a scale of 36 million RMB yuan to 5 million RMB yuan. (3) Based on the magnitude of disaster vulnerability risk, Liaoning’s coastal areas can be classified into four risk categories: high-risk zones (Jinzhou District), moderately high-risk zones (Zhuanghe City, Wafangdian City, Ganjingzi District), medium-risk zones (Lvshunkou District, Bayuquan), and low-risk zones (Gaizhou City, Suizhong County, Xingcheng City).
Based on the foregoing research conclusions, the following policy recommendations are proposed:
4.1 Effective measures should be implemented to mitigate the losses incurred by coastal erosion on land, buildings, infrastructure, agricultural output such as crops or trees, in order to decrease disaster losses. Additionally, efforts should be intensified to enhance the construction of a monitoring network for coastal erosion, enabling comprehensive observation and monitoring capabilities for critical coastal erosion factors. It is imperative to conduct thorough observation, early warning, comprehensive investigation, and assessment of coastal erosion, as well as to undertake coastal protection and restoration endeavors. Moreover, there is a need to harmonize coastal development with the coastal ecosystem, ensuring the maintenance of the health and stability of coastal ecosystems and providing essential support for the effective prevention of coastal erosion disasters.
4.2 Although Liaoning Province is experiencing a downward trend in losses from coastal erosion disasters, it is crucial to continue prioritizing disaster prevention and control efforts. Additionally, in the selection of disaster prevention and control measures, economic factors should be carefully considered in line with the specific circumstances of the losses. Specifically, the economic efficiency of disaster prevention and mitigation measures should be taken into account to ensure optimal outcomes.
4.3 Precise efforts should be made to implement coastal erosion disaster prevention and control measures in different regions. Based on the vulnerability risk zoning, particular attention should be given to high-risk zones (Jinzhou District) and moderately high-risk zones (Zhuanghe City, Wafangdian City, Ganjingzi District), through the establishment of a disaster early-warning system, formulation of practical and effective countermeasures, and increased allocation of funds for disaster prevention and control; a comprehensive management demonstration zone for coastal erosion disasters should be established, focusing on disaster management mechanisms, fundamental theoretical research, and disaster remediation. This initiative aims to develop a replicable and scalable disaster management system. Regarding the unregulated tourism development in Wafangdian City and other areas, which has led to coastline recession and building damage, it is recommended to consider the risks of coastal erosion comprehensively during the construction planning phase and to plan construction reasonably. For medium-risk zones (Lvshunkou District, Bayuquan) and low-risk zones (Gaizhou City, Suizhong County, Xingcheng City), stringent oversight on coastal development management is essential, and both the extent and methods of coastal development and utilization should be regulated. Restoration projects should be implemented in disaster-affected regions, accompanied by the establishment of protective facilities to mitigate disaster losses. And for the existing severe coastal erosion in Suizhong County and Bayuquan, primarily caused by illegal sand excavation in river channels and nearshore areas, it’s necessary to implement environmental damage compensation alongside strict law enforcement and supervision.
Data availability statement
The raw data supporting the conclusions of this article will be made available by the authors, without undue reservation.
Author contributions
CW: Conceptualization, Methodology, Writing – review & editing. YH: Conceptualization, Methodology, Writing – review & editing. GM: Writing – original draft. WW: Writing – original draft.
Funding
The author(s) declare financial support was received for the research, authorship, and/or publication of this article. Innovation Group Project of Southern Marine Science and Engineering Guangdong Laboratory (Zhuhai)(Grant No.SML2023SP221),Ocean Negative Carbon Emissions(ONCE)Program, National Social Science Foundation of China (Grant No.23BJY197),National Key Research and Development Program Project(Grant No.2018YFF0213300),National Environmental Protection Key Laboratory Fund for Coastal Marine Ecological Environment(Grant No.2022-z-015),Dalian Youth Science and Technology Star Project(Grant No.2021RQ084).
Conflict of interest
The authors declare that the research was conducted in the absence of any commercial or financial relationships that could be construed as a potential conflict of interest.
Publisher’s note
All claims expressed in this article are solely those of the authors and do not necessarily represent those of their affiliated organizations, or those of the publisher, the editors and the reviewers. Any product that may be evaluated in this article, or claim that may be made by its manufacturer, is not guaranteed or endorsed by the publisher.
Footnotes
- ^ The delineation of these zones does not imply that Jinzhou District, situated in the high-risk zone, experiences the most severe coastal erosion disaster losses. Rather, it indicates that when areas of various categories endure destruction of equal intensity, Jinzhou District incurs the greatest losses. This zoning outcome distinctly delineates the distribution pattern of vulnerability to coastal erosion disasters among different regions.
References
Badal M., Raju S., Sunil S. (2023). Preparing coastal erosion vulnerability index applying deep learning techniques in Odisha state of India. Int. J. Disaster Risk Reduction 10, 103986. doi: 10.1016/J.IJDRR.2023.103986
Bagyarajm, Senapathi V., Chung S. Y., Gopalakrishnan G., Xiao Y., Karthikeyan S., et al. (2023). A geospatial approach for assessing urban flood risk zones in Chennai, Tamil Nadu, India. Environ. Sci. pollut. Res. 30, 100562–100575. doi: 10.1007/s11356-023-29132-1
Barrie J. V., Conway K. W. (2002). Rapid sea-level change and coastal evolution on the Pacific margin of Canada. Sedimentary Geology 150, 171–183. doi: 10.1016/S0037-0738(01)00274-3
Box G. E., Pierce D. A. (1970). Distribution of residual autocorrelations in autoregressive-integrated moving average time series models. J. Am. Stat. Assoc. 65, 1509–11526. doi: 10.1080/01621459.1970.10481180
Bray M. J., Hooke J. M. (1997). Prediction of soft cliff retreat with accelerating sea level rise. J. Coast. Res. 13, 453–465.
Bruun P. (1962). Sea-level rise as a cause of shore erosion. J. Waterways Harbors Division 88 (1), 67–82. doi: 10.1061/JWHEAU.0000252
Bruun F. P. (1988). The Bruun rule of erosion by sea level rise: A discussion on large scale two and three-dimensional usages. J. Coast. Res. 4, 627–648.
Cai F., Su X. Z., Liu J. H., Li B., Lei G. (2009). Coastal erosion in China under the condition of global climate change and measures for its prevention. Prog. Natural Sci. 19, 415–426. doi: 10.1016/j.pnsc.2008.05.034
Chang J. I., Yoon S. (2016). The economic benefit of coastal erosion control in Korea. J. Coast. Research Special Issue 75, 1317–1321. doi: 10.2112/SI75-264.1
Chen X. (2007). Analysis of temporal and spatial changes of typhoon in Fujian Province. J. Catastrophology 22, 66–70.
Chen J. Y., Xia D. X., Yu Z. Y., et al. (2010). Coastal erosion in China (Beijing: China Ocean Press), 3–4.
Dean R. G., Cher R. J., Browder A. E. (1997). Full scale monitoring study of a submerged breakwater, Palm Beach, Florida, USA. Coast. Eng. 29, 291–315. doi: 10.1016/S0378-3839(96)00028-2
Feng C., Chao C., Qi H S., et al. (2022). Rapid migration of mainland China's coastal erosion vulnerability due to anthropogenic changes. J. Environ. Manage. 10, 115632. doi: 10.1016/j.jenvman.2022.115632
Graaff J. (1982). Dune erosion during a storm surge. Coast. Eng. 1, 99–134. doi: 10.1016/0378-3839(77)90010-2
Guo J. K. (2018). Research on the dynamic characteristics and mechanisms of the Rudong coast (Nanjing: Nanjing Normal University).
Hsu L. C. (2009). Forecasting the output of integrated circuit industry using genetic algorithm based multi-variable grey optimization models[J]. Expert Syst. Appl. 36, 7898–7903. doi: 10.1016/j.eswa.2008.11.004
Iwan L. B., Catherine M. F., Véronique C., Elisabeth G., Thibaud L., Nicolas L. D., et al. (2022). Systemic vulnerability of coastal territories to erosion and marine flooding: A conceptual and methodological approach applied to Brittany (France). Int. J. Disaster Risk Reduction 8, 103122. doi: 10.1016/j.ijdrr.2022.103122
Ji Z. X. (1996). The characteristics of coastal erosion and cause of erosion. J. Natural Disasters 5, 65–75. doi: 10.13577/j.jnd.1996.0208
Lee E. M. (2008). Coastal cliff behaviour: observations on the relationship between beach levels and recession rates. Geomorphology 101, 558–571. doi: 10.1016/j.geomorph.2008.02.010
Li Y. H. (2018). Research on the impact of three typical coastal engineering projects on adjacent beaches in China (Xiamen: Third Institute of Oceanography, State Oceanic Administration).
Li H. Y., Zhang H. Y., Wang X., et al. (2019). Influence on the sandy coast evolution of the ocean engineering - A case study of artificial Riyue island, Wanning city, Hainan Island. Mar. Environ. Sci. 38, 575–581. doi: 10.13634/j.cnki.mes.2019.04.014
Liang Y. T., Yang L. Q., Feng X. D. (2024). Flood disaster risk assessment in Liaocheng city based on combination weighting. J. Univ. Jinan (Science Technology) 5, 1–8. doi: 10.13349/j.cnki.jdxbn.20240518.001
Lu Y., He C. (2009). “Modeling and forecasting China’s GDP data with time series models,” in D-level essay in statistics (Department of Economics and Society, Hogskolan Dalarna, Sweden).
Lu J. G., Wei L. T., Wang S. G., Yu J., Zhou Q. (1993). Preliminary study of BP algorithm used in multi-level neural network. Comput. Sci. 1, 60–61.
Luo X. H., Yan X. Q., Chen Y. S., Yue M., Li J. W. (2020). The prediction of shale gas well production rate based on grey system theory dynamic model GM(1,N). J. Petroleum Explor. Production Technol. 10, 3601–3607. doi: 10.1007/s13202-020-00954-w
Ma X. L., Li Z. R., Zhou K. R. (1993). Back propagation neutral net and its application. J. Univ. Petroleum China 6, 126–130.
Marchand M. (2010). Concepts and science for coastal erosion management: concise report for policy makers Vol. 6 (Delft: Deltares).
McCarroll R.J., David M. K., Jin L., Allan B., Ierodiaconou D. (2024). Design and application of coastal erosion indicators using satellite and drone data for a regional monitoring program. Ocean Coast. Manage. 253, 107146. doi: 10.1016/j.ocecoaman.2024.107146
Mimura N., Kawaguchi E. (1996). Responses of coastal topography to sea-level rise. Proceedings of Coast. Structures. 83 Arlington, Virginia, USA.
Mimura N., Shimizu T., Horikawa K. (2010). Laboratory study on the influence of detached breakwater on coastal change. Coast. Structures.
Ministry of Oceans and Fisheries (2014). The second adjusted general plan for coastal improvement Vol. 52 (Sejong, Korea: Ministry of Oceans and Fisheries Publication).
Patel K., Jain R., Kalubarme M. H., Bhatt T. (2024). Coastal erosion monitoring using multi-temporal remote sensing and sea surface temperature data in coastal districts of Gujarat state, India. Geology Ecology Landscapes 8, 194–207. doi: 10.1080/24749508.2022.2127648
Paul S., Ghebreyesus D., Sharif H. (2019). Brief communication: Analysis of the fatalities and Socio-Economic impacts caused by hurricane florence. Geosciences 9, 58. doi: 10.3390/geosciences9020058
Pedro A. G., Leonardo S. C., Marcia M. (2023). Coastal erosion in temperate barriers: an anthropized sandy beach in Buenos Aires, Argentina. J. South Am. Earth Sci. 8, 104453. doi: 10.1016/j.jsames.2023.104453
Pethick J. (2001). Coastal management and sea level rise. Catena 42, 307–322. doi: 10.1016/S0341-8162(00)00143-0
Raudkivi A. J., Dette H. H. (2002). Reduction of sand demand for shore protection. Coast. Eng. 45, 239–259. doi: 10.1016/S0378-3839(02)00036-4
Sakashita T., Sato S., Tajima Y. (2011). Along shore extension of beach erosion around a large-scale structure. Proceedings of Coast. Sediments. Miami, Florida, USA.
Shi F., Cai F., Kirby J. T., Zheng J. X. (2013). Morphological modeling of a nourished bayside beach with a low tide terrace. Coast. Eng. 78, 23–34. doi: 10.1016/j.coastaleng.2013.03.005
Siluyele I., Jere S. (2016). Using Box-Jenkins models to forecast mobile cellular subscription. Open J. Stat 6, 303–309. doi: 10.4236/ojs.2016.62026
Tan C. M., Yu X. J. (2012). Impacts of sea level elevation on the coastal beach erosion and ecosystem of Guangdong. Guangzhou Environ. Sci. 27, 25–27.
Tubagus S., Karlina T., Rima R., Semeidi H., Adi P. F., Lesmana S. H., et al. (2024). The impact of coastal erosion on land cover changes in Muaragembong, Bekasi, Indonesia: a spatial approach to support coastal conservation. J. Coast. Conserv. 28, 169–186. doi: 10.1007/S11852-024-01045-2
Uda T. (2007). Beach erosion arising from artificial land modification. Disaster Rep. 2, 29–36. doi: 10.20965/jdr.2007.p0029
Uda T., Sannami T., Serizawa M. (2005). “Beach erosion in Japan as a structural problem,” in Proceedings of 14th Biennial Coastal Zone Conference, New Orleans, Louisiana, USA.
Walkden M., Dickson M. (2008). Equilibrium erosion of soft rock shores with a shallow or absent beach under increased sea level rise. Mar. Geology 251, 75–84. doi: 10.1016/j.margeo.2008.02.003
Wan S. D., Aminah I., Lee S. Y., Effi H. A., Cherdvong S., Khairul N. A. M., et al. (2024). The impact of climate change on coastal erosion in Southeast Asia and the compelling need to establish robust adaptation strategies. Heliyon 10, 256–276. doi: 10.1016/j.heliyon.2024.e25609
Wang L., Zhao J., Ai D., Chen G. P., Lin Y. L. (2024). Integrating risk zoning and multifactor analysis: A strategic approach to ecological carbon sink management. Ecol. Inf. 9, 102671. doi: 10.1016/j.ecoinf.2024.102671
Wen L., Yuan X. Y. (2020). Forecasting CO2 emissions in China’s commercial department, through BP neural network based on random forest and PSO. Sci. Total Environ. 718.
Wen C. Q., Zhu J., Cai F., Wang L. H., Qi H. S., Liu J. H., et al. (2021). Spatial and temporal distribution of wave energy on low energy coasts under the efefct of beach restoration project. Oceanologia Et Limnologia Sin. 51, 75–85.
Yang Y. X., Zhang J. B., Liu S. T. (2014). What we have learnt from the beach nourishment project in Qinhuangdao. Mar. Geology Front. 30, 1–15. doi: 10.16028/j.1009-2722.2014.03.004
Yüksek Y., Önsoy H., Birben A. R., Özölçer I. H. (1995). Coastal erosion in Eastern Black Sea Region, Turkey. Coast. Eng. 26, 225–239. doi: 10.1016/0378-3839(95)00022-4
Zaid A. H., Mohamed H., Issa E H., Rachid O., Maria A. B., Ahmed D., et al. (2022). Tsunami hazard and risk zoning for Qurayyat in northeast Oman coast: Worst-case credible scenarios along the Makran Subduction Zone. Western Asia J. Asian Earth Sciences,X 12, 100103. doi: 10.1016/J.JAESX.2022.100103
Zeng B., Luo C. M., Liu S. F., Bai Y., Li C. (2016). Development of an optimization method for the GM(1,N) model. Eng. Appl. Artif. Intell. 55, 353–362. doi: 10.1016/j.engappai.2016.08.007
Zhang P. (2018). Comparison of variable weighting and fixed weighting in combination prediction. Stat Decision 17.
Zhang K., Douglas B. C., Leatherman S. P. (2004). Global warming and coast erosion. Climate Change 64, 41–58. doi: 10.1023/B:CLIM.0000024690.32682.48
Zhu J., Cai F., Qi H. S., Lei G., Liu J. H., Zheng J. X., et al. (2021). Restoration method of flat composite beach on eroded coast (China: National Intellectual Property Administration). ZL201911023838.1.
Keywords: coastal erosion disaster, economic loss prediction, vulnerability risk zoning, Liaoning province, case study
Citation: Wang C, He Y, Ma G and Wang W (2024) Research on the economic loss prediction and vulnerability risk zoning of coastal erosion disaster: a case study from Liaoning, China. Front. Mar. Sci. 11:1431302. doi: 10.3389/fmars.2024.1431302
Received: 11 May 2024; Accepted: 02 July 2024;
Published: 22 July 2024.
Edited by:
Xuemei Li, Ocean University of China, ChinaReviewed by:
Peng Jiang, Shandong University, ChinaPing Li, Ministry of Natural Resources, China
Giandomenico Foti, Mediterranea University of Reggio Calabria, Italy
Copyright © 2024 Wang, He, Ma and Wang. This is an open-access article distributed under the terms of the Creative Commons Attribution License (CC BY). The use, distribution or reproduction in other forums is permitted, provided the original author(s) and the copyright owner(s) are credited and that the original publication in this journal is cited, in accordance with accepted academic practice. No use, distribution or reproduction is permitted which does not comply with these terms.
*Correspondence: Yixiong He, aGV5aXhpb25nbWFpbEAxNjMuY29t