 Danja P. Hoehn
 Alexandra R. McGoran
 Jon Barry
 E. E. Manuel Nicolaus
 Adil Bakir
- Centre for Environment, Fisheries and Aquaculture Science (Cefas), Lowestoft, United Kingdom
Microplastic pollution in the marine environment is of concern, with evidence of harmful effects on marine biota and ecosystems. There is still a knowledge gap of the mass of plastics supplied to the ocean and plastics observed in the ocean, indicating a missing sink. Therefore, baseline and monitoring data are needed to inform policy and regulatory measures. The goal of this study was to collect harmonised data of microplastics from the surface of the ocean using the Neuston Microplastic Catamaran. This study shows that the surface water of the coastal ocean in the North Sea holds/sustains high concentrations of microplastic, which exceed previously recorded measurements from the North-East Atlantic and Scottish Waters, indicating that the total stock of plastics might be much higher than previously determined. Microplastics were detected in all samples with concentrations ranging from 857 to 25,462 items km−2. The majority of microplastics analysed were fragments of polyethylene, polypropylene, and polystyrene in the size range of 1,000–5,000 µm. Mesoplastics (>5,000 µm) mainly in the form of filaments were found with concentrations ranging from 0 to 2,139 items km−2, and macroplastics (>5,000 µm) in the form of fragments and filaments were also found with concentrations ranging from 0 to 1,078 items km−2. These fragments and filaments likely originate from the break-up of common macrolitter items in the environment, such as plastic bags, bottles, and fishing gears, which are commonly comprised of similar polymers to those found in the present study. Our findings demonstrate that litters of all size classes are abundant in surface water, highlighting that it is a key compartment for the transport of marine litter and should be monitored to better our understanding of the fate and danger of plastic contamination in our ocean.
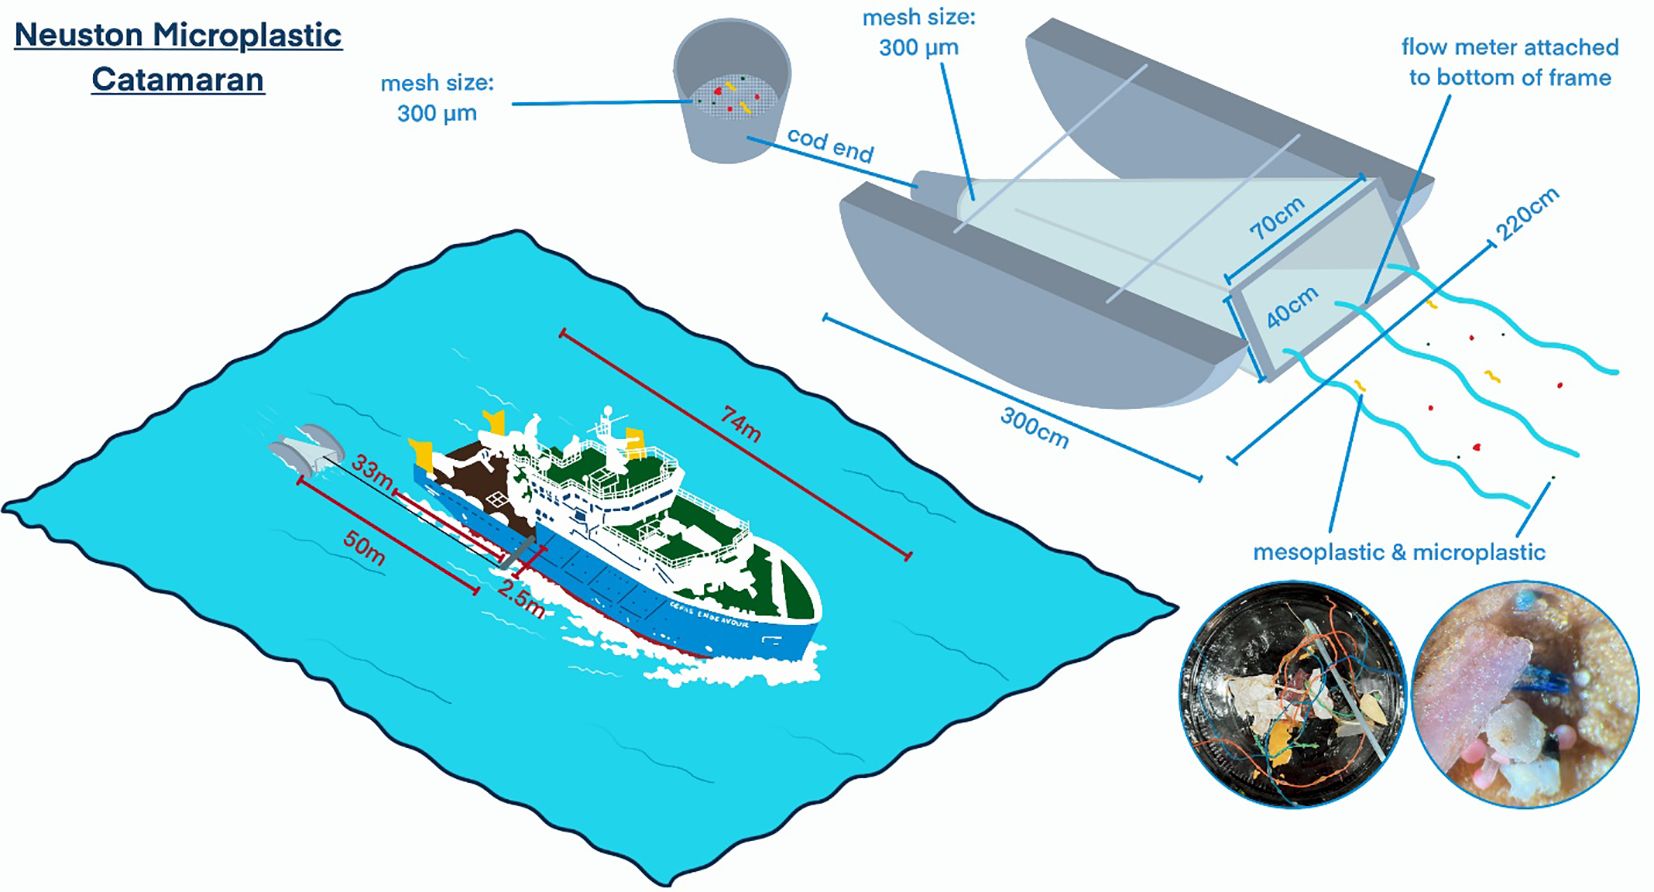
Graphical Abstract.
1 Introduction
Microplastic pollution has been recognised as an increasing global environmental concern and can be harmful to marine life (Chapron et al., 2018; Guggisberg and Guggisber, 2024). With an ever-increasing demand, plastic production exceeded 400 million tonnes in 2022 (Plastics Europe, 2023). The majority of production is driven by the need for packaging (39% of production in 2022; Plastics Europe, 2023), leading to high polypropylene and polyethylene production. While many countries have well-developed waste management, facilities, and strive for more circular economies, much of the plastic produced eventually leaks into the environment. A large proportion of plastic litter found in the marine environment comes from land-based sources (Andrady, 2011; Guggisberg and Guggisber, 2024) with rivers as the main transport pathways. It has been estimated that between 4.8 and 12.7 million tonnes of macroplastics flow into the oceans annually mainly through rivers (Jambeck et al., 2015; Lebreton et al., 2017). It is also important to consider sea-based sources of marine litter, representing an important route for the entry of plastic debris into the marine environment. Sea-based sources are quite varied and include fishing, aquaculture, shipping and boating, illegal dumping, and marine infrastructures (GESAMP, 2021). Marine plastic waste is varied in terms of size and shape ranging from macro (>2.5 cm), meso (>5 mm and ≤2.5 cm), micro (≤5 mm), and nano (either 1,000 nm or 100 nm according to adopted definition) from either primary or secondary sources (i.e., resulting from the degradation of larger debris). Regardless of their size, marine litter can negatively impact marine species, ecosystems (Ford et al., 2022; Lincoln et al., 2023) with the disruption of vital economic sectors such as tourism, fisheries, and aquaculture leading to accrued poverty for individuals and communities (Werner et al., 2016).
Microplastic pollution is a fast-emerging issue, and there is a lack of globally accepted protocols for the detection and analysis of microplastics, which makes comparisons between datasets difficult. In recognition of these concerns, since the EU Marine Strategy Framework Directive (MSFD) first included microplastics in a legislative proposal, there have been an increasing number of initiatives at national and international levels to tackle microplastics as part of wider plastic pollution challenge. For the UK, the Marine Strategy (DEFRA, 2019) sets out the ambition to develop a microplastics indicator in marine sediment and highlights the challenge to determine whether Good Environmental Status (GES) has been achieved because of the lack of knowledge on microplastics. The North-East Atlantic Environmental Strategy (North-East Atlantic Environment Strategy 2030, n.d.) includes a marine litter strategic objective to “prevent inputs of and significantly reduce marine litter, including microplastics, in the marine environment to reach levels that do not cause adverse impacts to the marine and coastal environment with the ultimate aim of eliminating inputs of litter” and regular monitoring and assessment, including the development of new common indicators on microplastics, and the development of a new Regional Action Plan for marine litter (2022) will play a role in supporting the measures and also evaluating their effectiveness. Under the UN Sustainable Development Goals (SDGs), the proposal for indicator 14.1.1b under national level includes floating plastic debris concentrations, highlighting the significance of this study (United Nations Environment Programme, 2021). Most recently, in March 2022 at the UN Environment Assembly (UNEA-5.2), a historic resolution was adopted to develop an international legally binding instrument on plastic pollution, which includes microplastics and aims to end plastic pollution by 2040. This instrument will address microplastics, including those specifically added to products, and assessment and monitoring will be required to measure its progress at a global scale.
Now more than ever, monitoring datasets and assessments of microplastics are needed to evaluate marine litter, advise policy, and inform on progress to achieving GES. However, coordinated microlitter monitoring programmes are still missing in the UK, and at OSPAR level, indicator development has mainly focussed on microplastics in sediment. Different sampling methods have hampered dataset collections, and datasets for floating microplastics have yet to be collected. Floating microplastic concentrations might be the highest compared to biota and sediment due to items entering first the ocean surface from land or ship-based sources before they get distributed or sink to the seabed.
The absence of a globally accepted protocol for the sampling and analysis of any compartment, including floating microplastics, makes comparisons between datasets difficult. While the collection of surface microlitter is usually carried out using Neuston nets in the mesh size range of 300–350 µm, other sampling gears have also been applied including underway pumping systems (Desforges et al., 2014; Lenz and Labrenz, 2018; Kye et al., 2023), Niskin bottles (Whitaker et al., 2019), and microplastic pumps (Preston-Whyte et al., 2021). In the case of plankton nets, mesh size will also have a direct impact on the quantity of collected items with net with lower mesh sizes collecting substantially higher amounts of microlitter (Lindeque et al., 2020).
In this study, we aimed to answer the research question: has the microplastic concentration of surface waters increased/changed over time in the Southern Bight of the North Sea? An in-depth understanding of the abundance of macro-, meso-, and microplastics and an understanding of the morphology (i.e., fragments, filaments, microbeads, pellets, etc.) and the polymer type is required to identify likely sources and to investigate impacts. As such, the main aim of this study was to provide a preliminary assessment of floating marine litter (macro-, meso-, and microplastics) in the North Sea and to identify potential accumulation sites (i.e., “hotspots”) to inform and guide targeted remediation of policy actions to reduce sources of marine litter for the area. Furthermore, the aim was to apply a harmonised approach for the collection and quantification of floating litter with Marine Scotland (Russell and Webster, 2021) and to make it suitable for wider-scale UK monitoring programmes.
The main objectives were to i) apply a harmonised approach for the collection and quantification of floating microlitter in the North Sea, ii) identify the main plastic and polymer type present in surface water samples, and iii) compare our data with two other reported comparable data in the literature.
2 Materials and method
2.1 Sample collection
Sea surface microplastics were collected in November 2022 from 11 sites in the North Sea (Figure 1) using the Centre for Environment, Fisheries and Aquaculture Science’ (Cefas) research vessel RV Cefas Endeavour.
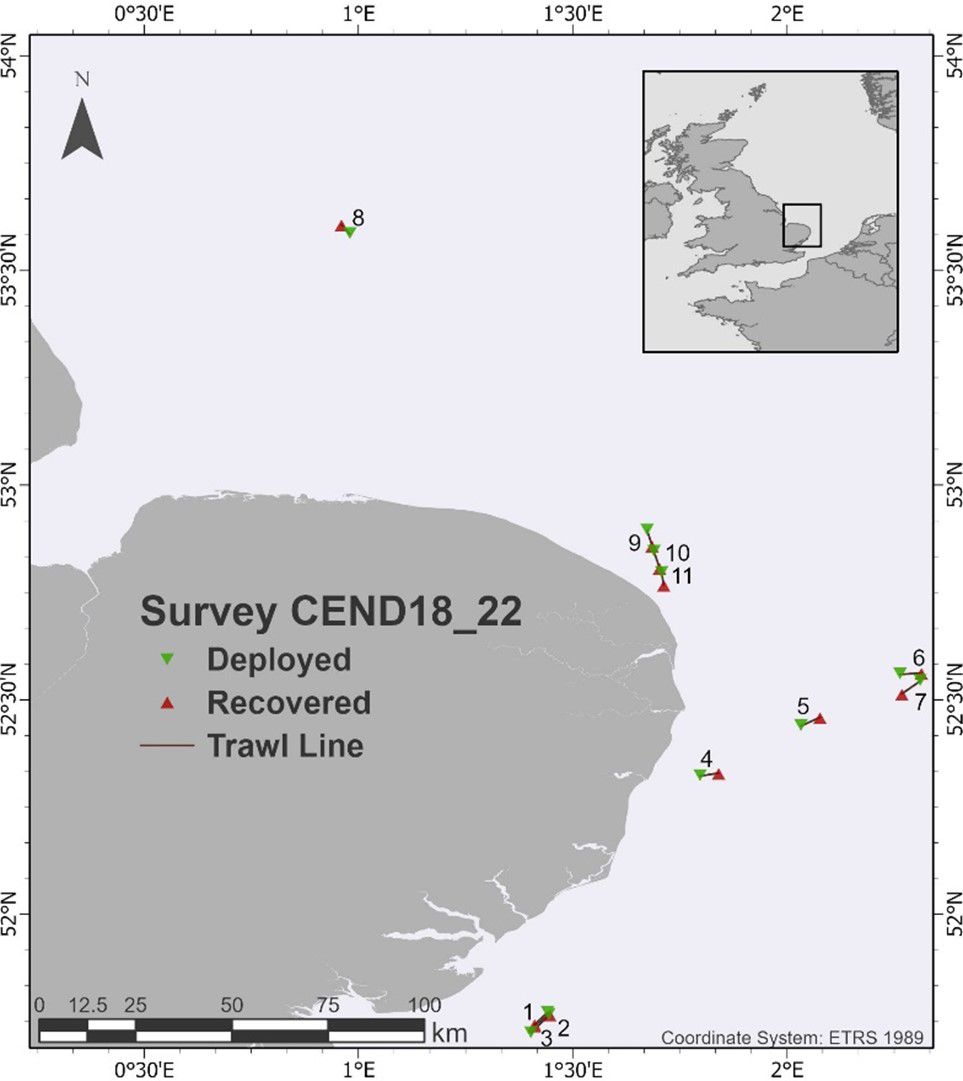
Figure 1. Location of the sampling sites (tows 1–11) off the East coast of England, UK during SmartBuoy (CEND18_22) survey using the Neuston microplastic catamaran.
A Neuston catamaran (Hydro-Bios; net mesh size, 300 µm) with a mechanical flowmeter (General Oceanics, 2030 and 2031 series) attached was used for the collection of floating microplastics, as it can even operate in high wave conditions compare to a manta trawl that operates best in calm conditions (Löder and Gerdts, 2015). The net opening was observed to skim the top 20 cm of the surface continuously. The catamaran was towed on a 50–75-m wire, 33 m behind the boat (starboard side) to avoid contamination of oil and marine litter and waves from the boat (Alfaro-Núñez et al., 2021) (Figure 2). The catamaran was towed clear of the ship’s wake 33 m behind the vessel. The mean speed of the ship while towing was four knots, with a towing time of 30 min. Wave height and swell were constantly observed to ensure that the catamaran was stable on the water surface (Figure 2). After each trawl, the net was rinsed from the outside with clean (no oil or litter) seawater to collect all sample in the cod end. The cod end was removed, and the sample was transferred into a large pre-rinsed glass bowl. The cod end was inverted and washed out from the outside using a small amount (<200 ml) of ultrapure water (UPW). Items left over in the net were gently removed using metal forceps and rinsed into the bowl. Samples were put into a glass container and stored frozen until further analysis.
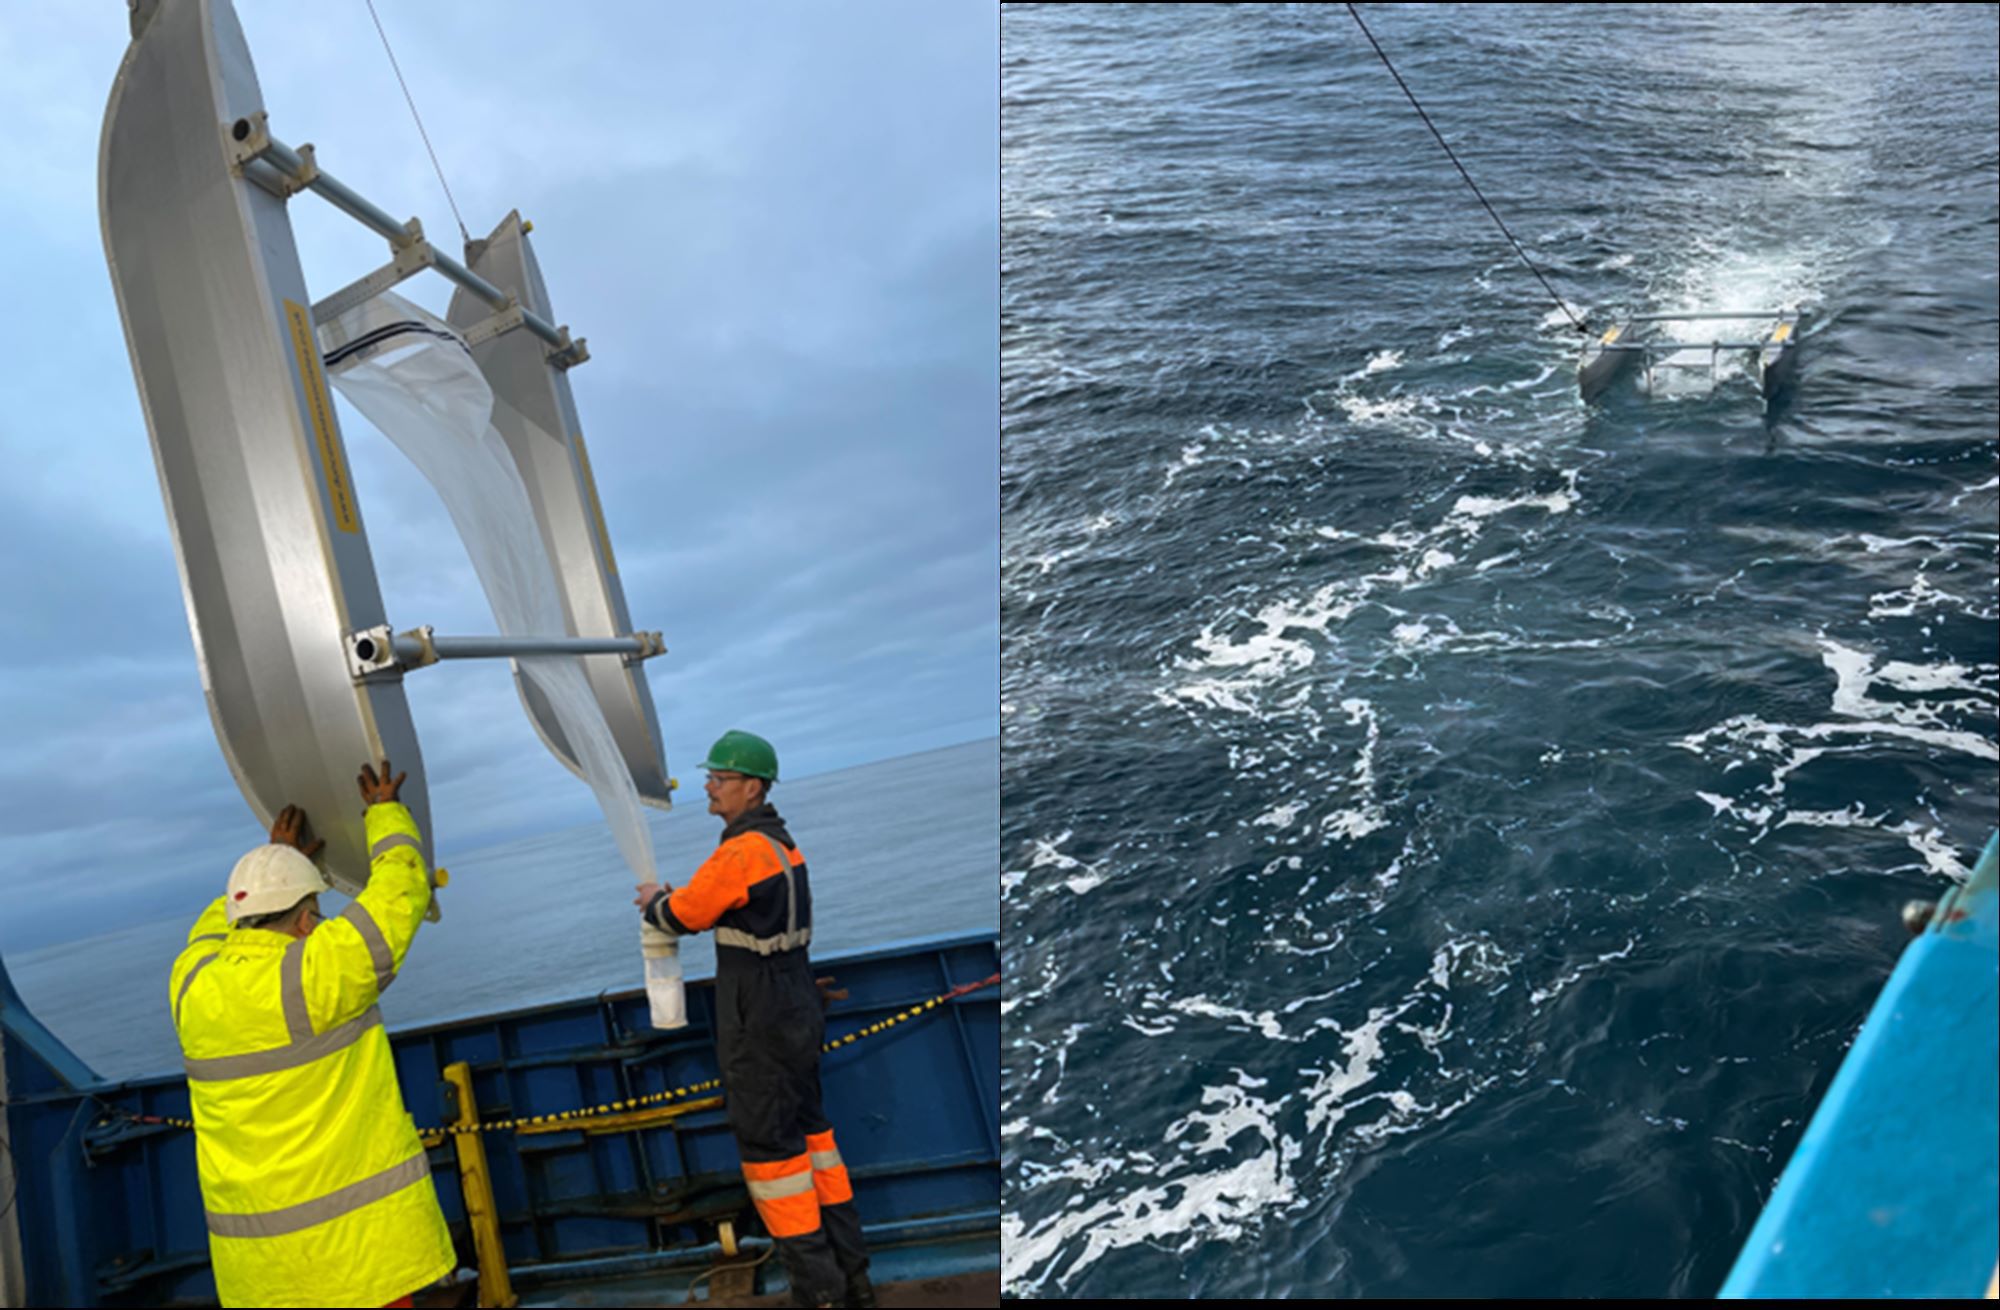
Figure 2. Microplastic catamaran, hulls with Neuston sampling net and cod end. Left: during deployment. Right: during towing.
2.2 Contamination control procedures during sample collection
Standard Operating Procedures (SOPs) for the collection of water samples were developed to ensure reproducibility of sampling. Dedicated field technicians were trained using the developed SOPs to minimise field contamination during sampling. Empty, pre-rinsed reverse osmosis (RO) glass jars were also used as field blanks and were open for the time required to transfer a water sample to the clean, pre-rinsed RO glass collecting jars. Prior to use, all glassware was cleaned using a laboratory detergent and rinsed using RO water. Care was taken during the field sampling to minimise sample contamination by opening jars only for the minimum amount of time during sample transfer.
2.3 Sample processing
2.3.1 Contamination control procedures in the laboratory
The following steps were followed to minimise contamination during sample processing and analysis. All work was carried out in a dedicated microplastics laboratory at Cefas with restricted access to minimise dust contamination. Additionally, a sticky mat was placed at the entrance to the lab to remove dust from shoes prior to entry. The lab floor and benches were cleaned daily before work commenced. All glassware were precleaned using RO water while keeping the glassware upside down to minimise dust deposition and subsequently covered with RO-rinsed foil. All chemicals were previously filtered onto a Whatman 47 mm ø 0.2 µm regenerated cellulose filter (VWR, UK). All work was also carried out in a biological safety cabinet. Negative controls (i.e., blank samples) were also processed alongside the environmental samples to quantify and characterise the extent of background contamination during analysis. Field blanks were collected during sample collection to record atmospheric fallout at each station. A clean sample jar was opened for the time taken to transfer the contents of the net to a sample jar. Negative controls were representative of the whole laboratory protocol followed for microlitter analysis (i.e., from chemical digestion to filtration, etc.).
2.3.2 Marine litter extraction
Water samples were visually inspected, and larger-sized items including macro- (>2.5 cm) and mesoplastics (>5 mm to ≤2.5 cm) were removed from the sample for imaging and for attenuated total reflectance Fourier transform infrared spectroscopic (ATR-FTIR) analysis (see Section 2.5). Samples were then sorted into two categories: low organic matter (i.e., clear samples) and high organic matter (i.e., darker, organic matter rich samples) for digestion of organic materials in the sample. Samples with a lower organic matter content were transferred into a 2-L glass beaker, and 400 mL of a 30% KOH: NaCIO v:v solution (Table 1) was added (Enders et al., 2015; Strand and Tairova, 2016). The chemicals used in this study are listed in Table 1.
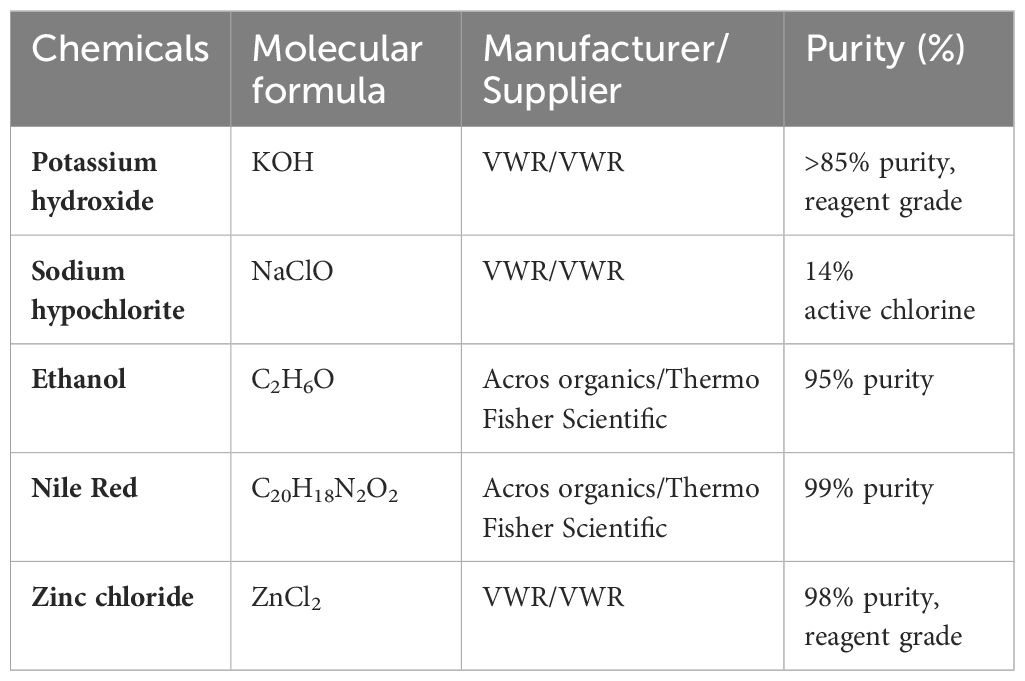
Table 1. List of chemicals, manufacturers, and suppliers.
Samples were then incubated for 24 hat 40°C on a heating plate with a magnetic stirrer. Samples were left to settle for 1 h before filtration onto GF/D (Whatman 47 mm ø, 2.7 µm porosity) filters. Due to the large amounts of particles onto filters in some cases, some samples were split across several filters. Filters were stained with Nile red (0.01 mg mL−1 in ethanol, see Table 1) prior to imaging and identification using either ATR-FTIR for particles above ~500 µm or micro-FTIR for particles below 500 µm in size.
Samples with high organic content needed an additional 400 mL 30% KOH: NaCIO v:v solution (Table 1) and often required a prolonged incubation time of 48 h. Otherwise, the same procedure was followed as for low organic content. When pouring the content into the filtering rig, care was taken not to pour the organic matter collected at the bottom of the beaker. To ensure that no microplastics were missed in this fraction, it was dried at 50°C, and then, 500 mL of ZnCl2 (1.5 g cm−3) (Table 1) was added to each beaker for a density separation. A magnetic stirrer hotplate (600 rpm, 1 h) was used to suspend the material in the solution. Samples were left to settle overnight. Following this, the supernatant was filtered onto GF/D filters.
2.4 Identification of microplastics using micro-FTIR and ATR-FTIR
Filters were visually assessed and quantified with blue and white light under a binocular microscope (MZ10F, Leica) with blue light attachment (FluoIII, CoolLED) and USB camera (GXCAM-U3PRO-20). Particles were imaged and measured using GX Capture-T (version x64, 4.10.16968.20200415).
Suspected microplastics were identified, and polymer identification was carried out following Bakir et al. (2023). Particles over 500 µm in size were analysed using ATR-FTIR with a Thermo Fisher Scientific Nicolet iS5 FTIR with iD7 ATR attachment and OMNIC software (version 9.9.473). Prior to sample analysis, quality control was carried out with the analysis of polystyrene (PS) and polyethylene (PE) reference material. A background was collected for every 10 samples analysed. Spectra (32 scans) were collected in transmission mode in the range of 4,000–500 cm−1 at a resolution of 4 cm−1. Polymer identification was verified based on the percentage match against provided polymer libraries (HR Nicolet Sampler Library, HR Spectra IR Demo and Hummel Polymer Sample Library). Only matches above 60% were selected for positive microplastics validation and polymer identification (Leistenschneider et al., 2021).
Particles below 500 µm in size were analysed using a LUMOS II (Bruker, UK) using micro-ATR-FTIR; a liquid-nitrogen-cooled mercury cadmium telluride detector was used to identify polymer type for particles of interest. Particles were manually transferred to 25-mm Anodisc filters (0.2 µm porosity, Whatman, VWR, UK). Before attempting to analyse samples, reference polyamide (PA) and PS were analysed as a quality control measure. Spectra (32 scans) were collected in absorbance mode in the range of 4000–500 cm−1 at a resolution of 4 cm−1. Polymer identification was verified based on the percentage match against provided polymer libraries (ATR-FTIR-Library complete, Vol. 1–4; Bruker Optics ATR-Polymer Library; IR-Spectra of Polymers, Diamond-ATR, IR-Spectra of Polymers, Geranium-AT & IR-Spectra of Additives, Diamond-ATR). Only matches above 60% were selected for positive microplastics validation and polymer identification (Leistenschneider et al., 2021).
2.5 Reporting
Units for the reporting of surface water floating plastics vary according to the method applied and between studies (Lusher et al., 2014; Maes et al., 2017b; Russell and Webster, 2021). Therefore, there is a need for the use of a range of reporting units to allow for comparison with the wider available literature. Floating plastic items in the present study were reported per unit area (km−2) and per volume sampled (m−3) (see Figure 3).
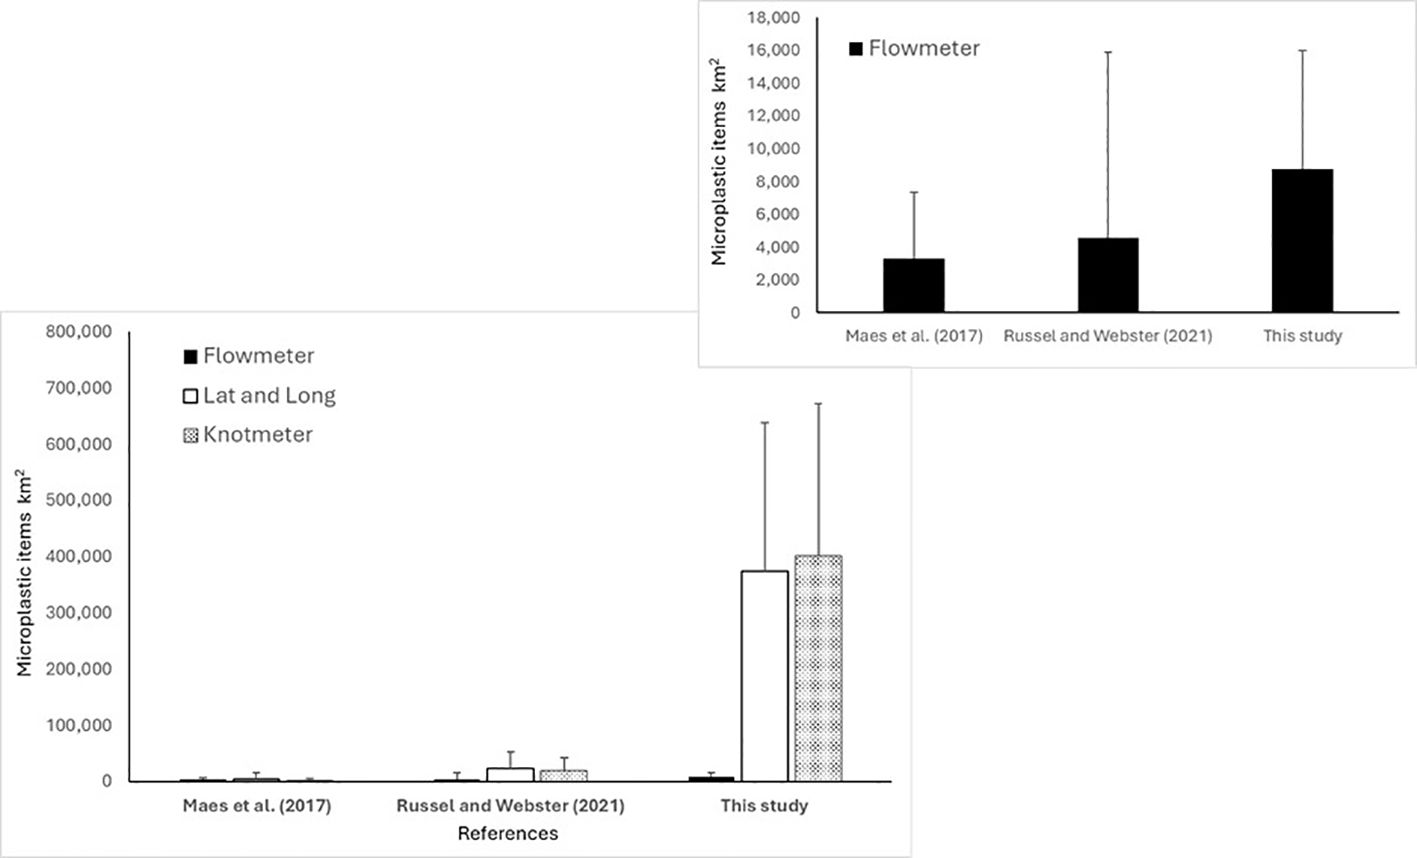
Figure 3. Comparison of microplastics per km2 ± SD of three regional studies calculated in three different ways. Flowmeter calculated using distance based on rotations. Latitude and longitude calculated distance based on coordinates. Knot metre calculated using distance based on onboard measuring speed. Inside: comparison of microplastics per km2 ± SD of three regional studies calculated using flowmeter.
Differences in calculation to estimate an abundance of floating plastic items were also observed between studies. In the present study, the coordinates of start and stop position and an on-board knot metre were used to measure the length of the trawl and a flowmeter attached to the bottom of the trawl mouth was used to estimate the volume of water sampled. This resulted in three different estimated microlitter abundances. First, using the distance between start and stop coordinates and multiplying this by the mouth width, the sample area was calculated. This calculation was repeated, replacing the distance between coordinates with the trawl distance calculated by the knot metre (Equation 1).
Lastly, following Russell and Webster (2021), the volume sampled was estimated. It was calculated that one revolution of the flowmeter equated to a tow distance of 0.3 m. The trawl distance was calculated by multiplying the number of revolutions by 0.3. The net mouth was 0.7 m × 0.4 m; however, the net was attached to the catamaran such that approximately half the net depth (0.2 m) was sampling the water, giving a sampling area of 0.14 m2 (i.e., 0.7 m × 0.2 m; Equation 2).
The reporting of microlitter in surface waters was done according to the recent Guidance on Monitoring of Marine Litter in European Seas (Guidance on Monitoring of Marine Litter in European Seas, 2023). Microlitter was reported according to EMODnet microlitter size classes (https://vocab.nerc.ac.uk/collection/H03/current/), microlitter types, and polymer types for data reporting.
2.6 Statistical analysis
The station locations were clustered into four groups (stations 1–8 and 9–11) representing regions of the North Sea (Figure 1). Grouping was used to investigate whether there was evidence of differences between the regions for characteristics of microplastics, mesoplastics, and macroplastics. The examined characteristics for all three types of plastics were station densities, proportion of PE, and proportion of fragments. For concentrations, a non-parametric Kruskal–Wallis analysis of variance was used. For the PE and fragment proportions, a one-way analysis of variance but with an arcsin transformation of the square roots of the proportions was used. For macroplastics, the analysis of fragment proportion was omitted because only one fragment was found.
3 Results
3.1 Contamination control procedures
The number of items in the field blanks ranged from 7 to 10 items with a mean value of 9 ± 1.73 (mean ± SD, n=3). A large proportion of items in field blanks were cellulosic based (i.e., cotton). An average of two rayon items was also detected in the field blanks, and environmental samples were blank corrected accordingly.
3.2 Monitoring of floating micro-, meso-, and macroplastics in surface waters
Macro- (>25 mm), meso- (5–25 mm), and microplastics (≤5 mm) were found at all samples under investigation (n=11) with a total of 2,526 litter items collected across all size categories. The abundance of floating plastic items increased with a decrease in size with 60 macro-, 125 meso-, and 2,341 microplastics (Supplementary Table S1).
3.2.1 Microplastics
The concentration of microplastics per square kilometre of sea surface varied from 756 to 25,462 items km−2 calculated using the flowmeter (Figure 3; Supplementary Table S1). The highest microplastic abundance was found at station 5 (25,462 items km−2), followed by station 6 (20,921 items km−2) just off the coast of East Anglia (Figure 4).
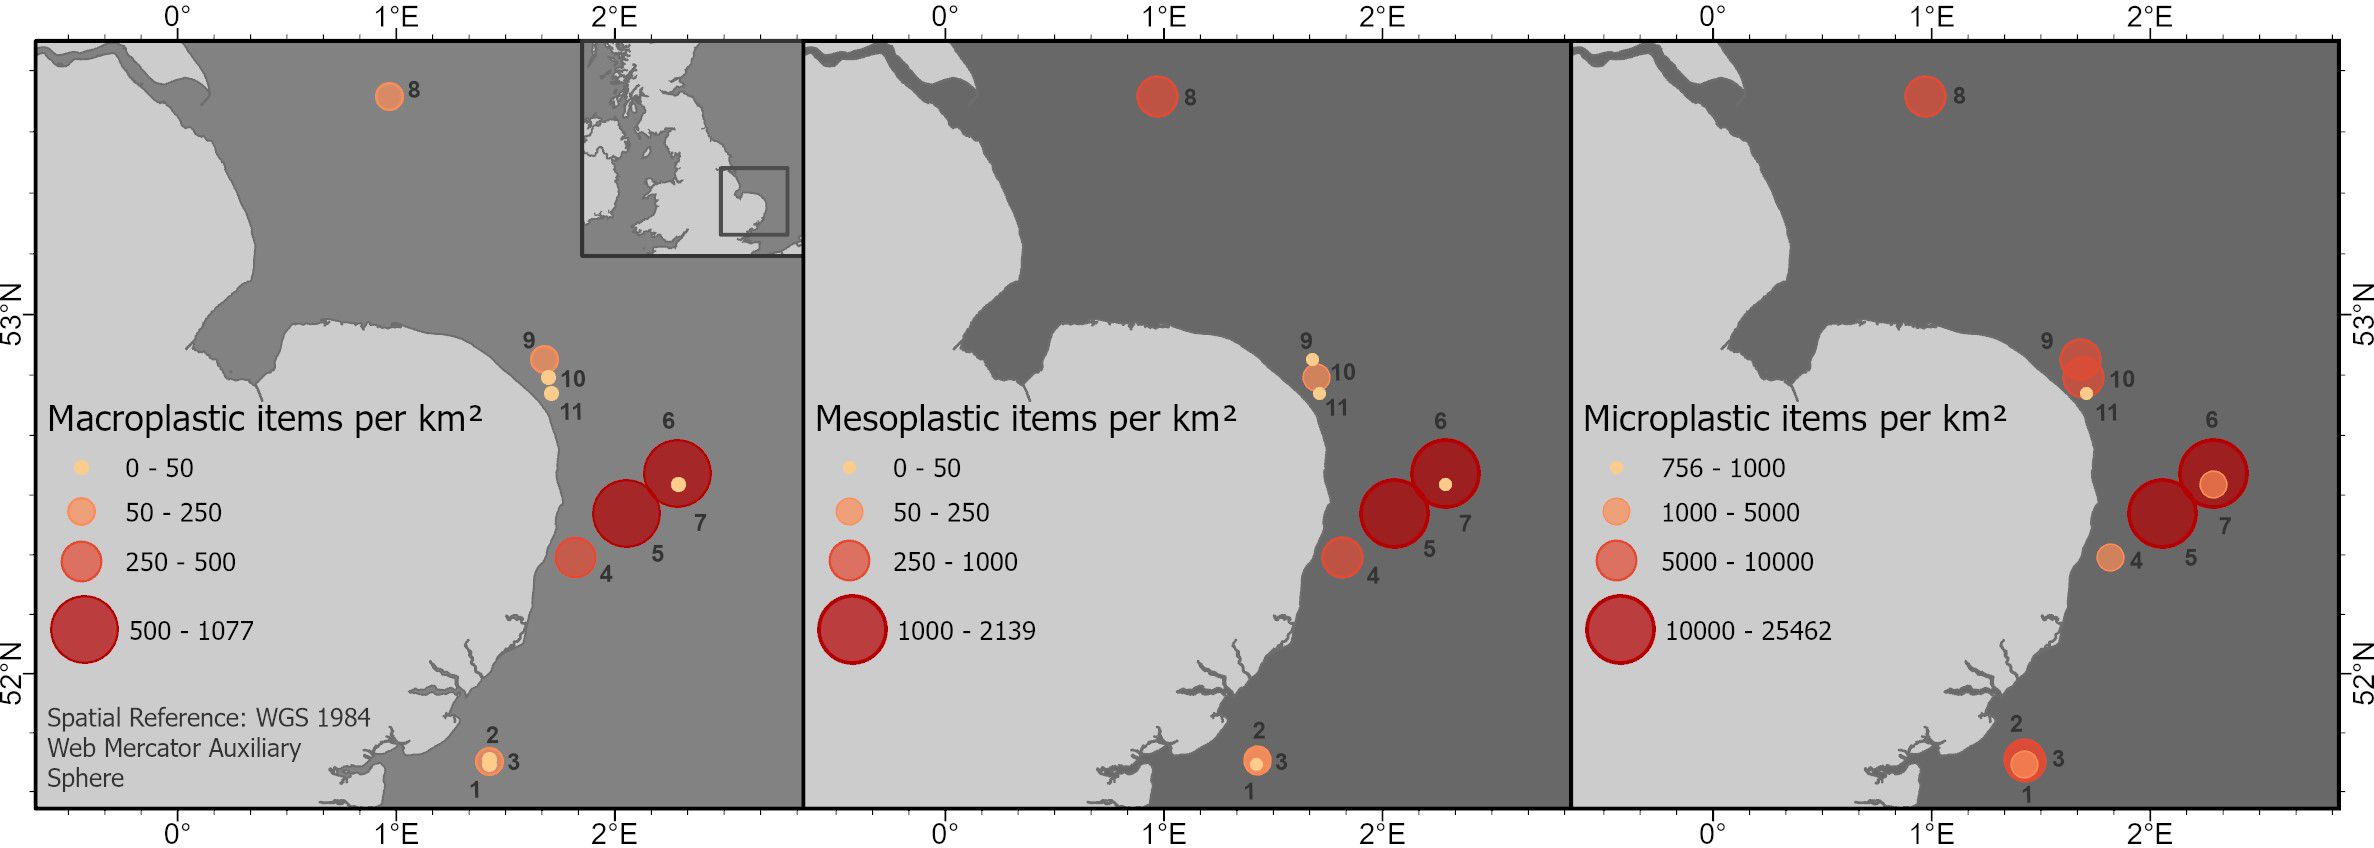
Figure 4. Map of samples and concentrations (items km−2) of micro-, meso-, and macroplastics. Circles indicate range of concentrations (red=highest to yellow=low).
Fragments (83%) were the most abundant morphology of microplastics present, followed by microbeads (8%), film (7%), and filaments (6%). A small number of nurdles and foam were also present (Figure 5; Supplementary Table S2). Most particles were white in colour (19%) followed by blue (17%) followed by black (15%), green (12%), clear (11%), pink (7%), yellow (7%), brown (4%), orange (3%), red (3%), and grey (2%). Sizes of microplastics (n=2,341, 11% of total MP analysed by micro-FTIR) ranged between 142 and 4,960 µm. Most items were in the size range 1,000–5,000 µm (84%) followed by 300–999 µm (15%). The majority of microplastics were polyethylene (PE) (67%) followed by polypropylene (PP) (16%), and 8% were polyester based (Figure 6; Supplementary Table S2). Approximately 6% of particles analysed could not be identified or were of natural composition. Microbeads were made of PE and were predominantly pink (47%) in colour, although some green (16%), blue (16%), white (11%), grey (5%), and brown (5%) ones were also present. Most fragments were PE or PP, while filaments were mainly PE, rayon, polyester based, or rubber.
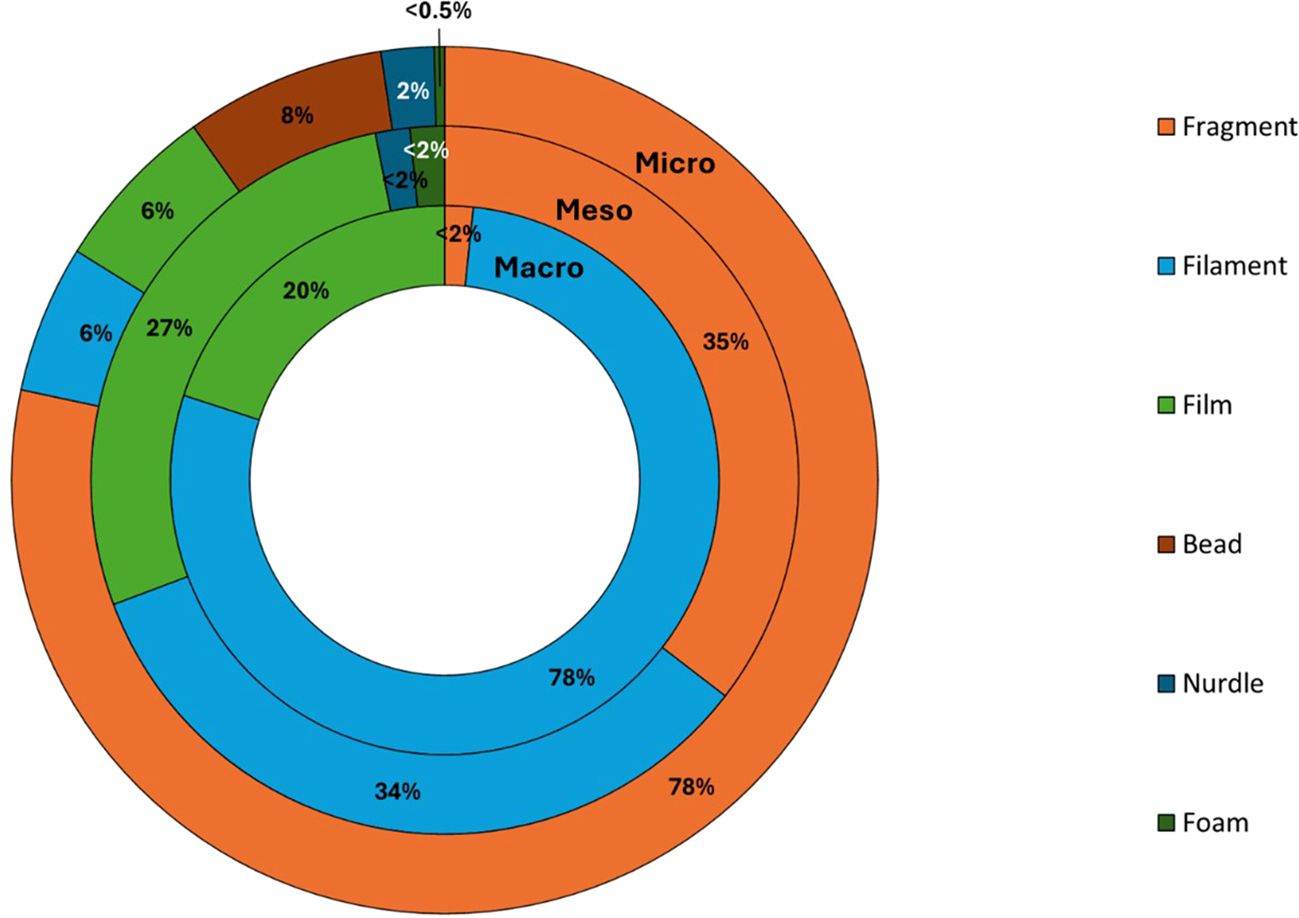
Figure 5. Percentage (%) abundance of different categories (fragment, filament, film, bead, nurdle, and foam) of micro-, meso-, and macroplastics (from outside to inside) from 11 stations.
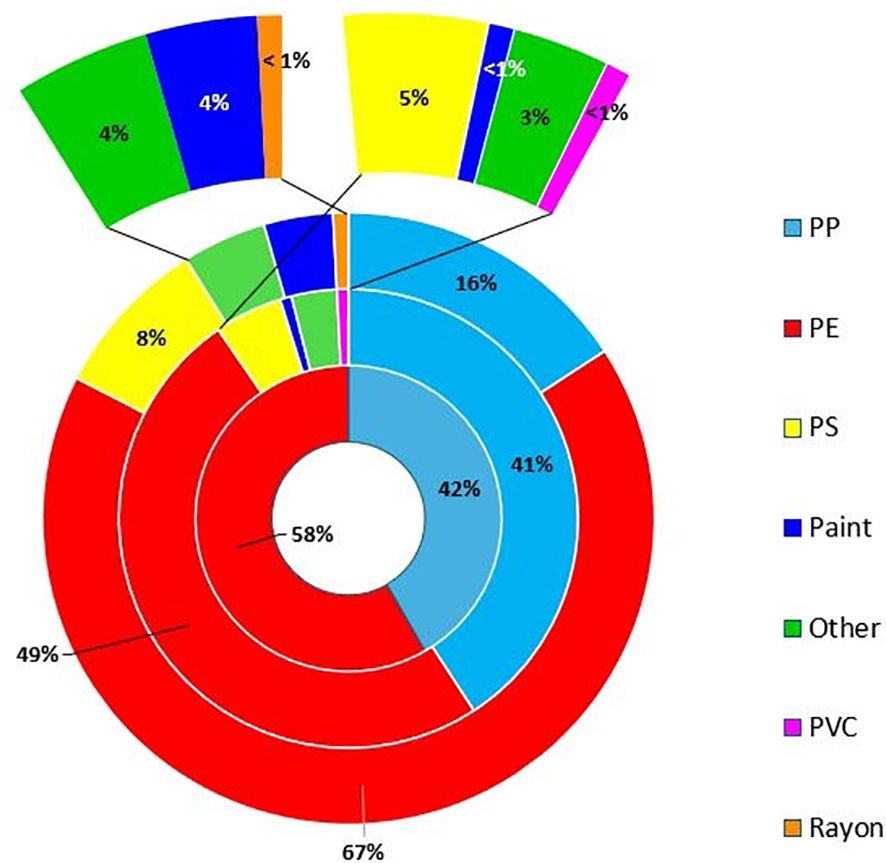
Figure 6. Abundance of types (%) of polymers [PP, PE, PS, Paint, Other (PA and Rubber) PVC, and Rayon) analysed using micro-FTIR for microplastic particles—outside ring (n=258). Middle ring—mesoplastic particles (n=114) analysed using either micro-FTIR or ATR-FTIR. Inner ring—macroplastic particles (n=58) analysed using ATR-FTIR. Natural items (4%) were not reported in the chart and PA and rubber were grouped as “other.”.
3.2.2 Mesoplastics
Mesoplastics concentrations ranged from 0 to 2,139 items km−2 with the highest abundances off the coast of East Anglia (stations 5 and 6), also a suspected hotspot for microplastics with substantially higher amounts of microplastics also being reported for that location (Figure 4). However, no statistically significant differences between the regions were found.
Most mesoplastics were fragments (35%) followed by filaments (34%), then film (28%), and a small number of foam (2%) items and nurdles (2%) were also present (Figure 5; Supplementary Table S2). Similarly to microplastics, PE was the most abundant mesoplastics polymer with 49% followed by PP (41%). A small number of PS (5%), rubber, and PA grouped as “other” (3%), paint (<1%), and PVC (<1%) items were also present (Figure 6; Supplementary Table S2). The size of mesoplastics ranged from 5.01 mm to 24.01 mm.
Approximately 99% of macroplastics (n=58) were analysed using the ATR-FTIR with concentrations ranging from 0 to 1,078 items km−2. Like micro- and mesoplastics concentrations, the highest concentrations were observed at stations 5 and 6 (Figure 4). Most macroplastics were filaments (78%), with some films (20%) and fragments (<2%) also present (Figure 4). PE was the main polymer found (58%) like/mirroring meso- and microsized plastics. The rest of the macroplastic items analysed were made of PP (42%). The size of macroplastics ranged from 25.35 mm to 385.08 mm.
3.3 Statistical analysis
For all of microplastics, mesoplastics, and macroplastics, there was no evidence of differences in concentration between the regions (p=0.84, p=0.26, and p=0.38, respectively). Similar non-statistically significant results were obtained for the proportion of PE (p=0.99, p=0.21, and p=0.61) for the three types of plastic. The p-values for the proportion of fragments in microplastics and mesoplastics were p=0.51 and p=0.30, respectively. Note that station 11 was not used for the proportions of PE and fragments for mesoplastics because no mesoplastics were found there. For a similar reason, stations 2, 7, 10, and 11 were omitted from the analysis of proportions of PE and fragments found in macroplastics.
4 Discussion
4.1 Guidelines for monitoring microplastics
Comparisons between datasets are still difficult, as no standardised protocols are globally accepted and applied. Global monitoring recommendations and best practices are included in diverse reports including the guidelines for the monitoring and assessment of plastic litter in the ocean (Guggisberg and Guggisber, 2024), the guidelines for Harmonizing Ocean Surface Microplastic Monitoring Methods (Ministry of the Environment Japan, 2023), and the Guidance on Monitoring of Marine Litter in European Seas—Update of the guidance on monitoring of marine litter for the Marine Strategy Framework Directive (Guidance on Monitoring of Marine Litter in European Seas, 2023). The European Commission (2023) also recommends the use of manta trawls with nets with a mesh size of 300 µm for the harmonisation with other monitoring programmes, which is consistent with this study. While a comparison of different sampling methods (i.e., manta nets and pump systems) is underway for the UK, previous studies have shown that the sampling protocol applied can have a direct impact on the abundance of microlitter and their composition (Lindeque et al., 2020; De-la-Torre et al., 2022; Shi et al., 2023). Net mesh size has also been shown to have a direct impact on the abundance of reported microplastics with an increase in their abundance with a decrease with net mesh size (Lindeque et al., 2020).
For the present study, microplastics were reported according to the European Commission (2023) with the use of EMODnet microlitter size classes and morphology as specified in the method section. While the sampling of surface floating microplastics in the marine environment is already harmonised, differences in laboratory-based procedures can also impact in the reporting of the abundance of microlitter (including microplastics).
4.2 Nile Red for staining microplastics
Fluorescence tagging of polymers using Nile Red (NR) was also applied in this study to increase the limit of detection of some microliter, which would have been otherwise lost against filter background (Nel et al., 2021), and to guide manual pickup of single items from filters with the priority analysis of fluorescent items onto filters. NR was developed as a low cost and fast approach for the detection and quantification of microplastics in environmental samples (Maes et al., 2017a). Since its development, the application of NR in relation to microplastic research has increased substantially (De Witte et al., 2022; Meyers et al., 2022). Shruti et al. (2022) recently published a review on the application of NR for the analysis of microplastics in environmental samples including food products. While the need for standardised protocols for NR use was highlighted in the review, the authors concluded that NR tagging of microplastics was a promising approach for a low cost and fast screening of microplastics from environmental samples, especially for laboratories lacking more advanced and often costly infrastructure (e.g., pyrolysis GC-MS or m-FTIR, m-Raman facilities). NR has also previously been used for the large-scale mapping of microplastics from sediment, indicating its suitability in a monitoring context (Bakir et al., 2020; Wang et al., 2018; Preston-Whyte et al., 2021; Kukkola et al., 2022). NR has also been applied to the detection and quantification of microplastics in biota (Catarino et al., 2018; Bakir et al., 2020a; Bakir et al., 2020b; Coc et al., 2021; Nalbone et al., 2021) and water (Bakir et al., 2020a; Preston-Whyte et al., 2021).
4.3 UK monitoring data
Monitoring data for the abundance of floating microplastics in UK waters are lacking, with only a small amount of baseline data currently available, and there is an urgent need to address this knowledge gap. Monitoring requires efforts and resources, so it is important to understand the policy priorities. One of these is to provide more information on sources and develop indicators that provide information closer to the source, which could enable change to be detected quicker. Available data for floating microplastics for the UK are mainly available for the North-East Atlantic (Lusher et al., 2014; Maes et al., 2017b) and for Scotland (Russell and Webster, 2021) (Table 2). In this study, microplastics were found in all samples analysed, indicating a widespread presence of microplastics in surface waters for the North Sea. In comparison, two sites in previous studies from the UK Channel, North and Celtic Sea had no microplastics present (Maes et al., 2017b), and 35% of samples from Scottish waters had no microplastics present (Russell and Webster, 2021), indicating spatial differences in the distribution of floating microplastics and likely variations in local inputs of microplastics in the marine environment.
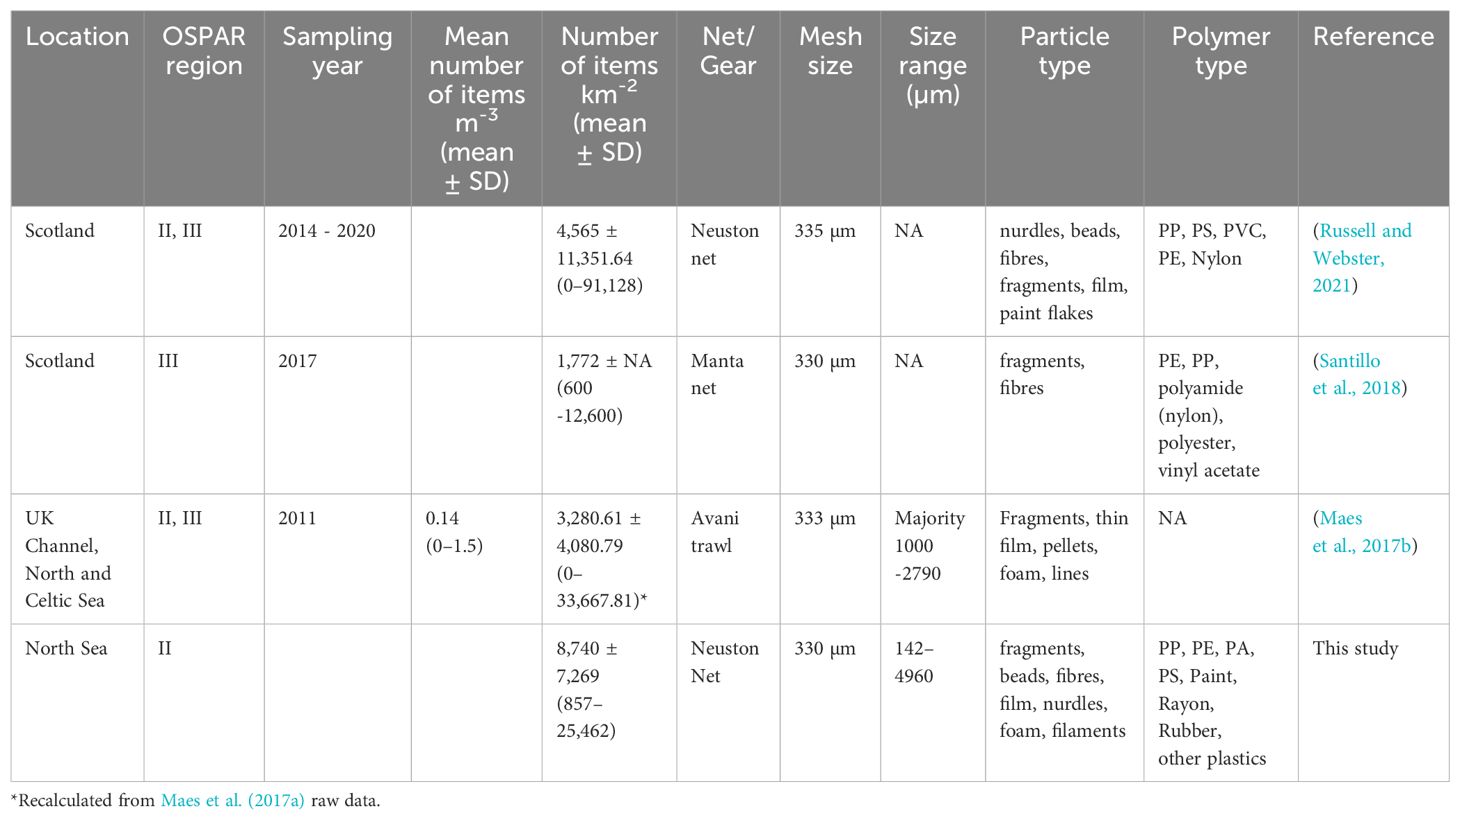
Table 2. Mean number of items in surface waters and near surface waters per cubic metre (m3) and squared kilometre (km2) reported in the literature for the UK (mean ± SD, ranges in brackets).
Three different methods were used in this study to calculate floating plastic concentrations due to variations in some sampling parameters between studies. As an example, Maes et al. (2017b) highlighted the potential impact on calculations using flowmeters potentially leading to large variations in the reporting of the abundance of floating microplastics. Nevertheless, calculating distance from coordinates (latitude and longitude) relies on the ship to move in a straight line during towing. Similarly, for the calculation of distance from speed (average speed used to calculate the distance of the tows), it is estimated that the vessel maintains a constant speed of four knots during towing. This is not always possible depending on waves, vessel direction, and currents. For these reasons and to make datasets comparable to published literature, concentrations were given and calculated in three ways: flowmeter, vessel speed, and coordinates.
4.4 Abundance and distribution of microplastics
The abundance of floating microplastics ranged from 857 to 25,462 items km−2 for the present study with an average abundance of 8,740 ± 7,269 items km−2 (mean ± SD). The average value was substantially higher than the average value reported by Maes et al. (2017b) for the North-East Atlantic of 3,281 ± 4,067.34 items km−2 and the average abundance of 4,564 ± 11,351 items km−2 reported for Scottish waters by Russell and Webster (2021) (Table 2). The abundance of microplastics (also meso- and macroplastics) was relatively high off the coast of Lowestoft (East of England) compared to other locations, suggesting an accumulation zone for plastics for the area. Higher abundances of floating microplastics for this area was also reported in 2011 by Maes et al. (2017b), indicating that there is less plastic in the Celtic Sea. Regarding the mesoplastics, there were no significant differences in the floating concentrations among the sites. However, higher mesoplastic abundances were observed at the microplastic “hotspots” (East of England), indicating the potential break up of larger plastic items into microplastics (secondary microplastics) (Thompson, 2015). The density of microplastics can vary depending on their polymer composition and size. In summary, high-density polyethylene (Brignac et al., 2019) fragments dominate surface waters with a size below 300 µm (Gunaalan et al., 2023). The polymer composition can also vary among size fractions, and as mentioned above/below, the abundance of smaller MP can be underestimated in some studies.
More baseline data are, however, needed to validate those observations (interactions between the size classes) and to identify additional accumulation zones for floating plastics for the UK. Repeated measurements in time are also necessary to understand whether those accumulation zones are permanent or transient. Higher abundance of floating microplastics for the area could be explained by local physical oceanographic processes (i.e., wind speed and currents) influencing particle retention or dispersion mechanisms and the local extent of microplastics release for the area. Similar observations in East Anglia have been made with eutrophication OSPAR assessment, where high coastal DIN and phytoplankton concentrations were found (García-García et al., 2019). Ocean hydrodynamics could play a key role in the transport and distribution of microplastics in the North Sea (Neumann et al., 2014). Surface currents such as shown by Thiel et al. (2011) and OSPAR (2000) could transport particles such as microplastics, up the coast from the English Chanell to East Anglia where they might accumulate.
Additionally, some accumulation zones for microplastics were also reported for Scotland with the highest concentrations recorded in the Solway and the Firths of Clyde and Forth. Higher abundances of microplastics for those areas were attributed to higher inputs from urbanised and industrial sources (Russell and Webster, 2021).
4.5 Polymer type and form
PE was the main polymer type reported for microplastics accounting for 67% of the particles analysed using micro-FTIR (n=247), followed by PP (16%). PE was also the most common polymer type for meso- and macrolitter with 50% and 58%, respectively, followed by PP with 41% and 42%, respectively. A consistent proportion of common polymer types between macro-, meso-, and microsized particles could also indicate the formation of secondary meso- and microplastics from the degradation process of larger debris (i.e., macroplastics). PE and PP have been largely reported for marine surface waters globally (Supplementary Table S3). By contrast, PP was the most common polymer type for floating microplastics in Scottish waters, followed by PS (12%), PVC (10%), and PE (10%) (Russell and Webster, 2021), suggesting differences in local inputs for specific polymeric materials or a greater influence on transboundary floating plastic items for English and Scottish waters due to variations in transport processes.
Fragments were the most prevalent morphology of microplastics reported for surface waters with 78%, followed by beads (8%) and filaments and films (6% each). Some small numbers of nurdles (2%) and foam (<0.5%) were also present. For mesoplastics, fragments were the main morphology type (45%) but filaments (43%) and films (35%) were also present in high proportion. Filaments (47%) were the main morphology type for macrolitter. It is worth noting that due to the relatively large net mesh size used (300–330 µm), smaller filaments were most probably lost during sample collection and were therefore under-estimated in the present study. Previous studies for the UK indicated that most microfilaments had a mean diameter of ~20–30 µm (Bakir et al., 2023). Interestingly, microbeads were detected for surface water for the North Sea while absent for the North Sea seafloor sediment (Bakir, 2022; Bakir and van Loon, 2023; Bakir et al., 2023) and marine biota (Gerigny et al. 2023), either suggesting a rapid long-range transport of those buoyant particles in the marine environment with limited settlement and interaction with biota or from transboundary inputs with the microbeads being released from other locations. Microbeads also accounted for an important proportion of microplastics reported in Scottish waters after fragments (Russell and Webster, 2021). Interestingly, microbeads reported from Scotland were made of PP, while the microbeads reported in this study were mainly composed of PE, which could indicate different sources.
4.6 Transport of microplastics
Microbeads are a good indicator of the input of plastic-based exfoliants in pharmaceutical and personal care products (PPCPs) with potential release from domestic sources and effluents from wastewater treatment plants. PPCPs such as facial scrubs have been identified as potentially important primary sources of microplastics to the marine environment. Previous studies estimated that between 4,594 and 94,500 microbeads could be released from an exfoliant in a single use (Napper et al., 2015). Although microbeads in cosmetics and personal care products have been banned in the UK since 2018 (Department for Environment, 2016), their presence in UK waters suggest inputs from additional sources or from other locations from transboundary transport. While national policies might be effective in reducing local and regional sources of microplastics, transboundary plastic pollution could also contribute to the high incidence of microbeads collected in this study. As an example, a modelling approach using a Lagrangian plastic drift model showed that most of the studied Mediterranean countries (13 out of 15) had at least one national MPA with over 55% of macroplastics originating from sources beyond their borders (Hatzonikolakis et al., 2021). Understanding transport of floating microplastics is important to identify likely sources of plastic litter and accumulation zones and to direct remediation actions at different levels (e.g., local, national regional and globally). Currents, wind, and waves are important factors that can change their short- to long-term transport including their dispersion in the marine environment (Calvert et al., 2021; van der Molen et al., 2021). Understanding main transport mechanisms can help the development and refinement of transport models of microplastics in the marine environment. Understanding of particle-specific characteristics such as concentration, morphology, size, interaction with suspended solids and organic matter, degree of biofouling, and level of weathering are also important parameters to consider for the simulation of plastic particle transport and fate.
The identification of specific sources of microplastics from their particle-specific characteristics is, however, difficult from their small size compared to meso- and macrolitter, for which matching a material to a specific use and often specific sources (e.g., fishing gear items) is usually possible. All data are accessible via the Cefas Data Portal (DOI: 10.14466/CefasDataHub.155) abiding to the FAIR principles (Findability, Accessibility, Interoperability, and Reusability), which has the advantage of worldwide visibility without barriers, and potentially leads to more citations and more impact. It also enables wider collaboration with the wider scientific community.
4.7 Comparison to other regions around the world
While the mean abundance of floating microplastics reported in this study (8,740 ± 7,269 items km−2) is relatively high compared to previous data for the UK, their abundance is much lower than other values reported globally (Supplementary Table S3). Carretero et al. (2022) reported an average abundance of 254,000 ± 13,4000 items km−2 in surface waters off the coasts of Northwest Spain for 2017 (Carretero et al., 2022). Higher abundances were also reported for the Cantabrian Sea with an average abundance of 35,000 ± 31,000 and 86,000 ± 154,000 items km−2 for samples collected in 2013 and 2014, respectively (Gago et al., 2015). Higher abundances were also reported off the West coast of Portugal (2018–2019) and for the Bay or Brest (Autumn 2014) with an average abundance of 40,822.58 ± 43,578.63 and 55,255 ± 73,475 (mean ± SD) (Frere et al., 2017; Rodrigues et al., 2020). Much higher MP concentrations were also observed in the Canary Islands with a mean of 998,075 items km−2 similar to those observed in the North Pacific Subtropical Gyre (Garcia-Regalado et al., 2024). As previously mentioned, additional sampling for the UK is needed, as additional accumulation zones might have been missed in this study, which would lead to higher average abundances of floating microplastics. More field studies of MP pollution on sediment, water column, and surface water in accumulation areas are needed to determine trends in this region.
Our work has highlighted that there may be higher concentrations of microplastics than previously thought, which will potentially affect future projects on risk assessments for microplastics relying on previous environmental relevant concentration of floating microplastics (Everaert et al., 2020). Understanding the type of abundance of floating plastic items will also support the understanding of the type of items potentially bioavailable to marine life with links to current proposed bioindicators for floating plastics (Rodríguez et al., 2024). Understanding the physical property of floating items (i.e., size, morphology, density, etc…) will also support the development of local and regional particle transport models to identify accumulation zones or “hotspots” and will help to guide policy and remediation actions.
5 Conclusion
A harmonised protocol was applied for the collection and for the analysis of floating plastic litter for UK waters for micro-, meso-, and macroplastics. This study highlighted the importance of harmonised protocols to produce robust datasets for the development of national monitoring programmes and to support policy actions. Microplastics were detected in all the samples under investigation, suggesting a widespread occurrence of microplastics in the Southern Bight of the North Sea. The highest abundance of microplastics was reported off the coast of East Anglia; however, the concentrations were lower compared to other locations globally. Fragments were the main prevalent (78%) morphology of microplastics followed by beads (8%), filaments (6%), and films (6%).
This suggests that the microplastics in UK waters mainly break down from larger items such as bags, bottles, and food containers. The adoption of surface water as a common indicator for microlitter for OSPAR environmental assessments would allow for future studies at a regional level to allow for regional action plans and risk maps. This work and data are also important at the global level to feed into and help advance the SDG indicator 14.1.1 on Plastic Litter in the Ocean.
Smaller items (smaller than 300 µm) are potentially under-sampled in surface water when they are smaller than the mesh size such as the small pink beads from cosmetics.
Data availability statement
The datasets presented in this study can be found in online repositories. The names of the repository/repositories and accession number(s) can be found below: All data are accessible via the Cefas Data Portal (DOI: 10.14466/CefasDataHub.155).
Ethics statement
Written informed consent was obtained from the individual(s) for the publication of any potentially identifiable images or data included in this article.
Author contributions
DH: Formal analysis, Investigation, Methodology, Writing – original draft. AM: Visualization, Writing – review & editing. JB: Formal analysis, Writing – review & editing. JR: Writing – review & editing. EN: Investigation, Writing – review & editing. AB: Conceptualization, Supervision, Writing – review & editing.
Funding
The author(s) declare financial support was received for the research, authorship, and/or publication of this article. The authors would like to thank and acknowledge the (Defra on behalf of the) UK Government for the funding: project number GB-GOV-7-BPFOCPP in funding this work. Furthermore, the authors would like to thanks Cefas for funding this work under the Seedcorn project: project number DP2000Y.
Acknowledgments
The authors would also like to thank Rob Brooks for providing the map. Thanks to Holly Nel for data QC. Thanks to Aimee Cuskeran and Daniel Jolly for help with the sample analysis.
Conflict of interest
The authors declare that the research was conducted in the absence of any commercial or financial relationships that could be construed as a potential conflict of interest.
Publisher’s note
All claims expressed in this article are solely those of the authors and do not necessarily represent those of their affiliated organizations, or those of the publisher, the editors and the reviewers. Any product that may be evaluated in this article, or claim that may be made by its manufacturer, is not guaranteed or endorsed by the publisher.
Supplementary material
The Supplementary Material for this article can be found online at: https://www.frontiersin.org/articles/10.3389/fmars.2024.1430307/full#supplementary-material
References
Alfaro-Núñez A., Astorga D., Cáceres-Farías L., Bastidas L., Soto Villegas C., Macay K., et al. (2021). Microplastic pollution in seawater and marine organisms across the Tropical Eastern Pacific and Galápagos. Sci. Rep. 11, 1–8. doi: 10.1038/s41598-021-85939-3
Andrady A. L. (2011). Microplastics in the marine environment. Mar. pollut. Bull. 62, 1596–1605. doi: 10.1016/j.marpolbul.2011.05.030
Bakir A. (2022). Monitoring of microplastics in Dutch marine sediments: a pilot study. Available online at: https://open.rijkswaterstaat.nl/@270662/development-monitoring-and-data-analysis/.
Bakir A., Desender M., Wilkinson T., Van Hoytema N., Amos R., Airahui S., et al. (2020a). Occurrence and abundance of meso and microplastics in sediment, surface waters, and marine biota from the South Pacific region. Mar. pollut. Bull. 160, 111572. doi: 10.1016/j.marpolbul.2020.111572
Bakir A., Doran D., Silburn B., Russell J., Archer-Rand S., Barry J., et al. (2023). A spatial and temporal assessment of microplastics in seafloor sediments: A case study for the UK. Front. Mar. Sci. 9. doi: 10.3389/fmars.2022.1093815
Bakir A., van der Lingen C. D., Preston-Whyte F., Bali A., Geja Y., Barry J., et al. (2020b). Microplastics in commercially important small pelagic fish species from South Africa. Front. Mar. Sci. 7. doi: 10.3389/fmars.2020.574663
Bakir A., van Loon W. M. G. M. (2023). Development of a monitoring and data analysis method for microplastic particles in Dutch marine sediments.
Brignac K. C., Jung M. R., King C., Royer S. J., Blickley L., Lamson M. R., et al. (2019). Marine debris polymers on Main Hawaiian Island beaches, sea surface, and seafloor. Environ. Sci. Technol. 53, 12218 12226. doi: 10.1021/acs.est.9b03561
Calvert R., McAllister M. L., Whittaker C., Raby A., Borthwick A. G. L., Van Den Bremer T. S. (2021). A mechanism for the increased wave-induced drift of floating marine litter. J. Fluid Mech. 915, A73. doi: 10.1017/jfm.2021.72
Carretero O., Gago J., Filgueiras A. V., Viñas L. (2022). The seasonal cycle of micro and meso-plastics in surface waters in a coastal environment (Ría de Vigo, NW Spain). Sci. Total Environ. 803, 150021. doi: 10.1016/j.scitotenv.2021.150021
Catarino A. I., Macchia V., Sanderson W. G., Thompson R. C., Henry T. B. (2018). Low levels of microplastics (MP) in wild mussels indicate that MP ingestion by humans is minimal compared to exposure via household fibres fallout during a meal. Environ. pollut. 237, 675–684. doi: 10.1016/j.envpol.2018.02.069
Chapron L., Peru E., Engler A., Ghiglione J. F., Meistertzheim A. L., Pruski A. M., et al. (2018). Macro- and microplastics affect cold-water corals growth, feeding and behaviour. Sci. Rep. 8, 15299. doi: 10.1038/s41598-018-33683-6
Coc C., Rogers A., Barrientos E., Sanchez H. (2021). Micro and macroplastics analysis in the digestive tract of a sea cucumber (Holothuriidae, holothuria floridana) of the placencia lagoon, Belize. Caribb. J. Sci. 51, 166–174. doi: 10.18475/cjos.v51i2.a2
De-la-Torre G. E., Pizarro-Ortega C. I., Dioses-Salinas D. C., Loayza J. C., Sanchez J. S., Meza-Chuquizuta C., et al. (2022). Are we underestimating floating microplastic pollution? A quantitative analysis of two sampling methodologies. Mar. pollut. Bull. 178, 113592. doi: 10.1016/j.marpolbul.2022.113592
Department for Environment, Food & Rural Affairs, The Rt Hon Andrea Leadsom (2016). Microbead ban announced to protect sealife (Dep. Environ. Food Rural Aff).
DEFRA. (2019). Department of Environment, Food and Rural Affairs, 2019. [WWW Document]. Dep. Environ. Food Rural Aff. marine-strategy-part1-october19.pdf (publishing.service.gov.uk) Available online at: http://www.gov.uk/government/publications.
Desforges J. P. W., Galbraith M., Dangerfield N., Ross P. S. (2014). Widespread distribution of microplastics in subsurface seawater in the NE Pacific Ocean. Mar. pollut. Bull. 79, 94–99. doi: 10.1016/j.marpolbul.2013.12.035
De Witte B., Catarino A. I., Vandecasteele L., Dekimpe M., Meyers N., Deloof D., et al. (2022). Feasibility study on biomonitoring of microplastics in fish gastrointestinal tracts. Front. Mar. Sci. 8. doi: 10.3389/fmars.2021.794636
Enders K., Lenz R., Stedmon C. A., Nielsen T. G. (2015). Abundance, size and polymer composition of marine microplastics ≥10 µm in the Atlantic Ocean and their modelled vertical distribution. Mar. pollut. Bull. 100, 70–81. doi: 10.1016/j.marpolbul.2015.09.027
Everaert G., De Rijcke M., Lonneville B., Janssen C. R., Backhaus T., Mees J., et al. (2020). Risks of floating microplastic in the global ocean. Environ. pollut. 207, 115499. doi: 10.1016/j.envpol.2020.115499
Ford H. V., Jones N. H., Davies A. J., Godley B. J., Jambeck J. R., Napper I. E., et al. (2022). The fundamental links between climate change and marine plastic pollution. Sci. Total Environ. 806, 150392. doi: 10.1016/j.scitotenv.2021.150392
Frere L., Paul-Pont I., Rinnert E., Petton S., Jaffré J., Bihannic I., et al. (2017). Influence of environmental and anthropogenic factors on the composition, concentration and spatial distribution of microplastics: a case study of the Bay of Brest (Brittany, France). Environ. pollut. 225, 211–222. doi: 10.1016/j.envpol.2017.03.023
Gago J., Henry M., Galgani F. (2015). First observation on neustonic plastics in waters off NW Spain (spring 2013 and 2014). Mar. Environ. Res. 111, 27–33. doi: 10.1016/j.marenvres.2015.07.009
García-García L. M., Sivyer D., Devlin M., Painting S., Collingridge K., van der Molen J. (2019). Optimizing monitoring programs: A case study based on the OSPAR eutrophication assessment for UK waters. Front. Mar. Sci. 5. doi: 10.3389/fmars.2018.00503
García-Regalado A., Herrera A., Almeda R. (2024). Microplastic and mesoplastic pollution in surface waters and beaches of the Canary Islands: A review. Mar. Poll Bull. 201, 116230. doi: 10.1016/j.marpolbul.2024.116230
Gerigny O., Bakir A., Barry J., Cardin Z., Chouteau L., El Rakwe M., et al. (2023). CleanAtlantic Tackling Marine Litter in the Atlantic Area. Characterization of microplastics ingested by mussels. Toward the determination of a bio-sentinel species of the marine environment contamination by microplastics? Available online at: https://www.cleanatlantic.eu/wp-content/uploads/2024/01/20231106_CleanAtlantic_Mussels.pdf.
GESAMP (2021). Sea-based sources of marine litter. Available online at: http://www.gesamp.org/publications/sea-based-sources-of-marine-litter (Accessed 10.19.23).
Guggisberg S., Guggisber S. (2024). Finding equitable solutions to the land-based sources of marine plastic pollution: Sovereignty as a double-edged sword. Mar. Policy 159, 105960. doi: 10.1016/j.marpol.2023.105960
Guidance on Monitoring of Marine Litter in European Seas (2023) (Publ. Off. Eur. Union). doi: 10.2760/59137
Gunaalan K., Almeda R., Vianello A., Lorenz C., Iordachescu L., Papacharalampos K., et al. (2023). Does water column stratification influence the vertical distribution of microplastics? Environ. Poll. 340, 122865. doi: 10.1016/j.envpol.2023.122865
Hatzonikolakis Y., Giakoumi S., Raitsos D. E., Tsiaras K., Kalaroni S., Triantaphyllidis G., et al. (2021). Quantifying transboundary plastic pollution in marine protected areas across the Mediterranean Sea. Front. Mar. Sci. 8. doi: 10.3389/fmars.2021.762235
Jambeck J. R., Geyer R., Wilcox C., Siegler T. R., Perryman M., Andrady A., et al. (2015). Plastic waste inputs from land into the ocean. Sci. (80-.) 347, 764–768. doi: 10.1126/science.1260352
Kukkola A. T., Senior G., Maes T., Silburn B., Bakir A., Kröger S., et al. (2022). A large-scale study of microplastic abundance in sediment cores from the UK continental shelf and slope. Mar. pollut. Bull. 178, 113554. doi: 10.1016/j.marpolbul.2022.113554
Kye H., Kim J., Ju S., Lee J., Lim C., Yoon Y. (2023). Microplastics in water systems: A review of their impacts on the environment and their potential hazards. Heliyon. 9 (3), E14359. doi: 10.1016/j.heliyon.2023.e14359
Lebreton L. C. M., van der Zwet J., Damsteeg J. W., Slat B., Andrady A., Reisser J. (2017). River plastic emissions to the world’s oceans. Nat. Commun. 8, 15611. doi: 10.1038/ncomms15611
Leistenschneider C., Burkhardt-Holm P., Mani T., Primpke S., Taubner H., Gerdts G. (2021). Microplastics in the Weddell Sea (Antarctica): A forensic approach for discrimination between environmental and vessel-induced microplastics. Environ. Sci. Technol. 55, 15900–15911. doi: 10.1021/acs.est.1c05207
Lenz R., Labrenz M. (2018). Small microplastic sampling in water: Development of an encapsulated filtration device. Water (Switzerland). 8 (8), 1055. doi: 10.3390/w10081055
Lincoln S., Chowdhury P., Posen P. E., Robin R. S., Ramachandran P., Ajith N., et al. (2023). Interaction of climate change and marine pollution in Southern India: Implications for coastal zone management practices and policies. Sci. Total Environ. 902, 166061. doi: 10.1016/j.scitotenv.2023.166061
Lindeque P. K., Cole M., Coppock R. L., Lewis C. N., Miller R. Z., Watts A. J. R., et al. (2020). Are we underestimating microplastic abundance in the marine environment? A comparison of microplastic capture with nets of different mesh-size. Environ. pollut. 265, 114721. doi: 10.1016/j.envpol.2020.114721
Löder M. G. J., Gerdts G. (2015). “Methodology used for the detection and identification of microplastics—a critical appraisal,” in Marine Anthropogenic Litter (Cham Heidelberg; New York; Dordrecht; London: Springer International Publishing), 201–227. doi: 10.1007/978-3-319-16510-3_8
Lusher A. L., Burke A., O’Connor I., Officer R. (2014). Microplastic pollution in the Northeast Atlantic Ocean: Validated and opportunistic sampling. Mar. pollut. Bull. 88, 325–333. doi: 10.1016/j.marpolbul.2014.08.023
Maes T., Jessop R., Wellner N., Haupt K., Mayes A. G. (2017a). A rapid-screening approach to detect and quantify microplastics based on fluorescent tagging with Nile Red. Sci. Rep. 7, 44501. doi: 10.1038/srep44501
Maes T., van der Meulen M. D., Devriese L. I., Leslie H. A., Huvet A., Frère L., et al. (2017b). Microplastics baseline surveys at the water surface and in sediments of the North-East Atlantic. Front. Mar. Sci. 4. doi: 10.3389/fmars.2017.00135
Meyers N., Catarino A. I., Declercq A. M., Brenan A., Devriese L., Vandegehuchte M., et al. (2022). Microplastic detection and identification by Nile red staining: towards a semi-automated, cost- and time-effective technique. Sci. Total Environ. 823, 153441. doi: 10.1016/j.scitotenv.2022.153441
Ministry of the Environment Japan (2023). Guidelines for Harmonizing Ocean Surface Microplastic Monitoring Methods - version 1.2. (Chiyoda-ku, Tokyo , Japan; Ocean Best Practices, Guidelines for Harmonizing Ocean Surface Microplastic Monitoring Methods. Version 1.2. (oceanbestpractices.org)). doi: 10.25607/OBP-867-2
Nalbone L., Panebianco A., Giarratana F., Russell M. (2021). Nile Red staining for detecting microplastics in biota: Preliminary evidence. Mar. pollut. Bull. 172, 112888. doi: 10.1016/j.marpolbul.2021.112888
Napper I. E. I. E., Bakir A., Rowland S. J. S. J., Thompson R. C. (2015). Characterisation, quantity and sorptive properties of microplastics extracted from cosmetics. Mar. Poll. Bull. 99, 178–185. doi: 10.1016/j.marpolbul.2015.07.029
Nel H. A., Chetwynd A. J., Kelleher L., Lynch I., Mansfield I., Margenat H., et al. (2021). Detection limits are central to improve reporting standards when using Nile red for microplastic quantification. Chemosphere 263, 127953. doi: 10.1016/j.chemosphere.2020.127953
Neumann D., Callies U., Matthies M. (2014). Marine litter ensemble transport simulations in the southern North Sea. Mar. Poll. Bull. 86, 2019–2228. doi: 10.1016/j.marpolbul.2014.07.016
North-East Atlantic environment strategy 2030. Available online at: https://www.ospar.org/convention/strategy (Accessed 4.29.24).
Plastics Europe (2023). Plastics – the fast Facts 2023. Available online at: https://plasticseurope.org/ (Accessed 10.19.23).
Preston-Whyte F., Silburn B., Meakins B., Bakir A., Pillay K., Worship M., et al. (2021). Meso- and microplastics monitoring in harbour environments: A case study for the Port of Durban, South Africa. Mar. pollut. Bull. 163, 111948. doi: 10.1016/j.marpolbul.2020.111948
Rodrigues D., Antunes J., Otero V., Sobral P., Costa M. H. (2020). Distribution patterns of microplastics in seawater surface at a Portuguese estuary and marine park. Front. Environ. Sci. 8. doi: 10.3389/fenvs.2020.582217
Rodríguez Y., Rodríguez A., Willem M.G.M. van Loon W. M. G. M., Pereira J. M., Frias J., Emily M. Duncan E. M., et al. (2024). Cory’s shearwater as a key bioindicator for monitoring floating plastics. Environ. Int. 186, 108595. doi: 10.1016/j.envint.2024.108595
Russell M., Webster L. (2021). Microplastics in sea surface waters around Scotland. Mar. pollut. Bull. 166, 112210. doi: 10.1016/j.marpolbul.2021.112210
Santillo D., Oakes G., Labunska I., Casado J., Brigden K., Thompson K. F., et al. (2018). Physical and chemical characterisation of sea-surface microplastics collected from coastal and inland waters of Scotland in the summer of 2017. Available online at: https://marine.gov.scot/sma/content/physical-and-chemical-characterisation-sea-surface-microplastics-collected-coastal-and.
Shi H., Wang X., Zhu L., Li D. (2023). Comprehensive Comparison of Various Microplastic Sampling Methods in Sea Water: Implications for Data Compilation. Water 15, 1035. doi: 10.3390/w15061035
Shruti V. C., Pérez-Guevara F., Roy P. D., Kutralam-Muniasamy G. (2022). Analyzing microplastics with Nile Red: Emerging trends, challenges, and prospects. J. Hazardous Materials. 423 (Part B), 127171. doi: 10.1016/j.jhazmat.2021.127171
Strand J., Tairova Z. (2016). Microplastic particles in North Sea sediments 2015. DCE - Danish Cent. Environ. Energy 1–20. Available online at: https://dce2.au.dk/pub/SR178.pdf (Accessed 10.19.23).
Thiel M., Hinojosa I. A., Joschko T., Gutow L. (2011). Spatio-temporal distribution of floating objects in the German Bight (North Sea). J. Sea Res. 65, 368–379. doi: 10.1016/j.seares.2011.03.002
Thompson R. C. (2015). “Marine anthropogenic litter,” in Marine Anthropogenic Litter (Cham Heidelberg New York Dordrecht London: Springer), 185–200. doi: 10.1007/978-3-319-16510-3
United Nations Environment Programme (2021). Understanding the state of the ocean. Available online at: https://wedocs.unep.org/handle/20.500.11822/35086 (Accessed 10.19.23).
van der Molen J., van Leeuwen S. M., Govers L. L., van der Heide T., Olff H. (2021). Potential micro-plastics dispersal and accumulation in the North Sea, with application to the MSC zoe incident. Front. Mar. Sci. 8. doi: 10.3389/fmars.2021.607203
Wang Z., Su B., Xu X., Di D., Huang H., Mei K., et al. (2018). Preferential accumulation of small (<300 um) microplastics in the sediments of a coastal plain river network in eastern China. Water Res. 144, 393–401. doi: 10.1016/j.watres.2018.07.050
Werner S., Budziak A., Van Franeker J. A., Galgani F., Hanke G., Maes T., et al. (2016). Harm caused by Marine Litter. (Luxembourg: Publication Office of the European Union). doi: 10.2788/690366
Keywords: microlitter, North Sea, marine litter, surface waters, UK, floating litter
Citation: Hoehn DP, McGoran AR, Barry J, Russell J, Nicolaus EEM and Bakir A (2024) Microplastics in sea surface waters in the Southern Bight of the North Sea. Front. Mar. Sci. 11:1430307. doi: 10.3389/fmars.2024.1430307
Received: 09 May 2024; Accepted: 15 July 2024;
Published: 07 August 2024.
Edited by:
Marina F. M. Santana, Australian Institute of Marine Science (AIMS), AustraliaReviewed by:
Peng Zhang, Guangdong Ocean University, ChinaAna Isabel Catarino, Flanders Marine Institute, Belgium
Copyright © 2024 Hoehn, McGoran, Barry, Russell, Nicolaus and Bakir. This is an open-access article distributed under the terms of the Creative Commons Attribution License (CC BY). The use, distribution or reproduction in other forums is permitted, provided the original author(s) and the copyright owner(s) are credited and that the original publication in this journal is cited, in accordance with accepted academic practice. No use, distribution or reproduction is permitted which does not comply with these terms.
*Correspondence: Danja P. Hoehn, ZGFuamEuaG9laG5AY2VmYXMuZ292LnVr