 Yuan Chai
 Jipeng Wei
 Jing Wang
 Weichen Guo3
 Yingbo Yu
- 1College of Marine Living Resource Sciences and Management, Shanghai Ocean University, Shanghai, China
- 2College of Economics and Management, Shanghai Ocean University, Shanghai, China
- 3The 802 Research Institute of the Eighth Research Institute, China Aerospace Science and Technology Corporation, Shanghai, China
- 4Fengxian District State-owned Assets Supervision and Administration Commission of Shanghai, Shanghai, China
- 5Institute of Marine Science, Shanghai Ocean University, Shanghai, China
Enhancing marine carbon sequestration through nearshore aquaculture is a novel scientific approach to addressing global climate change and facilitating low-carbon development. Scientifically estimating the quantity and price of China’s marine fisheries carbon sinks provides a crucial foundation for promoting marine carbon trading. In this article, firstly, the long-term carbon storage capacity of China’s marine carbon sequestration fishery available from 1979 to 2022 for carbon trading is calculated. And then a transcendental logarithmic production function model incorporating ridge regression analysis, and an accounting equation for estimating the shadow price of China’s marine fisheries carbon sequestration are established. Simultaneously, the distortion level of China’s marine fisheries carbon sequestration prices from 2015 to 2022 is measured, and the reasons and economic effects of the distortion in prices are analyzed. The research results show that: 1) The capacity of a net carbon sequestration in China’s marine carbon sequestration fishery for carbon trading, ranged from 78,869.01 tons in 1979 to 1,232,762.27 tons in 2022, with an average annual capacity of 592,472.07 tons and an average annual growth rate of 7.48%; 2) The price of China’s marine fisheries carbon sinks increased from 39.46 CNY in 1979 to 375.96 CNY in 2022, with an average annual growth rate of 6.00%. The average annual price was 167.87 CNY; 3) There were varying degrees of distortion in China’s marine fisheries carbon sequestration prices from 2015 to 2022, which decreased annually with the construction of China’s own carbon trading market and the practice of trading. To realize the value of marine fisheries carbon sequestration, it is necessary to actively promote the development of voluntary emission reduction markets, develop carbon trading futures markets, and strengthen the dynamic monitoring system for resources.
1 Introduction
There exists a global consensus on the detrimental impact of carbon emissions on global climate and environmental changes (Davies et al., 2013). In 2020, the Chinese government committed to “ reaching to the peak of CO2 emissions by 2030” and “ achieving for carbon neutrality by 2060”. However, China is currently experiencing rapid economic growth, resulting in a simultaneous rise in annual carbon dioxide emissions. As a response, China actively promotes various methods for enhancing carbon sinks in addition to emission reduction strategies (Tang and Liu, 2016). It achieves ecological carbon sinks through the functions of carbon sequestration and storage in forests, pastures, oceans, and other living organisms (Zhang et al., 2022). Ecological carbon sinks represent a crucial approach for reducing carbon emissions globally. The fishery carbon sink, which entails sequestering and storing carbon through carbon-absorbing aquatic products, holds substantial promise for fostering a low-carbon economy and contributing to the governance mechanism of reducing greenhouse gas emissions (Zhang et al., 2013). This is especially true for organic debris originating from deep-sea sediments after the demise of marine organisms. In this context, the carbon cycle may persist for millions of years, surpassing the duration of the carbon cycle associated with terrestrial organisms. Marine organisms play a crucial role in regulating the global carbon cycle, a pivotal factor in the world’s economic development (Xu et al., 2018). Marine organisms contribute to fixing 55% of the world’s carbon, with marine plants (seagrasses, seaweeds, mangroves, etc.) exhibiting notable and efficient carbon sequestration capabilities. Although their biomass accounts for merely 0.05% of terrestrial plants, their carbon stocks are comparable. Presently, marine fisheries carbon sinks trading is primarily undergoing pilot programs guided by government initiatives at the local level, and have not yet experienced extensive market trading. Moreover, the absence of standardized monitoring and supervision of such technology, combined with the novelty of marine fisheries carbon sinks in the market, complicates the evaluation of their market value. Furthermore, the lack of an established price mechanism hampers the initiation and advancement of marine fisheries carbon sinks market transactions. China pioneered the concept of fishery carbon sinks and has been at the forefront of promoting the development of carbon sink fisheries. Ongoing research predominantly centers on exploring the roles of marine biological carbon sinks, mechanisms for carbon sinks fisheries, the potential for carbon sequestration, accounting of sequestration amounts, as well as measurement and monitoring technologies. Nevertheless, there exists a scarcity of research regarding the involvement of marine fisheries carbon sinks in the carbon trading market, the establishment of market trading for such carbon sinks, and the recognition of their ecological value.
Among the existing studies, Yu quantified the carbon offset generated by shellfish aquaculture in Shandong between 2001 and 2009, employing a carbon offset model (Yu et al., 2011). Li employed the Conditional Value Assessment Method (CVM) to assess the carbon sequestration potential of marine aquaculture. The assessment included questionnaire surveys aimed at gauging the willingness of both rural and urban Chinese residents to financially support carbon sequestration initiatives in aquaculture (Li and Zhao, 2014). Yue evaluated the ecological value of carbon sinks in marine aquaculture spanning from 2000 to 2012, utilizing the photosynthesis reaction equation. The assessment focused on determining the amount and value of carbon sequestration and oxygen release from seaweed aquaculture in China during the same period and constructing an ecological value index for seaweed aquaculture (Yue et al., 2014).
Shen, a Chinese scholar, drew upon the foundational principles outlined by Pablo C. Benitez et al. for calculating carbon sink benefits in Latin American forestry. Additionally, he introduced the idea of valuing carbon sinks in marine ranches. Over an extended operational timeframe, operators have demonstrated a heightened willingness to invest in carbon sinks associated with shellfish aquaculture within marine ranches. The cumulative benefit stemming from farmed shellfish carbon sinks within the operation, denoted as NPV∞,shall surpass the net benefit associated with alternative aquaculture activities such as bait and medicated feeding, represented by R∞ (i.e., NPV∞ ≥ R∞). This condition establishes the minimum price for the carbon sinks within marine ranches (Shen et al., 2018). In 2017, Shao evaluated the option value of carbon sinks in Chinese fisheries employing the B-S option pricing model, leveraging the analysis on seawater-farmed algae as an illustrative example (Shao et al., 2017). These documents have made significant contributions to the exploration of marine carbon sinks and the assessment of their economic value, they propose various assessment methods, including the theory of incomplete information dynamic game, the Contingent Valuation Method (CVM), and the Black-Scholes (B-S) option pricing model. These methods provide new perspectives and tools for understanding and quantifying the potential ecological value of marine carbon sinks. The motivation behind these studies is primarily to respond to the global climate change challenge, promote the green development of the marine economy, facilitate marine carbon sink market transactions, and raise societal awareness of the functions of marine carbon sinks. Through these studies, we can gain a deeper understanding of the potential and value of marine carbon sinks, providing a scientific basis for formulating relevant policies and incentive mechanisms, thereby promoting the protection and sustainable use of marine ecosystems. However, there are still certain shortcomings exist: 1) Some studies rely on theoretical models and lack long-term field observation data, or the evaluation methods may be affected by sample selection and market conditions. 2) Many studies calculating the value of marine fisheries carbon sinks aggregate biological carbon sequestration, particulate organic carbon, and sediment carbon storage into the overall carbon sink amount, factoring in the transaction price. 3) A majority of these studies rely on transaction prices from the European Union (EU) carbon emissions trading market or the China Pilot Carbon Emissions Trading Market to determine the value of marine fisheries carbon sinks. It is crucial to emphasize that carbon sink trading functions as an offset mechanism in carbon emissions trading, and its price may not necessarily align with the carbon emissions trading price. To address the identified shortcomings, this paper initially considers the long-term carbon stock of marine fisheries carbon sinks eligible for carbon trading. Subsequently, it examines the intrinsic value of China’s marine fisheries carbon sinks. The marginal return per unit of such carbon sinks, referred to as the shadow price, is defined and estimated as a factor input through the transcendental logarithmic production function. Disclosing the intrinsic value, or shadow price, of China’s marine fisheries carbon sinks can foster the development and enhancement of the marine fisheries carbon sinks market transaction. Moreover, it can streamline the implementation of the carbon sinks trading mechanism and actualize the ecological value associated with marine fisheries carbon sinks.
2 Methodology
As outlined in the research scope, this paper primarily concentrates on the marine aquaculture industry, specifically targeting at the shellfish and algae aquaculture sectors. The capacity in marine carbon sink fisheries predominantly involves the capacity of carbon sinks for species in algae and shellfish aquaculture.
2.1 Net carbon sinks of aquaculture species in marine carbon sink fisheries
2.1.1 Carbon sinks of algal culture species
Atmospheric carbon is not included in the final carbon stocks. The net primary production from macroalgal growth comprises two components: one portion of macroalgae growth contributes to the biological harvest, where the biomass finds application in the algal industry, including uses such as food additives or direct consumption by consumers, the remaining portion is naturally shed with the fronds during the growth process, forming detritus. Some of this detritus enters the cultivated sea, while the other portion enters the shelf seas. The detritus of algae entering both the shelf seas and cultivated seas actively participates in the oceanic food chain. It undergoes decomposition or mineralization by microorganisms, triggering the release of CO2. A portion transforms into dissolved organic carbon (DOC), stored in seawater, while the remainder becomes particulate organic carbon (POC) and is deposited in cultivated or shelf seas. The combination of dissolved organic carbon (RDOC) and particulate organic carbon (BPOC) form an efficient carbon sink, which is stored over an extended duration and incorporated into the overall carbon stock. A graphical representation illustrates the formation of organic carbon during algal cultivation (Yan et al., 2011) (see Figure 1).
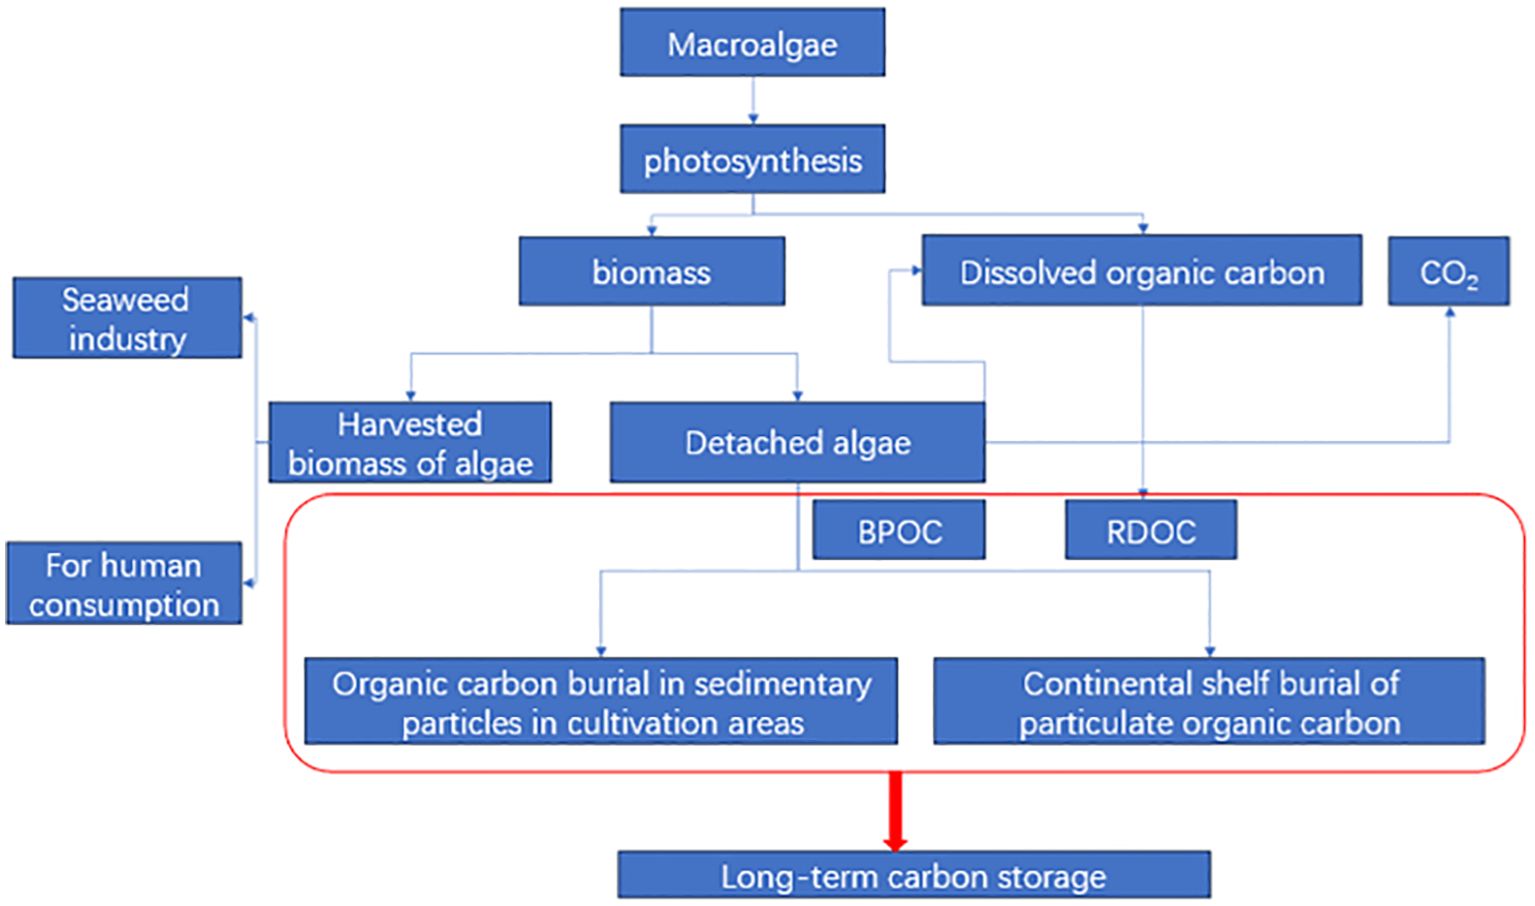
Figure 1. The process of organic carbon formation during algae cultivation.
To summarize, carbon sinks in algal culture species include biogenic sinks in the harvested material, termed removable carbon sinks. Moreover, they comprise the fraction of dissolved organic carbon (DOC) and particulate organic carbon (POC) transported to the water column and sediment. These components are calculated as follows:
In the above equation, represents the total photosynthetic carbon sequestration by algae, and , denotes the biological carbon sink removed by the harvest (Yan et al., 2011).
2.1.1.1 Measurement of biological carbon sinks from the harvests of algal culture species
The amount of carbon sinks removed by algal harvests can be determined based on the mass fraction of carbon in the algal nutrient composition (as indicated in Supplementary Table 1). According to the “Marine Industry Standard of the People’s Republic of China – Methods of Accounting for the Economic Value of Marine Carbon Sinks (Submission for Approval),” the carbon removed by algal culture species is assessed based on specific criteria: the mass fraction of C in wakame (Undaria pinnatifida) is 28.81%, the mass fraction of C in striped purple cabbage(Porphaasp) was 41.96%, in rockweed (Gelidium amansii) is 26.37%, in Tikkang Hedge (Gracilaria verrucosa) is28.4%, in kelp(Laminaria japonica) is about 31.2%, and in other species of algae is 30.36% (The Ministry of Natural Resources, 2022). The production data in the China Fisheries Statistical Yearbook represents the wet weight of algal culture species, and need to be converted to dry weight. The conversion coefficient between wet weight and dry weight for algal culture species is 20% according to the “the Marine Industry Standard of the People’s Republic of China – Methods of Accounting for the Economic Value of Marine Carbon Sinks”. Based on the information provided, the capacity of carbon sequestration resulting from the harvest of various algal culture species (also called the removable carbon sink capacity) can be calculated for the period from 1979 to 2022. The results are presented in Supplementary Figure 1.
2.1.1.2 Measurement of dissolved organic carbon and particulate organic carbon carbon sinks in algal products
2.1.1.2.1 Calculation of carbon sinks, including dissolved organic carbon and particulate organic carbon in kelp
Accounting of carbon sinks, including dissolved organic carbon (DOC) and particulate organic carbon (POC) in kelp, is guided by the China Pacific Society Technical Guidelines for Measuring and Monitoring Carbon Sinks in Kelp Cultivation Projects. The components of kelp-related carbon include buried particulate organic carbon in the cultivated environment, buried particulate organic carbon in the shelf sea environment, and inert dissolved organic carbon. In the cultivated environment, the burial rate of buried particulate organic carbon is 83 grams/m2/year (Li et al., 2007). The particulate organic carbon contributes to the sediment carbon at a rate of 19.5%, as calculated by the formula: Cultivated environment buried particulate organic carbon = kelp culture area × 83 g/m2/year × 19.5%. In the shelf sea environment, large seaweeds typically have a burial rate of 4.6%. The mass fraction of dry weight kelp is 31.2%. The formula for computing the organic carbon content of buried particles in the shelf sea environment is the product of the dry weight of kelp production, 4.6%, and 31.2%. Inert dissolved organic carbon comprises the forms generated through photosynthetic dissolved organic carbon, those resulting from the decomposition of detached kelp, and the contribution of photosynthetic dissolved organic carbon released from kelp, which constitutes 31.4% of the net primary productivity. Seaweed aquaculture exhibits a primary productivity of 2.5 kg/m2/year, with approximately 37.2% of the inert dissolved organic carbon originating from macroalgae through photosynthetic dissolved organic carbon (Gao et al., 2021). The formula for calculating the inert dissolved organic carbon formed by photosynthetic dissolved organic carbon is: Kelp aquaculture area × kelp aquaculture primary productivity of 2.5 kg/m2/year × kelp photosynthetically released organic carbon as a proportion of primary productivity (around 31.4%) × 37.2%. Approximately 19.5% of the inert organic carbon is generated through the decomposition of kelp shedding. The calculation formula is: The dry weight of kelp production × mass fraction of carbon in kelp × 19.5%. Based on the formula provided, dissolved organic carbon (DOC) and particulate organic carbon (POC) in kelp can be calculated for the period from 1979 to 2022. The results are showed in Supplementary Figure 2.
2.1.1.2.2 Measurement of dissolved organic carbon and particulate organic carbon sinks of other algae
Most studies have indicated that the release of dissolved organic carbon (DOC) during the growth of wakame, striped vetch, stonewort, tikkien hedge, and other algal species is typically below 5% (Penhale and Capone, 1981; Jiang et al., 2008). The release of particulate organic carbon (POC) is primarily attributed to dynamic erosion, detritus deposition during the harvesting period, and various other factors. According to a study conducted in the Otsuchi Bay aquaculture area in Japan, the release of POC constitutes around 19% of its photosynthetic carbon sequestration (Anselin, 1988). Given the data presented earlier, the mass ratio coefficients (α and β) for dissolved organic carbon (DOC) and particulate organic carbon (POC), crucial in assessing the algae’s total carbon sink, are determined to be 5% and 19%, respectively. Thus, the carbon sequestration intensity of algae, denoted as, can be inversely calculated using the formula (Yoshikawa et al., 2001) The formulas for DOC and POC in algal culture species are as follows:
The preceding text details the methodology for measuring the carbon sink in Chinese marine fisheries algae farming. This method facilitates projecting the carbon sink of Chinese marine fisheries algae farming spanning from 1979 to 2022, and the results are shown in Supplementary Figure 3.
Macroalgae carbon sinks, categorized as biomass organic carbon, transform CO2 into organic carbon. However, the biological harvesting of fixed carbon, through the consumption of carbon, leads to the reformation of CO2 released back into the atmosphere.
For carbon offset mechanisms, biological carbon storage involves the biological process of isolating carbon from the atmosphere for an extended period, considering short-term carbon sequestration as negligible. Forestry carbon sinks typically have a fixed crediting period of up to 30 years, renewable for a maximum of 20 years, while terrestrial carbon sequestration has a maximum crediting period of 20 years, as established by the basic consensus of the Joint Research Program on Global Fluxes for the oceans (Jiao et al., 2010). Consequently, this study focuses on the carbon sinks eligible for trading on the carbon emissions trading market, emphasizing long-term carbon sequestration while excluding macroalgae biogenic carbon sequestration, i.e., removable carbon sequestration. The comparison between the removable carbon sinks capacity and the carbon sinks for trading (long-term carbon storage) of algae from 1979 to 2022 are shown in Supplementary Figures 4 and 5.
2.1.2 Carbon sinks of shellfish farming species
According to the “Accounting Standards for the Economic Value of Marine Carbon Sinks,” shell-fish are classified as filter-feeding organisms. The carbon sinks produced through filter-feeding during their growth process are bifurcated into two components: one involves the carbon fixed by their shells, and the other pertains to the carbon fixed by their soft tissues. Harvesting shellfish products in mariculture is equivalent to removing CO2 from the seawater. Therefore, the formula for calculating the carbon sink of shellfish aquaculture products is as follows: Fixed C of mariculture shellfish products = Soft tissue C + Shell C.
The soft tissue carbon sink is calculated as: Yield (wet weight) ×wet/dry coefficient × soft tissue mass fraction × soft tissue carbon content factor. According to the carbon sink capacity accounting coefficients of major cultured shellfish products in Chinese waters outlined in the “Accounting Standards for the Economic Value of Marine Carbon Sinks,” the carbon content in the soft tissues of filter-feeding shellfish is typically about 44% of the dry weight of the soft tissues, while the carbon content in the shells is approximately 12% of the dry weight of the shells (see Supplementary Table 2 for the average values of the carbon content). The ratio between the dry weight of shellfish product of soft tissues and their wet weight (dry weight/wet weight), along with pertinent biological parameters, is evaluated following the guidelines outlined in “Accounting for the Economic Value of Marine Carbon Sinks” (see Supplementary Table 2 for specific calculation details). The carbon sink capacity of China’s shellfish aquaculture can be calculated using the above method for the period from 1979 to 2022 and the results are shown in Supplementary Figures 6–8.
2.1.3 Net carbon sinks of aquaculture species in marine carbon sink fisheries
The carbon leakage in marine carbon sink fisheries is predominantly a product of energy combustion, resulting in direct carbon emissions. This phenomenon specifically refers to the carbon dioxide generated through the combustion of diesel fuel used by aquaculture and fishing equipment, and also encompasses carbon leakage arising from algal aquaculture activities reliant on diesel. Based on research data from the China Pacific Society Technical Guidelines for Measuring and Monitoring Carbon Sinks in Kelp Cultivation Projects, the diesel consumption during the kelp aquaculture process is approximately 0.005 tons of diesel per ton of kelp (light dry weight). In 2022, China’s total seaweed production was 1,430,575 tons as reported in the China Fisheries Statistical Yearbook for 2023, leading to a diesel consumption of approximately 7,152.88 tons. The calculation method above is used to assess the carbon leakage of oceanic carbon sink fishery from 1979 to 2022, with the following formula: Net marine fishery carbon sink = long-term carbon storage of marine fishery carbon sinks carbon leakage of oceanic carbon sinks.
In this context, the long-term carbon storage of marine fishery carbon sink is characterized by the aggregate of the long-term carbon storage from algal aquaculture and shellfish aquaculture. Consequently, a graph illustrating the net carbon sink of marine fisheries from 1979 to 2022 can be generated. The net carbon sink of China’s marine fisheries available for carbon sink trading ranges from 77,072.83 tons in 1979 to 1,440,337.623 tons in 2022, with an average annual amount of 673,281.23 tons and an average annual growth rate of 8.14% (as dictated in Figure 2).
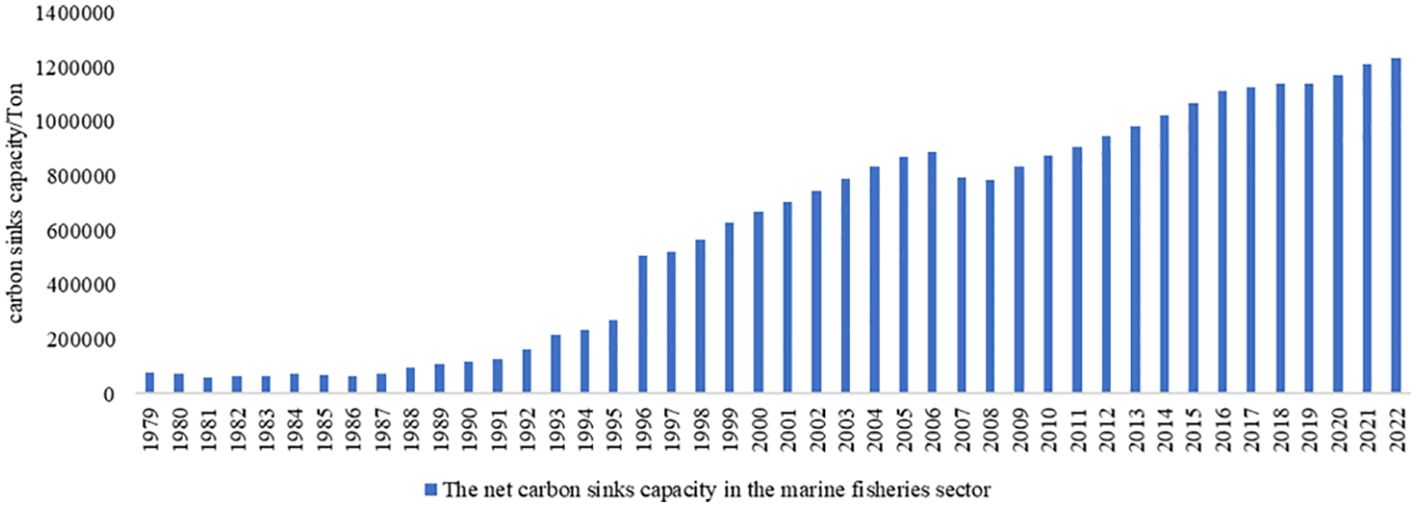
Figure 2. The Net Carbon sinks capacity in the Marine Fisheries Sector from 1979 to 2022.
2.2 Variables selection and data sources
2.2.1 Input indicators
The input indicators of the marine carbon sink fishery production function model mainly include the capital stock of marine carbon sink fishery, labor force in marine carbon sink fishery, and the capacity of carbon sink in marine carbon sink fishery (see Table 1).
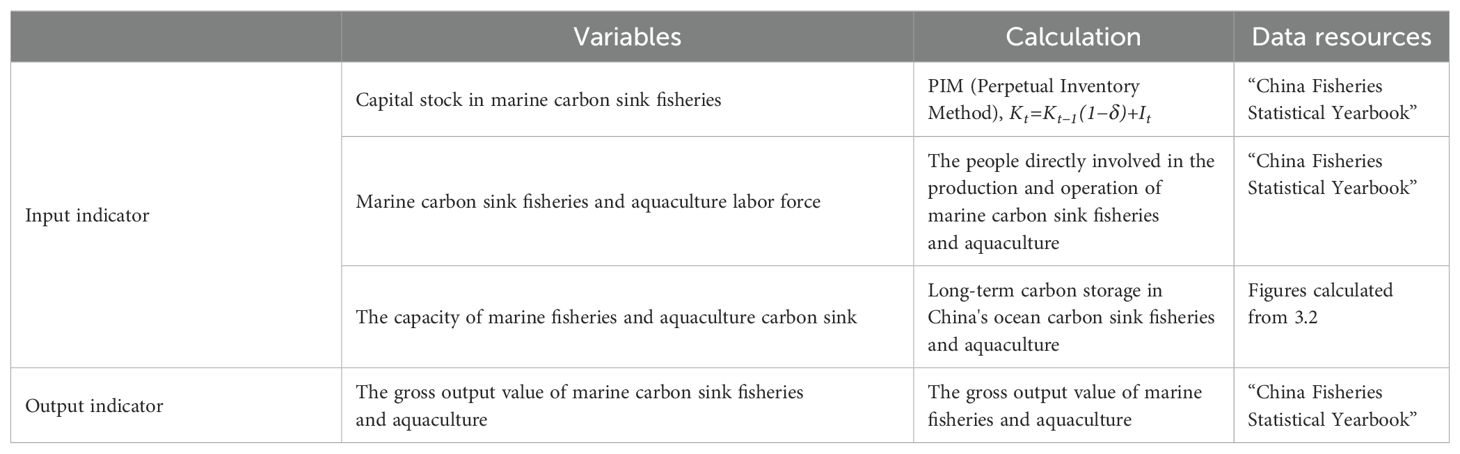
Table 1. Variables selection and data sources.
2.2.1.1 The capital stock in marine carbon sink fishery
The capital stock of marine carbon sinks cannot be directly obtained from the statistical yearbook. Therefore, fixed asset investment is used as a substitute for the capital stock due to the unavailability of direct data. This study employs the internationally recognized measurement method Perpetual Inventory Method(PIM) (Zhang, 2020).
The fixed asset investment for marine aquaculture is obtained from the following statistical sources:
The fixed asset investment data for marine aquaculture, employed in estimating the capital stock, is adjusted to comparable prices, with 1990 as the base year. The fixed asset investment price index is derived from the “China Fisheries Statistical Yearbook” under “Fixed Asset Investment Price Index” from 1979 to 2023.
• The labor force in marine carbon sink fishery
The labor force in marine carbon sink fishery refers to individuals directly involved in the aquaculture production and business activities of marine carbon sink fishery. In this study, the quantity of labor force in marine carbon sink fishery is represented by “Employed persons in aquaculture” under “Population and labor force in marine fisheries in various regions” in the “China Fisheries Statistical Yearbook.”
• The capacity of carbon sink in Chinese marine carbon sink fisheries
This paper focus on calculating the shadow price of the long-term carbon sink per unit, where the long-term carbon sequestration is considered as an input indicator in the estimation of the capacity of carbon sink for Chinese marine carbon sink fisheries.
2.2.2 Output Indicators
In this study, the gross value of the fishery output from the ocean carbon sink was selected to represent the output of the production function. The gross output value of marine carbon sink fishery refers to the total output value of fisheries production activities in the fisheries sector, which can serve as a carbon sink and contribute to the direct or indirect reduction of atmospheric carbon dioxide concentration. This paper employs the gross output value of marine fishery to represent the gross output value of marine carbon sink fishery. Specifically, the “national total economic output value of fishery – marine fishery” figure from the “China Fisheries Statistical Yearbook” is utilized as an indicator for the gross output value of marine carbon sink fishery. In this paper, the gross value of marine fishery is employed to represent the gross value of marine carbon sink fishery (see Table 1).
2.3 Models
2.3.1 Model setting
The production function refers to the quantitative dependency relationship between a certain combination of input factors in the production process and their maximum possible output under constant technical conditions. (Kang, 2018) The Cobb-Douglas (C-D) production function is primarily applicable to scenarios with only a single output and two input factors, featuring a substitution elasticity of 1. When the substitution elasticity of each input factor is not equal to 1, the C-D function becomes ineffective. Additionally, the premise of the C-D production function is that technological progress is neutral. The transcendental logarithmic production function model, however, can effectively overcome the assumption of Hicks neutral technological progress, (Yan et al., 2011) making it more consistent with real-world conditions by considering the interactions and substitution effects among factors. Therefore, the transcendental logarithmic production function model is selected to estimate the price of marine fishery carbon sinks This study attempts to introduce the amount of marine fishery carbon sinks as an input factor into the production function, expressed as:
Here, represent the output elasticities for capital, labor, and marine fishery carbon sinks, respectively. The technological change is expressed as a time trend, given by: .
After taking the logarithm of all variables, the transcendental logarithmic production function model is established as follows:
represent the coefficients for the logarithm of the labor force in marine carbon sink fishery, the capital stock in marine carbon sink fishery, the capacity of carbon sink in marine fishery, the cross term of labor force and the capacity of carbon sink, the cross term of the capital stock and the capacity of carbon sink, the cross term of the capital stock and the labor force, the square term of the logarithm of the capacity of carbon sink, the square term of the logarithm of labor, and the square term of the logarithm of capital stock, respectively. Taking the derivative of Equation 5, we get:
By rearranging both sides of Equation 6, the following can be obtained.
By rearranging both sides of Equation 6, the following can be obtained.
According to the theory of determining factor prices based on marginal productivity, the shadow price of carbon sink in marine fisheries is equal to the marginal productivity of carbon sink in marine fisheries, as expressed in Equation 8.
In the above Equation 8, the model (5) is estimated through a regression model. If the model is significant, the parameters are tested through statistical tests. The estimated values of model parameters are then substituted into Equation 8 with to deduce the shadow price of carbon sink in marine fisheries.
2.3.2 Model testing
2.3.2.1 Unit root test
The Augmented Dickey-Fuller (ADF) test was utilized, the outcomes of the test are outlined in Supplementary Table 3. It indicates that the P-value for each variable is below 5%, surpassing the critical value of 1%. As a result, the initial hypothesis is rejected. It is inferred that there is no unit root in the original series, signifying its stationary nature. Subsequently, further regression analysis can be conducted on the original series.
2.3.2.2 Sequential autocorrelation test
With a tested P-value of 0.0723, exceeding the critical value of 5%, the absence of serial autocorrelation can be inferred.
2.3.2.3 Multicollinearity test
The transcendental logarithmic production function offers several advantages over the traditional C-D production function. However, due to its inclusion of squared terms of the variables and their cross terms, there may be a more serious issue concerning multicollinearity. The significant linear correlation could render the regression coefficient values inconsistent with economic theory, thereby introducing inaccuracies to the regression results (Zhang and Shen, 2021). Hence, it is essential to test for the presence of multicollinearity. In this study, the VIF value (variance inflation factor) is selected for evaluation. The results are presented in Supplementary Table 4. It reveals that the VIF values for each variable exceed 10, and the average VIF value is also greater than 10. Therefore, it can be inferred that there is substantial multicollinearity among the variables in the model. Performing direct regression under these conditions would yield parameters with significant variance, rendering the regression results unreliable. It cannot be directly applied in the ordinary least squares regression method.
2.3.3 Ridge regression estimation and statistical tests of the model for ridge value K = 0.1
To ensure the validity of the model estimation results, it is necessary to eliminate the problem of multicollinearity and employ the ridge regression estimation method for fitting. Ridge regression modeling was conducted using SPSS. To more intuitively observe the optimal K value in the regression equation, ridge trace plots and goodness-of-fit plots are created, as shown in Figures 3 and 4. When K=0.1, the standardized regression coefficients of the variables remain stable, and the regression results are presented in Table 2. As shown in Table 3, when K=0.1, the model exhibits a decidability coefficient of 0.9626 and a modified decidability coefficient of 0.9528. This suggests that the regression equation fits very well. The model’s significance test statistic F is 97.45, indicating that the model constructed in this study passes the statistical test. Additionally, the Sig F value is 0.0000, indicating the excellent nature of the model.
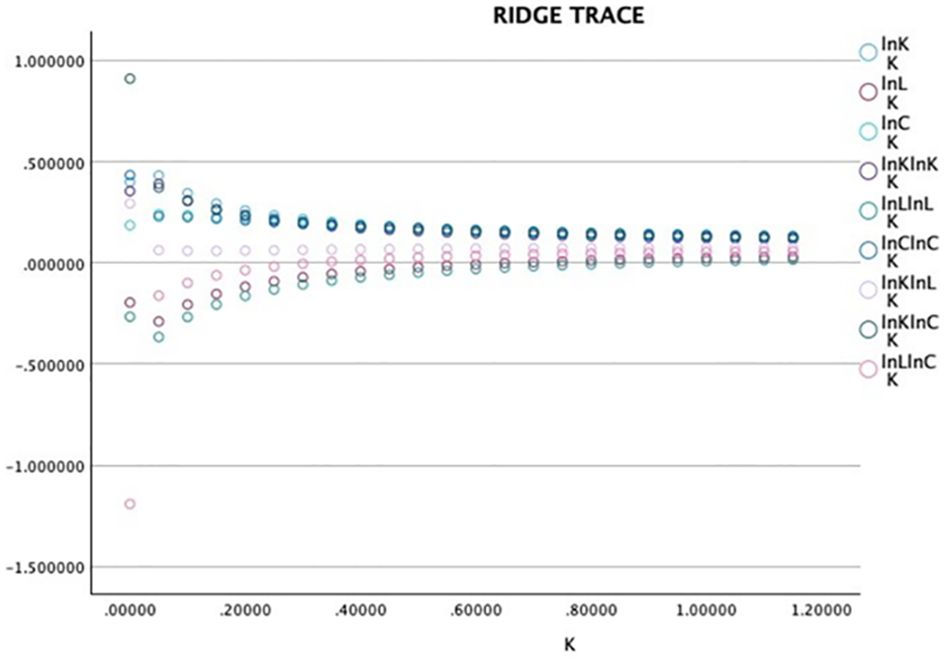
Figure 3. The ridge trace plots for each variable in the model /graphical representation of ridge traces for individual variables in the model.
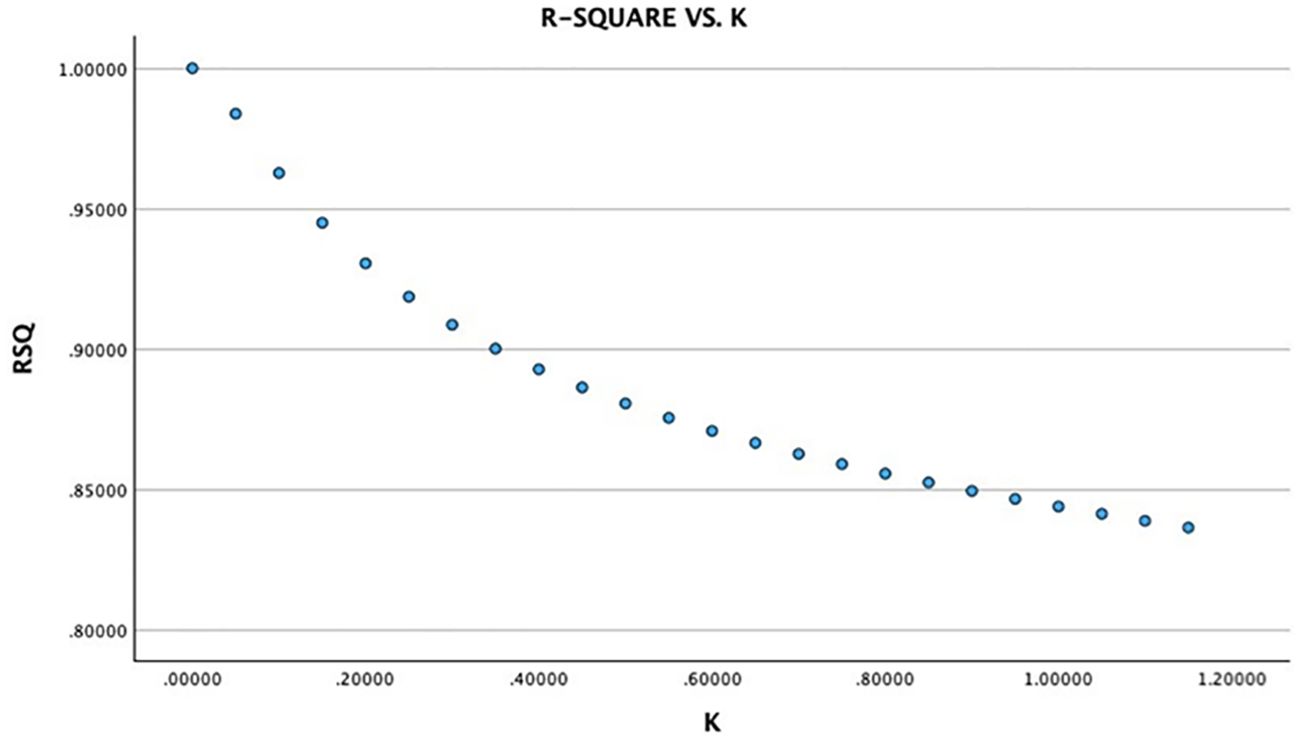
Figure 4. The model goodness-of-fit at different ridge trace values.
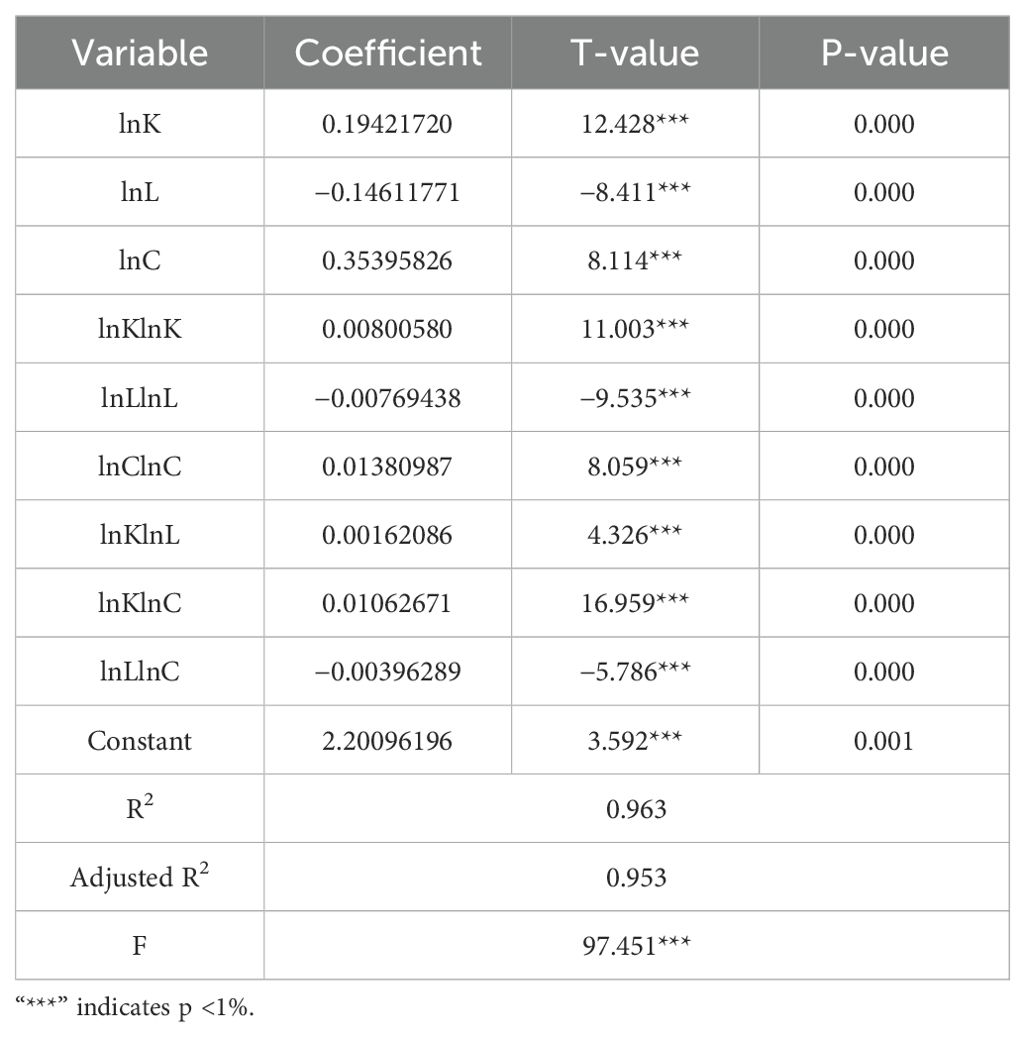
Table 2. The ridge regression coefficients and results of significance testing.
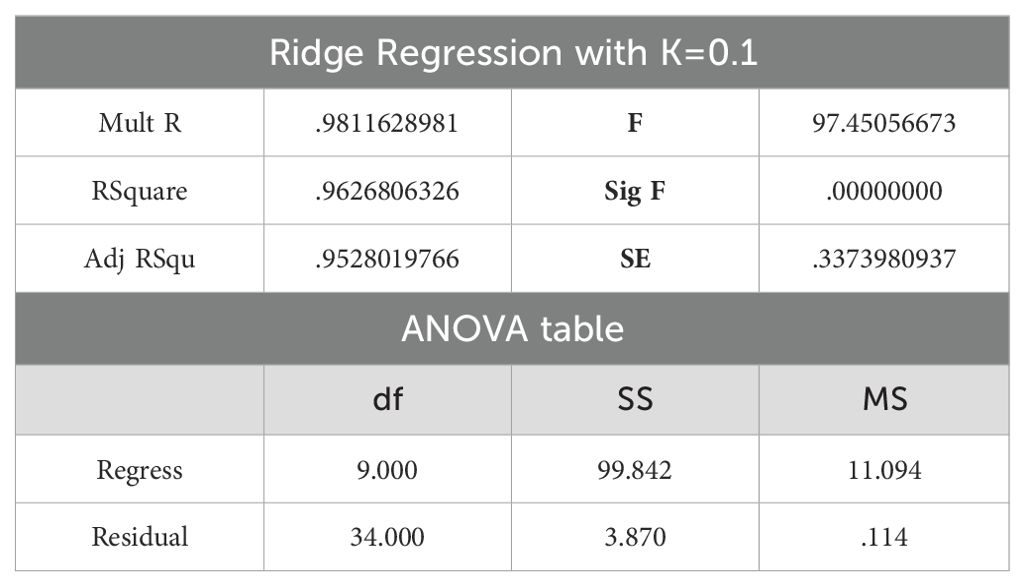
Table 3. Significance test results for ridge regression equation.
Consequently, the shadow price of China’s marine fisheries carbon sinks, calculated by substituting the estimated parameter values into Equation 8, is more reliable. The standardized ridge regression equation is obtained by substituting values from Table 3 into model Equations 5 and 9. The transcendental logarithmic production function can be expressed as follows:
The standardized coefficients for the regression model, derived from Equation 9, are then transformed to obtain coefficients for the original data. Based on the regression results, a relatively stable long-term equilibrium relationship exists among the labor force of marine carbon sink fishery, the capital stock marine carbon sink fishery, the capacity of marine fishery carbon sink, and the total output value of the marine carbon sink fishery. The regression coefficients of ocean carbon sink fishery capital stock and ocean carbon sink fishery carbon sink are positively and significantly correlated at the 1% level, indicating their positive role in promoting the economic growth of marine fishery. However, the regression coefficients of labor force in the marine carbon sink fishery are negatively and significantly correlated at the 1% level.
This phenomenon can be attributed primarily to the protective measures implemented for the offshore ecological environment and fishery resources, leading to a reduction in the cultivation area. Consequently, the original labor force engaged in fishery production gradually transfer to other industries, with some individuals taking up seasonal part-time work. The analysis of labor force data in this study indicates a gradual decline in the number of fishery employees, supported by a negative correlation revealed in the correlation test between the two variables.
Despite the decline in the labor force of marine carbon sink fishery, the economic growth of the marine fishery has not been significantly impacted. Additionally, aquaculture production has increased annually. This growth can be attributed to the continuous improvement of China’s marine fishery aquaculture technology, reducing the reliance on the number of traditional marine fishery labor forces to a certain extent. Simultaneously, with the improvement of China’s economic industrialization, some labor force engaged in marine fisheries have shifted to other industries. These factors have contributed to the negative correlation between the two variables. The squared terms of marine fishery capital stock and the capacity of marine fisheries carbon sinks are significantly correlated at the 1% level, suggesting increasing returns to scale. Furthermore, the cross terms of marine fisheries capital stock and marine fisheries carbon sinks, as well as marine fisheries labor force and marine fisheries carbon sinks, are also significantly correlated at the 1% level, indicating their roles in promoting the economic growth of the marine fishery industry.
3 Results
3.1 Prices of marine carbon sink fisheries in China
The coefficients necessary for calculating the shadow price of carbon sinks in China’s marine fisheries can be obtained through the ridge regression estimation and significance testing of the model parameters. These values are presented in Table 4.
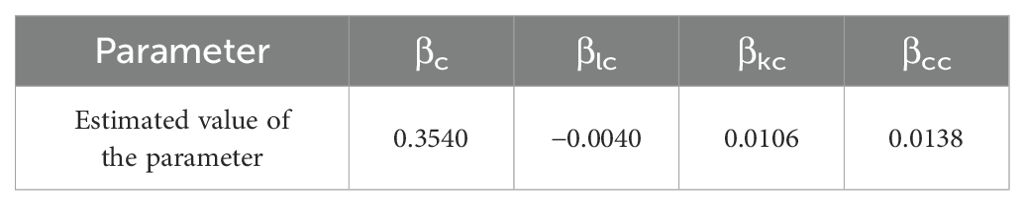
Table 4. The estimated values of βc, βlc, βkc, and βcc.
Equation 10 can be derived to obtain the accounting equation for the price of marine fisheries carbon sinks, presented as follows:
By utilizing Equation 11 and substituting the data for the gross value of marine fisheries, the capacity of marine fisheries carbon sinks, the labor force in marine carbon sink fisheries, and the capital stock in marine fisheries for the years 1979–2022, and the prices of marine fisheries carbon sinks for the corresponding period can be determined. The relevant information is detailed in Table 5.
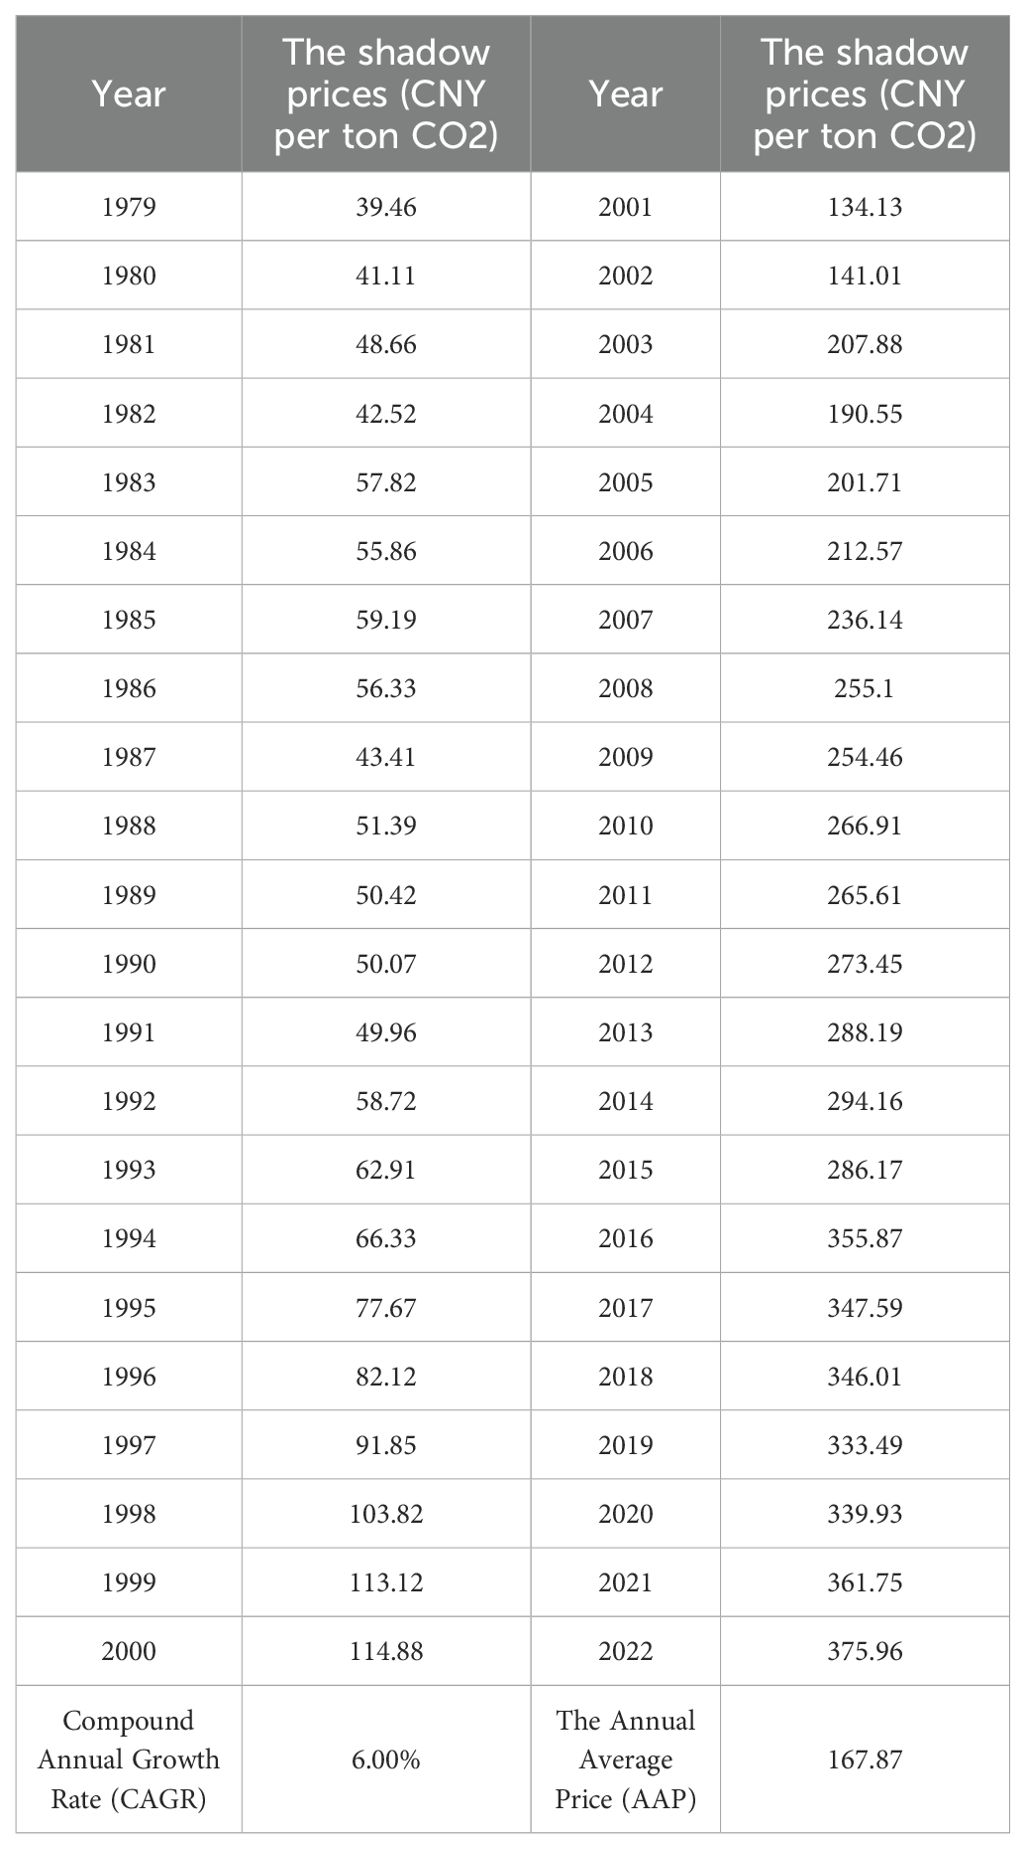
Table 5. The shadow prices of carbon sinks in China’s marine fisheries from 1979 to 2022.
To better observe the trend in the shadow price development of China’s marine fisheries carbon sinks, the trend graph illustrating the changes from 1979 to 2022 can be derived from the data presented in Figure 5.
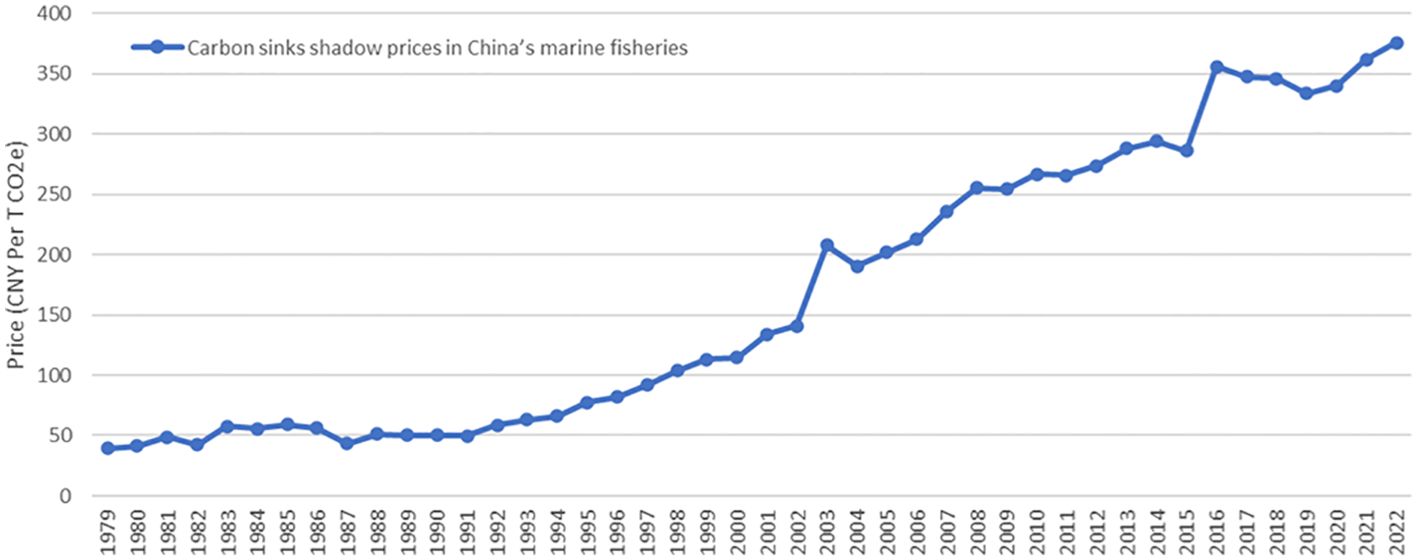
Figure 5. The trend chart illustrating the temporal evolution of carbon sinks shadow prices in China’s marine fisheries from 1979 to 2022: a trend analysis.
It can be revealed from the trends in Figures 5–7, that between 1979 and 1990, the price of China’s marine fisheries carbon sinks exhibited slow and steady growth, with slight fluctuations in individual years. From 1990 to 2006, there was an overall upward trend in the price, accompanied by slight fluctuations. This trend aligned with the period when China’s marine aquaculture area surpassed the annual growth rate. Between 2007 and 2015, the price growth gradually decelerated, coinciding with fluctuations in aquaculture area.
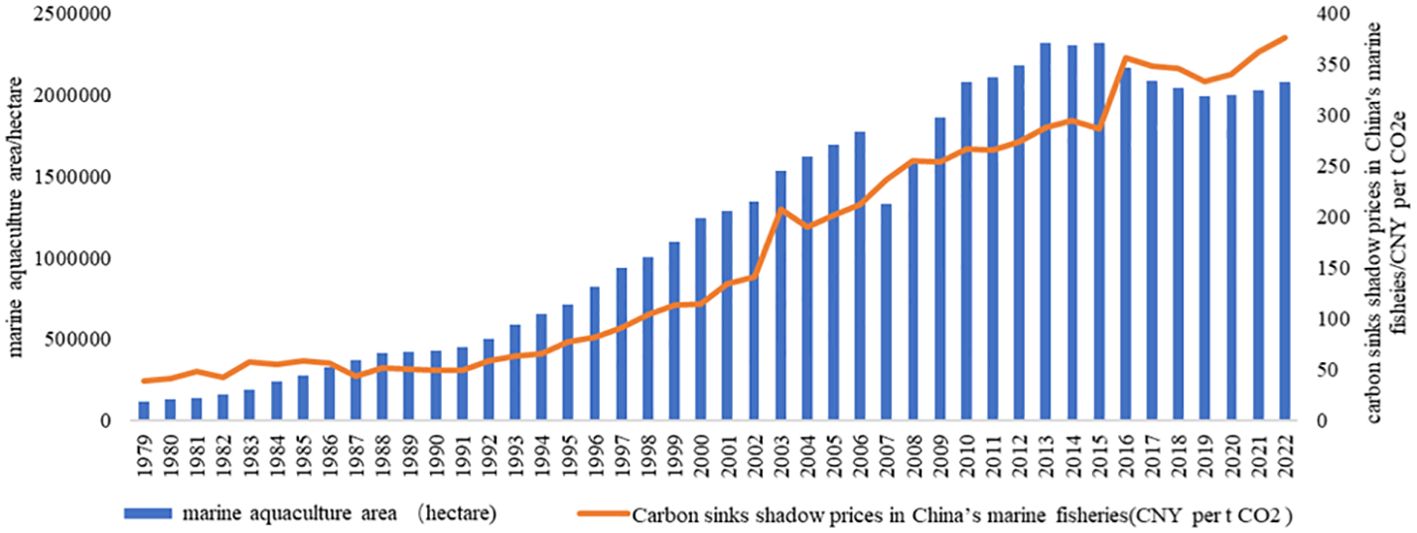
Figure 6. Temporal trends in the area of marine aquaculture and carbon sequestration shadow prices in China from 1979 to 2022.
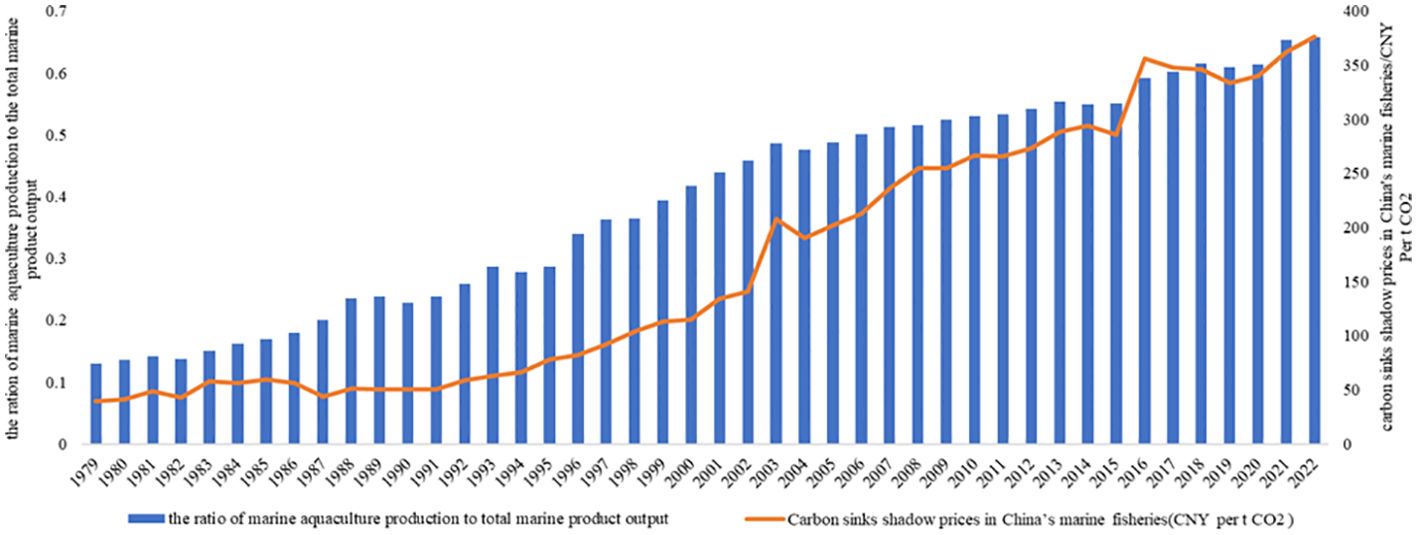
Figure 7. Temporal trends in the ratio of marine aquaculture production to total marine product output and carbon sequestration shadow prices in Chinese marine fisheries from 1979 to 2022.
Between 2007 and 2015, there was a gradual slowdown in price growth, accompanied by fluctuating and increasing price in aquaculture area. This was attributed to the decline in offshore fisheries and aquaculture resources, prompting a reduction in aquaculture area for conservation purposes. Nevertheless, aquaculture production did not experience a significant decline. In 2007, China initiated specific law enforcement, cleanup, and rectification efforts for sea-based aquaculture. The area of seawater aquaculture in both 2007 and 2008 was markedly smaller than that in 2006. From 2015 to the present day, the price continues to grow, albeit at a slower growth rate. This is in contrast to the fluctuating changes in aquaculture area, where aquaculture production has persisted in its growth trajectory due to intensified aquaculture practices and advancements in aquaculture technology. The trend in the change of shadow prices closely aligns with China’s mariculture production, particularly regarding the proportion of mariculture production, and exhibits similarity to the changing trend in changes in seawater aquaculture area. This, to some extent, supports and validates the credibility and reasonability of the shadow prices calculated in this study. China’s mariculture production and area have both experienced annual increases, with an average growth rate of 10.47% and 7.32%, respectively. Shellfish aquaculture dominates the mariculture industry, yet its share in over-all mariculture production is decreasing. Algae aquaculture, on the other hand, maintains stability and is on the rise. Presently, China’s sea-based mariculture area is undergoing sluggish expansion and approaching saturation, influenced by the near-shore environment and competition from other sectors. While the data indicate slow growth in mariculture area, the demand for mariculture remains robust. Furthermore, the advancement of deep-sea aquaculture presents significant potential for expanding mariculture space.
3.2 Comparison of the price of marine fisheries carbon sinks in China, EU CDM primary market for CER trading, and EU-ETS market
Supplementary Table 5 illustrates the computation of the annual trading average price through dividing the annual trading amount of carbon emissions by the annual trading volume. To facilitate comparisons, we analyze the disparity between the shadow price of marine fishery carbon sinks in China and the average prices in both the EU CDM primary market for CER trading and the EU-ETS market. Figure 8 presents trend graphs based on the data in Supplementary Table 5, depicting changes in the shadow price of marine fishery carbon sinks, the average price of CER in the EU CDM primary market, and the average price of the EU-ETS market from 2005 to 2022.

Figure 8. Comparative Trends in Carbon sinks shadow prices in China’s marine fisheries, average European Union Allowance (EUA) in European Union Emissions Trading System (EU-ETS) and average trading prices in Primary market Certified Emission Reduction(CER) of European Union Clean Development Mechanism Market(CDM), Denominated in Chinese Yuan(CNY).
The trend graph in Figure 8, depicting changes in the average price of CERs in the primary market and the EU-ETS market, reveals that the price of China’s marine fisheries carbon sinks initially exceeds that of CDM market CERs and EU-ETS trading. However, in subsequent periods, the EU-ETS trading price surpasses that of marine fisheries carbon sinks, and the carbon price undergoes a substantial increase owing to enhancements in the carbon emissions market trading mechanism and the global economic recovery.
An examination of the trend chart reveals that during the trial period of 2005–2007, influenced by market dynamics the EU carbon trading price, established an initial carbon price of approximately 20 euros per ton, gradually increasing to around 30 euros. During the period of 2008–2012, characterized by a decline in carbon price volatility attributed to the financial crisis, economic growth slowdown, and subsequent decline in energy consumption, European enterprises had lower emissions, which highlighted the issue of quota surplus. Consequently, the carbon price, which was nearly 30 euros in 2008, experienced a sharp decline, falling below 10 euros and fluctuating down to 7 euros in 2012. During the period of 2013–2017, carbon prices experienced a decline, attributed to a substantial surplus of cumulative quotas. This issue accentuated the decline in carbon prices, causing it to drop from nearly 30 euros in 2008 to below 10 euros, fluctuating down to 7 euros in 2012. The period of 2018–2020 marked a rebound in carbon trading prices, influenced by policy factors. After 2018, the carbon price experienced a sharp rise, surpassing 20 euros. Following the outbreak of the epidemic, the carbon trading price temporarily fell back to 15 euros and resumed its ascent. From 2021 to the present, there has been a continuous climb in carbon prices, reaching new highs. In 2021 alone, it surged from 33 euros to a peak of 90 euros. In 2022, the carbon trading price has sustained a high level of operation, reaching a peak of 99.2 euros on August 19, 2022. This peak is 400% higher than the initial establishment of the EU carbon market. It is evident that in the first three periods, the surplus of quotas in the EU carbon market contributed to the downturn in carbon trading prices. In subsequent periods, the EU took measures to address the excess quota and bolster market confidence through carbon market reforms. From 2014 to 2016, the EU implemented a discount auction mechanism, to reduce quotas by 900 million tons. In 2018, the EU introduced the carbon market stabilization reserve mechanism (MSR) to stabilize the carbon price. This mechanism played a crucial role in supporting the stability of carbon trading prices during the epidemic. Simultaneously, Europe’s Green New Deal strengthened climate targets. In 2021, the EU enacted the legislation to elevate the 2030 emission reduction target from 40% to 55%. Furthermore, the European Commission’s Carbon Market Reform Program in 2022 suggested increasing the 2030 emission reduction target from 43% to 61% in the areas covered by the carbon market. This development has emerged as a long-term driver for the increase in carbon prices.
China’s unified carbon emissions trading market commenced in 2021, having been established just over two years ago and covering a limited number of industries, specifically the thermal power industry. As a result, a stable and balanced market trading price has not fully materialized. The EU carbon market reveals that the future carbon emissions trading market’s carbon trading price is expected to exceed the shadow price of marine fisheries carbon sinks. This implies that the realization of the intrinsic value of marine fisheries carbon sinks is possible through market transactions. Drawing insights from the changes in the EU carbon trading price, it becomes evident that mature and stable coverage across a wide range of areas in the carbon trading market is crucial for realizing the value of marine fisheries carbon sinks. According to the price trend of Certified Emission Reductions (CERs) in the EU Clean Development Mechanism (CDM) market during the second trading period of the EU, the fluctuation of CER futures mirrored that of EU Allowance (EUA) futures during this period, international carbon emission reduction projects facilitated applications, and the volume of issued projects displayed a growth trend emission control enterprises commenced acquiring significant quantities of carbon emission reduction projects to offset their carbon allowances, thereby contributing to the upsurge in the price of CER futures in the first half of 2008. Following the time, the price of CER futures increased. However, due to the impact of the global economic crisis, the price of carbon in the EU sharply declined, leading to a subsequent drop in the price of CER futures. Upon entering the third trading period, market expectations regarding the price of CER futures declined. The EU implemented strict restrictions on the quantity of CER offsets and the types of CER projects, resulting in a decrease in the price of CERs and the volume of trading (Zhang et al., 2013).
In 2021, the European Union imposed restrictions on Clean Development Mechanism (CDM) trading exclusively to the least developed countries. Simultaneously, it mandated the adoption of the novel international emission reduction mechanism stipulated by the Paris Agreement for carbon offsets. This marked a pivotal shift in the EU’s approach to carbon trading. Consequently, the EU opted to discontinue the utilization of established international emission reduction credits, including Certified Emission Reductions (CERs), for offsetting carbon emissions within its carbon emission trading system. This strategic decision resulted in a virtual standstill within the CER market trading, reflecting a significant impact on the carbon offset landscape in the EU.
3.3 Distortions of factor prices of carbon sinks in China’s marine fisheries
This section investigates the absolute distortion of the price of carbon sink factors in marine fisheries, specifically examining how the market price in China deviates from the opportunity cost or shadow price (marginal productivity).
Assuming k denotes the degree of deviation, its mathematical expression is provided by Equation 12:
In the formula, if k = 1, it denotes that the price of the carbon sink in China’s marine fishery is deemed reasonable; otherwise, it indicates distortion. A higher degree of deviation from 1 reflects a more significant distortion in the pricing of China’s marine fishery carbon sinks.
Supplementary Table 6 displays the average prices of Certified Emission Reductions traded in China during the period from 2015 to 2022. By substituting the relevant data from Supplementary Table 6 from 2015 to 2022 into Equation 12, the degree of distortion in the price of carbon sink factors in China’s marine fisheries is calculated, as illustrated in Table 6.
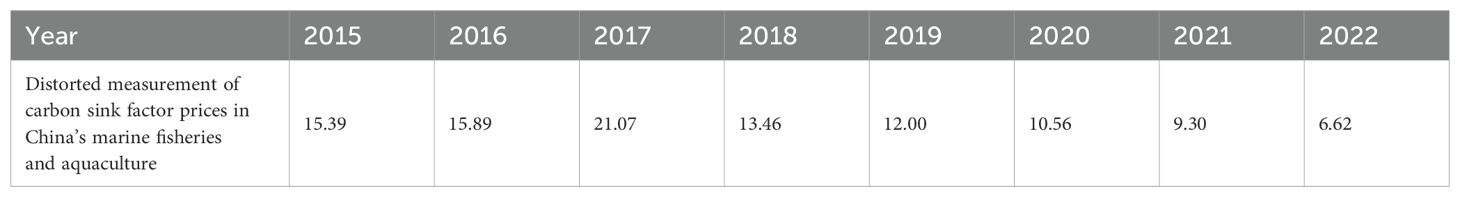
Table 6. Results of distorted measurement of carbon sink factor prices in China’s marine fisheries.
Table 6 reveals that from 2015 to 2022, the prices of China’s marine fisheries carbon sink factors exhibit varying degrees of distortion, with 2015 experiencing severe distortion. Overall, the degree of distortion in China’s marine fisheries carbon sink factor decreases annually, reaching 6.6 by 2022. In reality, China reinitiated the voluntary emission reduction market on October 19, 2023 (Regulations for the Administration of VoluntaryGreenhouse Gas Emission Reduction Trading (for Trial Implementation), 2022). After September 2023, carbon sink prices surged to new highs, reaching 103 CNY/ton at one point, indicating robust demand and an optimistic future value. It is evident that in the initial stages of the voluntary emission reduction market, lack of knowledge related to CDM projects and other factors jointly contributed to low project prices and significant distortion of factor prices. As China establishes its own carbon market and engages in carbon trading, the degree of distortion in the factor price of China’s marine fisheries carbon sinks is gradually decreasing each year. Consequently, the equilibrium of factor prices for carbon sinks in China’s marine fisheries can only be achieved through market trading.
3.4 Economic effects of factor price distortions of carbon sinks in China’s marine fisheries
Pervious research has predominantly investigated the economic impacts resulting from the distortion of factor prices, focusing on allocation efficiency, technological progress, welfare and income (Jones, 1971; Kumbhakar and Bhattacharyya, 1992; Magee, 1973). In extending these relevant analytical approaches, this study integrates the distinctive features of marine fisheries carbon sink factors to evaluate the economic consequences of price distortion in China from two perspectives.
On one hand, the distortion of carbon sink prices in China’s marine fisheries results in inefficient resource allocation. Due to the distorted prices of fishery carbon sinks, the participation cost for domestic suppliers in China becomes markedly lower than their intrinsic value. This diminishes the incentives for suppliers to engage in carbon sink trading. The industry’s limited awareness of participating in carbon trading exacerbates the problem. Suppliers, including algae farmers and shellfish farmers, may neglect the ecological value, prioritize the value of harvested goods, adopt environmentally detrimental production methods to boost goods’ value, and expand planting areas indiscriminately. When pollution reaches a certain threshold, it consequently impedes economic development.
On the other hand, distortions in the price of fisheries carbon sinks directly impact the benefits of carbon sink trade. These distortions result in a decline in terms of trade and economic losses for suppliers of carbon sinks rather than an improvement in welfare. The distorted prices lead to carbon sinks being traded at levels significantly below the shadow price, thereby limiting market transactions. In March 2022, China established the Hainan International Carbon Emission Trading Center, prioritizing the market-based trading of marine carbon products to facilitate both the reduction of total carbon emissions and incremental energy consumption. Notably, the distortion in the prices of fisheries carbon sink factors evidently hamper the progress of international trade in marine carbon sinks.
4 Discussion
4.1 Discussion
The oceans, as a vital ecosystem on Earth, play a crucial role in absorbing and sequestering the majority of carbon dioxide, thereby establishing themselves as the largest carbon reservoir on the planet. Scientific studies affirm that the oceanic carbon sinks pivotal in mitigating climate change, serving as a complementary approach to energy conservation and emission reduction strategies.
Global climate change stimulates the research and development of marine carbon sinks, which actively explores the ecological carbon sink trading price mechanism within marine fisheries to realize the ecological value of marine carbon sink fisheries. The study, draws on the data from the China Fishery Statistical Yearbook, (which is current through 2022, hence terminating the sample in that year)to calculate the pricing dynamics of China’s marine carbon sink fishery spanning the years 1979 to 2022, employing pertinent data sourced from the field of marine carbon sink fisheries. The price derived from the transcendental logarithmic production function does not align with the prices established in the actual carbon trading market. Rather, it signifies the value contributed by marine fishery carbon sinks as a production factor invested in the production of carbon sink fishery. This represents the price determined by the marginal productivity of the marine fishery carbon sink factor. Such information holds significance for the government in formulating price promotion policies, serving as a reference for initiatives aimed at fostering the trade of marine fishery carbon sinks. The paper introduces a measurement method for the shadow price of China’s marine fishery carbon sinks. Utilizing this approach, additional insights can be gained into the shadow price of China’s marine fishery carbon sinks and the degree of distortion in the pricing of China’s marine fishery carbon sink factors in the year 2023. Such information is of considerable importance for advancing the implementation of ecological carbon sink trading in China.
4.2 Policy implication
The preceding analysis indicates that the distortion in the pricing of carbon sink factors in China’s marine fisheries not only hinders the development of the marine carbon fishery industry but also results in the inefficient allocation of marine carbon fisheries resources. In light of the ongoing efforts to propel China’s fishery industry towards high-quality, it is imperative to facilitate green, and low-carbon development, while rectifying the distortion in the prices of carbon sink factors in marine fisheries.
4.2.1 Strengthening the dynamic monitoring system for carbon sink resources in marine fisheries and establishing the related asset accounting and management system
Accelerating the development of a dynamic monitoring system for carbon sink resources in marine fisheries is imperative. An organized and unified national survey should be conducted to promptly monitor variations in marine fisheries resources in regions such as the Bohai Sea, Yellow Sea, East China Sea, and South China Sea, utilizing data from natural resource investigations. Different marine regions exhibit distinct types, quantities, and qualities of carbon sink resources due to their diverse marine ecosystems. Consequently, diverse accounting methods and standards for carbon sink resources in various marine regions need to be established. Region-specific accounting methods can facilitate the exploration of carbon sink market transactions for local marine fisheries, thereby providing a basis for calculating the ecological value of marine fisheries carbon sinks. Furthermore, expediting the research and refinement of methodologies for marine fisheries carbon sink assessment and promptly establishing a comprehensive project methodology system that encompasses all marine fisheries carbon sink resources is crucial.
The construction of a standardized system for the ecological asset accounting of marine fisheries carbon sink resources should be prioritized. This necessitates elucidating asset accounting approaches, standards, and other relevant factors. Additionally, expedited progress should be made in the surveys and registration processes to ascertain the quantity, distribution, products, quality, as well as the development and utilization status of marine fisheries carbon sink resources. Simultaneously, efforts should be accelerated to improve the investigation of marine fisheries carbon sink resources, establish a dynamic monitoring system, and construct a comprehensive database. The gradual establishment of a nationally unified accounting and monitoring system for marine fisheries carbon sink resources will serve as a foundation for the development of a nationwide carbon sink resource market. To achieve this, it is essential to formulate a systematic and comprehensive set of norms and standards for monitoring, reporting, and verification of marine fisheries carbon sink projects, aiming to gain international consensus. Moreover, a unified and authoritative mechanism should be established for the publication and sharing of information on the monitoring, reporting, accounting, and evaluation of marine fisheries carbon sink resources.
4.2.2 Establishing the legal framework for marine fisheries carbon sink and improving the regulatory mechanism for carbon sink resource market transactions
Firstly, accelerating the establishment of a property rights system for marine fisheries carbon sink resources is crucial. This involves clarifying ownership entities and delineating the objects of ownership while exploring incentive mechanisms for property rights. Legally defining the rights of marine fisheries carbon sink resource owners is essential while maintaining state ownership of natural resources. This includes delineating the boundaries between ownership and usage rights, clarifying the attribution of rights such as usage, transfer, and profit, as well as their segmentation and circulation. Moreover, local governments should be encouraged to explore and establish incentive mechanisms for the protection and restoration of marine fisheries carbon sink resources. Such initiatives can attract private investors and social capital to participate in the protection and restoration of marine fisheries carbon sink resources through the development of demonstration projects like marine ranching. This would increase the supply of marine fisheries carbon sink resources and create conditions for realizing their value.
Secondly, it is essential to establish clear and systematic market trading rules, including trading entities, trading methods, trading management, pricing rules, and legal responsibilities. These rules are fundamental to market transactions and are crucial for ensuring the operation and stability of the marine fisheries carbon sink market.
Lastly, from a national strategic perspective, it is necessary to develop medium- and long-term plans for establishing an ecological carbon sink market mechanism, along with implementing standard-setting and supervision tasks.
4.2.3 Improving the national unified ecological carbon sink trading market in China and establishing the carbon trading future market
As of January 22, 2024, the voluntary emission reduction market has been relaunched. Establishing a unified carbon sink trading market and enhancing the trading mechanism are essential for achieving price discovery and fully leveraging the market’s regulatory functions. This provides valuable references for stakeholders involved in marine fisheries carbon sinks. The market price in carbon sink trading reflects the current supply and demand situation, but it does not account for future supply and demand conditions or price trends. Futures trading is beneficial for establishing reasonable prices and predicting future supply and demand scenarios as well as price trends. Additionally, futures trading aids in price discovery and risk mitigation. Through continuous financial innovation, establishing an ecological carbon sink futures trading market can provide relevant stakeholders in marine fisheries carbon sink trading with prices, thereby promoting more reasonable carbon sink trading prices.
5 Conclusion
The study yielded the research conclusions following the conducted analysis.
The proposal of the shadow price and its calculation holds great significance in determining the reasonable price of marine fishery carbon sinks and their real value by analyzing relevant literature on pricing. The shadow price of China’s marine fisheries’ carbon sinks is modeled by establishing a transcendental logarithmic production function. The final model for the shadow price is derived through this process. The shadow price of China’s marine fisheries carbon sinks for the period 1979 to 2022 is calculated through parameter estimation and significance testing of the model.
Utilizing the gross output value of China’s marine fisheries from 1979 to 2022 as the independent variable and the labor force, capital, and carbon sinks of marine fisheries as the dependent variables, the accounting equation for the price of marine fisheries carbon sinks is deduced. This derivation is grounded in the theory of marginal productivity, the concept of shadow price, and the transcendental logarithmic production function model. The annual price of marine fisheries carbon sinks is determined through ridge regression analysis. The study discloses that from 1979 to 2022, the price of carbon sinks in China’s marine fishery sector displayed an ascending trend, with fluctuations in certain intermediate years. The geometric average annual growth rate over the 44-year period is 6.00%, resulting in an average price of 167.87 CNY. This implies that the value of China’s marine fishery carbon sinks has been on the rise, the significance of marine carbon fisheries in the economic system and ecosystem is gradually highlighted with the initiation of the national unified carbon emissions trading market. The Chinese government actively advocates for emission reduction and sink enhancement policies. It initiated the construction of the national carbon emissions trading market program (thermal power industry) in 2017, officially launched the national carbon emissions trading market on July 16, 2021, and formally reinstated the voluntary emission reduction market on January 22, 2024. With the ongoing progress of this process, the carbon sinks of the marine fisheries industry will undergo a certain degree of development. This will be beneficial for the ecological value of marine fishery carbon sinks. Additionally, a comparison is made between the shadow price of China’s marine fisheries carbon sinks from 2015 to 2022 and the average annual carbon trading prices in the CDM primary market and EU-ETS market. Subsequently, the distortion degrees of the factor price of China’s marine fisheries carbon sinks for each year in the period 2015–2022 are measured as 15.39, 15.89, 21.07, 13.46, 12.00, 10.56, 9.30, and 6.62. This indicates varied levels of distortion in the factor price of China’s marine fisheries carbon sinks.
Additionally, the analysis identifies the reasons for the distortion in the pricing of carbon sinks in China’s marine fisheries. There are four main considerations. Firstly, despite the recent restart of the voluntary emission reduction market on January 22, 2024, China lacks a long-term stable, mature, and unified spot market for trading ecological carbon sinks. Secondly, China lacks a futures market for trading ecological carbon sinks, impeding access to price references for the main stakeholders in carbon sinks trading. Thirdly, the methodology of marine fishery carbon sinks needs improvement, and in-depth research is needed on the mechanism, timeliness of carbon sequestration function, and measurement methods of marine fishery carbon sinks. Fourthly, the marine fisheries industry exhibits high risk volatility, and the return rate of related carbon sink products is underestimated. Subsequently, the economic effects resulting from the distortion of the shadow price of marine fisheries carbon sinks are analyzed, and relevant policy recommendations are proposed to address the issue of distorted pricing of carbon sink factors in China’s marine fishery industry.
Data availability statement
The original contributions presented in the study are included in the article/Supplementary Material. Further inquiries can be directed to the corresponding author.
Author contributions
YC: Conceptualization, Data curation, Formal analysis, Investigation, Methodology, Project administration, Resources, Software, Validation, Visualization, Writing – original draft, Writing – review & editing. JWe: Funding acquisition, Writing – review & editing. JWa: Data curation, Formal analysis, Writing – review & editing. WG: Writing – review & editing, Data curation. YY: Visualization, Writing – review & editing. XZ: Funding acquisition, Writing – review & editing.
Funding
The author(s) declare financial support was received for the research, authorship, and/or publication of this article. This research was funded by Major Project of National Social Science Foundation of China (21&ZD155).
Conflict of interest
The authors declare that the research was conducted in the absence of any commercial or financial relationships that could be construed as a potential conflict of interest.
Publisher’s note
All claims expressed in this article are solely those of the authors and do not necessarily represent those of their affiliated organizations, or those of the publisher, the editors and the reviewers. Any product that may be evaluated in this article, or claim that may be made by its manufacturer, is not guaranteed or endorsed by the publisher.
Supplementary material
The Supplementary Material for this article can be found online at: https://www.frontiersin.org/articles/10.3389/fmars.2024.1429631/full#supplementary-material
References
Anselin L. (1988). Spatial econometrics: methods and models (Netherlands: Dordrecht Luwer Academic Publishers), 3–20.
Davies L. L., chitel K. U., Ruple J. (2013). Understanding barriers to commercial-scale carbon capture and sequestration in the United States: an empirical assessment. Energy Policy 59, 745–761. doi: 10.1016/j.enpol.2013.04.033
Gao Y., Zhang Y. T., Meirong Du., Lin F., Jiang W., Li W., et al. (2021). Dissolved organic carbon from cultured kelp Saccharina japonica: production, bioavailability, and bacterial degradation rates. Aquaculture Environ. Interact. 13, 101–110. doi: 10.3354/aei00393
Jiang A. J., Chen Z. J., Ren H. J. (2008). Arguments on oceanic carbon cycle of IPCC assessments. A Test Using C Budgets. 06, 369–375.
Jiao N., Herndl G. J., Hansell D. A., Benner R., Kattner G., Wilhelm S. W., et al. (2010). Microbial production of recalcitrant dissolved organic matter: Long-term carbon storage in the global ocean. Nat. Rev. Microbiol. 8, 593. doi: 10.1038/nrmicro2386
Jones R. W. (1971). Distortions in factor markets and the general equilibrium model of production. J. Polit. Econ. 79, 437–459. doi: 10.1086/259762
Kang H. (2018). Analysis of input and output in the forestry industry of fujian province based on the C-D production function. J. Inn. Mong. Univ. Financ. Econ. 16, 23–26. doi: 10.13895/j.cnki.jimufe.2018.02.006
Kumbhakar S. C., Bhattacharyya A. (1992). Price distortion and resource-use efficiency in Indian agriculture: A restricted profit function approach. Rev. Economic Stat 74, 231–239. doi: 10.2307/2109654
Li J. Y., Murauchi Y., Ichinomiya M., Agatsuma Y., Taniguchi K. (2007). Seasonal changes in photosynthesis and nutrient uptake in Laminaria japonica (Laminariaceae; Phaeophyta). Aquaculture Sci. 55, 587–597. doi: 10.1007/s10811-008-9352-2
Li M. N., Zhao S. (2014). Valuation of carbon sinks in mariculture. Resource Conserv. Environ. Prot. 01, 14–15. doi: 10.16317/j.cnki.12-1377/x.2014.01.033
Magee S. P. (1973). Factor market distortion, production: A survey oxford economic papers, new series, Vol. 25. (Oxford). p.1–43.
Penhale P. A., Capone D. G. (1981). Primary productivity and nitrogen fixation in two macroalgae-cyanobacteria associations. Bull. Mar. science. 31, 164–169.
Regulations for the Administration of VoluntaryGreenhouse Gas Emission Reduction Trading (for Trial Implementation). (2022). (Beijing: Ministry of Ecology and Environment).
Shao G. L., Ren X. C., Li C. (2017). Evaluation of carbon sink fisheries based on B-S option pricing model: take mariculture algae as an example. Chin. Fishery Economic. 35, 76–82.
Shen J. S., Wang Z. P., Wang X. Q. (2018). A study on incentive subsidy of blue carbon in marine ranch. J. Ocean Univ. China. 02), 16–21.
Tang Q. S., Liu H. (2016). Strategy for carbon sink and its amplification in marine fisheries. Strategic Study CAE 18, 68–73. doi: 10.15302/J-SSCAE-2016.03.011
The Ministry of Natural Resources. (2022). Accounting methods for economic value of ocean carbon sink. HY/T 0349-2022 (Beijing: China Standard Press).
Xu J. J., Qin T. T., Han L. M. (2018). A review of research on marine carbon sink fisheries. Resour. Sci. 40, 161–172.
Yan L. W., Huang H. J. Chen J. T., Y ang X. G. (2011). Estimation of carbon sink capacity of algal mariculture in the coastal areas of China. Adv. In Mar. Science. 29, 537–545.
Yoshikawa T., Takeuchi I., Furuya K. (2001). Active erosion of undaria pinnatifida, suringar (Laminariales, Phaeophyceae) mass-cultured in Otsuchi Bay in northeastern Japan. J. Exp. Mar. Biol. Ecol. 266, 51–52. doi: 10.1016/S0022-0981(01)00346-X
Yu J. K., Yang Z. K., Shao G. (2011). Analysis on carbon compensation amount of carbon sink fisheries based on shadow price model: take seawater shellfish aquaculture industry of Shandong province as example. Agric. Economics Manage. 06, 83–90.
Yue D. D., Wang L. M., Geng R. (2014). Initial assessment of seaweed farming ecological value in coastal waters of China. J. Agric. Sci. Technol. 16, 126–133. doi: 10.13304/j.nykjdb.2013.507
Zhang J. (2020). The estimation of China’s physical capital stock,1980-2018. Shanghai Economic Res. 08, 32–45.
Zhang J. H., Liu Y., WuW G., Wang X. M., Zhong Y. (2022). Overview of the marine fishery carbon sink project methodology. Prog. Fishery Sci. 43, 151–159. doi: 10.19663/j.issn2095-9869.20220325004
Zhang H. L., Shen D. (2021). Research of human capital’s influence on the growth effect of forestry ecology economy. Shanghai Economic Res. 07, 45–21. doi: 10.13880/j.cnki.cn65-1210/c.20171213.012
Keywords: marine carbon sinks, marine fisheries, fisheries carbon sinks, macroalgae and shellfish, shadow prices, factor prices, ridge regression
Citation: Chai Y, Wei J, Wang J, Guo W, Yu Y and Zhang X (2024) Research on carbon sink prices in China’s marine fisheries: an analysis based on transcendental logarithmic production function model from 1979 to 2022. Front. Mar. Sci. 11:1429631. doi: 10.3389/fmars.2024.1429631
Received: 08 May 2024; Accepted: 23 August 2024;
Published: 26 September 2024.
Edited by:
Junjie Wang, Nanjing University of Aeronautics and Astronautics, ChinaReviewed by:
Huimin Zhou, Henan Agricultural University, ChinaLi Ye, Wuhan University of Science and Technology, China
Copyright © 2024 Chai, Wei, Wang, Guo, Yu and Zhang. This is an open-access article distributed under the terms of the Creative Commons Attribution License (CC BY). The use, distribution or reproduction in other forums is permitted, provided the original author(s) and the copyright owner(s) are credited and that the original publication in this journal is cited, in accordance with accepted academic practice. No use, distribution or reproduction is permitted which does not comply with these terms.
*Correspondence: Jipeng Wei, anB3ZWlAc2hvdS5lZHUuY24=