
95% of researchers rate our articles as excellent or good
Learn more about the work of our research integrity team to safeguard the quality of each article we publish.
Find out more
ORIGINAL RESEARCH article
Front. Mar. Sci. , 27 September 2024
Sec. Marine Molecular Biology and Ecology
Volume 11 - 2024 | https://doi.org/10.3389/fmars.2024.1423676
 Dominique A. Cowart1*†
 Thomas Chevrier1,2†
 Anne-Elise Nieblas1†
 Jérémie Chanut1†
 Serge Bernard3†
 Sylvain Bonhommeau2†
The back-reef depressions, or lagoons, of Reunion Island (western Indian Ocean) host a high abundance of organisms living amongst the coral reefs and are critical sites for artisanal fishing, tourism, and shoreline stability for the island. Over time, increasing degradation of Reunionese reefs has been observed due to overexploitation, beach erosion and eutrophication. Efforts to mitigate the impact of these pressures on aquatic organisms include biodiversity surveys primarily performed through visual censuses that can be logistically complex and may unintentionally overlook organisms. Surveys integrating environmental DNA (eDNA) collections have provided rapid biodiversity assessments, while helping to circumvent some limitations of visual surveys. The present study describes the results of an exploratory eDNA survey, which aims to characterize metazoan communities of four Reunionese lagoons located along the west coast of the island. As eDNA surveys first require deliberate study design and optimization for each new context, we sought to establish a modernized workflow implementing specialized equipment to collect and preserve samples to facilitate future studies in these lagoons. During the austral summer of 2023, samples were pumped directly from surface and bottom depths at each site through self-preserving filters which were then processed for DNA metabarcoding using regions of the 12S ribosomal RNA (12S), small ribosomal subunit 18S (18S) and Cytochrome Oxidase I (COI) genes. The survey detected high species richness that varied by site, and in a single collection period, recovered the presence of 60 teleost families and numerous invertebrate taxa, including members of the coral faunal community that are less studied in Reunion. Distinct biological communities were observed at each site, and within a single lagoon, suggesting that these differences are due to site-specific factors (e.g., environmental variables, geographic distance, etc.). Although continued protocol optimization is needed, the present findings demonstrate the successful application of an eDNA-based survey for biodiversity assessment within Reunionese lagoons.
Coral reefs are biologically diverse ecosystems that act as a complex habitat for multitudes of species and a source of livelihood for many human populations (McManus et al., 2000). As a result of their positioning along coasts and proximity to humans, these ecosystems have been heavily impacted by global and local pressures over the last 60 years, leading to a 50% decline in coral reef cover worldwide (Eddy et al., 2021). The pressures affecting coral reefs have been largely classified into “acute threats” (e.g., destructive fishing practices and other forms of mechanical damage) and “chronic stressors” (e.g., overfishing, pollution, sedimentation and eutrophication from coastal runoff, climate change) (Edinger et al., 1998). These pressures have resulted in the degradation of many reefs through coral bleaching, the proliferation of diseases among reef species, the reduction of biodiversity, local extinctions and more (Randall and van Woesik, 2017; van Woesik and Kratochwill, 2022). The resilience, management and conservation of coral reefs and their resources are therefore continuing focal points of intense investigation by government officials and research scientists alike (Norström et al., 2016).
The western Indian Ocean is home to approximately 6% of the planet’s corals and is a hotspot of marine biodiversity (Obura et al., 2017, Obura et al., 2022). Within this sector lies the Mascarene Archipelago that includes Reunion Island, which hosts back-reef depressions containing short stretches of narrow fringing coral reefs that are situated along the western and southwestern coasts (Thébaud et al., 2009). Here, reef flat communities are dominated by scleractinian corals of the genera Acropora, Porites, Montipora and Pavona, as well as several reef fish families living amongst the corals (wrasse, Labridae; damselfish, Pomacentridae; carnivorous groupers, Serranidae; Baliste fishes, Balistidae; surgeonfishes, Acanthuridae; Goatfishes, Mullidae, etc.) (Thébaud et al., 2009; Tourrand et al., 2013). In Reunion, degradation of the reefs and lower coral coverage has been observed over decades as a result of combined factors such as eutrophication and human activities (pollution, tourism, etc.) (Tessier et al., 2008; Ahamada et al., 2008; Naïm et al., 2013; Tedetti et al., 2020). Accordingly, the Natural Marine Reserve of Reunion Island (RNMR) was established in 2007 and the organization was tasked with the protection and governance of several reefs along the western coast of the island, which includes 44 kilometers from Cap La Houssaye (Saint-Paul) to Roche aux Oiseaux (Etang-Salé) (Figure 1). While biodiversity surveys of the area have been primarily performed through visual-based methods to help develop current conservation strategies (Lagabrielle et al., 2009), these habitats remain difficult to fully characterize due to the multitude of organisms, and some individual taxa may be unintentionally overlooked as a result of their elusive behavior, rarity or small size. Nonetheless, efforts to mitigate the impact of human activities on animal populations, while simultaneously managing valuable aquatic resources, generally depend upon comprehensive assessments of biological communities (Kantoussan et al., 2018).
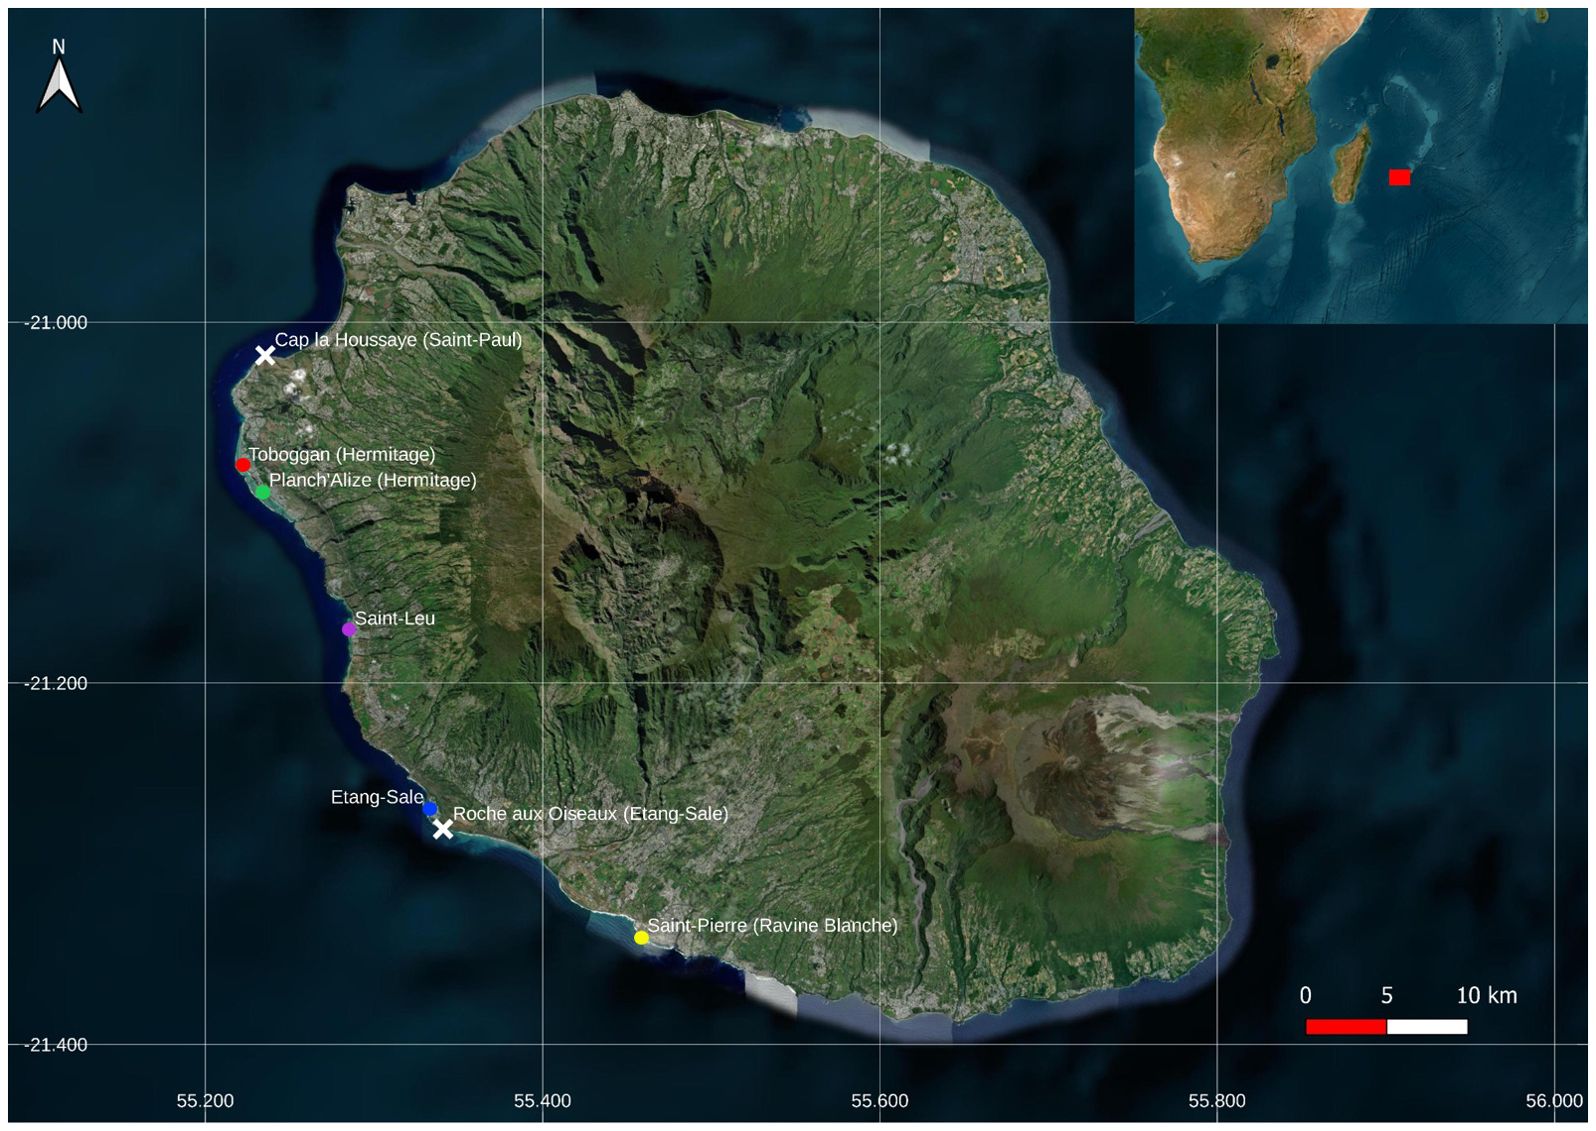
Figure 1. Map of Reunion Island displaying the locations of four back-reef depressions, present only on the west coast of the island: Hermitage, Saint-Leu, Étang-Salé, and Saint-Pierre. Colored circles indicate the five collection sites within a back-reef depression. The locations of Cap la Houssaye (Saint-Paul) and Roche aux Oiseaux (Étang-Salé), which are each denoted by a white “X”, represent the northern- and southernmost borders of the area that falls under the protection and governance of the Natural Marine Reserve of Reunion Island (RNMR).
A recent approach to circumvent some of the challenges associated with biodiversity surveys in highly diverse environments such as coral reefs has been to collect environmental samples (e.g.,water and sediment), that contain fragments of DNA shed from local organisms, and apply DNA sequencing techniques to these collections (Juhel et al., 2022; Shen et al., 2024). This ‘environmental DNA’ (eDNA) approach has an enormous capacity for the detection and identification of a variety of taxonomic groups and has helped to transform the field of conservation genetics (Seymour, 2019). Given its capacity to identify the taxonomic composition of a community from a single sample, eDNA metabarcoding in particular has also been used to investigate population dynamics, ecosystem health, trophic interactions and seasonal variations (Díaz-Ferguson and Moyer, 2014; Sigsgaard et al., 2016; Parsons et al., 2018; Djurhuus et al., 2018, 2020; Berry et al., 2019; Ruppert et al., 2019; Nguyen et al., 2020; Doorenspleet et al., 2021; Ruiz-Ramos et al., 2023; Jiang et al., 2023). Nevertheless, some factors make the application of eDNA metabarcoding complex (e.g., highly variable concentrations of DNA in the environment, differing persistence times and transport of DNA particles) which necessitates a deliberate study design and optimization for each new application and target (Deiner et al., 2017; Xing et al., 2022; Takahashi et al., 2023). From these initial tests, baseline knowledge is established and used to pursue more extensive research questions that eDNA can help resolve.
Our study provides an exploratory examination of the utility of environmental DNA surveys for biodiversity assessment at four back-reef depressions of Reunion Island, through the collection and processing of seawater samples for metabarcoding of three gene markers. Through this survey, we characterize and compare the metazoan communities inhabiting Reunionese back-reef depressions during the austral summer of 2023. Our study additionally sought to establish a “lab-to-field” workflow for ease of processing samples from these habitats, including the use of a specialized pump designed to facilitate water collections and reduce the risks of contamination.
The study focused on four back-reef depressions, referred to hereafter as “lagoons’’, which only exist on the western coast of Reunion (Figure 1). These are Hermitage, Saint-Leu, Étang-Salé and Saint-Pierre (Mahabot et al., 2017). These lagoons and the sites within were selected as they are followed by RNMR for collection of biodiversity data and exhibit differing physico-chemical signatures and thus reef structural composition (Tessier et al., 2008; RNMR 2019). The Hermitage back-reef depression is home to the La Saline - L’Hermitage reef, which is composed of two subtidal flats measuring ≤ 2 m depth, 250 - 550 m in width and extending over 9 km (Tourrand et al., 2013). The two sites sampled within this reef were Toboggan (North) and Planch’Alizé (South) which are approximately 2 km apart (Figure 1). These two sites exhibit differing physico-chemical signatures in terms of variations in salinity and nutrient enrichment, which influence biological assemblages (Naïm et al., 2013; Tedetti et al., 2020). For example, Toboggan is known to be dominated by the branching stony coral Acropora spp while Planch’Alizé is dominated by other types of stony corals (Naïm et al., 2013; Tourrand et al., 2013).
Saint-Leu, Étang-Salé and Saint-Pierre are smaller than Hermitage Reef and all experience strong human pressures including adjacency to urban areas (Tessier et al., 2008). Notably, Saint-Pierre experiences inputs of freshwater from the d’Abord River (Ahamada et al., 2002). Some areas of the Saint-Leu and Saint-Pierre reefs are dominated by Acropora spp, as well as coral and plankton feeding fishes, while other areas are home to more resistant and opportunistic taxa (Porites spp and Montipora spp) and a lower density and diversity of predatory fishes (Ahamada et al., 2002). At Étang-Salé, coral colonies primarily consist of Porites spp; and this site has been recorded as having low algae cover and low presence of predatory fishes (Ahamada et al., 2002; Tessier et al., 2008).
We performed water collections across five days between January 5th and February 28th, 2023 (Table 1). On each day, weather conditions were calm and stable, with clear skies, light breezes and air temperatures 27 - 30°C. Collections were done using the Smith-Root© eDNA sampler (ANDe™, Vancouver, WA, USA) and associated 0.45 µm pore polyethersulfone (PES) filter membranes (Thomas et al., 2019). The eDNA sampler is an electronic water pump in which the speed, volume and flow of water can be regulated using a digital control pad, and collection poles can be connected to the pump for direct sampling. Individual filter membranes are contained within housings, which are clamped to the ends of the collection poles. Attached to the filter housings are tube extensions that are lowered directly into the body of water prior to the start of the pump. At each site, sampling was done by lowering the tube extensions just below the water line (‘surface’) or attaching long hoses to the housings to pump just above the substrate (‘bottom’). Using the Smith-Root trident pole, triplicate samples were taken for each depth category, to help reduce the risk of false negative detections (Xing et al., 2022).
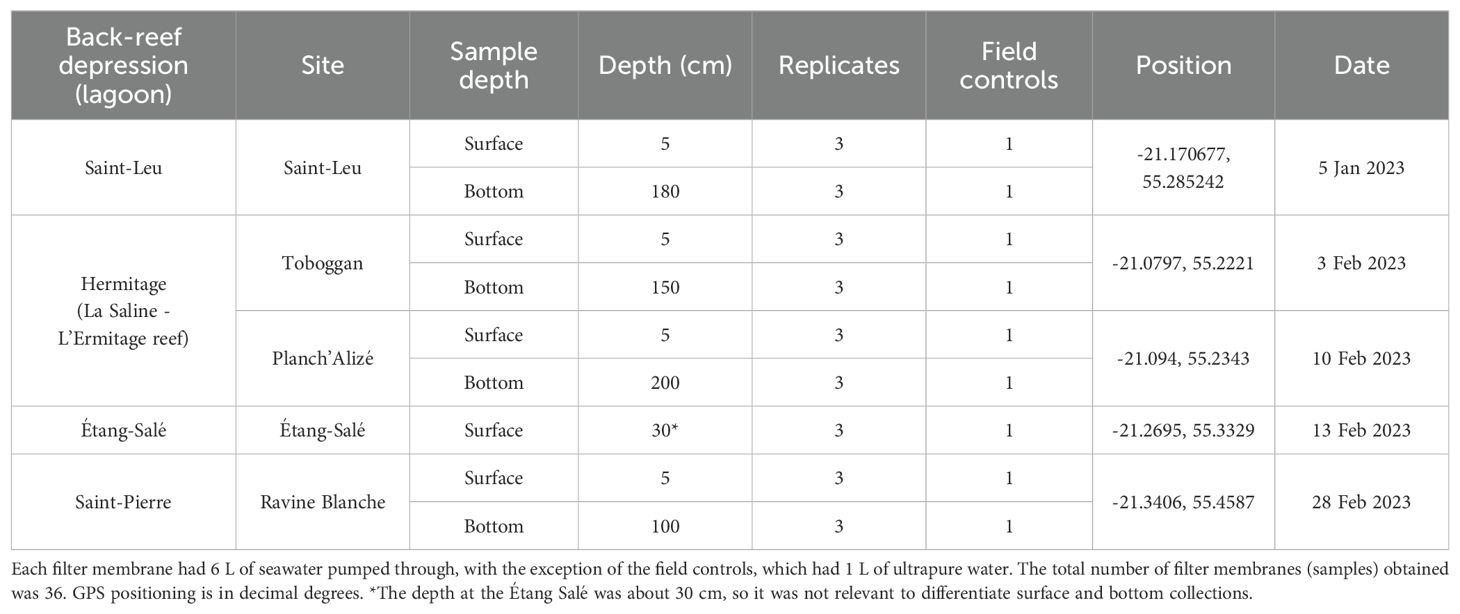
Table 1. Sample list for the four back-reef depressions and five sites in Reunion Island.
Water was passed through the filter membranes at a constant speed of 0.9 - 1 L/min, until they were saturated at 6 L each for a total of 18 L pumped per triplicate. As the filter membranes were self-preserving by desiccation, and once pumping was completed, the tube extensions or hoses were removed from the water and the pump was allowed to run for 20 s to dry the membranes (Thomas et al., 2019). The filters, still inside of their housings, were returned to their individual resealable bags and stored in a cooler for transport to the lab, where they stayed in dark, ambient conditions (23°C) until DNA extraction within 1 - 2 months of collection. Several negative field controls, each consisting of 1 L of ultrapure water (resistivity of 18 MΩ-cm at 25°C) placed in 1 L sterile bottles and then UV sterilized for 10 minutes, were prepared to help assess potential contamination of the equipment and supplies. For each set of triplicate samples, one negative control was filtered through the pump before filtering the seawater samples, and this was done for both surface and bottom samples, resulting in a total of two negative controls for each site. Overall, we obtained a total of 36 filter membranes (samples) accounting for all surface and bottom samples taken from the two sites at Hermitage and one site each at the other three lagoons, with the exception of Étang-Salé, whose water level is normally too low to collect bottom samples (Table 1).
To examine environmental conditions between eDNA collection sites and dates, we retrieved environmental profiles consisting of dissolved oxygen, pH, temperature and salinity data from long-term monitoring of the island’s lagoons by the European Water Framework Directive. These data were collected from water masses that best represent the four lagoons examined in this study. The data, available between 2002 and 2024, is collected six times annually and can be accessed on the IFREMER Envlit platform: https://envlit.ifremer.fr/Quadrige-la-base-de-donnees/Acceder-aux-donnees/Telecharger-les-donnees.
DNA from each filter was extracted using the Qiagen DNeasy Blood and Tissue Kit (Qiagen, Germany), following modified protocols published in Renshaw et al., 2015 and Gasparini et al., 2020. In the laboratory, membranes were carefully removed from their housings using single-use sterile forceps. The membranes were folded and cut using sterile tools and then immersed in a 2.0 ml microtube containing 567 µl buffer ATL and 63 µl Proteinase K solution. Tubes were incubated in a shaking heat block at 56°C for three hours. Following the incubation step, 630 µl of buffer AL and 630 µl of 100% ethanol were added to the tubes, after which all downstream steps followed the manufacturer’s protocol. Two negative extraction blanks (no filter, just reagents) were added for each site processed. Once the DNA extraction protocol was completed, all samples were assayed using the Qubit® High Sensitivity (HS) fluorometer (ThermoFisher, Waltham, MA, USA) to record the DNA concentrations of each sample; the concentrations of experimental samples measured between 1 - 10 ng/µL.
eDNA samples are sensitive to contamination and improper handling practices throughout the workflow can compromise the integrity of the samples and results (Goldberg et al., 2016). To evaluate potential contamination, we collected one field control per condition (‘surface’ and ‘bottom’) (Table 1). All field controls were processed in the same manner as the seawater samples. Each site was sampled on different days; subsequent DNA extractions for each site were also completed on separate days, all to help reduce DNA carryover/cross contamination between sites. All reusable equipment and supplies were thoroughly sterilized using the 10% bleach protocol and/or UV sterilization for 10 to 20 minutes, as described in Cowart et al., 2022, prior to their next usage in the field or lab. Additional precautions were taken to prevent cross-contamination, which included frequent glove changes, the use of single-use sterilized supplies when possible, careful handling of the filter membranes and frequent sterilization of field and lab spaces.
Greater coverage across taxonomic groups can mean less resolution between groups, thus, the use of multimarker datasets has become routine for providing more reliable and comprehensive bio-inventories (Alberdi et al., 2018). A review of eDNA metabarcoding studies in aquatic habitats has shown that for fish, the most common DNA markers employed are from the mitochondrial 12S ribosomal RNA (12S), 16S ribosomal RNA (16S) and Cytochrome c Oxidase subunit 1 (COI or COX1) genes, while for benthic fauna and eukaryotes in general, the genes of choice are frequently COI and the nuclear small ribosomal subunit 18S (18S) genes (van der Loos et al., 2021). As our primary interest was metazoan biodiversity, we chose three markers: a fragment measuring between 170 - 250-bp of the 12S gene (“MiFish”, Miya et al., 2015), a 350-bp fragment of the 18S V1-V2 region (Blaxter et al., 1998; Sinniger et al., 2016), and a 313-bp fragment of the COI gene (Leray et al., 2013b; Geller et al., 2013), all widely applied in marine eDNA metabarcoding studies (Supplementary Table S1). COI and 18S have been shown to complement one another in marine water metabarcoding studies (Holman et al., 2019; Brandt et al., 2021), uncover a variety of metazoans and have relatively well-populated, publicly-available databases for taxonomic assignments, while the MiFish primers are widely applied to characterize fish communities (Miya et al., 2015 and 2020). Furthermore, the primer sets amplify DNA fragments considered on the larger end for eDNA (< 400-bp, Langlois et al., 2021), which may aid in increasing specificity and reliability of taxonomic assignments, yet still be sufficiently small to amplify rapidly degrading genetic material.
DNA extracts were sent to ADNid (Montferrier sur Lez, France) for amplification, library preparation and sequencing of the three markers. Amplification was performed in a total volume of 15 μl containing 1X Type-it Microsatellite PCR master mix (Qiagen), 0.13 μM of each primer and 2 μl of genomic DNA. All amplification assays were run on an Eppendorf® Mastercycler® (Hamburg, Germany) under conditions specific to each marker, which were slightly adapted from those previously published in Miya et al., 2015 (12S) and Brandt et al., 2019 (18S and COI). For the 12S assay, an initial denaturation began at 95°C for 5 min followed by 35 cycles of 95°C for 30 s, 55°C for 1 min, and 72°C for 30 s, and a final extension at 60°C for 30 s. For 18S, an initial denaturation began at 95°C for 10 min, followed by 30 cycles of 95°C for 1 min, 57°C for 45s, and 72°C for 3 min, followed by a final extension at 72°C for 10 min. Finally, for the COI assay, initial denaturation began at 95°C for 10 min, followed by 16 cycles of 95°C for 10 s, 62°C (−1°C per cycle) for 30 s and 68°C for 1 min, followed by 25 cycles of 95°C for 10 s, 46°C for 30 s, 68°C for 1 min, and a final extension at 68°C for 7 min. Next, the PCR products for each sample of each marker were pooled and purified on AMPure XP magnetic beads (Beckman Coulter, Brea, CA, USA). Library construction proceeded by tagging each pool with a combination of two different barcodes designed by Illumina (San Diego, CA, USA) through a second amplification process, following recommendations by Illumina. Libraries were sequenced 2 x 250-bp paired-end using Illumina MiSeq V2.
We performed data preprocessing using the Standardized and Automated MetaBarcoding Analyses workflow (SAMBA v3.0.1) pipeline (Cormier et al., 2021), developed by SeBiMER (the Bioinformatics Core Facility of IFREMER) on raw sequence data that had already been demultiplexed by sample name. SAMBA executed cutadapt (Martin, 2011) to perform primer trimming and demultiplexing at a full match of the length of forward and reverse primers. Next, DADA2 v. 1.26 (Callahan et al., 2016) was implemented to visualize sequence read quality, filter reads based on length, perform dereplication and assembly/merging of reads at a minimum overlap of 13-bp, all prior to removing chimeras and generating amplicon sequence variants (ASVs). This was done through an error model based on the quality of the sequencing run to help identify true biological variation (Callahan et al., 2016; Chiarello et al., 2022). Following this, QIIME2 (Caporaso et al., 2010) was implemented to assign taxonomy to the ASV tables for each marker dataset using the MiFish (Miya et al., 2015) and MIDORI2 (Leray et al., 2022) databases for 12S, Silva release 132 (Quast et al., 2012) for 18S and the NCBI nr/nt database 253 release (December 2022) for COI.
The SAMBA pipeline generated phyloseq objects (McMurdie and Holmes, 2013) for each marker dataset used for downstream analyses in R (R Core Team, 2023). With these objects, we evaluated the sequencing depth for each marker dataset and full taxonomic composition of all samples, including the negative controls. Next, we curated the dataset by first plotting rarefaction curves for all samples using the vegan package (Oksanen et al., 2022). Samples with insufficient sequencing depth were removed. The threshold for removal was set at the sample with the fewest number of sequences for each dataset. Datasets were then normalized through rarefaction without replacement, after which unassigned ASVs, as well as those matching to non-target taxa (non-metazoans) were removed prior to downstream analyses. The ASVs that were present in the negative controls were evaluated separately to determine if their abundances, in terms of the number of sequences, were higher in the controls or the experimental samples. If they were higher in any of the negative controls, they were removed from the dataset prior to downstream analyses.
Comparisons of the density of ASVs across the sites were visualized through the ggVennDiagram package (Gao et al., 2021). Relative abundances of target taxa were generated through the aid of phyloseq. To examine how well our present sampling effort surveyed metazoan biodiversity and to simulate future efforts, we generated accumulation and extrapolation curves based on species richness (q = 0) for all three marker datasets using the iNEXT (iNterpolation and EXTrapolation) package (Chao et al., 2014; Hsieh et al., 2016). Further, total richness of a habitat was approximated through the Chao2 estimator in iNEXT and vegan. Species richness estimates were tested through the analysis of variance (ANOVA) and Tukey Honest Significant Difference (Tukey HSD) to determine if richness differed across markers and sites. Next, Jaccard dissimilarity matrices (incidence) were produced to generate nonmetric multidimensional scaling (nMDS) ordinations using the ‘metaMDS’ function in vegan. Permutation Analysis of Variance (PERMANOVA) testing based on the Jaccard matrices was performed across the differing levels of ‘site’, ‘depth’ and ‘replicate’, as well as their interactions, to determine if there were any significant differences in communities, using the ‘adonis2’ function from vegan and implementing 999 permutations and the Holm correction for multiple testing.
The number of samples processed and sequenced for this study totaled 37, which included 27 experimental samples, 9 negative field control samples (Table 1) and a negative control that was inserted during PCR assaying and sequencing for each DNA marker. Prior to the data curation step, the 12S dataset consisted of 2,179,913 sequences and 1,477 ASVs; the 18S dataset consisted of 6,219,344 sequences and 8,155 ASVs; and the COI dataset contained 2,145,150 sequences and 18,719 ASVs. Sequencing depths, before and after data curation, are shown in Supplementary Figures S1–S3 corresponding to each of the datasets. The mean number of sequences per sample and per ASV, before and after data curation, is displayed in Table 2. Examination of only the experimental samples of the 12S dataset identified that 46.97% of the ASVs were assigned to ‘teleostei’ (bony fish), while 0.14% were assigned to chondrichthyes (cartilaginous fish); however, ~90% of all sequences were ascribed to fish (Supplementary Figure S4). The 18S dataset revealed that approximately 22.74% of ASVs and 33% of sequences were assigned to metazoans, while the COI dataset identified 43% of ASVs and 44% of sequences were assigned to metazoans (Supplementary Figure S4).
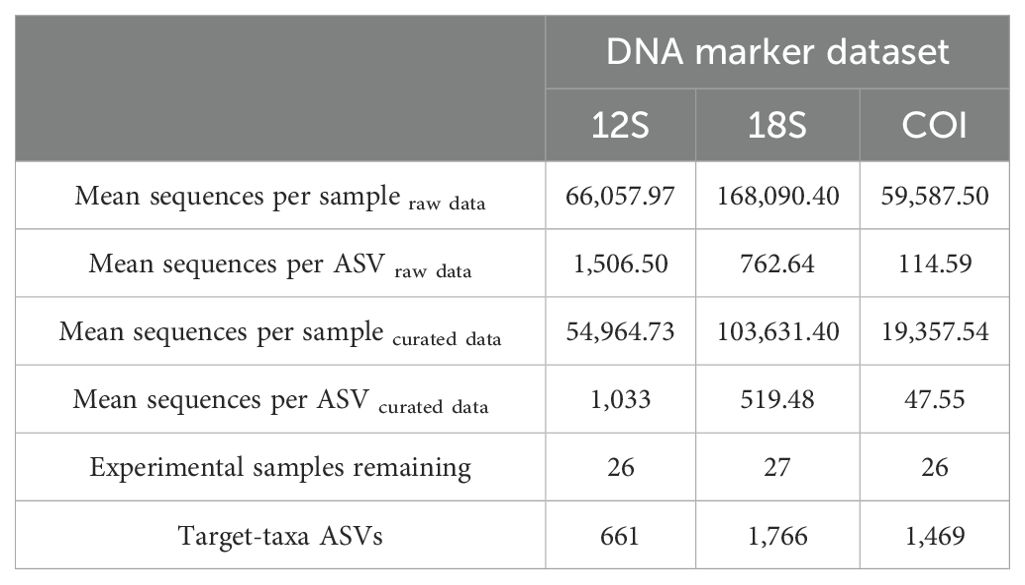
Table 2. Summary values before and after the data curation process for each dataset.
Rarefaction curves for all samples, prior to curation and normalization, are shown in Supplementary Figure S5. Rarefaction curves for the 12S experimental samples resulted in the removal of a single bottom sample obtained from Saint-Pierre due to insufficient sequencing depth (22,392 sequence reads)(Supplementary Figure S5). After normalization, any taxa not matching either class Actinopterygii (ray-finned fish) or Chondrichthyes (cartilaginous fish) was removed. For 18S, all rarefaction curves for the experimental samples reached plateau, while for the COI dataset, a single surface sample from Saint-Leu had very low sequencing depth compared to the average number of sequences per sample (5,917 sequence reads) and was removed prior to normalization and the removal of all non-target ASVs (Supplementary Figure S5).
The negative controls for each marker dataset exhibited low diversity and differing taxa signatures when compared to their experimental samples, as seen in plots of relative abundance of ASVs in the negative control samples prior to data curation (Supplementary Figures S6–S8). A total of 38 ASVs were present in the 12S controls, representing 12.4% of the sequences in that dataset (Supplementary Figure S6). Following curation, two ASVs assigned to class ‘Actinopterygii’ were present at lower abundance, in terms of the number of sequences, than the experimental samples. Despite this, one ASV matching to the family Istiophoridae (billfish) was removed from the dataset prior to downstream analyses as it is non-native to the lagoons of Reunion Island (Supplementary Table S2). A total of 187 ASVs were present in the 18S controls, representing 5.5% of all sequences; of these, 20 matched to metazoan taxa (Supplementary Figure S7). Following data curation, six of the 20 ASVs were identified in the experimental samples, yet none were more abundant in the controls (Supplementary Table S2). The COI dataset contained 39 ASVs representing 5.8% of all sequences (Supplementary Figure S8); after curation, a single ASV was present in a negative control at much lower abundance, and therefore, was not removed (Supplementary Table S2).
The final curated datasets consisted of 26 samples and 661 ASVs for 12S, 27 samples and 1,766 ASVs for 18S and 26 samples and 1,469 ASVs for COI (Table 2). The density of ASVs by site in terms of proportion and count is illustrated through flower diagrams depicted in Figure 2. Higher percentages of ASVs were seen at the external petals of each flower and supported the distinct community of each site (Figure 2). Saint-Leu was identified as having the highest density of ASVs, followed by Saint-Pierre for both the 12S and 18S datasets; however, the highest density of ASVs for COI was found at Planch’Alizé (Figure 2). As shown in the center of each flower, the percentage of ASVs found at all sites ranged between 1.7% (COI) and 6.5% (12S). The proportion of overlapping ASVs between two or more sites is portrayed by the intersection of “lightbulb” forms that represent each site. As an example, the yellow-shaded shape shown within the 12S flower presents the percentage (0.8%) of ASVs shared by Planch’Alizé, Saint-Leu and Saint Pierre (Figure 2). Overall, the proportion of ASVs shared between and across sites varied greatly, depending on the dataset. For example, 4.4% of ASVs were shared between all sites except Planch’Alizé as shown by the 12S dataset. Additionally, both 18S and COI datasets identified 5.3% and 2.6% ASVs, respectively, shared between Toboggan and Saint-Leu (Figure 2).

Figure 2. Flower diagrams illustrating the number and percentage of ASVs observed from each site for the 12S (top), 18S (middle) and COI (bottom) datasets. The count gradient details the density of ASVs at each site by color intensity with a total of 661 ASVs for 12S, 1,766 ASVs for 18S and 1,469 ASVs for COI.
Observed and estimated richness for the assigned ASVs was first examined across markers and was found to be higher for the 18S dataset compared with COI and 12S datasets (Supplementary Figure S9), while each dataset exhibited differing results across sites (Supplementary Figure S10, Tukey HSD, p < 0.01). The 12S dataset revealed similarity in richness at Toboggan and Étang-Salé, as well as between Saint-Leu and Saint-Pierre, with Planch’Alizé as the most significantly different and exhibiting the lowest species richness comparatively (Supplementary Figure S10). The 18S dataset also identified similar richness at Toboggan and Étang-Salé, and between Planch’Alizé and Saint-Pierre, while Saint-Leu was the most dissimilar and also had the highest species richness values comparatively (Supplementary Figure S10). No significant differentiation between sites in terms of richness was detected in the COI dataset (Supplementary Figure S10).
Species accumulation curves for each dataset revealed that species richness remained undersampled at each site for each dataset, based on the present sampling effort in terms of the number of filters and liters (Figure 3). Further, each dataset exhibited a similar trend where a full saturation of species richness would be reached at between 15 to 20 filters (90 - 120 L), as indicated by the gradual plateau of the curves. Étang-Salé’s curves reached a plateau earlier as only three surface samples were taken due to its shallow depth profile (Figure 3). Examining trends in environmental parameters between 2002 and 2024 (dissolved oxygen, pH, temperature, salinity, oxygen) showed relatively stable environmental conditions over the sample collection period from January through February (Supplementary Figure S11). Overall, 12S, 18S and COI surveys detected approximately 37%, 56% and 40% of estimated total richness, respectively (Supplementary Table S3).
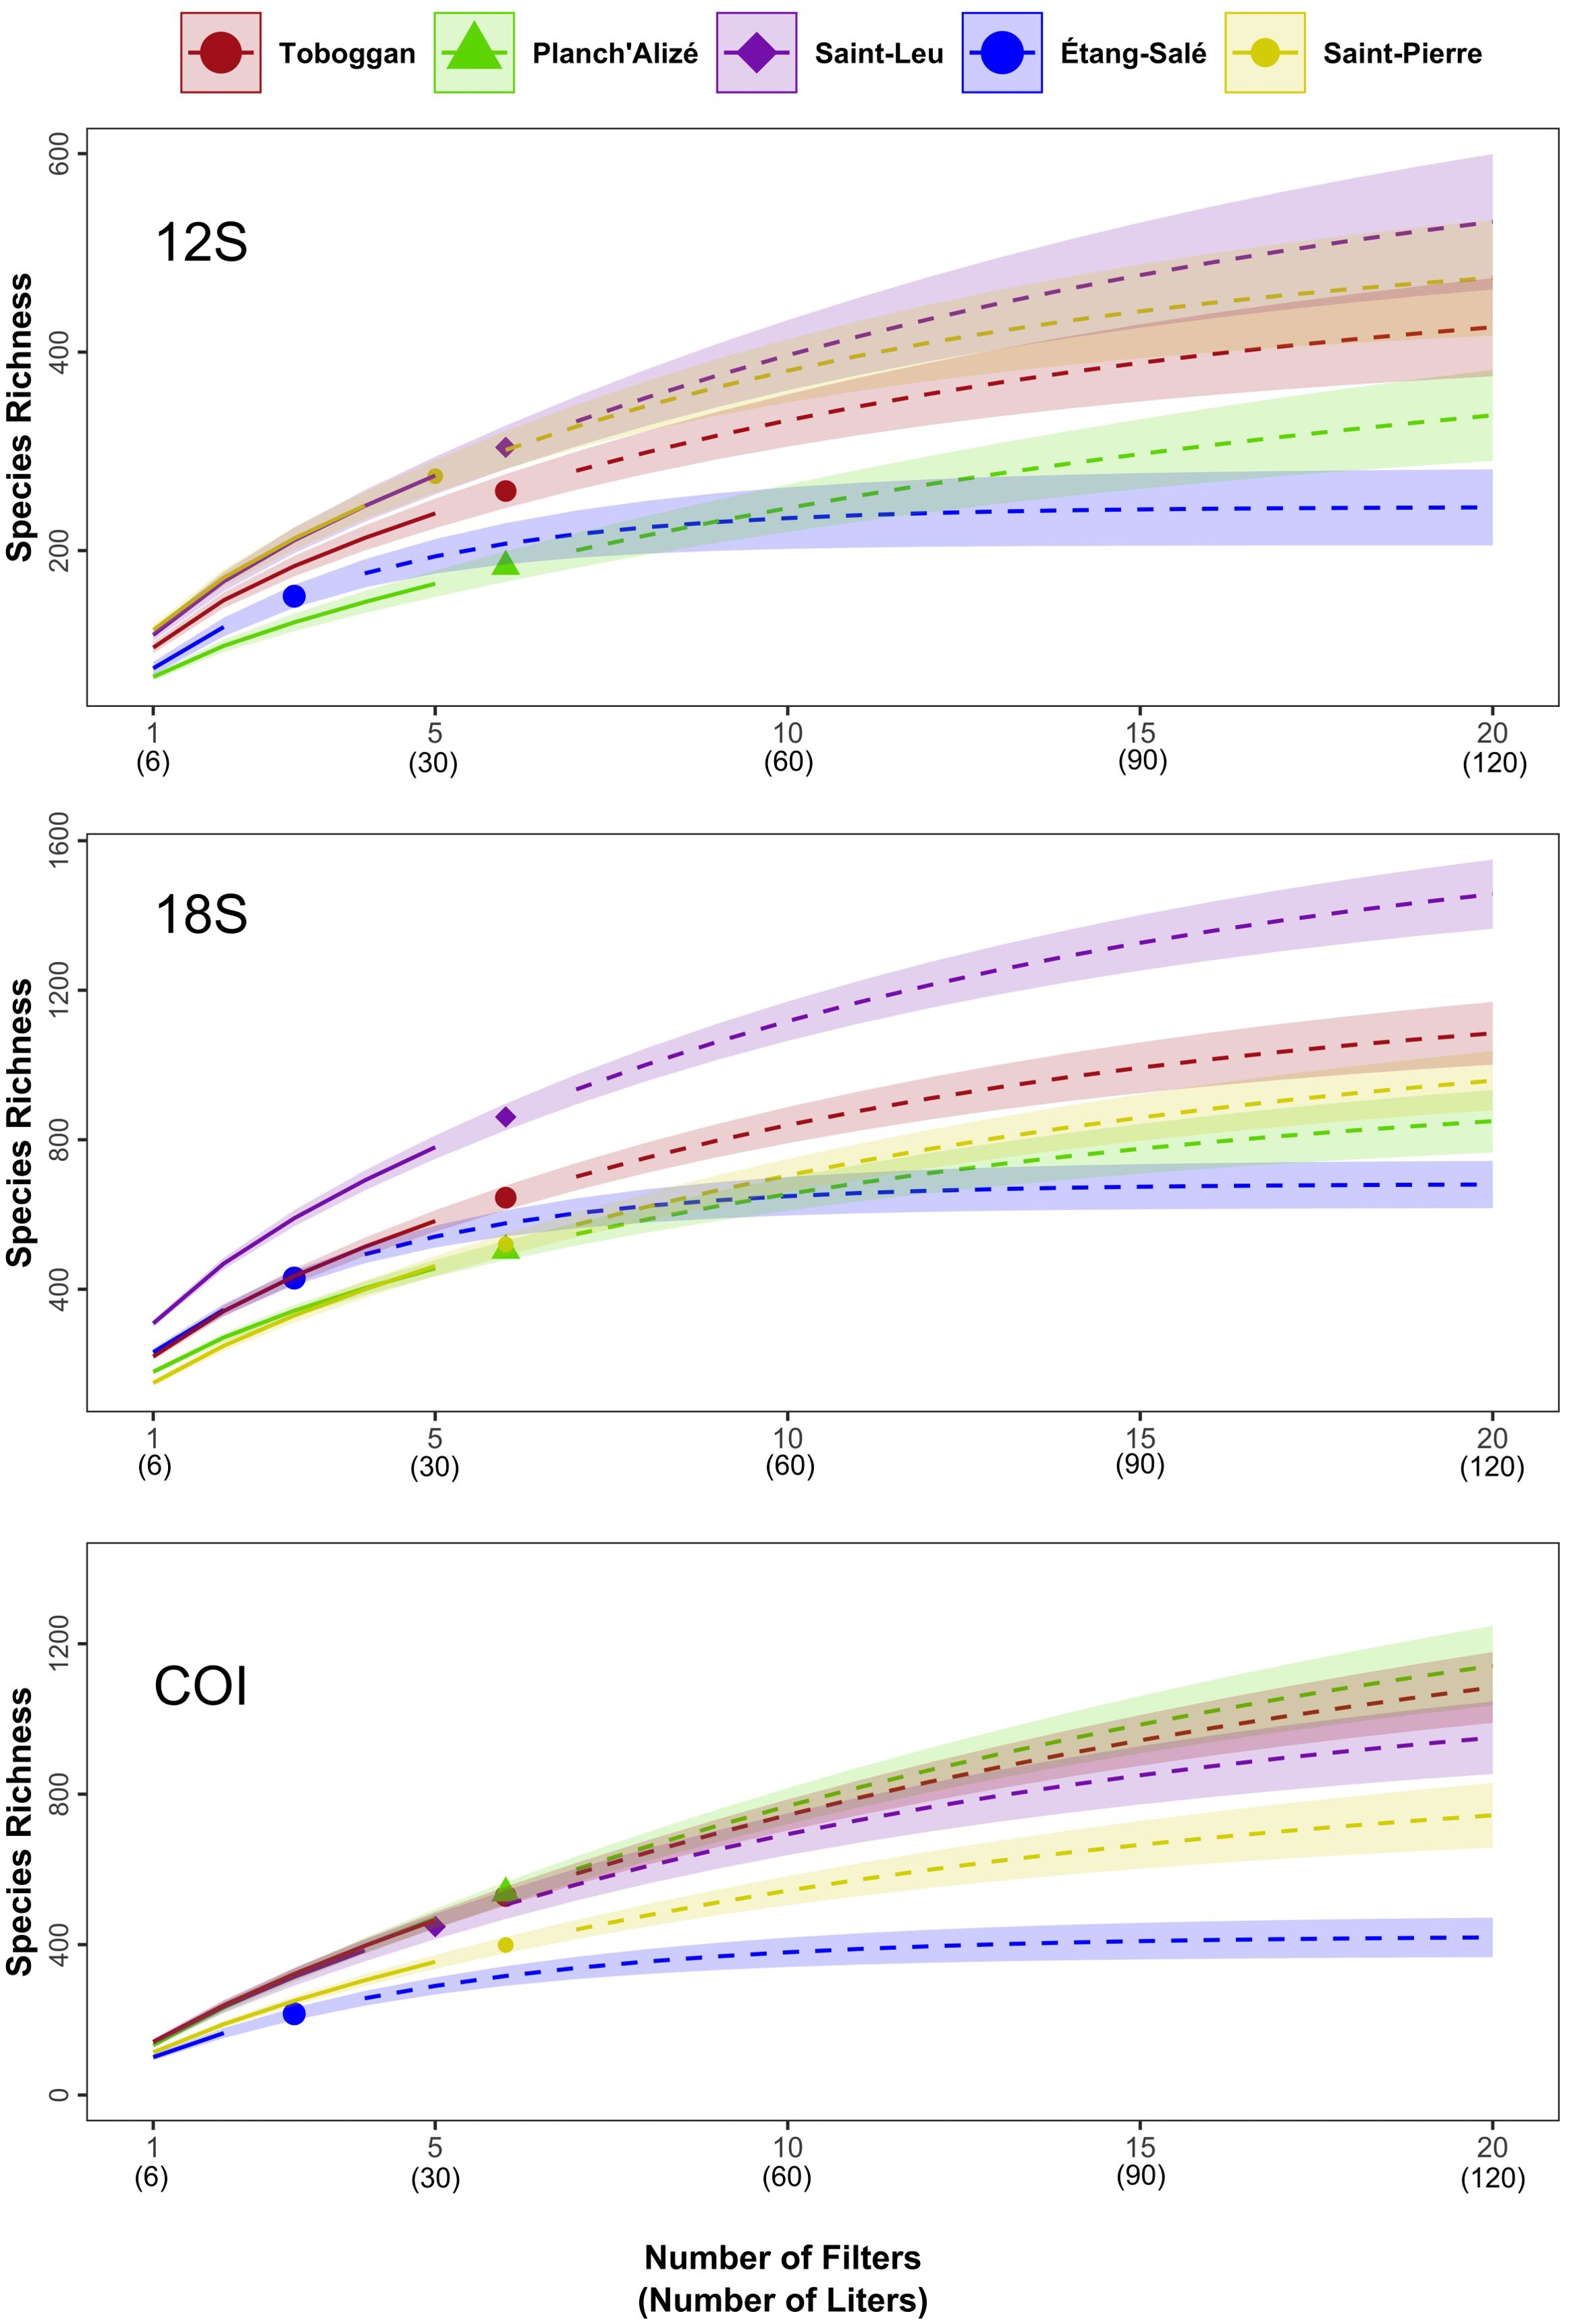
Figure 3. Species richness (q = 0) accumulation curves for each site by the number of filters and liters, calculated using iNEXT for the 12S (top), 18S (middle), and COI (bottom) datasets. The solid lines indicate values for the present collections, whose number is denoted by different symbols (colored circles, diamonds, triangles) while the dotted line shows the predicted richness beyond the number collections (extrapolated). The 95% confidence intervals are indicated by the shading.
Figure 4 illustrates the relative abundance of ASVs assigned to 21 common fish families for the five collection sites, as detected using the 12S dataset. Common families were identified as having ≥ 10 ASVs assigned across the entire dataset (all sites), and out of 60 fish families detected by 12S, these 21 families accounted for 87 - 93% of all ASVs per site (Figure 4). All five sites had high relative abundances of ASVs assigned to Gobiidae (gobies, 8 - 13% of ASVs at each site), Pomacentridae (damsel and clown fishes, 10 - 15%), Labridae (wrasses, 9 - 15%), and Acanthuridae (surgeon fish and tangs, 10 - 13%). Comparing across sites, we also observed notable differences in the relative abundance of specific families. Planch’Alizé had a lower relative abundance of the family Blenniidae (blennies) compared to other sites (2.5% at Planch’Alize compared to >12% elsewhere), while Muraenidae (eels) had higher relative abundance at Saint-Pierre (14% at Saint-Pierre compared to <9% elsewhere) indicating a greater presence of ASVs assigned to this family at this site (Figure 4). In contrast, several families had lower relative abundances (<2.5%) at every site, such as Apogonidae (cardinalfishes, not identified from Étang-Salé), Mugilidae (mullets), Belonidae (needlefish), Tetraodontidae (pufferfish), and Kyphosidae (sea chubs, not identified from Planch’Alizé) and Scorpaenidae (scorpion fishes and rock fishes) (Figure 4).
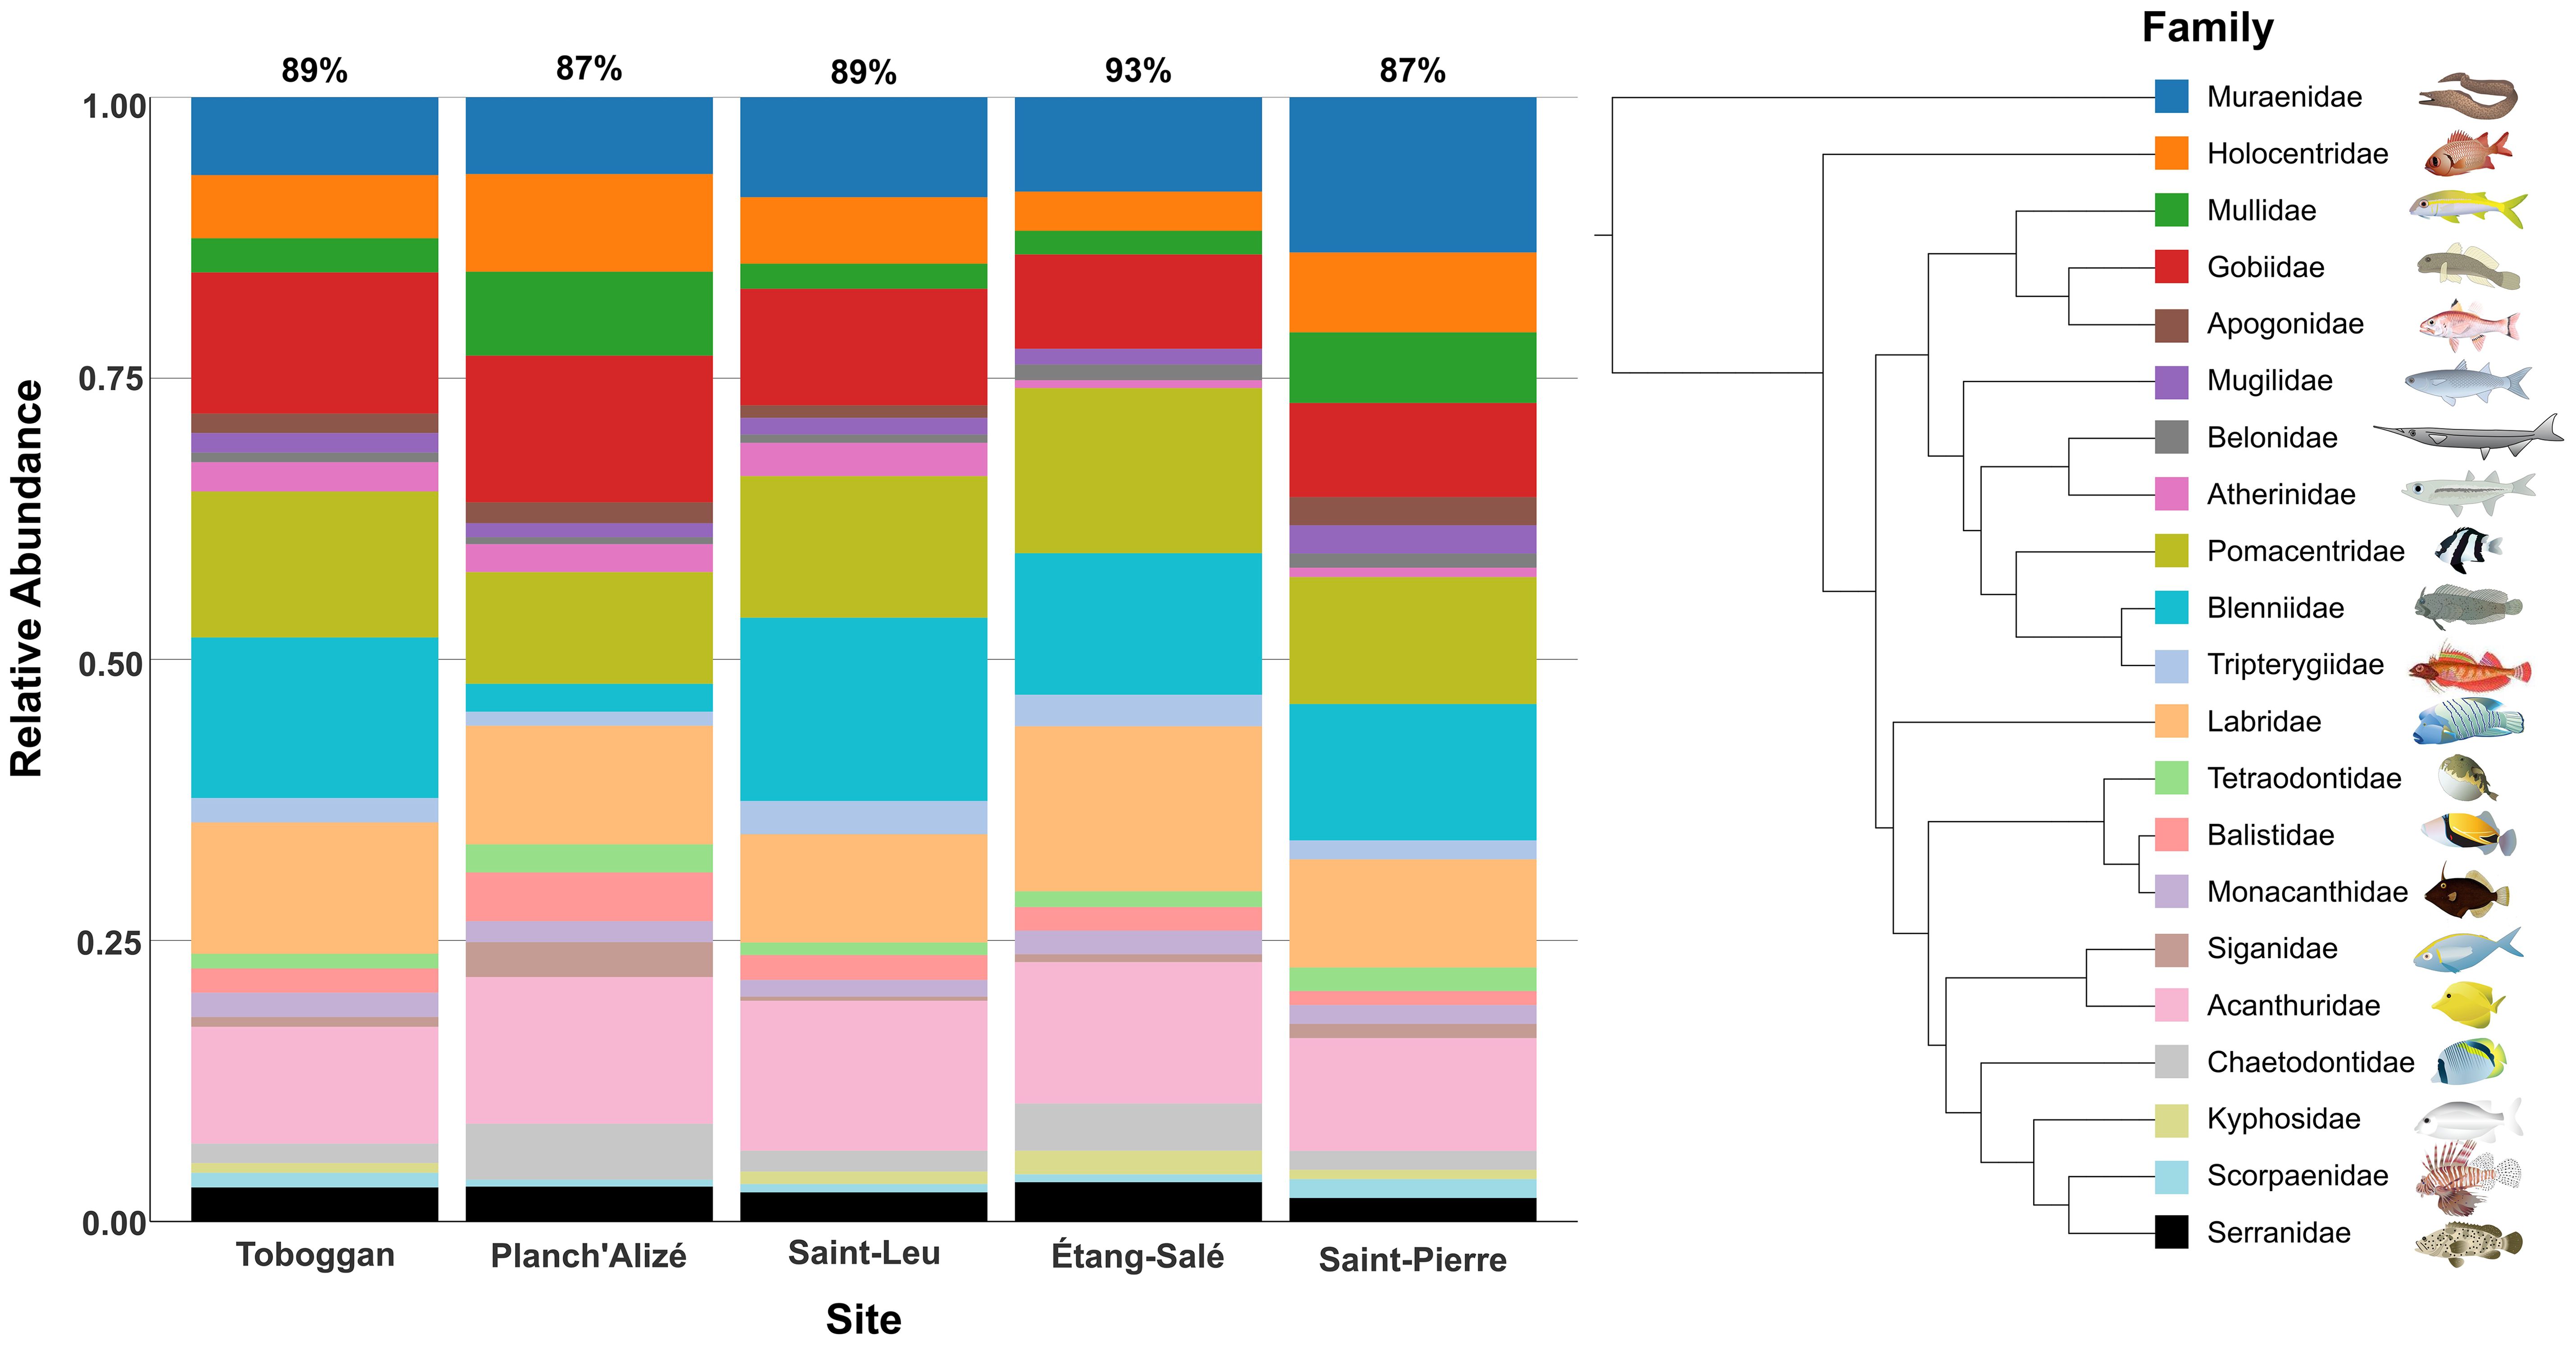
Figure 4. Relative abundance of ASVs for the most common families of fish observed at each site, as identified from the 12S dataset. Twenty-one families were identified as having ≥ 10 ASVs assigned across the total dataset (all sites). The percentages above each bar represent the proportion of total ASVs attributed to the 21 families at each site. The tree was generated through the interactive tree of life (iTOL) v.6.8.1 interface (Letunic and Bork, 2021), aided by the Fish Tree of Life (Rabosky et al., 2018) and illustrates hypothesized taxonomic relationships of the families; however, tree lengths were not used as the image does not focus on evolutionary comparisons. Fish images are courtesy of the University of Maryland Center for Environmental Science Integration and Application Network (ian.umces.edu), NOAA photo library (www.photolib.noaa.gov), the Phila print shop (www.philaprintshop.com) and Wikimedia Commons. Images are used as representatives of the respective family and these exact species may not necessarily be found at the sampled sites.
Examining the 18S and COI datasets, 21 and 18 phyla, respectively, were also detected, and the most common phyla are displayed in Figure 5. Fifteen (18S) and nine (COI) phyla were identified as having ≥ 10 ASVs assigned across the entire dataset (all sites), and accounted for ≥ 98% of all ASVs per site (Figure 5). The relative abundance of these phyla varied widely by both site and eDNA dataset. The 18S dataset revealed higher relative abundances of several phyla at each site, including Annelida (17 - 25%), Arthropoda (9 - 14%), Cnidaria (6 - 11%), Mollusca (6 - 14%), and Porifera (18 - 26%), while several phyla had low relative abundances in the dataset such as Bryozoa (< 0.5%), Hemichordata (< 1%, not recovered at Étang-Salé) and Tardigrada (< 2%) (Figure 5, top). When examining certain differences between sites, Planch’Alizé had a higher relative abundance for Mollusca compared to the other sites (14% compared to ≤ 10% elsewhere), and Saint-Pierre had a higher abundance for Nematoda comparatively (17% compared to ≤ 11% elsewhere) (Figure 5, top).
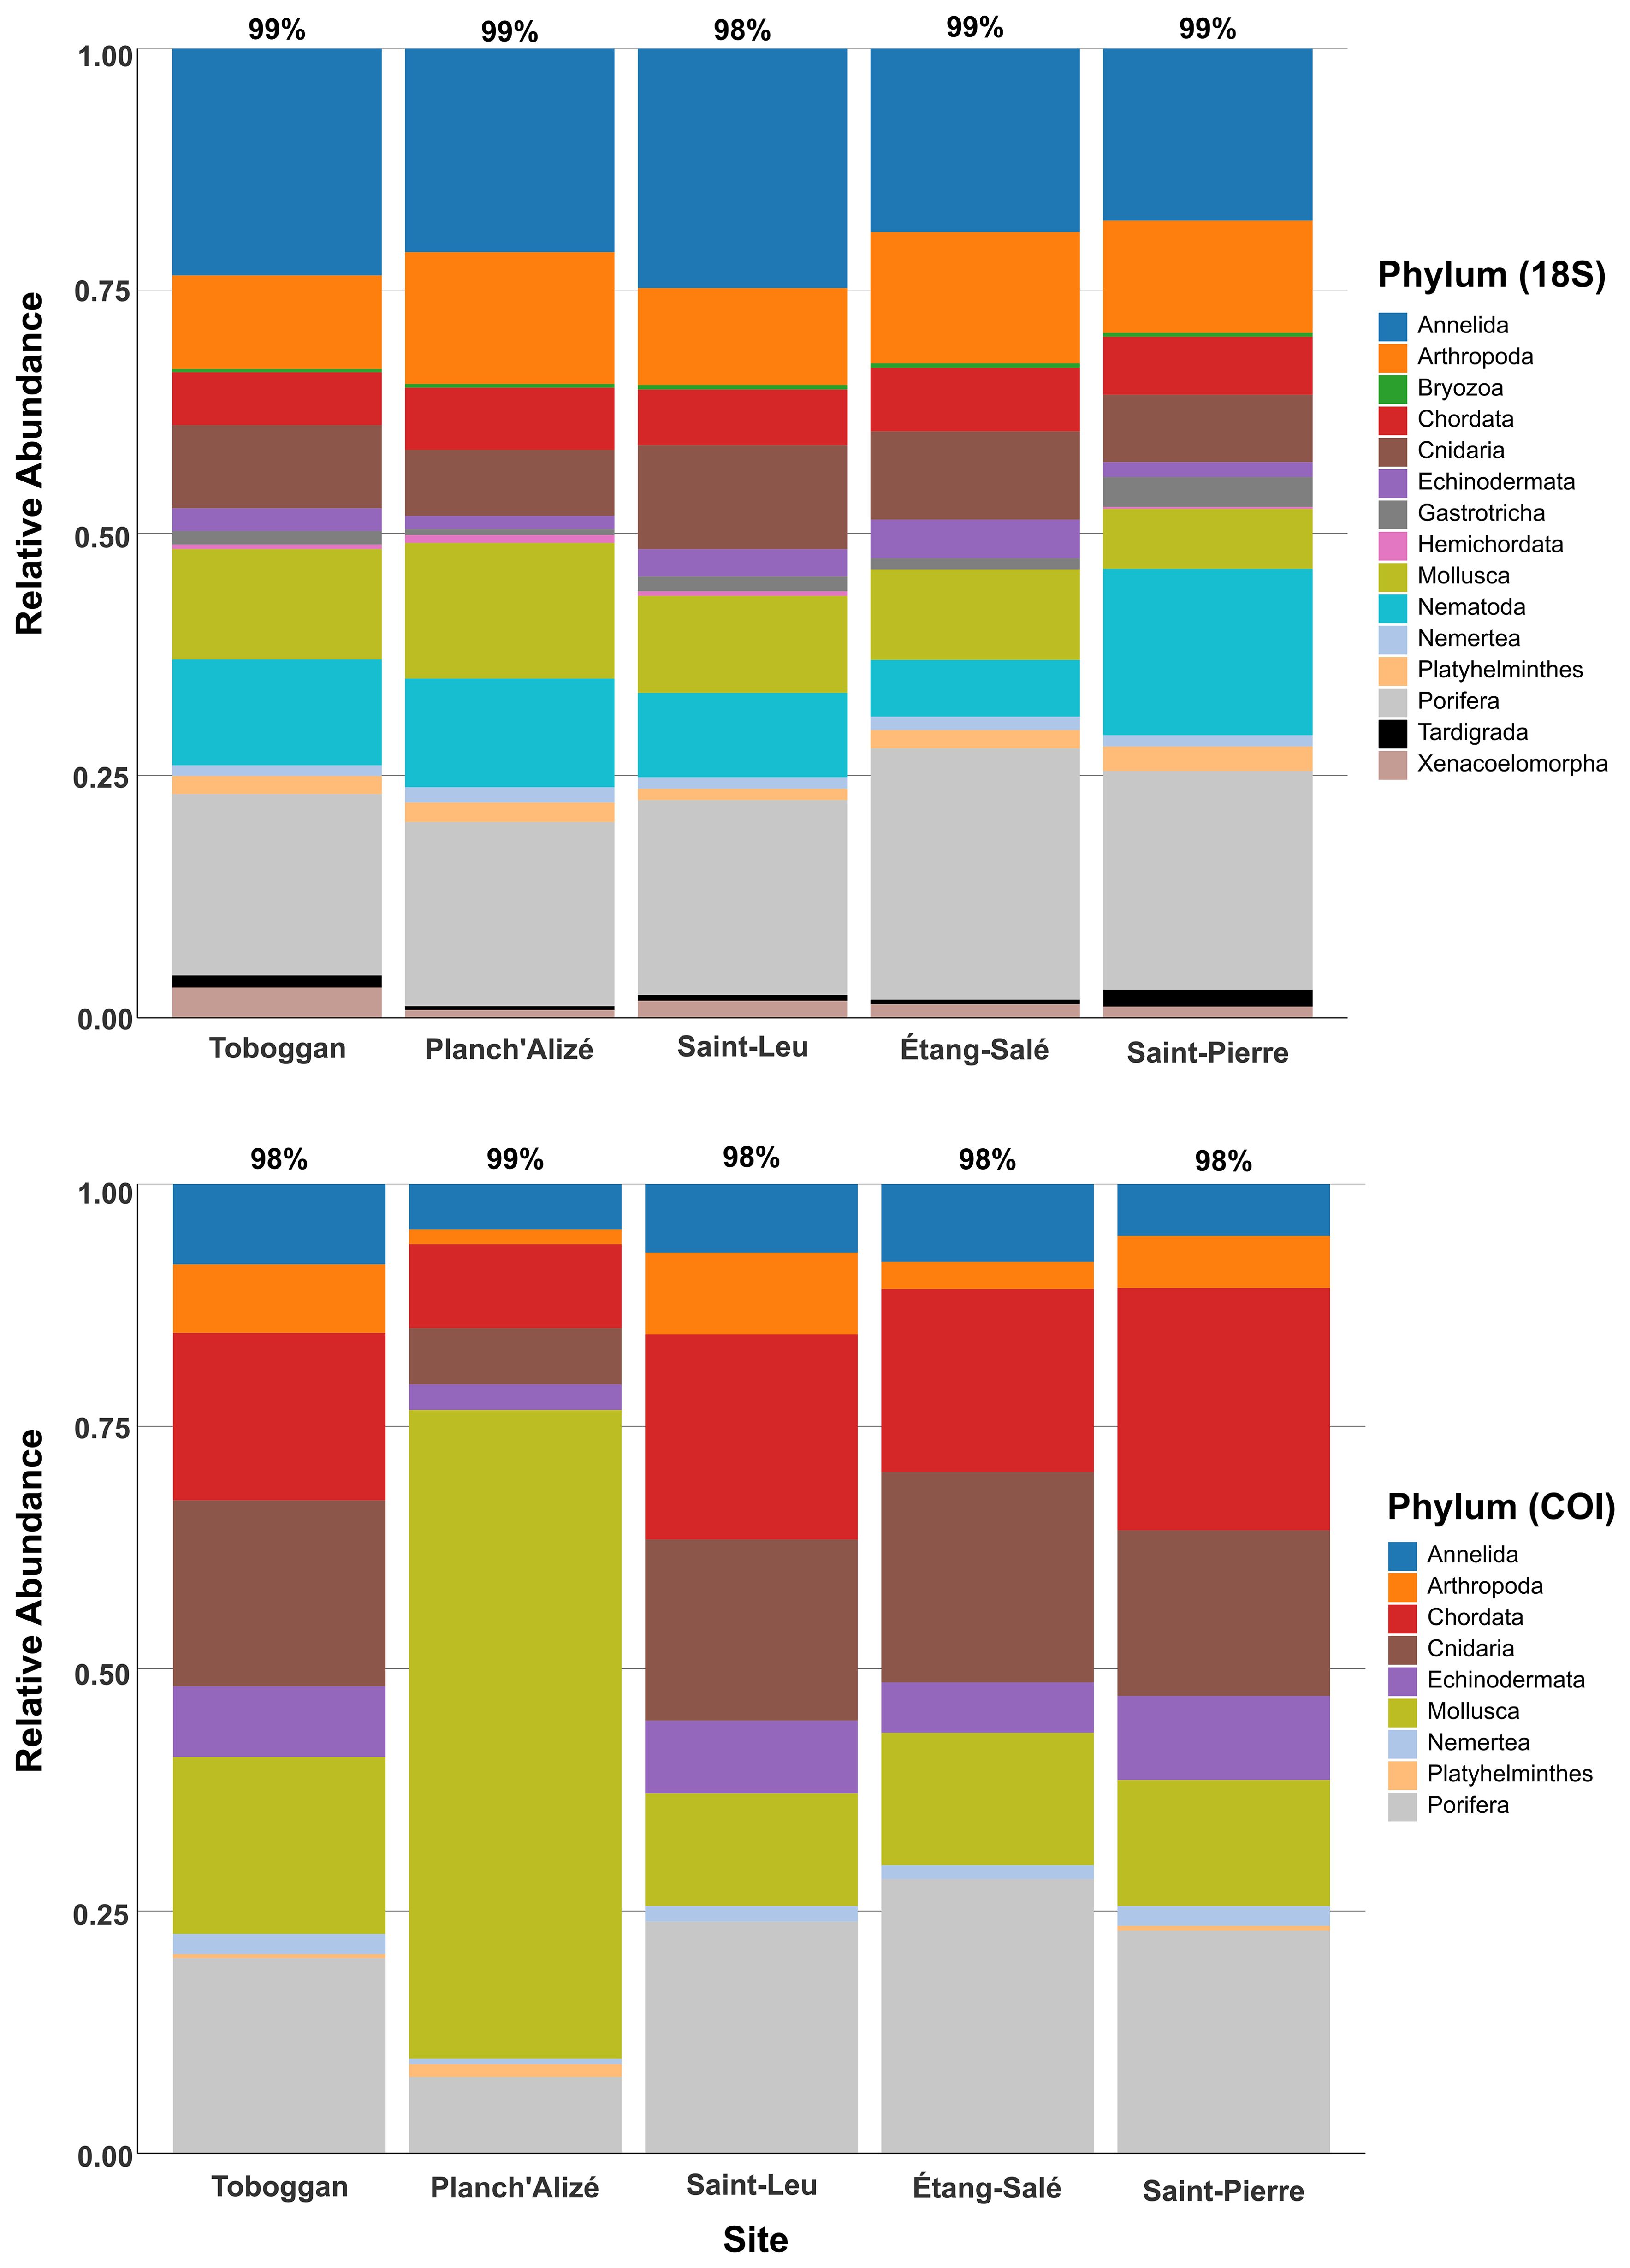
Figure 5. Relative abundance plot for the 15 most common metazoan phyla observed from each site, identified from the 18S dataset (top) and 9 most common metazoan phyla observed from each site, identified from the COI dataset (bottom). The remaining phyla not shown for 18S include Brachiopoda, Chaetognatha, Ctenophora, Entoprocta, Gnathostomulida, and Rotifera, while the remaining phyla not shown for COI include Bryozoa, Chaetognatha, Ctenophora, Entoprocta, Gastrotricha, Hemichordata, Nematoda, Rotifera and Xenacoelomorpha. The percentages above each bar represent the proportion of total ASVs attributed to the common families at each site.
The COI marker detected the same common phyla as 18S but with widely differing relative abundances across sites for Annelida (4 - 8%), Arthropoda (1 - 8%), Chordata (8 - 25%), Cnidaria (5 - 22%) and Mollusca (11 - 67%) (Figure 5, bottom). Similar to 18S, the COI dataset revealed high relative abundances for Porifera (7 - 29%) and low relative abundances for Nemertea (< 2.5%) and Platyhelminthes (< 1.5%, not detected at Saint-Leu and Étang-Salé); however, Platyhelminthes was detected at these sites through the 18S maker (Figure 5). Planch’Alizé was distinguished by the much lower relative abundances for Chordata, Cnidaria and Porifera (< 9% for all three phyla, compared to >17% elsewhere), and much higher relative abundances for Mollusca (67%) when compared to other sites (Figure 5, bottom).
Through visual inspection of communities based on nMDS ordination, a distinctive clustering pattern was observed by site for each dataset, though there was overlap between Toboggan, Saint-Leu and Étang-Salé within the 12S dataset (Figure 6). Further, clustering proximity was observed for Toboggan, Saint-Leu and Étang-Salé through the visualization of the 18S and COI datasets. Conversely, the remote positioning of Planch’Alizé and Saint-Pierre communities was shown by all three datasets. Within-site dissimilarity appeared most conspicuously for Planch’Alizé through the COI dataset, as indicated by the distance between surface and bottom samples (Figure 6). PERMANOVA testing confirmed the “Site” factor as highly significant (p < 0.001, Table 3), supporting the presence of heterogeneity amongst sites in terms of their biological communities. Testing the interaction between “Site” and “Depth” was highly significant for the COI dataset (p = 0.008), though variation between replicates was not (Table 3).
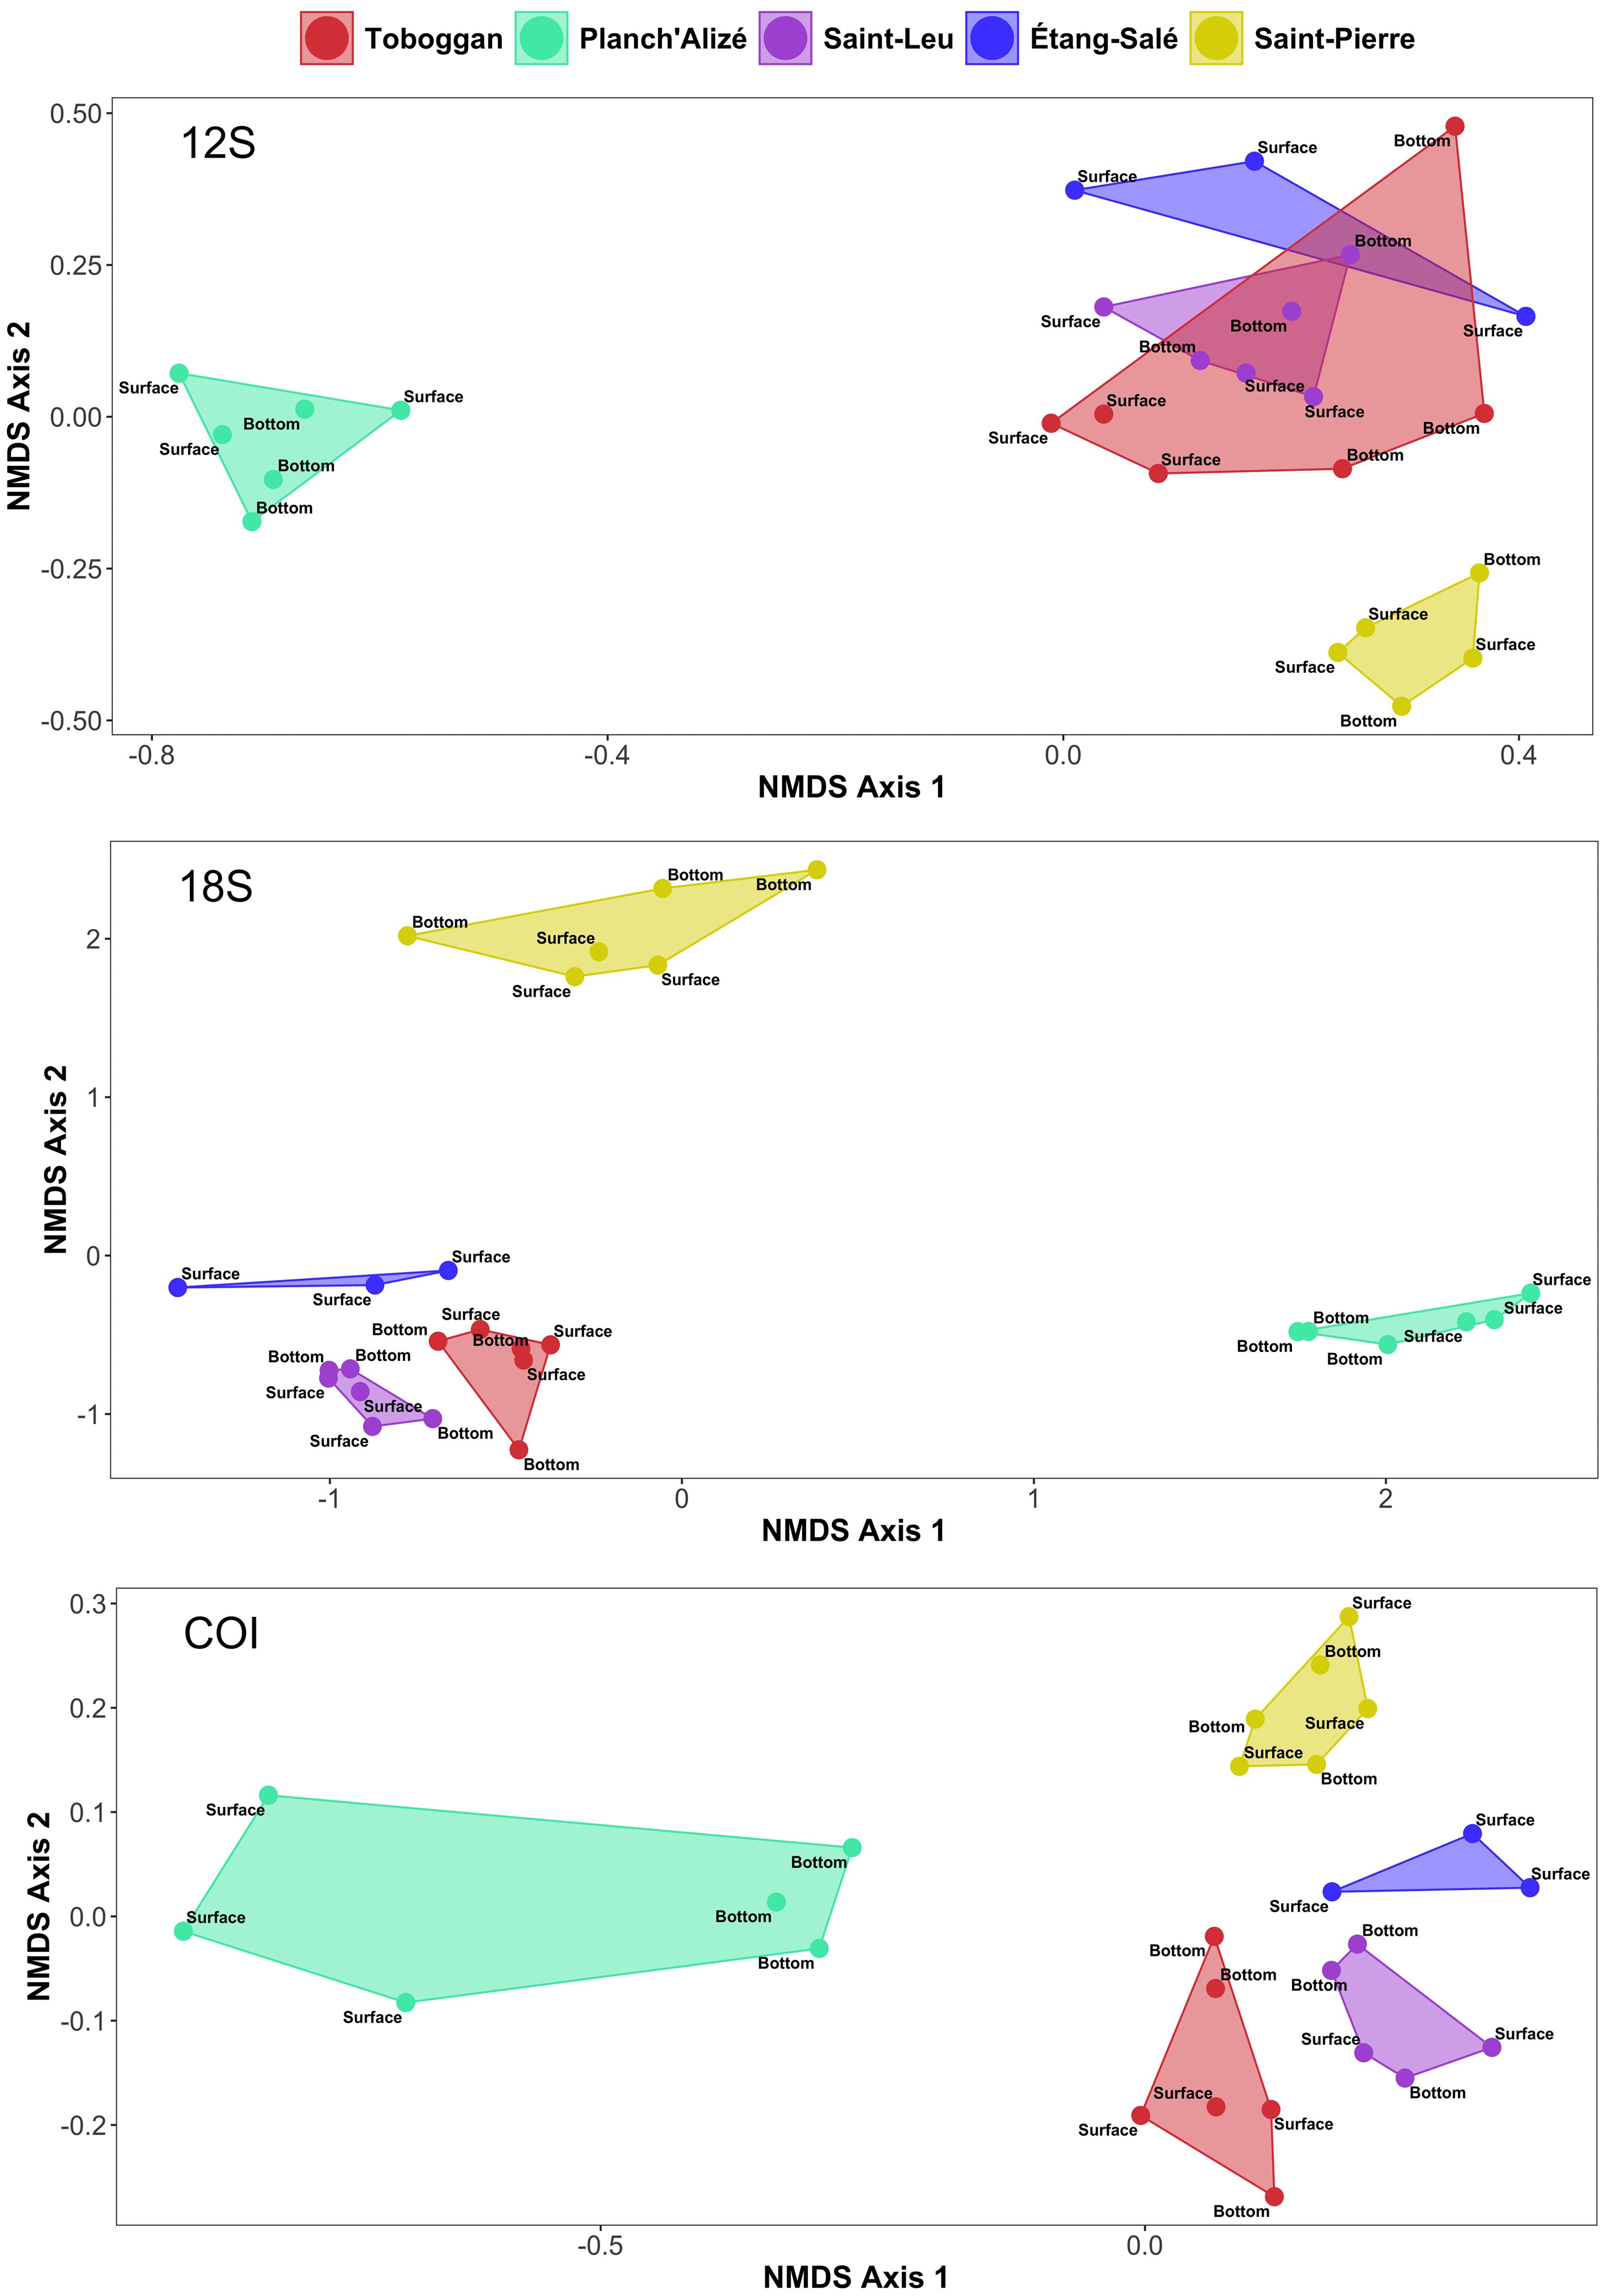
Figure 6. Non-metric multidimensional scaling (nMDS) plots based upon presence-absence data and Jaccard dissimilarity matrices for 12S (top), 18S (middle) and COI (bottom). Points indicate samples, while convex hulls identify the associations between samples for each site.
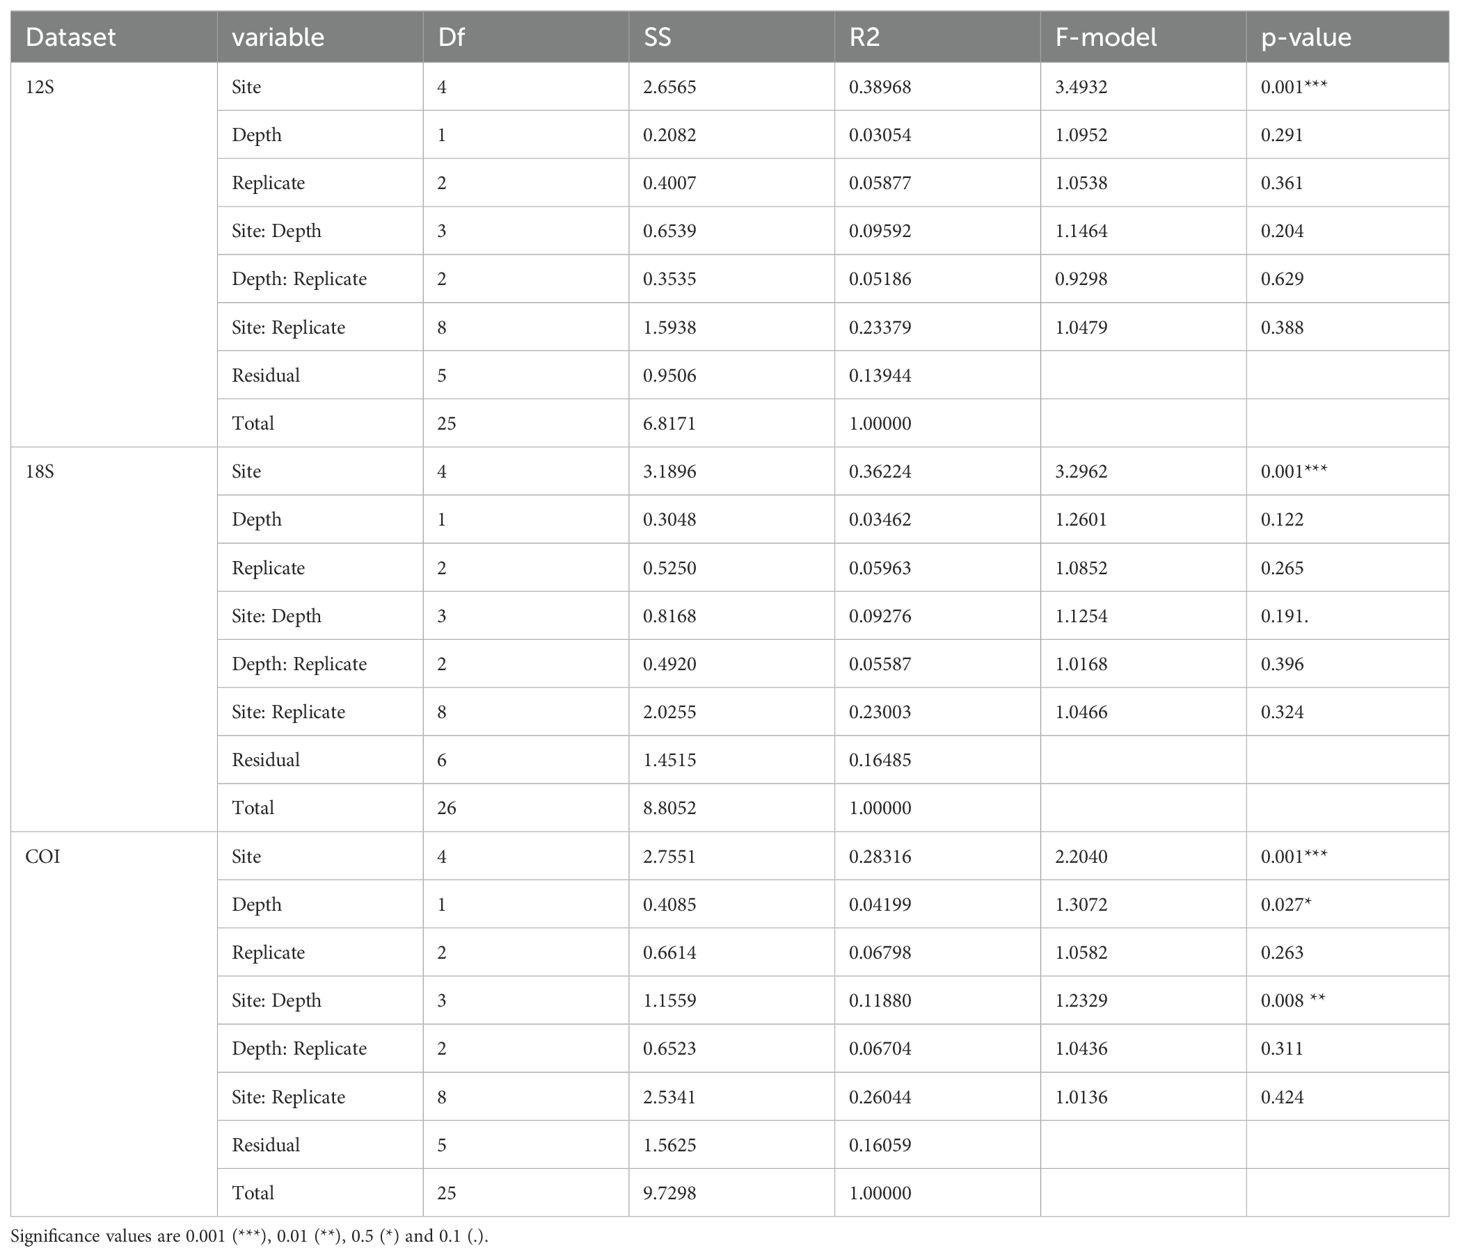
Table 3. PERMANOVA results based upon Jaccard dissimilarity matrices for the 12S, 18S and COI datasets.
nMDS ordination and PERMANOVA testing applied to each dataset without the removal of any taxa (metazoans and non-metazoans combined) revealed similar patterns of communities (Supplementary Figure S12; Supplementary Table S4). When accounting for all taxa, more distinctive separations of communities were observed; for instance, Toboggan, Saint-Leu and Étang-Salé 12S communities remained in proximity to one another, but were no longer overlapping, while Planch’Alizé and Saint-Pierre maintained their remote positioning (Supplementary Figure S12). PERMANOVA testing once again identified “Site” as highly significant in determining variations in distances between groups for all datasets (p < 0.001, Supplementary Table S4); however, all other variables and their interactions were not significant (Supplementary Table S4).
The present study provides one of the first environmental DNA screenings of coral reef communities inhabiting lagoons of Reunion Island. eDNA was recovered from five sites that are designated as monitoring stations for collection and survey programs, and these findings encourage the use of eDNA surveys for assisting biodiversity programs and local governing bodies, such as the Marine Natural Reserve of Reunion Island (RNMR), in their monitoring, management and protection of coral reef habitats of Reunion Island.
Moreover, we present operational protocols for rapid community assessment at Reunionese lagoons, through implementation of a specialized eDNA pump, self-preserving filter units, and a sampling strategy that includes replicate and depth collections. We found that eDNA metabarcoding provided a powerful glance into biological community composition present at the lagoons, and the use of multiple DNA markers allowed us to obtain a broader view of the metazoan community, through identification of differing organisms and their relative abundances recovered between each dataset. These molecular inventories can serve as baseline data for on-going austral summer collections that can be paired with complementary methods such as visual/aerial, and high-resolution multispectral and hyperspectral image surveys on the island (Conand et al., 2010; Lemahieu et al., 2012; Bajjouk et al., 2019) to provide a more comprehensive monitoring program for coral reefs. As such, the comparison of the present datasets with data obtained through visual survey monitoring programs is expected to be carried out in a subsequent study.
Initial rarefaction curves, which accounted for all ASVs, indicated that sequencing depth was adequate for characterizing species richness, and that few taxa were missing from the communities targeted by each marker (Supplementary Figure S5). Following data curation, however, accumulation curves plotted on the basis of species richness and number of filters (samples) did not reach saturation, indicating that the current sampling effort would need to be tripled to reach full characterization of the metazoan communities of each site (e.g., at least nine filters and 54 L per site, Figure 3). Previous research suggests even higher volumes are needed to fully characterize some reef communities (Stauffer et al., 2021).
Observed species richness significantly differed depending on the DNA marker, with a greater observed richness for the 18S dataset, while the richness was comparable between 12S and COI (Supplementary Figure S9). It should be noted that the 18S fragment used here targets a wider variety of organisms than 12S and had a higher initial sequencing depth compared to both 12S and COI (Table 2). When examining sites within each dataset, Planch’Alizé and Saint-Leu were distinct in terms of richness and density of organisms (Figure 2; Supplementary Figure S10). With the exception of Étang-Salé, which was undersampled due to characteristically low water levels, it was clear that communities at Planch’Alizé had a significantly lower species richness compared to the other remaining sites, including Toboggan, which also lies within the Hermitage lagoon < 2 km to the north, while Saint-Leu exhibited the highest richness (Supplementary Figure S10; Supplementary Table S3). Planch’Alizé has been characterized as experiencing nutrient enrichment from the seepage of nitrogen rich groundwater when compared to Toboggan, which experiences very little groundwater seepage (Mioche and Cuet 1999, Denis et al., 2013). Additional environmental conditions documented at Planch’Alizé include low water flow, higher mean sea surface temperatures (SST), high SST variation, variable salinities and silicate concentrations (Denis et al., 2013; Tourrand et al., 2013), as well as characteristics of high algal and low coral abundance (Chabanet et al., 1997; Denis et al., 2011; Naïm et al., 2013). As species richness and diversity of fish and invertebrate assemblages have long been known to be correlated with the architectural complexity, coverage, size and diversity of corals (Luckhurst and Luckhurst, 1978; Galzin et al., 1994; Ditzel et al., 2022), the reduced coral attributes detected at Planch’Alizé may explain lower richness values seen, at least through the 12S and 18S datasets (Supplementary Table S3), though additional collections are needed to confirm these findings. Additionally, the eDNA survey detected lower relative abundances of the family Blenniidae and higher abundance of Mollusca at Planch’Alizé, compared to other sites (Figure 4). Both groups are broad and highly diverse, therefore the factors contributing to their distinct representation at Planch’Alizé warrants further investigation.
A compilation of multiple visual surveys and collections aiming to enumerate marine fish fauna of Reunion Island identified 965 species within 158 families, with 549 of these species found at shallow coral reefs (0 - 80 m) (Fricke et al., 2009). The largest families of fish include the Labridae (wrasse), Serranidae (groupers), Gobiidae (gobies), Pomacentridae (damselfish), Blenniidae (blennies), Carangidae (jacks and others), Muraenidae (Moray eels), Acanthuridae (surgeonfish), Lutjanidae (snappers), Chaetodontidae (butterfly fish), Holocentridae (squirrelfish) and Scorpaenidae (lionfishes and others) (Fricke et al., 2009, Thébeaud et al., 2009, Tourrand et al., 2013). With only a single time period of collection for five sites, the present 12S eDNA survey identified 60 families, which is approximately 38% of the total number of estimated marine families. Among the most abundant in the eDNA dataset were also the same families identified from these previous collections: Labridae, Gobiidae, Holocentridae, Pomacentridae, Blenniidae, Muraenidae and Acanthuridae; Balistidae, Mullidae, Atherinidae, Tetraodontidae and Scorpaenidae (Figure 4).
The 18S and COI surveys detected conspicuous phyla of the coral reef benthic invertebrate community, including annelid worms, nematodes, cnidarians, porifera sponges, mollusks, echinoderms and arthropods (Figure 5). While both markers revealed some of the same phyla, their relative abundances differed across markers and sites. For instance, 18S detected higher relative abundances of Annelida when compared to COI, while COI detected higher relative abundances for Chordata and Cnidaria compared to 18S (Figure 5). The present eDNA dataset recovered taxonomic groups previously reported as either not well-studied or extremely understudied on Reunion Island such as Porifera, Platyhelminthes, Annelida, and Bryozoa (Bourmaud et al., 2005), though more recent efforts have been undertaken that improve taxa characterization of some groups (see Klautau et al., 2022). Additionally, it is widely recognized that each DNA marker has different taxa-specific ‘biases’ (discussed below) and underlines the importance of using multimarker datasets, and/or the metagenomic (non-targeted) approach to bypass constraints associated with DNA markers (see Coissac et al., 2012), to amass comprehensive molecular bio-inventories.
We detected significant differentiation amongst the sites examined, in terms of their overall biological communities. In particular, Saint Pierre and the Hermitage site Planch’Alizé appeared especially distinct from the other sites, regardless of the type of community targeted, suggesting these differences are due to site-specific factors (e.g., environmental variables, geographic distance, etc.). For instance, the distinctive metazoan communities recovered from Planch’Alizé are briefly discussed above and are presumably responsible for the patterns seen throughout the results (Figure 6; Supplementary Figure S10; Supplementary Table S3).
Saint-Pierre and Saint-Leu are adjacent to urban areas and experience nutrient enrichment from anthropogenic sources (Riaux-Gobin et al., 2011). However, the Ravine Blanche sector of Saint-Pierre, where our sampling occurred, has historically had a diverse benthic population living amongst the dominant Acropora spp corals, which were not recorded to be adversely impacted by the anthropogenic inputs and sedimentation from the d’Abord river (Ahamada et al., 2002, 2008), though we obtained moderate species richness values (Supplementary Table S3). Both Saint-Leu and Saint-Pierre were identified by 12S and 18S as having the highest concentration of ASVs and species richness (Figures 2, 3). Therefore, the differences of the communities at Saint Pierre may be linked to other factors such as its geographic distance from the other sites and/or specific chemical signatures; however, to determine which requires additional investigation.
When comparing biological communities including non-targeted/non-metazoan taxa, we found similar patterns of site and sample clustering, which was further supported by statistical testing, though we saw more distinct clustering, particularly for the 12S dataset (Figure 6; Supplementary Figure S12; Table 3; Supplementary Table S4). The overlap of samples from Toboggan, Saint-Leu and Étang-Salé sites suggest the possibility of similar fish communities (Figure 6, top). It should be mentioned that non-fish DNA can be amplified using the 12S MiFish maker, though in lower abundances (Miya et al., 2015; Anderson and Thompson 2022), therefore, the 12S dataset that contains non-target taxa should be interpreted with caution. Overall, the findings with and without non-metazoans support site specific differences, including within the Hermitage lagoon.
The choice of genetic markers for metabarcoding surveys is a critical component of barcoding-based studies. Some of the most frequently employed markers are selected from the mitochondrial COI as this gene is often able to discriminate between closely related animals and has extensive reference libraries present on MIDORI2 (Leray et al., 2022), the Barcode of Life Data Systems (BOLD) and NCBI GenBank databases (Lear et al., 2018; van der Loos et al., 2021; Othman et al., 2021), to name a few. For this initial eDNA study, we chose to use NCBI given its more expansive taxonomic coverage and wider public accessibility (Sayers et al., 2023).
While COI generally provides higher species resolution and more reliable assignments, the use of this marker is also accompanied by a higher percentage of unassigned sequences (Leray and Knowlton, 2015; Wangensteen et al., 2018; Cowart et al., 2020), and we also observed this within our study with a high percentage of unassigned ASVs and sequences remaining for this dataset (Supplementary Figure S4). Further, COI is subjected to biases associated with maternal inheritance, overestimations of species divergence and the presence of pseudogenes (Frézal and Leblois, 2008; Buhay, 2009; Deagle et al., 2014), all of which can skew assessments of biological diversity recovered through DNA sequencing approaches. A recent study implementing DNA metabarcoding of COI and 18S on samples retrieved from Autonomous Reef Monitoring Structures (ARMS) installed at a Reunionese coral reef, found that only a small percentage of the sequence reads were taxonomically assigned despite the use of differing assignation methods and databases (Couëdel et al., 2024). The study by Couëdel and colleagues, along with a higher percentage of unassigned COI sequences seen within the present study, also suggest that distinctive animal communities inhabit Reunionese coral reefs and signals a need for more comprehensive sequence database specifically compiled for the island’s coral reef fauna.
Other markers commonly used for biodiversity survey include mitochondrial ribosomal rRNA 16S and 12S, and the nuclear 18S, which are relatively conserved and evolve more slowly than some other genes and regions (Machida and Knowlton, 2012; Cawthorn et al., 2012). While 18S markers may have less power for separation of certain groups at lower taxonomic levels (Creer et al., 2016; Leray and Knowlton, 2015), some regions such as VI-V2, are useful for identifying an array of benthic invertebrates such as annelids, arthropods, molluscs and nematodes in water and sediment that would be missed by other markers (Holman et al., 2019; Brandt et al., 2021; Othman et al., 2021), which was also supported in the present study (Figure 5). Given these benefits and drawbacks of each gene, we chose to produce a multi-fragment dataset, though there still remains a varied percentage of unknown/unassigned taxa for each dataset (Supplementary Figure S4). Therefore, in addition to assignment against well populated databases, eDNA data should be assigned against well curated and comprehensive local databases to decrease the number of taxa that remain unidentified and provide more robust biodiversity assessments.
Most of the negative field controls for each gene marker had very low diversity and sequencing depth, as expected (Supplementary Figure S5). A separate examination of the controls identified that for each dataset, the few ASVs present were dominated by non-interest taxa (Supplementary Figures S6–S8), which, when removed from the experimental samples, did not transform the overall final results (Supplementary Figure S12; Supplementary Table S4). In terms of metazoan taxa, the 12S dataset contained fish DNA matching to the family Istiophoridae (billfish) (Supplementary Table S3). This particular ASV was present in higher abundances in only two experimental samples (one bottom sample from Toboggan and one bottom sample from Saint-Pierre), compared to the negative controls (Supplementary Table S3). This family is typically not present in the lagoons of Reunion Island, though it may be possible for larvae to drift from oceanic habitats into the coastal lagoons (Shiroza, pers. comm.), and sailfish can be observed at the outer reef slopes. The limited presence of Istiophoridae in some samples suggests that its DNA may have been introduced at some point during the handling of the filters.
The presence of some ASVs within negative field controls are not totally unexpected, though not as often reported (Harper et al., 2019; Sepulveda et al., 2020; Furlan et al., 2020). In this study, we report the recovery of target fauna in the negative controls. While limited, these findings further support the sensitivity of the eDNA approach, as well as emphasizing the continued importance of integrating negative controls, including a filter that has not been in contact with the pump or exposed to water, and adhering to clean handling practices throughout the workflow to reduce future risks of such contamination.
During the sample collection phase of the project, we implemented a portable eDNA system consisting of a specialized pump known as the ‘eDNA sampler’ and associated self-preserving filter units, which were both developed by Smith-Root. To date, the eDNA sampler has primarily been used for studies targeting freshwater ecosystems (see Thomas et al., 2019; Nolan et al., 2023, but also von Ammon et al., 2023); however, we demonstrate its successful deployment at tropical coral reefs habitats. The eDNA sampler facilitated straightforward collection of 6 L of water per sample and three true replicates for each depth treatment, using its associated trident pole. There was no significant variation between triplicate samples or depths ≤ 2 m (Table 3), supporting the consistency of the technical strategy of the collections, and suggesting that the variations we observe between sites are most likely attributed to true biological differences. Further, the volumes and replicates were sufficient to recover a wide variety of eukaryotic taxa (Supplementary Figure S5); however, when accounting for only metazoan taxa, species accumulation curves indicated that additional sampling is needed to characterize the communities more thoroughly (Figure 3). Previous studies have found that increasing the volume of water and/or number of replicates is likely to augment the number of observed and expected target taxa captured at coral reefs (Bessey et al., 2020; Stauffer et al., 2021; Xing et al., 2022). We can therefore improve our eDNA workflow through the collection of additional samples (increased volumes), aim for higher sequencing depths and perform taxonomic assignments to more localized reference databases (Takahashi et al., 2023), all of which will assuredly improve taxonomic coverage for achieving more complete biodiversity inventories for Reunionese lagoons.
The datasets presented in this study can be found in online repositories. The names of the repository/repositories and accession number(s) can be found below: https://www.ncbi.nlm.nih.gov/, PRJNA1043860, https://zenodo.org/, 10.5281/zenodo.8410270.
DC: Conceptualization, Data curation, Formal analysis, Funding acquisition, Investigation, Methodology, Validation, Writing – original draft, Writing – review & editing. TC: Formal analysis, Investigation, Methodology, Writing – review & editing. A-EN: Conceptualization, Funding acquisition, Investigation, Methodology, Project administration, Resources, Supervision, Validation, Writing – review & editing. JC: Investigation, Methodology, Writing – review & editing. SeB: Conceptualization, Funding acquisition, Investigation, Project administration, Resources, Supervision, Validation, Writing – review & editing. SyB: Conceptualization, Funding acquisition, Investigation, Methodology, Project administration, Resources, Supervision, Validation, Writing – review & editing.
Prior to the collection of water samples within the marine reserve, the Réserve Marine Naturelle de La Réunion (RNMR) was notified.
The author(s) declare financial support was received for the research, authorship, and/or publication of this article. The Plancha and p-Pumpit projects were supported by the Contrat de convergence et de transformation 2019-2022, mesure 3.3.1.1 de la Préfecture de la Réunion, France.
We are sincerely grateful to the team at ADNid, and specifically Pascal Alonso, for their data handling expertise. We also extend our thanks to the representatives at Smith-Root for their guidance during the course of this project, as well as reviewers for their valuable feedback and insightful comments.
Authors DC, TC, A-EN, and JC were employed by Company for Open Ocean Observations and Logging (COOOL).
The remaining authors declare that the research was conducted in the absence of any commercial or financial relationships that could be construed as a potential conflict of interest.
All claims expressed in this article are solely those of the authors and do not necessarily represent those of their affiliated organizations, or those of the publisher, the editors and the reviewers. Any product that may be evaluated in this article, or claim that may be made by its manufacturer, is not guaranteed or endorsed by the publisher.
The Supplementary Material for this article can be found online at: https://www.frontiersin.org/articles/10.3389/fmars.2024.1423676/full#supplementary-material
Ahamada S., Bigot L., Bijoux J., Maharavo J., Meunier S., Moyne-Picard M., et al. (2002). Chapter 5: Status of Coral Reefs in the South West Indian Ocean Island Node: Comoros, Madagascar, Mauritius, Reunion and Seychelles. In: Wilkinson C.. Status of coral reefs of the world: 2002. (IUCN), p. 79–100. Available online at: https://aquadocs.org/handle/1834/366.
Ahamada S., Bijoux J., Cauvin B., Hagan A., Harris A., Koonjul M., et al. (2008). Chapter 7: Status of the coral reef of the South-West Indian Ocean island states: Comoros, Madagascar, Mauritius, Réunion, Seychelles. In: Wilkinson C. (Ed). Status of coral reefs of the world: 2008. (Townsville, Australia: Global Coral Reef Monitoring Network and Reef and Rainforest Research Centre), p. 73–79.
Alberdi A., Aizpurua O., Gilbert M. T. P., Bohmann K. (2018). Scrutinizing key steps for reliable metabarcoding of environmental samples. Methods Ecol. Evol. 9, 134–147. doi: 10.1111/2041-210X.12849
Anderson S. R., Thompson L. R. (2022). Optimizing an enclosed bead beating extraction method for microbial and fish environmental DNA. Environ. DNA 4, 291–303. doi: 10.1002/edn3.251
Bajjouk T., Mouquet P., Ropert M., Quod J.-P., Hoarau L., Bigot L., et al. (2019). Detection of changes in shallow coral reefs status: Towards a spatial approach using hyperspectral and multispectral data. Ecol. Indic. 96, 174–191. doi: 10.1016/j.ecolind.2018.08.052
Berry T. E., Saunders B. J., Coghlan M. L., Stat M., Jarman S., Richardson A. J., et al. (2019). Marine environmental DNA biomonitoring reveals seasonal patterns in biodiversity and identifies ecosystem responses to anomalous climatic events. PloS Genet. 15, e1007943. doi: 10.1371/journal.pgen.1007943
Bessey C., Jarman S. N., Berry O., Olsen Y. S., Bunce M., Simpson T., et al. (2020). Maximizing fish detection with eDNA metabarcoding. Environ. DNA 2, 493–504. doi: 10.1002/edn3.74
Blaxter M. L., De Ley P., Garey J. R., Liuk L. X., Scheldeman P., Vierstraete A., et al. (1998). A molecular evolutionary framework for the phylum Nematoda. Nature 392, 71–75. doi: 10.1038/32160
Bourmaud C., Abouïdane A., Boissier P., Leclère L., Mirault E., Pennober G. (2005). Coastal and marine biodiversity of La Réunion. Indian J. Mar. Sci. 34, 98–103.
Brandt M. I., Pradillon F., Trouche B., Henry N., Liautard-Haag C., Cambon‑Bonavita M.-A., et al. (2021). Evaluating sediment and water sampling methods for the estimation of deep-sea biodiversity using environmental DNA. Sci. Rep. 11, 7856. doi: 10.1038/s41598-021-86396-8
Brandt M. I., Trouche B., Quintric L., Wincker P., Poulain J., Arnaud-Haond S.. (2019). “A flexible pipeline combining clustering and correction tools for prokaryotic and eukaryotic metabarcoding.” BioRxiv, 717355. doi: 10.1101/717355
Buhay J. E. (2009). COI-like” Sequences are becoming problematic in molecular systematic and DNA barcoding studies. J. Crustac Biol. 29, 96–110. doi: 10.1651/08-3020.1
Callahan B. J., McMurdie P. J., Rosen M. J., Han A. W., Johnson A. J. A., Holmes S. P. (2016). DADA2: High resolution sample inference from Illumina amplicon data. Nat. Methods 13, 581–583. doi: 10.1038/nmeth.3869
Caporaso J. G., Kuczynski J., Stombaugh J., Bittinger K., Bushman F. D., Costello E. K., et al. (2010). QIIME allows analysis of high-throughput community sequencing data. Nat. Methods 7, 335–336. doi: 10.1038/nmeth.f.303
Cawthorn D.-M., Steinman H. A., Witthuhn R. C. (2012). Evaluation of the 16S and 12S rRNA genes as universal markers for the identification of commercial fish species in South Africa. Gene 491, 40–48. doi: 10.1016/j.gene.2011.09.009
Chabanet P., Ralambondrainy H., Amanieu M., Faure G., Galzin R. (1997). Relationships between coral reef substrata and fish. Coral Reefs 16, 93–102. doi: 10.1007/s003380050063
Chao A., Gotelli N. J., Hsieh T. C., Sander E. L., Ma K. H., Colwell R. K., et al. (2014). Rarefaction and extrapolation with Hill numbers: a framework for sampling and estimation in species diversity studies. Ecol. Monogr. 84, 45–67. doi: 10.1890/13-0133.1
Chiarello M., McCauley M., Villéger S., Jackson C. R. (2022). Ranking the biases: The choice of OTUs vs. ASVs in 16S rRNA amplicon data analysis has stronger effects on diversity measures than rarefaction and OTU identity threshold. PloS One 17, e0264443. doi: 10.1371/journal.pone.0264443
Coissac E., Riaz T., Puillandre N. (2012). Bioinformatic challenges for DNA metabarcoding of plants and animals. Mol. Ecol. 21, 1834–1847. doi: 10.1111/j.1365-294X.2012.05550.x
Conand C., Michonneau F., Paulay G., Bruggemann H. (2010). Diversity of the holothuroid fauna (Echinodermata) at la Réunion (Western Indian ocean). Western Indian Ocean J. Mar. Sci. 9, 145–151.
Cormier A., Durand P., Noel C., Leroi L. (2021). SAMBA: Standardized and Automated MetaBarcoding Analyses workflow. (Plouzané, France: IFREMER) doi: 10.48546/WORKFLOWHUB.WORKFLOW.156.1
Couëdel M., Dettai A., Guillaume M. M., Bonillo C., Frattini B., Bruggemann J. H. (2024). Settlement patterns and temporal successions of coral reef cryptic communities: implications for evaluating diversity using Autonomous Reef Monitoring Structures (ARMS). doi: 10.21203/rs.3.rs-3770683/v1
Cowart D. A., Matabos M., Brandt M. I., Marticorena J., Sarrazin J. (2020). Exploring environmental DNA (eDNA) to assess biodiversity of hard substratum faunal communities on the lucky strike vent field (Mid-atlantic ridge) and investigate recolonization dynamics after an induced disturbance. Front. Mar. Sci. 6. doi: 10.3389/fmars.2019.00783
Cowart D. A., Murphy K. R., Cheng C.-H. C. (2022). “Environmental DNA from Marine Waters and Substrates: Protocols for Sampling and eDNA Extraction,” in Marine Genomics: Methods and Protocols. Eds. Verde C., Giordano D. (Springer US, New York, NY), 225–251. doi: 10.1007/978-1-0716-2313-8_11
Creer S., Deiner K., Frey S., Porazinska D., Taberlet P., Thomas W. K., et al. (2016). The ecologist’s field guide to sequence-based identification of biodiversity. Methods Ecol. Evol. 7, 1008–1018. doi: 10.1111/2041-210X.12574
Deagle B. E., Jarman S. N., Coissac E., Pompanon F., Taberlet P. (2014). DNA metabarcoding and the cytochrome c oxidase subunit I marker: not a perfect match. Biol. Lett. 10, 20140562. doi: 10.1098/rsbl.2014.0562
Deiner K., Bik H. M., Mächler E., Seymour M., Lacoursière-Roussel A., Altermatt F., et al. (2017). Environmental DNA metabarcoding: Transforming how we survey animal and plant communities. Mol. Ecol. 26, 5872–5895. doi: 10.1111/mec.14350
Denis V., Debreuil J., De Palmas S., Richard J., Guillaume M., Bruggemann J. (2011). Lesion regeneration capacities in populations of the massive coral Porites lutea at Réunion Island: environmental correlates. Mar. Ecol. Prog. Ser. 428, 105–117. doi: 10.3354/meps09060
Denis V., Guillaume M. M. M., Goutx M., de Palmas S., Debreuil J., Baker A. C., et al. (2013). Fast growth may impair regeneration capacity in the branching coral acropora muricata. PloS One 8, e72618. doi: 10.1371/journal.pone.0072618
Díaz-Ferguson E. E., Moyer G. R. (2014). History, applications, methodological issues and perspectives for the use of environmental DNA (eDNA) in marine and freshwater environments. Rev. Biol. Trop. 62, 1273–1284. doi: 10.15517/rbt.v62i4.13231
Ditzel P., König S., Musembi P., Peters M. K. (2022). Correlation between coral reef condition and the diversity and abundance of fishes and sea urchins on an east African coral reef. Oceans 3, 1–14. doi: 10.3390/oceans3010001
Djurhuus A., Closek C. J., Kelly R. P., Pitz K. J., Michisaki R. P., Starks H. A., et al. (2020). Environmental DNA reveals seasonal shifts and potential interactions in a marine community. Nat. Commun. 11, 254. doi: 10.1038/s41467-019-14105-1
Djurhuus A., Pitz K., Sawaya N. A., Rojas-Márquez J., Michaud B., Montes E., et al. (2018). Evaluation of marine zooplankton community structure through environmental DNA metabarcoding. Limnol. Ocean Methods 16, 209–221. doi: 10.1002/lom3.10237
Doorenspleet K., Jansen L., Oosterbroek S., Bos O., Kamermans P., Janse M., et al. (2021). “High resolution species detection: accurate long read eDNA metabarcoding of North Sea fish using Oxford Nanopore sequencing.” BioRxiv. doi: 10.1101/2021.11.26.470087
Eddy T. D., Lam V. W. Y., Reygondeau G., Cisneros-Montemayor A. M., Greer K., Palomares M. L. D., et al. (2021). Global decline in capacity of coral reefs to provide ecosystem services. One Earth 4, 1278–1285. doi: 10.1016/j.oneear.2021.08.016
Edinger E. N., Jompa J., Limmon G. V., Widjatmoko W., Risk M. J. (1998). Reef degradation and coral biodiversity in Indonesia: effects of land-based pollution, destructive fishing practices and changes over time. Mar. pollut. Bull. 36 (8), 617–630.
Frézal L., Leblois R. (2008). Four years of DNA barcoding: Current advances and prospects. Infect. Genet. Evol. 8, 727–736. doi: 10.1016/j.meegid.2008.05.005
Fricke R., Mulochau T., Durville P., Chabanet P., Tessier E., Letourneur Y. (2009). “Annotated checklist of the fish species (Pisces) of La Réunion, including a Red List of threatened and declining species.” Stuttgarter Beiträge zur Naturkunde A, Neue Serie 2, 1–168.
Furlan E. M., Davis J., Duncan R. P. (2020). Identifying error and accurately interpreting environmental DNA metabarcoding results: A case study to detect vertebrates at arid zone waterholes. Mol. Ecol. Resour. 20, 1259–1276. doi: 10.1111/1755-0998.13170
Galzin R., Planes S., Dufour V., Salvat B. (1994). Variation in diversity of coral reef fish between French Polynesian atolls. Coral Reefs 13, 175–180. doi: 10.1007/BF00301196
Gao C.-H., Yu G., Cai P. (2021). ggVennDiagram: an intuitive, easy-to-use, and highly customizable R package to generate venn diagram. Front. Genet. 12. doi: 10.3389/fgene.2021.706907
Gasparini L., Crookes S., Prosser R. S., Hanner R. (2020). Detection of freshwater mussels (Unionidae) using environmental DNA in riverine systems. Environ. DNA 2, 321–329. doi: 10.1002/edn3.71
Geller J., Meyer C., Parker M., Hawk H. (2013). Redesign of PCR primers for mitochondrial cytochrome c oxidase subunit I for marine invertebrates and application in all-taxa biotic surveys. Mol. Ecol. Resour. 13, 851–861. doi: 10.1111/1755-0998.12138
Goldberg C. S., Turner C. R., Deiner K., Klymus K. E., Thomsen P. F., Murphy M. A., et al. (2016). Critical considerations for the application of environmental DNA methods to detect aquatic species. Methods Ecol. Evol. 7, 1299–1307. doi: 10.1111/2041-210X.12595
Harper L. R., Lawson Handley L., Carpenter A. I., Ghazali M., Di Muria C., Macgregor C. J., et al. (2019). Environmental DNA (eDNA) metabarcoding of pond water as a tool to survey conservation and management priority mammals. Biol. Conserv. 238, 108225. doi: 10.1016/j.biocon.2019.108225
Holman L. E., de Bruyn M., Creer S., Carvalho G., Robidart J., Rius M. (2019). Detection of introduced and resident marine species using environmental DNA metabarcoding of sediment and water. Sci. Rep. 9, 11559. doi: 10.1038/s41598-019-47899-7
Hsieh T. C., Ma K. H., Chao A. (2016). iNEXT: an R package for rarefaction and extrapolation of species diversity (Hill numbers). Methods Ecol. Evol. 7, 1451–1456. doi: 10.1111/2041-210X.12613
Jiang P., Zhang S., Xu S., Xiong P., Cao Y., Chen Z., et al. (2023). Comparison of environmental DNA metabarcoding and bottom trawling for detecting seasonal fish communities and habitat preference in a highly disturbed estuary. Ecol. Indic. 146, 109754. doi: 10.1016/j.ecolind.2022.109754
Juhel J., Marques V., Utama R. S., Vimono I. B., Sugeha H. Y., Kadarusman K., et al. (2022). Estimating the extended and hidden species diversity from environmental DNA in hyper-diverse regions. Ecography 2022, e06299. doi: 10.1111/ecog.06299
Kantoussan J., Laë R., Tine M. (2018). Review of the fisheries indicators for monitoring the impacts of fishing on fish communities. Rev. Fish Sci. Aquac. 26, 460–478. doi: 10.1080/23308249.2018.1458282
Klautau M., Lopes M. V., Tavares G., Pérez T. (2022). Integrative taxonomy of calcareous sponges (Porifera: Calcarea) from Réunion Island, Indian Ocean. Zool. J. Linn Soc. 194, 671–725. doi: 10.1093/zoolinnean/zlab014
Lagabrielle E., Rouget M., Payet K., Wistebaar N., Durieux L., Baret S., et al. (2009). Identifying and mapping biodiversity processes for conservation planning in islands: A case study in Réunion Island (Western Indian Ocean). Biol. Conserv. 142, pp.1523–1535. doi: 10.1016/j.biocon.2009.02.022
Langlois V. S., Allison M. J., Bergman L. C., To T. A., Helbing C. C. (2021). The need for robust qPCR-based eDNA detection assays in environmental monitoring and species inventories. Environ. DNA 3, 519–527. doi: 10.1002/edn3.164
Lear G., Dickie I., Banks J., Boyer S., Buckley H. L., Buckley T. R., et al. (2018). Methods for the extraction, storage, amplification and sequencing of DNA from environmental samples. N Z J. Ecol. 42, 10–50A. doi: 10.20417/nzjecol
Lemahieu A., Pennober G., David G., Lavigne F., Pothin K. (2012). Monitoring coastal uses of the Marine Reserve of La Reunion using aerial surveys, Reunion Island, France, West Indian Ocean.: Outdoor Recreation in Change – Current Knowledge and Future Challenges. 6th international Management of Visitors Conference., Mid-Sweden University, University of Gothenburg, Karlstad University, Swedish University of Agricultural Sciences, Umeå University, Blekinge Institute of Technology and Örebro University., Aug 2012, Stockholm, Sweden. (hal-01501517)
Leray M., Knowlton N. (2015). DNA barcoding and metabarcoding of standardized samples reveal patterns of marine benthic diversity. Proc. Natl. Acad. Sci. 112, 2076–2081. doi: 10.1073/pnas.1424997112
Leray M., Knowlton N., Machida R. J. (2022). MIDORI2: A collection of quality controlled, preformatted, and regularly updated reference databases for taxonomic assignment of eukaryotic mitochondrial sequences. Environ. DNA 4, 894–907. doi: 10.1002/edn3.303
Leray M., Yang J. Y., Meyer C. P., Mills S. C., Agudelo N., Ranwez V., et al. (2013). A new versatile primer set targeting a short fragment of the mitochondrial COI region for metabarcoding metazoan diversity: application for characterizing coral reef fish gut contents. Front. Zool. 10, 34. doi: 10.1186/1742-9994-10-34
Letunic I., Bork P. (2021). Interactive Tree Of Life (iTOL) v5: an online tool for phylogenetic tree display and annotation. Nucleic Acids Res. 49, W293–W296. doi: 10.1093/nar/gkab301
Luckhurst B. E., Luckhurst K. (1978). Analysis of the influence of substrate variables on coral reef fish communities. Mar. Biol. 49, 317–323. doi: 10.1007/BF00455026
Machida R. J., Knowlton N. (2012). PCR primers for metazoan nuclear 18S and 28S ribosomal DNA sequences. PloS One 7, e46180. doi: 10.1371/journal.pone.0134314
Mahabot M.-M., Jaud M., Pennober G., Le Dantec N., Troadec R., Suanez S., et al. (2017). The basics for a permanent observatory of shoreline evolution in tropical environments; lessons from back-reef beaches in La Reunion Island. Collect C R Geosci. 349, 330–340. doi: 10.1016/j.crte.2017.09.010
Martin M. (2011). Cutadapt removes adapter sequences from high-throughput sequencing reads. EMBnet J. 17, 10–12. doi: 10.14806/ej.17.1.200
McManus J. W., Menez L. A., Kesner-Reyes K. N., Vergara S. G., Ablan M. C. (2000). Coral reef fishing and coral-algal phase shifts: implications for global reef status. ICES J. Mar. Sci. 57 (3), 572–578. doi: 10.1006/jmsc.2000.0720
McMurdie P. J., Holmes S. (2013). phyloseq: an R package for reproducible interactive analysis and graphics of microbiome census data. PloS One 8, e61217. doi: 10.1371/journal.pone.0061217
Mioche D., Cuet P. (1999). “Métabolisme du carbone, des carbonates et des sels nutritifs en saison chaude, sur un récif frangeant soumis à une pression anthropique (île de la Réunion, océan Indien).” Comptes Rendus de l'Académie des Sciences-Series IIA-Earth and Planetary Science 329, 53–59.
Miya M., Gotoh R. O., Sado T. (2020). MiFish metabarcoding: a high-throughput approach for simultaneous detection of multiple fish species from environmental DNA and other samples. Fish Sci. 86, 939–970. doi: 10.1007/s12562-020-01461-x
Miya M., Sato Y., Fukunaga T., Sado T., J., Poulsen Y., Sato K., et al. (2015). MiFish, a set of universal PCR primers for metabarcoding environmental DNA from fishes: detection of more than 230 subtropical marine species. R Soc. Open Sci. 2, 150088. doi: 10.1098/rsos.150088
Naim O., Tourrand C., Ballesteros E., Semple S., Bigot L., Cauvin B., et al. (2013). Fringing reefs of Reunion Island and eutrophication effects. Part 2: Long-term monitoring of primary producers. Atoll Res. Bull. (No. 597. Smithsonian Institution Scholarly Press). doi: 10.5479/si.00775630.597
Nguyen B. N., Shen E. W., Seemann J., Correa A. M. S., O’Donnell J. L., Altieri A. H., et al. (2020). Environmental DNA survey captures patterns of fish and invertebrate diversity across a tropical seascape. Sci. Rep. 10, 6729. doi: 10.1038/s41598-020-63565-9
Nolan K. P., Loeza-Quintana T., Little H. A., McLeod J., Ranger B., Borque D. A., et al. (2023). Detection of brook trout in spatiotemporally separate locations using validated eDNA technology. J. Environ. Stud. Sci. 13, 66–82. doi: 10.1007/s13412-022-00800-x
Norström A. V., Nyström M., Jouffray J.-B., Folke C., Graham N. A., Moberg F., et al. (2016). Guiding coral reef futures in the Anthropocene. Front. Ecol. Environ. 14, 490–498. doi: 10.1002/fee.1427
Obura D., Gudka M., Rabi F. A., Gian S. B., Bijoux J., Freed S., et al. (2017). Coral reef status report for the Western Indian Ocean. Global Coral Reef Monitoring Network (GCRMN)/International Coral Reef Initiative (ICRI)., pp 144.
Obura D., Gudka M., Samoilys M., Osuka K., Mbugua J., Keith D. A., et al. (2022). “Vulnerability to collapse of coral reef ecosystems in the Western Indian Ocean.” Nature Sustainability 5, 104–113. doi: 10.1038/s41893-021-00817-0
Oksanen J., Blanchet F. G., Friendly M., Kindt R., Legendre P., McGlinn D., et al (2022). “vegan: Community ecology package (2.6-4).”
Othman N., Haris H., Fatin Z., Najmuddin M. F., Sariyati N. H., Md-Zain B. M., et al. (2021). A review on environmental DNA (eDNA) metabarcoding markers for wildlife monitoring research. IOP Conf. Ser. Earth Environ. Sci. 736, 12054. doi: 10.1088/1755-1315/736/1/012054
Parsons K. M., Everett M., Dahlheim M., Park L. (2018). Water, water everywhere: environmental DNA can unlock population structure in elusive marine species. R Soc. Open Sci. 5, 180537. doi: 10.1098/rsos.180537
Quast C., Pruesse E., Yilmaz P., Gerken J., Schweer T., Yarza P., et al. (2012). The SILVA ribosomal RNA gene database project: improved data processing and web-based tools. Nucleic Acids Res. 41, D590–D596. doi: 10.1093/nar/gks1219
Rabosky D. L., Chang J., Title P. O., Cowman P. F., Sallan L., Friedman M., et al. (2018). An inverse latitudinal gradient in speciation rate for marine fishes. Nature 559, 392–395. doi: 10.1038/s41586-018-0273-1
R Core Team (2023). R: A Language and Environment for Statistical Computing (Vienna, Austria: R Foundation for Statistical Computing). Available online at: https://www.R-project.org/.
Renshaw M. A., Olds B. P., Jerde C. L., McVeigh M. M., Lodge D. M. (2015). The room temperature preservation of filtered environmental DNA samples and assimilation into a phenol–chloroform–isoamyl alcohol DNA extraction. Mol. Ecol. Resour. 15, 168–176. doi: 10.1111/1755-0998.12281
Réserve Naturelle Marine de la Réunion (2019). Rapport d’activité 2019. Available online at: http://www.reservemarinereunion.fr/documentation/rapport-activite/1143/les-rapports-dactivite/ (Accessed on December 3, 2023).
Riaux-Gobin C., Witkowski A., Saenz-Agudelo P., Neveux J., Oriol L., Vétion G. (2011). Nutrient status in coral reefs of the Îles Eparses (Scattered Islands): comparison to nearby reefs subject to higher anthropogenic influences (Mozambique Channel and Mascarenes, Indian Ocean). Oceanol. Hydrobiol. Stud. 40, 84–90. doi: 10.2478/s13545-011-0033-4
Ruiz-Ramos D. V., Meyer R. S., Toews D., Stephens M., Kolster M. K., Sexton J. P. (2023) “Environmental DNA (eDNA) detects temporal and habitat effects on community composition and endangered species in ephemeral ecosystems: A case study in vernal pools.“ Environmental DNA 5, 85–101. doi: 10.1002/edn3.360
Ruppert K. M., Kline R. J., Rahman M. S. (2019). Past, present, and future perspectives of environmental DNA (eDNA) metabarcoding: A systematic review in methods, monitoring, and applications of global eDNA. Glob. Ecol. Conserv. 17, e00547. doi: 10.1016/j.gecco.2019.e00547
Sayers E. W., Cavanaugh M., Clark K., Pruitt K. D., Sherry S. T., Yankie L., et al. (2023). GenBank 2023 update. Nucleic Acids Res. 51, D141–D144. doi: 10.1093/nar/gkac1012
Sepulveda A. J., Hutchins P. R., Forstchen M., Mckeefry M. N., Swigris A. M. (2020). The elephant in the lab (and field): contamination in aquatic environmental DNA studies. Front. Ecol. Evol. 8. doi: 10.3389/fevo.2020.609973
Seymour M. (2019). Rapid progression and future of environmental DNA research. Commun. Biol. 2, 1–3. doi: 10.1038/s42003-019-0330-9
Shen E. W., Borbee E. M., Carvalho P. G., Setiawan F., Subhan B., Madduppa H., et al. (2024). Preliminary characterization of coral reef diversity using environmental DNA in a hyper-diverse context. Regional Stud. Mar. Sci. 71, 103432. doi: 10.1016/j.rsma.2024.103432
Sigsgaard E. E., Nielsen I. B., Bach S. S., Lorenzen E. D., Robinson D. P., Knudsen S. W., et al. (2016). “Population characteristics of a large whale shark aggregation inferred from seawater environmental DNA.” Nature ecology & evolution 1, 0004. doi: 10.1038/s41559-016-0004
Sinniger F., Pawlowski J., Harii S., Gooday A. J., Yamamoto H., Chevaldonné P., et al. (2016). Worldwide analysis of sedimentary DNA reveals major gaps in taxonomic knowledge of deep-sea benthos. Front. Mar. Sci. 3. doi: 10.3389/fmars.2016.00092
Stauffer S., Jucker M., Keggin T., Marques V., Andrello M., Bessudo S., et al. (2021). How many replicates to accurately estimate fish biodiversity using environmental DNA on coral reefs? Ecol. Evol. 11, 14630–14643. doi: 10.1002/ece3.8150
Takahashi M., Saccò M., Kestel J. H., Nester G., Campbell M. A., Heyde Der Van M., et al. (2023). “Aquatic environmental DNA: A review of the macro-organismal biomonitoring revolution.” Science of the Total Environment 873, 162322.
Tedetti M., Bigot L., Turquet J., Guigue C., Ferretto N., Goutx M., et al. (2020). Influence of freshwater discharges on biogeochemistry and benthic communities of a coral reef ecosystem (La Réunion island, Indian ocean). Front. Mar. Sci. 7. doi: 10.3389/fmars.2020.596165
Tessier E., Bigot L., Cadet C., Cauvin B., Chabanet P., Conand C., et al. (2008). Les récifs coralliens de la Réunion en 2007: état des lieux et réseau de suivi. Rev. d’écologie 63, 85–102. doi: 10.3406/revec.2008.1400
Thébaud C., Strasberg D., Warren B. H., Cheke A. (2009). “Mascarene Islands, Biology,” in Encyclopedia of Islands. Eds. Gillespie R., Clague D. (Berkeley: : University of California Press), 612–619. doi: 10.1525/9780520943728-146
Thomas A. C., Nguyen P. L., Howard J., Goldberg C. S. (2019). A self-preserving, partially biodegradable eDNA filter. Methods Ecol. Evol. 10, 1136–1141. doi: 10.1111/2041-210X.13212
Tourrand C., Naim O., Bigot L., Cadet C., Cauvin B., Semple S., et al. (2013). Fringing reefs of reunion island and eutrophication effects - part 1: long-term monitoring of two shallow coral reef communities. Atoll Res. Bull. 596, 1–35. doi: 10.5479/si.00775630.596
van der Loos Luna M., Nijland Reindert (2021). Biases in bulk: DNA metabarcoding of marine communities and the methodology involved. Mol. Ecol. 30 (21), 3270–3288. doi: 10.1111/mec.15592
van Woesik R., Kratochwill C. (2022). A global coral-bleaching database 1980–2020. Sci. Data 9, 20. doi: 10.1038/s41597-022-01121-y
Van Woesik R., Randall C. J. (2017). Coral disease hotspots in the Caribbean. Ecosphere 8, e01814. doi: 10.1002/ecs2.1814
von Ammon U., Pochon X., Casanovas P., Trochel B., Zirngibl M., Thomas A., et al. (2023). Net overboard: Comparing marine eDNA sampling methodologies at sea to unravel marine biodiversity. Mol. Ecol. Resour. 23, 440–452. doi: 10.1111/1755-0998.13722
Wangensteen O. S., Palacín C., Guardiola M., Turon X. (2018). DNA metabarcoding of littoral hard-bottom communities: high diversity and database gaps revealed by two molecular markers. PeerJ 6, e4705. doi: 10.7717/peerj.4705/supp-12
Keywords: eDNA, back-reef depression, coral reefs, DNA metabarcoding, fish, invertebrate
Citation: Cowart DA, Chevrier T, Nieblas A-E, Chanut J, Bernard S and Bonhommeau S (2024) Detecting local variations across metazoan communities in back-reef depressions of Reunion Island (Mascarene Archipelago) through environmental DNA survey. Front. Mar. Sci. 11:1423676. doi: 10.3389/fmars.2024.1423676
Received: 26 April 2024; Accepted: 26 August 2024;
Published: 27 September 2024.
Edited by:
Adriana Vallesi, University of Camerino, ItalyReviewed by:
Eva Aylagas, King Abdullah University of Science and Technology, Saudi ArabiaCopyright © 2024 Cowart, Chevrier, Nieblas, Chanut, Bernard and Bonhommeau. This is an open-access article distributed under the terms of the Creative Commons Attribution License (CC BY). The use, distribution or reproduction in other forums is permitted, provided the original author(s) and the copyright owner(s) are credited and that the original publication in this journal is cited, in accordance with accepted academic practice. No use, distribution or reproduction is permitted which does not comply with these terms.
*Correspondence: Dominique A. Cowart, ZG9taW5pcXVlLmNvd2FydEBjb21wYW55LWNvb29sLmlv
†ORCID: Dominique A. Cowart, orcid.org/0000-0002-2581-0355
Thomas Chevrier, orcid.org/0009-0006-4108-5698
Anne-Elise Nieblas, orcid.org/0000-0002-3974-8484
Jérémie Chanut, orcid.org/0009-0002-8808-9689
Serge Bernard, orcid.org/0000-0003-1772-0592
Sylvain Bonhommeau, orcid.org/0000-0002-0882-5918
Disclaimer: All claims expressed in this article are solely those of the authors and do not necessarily represent those of their affiliated organizations, or those of the publisher, the editors and the reviewers. Any product that may be evaluated in this article or claim that may be made by its manufacturer is not guaranteed or endorsed by the publisher.
Research integrity at Frontiers
Learn more about the work of our research integrity team to safeguard the quality of each article we publish.