 Imogen Bunting1*
 Yun Yi Kok2Erik C. Krieger1,3Sarah J. Bury2Roberta D’Archino2
 Christopher E. Cornwall1
- 1School of Biological Sciences, and Coastal People Southern Skies Centre of Research Excellence, Victoria University of Wellington Te Herenga Waka, Wellington, New Zealand
- 2Oceans Science Centre, National Institute of Water and Atmosphere Research Taihoro Nukurangi, Evans Bay, Wellington, New Zealand
- 3Red Sea Research Centre, King Abdullah University of Science and Technology, Thuwal, Saudi Arabia
Kelp forests are productive and biodiverse ecosystems with high ecological, cultural, and economic importance. However, the high sensitivity of kelp to water temperature means that these ecosystems are vulnerable to marine heatwaves (MHWs), especially at the equatorward edge of their range. To date, few laboratory studies have compared the effects of MHWs of different durations or intensities on kelp, and it is difficult to determine these effects from naturally occurring MHWs in the field. We exposed juvenile sporophytes of the giant kelp Macrocystis pyrifera from Wellington, Aotearoa New Zealand to simulated MHWs three or six weeks in duration, at temperatures of 18°C, 20°C, and 22°C, corresponding to 2, 4, and 6°C above local mean summer temperatures. While all MHW treatments reduced mean kelp growth rates by over 30% relative to 16°C controls, the 22°C treatments had much more severe and wide-ranging effects, including rapid blade erosion, reduced chlorophyll fluorescence, tissue bleaching, increased δ13C values, and mortality. Nonetheless, sporophytes had some ability to recover from heat stress; within the 18°C treatment, mean relative growth rates neared or exceeded those within the control treatment within three weeks after MHWs concluded. These results support the findings of previous studies which indicate that M. pyrifera sporophytes experience a key physiological tipping point around 20°C. Additionally, our findings suggest that juvenile M. pyrifera from the Wellington population could be relatively resilient to MHWs if temperatures remain at sub-lethal levels. However, if average MHW intensities and durations continue to increase over time, survival and recruitment of juvenile kelp could be adversely affected, thus threatening the long-term persistence of giant kelp forests near the warm edge of their range in New Zealand.
1 Introduction
Kelp forests are highly productive and biodiverse temperate marine ecosystems which occupy around a quarter of the world’s coastlines (Wernberg et al., 2019). Kelps are ecosystem engineers that modify their physical environment through shading (Arkema et al., 2009) and alteration of current velocities (Gaylord et al., 2007), as well as altering their chemical environment by increasing oxygen concentrations and pH (Britton et al., 2016; Traiger et al., 2022). Kelp sporophytes create complex three-dimensional structures that serve as an important habitat for highly diverse biotic assemblages (Teagle et al., 2017), especially of sessile invertebrates (Graham, 2004; Arkema et al., 2009; Miller et al., 2015) and fish (Villegas et al., 2019). The loss of kelp canopies can cause severe declines in biomass and diversity within these communities, including the complete loss of commercially important species such as abalone (Graham, 2004; Vanella et al., 2007; O’Connor and Anderson, 2010; Johnson et al., 2011; Arafeh-Dalmau et al., 2019). Moreover, kelp forests contribute to many ecosystem services, including carbon sequestration (Filbee-Dexter and Wernberg, 2020), nutrient cycling (Wernberg et al., 2019), and reduction of coastal erosion (Løvås and Tørum, 2001). Kelp also holds cultural value and serves as food for some communities, and has a broad variety of commercial uses, including biofuel and production of pharmaceuticals (Wernberg et al., 2019; Li et al., 2023). The economic value of the ecosystem services provided by kelp forests globally is estimated to be as high as US$500 billion (Eger et al., 2023).
Anthropogenic stressors currently threaten the persistence of kelp forests and the biotic communities that they support. Kelps and other macroalgae are thought to be particularly susceptible to the impacts of ocean warming, as their large surface area to volume ratio makes them highly responsive to changes in environmental conditions (Smale, 2020). In kelps, thermal stress can cause thinning of cellular structures, leading to reduced tissue strength and rapid erosion (Simonson et al., 2015). Declines in abundance and range shifts or contractions have been reported for numerous kelp species within the past decade (Straub et al., 2016; Smale, 2020), and the total extent of kelp forests is declining at a global scale (Krumhansl et al., 2016). Climate change is thought to be one of the key drivers of these changes, along with pollution and overgrazing due to overexploitation of predators that consume grazers (Steneck et al., 2002; Wernberg et al., 2019). Climate change can also have indirect negative impacts on kelp, such as promoting range expansion by herbivores (Ling et al., 2009; Vergés et al., 2014; Provost et al., 2017) and increased competition between cold-temperate kelps and eurythermal algae (Filbee-Dexter and Wernberg, 2018) or heat-tolerant invasive kelps (Edwards and Hernández-Carmona, 2005; Smale et al., 2015; James and Shears, 2016; Lebrun et al., 2022; Wright et al., 2022).
The increasing frequency of marine heatwaves (MHWs) is an important consequence of climate change that threatens kelp forest ecosystems (Wernberg et al., 2023). MHWs are defined as anomalously warm events in which sea surface temperatures within a specified area exceed the 90th percentile, based on 30 years of historical baseline data, for at least five days (Hobday et al., 2016). They are often driven by interactions between local weather and oceanographic conditions and increasing greenhouse gas emissions (Salinger et al., 2019; de Burgh-Day et al., 2022; Kerry et al., 2022). The increasing frequency of MHWs means that local sea temperatures may exceed lethal thresholds for some species much earlier than predicted by some models of future climate scenarios that simply assess means changes in temperature (Harvey et al., 2022). MHWs have been linked to severe declines in kelp canopy cover (Wernberg et al., 2016, 2018; McPherson et al., 2021; Tolimieri et al., 2023) and regime shifts from kelp forests to less productive, turf algae-dominated ecosystems (Wernberg et al., 2016). More broadly, MHWs can cause local extinctions of sensitive macroalgal species (Smale and Wernberg, 2013; Thomsen et al., 2019).
The giant kelp Macrocystis pyrifera is an abundant and ecologically vital species, but its potential vulnerability to climate change and MHWs is concerning. M. pyrifera is the world’s most widely distributed kelp species and is spread throughout temperate coastal regions of the Pacific basin, including the west coast of the Americas, southeastern Australia, and central and southern Aotearoa New Zealand (Mora-Soto et al., 2020). M. pyrifera is also the world’s largest kelp species, reaching lengths of up to 60 meters (Schiel and Foster, 2015). MHWs and other extreme warming events have been linked to declines in M. pyrifera canopy cover (Dayton et al., 1992; Arafeh-Dalmau et al., 2019; Tait et al., 2021; Tolimieri et al., 2023). Laboratory studies have found that exposure to elevated temperatures can have a variety of adverse impacts on both microscopic stages (gametophytes) and diploid, macroscopic sporophytes of M. pyrifera, with gametophytes often having greater thermal resilience than sporophytes (Ladah, 2000; Hollarsmith et al., 2020; Le et al., 2024). The effects of increased temperatures can include increased mortality (e.g., Ladah and Zertuche-González, 2007; Fernández et al., 2020; Purcell et al., 2024), reduced reproductive success (Muth et al., 2019; Hollarsmith et al., 2020; Le et al., 2022; Fernández et al., 2023), lower growth rates (Brown et al., 2014; Fernández et al., 2020, 2021), photosynthetic impairment (Umanzor et al., 2021), and reduced pigmentation (Sánchez-Barredo et al., 2020; Umanzor et al., 2021). Increasing the duration of exposure to elevated temperatures can also increase the severity of these negative effects on kelps (Leathers et al., 2023).
M. pyrifera grows throughout the South Island and at the southern tip of the North Island of New Zealand, with its range limited mostly by temperature (Hay, 1990). Three genetic clusters have been identified for M. pyrifera diversity within New Zealand; gametophytes from the northernmost populations have a higher temperature threshold for successful fertilisation than those from southern regions, perhaps indicating higher thermal tolerance (Le, 2022). MHWs have become increasingly severe within New Zealand waters during the past three decades (Montie et al., 2023). Modelling suggests that mean MHW intensities could increase by up to 1.75°C by 2100 under a high greenhouse gas emissions scenario (SSP3–7.0) (Behrens et al., 2022). MHWs have been linked to declines in M. pyrifera canopy cover throughout New Zealand (Tait et al., 2021), and there is anecdotal evidence of losses of M. pyrifera abundance throughout the Wellington region (authors, pers. obs), near the northern distribution limit described by Hay (1990). M. pyrifera abundance is predicted to decline near the northern edge of its distribution in New Zealand in the near future due to ongoing warming and MHWs (Cornwall et al., 2023).
Field studies of the impacts on MHWs on macroalgae must rely on naturally occurring events and cannot easily separate the effects of MHWs from other environmental stressors, nor determine the relative importance of MHW duration and intensity, thus limiting our ability to use past events to forecast future change. Manipulative experiments which simulate the impacts of MHWs are a useful tool to predict how wild populations might respond to MHWs of a specified duration or intensity. Previous laboratory studies on the effects of simulated MHWs on M. pyrifera sporophytes have typically focused on relatively short, intense heatwaves (up to 7 days, with temperature increases of 6−8°C relative to local mean temperatures), which led to severe reductions in growth and photosynthetic performance (see Sánchez-Barredo et al., 2020; Umanzor et al., 2021). In this study, we used a laboratory experiment to simulate longer heatwave periods (21 or 42 days) at several different temperatures (ranging from 2–6°C above local summer mean temperatures) to assess the impacts of heatwave duration and intensity on juvenile M. pyrifera sporophytes. Our aim was to investigate how M. pyrifera populations near their warm distribution limit in New Zealand might respond to a broad range of present-day and future MHW scenarios. We hypothesised that the severity of any negative physiological impacts of the heatwave would be positively correlated with both the temperature and duration of the heatwave.
2 Materials and methods
2.1 Spore collection and culture
Macrocystis pyrifera sori were collected by snorkelling at low tide, at depths of 1–2 meters, at Kau Bay in Wellington Harbour (41.29°S, 174.83°E) in the North Island of New Zealand in July 2022. Sori from several individuals were kept chilled and taken immediately to the National Institute of Water and Atmosphere Research’s (NIWA) experimental facility. These sori were rinsed with freshwater and patted dry, then refrigerated overnight at 4°C. The next day, sori were cut into 1–2 cm² fragments, then immersed in F/2 nutrient-enriched filtered seawater (Guillard, 1975; AusAqua, Wallaroo, South Australia) for about an hour to stimulate spore release. The seawater slurry containing spores was then poured over sheets of plastic mesh immersed in 400 mL glass jars. This mesh was left undisturbed at 15°C for a few days to allow the spores to settle.
After settlement, the mesh sheets were transferred to tanks in a temperature-controlled room set at 15°C. Light panels provided steady illumination of around 30 μmol photons m−2 s−1 during a 12-hour photoperiod, giving a total daily dose of 1.3 mol photons m−2. Seawater was sterilised using a 30 W UV steriliser (Trevoli, Auckland, New Zealand) and recirculated in a 295 L capacity system, which included a 250 L sump and seaweed growth tanks with an internal volume of 45 L. Water temperature was maintained using a 500 W drop-in aquarium element (EHEIM, Deizisau, Germany) located in the sump, which was controlled by a CN74 temperature controller (Omega Engineering, Norwalk, Connecticut, USA) and an electronic relay coupled to a PT100 temperature probe (Omega Engineering, Norwalk, Connecticut, USA), also located in the sump. Tank temperature was monitored using HOBO Pendant MX Data Loggers (Onset, Bourne, Massachusetts, USA).
Sporophytes with a blade length of at least 20 mm were removed from their original mesh sheets and re-attached to separate pieces of mesh. Sinkers were tied to these mesh parcels to keep the sporophytes submerged. The sporophytes were left for two weeks to re-attach and were then transferred to the experimental tanks at Victoria University of Wellington Coastal Ecology Laboratory on 4 October 2022.
2.2 Experimental conditions
The experimental setup consisted of eight 70 L (250 × 470 × 610 mm) water baths, each connected to a separate header tank. Each water bath contained four separate 4 L (155 × 235 × 105 mm) experimental tanks. Seawater was pumped continuously into the header tanks from the nearby Taputeranga Marine Reserve, on the south coast of Wellington. To stabilise pH, air was bubbled constantly through the header tanks via air stones (Aqua One, Ingleburn, Australia) connected to an LP-100 aerator pump (Resun, Shenzhen, China). Seawater flowed from the headers into the experimental tanks, then out into the water baths, at a rate of approximately 120 mL per minute. Each tank contained a 2 W, 150 L h-1 HL-BT100B immersible pump (Hailea, Guangdong, China) to maintain water motion. Tanks were scrubbed weekly to remove epiphytic algae.
The tanks were illuminated on a daily 12:12 light/dark cycle, with customised Zeus 70 LED panels (Ledzeal, Shenzhen, China). These turned on at 08:00, increased steadily in intensity to a peak at 13:00 of around 65 μmol m−2 s−1 of photons of photosynthetically active radiation (PAR), remained at that peak value for two hours, then steadily decreased in intensity until they turned off at 20:00. The LED panels predominantly emitted light in the blue and green regions of the visible light spectrum, to mimic the light spectrum available in subtidal habitats approximately 2 m deep along Wellington’s south coast (see Krieger et al., 2023a). The tanks received a total daily irradiance dose of approximately 1.6 mol m−2 d−1. The water baths were surrounded by a mesh curtain to limit exposure to external light sources.
Apex temperature probes (Neptune Systems, Morgan Hill, California, USA) were placed in one tank within each water bath. Probes were calibrated weekly against a reference thermometer (FisherBrand, Waltham, Massachusetts, USA). The temperature probes were connected via an Apex Classic programmable control unit (Neptune Systems, Morgan Hill, California, USA) to 300 W submersible heaters (Weipro, Zhongshan, China) within the water baths, and to Hailea 300A 1/4HP external chillers (Hailea, Guangdong, China) connected to the header tanks. Heaters or chillers were automatically switched on if the temperature in the tanks exceeded 0.1°C below or 0.2°C above the target temperature.
To ensure consistency, temperature and pH were measured weekly in the experimental tanks, water baths, and header tanks. Temperature was measured using a Fisherbrand Traceable Kangaroo Thermometer (FisherBrand, Waltham, Massachusetts, USA) and pH was determined potentiometrically using an IntelliCAL PHC101 glass electrode (Hach New Zealand, Auckland, New Zealand). This electrode was calibrated weekly against artificial seawater with Tris buffer added (Dickson et al., 2007). The R package “seacarb” (Gattuso et al., 2021) was used to convert the tank pH readings from millivolts to the total scale. Water samples for nitrogen analysis were collected at two-week intervals during the heatwave period, using methods derived from Pritchard et al. (2015). Samples were taken using a 50 mL syringe and passed through a 0.45 μm filter into a labelled 50 mL plastic storage vial, then frozen at −20°C. A separate syringe and filter were used for each sample. The seawater samples were later analysed at the University of Otago’s Portobello Marine Laboratory. A Lachat QuikChem 8500 Series 2 FIA auto analyser (Hach New Zealand, Auckland, New Zealand) was used to calculate the concentrations of NOx ions and ammonia using methods derived from Strickland and Parsons (1972).
Two sporophytes were allocated to each experimental tank, giving a total of eight for each experimental treatment and 16 controls. The largest and smallest individuals were apportioned as evenly as possible between treatments. Sporophytes were scrubbed gently with a toothbrush once a week to remove epiphytic algae and dead tissue. Sporophytes were marked as dead if the blade completely eroded or detached from the meristem. The initial lengths of the sporophytes ranged from 20 to 95 mm, with an arithmetic mean value of 50.5 ± 2.2 mm (mean ± standard error).
2.3 Heatwave simulations
Initially, all tanks were kept at a stable temperature of 16°C for three weeks to allow the sporophytes to acclimate to laboratory conditions. The 16°C treatment was chosen to approximate the historical mean summer (i.e., December to February) sea surface temperature throughout the Wellington region (Booth, 1975; Krieger et al., 2023b; Supplementary Figure S1). Six different heatwave scenarios were simulated. Three of the water baths were subjected to three-week heatwaves, at temperatures of 18°C, 20°C, and 22°C respectively. Another three water baths were subjected to six-week heatwaves at the same temperatures. The remaining two water baths were kept at 16°C to act as controls. The experimental treatments were interspersed systematically to minimise the impact of any non-treatment effects (i.e., A-3 from Hurlbert, 1984). At the start of the simulated heatwaves, temperatures were increased by increments of 2°C day-1, after Sánchez-Barredo et al. (2020) and Umanzor et al. (2021), in order to simulate a rapid onset MHW; temperatures were then lowered by 2°C daily increments at the end of each heatwave period. After the three-week heatwave period, the sporophytes were left in the tanks for another three weeks to examine whether they showed signs of recovery.
To compare the experimental scenarios to real-world MHWs, daily sea surface temperature data for the greater Wellington region were obtained from the National Oceanic and Atmospheric Administration’s “Optimum Interpolation Sea Surface Temperature V2.1” dataset (Reynolds and Banzon, 2008). A baseline seasonal climatology from 1982 to 2011 was constructed for the greater Wellington region using the R package “heatwaveR” (Schlegel and Smit, 2021) to detect and analyse MHWs that occurred within the region between 1982 and 2023. These data are summarised in the Supplementary Material (Supplementary Figures S1–S3). Throughout the last three decades, there has been an average of 3.2 MHW events per year throughout the greater Wellington region, with a mean duration of 16 days and a mean temperature anomaly of 1.27°C (Supplementary Figures S1–S3). The 18°C treatment, or a temperature anomaly of approximately 2°C, is most similar to the mean temperatures during previous summer MHW events within the Wellington region (Supplementary Figures S1, S2). The 20°C treatment is more representative of maximum temperature anomalies of 3–4°C during more recent, strong heatwaves (Supplementary Figures S1, S2). The 22°C treatment, corresponding to a 6°C temperature anomaly, represents a worst-case scenario that has not yet occurred in this region, but could become more plausible under the most severe greenhouse gas emissions scenarios modelled by Behrens et al. (2022). Numerous MHWs within the Wellington region have lasted longer than three weeks, while a few events have surpassed six weeks (Supplementary Figure S3).
2.4 Kelp performance
2.4.1 Growth
Sporophyte length measurements were taken weekly during the acclimation and experimental phases. Length was measured to the nearest millimetre using a ruler, from the base of the blade to the apex. Relative growth rates (RGR; Kain and Jones, 1976) were calculated on a week-to-week basis, and for the duration of the acclimation and heatwave phases.
2.4.2 Chlorophyll fluorescence
Chlorophyll fluorescence was measured the day before the heatwaves began, and on the days that the three- and six-week heatwaves ended, using a Diving-PAM blue light fluorometer (Walz, Effeltrich, Germany). The effective quantum efficiency of photosystem II electron transport (Fv’/Fm’) was calculated by measuring the ratio of variable fluorescence to maximum fluorescence in the low-light adapted state. The fluorometer was held near the base of the blade to ensure consistent assessment of the youngest tissue.
2.4.3 Dissolved inorganic carbon uptake
Incubations were carried out during weeks two and five of the heatwave period. Four sporophytes from each heatwave treatment and eight from the control treatment were assessed; one individual was chosen at random from each experimental tank. For each incubation, a 500 mL transparent plastic incubation chamber was filled with water from an experimental tank, then one of the sporophytes from that tank was placed into the chamber. A stirrer bar was placed in the chamber’s lid, separated from the sporophyte by a mesh grid. The chamber was then sealed underwater to minimise the intrusion of air bubbles. The pH within the tank was measured in millivolts using an IntelliCAL PHC101 glass pH electrode (Hach New Zealand, Auckland, New Zealand), and its temperature was recorded in °C using a Fisherbrand Kangaroo Traceable Thermometer (FisherBrand, Waltham, Massachusetts, USA). The chamber was then placed upside-down on a 2mag MIXdrive 6 magnetic stirrer plate (2mag AG, Munich, Germany) set to 200 revolutions per minute, within a water bath set to the same temperature as the experimental tank, under illumination of 70 µmol photons m−² s−1. After half an hour, the chamber was taken out and the temperature and mV of the water in the chamber were measured. The R package “seacarb” (Gattuso et al., 2021) was later used to convert the pH readings to the total scale using mV calibration in Tris buffer, following Dickson et al. (2007).
A 150 mL water sample was taken from one of the header tanks on each day that incubations were carried out, and salinity was measured within that tank using an IntelliCAL CDC401 conductivity probe (Hach New Zealand, Auckland, New Zealand). These water samples were filtered through 0.45 µm glass microfiber discs (Whatman, Chalfont St. Giles, UK) and refrigerated in airtight containers, then total alkalinity (TA) was determined through titration and addition of 0.1 mol m-3 hydrochloric acid, according to the methodology described in Huang et al. (2012), using an AS-ALK2 titrator (Apollo SciTech, Newark, Delaware, USA). Titrations were carried out on at least three 25 mL subsamples from each water sample. During each titration, the weight of water used was measured, and the R package “seacarb” (Gattuso et al., 2021) was used to account for the mass and salinity of the water sample and to increase the accuracy of the calculated TA value. To assess the accuracy of these results, titrations were also regularly carried out on Certified Reference Material (University of California, San Diego, California, USA) with a known TA value; the final calculated TA values for the reference material remained within 95% confidence intervals.
The temperature, pH, and TA data were used to estimate the change in total dissolved inorganic carbon (DIC) during each incubation, using the CO2SYS Microsoft Office Excel program (Pierrot et al., 2011). DIC uptake rates were then standardised against the surface area of the sporophytes. This was estimated by taking a photograph of each sporophyte with a 1 cm grid in the background and counting the number of grid squares fully or partially covered by each specimen.
2.4.4 Pigment content
After three weeks in heatwave conditions, tissue sub-samples were taken from half of the sporophytes in the control and three-week heatwave treatments. Four individuals were sampled from each heatwave treatment, as well as eight from the control. Sub-samples were not taken from the sporophytes on which incubations were carried out, to avoid placing additional stress on these individuals. One small sporophyte was sacrificed at this timepoint; the other sporophytes were returned to their tanks. After the six-week heatwave ended, all surviving sporophytes were sampled. Sub-samples were taken using a scalpel blade, which was rinsed with ethanol between sampling to prevent cross-contamination. These sub-samples were patted dry, then sealed in Eppendorf tubes, which were wrapped in aluminium foil and frozen at −20°C.
Chlorophyll a, chlorophyll c, and fucoxanthin were extracted from these tissue samples using methods adapted from Seely et al. (1972). Each sub-sample was patted dry, and around 0.05 g of tissue was weighed out, then subsequently crushed in a mortar and pestle with a known volume of dimethyl sulfoxide (DMSO). More DMSO was used to wash the ground algal tissue into a 1.5 mL Eppendorf tube, which was put on ice for at least 10 minutes, then centrifuged at 13200 RPM for 10 minutes in a 5145 D centrifuge (Eppendorf, Hamburg, Germany). After centrifuging, the supernatant was transferred to a quartz cuvette (Starna Scientific, Hainault, UK). More DMSO was added to fill the cuvette if necessary; the total volume of DMSO used was in proportion to the mass of tissue used, and did not exceed 1.5 mL per sample. A UV-1900i spectrophotometer (Shimadzu, Kyoto, Japan) was used to measure the absorbance of each sample between 400 and 700 nm and to generate a spectrogram. Before running the algal samples, a “blank” cuvette containing DMSO only was run to correct for the absorbance of DMSO alone. Cuvettes were rinsed with DMSO between samples to avoid cross-contamination.
Acetone was then added to the pellets. The volume of acetone added to each sample was equal to the volume of DMSO used for the same sample. The Eppendorf tubes were shaken for 1 minute, then left on ice. After 1.5–3 hours, the Eppendorf tubes were centrifuged at 13200 rpm for 10 minutes. The supernatant was then transferred to a quartz cuvette, and spectrophotometry was carried out. Another “blank” sample was run to account for the absorbance of acetone, and cuvettes were rinsed with acetone between samples. Peak and trough values from the spectrograms were used to calculate the amount of chlorophyll a (Equation 1), chlorophyll c (Equation 2), and fucoxanthin (Equation 3) per gram of tissue in each sample.
Equation 1:
Equation 2:
Equation 3:
Where m is the wet weight of the tissue sample in grams, V is the total volume of DMSO or acetone used in litres, P1 is the maximum absorbance value at the long-wavelength peak of the spectrograph (around 660 nm) in DMSO (P1D) or acetone (P1A), P2 is the maximum absorbance value at the short-wavelength peak (around 450 nm), T1 is the minimum absorbance value at the trough nearest the long-wavelength peak, and T2 is the minimum absorbance value at the trough nearest the short-wavelength peak.
2.4.5 Total % carbon, % nitrogen, and stable isotope values
Tissue samples were collected for stable isotope analysis from all surviving sporophytes after the conclusion of the six-week experimental period. These samples were wrapped in aluminium foil and left overnight in an Isotherm convection oven (Esco Lifesciences Group, Singapore) at 75°C. The dried samples were then homogenised by grinding into powder with a mortar and pestle, and were then sealed in Eppendorf tubes. The mortar and pestle were rinsed with water and dried between samples to avoid cross-contamination. Six additional sporophytes were sampled from the culture facility at NIWA to obtain baseline values and evaluate whether the different seawater sources utilised by NIWA and the Coastal Ecology Laboratory could have contributed to any differences in stable isotope ratios.
Stable isotope analyses were carried out at the NIWA Environmental and Ecological Stable Isotope Analytical Facility in Wellington. Dried algal samples were weighed to the nearest microgram. Samples were analysed for total carbon content (%), total nitrogen content (%), δ13C, and δ15N values using a DELTA V Plus continuous flow isotope ratio mass spectrometer, linked to a Flash 2000 elemental analyser using a MAS200R autosampler (Thermo Fisher Scientific, Bremen, Germany). International reference materials were used to normalise the stable isotope values, after Paul et al. (2007). Sample δ15N values were two-point normalised using stable isotope data from the daily analysis of National Institute of Standards and Technology (NIST)8573 USGS40 L-glutamic acid and NIST8548 International Atomic Energy Agency (IAEA)-N2 ammonium sulfate. Sample δ13C values were two-point normalised using stable isotope data from the daily analysis of NIST8573 USGS40 L-Glutamic acid and USGS74 L-Valine #2. Data from the daily analysis of the following materials were used to check accuracy and precision: USGS65 Glycine (values of both δ15N and δ13C) and L-Valine #2 USGS74 (value of δ15N only). Precision was determined by the repeat analysis of a working laboratory standard DL-Leucine (DL-2-Amino-4-methylpentanoic acid, C6H13NO2, Lot 127H1084, Sigma, Australia). Repeat analysis of international reference standards produced data accurate to within 0.5% for % carbon and % nitrogen, and 0.2 ‰ for δ13C and δ15N values; and a precision of better than 0.2% for % carbon and % nitrogen, and 0.1 ‰ for δ13C and δ15N values.
2.5 Statistical analysis
The Shapiro-Wilk test (Shapiro and Wilk, 1965) was used to determine that the datasets from this experiment were normally distributed. The R package “lme4” (Bates et al., 2023) was then used to fit linear mixed-effects models to the data for growth rates, Fv’/Fm’, DIC uptake, pigment content, total % carbon and nitrogen, and δ15N and δ13C values. Temperature and heatwave duration were treated as fixed effects, while water bath was treated as a random effect. Only the effects of temperature were assessed for the data collected during the first three-week heatwave phase. The effects of temperature, duration, and their interaction were assessed for the data collected during the latter phase of the experiment, when the three-week heatwaves had concluded while the six-week heatwaves continued. Analysis of Variance (ANOVA) was then run on these models, and p-values were generated using the R package “car” (Fox et al., 2023). The R package “multcomp” (Hothorn et al., 2023) was used to run pairwise Tukey’s tests (Tukey, 1949) on the models to assess significant differences between individual treatments.
3 Results
Raw experimental data is accessible in the Supplementary Material (“Supplementary Data”, Sheet 1–5). Temperature, pH, and nitrogen availability data are available in the Supplementary Material (“Supplementary Figures and Tables”, Supplementary Tables S1, S2).
3.1 Survival and physical appearance
By the third week in heatwave conditions, several of the sporophytes within the 22°C treatments were visibly bleached, and their blades were eroding rapidly (Supplementary Material, Images S1A–D). Bleaching was also visible after five weeks at 20°C. Five sporophytes died during the experiment. All deaths occurred in the 22°C treatments, during the second half of the heatwave period; two during week 4, and three during week 6. Four of the sporophytes within the 22°C, six-week heatwave treatment died in total, giving a mortality rate of 50%, while one sporophyte died within the 22°C, three-week treatment, with a mortality rate of 12.5%.2
3.2 Growth
There was no consistent variation in mean RGR between treatments during the acclimation period (Figure 1; p = 0.847). Heatwave temperature had a significant negative relationship with RGR during the three-week heatwave period (Figure 2; p< 0.001, Table 1). This effect was noticeable after just one week in heatwave conditions (Figure 1). By the end of the three-week heatwave, many of the sporophytes in heatwave conditions were eroding faster than they grew, including almost all of the sporophytes at 22°C. Mean RGR over the three-week heatwave period were 1.46 ± 0.28 in the control treatment, 0.17 ± 0.54 at 18°C, 0.50 ± 0.33 at 20°C, and −1.06 ± 0.23 at 22°C (mean ± SE) (Figure 2). The 22°C treatment was the only treatment with a significantly lower mean RGR than the control treatment over the three-week heatwave period (p< 0.001, Figure 2).
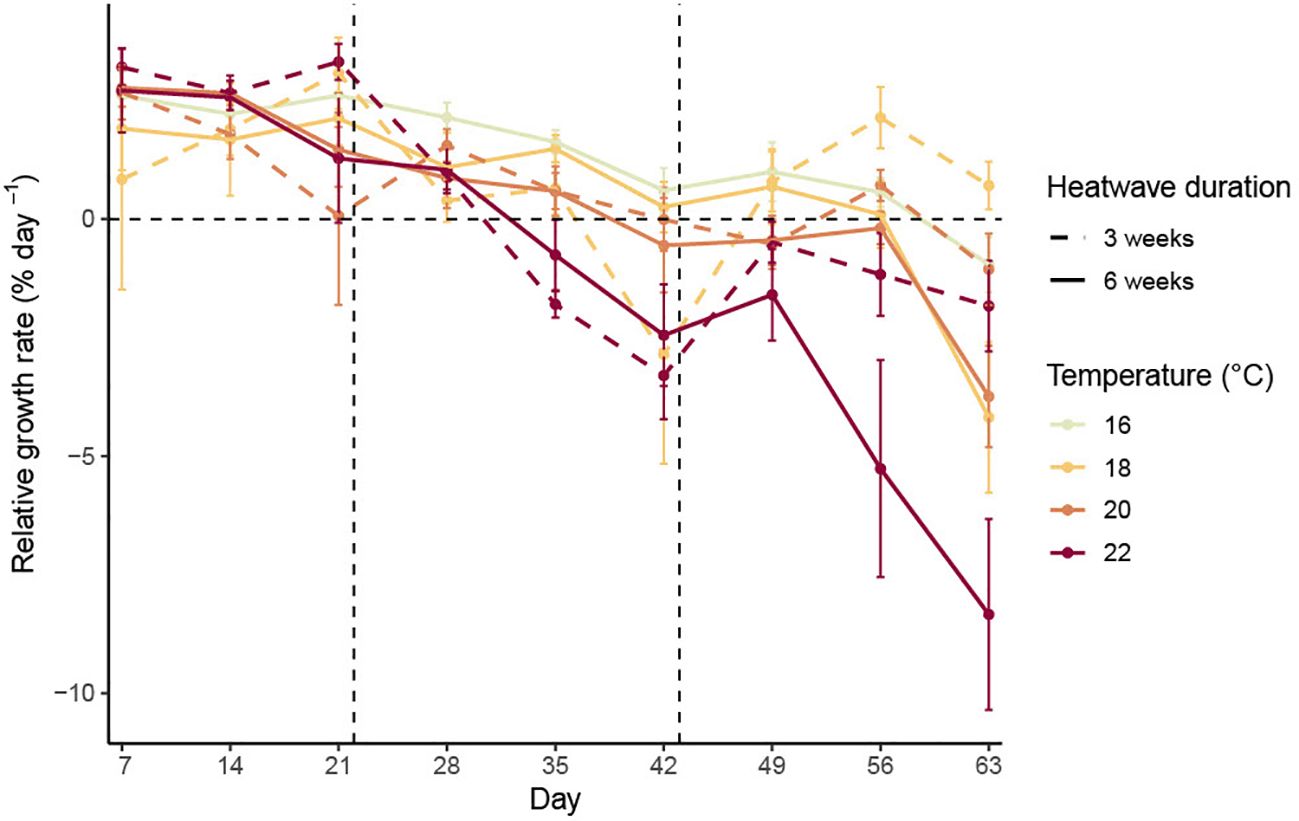
Figure 1. Mean relative growth rates (with standard error) of Macrocystis pyrifera sporophytes measured weekly over the experimental period.
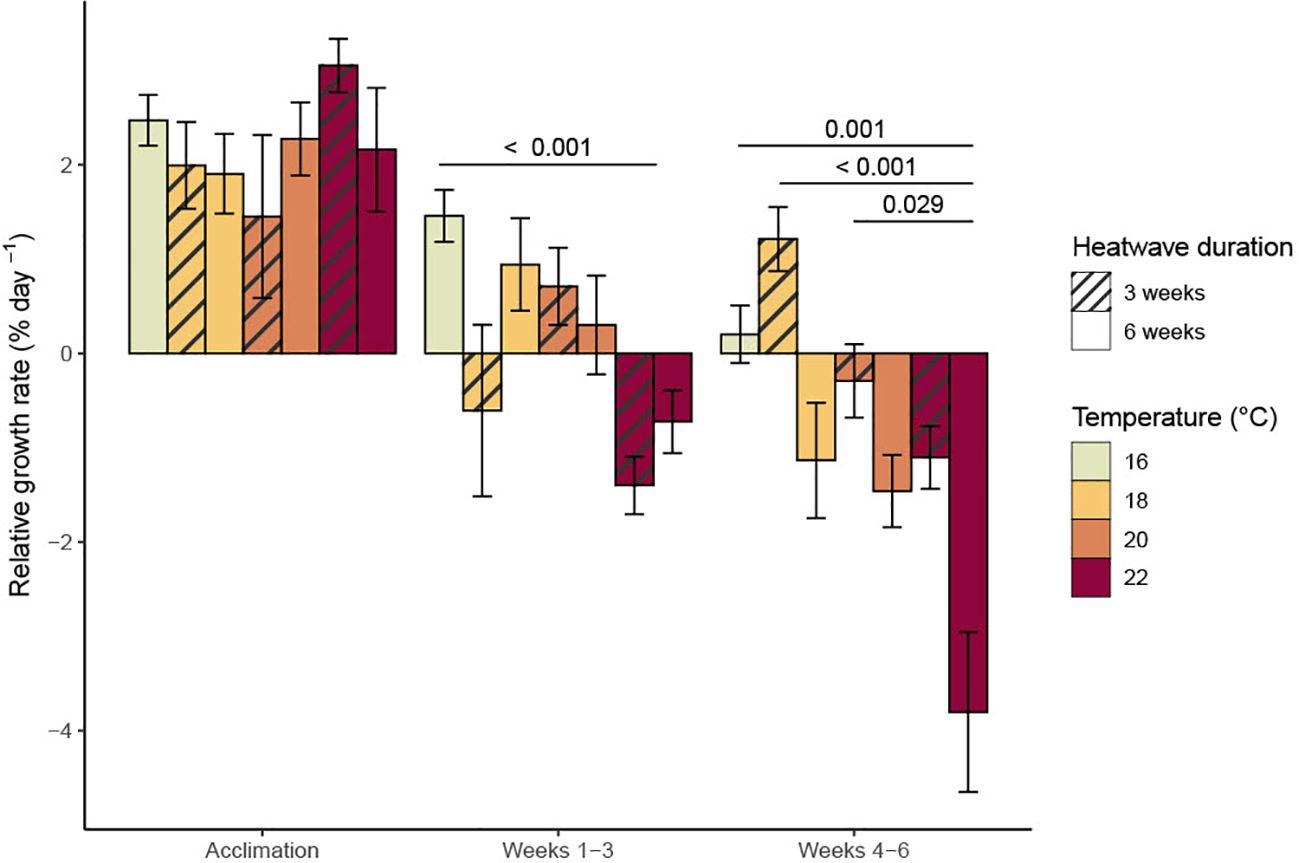
Figure 2. Mean relative growth rates (with standard error) of Macrocystis pyrifera sporophytes over each three-week experimental phase. Significant (p< 0.05) differences between treatments are indicated by bars, with p-values provided.
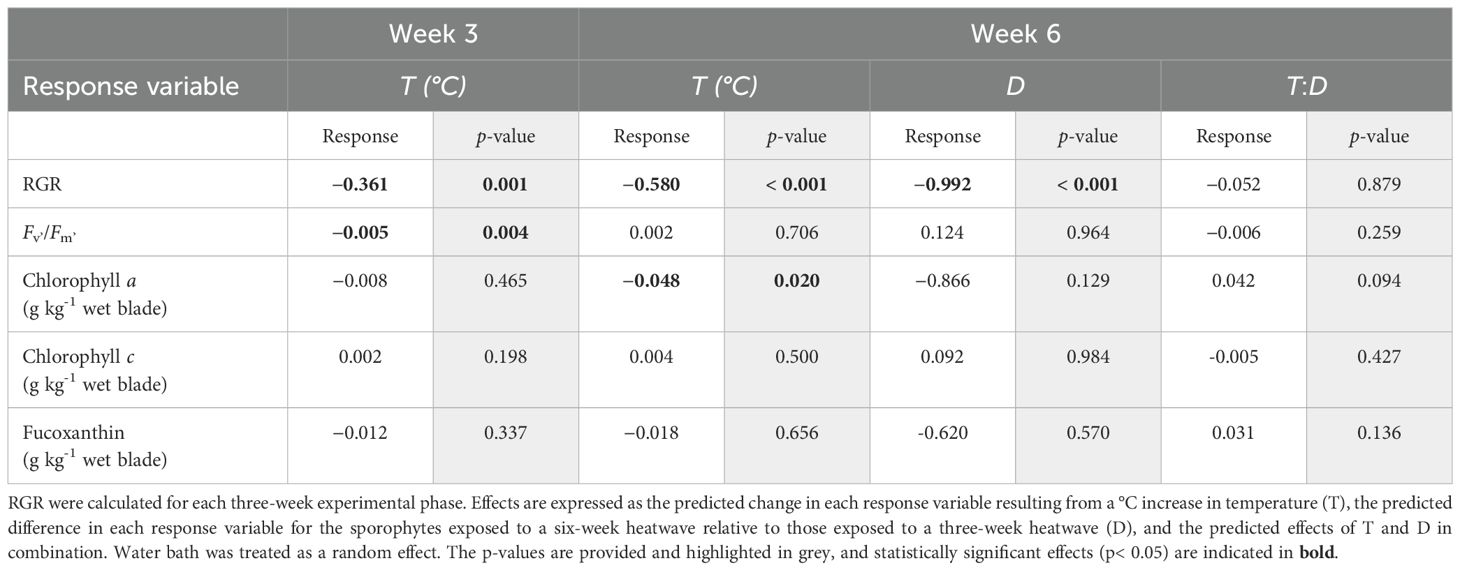
Table 1. Predicted effects of heatwave temperature, duration, and their interaction on Macrocystis pyrifera sporophyte relative growth rates (RGR), chlorophyll fluorescence (Fv’/Fm’), and pigment content, obtained by fitting linear mixed-effects models to the data collected during the heatwave experiment.
Heatwave temperature continued to have a significant negative effect on RGR during the last three weeks of the experimental period (p< 0.001, Table 1). Heatwave duration also had a significant effect on long-term RGR during this period (p< 0.001, Table 1), as the sporophytes which remained in heatwave conditions for six weeks continued to decline in length at a more rapid rate than those which were returned to 16°C after three weeks. The sporophytes returned to 16°C had some signs of recovery, with their mean RGR becoming more positive during weeks four and five (Figure 1; day 49–56). The sporophytes from the 18°C, three-week heatwave treatment had a particularly high mean RGR during this period (Figure 2). Conversely, many of the sporophytes that had been kept at 20°C and 22°C continued to erode, although less rapidly than those that remained in heatwave conditions (Figure 2). There was no evidence for an interactive effect of heatwave temperature and duration. Over the final three weeks of the experimental period, the sporophytes in the 22°C, six-week heatwave treatment had a significantly lower mean RGR than the control treatment (p = 0.001), as well as the three-week heatwave treatments at 18°C and 20°C (p< 0.001 and p = 0.029, respectively, Figure 2).
3.3 Chlorophyll fluorescence
Overall, there was little variation in mean Fv’/Fm’ values between treatments, except for the 22°C heatwave treatment, which had a significantly lower mean (0.704 ± 0.012) than any of the other treatments after three weeks in heatwave conditions (p = 0.001, Figure 3). This difference decreased by the end of the six-week heatwave; at that point, the mean Fv’/Fm’ value of the surviving sporophytes in the 22°C, six-week treatment was 0.731 ± 0.010, which was noticeably, but not significantly, lower than the other treatments (Figure 3). Overall, temperature had a significant impact on Fv’/Fm’ during the first three weeks of heatwave conditions (p = 0.004, Table 1), but not the latter half of the experiment (p = 0.706, Table 1).
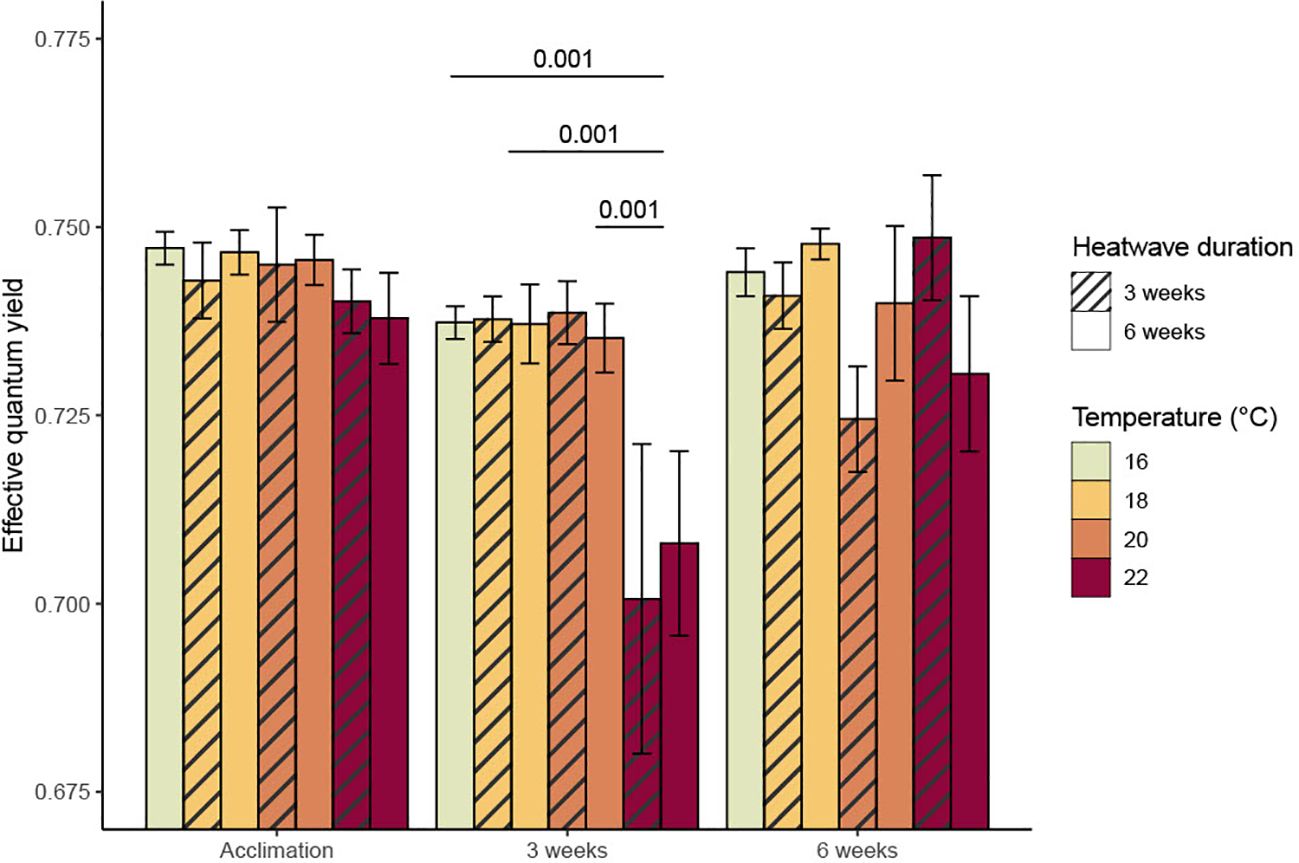
Figure 3. Mean effective quantum yield of photochemical energy conversion (Fv’/Fm’) (with standard error) of Macrocystis pyrifera sporophytes at the end of each experimental phase. Significant (p< 0.05) differences between treatments are indicated by bars, with p-values provided.
3.4 Dissolved inorganic carbon uptake
DIC uptake rates were extremely variable within treatments; the sporophytes with the highest uptake rates tended to be those kept at 18°C and 20°C (Figure 4). Mean DIC uptake rates remained relatively stable between the heatwave and recovery periods in the 20°C and 22°C, three-week heatwave treatments. However, there was a noticeable, but non-significant, decline in mean DIC uptake rates within the 18°C, three-week treatment, from 2.50 ± 0.40 µmol hr-1 cm-2 during the heatwave to 1.99 ± 0.79 µmol hr-1 cm-2 during the recovery period. Conversely, mean DIC uptake rates increased non-significantly between week two and week five among the sporophytes subjected to six-week heatwaves (Figure 4). There was no relationship between temperature and DIC uptake (p = 0.642, Table 2); however, heatwave duration did have a significant impact on temperature, due to the increase in average DIC uptake rates within the heatwave treatments during the second half of the six-week heatwave (p = 0.039, Table 2). There were no statistically significant differences between individual treatments.
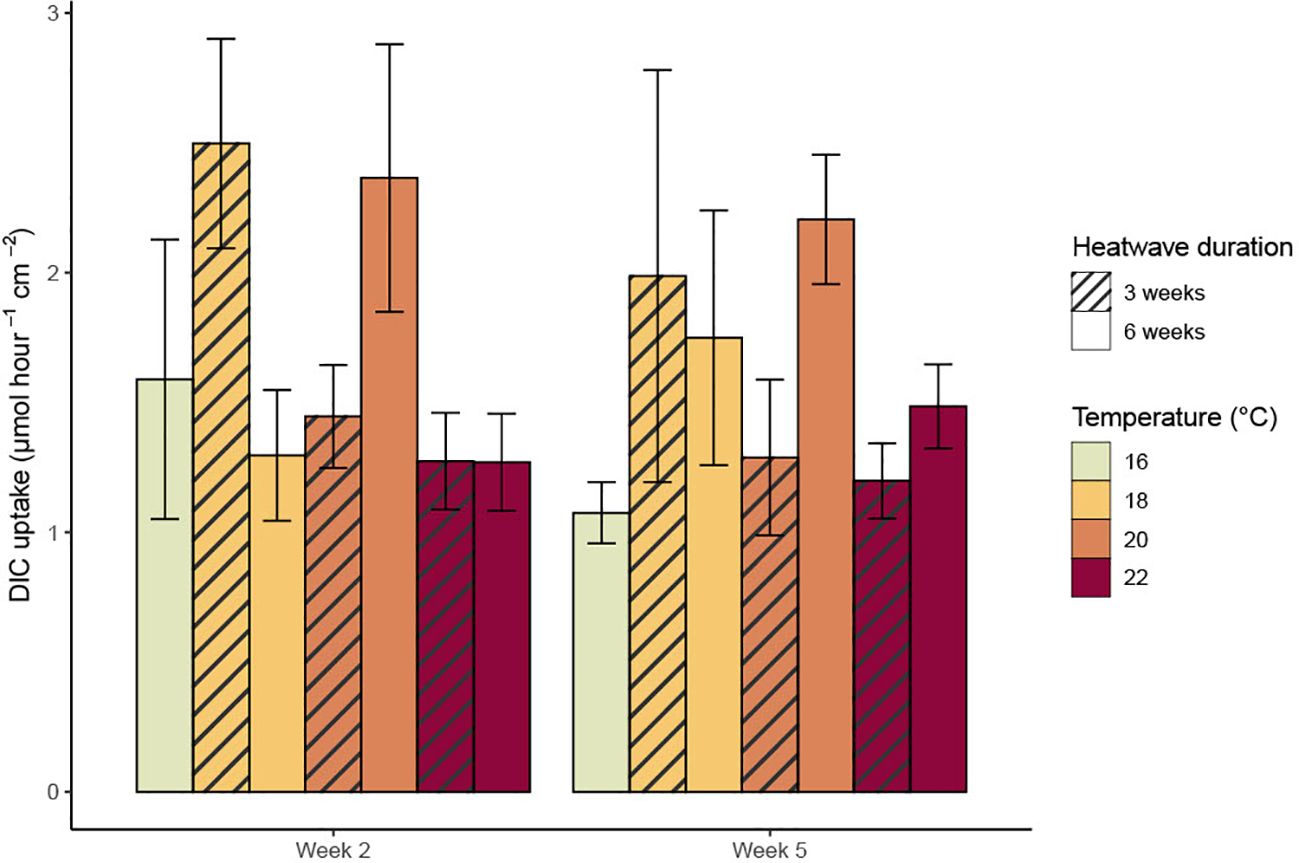
Figure 4. Mean dissolved inorganic carbon (DIC) uptake rates (with standard error) of Macrocystis pyrifera sporophytes at the mid-point of each heatwave phase.
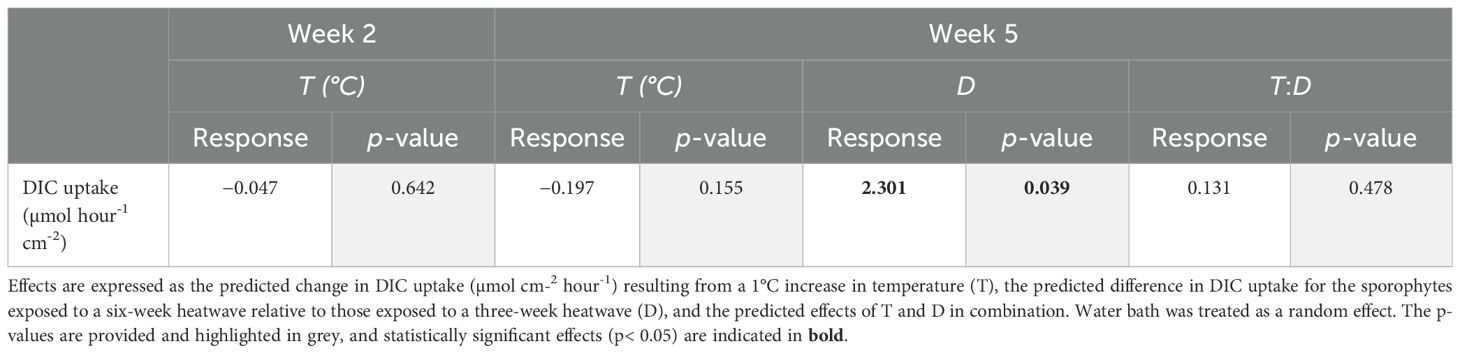
Table 2. Predicted effects of heatwave temperature, duration, and their interaction on dissolved inorganic carbon (DIC) uptake rates of Macrocystis pyrifera sporophytes, obtained by fitting linear mixed-effects models to the data collected during the heatwave experiment.
3.5 Pigment content
After three weeks in heatwave conditions, the sporophytes kept at 22°C had relatively low mean chlorophyll a (0.123 ± 0.031 g kg-1) and fucoxanthin (0.095 ± 0.025 g kg-1) content when compared to the other temperature treatments (Figures 5A, C). Chlorophyll a and fucoxanthin content were also slightly lower (chlorophyll a: 0.173 ± 0.051 g kg-1; fucoxanthin: 0.193 ± 0.027 g kg-1) at 18°C and higher (chlorophyll a: 0.233 ± 0.010 g kg-1; fucoxanthin: 0.252 ± 0.010 g kg-1) at 20°C when compared to the control treatment (chlorophyll a: 0.204 ± 0.028 g kg-1; fucoxanthin: 0.211 ± 0.027 g kg-1). However, these differences were not statistically significant (Figures 5A, C; Table 1). Temperature had no effect on chlorophyll c content (Figure 5B; Table 1).
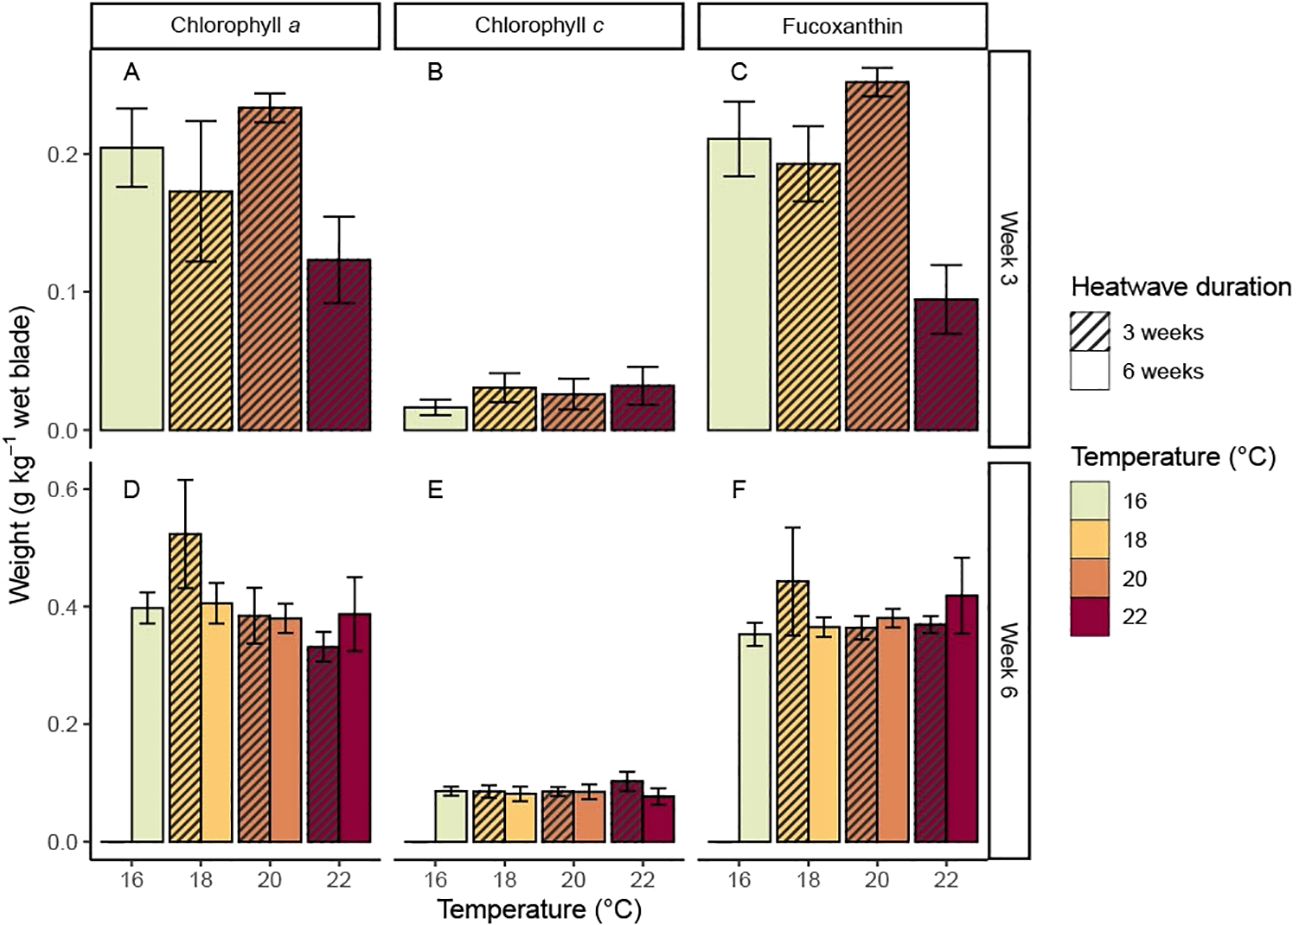
Figure 5. Mean concentrations of (A) chlorophyll a, (B) chlorophyll c, and (C) fucoxanthin (with standard error) in Macrocystis pyrifera blade tissue after three weeks in heatwave conditions, and mean concentrations of (D) chlorophyll a, (E) chlorophyll c, and (F) fucoxanthin (with standard error) in blade tissue at the end of the experiment.
The mean pigment content of the tissue samples taken at week six was about twice as high as the week three samples. This trend was consistent across all treatments, including controls, and all three pigments analysed. The week six samples generally showed less variation in pigmentation between treatments when compared to the week three samples (Figures 5D–F). However, the sporophytes from the 18°C, three-week heatwave treatment had noticeably higher mean chlorophyll a (0.524 ± 0.028 g kg-1) and fucoxanthin (0.443 ± 0.092 g kg-1) content than the control treatment (chlorophyll a: 0.398 ± 0.026 g kg-1; fucoxanthin: 0.353 ± 0.019 g kg-1). The sporophytes from the 22°C treatments generally had low chlorophyll a content when compared to the other treatments, but this was not statistically significant. Overall, there was statistical support for a decrease in chlorophyll a content with increasing temperature at the six-week mark (p = 0.020, Table 1), but not at the three-week mark (p = 0.465, Table 1). No statistically significant relationships were found between heatwave temperature or duration and chlorophyll c or fucoxanthin content (Table 1).
3.6 Total % carbon, % nitrogen, and stable isotope values
There was a significant relationship between temperature and total % carbon content (p = 0.009, Table 3), with mean values of % carbon increasing consistently with temperature (Figure 6). The 20°C and 22°C, six-week treatments both had significantly higher mean % carbon values than the control treatment (p = 0.031 and p< 0.001, respectively). No significant relationship was found between temperature and % nitrogen content (p = 0.350, Table 3); however, the 22°C, six-week treatment had significantly higher mean % nitrogen (1.68 ± 0.12%) than the control and both 20°C treatments (Figure 7). There was no consistent relationship between temperature and mass carbon: nitrogen (C:N) ratios; the highest values were found in the 20°C, six-week treatment (Figure 8; p = 0.720, Table 3). Stable isotope ratios were also affected significantly by temperature, with both mean δ13C values (Figure 9; p< 0.001, Table 3) and δ15N values (Figure 10; p = 0.043, Table 3) increasing consistently with temperature among the sporophytes exposed to six-week heatwaves. There were no significant differences in δ15N values between individual treatments, but the 22°C, six-week heatwave treatment had significantly higher δ13C values than the control or 18°C treatments (Figure 9).
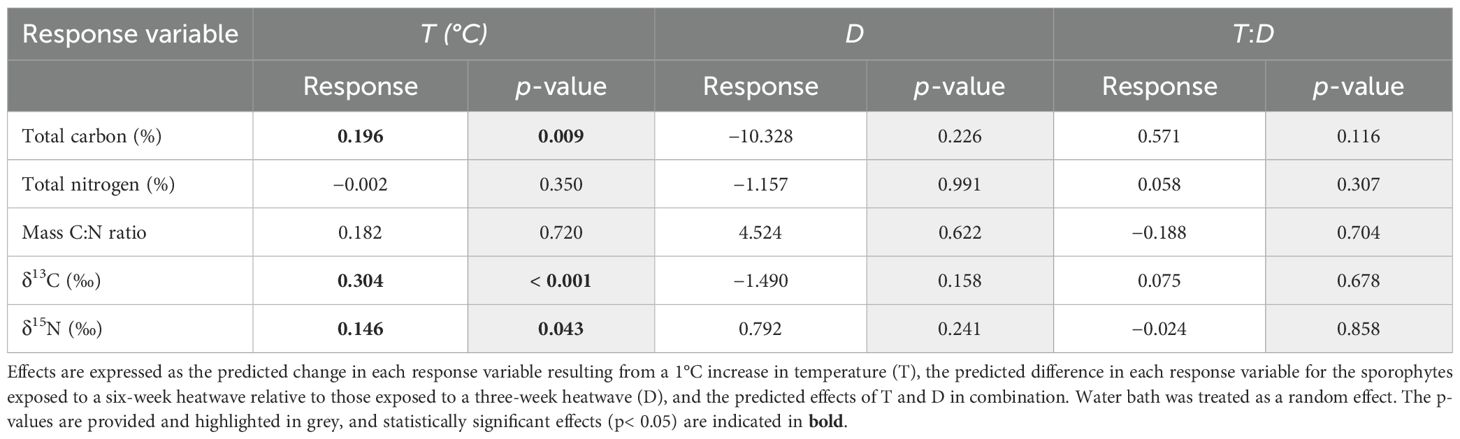
Table 3. Predicted effects of heatwave temperature, duration, and their interaction on % carbon and nitrogen content and δ13C and δ15N values, obtained by fitting linear mixed-effects models to the data obtained from stable isotope analysis of Macrocystis pyrifera blade tissue samples taken at the conclusion of the experiment.
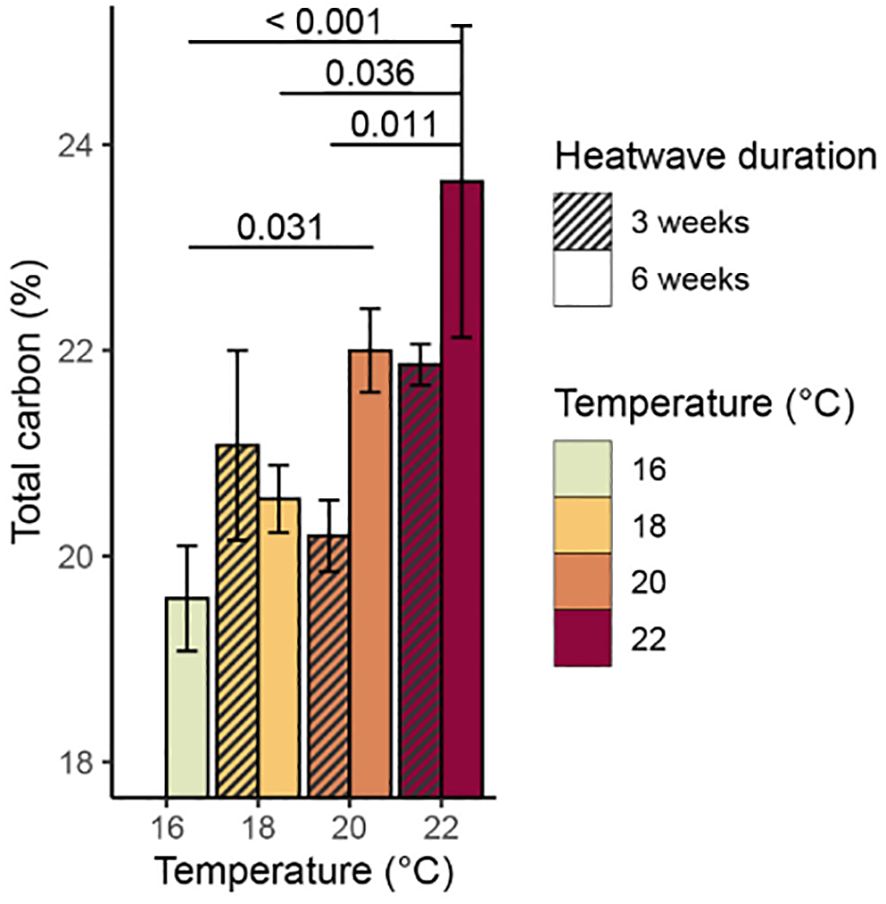
Figure 6. Mean % carbon content (with standard error) of Macrocystis pyrifera blade tissue at the end of the experiment. Significant (p< 0.05) differences between treatments are indicated by bars, with p-values provided.
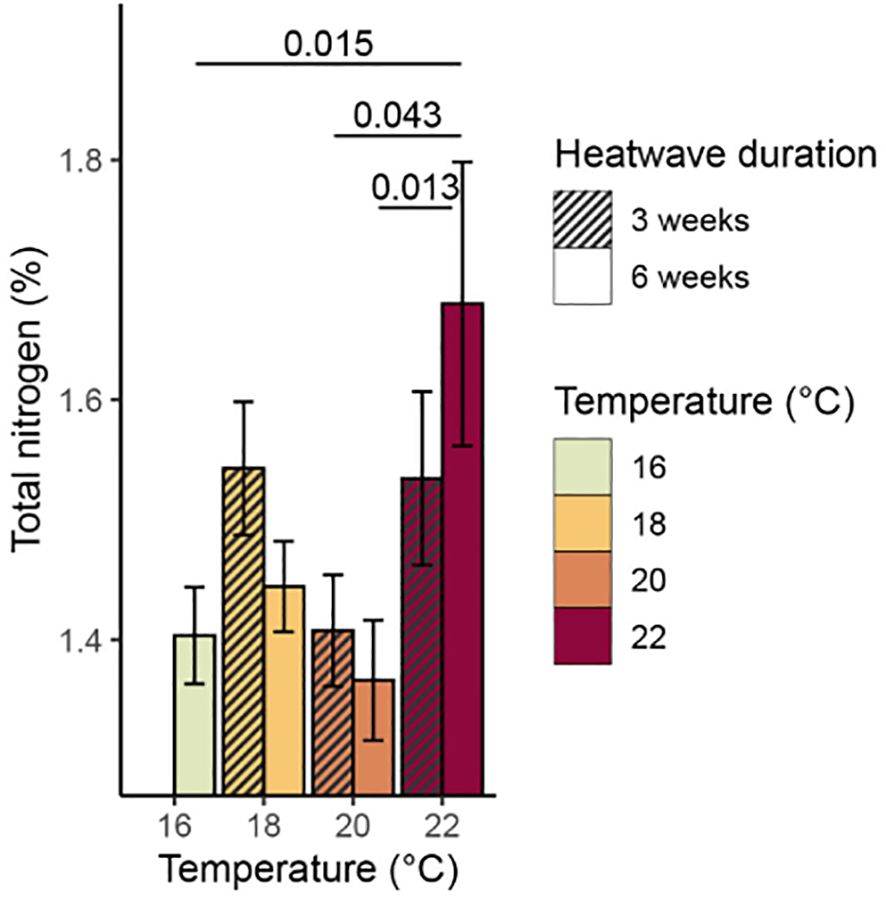
Figure 7. Mean % nitrogen content (with standard error) of Macrocystis pyrifera blade tissue at the end of the experiment. Significant (p< 0.05) differences between treatments are indicated by bars, with p-values provided.
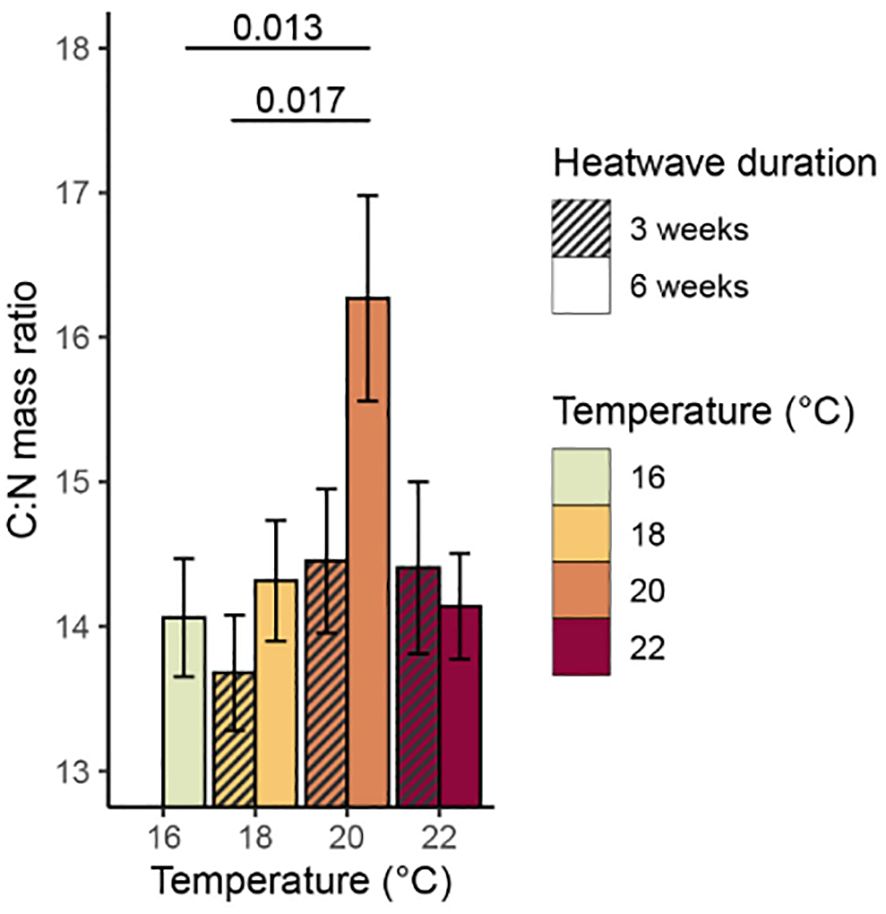
Figure 8. Mean mass carbon:nitrogen (C:N) ratio, with standard error, of Macrocystis pyrifera blade tissue at the end of the experiment. Significant (p< 0.05) differences between treatments are indicated by bars, with p-values provided.
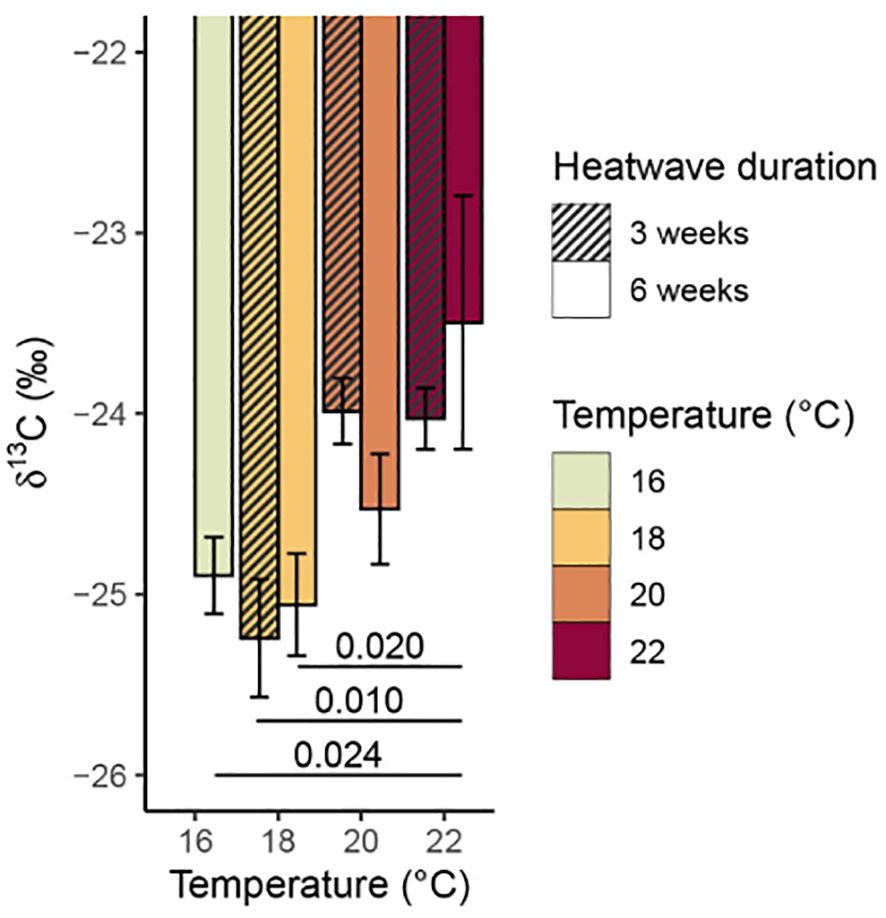
Figure 9. Mean δ13C values (with standard error) of Macrocystis pyrifera blade tissue at the end of the experiment. Significant (p< 0.05) differences between treatments are indicated by bars, with p-values provided.
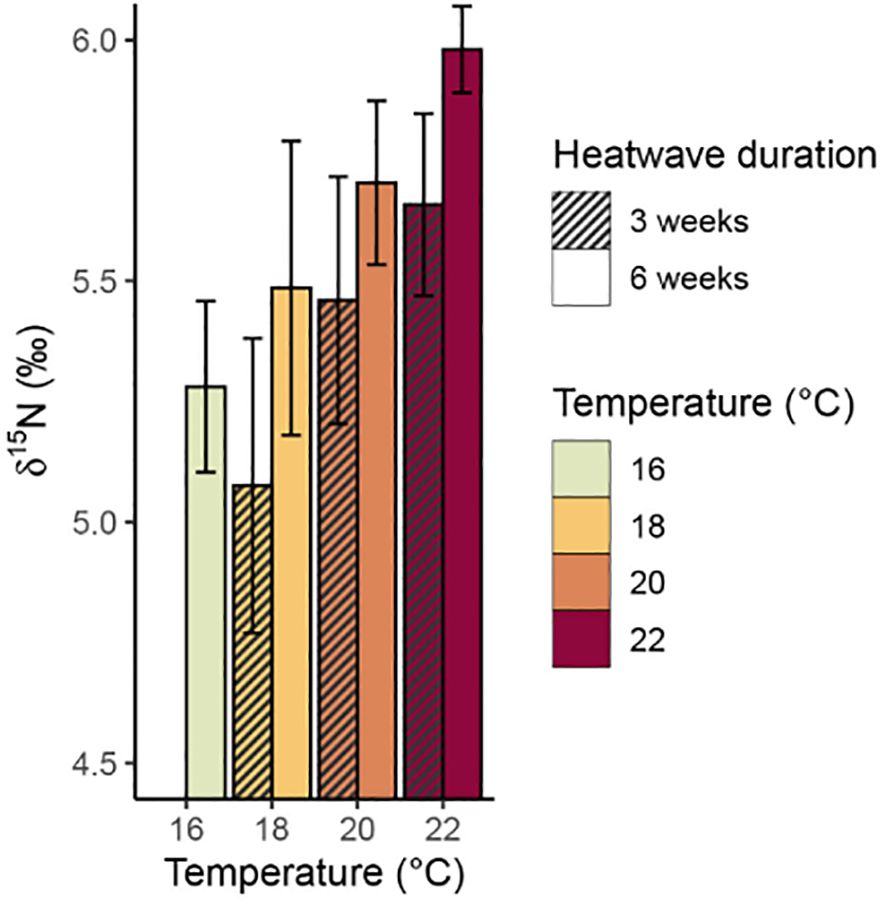
Figure 10. Mean δ15N values (with standard error) of Macrocystis pyrifera blade tissue at the end of the experiment.
The sporophytes that had been kept in heatwave conditions for three weeks still showed some treatment effects at the end of their recovery period, with elevated carbon content, δ13C, and δ15N values relative to the control treatment. The 18°C, three-week treatment was somewhat of an exception, as the sporophytes in this treatment had slightly lower mean values of δ13C (−25.25 ± 0.33‰) and δ15N (5.08 ± 0.31‰) relative to the control treatment (−24.90 ± 0.31‰ and 5.28 ± 0.18‰, respectively), however, these differences are within the range of analytical precision of the stable isotope measurements. Overall, total % carbon content and δ13C values followed similar trends with temperature (Figures 6, 9), and subsequent modelling found evidence of a linear relationship between the two variables (p = 0.009). Conversely, there was no strong evidence of a relationship between total % nitrogen content and δ15N values (p = 0.074). There was no evidence that heatwave duration had any significant effects on total % carbon, total % nitrogen, δ13C, or δ15N values (Table 3).
The % carbon and % nitrogen content and carbon and nitrogen stable isotope ratios of the sporophytes sampled directly from the culture tanks at NIWA are summarized in the Supplementary Material (Supplementary Table S3). These sporophytes had a mean δ13C value of −29.94 ± 0.33‰, and a mean δ15N value of −3.22 ± 0.21‰; both values were much lower than any of the experimental treatments. Conversely, the sporophytes in the culture tanks had a mean % nitrogen content of 2.06 ± 0.05%, which was much higher than any of the experimental treatments.
4 Discussion
4.1 Impacts of heatwave intensity and duration
Increasing both the duration and intensity of marine heatwave treatments used in this experiment had significant negative impacts on the growth of Macrocystis pyrifera sporophytes. The 22°C heatwave treatments, representing a 6°C temperature anomaly relative to summer average temperatures, had larger impacts on growth than any of the other treatments, and were the only treatments with consistent negative impacts on survival, photosynthetic performance, or pigmentation. These findings suggest that local M. pyrifera populations experience a tipping point near 22°C, beyond which significant physiological impacts, including photosynthetic impairment and death, become much more probable.
The longer heatwave had significantly greater impacts on blade growth rates than the shorter heatwave; however, the impacts of elevated temperatures on Fv’/Fm’ and pigmentation became less pronounced over time. In the case of the 22°C treatment, this may have been the result of the less thermally resistant sporophytes dying over the course of the longer heatwave, rather than a sign of acclimatisation to the increased temperature. We were unable to assess the recovery rates of the sporophytes exposed to six-week heatwaves due to time constraints; it would be worthwhile for future studies to further investigate the capacity for M. pyrifera sporophytes to recover from the effects of long-lasting heatwaves.
The M. pyrifera sporophytes used in this experiment were able to recover from thermal stress to some extent. The sporophytes exposed to an 18°C heatwave for three weeks appeared to be in good health by the end of the recovery period, growing more rapidly than the control treatment. The DIC uptake rates from this experiment, as well as previous studies (Fernández et al., 2020), suggest that M. pyrifera sporophytes have higher thermal optima for photosynthesis, at water temperatures between 17–20°C, than for growth. Therefore, the sporophytes in the 18°C treatments may have been able to photosynthesise more rapidly and accumulate greater quantities of stored carbohydrates during the heatwave. Since they were less severely affected by thermal stress than the higher temperature treatments, they may have been better able to direct these reserves towards growth and pigment production during their recovery period.
4.2 Trends and comparisons to previous findings
The consistent negative relationship between heatwave temperature and M. pyrifera growth rates that was observed during this study supports trends found in previous laboratory experiments. Temperatures higher than 14°C are consistently associated with reduced blade growth in M. pyrifera (Mabin et al., 2019; Fernández et al., 2020; Umanzor et al., 2021); our results mirror this trend, though we did not use a 14°C treatment here, as our experiment was designed to assess responses to MHWs at local summer temperatures. Our findings also support field observations which linked a MHW event, with widespread temperature anomalies of 1–4°C (equivalent to our 18°C and 20°C treatments), to declines in M. pyrifera canopy cover throughout southern New Zealand (Tait et al., 2021). Negative impacts on survival, chlorophyll fluorescence, and photosynthetic performance are often only observed at or above 20°C (Mabin et al., 2019; Fernández et al., 2020; Sánchez-Barredo et al., 2020; Fernández et al., 2021; Umanzor et al., 2021), as was the case in our experiment, although they have sometimes been reported at lower temperatures (Brown et al., 2014; Fernández et al., 2020). The threshold for 100% mortality in young M. pyrifera blades from Tasmania, Australia was between 24°C and 27°C (Fernández et al., 2020). The Wellington population could have a similar survival threshold; the study site used by Fernández et al. (2020) had a mean summer sea surface temperature of around 16°C between 1980 and 2010 (Butler et al., 2020), which is similar to Wellington’s mean summer sea surface temperatures. Around 30% of M. pyrifera gametophytes from New Zealand survived at 23.6°C (Le et al., 2024). Further studies would be required to confirm where the survival threshold lies for sporophytes from the Wellington M. pyrifera population. The effect of temperature on pigmentation in M. pyrifera is variable (e.g., Mabin et al., 2019; Fernández et al., 2020; Sánchez-Barredo et al., 2020; Umanzor et al., 2021); it has been suggested that related stressors, such as nutrient depletion, could be a more important driver of tissue bleaching in M. pyrifera than temperature itself (Sánchez-Barredo et al., 2020).
The increased uptake of the heavier isotopes 13C and 15N by M. pyrifera sporophytes at elevated temperatures in this study is unusual when compared to previous studies (e.g., Fernández et al., 2020). We considered the alternative hypothesis that the seawater source used by NIWA, where the sporophytes were originally cultured, might have had higher concentrations of these heavy isotopes than the source used by the Wellington University Coastal Ecology Laboratory, and the heat-stressed sporophytes might have preferentially retained these heavier isotopes due to their reduced growth and tissue turnover rates. However, the sporophytes grown under pre-experimental conditions at NIWA had much lower mean δ13C and δ15N values than the sporophytes used in the experiment. Hence, the increases in δ13C and δ15N values with temperature within our experiment are likely a direct response to the simulated heatwaves.
Macroalgal δ13C values between -30 and -10 ‰ theoretically indicate the use of both bicarbonate and carbon dioxide (CO2) as carbon sources (Raven et al., 2002). In macroalgae, an increase in photosynthetic rates can drive increased bicarbonate uptake to satisfy the carbon requirements of photosynthesis (Cornelisen et al., 2007). Direct uptake of bicarbonate is achieved by using CO2-concentrating mechanisms (CCMs) (Raven et al., 2002; Meyer and Griffiths, 2013; Sun et al., 2023), which are present in M. pyrifera (Hepburn et al., 2011; Fernández et al., 2014). Although CCMs allow macroalgae to take up and store more carbon, they are energetically and nutrient costly, and these demands can limit the growth of CCM-using species in unfavourable environmental conditions (Hepburn et al., 2011). The correlation between total % carbon content and δ13C values within our samples suggests that the relationship between temperature and carbon content may have been driven by increased bicarbonate uptake at higher temperatures. Thermal stress could perhaps have driven these kelp sporophytes to respond by actively taking up and storing more DIC. Since kelp blade tissue strength is compromised at high temperatures (Simonson et al., 2015), perhaps the sporophytes exposed to simulated MHWs in our experiment prioritised storage of carbohydrates instead of blade growth. These stored reserves could theoretically have been used to increase blade elongation rates if temperatures reduced, to compensate for reduced growth during the heatwave. The strategy of directing more energy towards DIC uptake and carbon storage could be disadvantageous in the long term, as the high energetic costs associated with CCM operation might limit the energy available for other necessary processes such as photosystem operation and pigment synthesis. Follow-up studies would be necessary to confirm whether, and how, this M. pyrifera population is capable of upregulating carbon storage in response to thermal stress. Perhaps this could be examined by measuring the uptake rates of different carbon species by kelp sporophytes, or by assessing the expression of genes related to carbon acquisition and storage. In other kelp species, some transcripts related to cell division and photosynthesis can be downregulated under thermal stress (Hara et al., 2022; Liesner et al., 2022), perhaps indicating a trade-off between acclimatisation to heat stress and the efficiency of some biological processes.
4.3 Wider context
Some M. pyrifera populations are relatively resistant to MHWs in the field, even when temperature anomalies exceed 4°C (Reed et al., 2016). Even when severe canopy losses occur, M. pyrifera stands can recover to their original canopy area and stem density within several months to two years after disturbance (Dayton et al., 1992; Edwards, 2004; Edwards and Hernández-Carmona, 2005; O’Connor and Anderson, 2010; Tolimieri et al., 2023). Juvenile recruitment plays a central role in this recovery process (Graham et al., 1997); recruitment success can also serve as an indicator of the overall health and resilience of kelp forests (Barrientos et al., 2024). Therefore, the ability of juveniles to survive MHWs, as demonstrated by this study, is likely a key contributing factor to the rapid recovery rates of M. pyrifera stands. However, kelp population dynamics are affected by more traits than survivorship rates alone. Larger M. pyrifera juveniles are much more likely to survive, potentially because they are better able to compete for light and less vulnerable to density-dependent mortality (Dean et al., 1989). Our findings suggest that long-lasting MHWs could limit the growth rates of new recruits. This means that even if they survive the direct effects of thermal stress, these sporophytes may be more susceptible to mortality due to other stressors, such as competition for light (Dean et al., 1989). Thus, reduced growth, and increased susceptibility to other stressors, could ultimately delay or prevent canopy recovery. In the field, kelp population recovery can be suppressed by long-lasting heatwaves (Arafeh-Dalmau et al., 2019), as well as other stressors including grazing (Dayton et al., 1992; Edwards, 2019) and wave exposure (Graham et al., 1997). MHWs can also create more favourable conditions for more heat-tolerant algal species, leading to increased competition (Wernberg et al., 2016; Atkinson et al., 2020), which would likely place additional pressure on thermally-stressed kelp recruits. In New Zealand, for instance, MHWs could allow the invasive kelp Undaria pinnatifida to outcompete native species (James and Shears, 2016). Additionally, the deaths of less heat-tolerant individuals during MHWs can lead to reductions in genetic diversity within kelp populations. While this process of “genetic tropicalisation” may lead to greater thermal tolerance at a population level, it also increases the risk of inbreeding depression, and may cause a reduction in overall adaptive capacity (Coleman et al., 2020). This could ultimately limit the ability of kelp populations to adapt to other threats, such as novel diseases or pollutants.
A 2°C anomaly relative to mean sea surface temperatures (i.e., the 18°C treatment) is the most representative of a typical MHW event in the Wellington region (Supplementary Figures S1, S2), as well as MHW events throughout New Zealand as a whole (Behrens et al., 2022; MetOcean Solutions, 2023). However, mean and maximum MHW intensities have been trending upwards within New Zealand for the past two decades (Montie et al., 2023), and are predicted to continue increasing (Behrens et al., 2022). The Wellington region has already experienced temperature spikes higher than 20°C during MHWs (Supplementary Figure S1), with some sites within the region experiencing temperatures of up to 21.5°C (Krieger et al., 2023c). Modelling suggests that long-lasting MHWs exceeding 22°C are presently unlikely to occur in the regions where M. pyrifera grows within New Zealand, but these could become more likely within the next century if global greenhouse gas emissions continue to increase (Behrens et al., 2022). Additionally, most models of historical and future occurrence of MHWs in New Zealand rely on satellite data collected over broad spatial scales. The shallow coastal environments where kelp grows are highly dynamic; temperatures within these habitats could exceed MHW thresholds without being recognised as a regional MHW. Therefore, it is valuable to understand how M. pyrifera would respond to temperatures higher than those recorded during contemporary MHW events.
Temperature anomalies greater than 4°C have been recorded during MHWs in New Zealand, mostly in southern regions (MetOcean Solutions, 2023). There is some evidence that warm-edge kelp populations may be more resilient to increased temperatures than higher-latitude populations (Ladah, 2000; Muth et al., 2019; Hollarsmith et al., 2020; King et al., 2019; Liesner et al., 2020), though there are exceptions (Cavanaugh et al., 2019). Therefore, populations from New Zealand’s South Island, where M. pyrifera is most widespread (Shaffer and Rovellini, 2020), could theoretically be less heat-tolerant than the warm-edge population studied here. Assessing the vulnerability of M. pyrifera populations from southern New Zealand to MHWs would be a worthwhile direction for further research.
4.4 Conclusion
This work demonstrates that marine heatwaves can reduce the growth rates of juvenile M. pyrifera sporophytes in New Zealand, while heatwaves surpassing 22°C have far more severe impacts, including potentially reducing the photosynthetic efficiency and survivorship of juveniles. Long-lasting heatwaves could suppress recruitment and growth of juvenile kelp, potentially jeopardising the long-term stability of local populations. However, the kelp studied here demonstrated a high capacity for recovery after heatwaves, suggesting that populations can persist if key temperature thresholds are not exceeded. If sea surface temperatures around New Zealand continue to rise, and temperature anomalies exceeding 6°C become more prevalent throughout central and southern New Zealand, M. pyrifera could face a greater risk of population collapse and local extinction.
Data availability statement
The original contributions presented in the study are included in the article/Supplementary Material. Further inquiries can be directed to the corresponding author.
Author contributions
IB: Conceptualization, Data curation, Formal analysis, Investigation, Methodology, Visualization, Writing – original draft. YK: Methodology, Writing – review & editing. EK: Conceptualization, Methodology, Supervision, Writing – review & editing. SB: Investigation, Methodology, Writing – review & editing. RD: Conceptualization, Funding acquisition, Methodology, Project administration, Resources, Supervision, Writing – review & editing. CC: Conceptualization, Funding acquisition, Methodology, Project administration, Resources, Supervision, Writing – review & editing.
Funding
The author(s) declare financial support was received for the research, authorship, and/or publication of this article. This research was supported by funding from the Coastal People, Southern Skies Centre for Research Excellence project to CEC (E4280), a Rutherford Discovery Fellowship to CEC (VUW 1701), the Wellington Community Fund, the Eurofins Foundation, and the Clare Foundation.
Acknowledgments
The authors would like to thank Neill Barr, Denisa Berbece, Imke Böök, Laura Bornemann Santamaría, Katie Fenton, Ashtyn Isaak, Holly Koch, Maya Korth, Journey Luond, Daniel McNaughtan, Alexandra Northmore, Ohad Peleg, Siddharth Ravishankar, Aleluia Taise, and John van der Sman for their help with kelp culture, data collection, maintaining the experiment, and feedback. Thanks also to Kat Siegers and Arlo McMahon for their assistance with experimental setup. Our thanks also go to Josette Delgado, Oliver Kerr-Hislop, Graeme Moss, and Julie Brown for their help with stable isotope analysis, and to Linda Groenewegen for her work on nutrient sample analysis.
Conflict of interest
The authors declare that the research was conducted in the absence of any commercial or financial relationships that could be construed as a potential conflict of interest.
The author(s) declared that they were an editorial board member of Frontiers, at the time of submission. This had no impact on the peer review process and the final decision.
Publisher’s note
All claims expressed in this article are solely those of the authors and do not necessarily represent those of their affiliated organizations, or those of the publisher, the editors and the reviewers. Any product that may be evaluated in this article, or claim that may be made by its manufacturer, is not guaranteed or endorsed by the publisher.
Supplementary material
The Supplementary Material for this article can be found online at: https://www.frontiersin.org/articles/10.3389/fmars.2024.1423595/full#supplementary-material
Abbreviations
CCM, Carbon dioxide concentrating mechanism; DIC, Dissolved inorganic carbon; DMSO, Dimethyl sulfoxide; MHW, Marine heatwave; RGR, Relative growth rate; TA, Total alkalinity; δ13C Ratio of 13C to 12C, expressed in ‰ units; δ15N Ratio of 15N to 14N, expressed in ‰ units.
References
Arafeh-Dalmau N., Montaño-Moctezuma G., Martínez J. A., Beas-Luna R., Schoeman D. S., Torres-Moye G. (2019). Extreme marine heatwaves alter kelp forest community near its equatorward distribution limit. Front. Mar. Sci. 6. doi: 10.3389/fmars.2019.00499
Arkema K. K., Reed D. C., Schroeter S. C. (2009). Direct and indirect effects of giant kelp determine benthic community structure and dynamics. Ecology 90, 3126–3137. doi: 10.1890/08-1213.1
Atkinson J., King N. G., Wilmes S. B., Moore P. J. (2020). Summer and winter marine heatwaves favor an invasive over native seaweeds. J. Phycol. 56, 1591–1600. doi: 10.1111/jpy.13051
Barrientos S., Piñeiro-Corbeira C., Díaz-Tapia P., García M. E., Barreiro R. (2024). Recruitment as a possible indicator of declining resilience in degraded kelp forests. Ecol. Indic. 160, 111917. doi: 10.1016/j.ecolind.2024.111917
Bates D., Maechler M., Bolker B., Walker S. (2023). lme4: Linear Mixed-Effects Models using ‘Eigen’ and S4. R package version 1.1-33. Available online at: https://cran.r-project.org/web/packages/lme4/index.html.
Behrens E., Rickard G., Rosier S., Williams J., Morgenstern O., Stone D. (2022). Projections of future marine heatwaves for the oceans around New Zealand using New Zealand’s Earth System Model. Front. Climate 4. doi: 10.3389/fclim.2022.798287
Booth J. D. (1975). Seasonal and tidal variations in the hydrology of Wellington harbour. New Z. J. Mar. Freshw. Res. 9, 333–354. doi: 10.1080/00288330.1975.9515572
Britton D., Cornwall C. E., Revill A. T., Hurd C. L., Johnson C. R. (2016). Ocean acidification reverses the positive effects of seawater pH fluctuations on growth and photosynthesis of the habitat forming kelp, Ecklonia radiata. Nat. Sci. Rep. 6, 26036. doi: 10.1038/srep26036
Brown M. B., Edwards M. S., Kim K. Y. (2014). Effects of climate change on the physiology of giant kelp, Macrocystis pyrifera, and grazing by purple urchin, Strongylocentrotus purpuratus. Algae 29, 203–215. doi: 10.4490/algae.2014.29.3.203
Butler C. L., Lucieer V. L., Wotherspoon S. J., Johnson C. R. (2020). Multi-decadal decline in cover of giant kelp Macrocystis pyrifera at the southern limit of its Australian range. Mar. Ecol. Prog. Ser. 653, 1–18. doi: 10.3354/meps13510
Cavanaugh K. C., Reed D. C., Bell T. W., Castorani M. C. N., Beas-Luna R. (2019). Spatial variability in the resistance and resilience of giant kelp in Southern and Baja California to a multiyear heatwave. Front. Mar. Sci. 6. doi: 10.3389/fmars.2019.00413
Coleman M. A., Minne A. J. P., Vranken S., Wernberg T. (2020). Genetic tropicalisation following a marine heatwave. Nat. Sci. Rep. 10, 12726. doi: 10.1038/s41598-020-69665-w
Cornelisen C. D., Wing S. R., Clark K. L., Bowman M. H., Frew R. D., Hurd C. L. (2007). Patterns in the δ13C and δ15N signature of Ulva pertusa: Interaction between physical gradients and nutrient source pools. Limnol. Oceanogr. 52, 820–832. doi: 10.4319/lo.2007.52.2.0820
Cornwall C. E., Nelson W. A., Aguirre J. D., Blain C. O., Coyle L., D’Archino R., et al. (2023). Predicting the impacts of climate change on New Zealand’s seaweed-based ecosystems. New Z. J. Bot. doi: 10.1080/0028825X.2023.2245786
Dayton P. K., Tegner M. J., Parnell P. E., Edwards P. B. (1992). Temporal and spatial patterns of disturbance and recovery in a kelp forest community. Ecol. Monogr. 62, 421–445. doi: 10.2307/2937118
Dean T. A., Thies K., Lagos S. L. (1989). Survival of juvenile giant kelp: the effects of demographic factors, competitors, and grazers. Ecology 70, 483–495. doi: 10.2307/1937552
de Burgh-Day C. O., Spillman C. M., Smith G., Stevens C. L. (2022). Forecasting extreme marine heat events in key aquaculture regions around New Zealand. J. South. Hemis. Earth Syst. Sci. 72, 58–72. doi: 10.1071/ES21012
Dickson A. G., Sabine C. L., Christian J. R. (Eds.) (2007). Guide to best practices for ocean CO2 measurements (PICES Special Publication 3. North Pacific Marine Science Organization: Sidney, BC, Canada).
Edwards M. S. (2004). Estimating scale-dependency in disturbance impacts: El Niños and giant kelp forests in the northeast Pacific. Oecologia 138, 436–447. doi: 10.1007/s00442-003-1452-8
Edwards M. S. (2019). Comparing the impacts of four ENSO events on giant kelp (Macrocystis pyrifera) in the northeast Pacific Ocean. Algae 34, 141–151. doi: 10.4490/algae.2019.34.5.4
Edwards M. S., Hernández-Carmona G. (2005). Delayed recovery of giant kelp near its southern range limit in the North Pacific following El Niño. Mar. Biol. 147, 273–279. doi: 10.1007/s00227-004-1548-7
Eger A. M., Marzinelli E. M., Beas-Luna R., Blain C. O., Blamey L. K., Byrnes J. E. K., et al. (2023). The value of ecosystem services in global marine kelp forests. Nat. Commun. 14, 1894. doi: 10.1038/s41467-023-37385-0
Fernández P. A., Gaitán-Espitia J. D., Leal P. P., Schmid M., Revill A. T., Hurd C. L. (2020). Nitrogen sufficiency enhances thermal tolerance in habitat-forming kelp: implications for acclimation under thermal stress. Nat. Sci. Rep. 10, 3186. doi: 10.1038/s41598-020-60104-4
Fernández P. A., Hurd C. L., Roleda M. Y. (2014). Bicarbonate uptake via an anion exchange protein is the main mechanism of inorganic carbon acquisition by the giant kelp Macrocystis pyrifera (Laminariales, Phaeophyceae) under variable pH. J. Phycol. 50, 998–1008. doi: 10.1111/jpy.12247
Fernández P. A., Labbé B., Gaitán-Espitia J. D., Hurd C. L., Paine E. R., Willis A., et al. (2023). The influence of ammonium to nitrate ratio on the thermal responses of early life stages of the giant kelp Macrocystis pyrifera. Algal Res. 72, 103114. doi: 10.1016/j.algal.2023.103114
Fernández P. A., Navarro J. M., Camus C., Torres R., Buschmann A. H. (2021). Effect of environmental history on the habitat−forming kelp Macrocystis pyrifera responses to ocean acidification and warming: a physiological and molecular approach. Nat. Sci. Rep. 11, 2510. doi: 10.1038/s41598-021-82094-7
Filbee-Dexter K., Wernberg T. (2018). Rise of turfs: a new battlefront for globally declining kelp forests. BioScience 68, 64–76. doi: 10.1093/biosci/bix147
Filbee-Dexter K., Wernberg T. (2020). Substantial blue carbon in overlooked Australian kelp forests. Nat. Sci. Rep. 10, 12341. doi: 10.1038/s41598-020-69258-7
Fox J., Weisberg S., Price B. (2023). car: Companion to Applied Regression. R package version 3.1-2. Available online at: https://cran.r-project.org/web/packages/car/index.html.
Gattuso J.-P., Epitalon J.-M., Lavigne H., Orr J. (2021). seacarb: Seawater Carbonate Chemistry. R package version 3.3.2. Available online at: https://cran.r-project.org/web/packages/seacarb/index.html.
Gaylord B., Rosman J. H., Reed D. C., Koseff J. R., Fram J., SacIntyre S., et al. (2007). Spatial patterns of flow and their modification within and around a giant kelp forest. Limnol. Oceanogr. 52, 1838–1852. doi: 10.4319/lo.2007.52.5.1838
Graham M. H. (2004). Effects of local deforestation on the diversity and structure of Southern California giant kelp forest food webs. Ecosystems 7, 341–357. doi: 10.1007/s10021-003-0245-6
Graham M. H., Harrold C., Lisin S., Light K., Watanabe J. M., Foster M. S. (1997). Population dynamics of giant kelp Macrocystis pyrifera along a wave exposure gradient. Mar. Ecol. Prog. Ser. 148, 269–279. doi: 10.3354/meps148269
Guillard R. R. L. (1975). “Culture of phytoplankton for feeding marine invertebrates,” in Culture of Marine Invertebrate Animals. Eds. Smith W. L., Chanley M. H. (Springer, Boston, MA). doi: 10.1007/978-1-4615-8714-9_3
Hara Y., Otake Y., Akita S., Yamazaki T., Takahashi F., Yoshikawa S., et al. (2022). Gene expression of a canopy-forming kelp, Eisenia bicyclis (Laminariales, Phaeophyceae), under high temperature stress. Phycol. Res. 70, 203–211. doi: 10.1111/pre.12497
Harvey B. P., Marshall K. E., Harley C. D. G., Russell B. D. (2022). Predicting responses to marine heatwaves using functional traits. Trends Ecol. Evol. 37, 20–29. doi: 10.1016/j.tree.2021.09.003
Hay C. H. (1990). The distribution of Macrocystis (Phaeophyta: Laminariales) as a biological indicator of cool sea surface temperature, with special reference to New Zealand waters. J. R. Soc. New Z. 20, 313–336. doi: 10.1080/03036758.1990.10426716
Hepburn C. D., Pritchard D. W., Cornwall C. E., McLeod R. J., Beardall J., Raven J. A., et al. (2011). Diversity of carbon use strategies in a kelp forest community: implications for a high CO2 ocean. Global Change Biol. 17, 2488–2497. doi: 10.1111/j.1365-2486.2011.02411.x
Hobday A. J., Alexander L. V., Perkins S. E., Smale D. A., Straub S. C., Oliver E. C. J., et al. (2016). A hierarchical approach to defining marine heatwaves. Prog. Oceanogr. 141, 227–238. doi: 10.1016/j.pocean.2015.12.014
Hollarsmith J. A., Buschmann A. H., Camus C., Grosholz E. D. (2020). Varying reproductive success under ocean warming and acidification across giant kelp (Macrocystis pyrifera) populations. J. Exp. Mar. Biol. Ecol. 522, 151247. doi: 10.1016/j.jembe.2019.151247
Hothorn T., Bretz F., Westfall P., Heiberger R. M., Schuetzenmeister A., Scheibe S. (2023). multcomp: Simultaneous Inference in General Parametric Models. R package version 1.4-25. Available online at: https://cran.r-project.org/web/packages/multcomp/multcomp.pdf. (Accessed June 15, 2024)
Huang W.-J., Wang Y., Cai W.-J. (2012). Assessment of sample storage techniques for total alkalinity and dissolved inorganic carbon in seawater. Limnol. Oceanogr.: Methods 10, 711–717. doi: 10.4319/lom.2012.10.711
Hurlbert S. H. (1984). Pseudoreplication and the design of ecological field experiments. Ecol. Monogr. 54, 187–211. doi: 10.2307/1942661
James K., Shears N. T. (2016). Population ecology of the invasive kelp Undaria pinnatifida towards the upper extreme of its temperature range. Mar. Biol. 163, 225. doi: 10.1007/s00227-016-2993-9
Johnson C. R., Banks S. C., Barrett N. S., Cazassus F., Dunstan P. K., Edgar G. J., et al. (2011). Climate change cascades: Shifts in oceanography, species’ ranges and subtidal marine community dynamics in eastern Tasmania. J. Exp. Mar. Biol. Ecol. 400, 17–32. doi: 10.1016/j.jembe.2011.02.032
Kain J. M., Jones N. S. (1976). The biology of Laminaria hyperborea. VIII. Growth on cleared areas. J. Mar. Biol. Assoc. United Kingdom 56, 267–290. doi: 10.1017/S0025315400018907
Kerry C., Roughan M., Azevedo Correia de Souza J. M. (2022). Drivers of upper ocean heat content extremes around New Zealand revealed by Adjoint Sensitivity Analysis. Front. Climate 4. doi: 10.3389/fclim.2022.980990
King N. G., McKeown N. J., Smale D. A., Wilcockson D. C., Hoelters L., Groves E. A., et al. (2019). Evidence for different thermal ecotypes in range centre and trailing edge kelp populations. J. Exp. Mar. Biol. Ecol. 514–515, 10–17. doi: 10.1016/j.jembe.2019.03.004
Krieger E. C., Nelson W. A., Grand J., Le Ru E. C., Bury S. J., Cossais A., et al. (2023a). The role of irradiance in controlling coralline algal calcification. Limnol. Oceanogr. 68, 1269–1284. doi: 10.1002/lno.12345
Krieger E. C., Sarid-Segal Y., Böök I. M., Taise A., Berbece D., Cornwall C. E. (2023b). Tolerance of three temperate macroalgal taxa to marine heatwaves of differing durations and intensities is not modulated by irradiance. Phycologia 62, 627–636. doi: 10.1080/00318884.2023.2267411
Krieger E. C., Taise A., Nelson W. A., Grand J., Le Ru E., Davy S. K., et al. (2023c). Tolerance of coralline algae to ocean warming and marine heatwaves. PloS Climate 2, e0000092. doi: 10.1371/journal.pclm.0000092
Krumhansl K. A., Okamoto D. K., Rassweller A., Byrnes J. E. K. (2016). Global patterns of kelp forest change over the past half-century. Proc. Natl. Acad. Sci. 113, 13785–13790. doi: 10.1073/pnas.1606102113
Ladah L. B. (2000). Life on the edge: Stress survival adaptations in southern limit Macrocystis pyrifera populations. J. Phycol. 36, 40–41. doi: 10.1046/j.1529-8817.1999.00001-120.x
Ladah L. B., Zertuche-González J. A. (2007). Survival of microscopic stages of a perennial kelp (Macrocystis pyrifera) from the center and the southern extreme of its range in the Northern Hemisphere after exposure to simulated El Niño stress. Mar. Biol. 152, 677–686. doi: 10.1007/s00227-007-0723-z
Le D. M. (2022). Thermal tolerance of the giant kelp Macrocystis pyrifera. University of Otago, Dunedin, New Zealand. Available at: http://hdl.handle.net/10523/13600.
Le D. M., Desmond M. J., Pritchard D. W., Hepburn C. D. (2022). Effect of temperature on sporulation and spore development of giant kelp (Macrocystis pyrifera). PloS One 17, e0278268. doi: 10.1371/journal.pone.0278268
Le D. M., Desmond M. J., Pritchard D. W., Hepburn C. D. (2024). Thermal threshold for fertilisation and gametophyte survivorship of the giant kelp Macrocystis pyrifera. Mar. Ecol. Prog. Ser. 734, 23–33. doi: 10.3354/meps14559
Leathers T., King N. G., Foggo A., Smale D. A. (2023). Marine heatwave duration and intensity interact to reduce physiological tipping points of kelp species with contrasting thermal affinities. Ann. Bot. 133 (1), 51–60. doi: 10.1093/aob/mcad172
Lebrun A., Comeau S., Gazeau F., Gattuso J.-P. (2022). Impact of climate change on Arctic macroalgal communities. Global Planet. Change 219, 103980. doi: 10.1016/j.gloplacha.2022.103980
Li J., Bergman K., Thomas J.-B. E., Gao Y., Gröndahl F. (2023). Life Cycle Assessment of a large commercial kelp farm in Shandong, China. Sci. Total Environ. 903, 166861. doi: 10.1016/j.scitotenv.2023.166861
Liesner D., Fouqueau L., Valero M., Roleda M. Y., Pearson G. A., Bischof K., et al. (2020). Heat stress responses and population genetics of the kelp Laminaria digitata (Phaeophyceae) across latitudes reveal differentiation among North Atlantic populations. Ecol. Evol. 10, 9144–9177. doi: 10.1002/ece3.6569
Liesner D., Pearson G. A., Bartsch I., Rana S., Harms L., Heinrich S., et al. (2022). Increased heat resilience of intraspecific outbred compared to inbred lineages in the kelp Laminaria digitata: physiology and transcriptomics. Front. Mar. Sci. 9. doi: 10.3389/fmars.2022.838793
Ling S. D., Johnson C. R., Frusher S. D., Ridgway K. R. (2009). Overfishing reduces resilience of kelp beds to climate-driven catastrophic phase shift. Proc. Natl. Acad. Sci. 106, 22341–22345. doi: 10.1073/pnas.0907529106
Løvås S. M., Tørum A. (2001). Effect of the kelp Laminaria hyperborea upon sand dune erosion and water particle velocities. Coast. Eng. 44, 37–63. doi: 10.1016/S0378-3839(01)00021-7
Mabin C. J. T., Johnson C. R., Wright J. T. (2019). Physiological response to temperature, light, and nitrates in the giant kelp Macrocystis pyrifera from Tasmania, Australia. Mar. Ecol. Prog. Ser. 614, 1–19. doi: 10.3354/meps12900
McPherson M. L., Finger D. J. I., Housekeeper H. F., Bell T. W., Carr M. H., Rogers-Bennett L., et al. (2021). Large-scale shift in the structure of a kelp forest ecosystem co-occurs with an epizootic and marine heatwave. Commun. Biol. 4, 298. doi: 10.1038/s42003-021-01827-6
MetOcean Solutions (2023). Recent marine heatwaves in Aotearoa New Zealand (Wellington, New Zealand: Meteorological Service of New Zealand Ltd). Available at: https://www.moanaproject.org/recent-marine-heatwaves.
Meyer M., Griffiths H. (2013). Origins and diversity of eukaryotic CO2-concentrating mechanisms: lessons for the future. J. Exp. Bot. 64, 769–786. doi: 10.1093/jxb/ers390
Miller R. J., Page H. M., Reed D. C. (2015). Trophic versus structural effects of a marine foundation species, giant kelp (Macrocystis pyrifera). Oecologia 179, 1199–1209. doi: 10.1007/s00442-015-3441-0
Montie S., Thoral F., Smith R. O., Cook F., Tait L. W., Pinkerton M. H., et al. (2023). Seasonal trends in marine heatwaves highlight vulnerable coastal ecoregions and historic change points in New Zealand. New Z. J. Mar. Freshw. Res. 58 (2), 274–299. doi: 10.1080/00288330.2023.2218102
Mora-Soto A., Palacios M., Macaya E. C., Gómez I., Huovinen P., Pérez-Matus A., et al. (2020). A high-resolution global map of giant kelp (Macrocystis pyrifera) forests and intertidal green algae (Ulvophyceae) with Sentinel-2 imagery. Remote Sens. 12, 694. doi: 10.3390/rs12040694
Muth A. F., Graham M. H., Lane C. E., Harley C. D. G. (2019). Recruitment tolerance to increased temperature present across multiple kelp clades. Ecology 100, e02594. doi: 10.1002/ecy.2594
O’Connor K. C., Anderson T. W. (2010). Consequences of habitat disturbance and recovery to recruitment and the abundance of kelp forest fishes. J. Exp. Mar. Biol. Ecol. 386, 1–10. doi: 10.1016/j.jembe.2010.01.016
Paul D., Skrzypek G., Fórizs I. (2007). Normalization of measured stable isotopic compositions to isotope reference scales - a review. Rapid Commun. Mass Spectrom. 21, 3006–3014. doi: 10.1002/rcm.3185
Pierrot D. E., Wallace D. W. R., Lewis E. (2011). MS Excel Program Developed for CO2 System Calculations (Bethel, PA: Carbon Dioxide Information Analysis Center, Oak Ridge National Laboratory). doi: 10.3334/cdiac/otg.co2sys_xls_cdiac105a
Pritchard D. W., Hurd C. L., Beardall J., Hepburn C. D. (2015). Restricted use of nitrate and a strong preference for ammonium reflects the nitrogen ecophysiology of a light-limited red alga. J. Phycol. 51, 277–287. doi: 10.1111/jpy.12272
Provost E. J., Kelaher B. P., Dworjanyn S. A., Russell B. D., Connell S. D., Ghedini G., et al. (2017). Climate-driven disparities among ecological interactions threaten kelp forest persistence. Global Change Biol. 23, 353–361. doi: 10.1111/gcb.13414
Purcell D., Wheeler T. T., Hayes M., Packer M. A. (2024). Effect of photoperiod and temperature on bioproduct production from juvenile sporophytes of Macrocystis pyrifera. Front. Mar. Sci. 11. doi: 10.3389/fmars.2024.1410877
Raven J. A., Johnston A. M., Kübler J. E., Korb R., McInroy S. G., Handley L. L., et al. (2002). Mechanistic interpretation of carbon isotope discrimination by marine macroalgae and seagrasses. Funct. Plant Biol. 29, 355–378. doi: 10.1071/PP01201
Reed D., Washburn L., Rassweiler A., Miller R., Bell T., Harrer S. (2016). Extreme warming challenges sentinel status of kelp forests as indicators of climate change. Nat. Commun. 7, 13757. doi: 10.1038/ncomms13757
Reynolds R. W., Banzon V. F. (2008). “NOAA Optimum Interpolation 1/4 Degree Daily Sea Surface Temperature (OISST) Analysis, Version 2,” in NOAA National Centers for Environmental Information (NOAA, Washington, DC), V5SQ8XB5. doi: 10.1175/jcli-d-21-0001.1
Salinger M. J., Renwick J., Behrens E., Mullan A. B., Diamond H. J., Sirguey P., et al. (2019). The unprecedented coupled ocean-atmosphere summer heatwave in the New Zealand region 2017/18: drivers, mechanisms and impacts. Environ. Res. Lett. 14, 044023. doi: 10.1088/1748-9326/ab012a
Sánchez-Barredo M., Sandoval-Gil J. M., Zertuche-González J. A., Ladah L. B., Belando-Torrentes M. D., Beas-Luna R., et al. (2020). Effects of heat waves and light deprivation on giant kelp juveniles (Macrocystis pyrifera, Laminariales, Phaeophyceae). J. Phycol. 56, 880–894. doi: 10.1111/jpy.13000
Schiel D. R., Foster M. S. (2015). The biology and ecology of giant kelp forests (Oakland: University of California Press). Available at: https://books.google.co.nz/books?id=dO_LBwAAQBAJ&printsec=frontcover#v=onepage&q&f=false.
Schlegel R. W., Smit A. J. (2021). heatwaveR: Detect Heatwaves and Cold-Spells. R package version 0.4.6. Available online at: https://cran.r-project.org/web/packages/heatwaveR/index.html. (Accessed July 15, 2022)
Seely G. R., Duncan M. J., Vidaver W. E. (1972). Preparative and analytical extraction of pigments from brown algae with dimethyl sulfoxide. Mar. Biol. 12, 184–188. doi: 10.1007/BF00350754
Shaffer M. R., Rovellini A. (2020). A review of habitat use, home range size and connectivity for selected New Zealand species (Department of Conservation, New Zealand). Available at: https://dxcprod.doc.govt.nz/globalassets/documents/conservation/marine-and-coastal/marine-protected-areas/mpa-publications/habitat-use-and-movement-patterns-2020.pdf.
Shapiro S. S., Wilk M. B. (1965). An analysis of variance test for normality. Biometrika 52, 591–611. doi: 10.2307/2333709
Simonson E. J., Scheibling R. E., Metaxas A. (2015). Kelp in hot water: I. Warming seawater temperature induces weakening and loss of kelp tissue. Mar. Ecol. Prog. Ser. 537, 89–104. doi: 10.3354/meps11438
Smale D. A. (2020). Impacts of ocean warming on kelp forest ecosystems. New Phytol. 225, 1447–1454. doi: 10.1111/nph.16107
Smale D. A., Wernberg T. (2013). Extreme climatic event drives range contraction of a habitat-forming species. Proc. R. Soc. B 280, 20122829. doi: 10.1098/rspb.2012.2829
Smale D. A., Wernberg T., Yunnie A. L. E., Vance T. (2015). The rise of Laminaria ochroleuca in the Western English Channel (UK) and comparisons with its competitor and assemblage dominant Laminaria hyperborea. Mar. Ecol. 36, 1033–1044. doi: 10.1111/maec.12199
Steneck R. S., Graham M. H., Bourque B. J., Corbett D., Erlandson J. M., Estes J. A., et al. (2002). Kelp forest ecosystems: biodiversity, stability, resilience and future. Environ. Conserv. 29, 436–459. doi: 10.1017/S0376892902000322
Straub S. C., Thomsen M. S., Wernberg T. (2016). “The dynamic biogeography of the anthropocene: the speed of recent range shifts in seaweeds,” in Seaweed Phylogeography. Eds. Hu Z. M., Fraser C. (Dordrecht, Springer). doi: 10.1007/978-94-017-7534-2_3
Strickland J. D. H., Parsons T. R. (1972). A Practical Handbook of Seawater Analysis. 2nd edition (Ottawa, Canada: Fisheries Research Board of Canada). (Bulletin Fisheries Research Board of Canada, Nr. 167 (2nd ed)). doi: 10.25607/OBP-1791
Sun J., Zhao C., Zhao S., Dai W., Liu J., Zhang J., et al. (2023). Diversity of CO2 concentrating mechanisms in macroalgae photosynthesis: a case study of Ulva sp. J. Mar. Sci. Eng. 11, 1911. doi: 10.3390/jmse11101911
Tait L. W., Thoral F., Pinkerton M. H., Thomsen M. S., Schiel D. R. (2021). Loss of giant kelp, Macrocystis pyrifera, driven by marine heatwaves and exacerbated by poor water quality in New Zealand. Front. Mar. Sci. 8. doi: 10.3389/fmars.2021.721087
Teagle H., Hawkins S. J., Moore P. J., Smale D. A. (2017). The role of kelp species as biogenic habitat formers in coastal marine ecosystems. J. Exp. Mar. Biol. Ecol. 492, 81–98. doi: 10.1016/j.jembe.2017.01.017
Thomsen M. S., Mondardini L., Alestra T., Gerrity S., Tait L., South P. M., et al. (2019). Local extinction of bull kelp (Durvillaea spp.) due to a marine heatwave. Front. Mar. Sci. 6. doi: 10.3389/fmars.2019.00084
Tolimieri N., Andrew O. Shelton A. O., Samhouri J. F., Harvey C. J., Feist B. E., Williams G. D., et al. (2023). Changes in kelp forest communities off Washington, USA, during and after the 2014–2016 marine heatwave and sea star wasting syndrome. Mar. Ecol. Prog. Ser. 703, 47–66. doi: 10.3354/meps14220
Traiger S. B., Cohn B., Panos D., Daly M., Hirsh H. K., Martone M., et al. (2022). Limited biogeochemical modification of surface waters by kelp forest canopies: Influence of kelp metabolism and site-specific hydrodynamics. Limnol. Oceanogr. 67, 392–403. doi: 10.1002/lno.11999
Tukey J. (1949). Comparing individual means in the analysis of variance. Biometrics 5, 99–114. doi: 10.2307/3001913
Umanzor S., Sandoval-Gil J., Sánchez-Barredo M., Ladah L. B., Ramírez-García M., Zertuche-González J. A. (2021). Short-term stress responses and recovery of giant kelp (Macrocystis pyrifera, Laminariales, Phaeophyceae) juvenile sporophytes to a simulated marine heatwave and nitrate scarcity. J. Phycol. 57, 1604–1618. doi: 10.1111/jpy.13189
Vanella F. A., Fernández D. A., Carolina Romero M., Calvo J. (2007). Changes in the fish fauna associated with a sub-Antarctic Macrocystis pyrifera kelp forest in response to canopy removal. Polar Biol. 30, 449–457. doi: 10.1007/s00300-006-0202-x
Vergés A., Steinberg P. D., Hay M. E., Poore A. G. B., Campbell A. H., Ballesteros E., et al. (2014). The tropicalization of temperate marine ecosystems: climate-mediated changes in herbivory and community phase shifts. Proc. R. Soc. B 281, 20140846. doi: 10.1098/rspb.2014.0846
Villegas M., Laudien J., Sielfeld W., Arntz W. (2019). Effect of foresting barren ground with Macrocystis pyrifera (Linnaeus) C. Agardh on the occurrence of coastal fishes off northern Chile. J. Appl. Phycol. 31, 2145–2157. doi: 10.1007/s10811-018-1657-1
Wernberg T., Bennett S., Babcock R. C., de Bettignies T., Cure K., Depczynski M., et al. (2016). Climate-driven regime shift of a temperate marine ecosystem. Science 353, 169–172. doi: 10.1126/science.aad8745
Wernberg T., Coleman M. A., Bennett S., Thomsen M. S., Tuya F., Kelaher B. P. (2018). Genetic diversity and kelp forest vulnerability to climatic stress. Nat. Sci. Rep. 8, 1–8. doi: 10.1038/s41598-018-20009-9
Wernberg T., Krumhansl K., Filbee-Dexter K., Pedersen M. F. (2019). “Status and trends for the world’s kelp forests,” in World Seas: An Environmental Evaluation, 2nd ed. Ed. Sheppard C. (London, UK: Academic Press). doi: 10.1016/C2015-0-04336-2
Wernberg T., Thomsen M. S., Baum J. K., Bishop M. S., Bruno J. F., Coleman M. A., et al. (2023). Impacts of climate change on marine foundation species. Annu. Rev. Mar. Sci. 16, 247–282. doi: 10.1146/annurev-marine-042023-093037
Keywords: kelp, climate change, marine heatwaves, macroalgae, thermal stress, resilience
Citation: Bunting I, Kok YY, Krieger EC, Bury SJ, D’Archino R and Cornwall CE (2024) Marine heatwave intensity and duration negatively affect growth in young sporophytes of the giant kelp Macrocystis pyrifera. Front. Mar. Sci. 11:1423595. doi: 10.3389/fmars.2024.1423595
Received: 26 April 2024; Accepted: 29 July 2024;
Published: 23 August 2024.
Edited by:
Thomas Wernberg, University of Western Australia, AustraliaCopyright © 2024 Bunting, Kok, Krieger, Bury, D’Archino and Cornwall. This is an open-access article distributed under the terms of the Creative Commons Attribution License (CC BY). The use, distribution or reproduction in other forums is permitted, provided the original author(s) and the copyright owner(s) are credited and that the original publication in this journal is cited, in accordance with accepted academic practice. No use, distribution or reproduction is permitted which does not comply with these terms.
*Correspondence: Imogen Bunting, aW1vZ2VuLmJ1bnRpbmdAdnV3LmFjLm56