
95% of researchers rate our articles as excellent or good
Learn more about the work of our research integrity team to safeguard the quality of each article we publish.
Find out more
ORIGINAL RESEARCH article
Front. Mar. Sci. , 18 July 2024
Sec. Marine Pollution
Volume 11 - 2024 | https://doi.org/10.3389/fmars.2024.1422748
 Dhivya B. Thiyagarajan1*
 Marie H. S. Stette1
 Bilal M. Afzal1
 Balpreet S. Ahluwalia2
 Krishna Agarwal2
 Roy A. Dalmo1
 Deanna L. Wolfson2
The rising problem of plastic pollution is becoming one of the major environmental issues for the world. In the ocean, plastics undergo degradation into smaller microplastics (MPs) and nanoplastics (NPs). Wild fish and farmed salmon would likely be exposed to these NPs and MPs both through skin and through skin wounds. Keratocyte cells, located in the skin epithelial layer, are scavenger cells which may remove foreign materials and maintain the salmon’s health. They are therefore first in line to handle and to suffer from MP and NP exposure. While the impacts of MPs have been well studied in many different organisms, much less is known about the effects of NP exposure, particularly at the subcellular level. Here, we have used holotomographic and fluorescence microscopy to show that both skin and corneal salmon keratocyte cells fully internalize 500–1000 nm polystyrene particles, as well as inorganic 500 nm silica particles. The fact that corneal epithelial cells also take up particles is novel. Furthermore, some of these particles likely end up in lysosomal compartments within 2 hours of exposure. Here, we show that both conventional and new modalities of microscopy have a role to play to understand how micro- and nano particles affect epithelial cells.
Plastics are one of the most used materials in the world, and they are integrated as a part of human lifestyle. The presence of plastics in the oceans poses a threat to marine species, food safety, and human health (Thompson et al., 2009; Halden, 2010; Revel et al., 2018; Anastasopoulou and Fortibuoni, 2019). Plastics enter the environment from several sources including terrestrial sources such as industrial waste, personal care products; and from ocean-based sources including fisheries and aquaculture. Tons of plastics end up in the ocean and these plastics are degraded into smaller pieces as micro and nano plastics (MPs/NPs) (Shah et al., 2008; Syakti, 2017). While there is not yet regulatory or scientific consensus, a common definition of a MP is any plastic particle with a diameter up to 5mm (Moore, 2008); NP are often defined as 1-1000 nm (Gigault et al., 2018). Microplastics are currently found in all oceans (Bergmann et al., 2022), including in Arctic waters (Lusher et al., 2015) and are also present in drinking water (North and Halden, 2013). It is suggested that 90% of the MPs are sedimented on the seafloors whereas 8% remains in water masses (Kim et al., 2023).
Accordingly, there is ongoing interest in understanding how plastic pollution impacts environmental, animal, and human health both directly and through the food chain (Krüger et al., 2020; Li et al., 2021). Atlantic salmon is one of the world’s most consumed fish, with the salmon industry continuing to grow tremendously. Salmon mortality in Norwegian aquaculture remains high at around 15% and generally is linked to multiple contributing factors rather than just being determined by a single clear cause (Singh et al., 2024). While some of those factors, e.g. pathogens and handling procedures such as de-lousing, have been well-studied, the impact of NPs and MPs on Atlantic salmon has not (Oliveira et al., 2021).
Salmon farming is carried out in open sea cages made of different plastic polymers like polypropylene (PP), polyethylene terephthalate (PET), and polyvinyl chloride (PVC), amongst others (Abihssira-García et al., 2022). There are many opportunities for salmon to be exposed to MP and NPs from the environment, including through direct exposure, ingestion (Walkinshaw et al., 2022), and entry through wounds. The skin and mucus are the first lines of defense to block entry of e.g. infectious agents and small foreign particles (Esteban, 2012). The skin serves also as a barrier against physical insults and xenobiotics and is involved in maintaining osmotic balance (Salinas et al., 2022). In healthy fish, the healing capacity of the skin is high, due to the fast-migrating skin epithelial cells, called keratocytes (Kjetil and Dalmo, 1998; Ream et al., 2003). Skin keratocyte cells (SKCs) are the key cells for scavenging particulate matter, thus keeping the skin and regenerating wounds clean (Åsbakk, 2001; Nestle et al., 2009).
The cornea of the eye also belongs to the fish integument. Most fish species have two distinct layers of cornea, namely the epidermis and the dermis (Kryvi and Poppe, 2016). Similar to the skin, the corneal epidermis contains corneal keratocyte cells (CKCs), which protect internal eye structures from the external environment. Unlike SKCs, however, the morphological characteristics and scavenging abilities of corneal keratocytes have not yet been well documented, especially not for aquatic species.
With the increasing prevalence of marine plastics, it is increasingly important to understand how both SKCs and CKCs interact with and are impacted by these materials. Thus far, the majority of studies have focused on larger microplastics, with relatively few focusing on NPs (Abihssira-García et al., 2020). To get a better picture of the biological impacts of plastics, further information is needed about the interaction of NPs at the subcellular scale, which requires a different toolset than is often used for studying NPs and MPs and cells.
Holotomography (HT) is a relatively new imaging tool which shows promise as a non-invasive way to study both phenotype and subcellular dynamics. It does not require the addition of dyes or other contrast agents, instead finding its contrast from the inherent differences in the refractive indices [RIs] of the sample itself, while still providing high-resolution 3D images [Cotte et al., 2013 (Kim et al., 2021)]. Different biological components can have significantly different RIs: e.g., 1.36-1.38 for cytoplasm, and 1.46-1.54 for membranes; other materials such as polystyrene (1.59) can be at the edge or outside the typical biological range or, like silica (1.44), lie well within it (Gul et al., 2021). HT imaging effectively provides a 3D map of the RI of the sample, with higher RI materials like membranes being clearly differentiated from lower RI materials like water (1.33) or other aqueous media (Medina-Ramirez et al., 2024). HT imaging has the additional advantage of using very low illumination power, and unlike with fluorescence microscopy, light does not need to be absorbed to provide contrast. Thus, the sample is subjected to and absorbs less energy, and the biological objects of interest do not need to receive an extra high dose of light since they do not need to be attached to light absorbing dyes.
However, HT lacks the specificity provided by fluorescent labeling, meaning that all objects with the same RI will appear the same, regardless of their underlying biological or chemical composition. It is also diffraction-limited, so even with significant differences in RI, small or thin objects (e.g. cell membranes or individual proteins) are not well resolved from the surrounding medium. To regain some of the lost specificity, the Nanolive Cell Explorer-Fluo combines 3D HT imaging with 2D fluorescence so that the specificity of fluorescence can be used to verify the identity of HT-distinct objects while still allowing the bulk of the imaging to be performed using the less-harmful HT modality. However, when multi-target specificity is needed, full 3D fluorescence using a different instrument can fill the gap.
In this study, both corneal and skin keratocyte cells were exposed to polystyrene, as an example of plastic, and silica, as an analogue to a naturally occurring and inorganic particulate found in the oceans. Particle sizes ranged from 500-1000 nm, chosen as the entry point to the much understudied NP size range while still being clearly visible in high-resolution optical microscopy.
The fish used in this study were supplied by the Tromsø Aquaculture Research Station, Kårvika, Tromsø, Norway. The study was conducted with post-smolt Atlantic salmon of mixed sex in the size range 500 g to 1.5 kg. The fish were reared in tanks with natural seawater (salinity of 33-34 parts per thousand). The fish were fed with commercial Skretting Nutra Olympic. Fifteen minutes before sampling, the net was disinfected with Virkon (NorEngros, #191635) and rinsed with tap water afterward. Fish were euthanized by a blow to the head by a wooden priest and their length and weight were measured. The handling of fish and picking of scales do not require special approval, as detailed in the Norwegian Regulations for use of animals in experimentation (https://lovdata.no/dokument/SF/forskrift/2015-06-18-761#KAPITTEL_10). This method is also in compliance with EU legislation Directive2010/63/EU (https://eurlex.europa.eu/legal-content/EN/TXT/?uri=CELEX:32010L0063).
Once the fish was killed, 3-4 scales were plucked from the dorsal region and placed with the external side up on a 35mm glass bottom culture dish (VWR -75856-740). After 6-10 minutes in air to improve scale adherence, 2ml of HBSS-mix media was added, consisting of filtered HBSS (VWR,21-023-CM) with 100µg/ml streptomycin, 100IU/ml penicillin (Sigma-P0781), and 1µg/ml of Amphotericin B solution (Sigma -A2942). SKC samples were then placed in incubators ranging from 4 to 12°C. Cultured cells were used within 3-8 days for particle exposure.
The cornea from each eye was removed carefully and rinsed well with HBSS-mix media (as described above) to remove excess blood cells and organic matter. Thereafter the cornea was placed in 35mm glass bottom dishes with the anterior part facing down. Two small pieces of agarose (2%) were applied to the top part of the cornea to physically hold the cornea in place, thus making it easier for the epithelial cells to adhere to and migrate along the bottom. After approximately 9 minutes, 2 ml of media was added, and CKC samples were incubated at temperatures ranging from 4 to 12°C.
Polystyrene spheres doped with plum purple, fluorescent dye (PP-PS) were commercially acquired from Bangs Laboratories, Inc. with two approximate diameters: 500 nm (item # FSPP004, 503 nm per the manufacturer) and 1000 nm (item # FS03F, 960 nm per the manufacturer). Silica particles doped with FITC (FITC-SiO2) with a diameter of 500 nm (Nanocs Inc., item # Si500FC-1). All particles were commercially acquired with a stock concentration of 1% solids. Particles were then serially diluted in culture media such that there were several particles per cell visible per field of view in the microscope, without having particles covering the entire field of view. This would ensure that cells exposed to particles would be experimentally findable without having extreme imaging artifacts from too high of a concentration. PP-PS were serially diluted in culture media 10-6 from stock and FITC-SiO2 were serially diluted 10-3 from stock solution. The different dilution factors were likely due to the tendency of particles to settle, resulting in uneven sampling of particles during each serial dilution, despite mixing.
To expose cells to particles, culture media was aspirated from dishes containing SKCs or CKCs, then replaced with 2ml of a particle dilution. Samples were incubated with the particles for 60 minutes at room temperature. After incubation, cells were washed 3X in culture media and then either fluorescently labeled or directly imaged.
Cell membranes were labeled using either CellMask Green (ThermoFisher #C37608) or CellMask Orange (ThermoFisher #C10045) diluted 1:1000 in culture media. Samples were incubated at room temperature for 10 minutes before washing 3X in culture media. Lysosomes were labeled using LysoTracker Deep Red (ThermoFisher # L12492) diluted 1:2000 in culture media, with incubation for 40 minutes at room temperature before washing 3X with culture media.
Holotomographic (HT) images were acquired using a Nanolive 3D Cell Explorer - Fluo microscope (Nanolive SA; Lausanne, Switzerland), which is equipped with a 60X 0.8NA air objective and a 520 nm laser diode. Correlative fluorescence excitation is provided by a CoolLED pE-300 Ultra with standard DAPI/FITC/TRITC filters. Prior to imaging, the user must input the RI of the sample media; here a value of 1.3344 was used, as measured by a PAL-RI refractometer (ATAGO CO, Tokyo, Japan). Most images were collected as single timepoint data, with 1 HT image for every fluorescence image (for multiple particle types in the same sample, 1 image of each color fluorescence was acquired for each HT image). For the timelapse shown in Supplementary Video 1, HT images were acquired every 70 seconds and a 2D fluorescence image was acquired in the DAPI channel every 210 seconds (i.e. 1 fluorescence image for every 3 HT image) for 30 minutes. HT images were reconstructed automatically in the microscope’s built-in software, STEVE (v. 1.6.3496). In-focus HT image planes were manually selected by the user and exported from STEVE as 3D.tif files, and correlative fluorescence images were exported as single channel 2D.tif files for further study. Specific acquisition parameters (e.g. fluorescence intensity) can be extracted for all images and videos from the vol file metadata in the correlated public dataset, with additional information (e.g. which images planes were exported for analysis) in the associated readme file.
A DeltaVision Elite microscope (GE Healthcare Life Sciences, Marlborough, USA; hereafter referred to as DV) equipped with a single sCMOS camera was used to acquire widefield fluorescence and differential interference contrast (DIC) images. The DV uses LED excitation and standard DAPI/FITC/TRITC filter sets. For larger fields of view, 10X 0.4NA or 20X 0.8NA Olympus air objectives were used. For high-resolution imaging, a 60x 1.42 NA Olympus oil immersion (oil RI = 1.516-1.520) objective was used. 3D fluorescence images were deconvolved using the manufacturer-provided software (SoftWoRx 7.0.0 version). Specific acquisition and deconvolution parameters for each image are available as.log files in the correlated public dataset.
After instrument-specific processing as described above, all images were visually analyzed using FIJI/ImageJ (Schindelin et al., 2012). Images were adjusted linearly for brightness and contrast and examined in 3D using the ‘Orthogonal Views’ feature. Figures presented here include single plane views, orthogonal views, maximum intensity projections, and ‘focused’ projections created using the ‘Gaussian_Stack_Focuser’ plugin with a radius of 5. Supplementary Video 1 was created by maximum intensity projecting HT timelapse images, choosing the lookup table ‘Gem’, adjusting brightness/contrast, converting it to an RGB image, then splitting the three channels. The fluorescence timelapse image stack had two blank images inserted into the stack for every fluorescence image, so the number of frames would match the HT image stack (as only one fluorescence image was acquired for every three HT image). The fluorescence image stack was then added to the blue HT image stack using the image calculator, and the R, G, and B channels were recombined for the final video image stack. The time stamp was added using ‘Series Labeler’.
Keratocytes have both phagocytic activity and are highly mobile, making them mobile scavengers (Nishida, 2010). Thus, for both corneal and skin keratocyte cells (CKCs and SKCs, respectively) we investigated those that had actively moved away from the tissue sample which was initially placed in each dish. Morphology was first examined in the absence of exogenous particles. Figure 1A shows the migration of cells from the scale mass on the upper left as the cells explore the scale-free region on the right. Cells move out from the mass both in large clusters as well as single cells. Long-term time-lapse DIC imaging of this cellular migration has previously been made available by our group as an open dataset (Opstad and Wolfson, 2021). CKC clusters are not as large or dense as SKCs, but we still observe relatively large clusters as well as single cells in CKCs, as shown in Figure 1C.
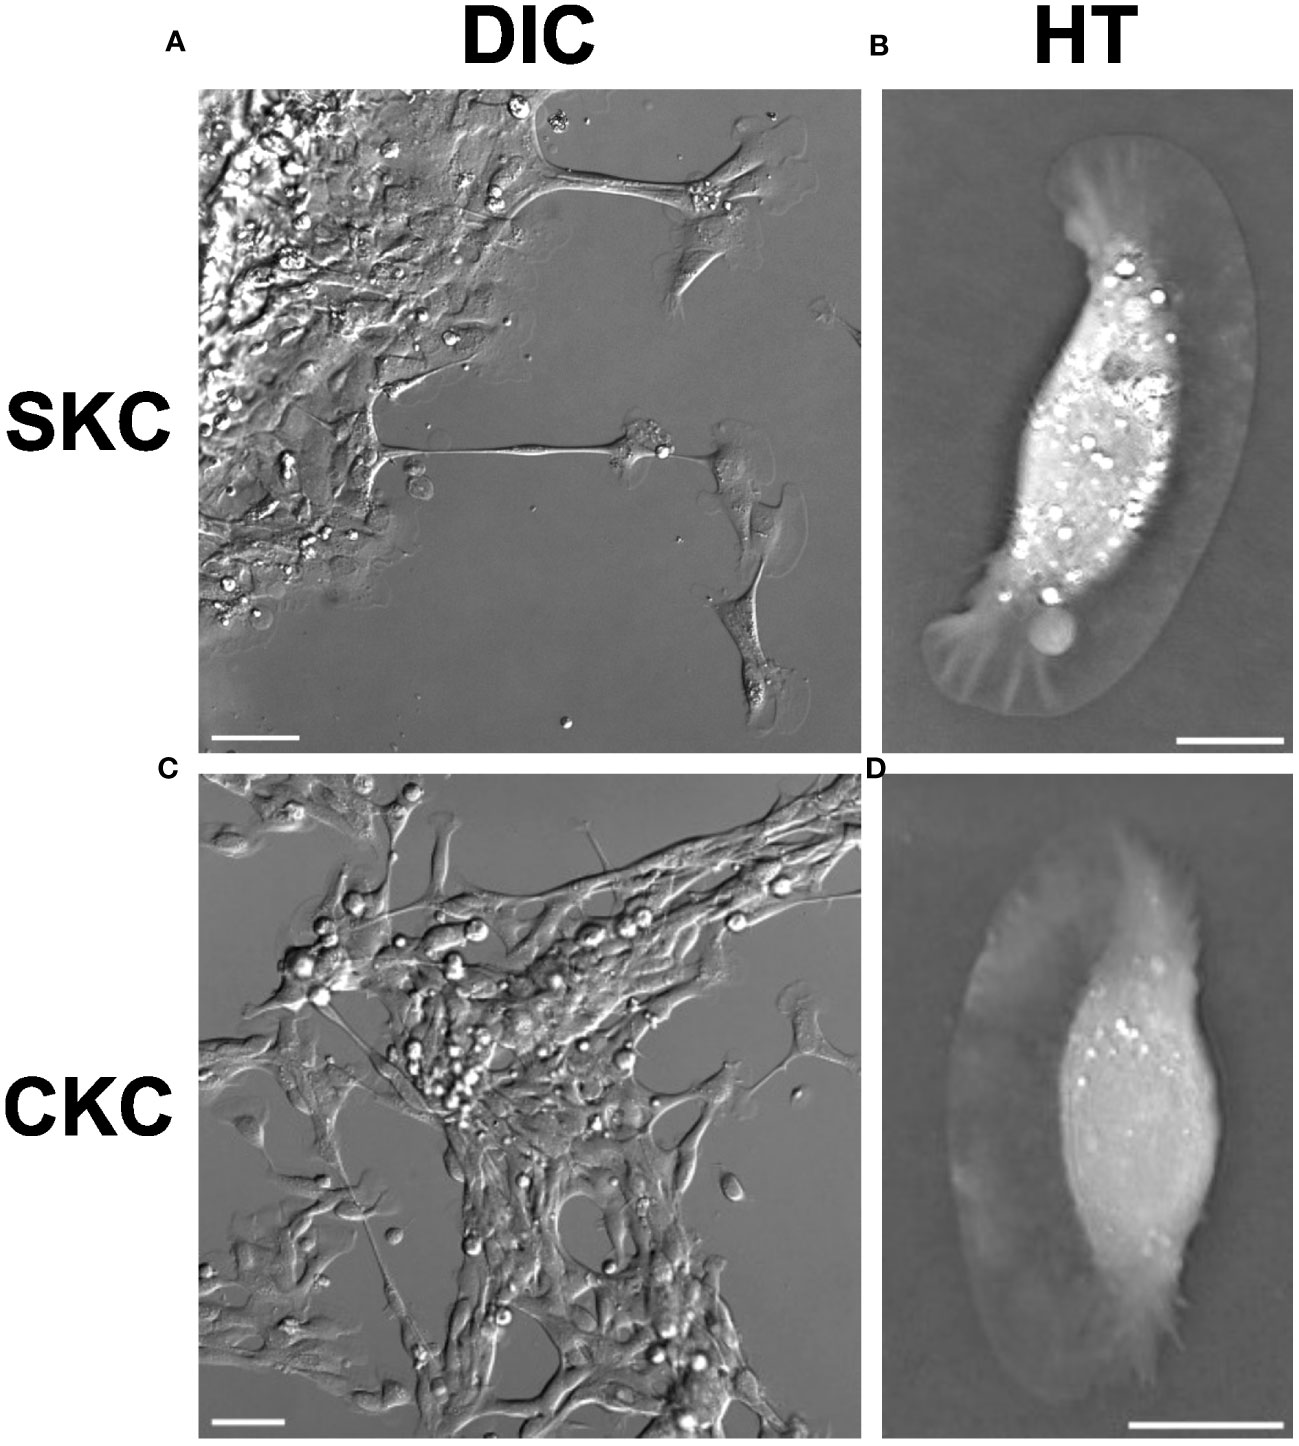
Figure 1 Morphology of SKCs and CKCs prior to particle exposure. DIC imaging shows (A) SKCs migrating away from a mass of cells originating from a scale explant, and (C) CKCs interacting with a mass of cells originating from a cornea explant. A variety of cell shapes are visible, but the fan shape of the thin lamellipodia is visible for many. Cells can be seen stretching out across long distances, and in some cases maintaining distant contact through thin tubes. The classical shape of a ‘canoe’ profile can be seen when looking at a single z-slice of a 3D HT image for an individual (B) SKC and (D) CKC; the thin lamellipodium forms the bottom of the canoe shape. Scale bars are (A, C) 50 µm and (B, D) 10 µm.
Cell morphology was probed using two different label-free imaging methods, DIC (Figures 1A, C) and HT (Figures 1B, D), and both showed similar morphology between the two cell types as well as close agreement with what has previously been reported in the literature (Ream et al., 2003; Herant and Dembo, 2010). There is a central, elongated cell mass, typically 40 – 60 µm long, which contains the nucleus, along with a thin lamellipodium on the leading edge of cellular motion; often this lamellipodium gives the cell the appearance of a canoe as seen from the side. However, the lamellipodium is quite active, and will extend out in one or more directions in the shape of a fan, as can be seen in Figures 1B, D. Additionally, cells can form long tubes extending tens to hundreds of microns between the cell body and either a remote lamellipodial fan or to other cells.
SKCs and CKCs were incubated with 500 nm or 1 µm PP-PS particles for 1 hour and then washed before imaging. Both cell types showed clear colocalization with both particle types even after washing, indicating that the particles had become cell associated. Figure 2 shows representative images of these associations, which were consistently found irrespective of particle size or cell type, or whether the cells were isolated or part of a cluster. Supplementary Video 1 furthermore shows SKC cells moving across and picking up 1 µm PP-PS particles from the substrate, indicating that at least some of this association is due to an active process. 3D analysis suggested but could not confirm that particles were internalized (Supplementary Figure 1). Similarly, SKCs and CKCs were incubated with 500 nm FITC-SiO2 particles, which also showed clear cell-association post-washing after 1 hour of incubation for both cell types (Figure 3). Like with PP-PS particles, internalization was suggested but could not be concluded using HT imaging. While other studies have successfully used HT to determine nanomaterial internalization inside cells, (Friedrich et al., 2020; Géloën et al., 2021) the proximity of these PP-PS and FITC-SiO2 particles to the membrane, combined with relatively low membrane contrast, the particle sizes and shape-related artifacts all resulted in insufficient detail to conclusively determine internalization from HT data alone.
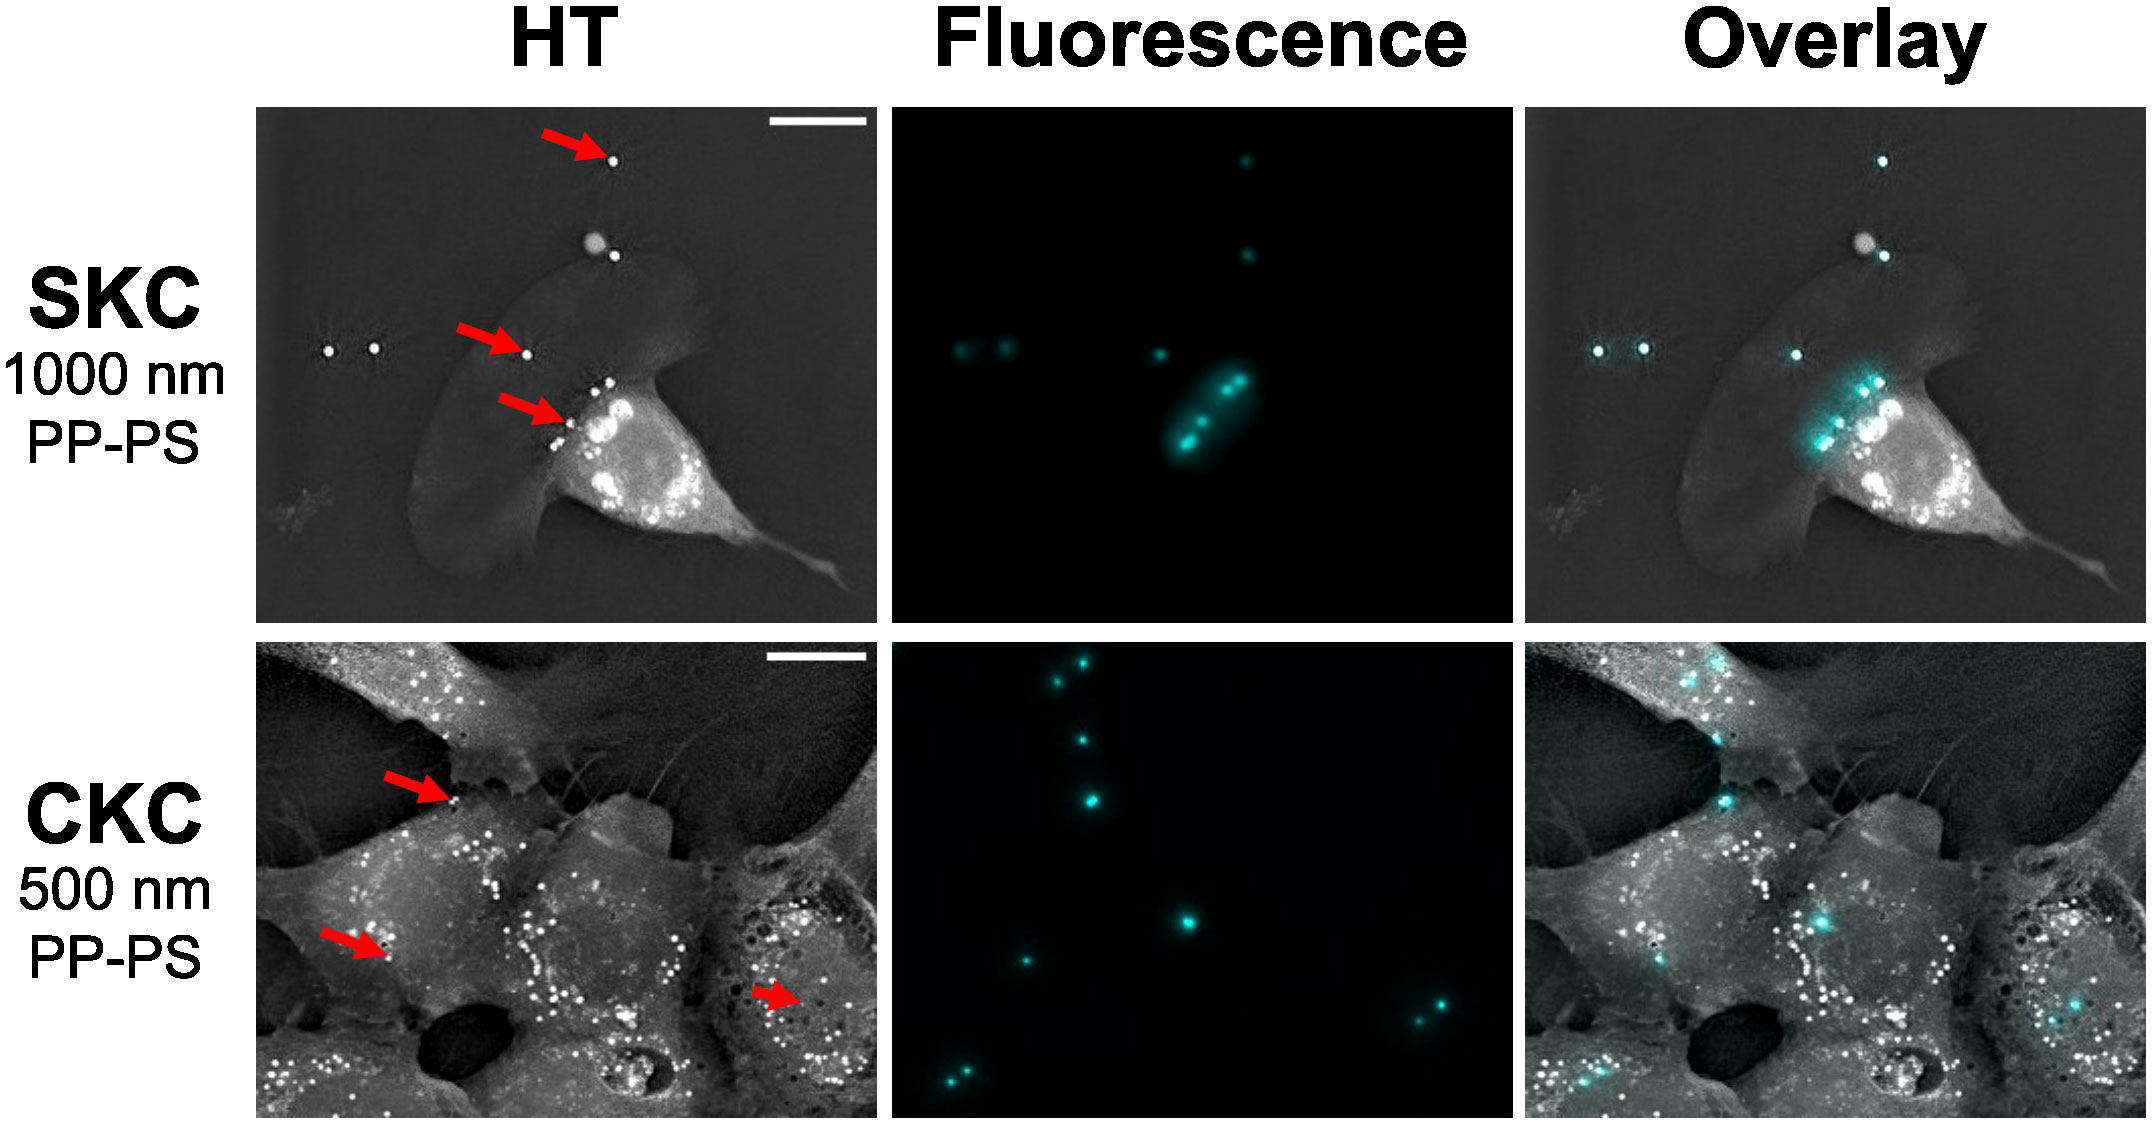
Figure 2 SKCs and CKCs associate with PP-PS within 1 hour. PP-PS particles (red arrows) appear as bright, round objects in focused HT projections (left). Fluorescence (cyan) is used to confirm the identity of the particles as PP-PS. Both SKC and CKCs show visible associations with PP-PS. Scale bars are 10 µm.
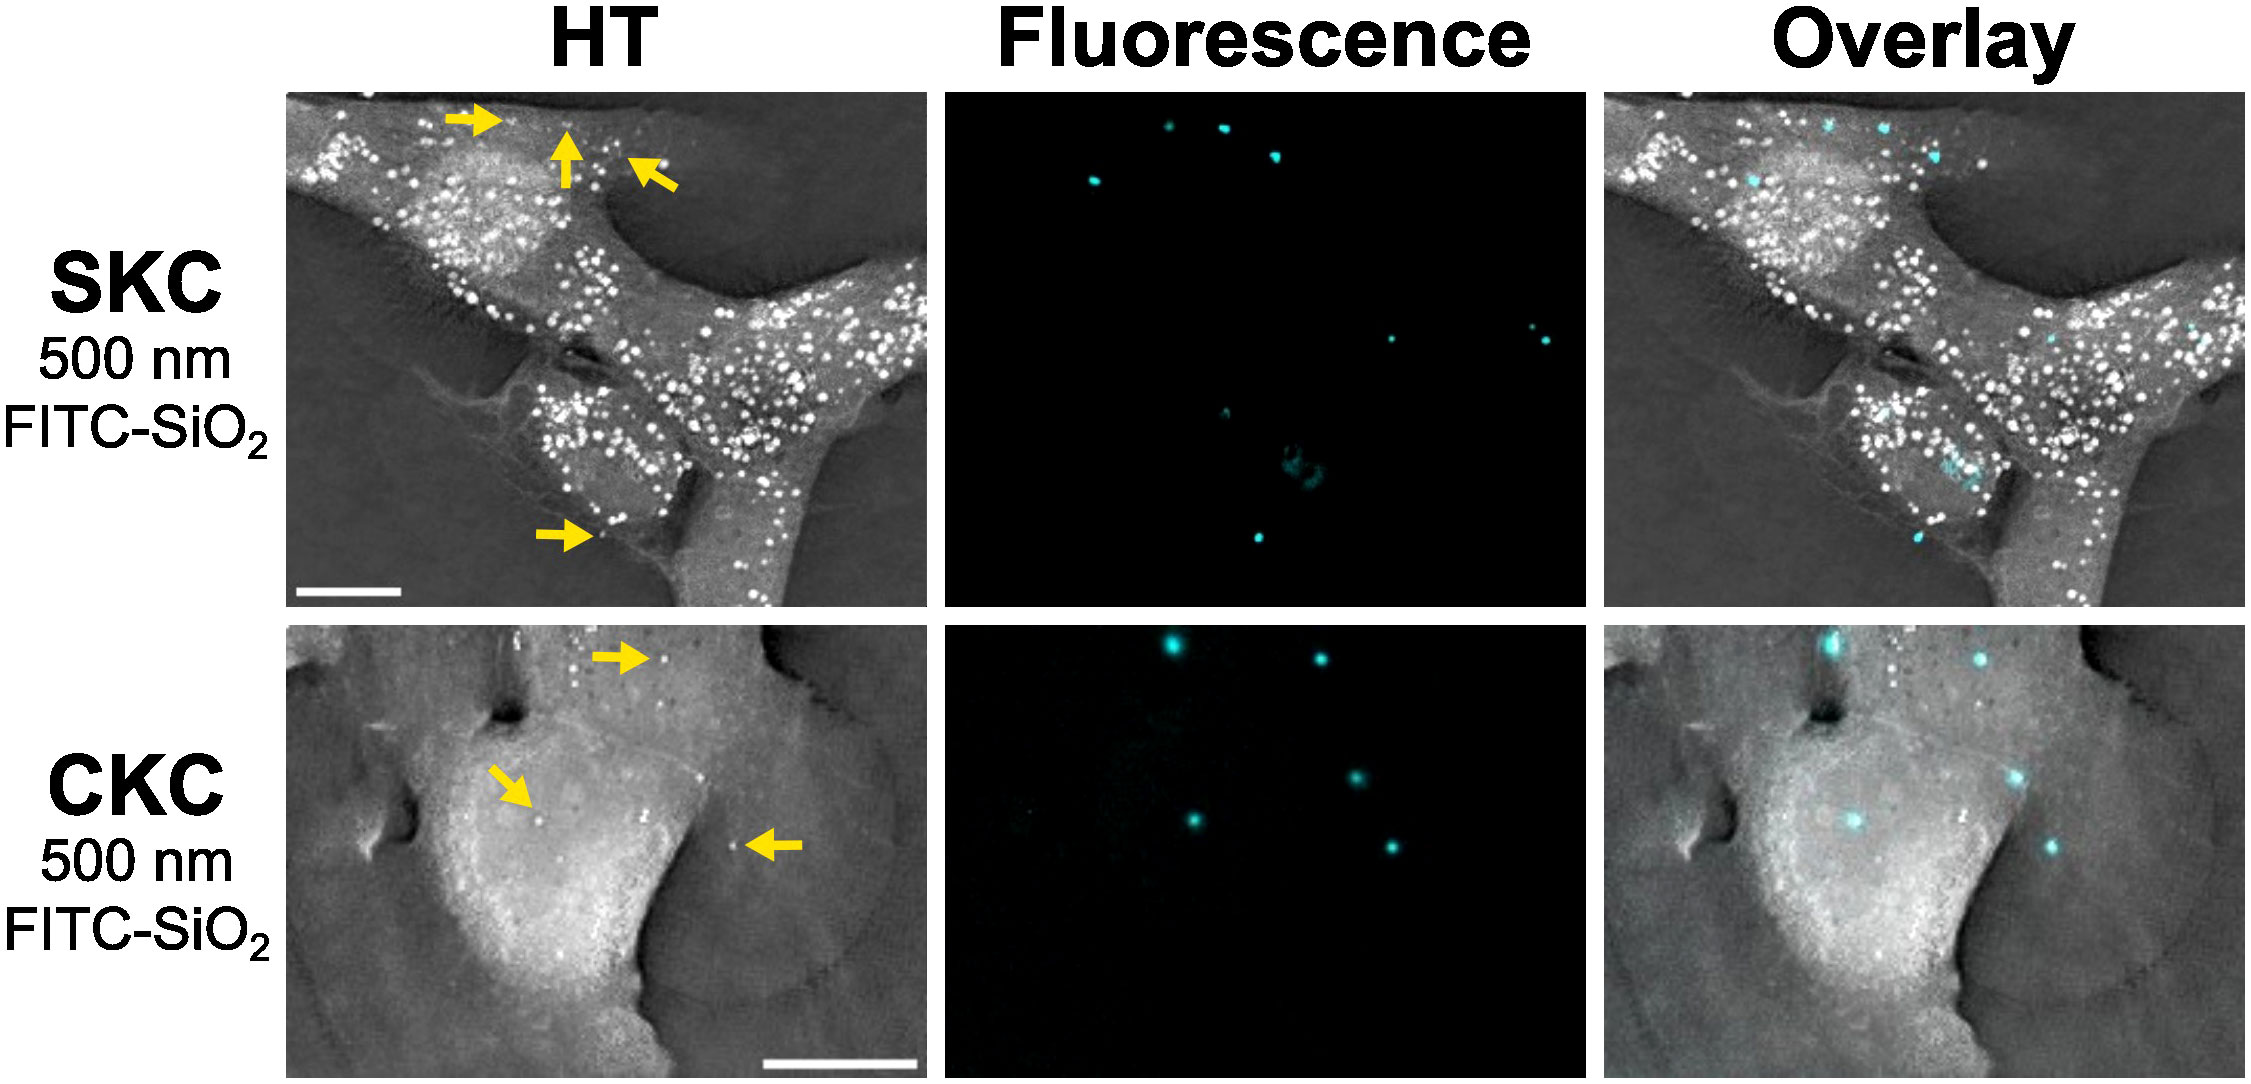
Figure 3 SKCs and CKCs associate with FITC-SiO2 within 1 hour. Fluorescence (cyan) is used to distinguish which of the bright spheres seen in the focused HT projection images are exogenous FITC-SiO2 rather than biological structures. Yellow arrows indicate some of the cell-associated particles, which can be seen in different parts of the cell. Scale bars are 10 µm.
To further confirm whether these cells have preferential uptake for either material when simultaneously exposed to both polystyrene and silica particles, SKCs/CKCs were exposed to approximately equal amounts of both 500 nm polystyrene and 500 nm FITC-SiO2 particles for 1 hour. Cells appeared to associate with both particle types without apparent preference, as shown in Supplementary Figure 2. Future studies could however reveal minor differences in uptake, such as the speed of uptake or cellular saturation level, which were not apparent from the single timepoint studied here.
The contrast in HT images is provided by inherent differences in RI of the samples; As both silica (RI = 1.44) and polystyrene (RI = 1.60) have significantly higher RI than most biological cells on average (Gul et al., 2021) the particles were expected to show up significantly brighter than the cells themselves. The particles, whose identities were confirmed with correlative fluorescence imaging (Figures 2, 3), do indeed appear to be some of the brightest objects in the images. Yet there are many other particle-like objects which appear similarly bright, including in control cells where no particles had been added. Analysis of HT images showed intensities, which should indicate the RI, of typically <1.4 for these particles - far less than the 1.60 expected for polystyrene, and generally less than the 1.44 expected for silica. Discussions with the instrument manufacturer revealed that their image reconstruction algorithm limited output intensities to approximately ±0.1 relative to the input background media RI; for the aqueous media the background RI is approximately 1.33. Later discussions pointed to challenges within holotomographic reconstruction (Sirico et al., 2022) such as phase unwrapping, as well as challenges specific to spherical, refractive objects specifically. Larger polystyrene particles (up to 10 µm were tested) generally showed higher reconstructed RI values, including beyond the ±0.1 expected limit, but the vast majority of even these larger particles still showed reconstructed RI values significantly below the expected 1.60 of polystyrene. Following the microscope manufacturer’s suggestion for reducing artifacts, the cell media was replaced with OptiPrep, a biologically inert media (Boothe et al., 2017) with a relatively high (1.43) RI, in order to shift the range of the reconstructed RI values higher. While this appears to improve contrast particularly for ruffles in the lamellipodia (see Supplementary Figure 3), it ultimately was impossible to differentiate between different particle types, including endogenous and exogenous.
While HT imaging alone cannot be used to identify exogenous particles from biological objects, it is still a useful tool for other purposes or in combination with other modalities. It is significantly less phototoxic than fluorescence imaging and could be used to provide a 3D view of the sample without needing to fluorescently label the cells themselves. Therefore, in this study HT was used to image cells’ interactions with silica and PS particles and correlative fluorescence was used to validate the identification of the particles in the HT images.
As with HT imaging, SKCs and CKCs were incubated with 500 nm PP-PS, 1 µm PP-PS, and/or 500 nm FITC-SiO2 particles for 1 hour and then washed. Cells were then fluorescently labeled, which added 15-60 minutes to the time at which cells had to internalize particles before 3D fluorescence imaging. After this time, all cell and particle combinations tested showed particles were definitively internalized inside the cells. Here, the superior contrast of a fluorescently labeled membrane ensured that the boundaries of the cell were clearly delineated, and the use of 3D imaging enabled the distinction between particles sitting above or below the cell from particles which are inside the cell.
Figure 4 shows a representative 3D fluorescence image of a 1 µm PP-PS particle clearly internalized inside an SKC. Lysosomal labeling shows the particle near but not conclusively colocalized with a lysosome. Commercially available fluorescent cell markers are typically optimized for mammalian cells, and as such we had mixed success particularly with lysosomal labels, even after optimization steps. Figure 5 shows internalization of a 500 nm PP-PS particle inside a CKC, although here the lysosomal labeling is even less distinct. However, the proximity of these particles to lysosomal markers in these data, along with data previously collected by our group (Svartaas and Kjølstad, 2020), strongly suggest a lysosomal pathway for small polystyrene particles in salmon keratocytes.
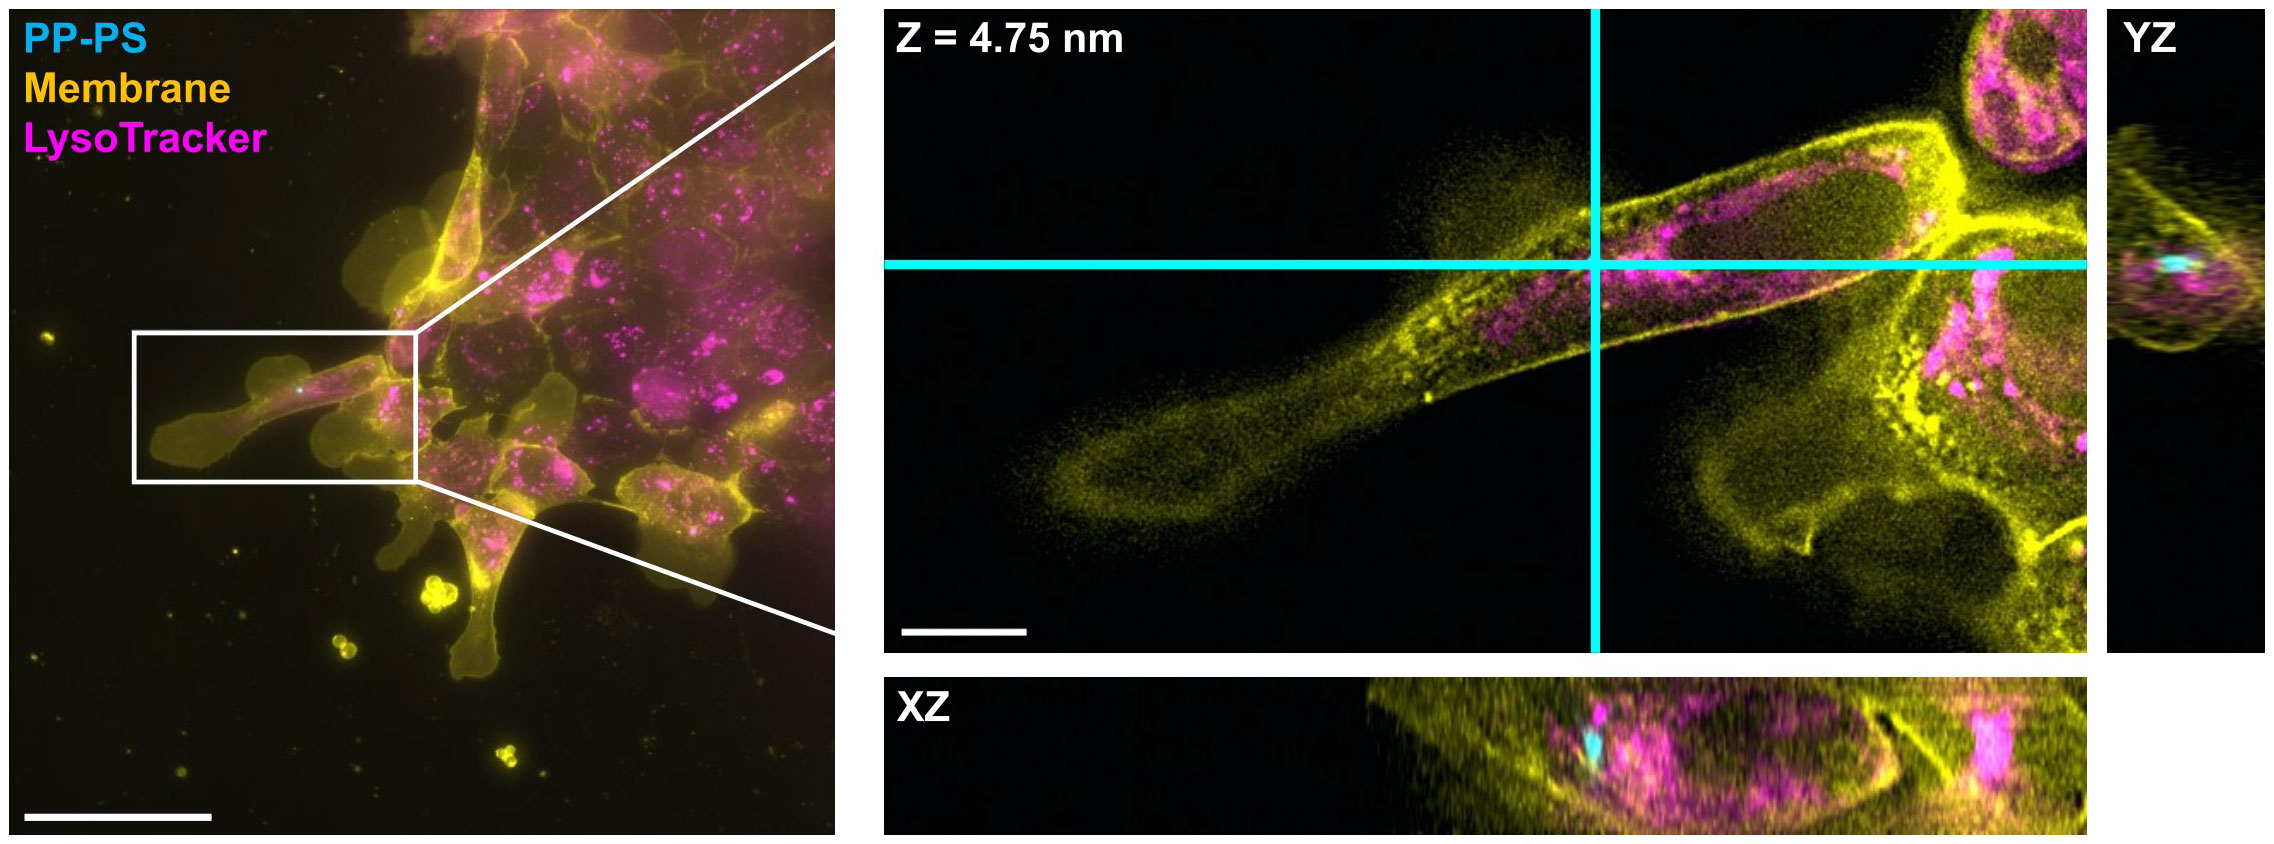
Figure 4 Internalization of PP-PS in SKC is confirmed using DV fluorescence microscopy. A 1000 nm PP-PS particle (cyan) is shown clearly within all membrane (yellow) boundaries of an SKC, and touching a lysosomal marker (magenta) in the YZ plane. The boxed region from the maximum intensity projection on the left is expanded and shown in 3D on the right; this region is shown as a single slice in XY and its orthogonal planes: i.e. the view from the side of the 3D volume after cutting along the cyan lines. Scale bars are (left) 50 µm and (right) 10 µm.
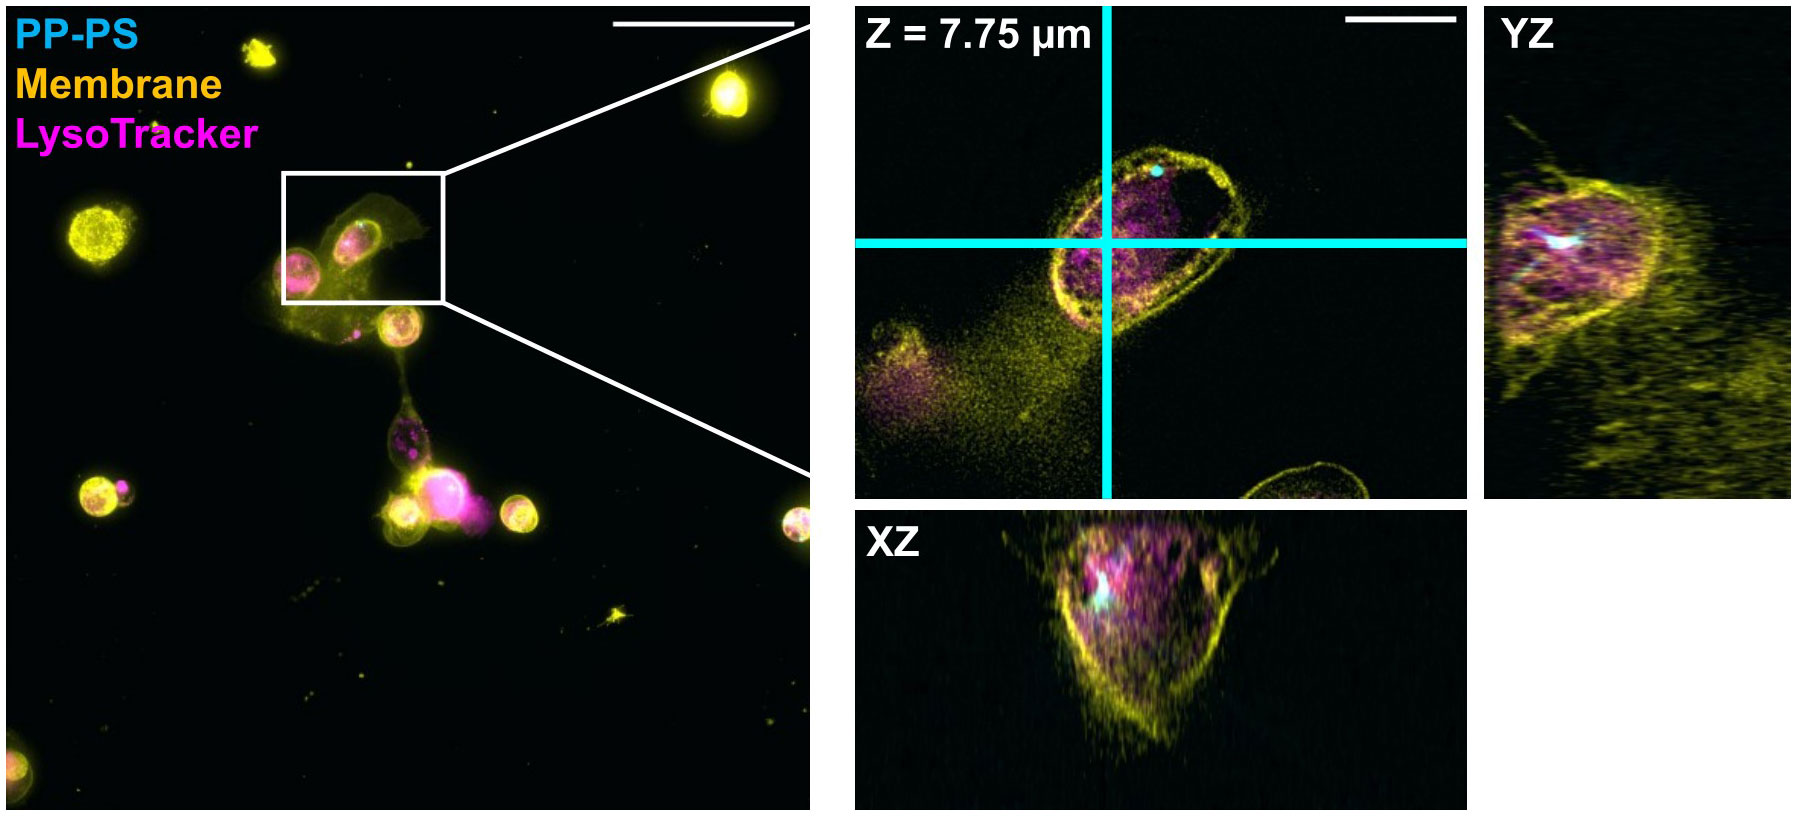
Figure 5 Internalization of PP-PS in CKC is confirmed using DV fluorescence microscopy. A 500 nm PP-PS particle (cyan) is shown near to the cell membrane (yellow) but still clearly inside an SKC. Lysosomal labeling (magenta) was indistinct, so it cannot be determined if the particle ended up in a lysosomal compartment. The boxed region from the maximum intensity projection on the left is expanded and shown in 3D on the right; this region is shown as a single slice in XY and its orthogonal planes: i.e. the view from the side of the 3D volume after cutting along the cyan lines. Scale bars are (left) 50 µm and (right) 10 µm.
Imaging internalized FITC-SiO2 particles shows more definitive colocalization with lysosomes. In Figure 6, a silica particle is shown to fit snugly into a pocket within a round lysosome inside a CKC. In Figure 7, there is complete overlap of the lysosomal marker with the particle inside a SKC. Particle uptake occurs both for single, isolated cells and for those moving as part of a cluster, and as shown, for both SKCs and CKCs.
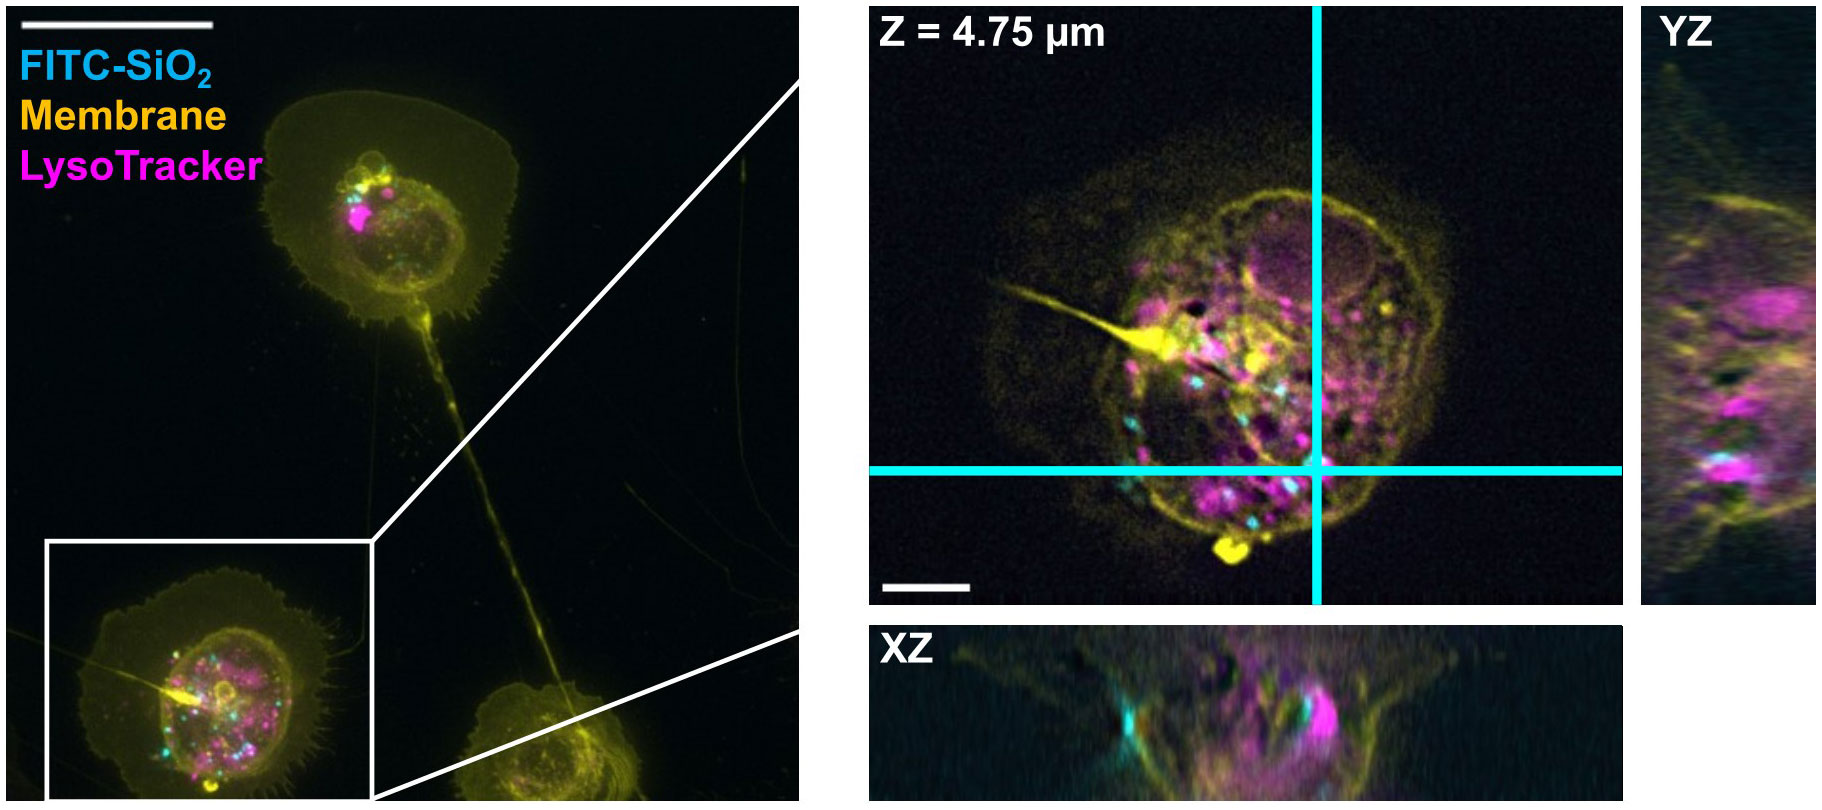
Figure 6 DV fluorescence microscopy shows colocalization of FITC-SiO2 with lysosomes in a CKC. 500 nm FITC-SiO2 particles (cyan) are shown in clear association with lysosomal markers (magenta) within a CKC. The particle appears to be in a pocket within a larger lysosomal structure. The boxed region from the maximum intensity projection on the left is expanded and shown in 3D on the right; this region is shown as a single slice in XY and its orthogonal planes: i.e. the view from the side of the 3D volume after cutting along the cyan lines. Scale bars are (left) 25 µm and (right) 5 µm.
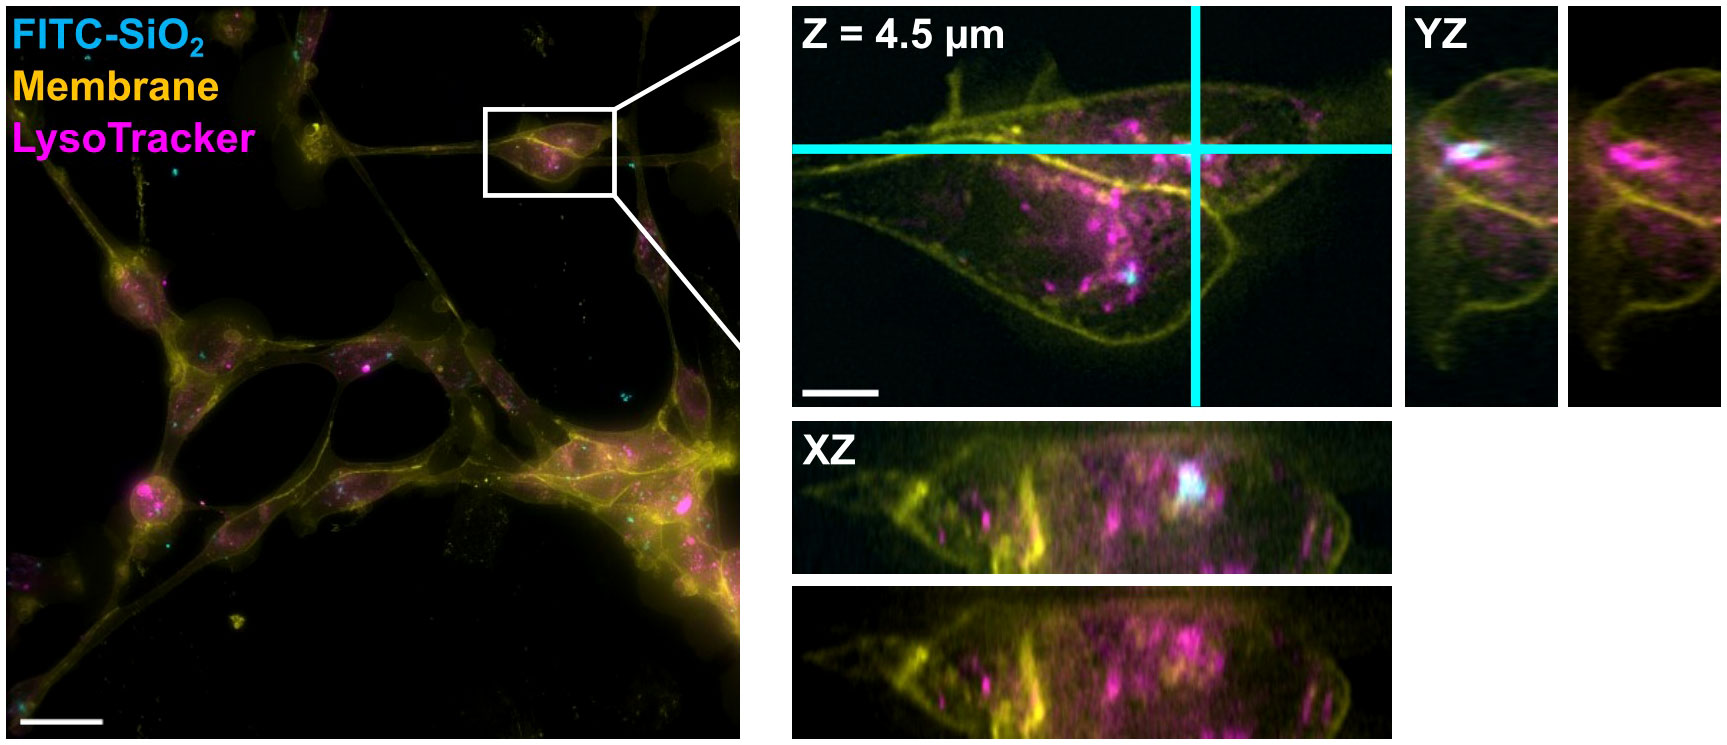
Figure 7 DV fluorescence microscopy shows FITC-SiO2 within a lysosomal structure in an SKC. A 500 nm FITC-SiO2 particle (cyan) is shown directly overlapping the signal from a lysosomal marker (magenta) inside the boundaries of an SKC membrane (yellow). The boxed region from the maximum intensity projection on the left is expanded and shown in 3D on the right; this region is shown as a single slice in XY and its orthogonal planes: i.e. the view from the side of the 3D volume after cutting along the cyan lines. These side views are shown with and without the FITC-SiO2 channel for better visibility of the lysosomal structure. Scale bars are (left) 25 µm and (right) 5 µm.
Neither CKCs nor SKCs showed indications of preferential uptake of silica compared to polystyrene. Imaging uptake of 500 nm particles of these types in SKCs (Figure 8) and CKCs (Figure 9) shows that both particle types are taken up within the same cells. Furthermore, PPPS and FITC-SiO2 can be seen clustered together in some places, as well as completely separate in others, which suggests that the cells process both particle types similarly. While to ensure consistent dilution practices to match the relative concentration of particles in the experiments, the sedimentary nature of particles made this a challenge with available equipment. Further insights on preferential uptake and minor differences between how the cells interact with different particle types would need more tightly controlled quantification of particle density.
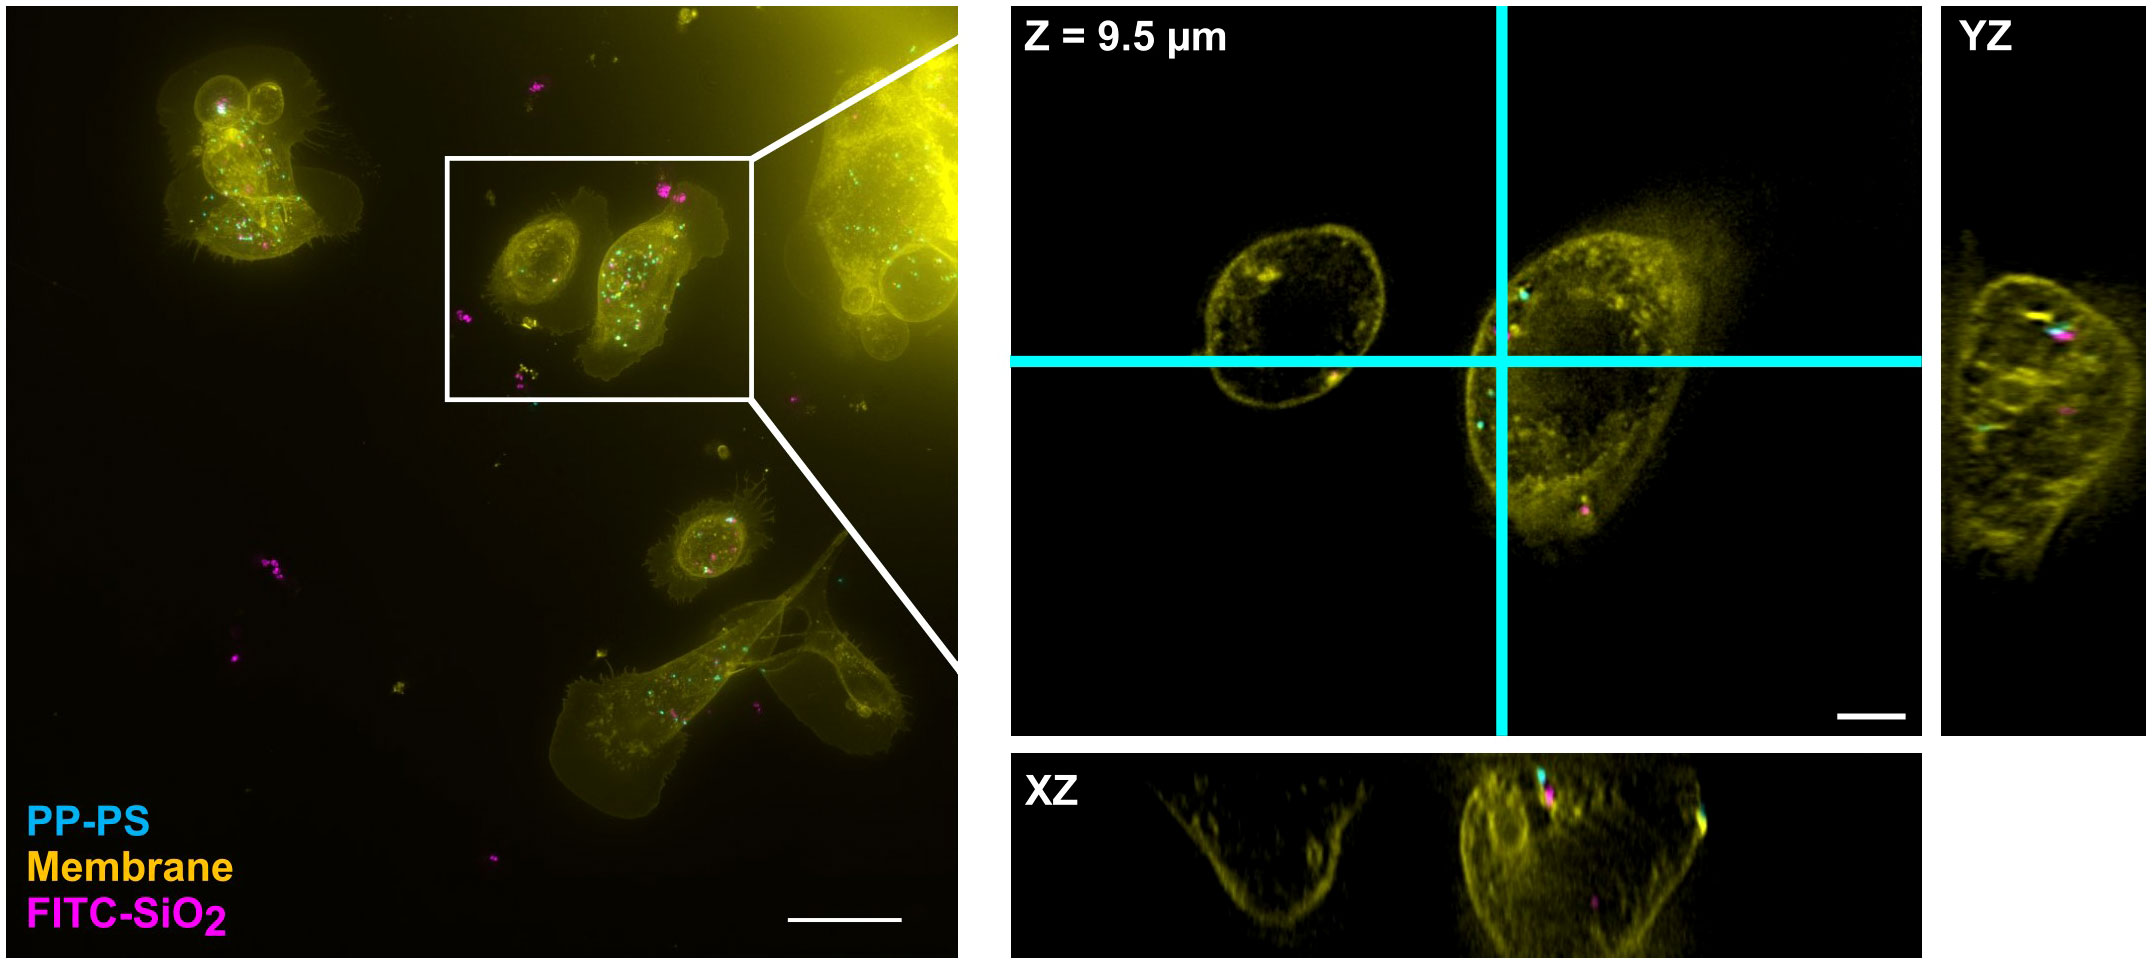
Figure 8 SKCs concurrently internalize both 500 nm PP-PS and FITC-SiO2. When exposed to similar concentrations, SKCs will take up both particle types without clear prejudice. PP-PS (cyan) and FITC-SiO2 (shown in magenta here) are visible colocalizing and distinctly separate, even within the same cell. Particles not attached to cells appear as large clusters in the maximum intensity projection (left) due to their diffusive wandering during the relatively long 3D acquisition. The boxed region is expanded and shown in 3D on the right; this region is shown as a single slice in XY and its orthogonal planes: i.e. the view from the side of the 3D volume after cutting along the cyan lines. Scale bars are (left) 25 µm and (right) 5 µm.
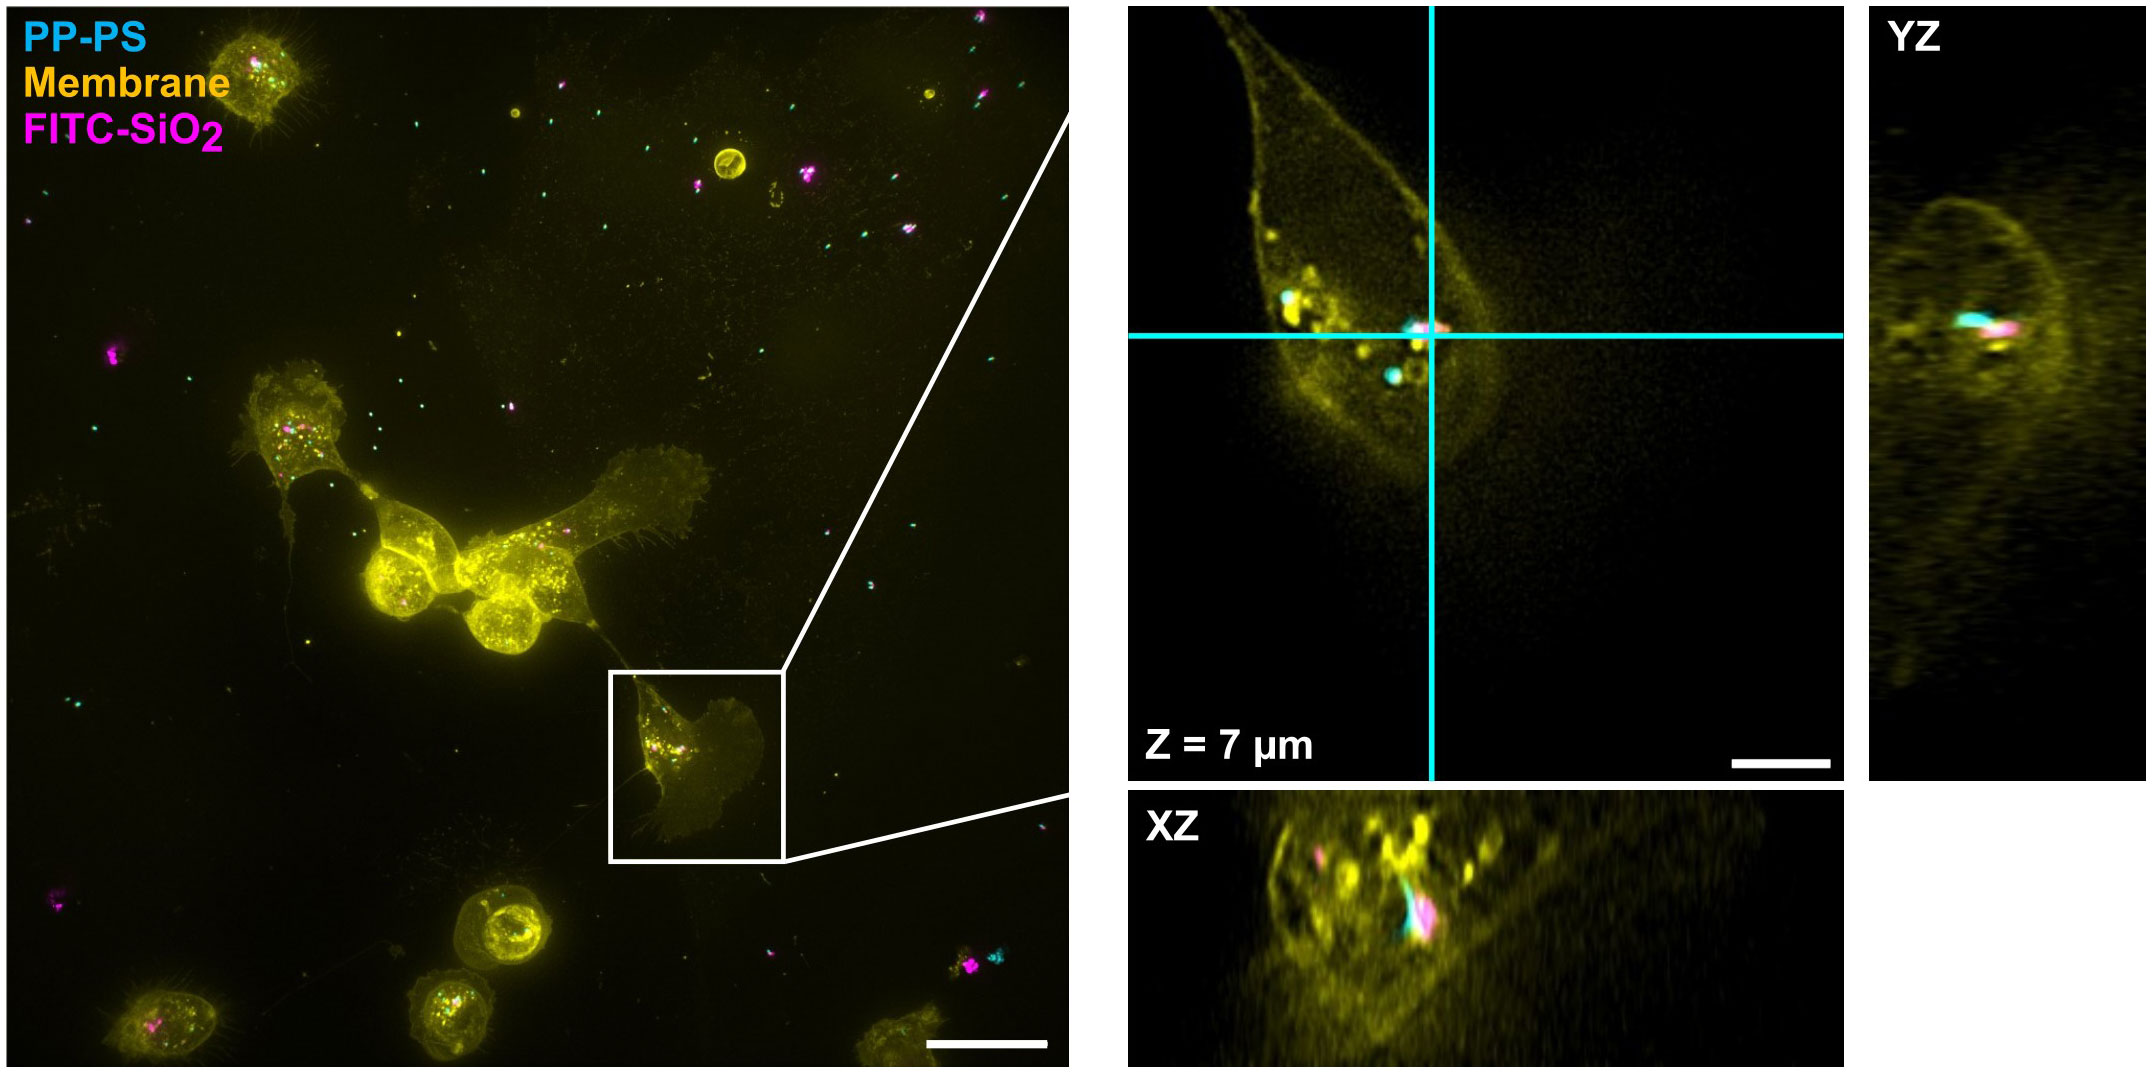
Figure 9 CKCs concurrently internalize both 500 nm PP-PS and FITC-SiO2. As with SKCs, CKCs internalize both particle types within the same cell. PP-PS (cyan) and FITC-SiO2 (shown in magenta here) can be seen both in close proximity and in isolation. The boxed region from the maximum intensity projection on the left is expanded and shown in 3D on the right; this region is shown as a single slice in XY and its orthogonal planes: i.e. the view from the side of the 3D volume after cutting along the cyan lines. Scale bars are (left) 25 µm and (right) 5 µm.
While fluorescence imaging provided the contrast necessary for determining internalization, it came with additional challenges compared to HT imaging. As mentioned above, lysosomal labeling was somewhat inconsistent in terms of its specificity, and the concentration required to achieve any clear labeling was significantly higher than what is recommended by the manufacturer or typically used with mammalian cells. While the membrane labeling used similar conditions as to what is common with mammalian cells, the resulting intensity was somewhat lower and was also inconsistent. For example, SKCs within a large cluster or migrating sheet were sometimes resistant to labeling, which may indicate some sort of protective mechanism from the primary tissue.
Labeling itself appeared to have a toxic effect on the cells: cell number was typically reduced after completion of labeling and washing steps, and cells were more likely to have a rounded up shape or show visible signs of blebbing. Most critical, however, was the appearance of small autofluorescent particles in the orange imaging channel, even in control samples with no exogenous microparticles added (Supplementary Figure 4). These particles were not observed in control samples without labeling, and with labeled samples they were apparent from the start of imaging, suggesting they are a direct response to the added labels. With a similar size and intensity to the NPs evaluated here, confusion between these endogenous particles and exogenous NPs can only be avoided by avoiding the orange channel for these structures, and ensuring proper controls.
In addition to chemical toxicity, fluorescence imaging also suffers from phototoxicity (Schneckenburger et al., 2012; Icha et al., 2017). For each 3 colors, 3D images shown here, 100-200 individual image planes were taken; because keratocytes move fairly quickly (Opstad et al., 2022), this required the use of relatively high imaging power to reduce imaging time and motion-related artifacts. Adding a fluorescent label increases absorption at the site of the label, which resulted in particularly high absorption at the very thin lamellipodia. Furthermore, the blue light used for imaging PP-PS (390 nm) is more damaging than longer wavelengths, even though it was necessary to enable multicolor imaging, particularly while avoiding the orange autofluorescence. As a result of all of this damage, cells could often be seen blebbing after such imaging (e.g. Figure 6), ruling out the possibility of time-lapse imaging without drastically changing conditions (such as limiting the number of z-planes collected). Thus, to capture true dynamics in the future, a combination of low-intensity, low-photodamage HT imaging should be combined with occasional use of high-specificity, high-damage 3D fluorescence imaging.
Scavenging keratocyte cells from salmon skin and cornea appear similar both in morphology and in their interactions with nano- to micro-scale silica and polystyrene particles. Both SKCs and CKCs tightly adhered to 500 to 1000 nm particles within an hour and internalized them within 90 minutes, with possible lysosomal trafficking shortly after. The exact timing and entry mechanisms for these particles are still unknown, and several technological challenges remain for directly investigating them. The appearance of NP binding to cell surfaces can be conflated with internalization and certain uptake pathways (Abihssira-García et al., 2020), but further investigation is needed to confirm these hypotheses, and the mechanism likely varies with MP size. A further challenge is that commercial fluorescent labels for subcellular targets are much more common for mammalian cell biology than marine, and often do not work as effectively or as reliably on these off-target species. Here we observed toxic effects both from the labeling itself, with the formation of autofluorescent granules (Croce and Bottiroli, 2014), and from phototoxicity, in the form of blebbing or other cellular degradation (Icha et al., 2017). The size and intensity of these endogenous granules present their own technological challenge to cell-nanoparticle interactions, as they are thus far indistinguishable from exogenous particles. When combined with the relatively fast migration of keratocytes themselves, these issues make 3D fluorescence imaging a challenging method to study the dynamics of cell-MP interactions, and other modalities may be better suited to fill this gap.
Holotomography directly addresses the toxicity problems encountered in fluorescence imaging. Since the contrast comes from inherent differences in RI within the sample, potentially toxic exogenous labels aren’t needed; without highly absorbing labels, imaging results in lower energy transfer to the sample than with fluorescence imaging, most specifically at the organelles of interest. Furthermore, the overall imaging intensity is significantly lower with HT, making it a much more live-cell friendly approach. However, these advantages come at the cost of a lack of specificity and image artifacts -which are particularly strong for high RI, spherical particles such as MPs. Furthermore, HT is a relatively unexplored technology compared to fluorescence microscopy, so image analysis and data extraction workflows which exist for fluorescence are missing for HT. Even the promise of artificial intelligence is more challenging for HT, as there is a dearth of public datasets to train on for this relatively new technology. As such, we are also publishing a public dataset (Thiyagarajan et al., 2024) which includes this research data as well as examples of other particle types, including gold and graphene.
Future studies of keratocyte-MP interactions will require a multimodal approach to balance needs for specificity, contrast, speed, timing, toxicity, resolution, and many other factors. However, with the increasing prevalence of MPs throughout the world, the need to understand these interactions will only increase. Here, only a tiny subset of exogenous particles was studied: one synthetic material (polystyrene) and one material similar to naturally occurring ocean sand (FITC-doped silica), both 500-1000 nm and spherical in shape. Material type and surface functionalization are highly likely to affect their cellular interactions, e.g. with low density materials changing the buoyancy of the organism that ingests them (Augustine et al., 2020). Different cellular uptake mechanisms such as endocytosis, phagocytosis, or pore-mediated entry all have different size restrictions, and will have corresponding differences in dynamics, capacity, and post-uptake trafficking and processing. Even the shapes of particles impact their uptake (He and Park, 2016) and toxicity (Dong et al., 2019). With the variety of challenges presented by both scientific and societal problems from micro- and nanoplastics, it is clear that interdisciplinary collaboration to develop new investigative workflows will be necessary.
The datasets presented in this study can be found in online repositories. The names of the repository/repositories and accession number(s) can be found below: Thiyagarajan, Dhivya B; Afzal, Bilal M; Wolfson, Deanna, 2024, "Label-free and fluorescent imaging data of microparticle association with Salmon Keratocytes", https://doi.org/10.18710/KBEQT9, DataverseNO, V1.
Ethical approval was not required for the study involving animals in accordance with the local legislation and institutional requirements because formal approval of the experimental protocol by the Norwegian Animal Research Authority (NARA) is not required since it falls under the purpose of recognized animal husbandry. These practices are exempt from the European convention on the protection of animals used for scientific purposes (EU Directive (2010/63/EU, cf. article 5d), which Norway has subscribed and implemented.
DT: Conceptualization, Data curation, Formal Analysis, Investigation, Methodology, Visualization, Writing – original draft, Writing – review & editing, Project administration, Supervision. MS: Writing – review & editing, Data curation, Formal Analysis, Investigation, Methodology. BA: Investigation, Writing – review & editing, Data curation, Formal Analysis, Methodology, Visualization. BA: Writing – review & editing, Conceptualization, Funding acquisition. KA: Funding acquisition, Writing – review & editing. RD: Funding acquisition, Writing – original draft, Writing – review & editing, Conceptualization, Supervision, Visualization, Methodology. DW: Conceptualization, Data curation, Formal Analysis, Investigation, Methodology, Visualization, Writing – original draft, Writing – review & editing, Supervision.
The author(s) declare financial support was received for the research, authorship, and/or publication of this article. This research was supported by a grant from the Research Council of Norway (ID# 301401).
The authors acknowledge Ole Kristian Helstad Svartaas and Eskil Mossige Kjølstad for their early work at UiT the Arctic University of Norway optimizing sample collection, labeling, and imaging conditions for keratocyte cells.
The authors declare that the research was conducted in the absence of any commercial or financial relationships that could be construed as a potential conflict of interest.
All claims expressed in this article are solely those of the authors and do not necessarily represent those of their affiliated organizations, or those of the publisher, the editors and the reviewers. Any product that may be evaluated in this article, or claim that may be made by its manufacturer, is not guaranteed or endorsed by the publisher.
The Supplementary Material for this article can be found online at: https://www.frontiersin.org/articles/10.3389/fmars.2024.1422748/full#supplementary-material
Abihssira-García I. S., Kögel T., Gomiero A., Kristensen T., Krogstad M., Olsvik P. A. (2022). Distinct polymer-dependent sorption of persistent pollutants associated with Atlantic salmon farming to microplastics. Mar. pollut. Bull. 180, 113794. doi: 10.1016/j.marpolbul.2022.113794
Abihssira-García I. S., Park Y., Kiron V., Olsvik P. A. (2020). Fluorescent microplastic uptake by immune cells of atlantic salmon (Salmo salar L.). Front. Environ. Sci. 8. doi: 10.3389/fenvs.2020.560206
Anastasopoulou A., Fortibuoni T. (2019). Impact of Plastic Pollution on Marine Life in the Mediterranean Sea. In: Stock F., Reifferscheid G., Brennholt N., Kostianaia E. (eds) Plastics in the Aquatic Environment - Part I. The Handbook of Environmental Chemistry, vol 111. Springer, Cham. doi: 10.1007/698_2019_421
Åsbakk K. (2001). Elimination of foreign material by epidermal malpighian cells during wound healing in fish skin. J. Fish. Biol. 58, 953–966. doi: 10.1111/j.1095-8649.2001.tb00547.x
Åsbakk K, Dalmo R. (1998). Atlantic salmon (Salmo salar L.) epidermal Malpighian cells—motile cells clearing away latex beads in vitro. J. Mar. Biotechnol. 6, 30–34.
Augustine R., Hasan A., Primavera R., Wilson R. J., Thakor A. S., Kevadiya B. D. (2020). Cellular uptake and retention of nanoparticles: Insights on particle properties and interaction with cellular components. Materials. Today Commun. 25, 101692. doi: 10.1016/j.mtcomm.2020.101692
Bergmann M., Collard F., Fabres J., Gabrielsen G. W., Provencher J. F., Rochman C. M., et al. (2022). Plastic pollution in the arctic. Nat. Rev. Earth Environ. 3, 323–337. doi: 10.1038/s43017-022-00279-8
Boothe T., Hilbert L., Heide M., Berninger L., Huttner W. B., Zaburdaev V., et al. (2017). A tunable refractive index matching medium for live imaging cells, tissues and model organisms. eLife 6, e27240. doi: 10.7554/eLife.27240.022
Cotte Y., Toy F., Jourdain P., Pavillon N., Boss D., Magistretti P., et al. (2013). Marker-free phase nanoscopy. Nat. Photonics. 7, 113–117. doi: 10.1038/nphoton.2012.329
Croce A. C., Bottiroli G. (2014). Autofluorescence spectroscopy and imaging: a tool for biomedical research and diagnosis. Eur. J. Histochem. 58, 2461. doi: 10.4081/ejh.2014.2461
Dong L., Tang S., Deng F., Gong Y., Zhao K., Zhou J., et al. (2019). Shape-dependent toxicity of alumina nanoparticles in rat astrocytes. Sci. Total. Environ. 690, 158–166. doi: 10.1016/j.scitotenv.2019.06.532
Esteban M. (2012). An overview of the immunological defenses in fish skin. ISRN. Immunol. 2012, 129. doi: 10.5402/2012/853470
Friedrich R. P., Schreiber E., Tietze R., Yang H., Pilarsky C., Alexiou C. (2020). Intracellular quantification and localization of label-free iron oxide nanoparticles by holotomographic microscopy. Nanotechnol. Sci. Appl. 13, 119–130. doi: 10.2147/NSA.S282204
Géloën A., Isaieva K., Isaiev M., Levinson O., Berger E., Lysenko V. (2021). Intracellular detection and localization of nanoparticles by refractive index measurement. Sensors. (Basel. Switzerland). 21. doi: 10.3390/s21155001
Gigault J., Halle A. T., Baudrimont M., Pascal P. Y., Gauffre F., Phi T. L., et al. (2018). Current opinion: What is a nanoplastic? Environ. pollut. 235, 1030–1034. doi: 10.1016/j.envpol.2018.01.024
Gul B., Ashraf S., Khan S., Nisar H., Ahmad I. (2021). Cell refractive index: Models, insights, applications and future perspectives. Photodiagnosis Photodyn. Ther. 33, 102096. doi: 10.1016/j.pdpdt.2020.102096
Halden R. U. (2010). Plastics and health risks. Annu. Rev. Public Health 31, 179–194. doi: 10.1146/annurev.publhealth.012809.103714
He Y., Park K. (2016). Effects of the microparticle shape on cellular uptake. Mol. Pharmaceutics. 13, 2164–2171. doi: 10.1021/acs.molpharmaceut.5b00992
Herant M., Dembo M. (2010). Form and function in cell motility: from fibroblasts to keratocytes. Biophys. J. 98, 1408–1417. doi: 10.1016/j.bpj.2009.12.4303
Icha J., Weber M., Waters J. C., Norden C. (2017). Phototoxicity in live fluorescence microscopy, and how to avoid it. Bioessays 39. doi: 10.1002/bies.201700003
Kim S.-K., Kim J.-S., Kim S.-Y., Song N.-S., La H. S., Yang E.-J. (2023). Arctic Ocean sediments as important current and future sinks for marine microplastics missing in the global microplastic budget. Sci. Adv. 9, eadd2348. doi: 10.1126/sciadv.add2348
Kim D., Lee S., Lee M., Oh J., Yang S. A., Park Y. (2021). Holotomography: refractive index as an intrinsic imaging contrast for 3-D label-free live cell imaging. Adv. Exp. Med. Biol. 1310, 211–238. doi: 10.1007/978-981-33-6064-8
Krüger L., Casado-Coy N., Valle C., Ramos M., Sánchez-Jerez P., Gago J., et al. (2020). Plastic debris accumulation in the seabed derived from coastal fish farming. Environ. pollut. 257, 113336. doi: 10.1016/j.envpol.2019.113336
Kryvi H., Poppe T. (2016). Fiskeanatomi (Fagbokforl). Available at: https://norecopa.no/no/textbase/fiskeanatomi-fish-anatomy-second-edition.
Li P., Wang X., Su M., Zou X., Duan L., Zhang H. (2021). Characteristics of plastic pollution in the environment: A review. Bull. Environ. Contamination. Toxicol. 107, 577–584. doi: 10.1007/s00128-020-02820-1
Lusher A. L., Tirelli V., O’connor I., Officer R. (2015). Microplastics in Arctic polar waters: the first reported values of particles in surface and sub-surface samples. Sci. Rep. 5, 14947. doi: 10.1038/srep14947
Medina-Ramirez I. E., Macias-Diaz J. E., Masuoka-Ito D., Zapien J. A. (2024). Holotomography and atomic force microscopy: a powerful combination to enhance cancer, microbiology and nanotoxicology research. Discovery Nano. 19, 64. doi: 10.1186/s11671-024-04003-x
Moore C. J. (2008). Synthetic polymers in the marine environment: a rapidly increasing, long-term threat. Environ. Res. 108, 131–139. doi: 10.1016/j.envres.2008.07.025
Nestle F. O., Di Meglio P., Qin J. Z., Nickoloff B. J. (2009). Skin immune sentinels in health and disease. Nat. Rev. Immunol. 9, 679–691. doi: 10.1038/nri2622
Nishida T. (2010). Commanding roles of keratocytes in health and disease. Cornea 29, S3–S6. doi: 10.1097/ICO.0b013e3181f2d578
North E. J., Halden R. U. (2013). Plastics and environmental health: the road ahead. Rev Environ Health 28, 1–8. doi: 10.1515/reveh-2012-0030
Oliveira V. H. S., Dean K. R., Qviller L., Kirkeby C., Bang Jensen B. (2021). Factors associated with baseline mortality in Norwegian Atlantic salmon farming. Sci. Rep. 11, 14702. doi: 10.1038/s41598-021-93874-6
Opstad I. S., Wolfson D. L. (2021). Salmon keratocyte DIC microscopy videos. V1 ed. Ed. UI T. T. A. U. O. N. (DataverseNO).
Opstad I. S., Wolfson D. L., Ahluwalia B. S., Agarwal K., Seternes T., Dalmo R. A. (2022). The complexity of keratocyte migration in salmon explant cultures: initial results and future prospects. bioRxiv. 2022.06.01.494312. doi: 10.1101/2022.06.01.494312
Ream R. A., Theriot J. A., Somero G. N. (2003). Influences of thermal acclimation and acute temperature change on the motility of epithelial wound-healing cells (keratocytes) of tropical, temperate and Antarctic fish. J. Exp. Biol. 206, 4539–4551. doi: 10.1242/jeb.00706
Revel M., Châtel A., Mouneyrac C. (2018). Micro(nano)plastics: A threat to human health? Curr. Opin. Environ. Sci. Health 1, 17–23. doi: 10.1016/j.coesh.2017.10.003
Salinas I., Ding Y., Fernández-Montero Á., Sunyer J. O. (2022). “Mucosal Immunity in Fish,” in Principles of Fish Immunology: From Cells and Molecules to Host Protection. Eds. Buchmann K., Secombes ,. C. J. (Springer International Publishing, Cham).
Schindelin J., Arganda-Carreras I., Frise E., Kaynig V., Longair M., Pietzsch T., et al. (2012). Fiji: an open-source platform for biological image analysis. Nat. Methods 9, 676–682. doi: 10.1038/nmeth.2019
Schneckenburger H., Weber P., Wagner M., Schickinger S., Richter V., Bruns T., et al. (2012). Light exposure and cell viability in fluorescence microscopy. J. Microsc. 245, 311–318. doi: 10.1111/j.1365-2818.2011.03576.x
Shah A. A., Hasan F., Hameed A., Ahmed S. (2008). Biological degradation of plastics: A comprehensive review. Biotechnol. Adv. 26, 246–265. doi: 10.1016/j.biotechadv.2007.12.005
Singh G. G., Sajid Z., Mather C. (2024). Quantitative analysis of mass mortality events in salmon aquaculture shows increasing scale of fish loss events around the world. Sci. Rep. 14, 3763. doi: 10.1038/s41598-024-54033-9
Sirico D. G., Miccio L., Wang Z., Memmolo P., Xiao W., Che L., et al. (2022). Compensation of aberrations in holographic microscopes: main strategies and applications. Appl. Phys. B. 128, 78. doi: 10.1007/s00340-022-07798-8
Svartaas O. K. H., Kjølstad E. M. (2020). Keratocyttlignende celler fra hornhinne og hud hos atlantisk laks (Salmo salar L.). Mikro-og nanoplast, mitokondrieutveksling, fusjonering og celletunneler (UiT Munin: UiT The Arctic University of Norway).
Syakti A. (2017). Microplastics monitoring in marine environment. Omni-Akuatika 13. doi: 10.20884/1.oa.2017.13.2.430
Thiyagarajan, Dhivya B., Afzal, Bilal M., Wolfson D. (2024). “Label-free and fluorescent imaging data of microparticle association with Salmon Keratocytes” Ed. UI T. T. A. U. O. N. (DataverseNO). DRAFT VERSION ed. doi: 10.18710/KBEQT9
Thompson R. C., Moore C. J., Vom Saal F. S., Swan S. H. (2009). Plastics, the environment and human health: current consensus and future trends. Philos. Trans. R. Soc. Lond. B. Biol. Sci. 364, 2153–2166. doi: 10.1098/rstb.2009.0053
Keywords: microplastics, nanoplastics, Atlantic salmon, keratocyte cells, label-free microscopy, live cell imaging, holotomography, fluorescence microscopy
Citation: Thiyagarajan DB, Stette MHS, Afzal BM, Ahluwalia BS, Agarwal K, Dalmo RA and Wolfson DL (2024) 3D imaging shows nano- and microparticles are internalized by salmon skin and corneal epithelial cells. Front. Mar. Sci. 11:1422748. doi: 10.3389/fmars.2024.1422748
Received: 24 April 2024; Accepted: 18 June 2024;
Published: 18 July 2024.
Edited by:
Chiara Gambardella, National Research Council (CNR), ItalyReviewed by:
Francesca Sbrana, National Research Council (CNR), ItalyCopyright © 2024 Thiyagarajan, Stette, Afzal, Ahluwalia, Agarwal, Dalmo and Wolfson. This is an open-access article distributed under the terms of the Creative Commons Attribution License (CC BY). The use, distribution or reproduction in other forums is permitted, provided the original author(s) and the copyright owner(s) are credited and that the original publication in this journal is cited, in accordance with accepted academic practice. No use, distribution or reproduction is permitted which does not comply with these terms.
*Correspondence: Dhivya B. Thiyagarajan, ZGhpdnlhLnRoaXlhZ2FyYWphbkB1aXQubm8=
Disclaimer: All claims expressed in this article are solely those of the authors and do not necessarily represent those of their affiliated organizations, or those of the publisher, the editors and the reviewers. Any product that may be evaluated in this article or claim that may be made by its manufacturer is not guaranteed or endorsed by the publisher.
Research integrity at Frontiers
Learn more about the work of our research integrity team to safeguard the quality of each article we publish.