 Yu Fan
 Chengji Shen
 Yifan Xie
 Chunhui Lu
 Chenming Zhang5
- 1The National Key Laboratory of Water Disaster Prevention, Hohai University, Nanjing, China
- 2College of Harbour, Coastal and Offshore Engineering, Hohai University, Nanjing, China
- 3College of Water Conservancy and Hydropower Engineering, Hohai University, Nanjing, China
- 4Yangtze Institute for Conservation and Development, Hohai University, Nanjing, China
- 5School of Civil Engineering, The University of Queensland, Brisbane, QLD, Australia
- 6College of Engineering, Westlake University, Hangzhou, China
Recently, the influence of subsurface dams on solute transport in coastal aquifers has become a hot research topic. Although many studies have been conducted, the combined effects of subsurface dam and tides on variable-density solute transport remain unclear, and this study aimed to fill this research gap. In the current study, a numerical model representing a 2-D cross-shore coastal aquifer was established. The model simulated cases with and without a subsurface dam, and sensitivity analysis cases with different height and location of the subsurface dam and solute concentration. The results show that a subsurface dam blocks a portion of the solute plume, which can only be discharged by dilution at the edges, thereby altering its discharge pattern and reducing their discharge rate. The addition of a subsurface dam may either prolong or shorten the residence time of solute,depending on the location rather than the height of the subsurface dam. In particular, a more landward subsurface dam would significantly increase the residence time; sensitivity analysis demonstrates that both the landward shift and the height increase of the subsurface dam contribute to a heightened ratio of dynamic mass distribution for the solute plume within the freshwater and saltwater zones of the aquifer, with maximum changes in mass distribution ratios of 87.22% and 300%, respectively. Also, these factors cause the solute to migrate both seaward and landward, respectively, across the primary outflow regions of the aquifer-ocean interface. Results from this study may provide theoretical guidance for the optimal design and environmental impact assessment of subsurface dams.
1 Introduction
Currently, over one-third of the global population resides within 100 km of coastlines, leading to increased discharge of land-sourced solutes (e.g., nutrients and organic matter) into the ocean due to high population density (Shen et al., 2022). Coastal aquifers play a vital role as a pathway for land-sourced solutes to enter the sea, and the hydrodynamic processes within the aquifer significantly influence the migration characteristics of these solutes, thereby impacting the water ecology and environment of the nearshore sea (Morales-Ojeda et al., 2010). Numerous studies conducted in the past decades have primarily focused on the hydrodynamics in coastal aquifers, considering the individual or combined effects of tides (Robinson et al., 2007; Xie et al., 2023), waves (Xin et al., 2010; Yu et al., 2022), sea level rise (Werner and Simmons, 2009; Guimond et al., 2022; Chambers et al., 2023), aquifer heterogeneity (Song et al., 2022; Zhuang et al., 2023), and rainfall (Geng and Boufadel, 2017; Yu et al., 2017; Pandey et al., 2023).
Among these factors, tides are the primary factor influencing the hydrodynamic processes in coastal aquifers. Tidal presence significantly alters the characteristics of the groundwater flow field and salinity distribution, which subsequently impacts the process of solute migration (Boufadel et al., 2006; Bakhtyar et al., 2013; Li et al., 2022). Indoor experiments and numerical simulations reveal that tides have a significant impact on the shape and degree of solute diffusion from land-sourced sources prior to discharge into the ocean (Zhang et al., 2001). According to Robinson et al. (2007), the circulation of seawater within the upper saline plume (USP) induced by tides significantly alters the transport path of terrestrial solutes in the aquifer. This process slows down the solute transport rate from the aquifer to the sea and reduces its discharge concentration. Shen et al. (2019) discovered that under specific hydrogeological conditions, unsteady flow develops in tidally influenced aquifers. In contrast to the quasi-steady upper saline plume, this unsteady flow substantially changes the migration path of solutes towards the ocean, leading to deeper penetration into the aquifer. Furthermore, tidal circulation governs the transport and transformation of reactive solutes in the coastal aquifer. Numerical investigations carried out by Anwar et al. (2014) reveal that tidal forces intensify the blending of saline and freshwater, especially in the presence of dissolved organic matter (DOM), consequently facilitating the attenuation of .
The aforementioned studies primarily concentrate on natural aquifers, overlooking the aquifers influenced by human activities. Numerous coastal regions have constructed subsurface dams within aquifers to counteract seawater intrusion and safeguard subsurface freshwater resources (Chang et al., 2019; Ke et al., 2021; Sun et al., 2021). Subsurface dams are constructed through the injection of virtually impermeable materials into the aquifers (Abdoulhalik and Ahmed, 2017). These studies have indicated that the existence of subsurface dams hinders the hydraulic connectivity between upstream and downstream aquifers, resulting in alterations in the discharge pattern and flux of subsurface freshwater (Chang et al., 2019; Fang et al., 2023). Concurrently, prior research has primarily concentrated on examining the effects of subsurface dam construction on pollution in coastal aquifers. Lalehzari and Tabatabaei (2015) investigated a real aquifer and discovered that the implementation of subsurface dams not only decelerated the migration rate but also modified the shape of the contamination zone. Sun et al. (2019) conducted the initial investigation on how the height of subsurface dams, the distance between the subsurface dam and the seaside boundary, and the infiltration rate influence the distribution of in groundwater. Studies have also examined the effects of subsurface dams in combination with hydrogeologic conditions on . Fang et al. (2022a); (Fang et al., 2023) observed that the combined impact of tidal and subsurface dams led to a higher escalation of nitrate pollution than the sum of their individual effects.
While previous studies have partially elucidated the impacts of tidal or subsurface dams on solute transport processes in coastal aquifers, they have mostly considered conservative or reactive solutes, with limited investigations on the effects of subsurface dams and tides on variable-density solute transport processes in aquifers. To bridge this research gap, this study employs numerical simulations to investigate and assess the impacts of subsurface dam height and location on the transport of variable-density solute. These findings contribute to a deeper understanding of the interactions between natural and human factors in coastal aquifers and the adjacent marine environment. Moreover, they provide a scientific foundation for conducting environmental impact assessments of subsurface dam projects.
2 Methods
2.1 Governing equations
This study adopted SUTRA-MS, a variable-saturation, variable-density groundwater flow and multiple-species solute transport model (Hughes and Sanford, 2004), to investigate the effects of a subsurface dam on variable-density solute transport in an unconfined aquifer. The governing equation for variable-saturation, variable-density groundwater flow is given by:
where ϕ is the porosity [-]; ρ is the fluid density [ML-3]; SW is the water saturation [-]; t is the time [T]; K(ψ) is the hydraulic conductivity [LT-1], which depends on the capillary pressure head in the unsaturated zone and equals KS (saturated hydraulic conductivity [LT-1]) in the saturated zone; Φ is the hydraulic head [L] and Φ=p/ρg+z with p being the fluid pressure [ML-1T-2]; g is the magnitude of gravitational acceleration [LT-2] and z being the elevation [L]; Ci is the solute concentration [ML-3] of species i; NS is the number of dissolved species; QP is the fluid mass source [ML-3T-1]. Note that Equation 1 does not consider the sediment storativity, which is caused by the compressibility of water and solid matrix, or the additional source/sink term, which accounts for the effects of tidal loading (Reeves et al., 2000; Wilson and Gardner, 2006). The value of KS used in this study is more than 10-6 m s-1, which is in line with the criterion proposed by Xin et al. (2009) to avoid tidal load corrections by ignoring storage force. The governing equation for multi-species solute transport is shown below:
where D is the hydrodynamic dispersion tensor [L2T-1]; C* is the salt concentration of the fluid source [ML-3]. Equations 1 and 2 are linked by the Equation 3 below, which describes the relationship between fluid density and solute concentrations:
where ρ0 is the freshwater density [ML-3]; λi is the change rate [-] of fluid density as a function of the concentration of species i. In this study, there were two species (NS = 2): a solute in the saltwater and a land-sourced variable-density solute, of which the change rates were both set to 0.7143 (Shen et al., 2022).
The constitutive relationships between K(ψ), SW and ψ were described by the Van Genuchten (1980) functions shown in Equations 4a and 4b below:
where SWRES is the residual water saturation [-]; a [L-1] and n [-] are the Van Genuchten (1980) constants.
2.2 Model setup
The simulation area, as depicted in Figure 1, represents a 2-D coastal aquifer profile with a subsurface dam perpendicular to the shoreline. At the bottom of the aquifer (AF), a bedrock layer is assumed as the no-flow boundary. The inland side boundary (AB) is set as a constant freshwater flow boundary. With regard to the freshwater boundary inland of the aquifer, previous studies have generally used either a constant head boundary (Wang et al., 2023) or a constant flow boundary (Gao et al., 2023). Werner and Simmons (2009) found that using different boundary conditions (constant head or constant flow) had a large effect on the results. Therefore, changing the type of boundary condition, and constant head boundary condition may produce different results than those given in this study. The inland freshwater flow setting in this study was consistent with previous studies (Shen et al., 2019; Zhang et al., 2021) and was set at 2.1 m3 d-1. Since this study does not consider precipitation or evapotranspiration, the top boundary of the model (BC) is also set as a no-flow boundary. The seaward boundary EF symbolizes the partition of flow at the seawater extent within the domain, and is designated as a no-flow boundary. The intersection of the aquifer and seawater (CDE) is set as the pressure boundary, with a slope of 0.1 along the CD direction, and the pressure is determined by the tidal level. Tides are assumed to be semi-diurnal in sinusoidal form as expressed by Equation 5 below:
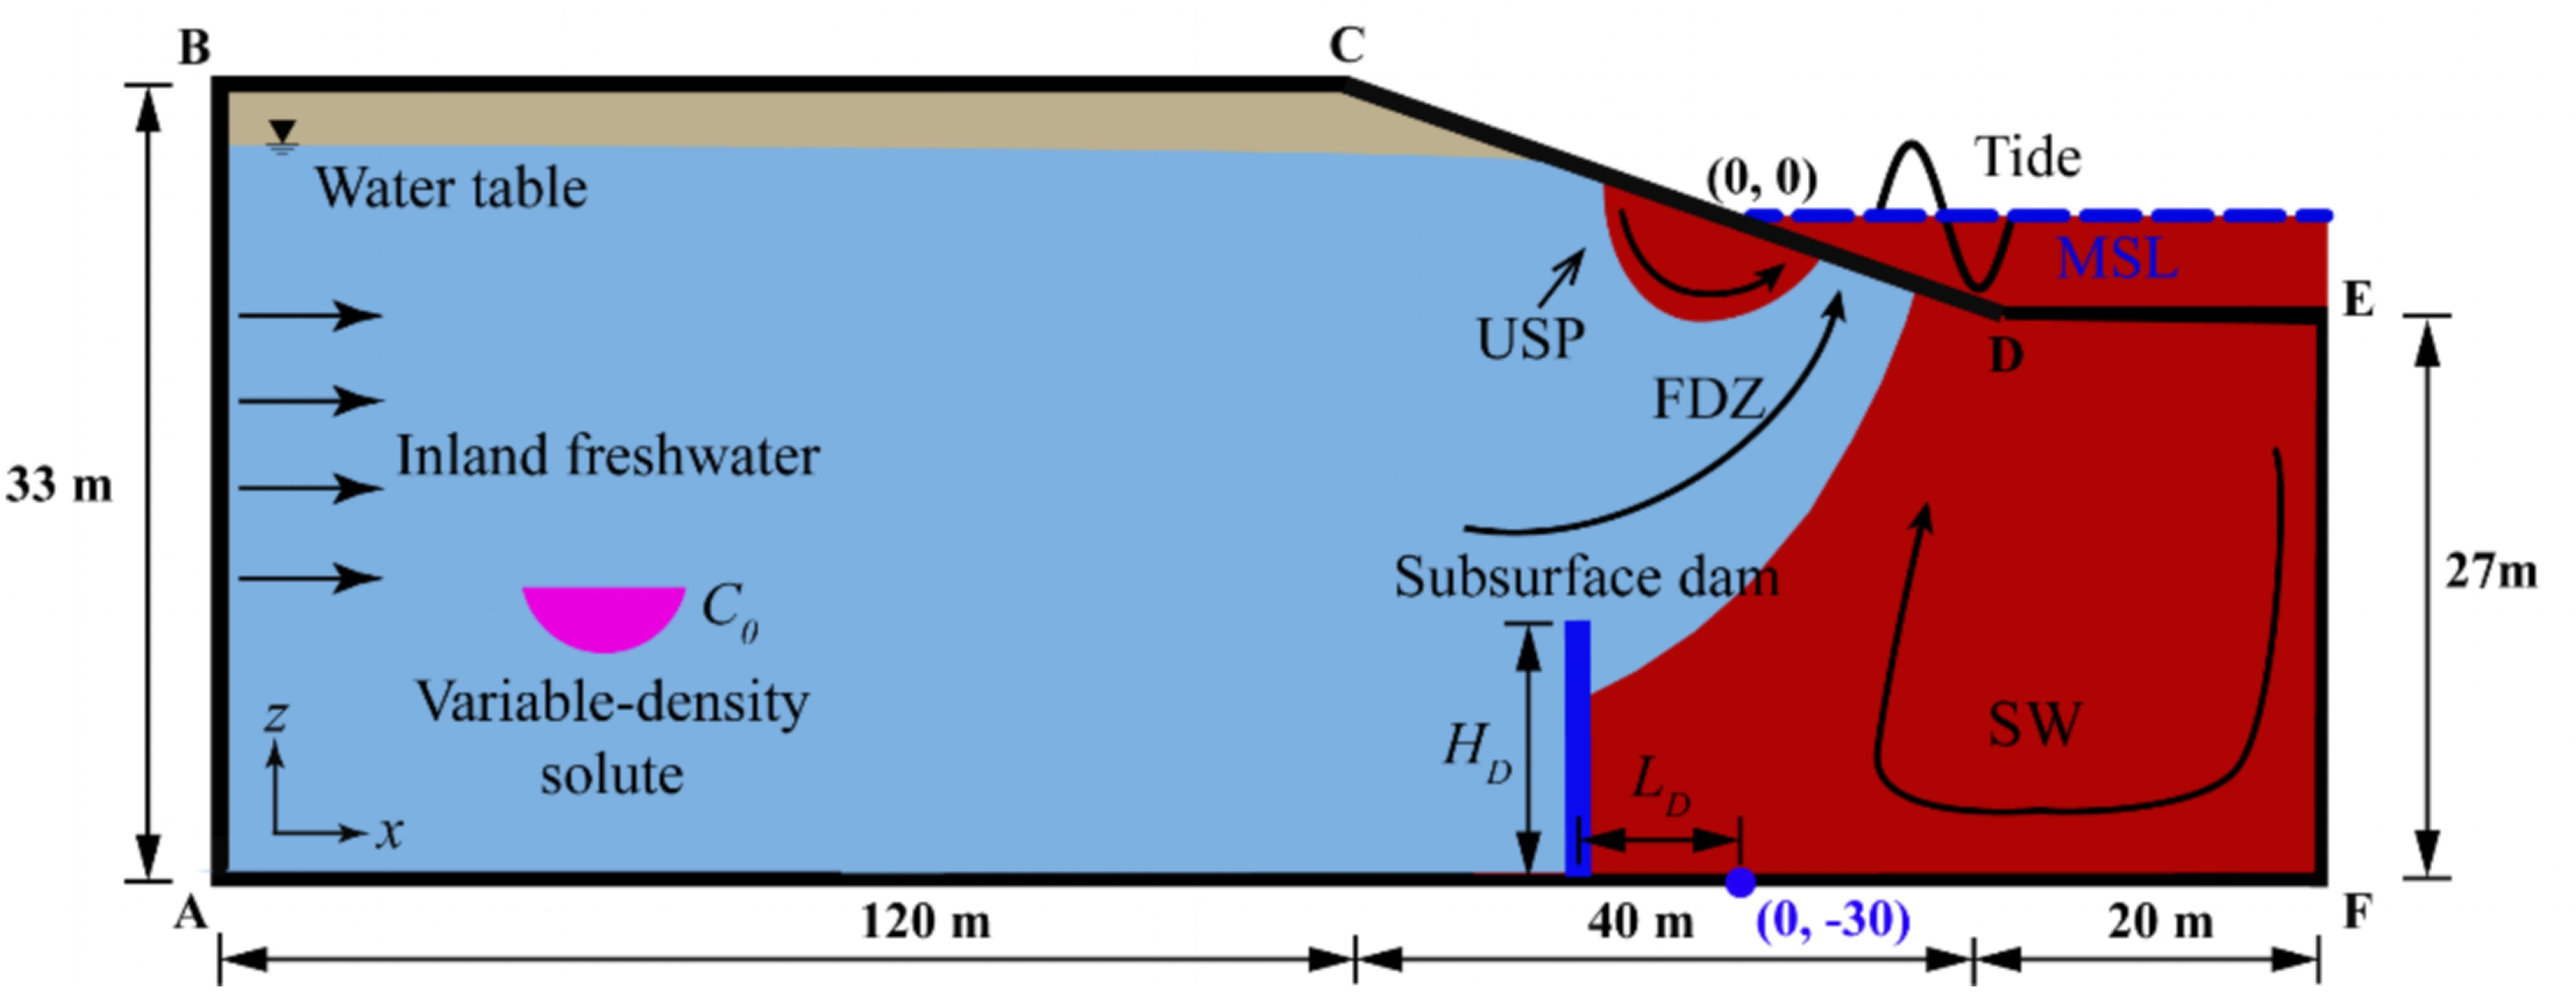
Figure 1 Schematic diagram of a 2-D cross-shore unconfined coastal aquifer with a subsurface dam. The designations USP, FDZ, and SW correspond to the upper saline plume, freshwater discharge zone, and saltwater wedge, respectively. The coordinates of boundary nodes are A (-150 m, -30 m), B (-150 m, 3 m), C (-30 m, 3 m), D (30 m, -3 m), E (50 m, 3 m), and F (50 m, -30 m). The black lines with arrows represent the direction of flow in USP, FDZ and SW. MSL represents the mean sea level. Note that rainfall and evaporation were excluded in this study.
where H(t) is the tidal level [L] varying with time t [T]; HMSL is the mean sea level (MSL) [L] (set as 0 m); A is the tidal amplitude [L]; and ω is the angular frequency [T-1] and ω=2π/T, with T being the tidal period [T] and set as 12 hours.
During falling tide, a seepage face was permitted to form above the tidal elevation, following the approach suggested by Wilson and Gardner (2006) and Xin et al. (2010). In this method: (1) if the exposed boundary nodes were saturated in the last time step, they were designated as seepage face nodes and subjected to atmospheric pressure, (2) if the boundary nodes above the tidal level were unsaturated in the previous time step, they were set as non-flowing. Consequently, regarding salt transport, nodes with inflow to the beach aquifer were assigned a seawater concentration (35 ppt), while nodes with outflow from the beach aquifer had a zero-concentration gradient.
2.3 Model parameters and simulations
This study initially examines two distinct situations: a homogeneous aquifer (Case-H) and an aquifer containing a subsurface dam (Case-D). In Case-H, the saturated hydraulic conductivity (KS) of the aquifer is defined as 1.16 × 10⁻⁴ m s-1, this value was previously used by Vandenbohede and Lebbe (2006) in numerical investigations based on field measurements. In Case-D, the permeability coefficient of the subsurface dam is significantly lower than that of the aquifer medium, differing by a factor of nine orders of magnitude (1.16 × 10⁻¹³ m s-1). This makes the subsurface dam nearly impervious to water. Height of the subsurface dam (HD) is 15 m, approximately half the height of the aquifer, while the its thickness is set at 1 m. Regarding the placement of the subsurface dam, its position was established relative to the x = 0 m distance (LD) from the right-hand boundary, with the positive direction oriented towards the landward boundary. In Case-D, the right-hand boundary of subsurface dam aligns precisely with x = 0 m, signifying a distance of 0 m. Furthermore, leveraging Case-D as a foundation, alterations to its location and height were introduced to comprehensively investigate the impacts of LD and HD on the transport dynamics of variable-density solute within the aquifer. Considering the height variation of the subsurface dam, it is essential that the dam is not too low to effectively block seawater. Additionally, an overflow channel is necessary for freshwater to flow over the dam. The placement of the subsurface dam must be strategically considered: if too close to the sea, seawater can overflow the dam; if too far, the dam fails to effectively block seawater. Therefore, we tried to select the suitable range of LD and HD. The parameters for sensitivity analysis of the operational conditions are displayed in Table 1.
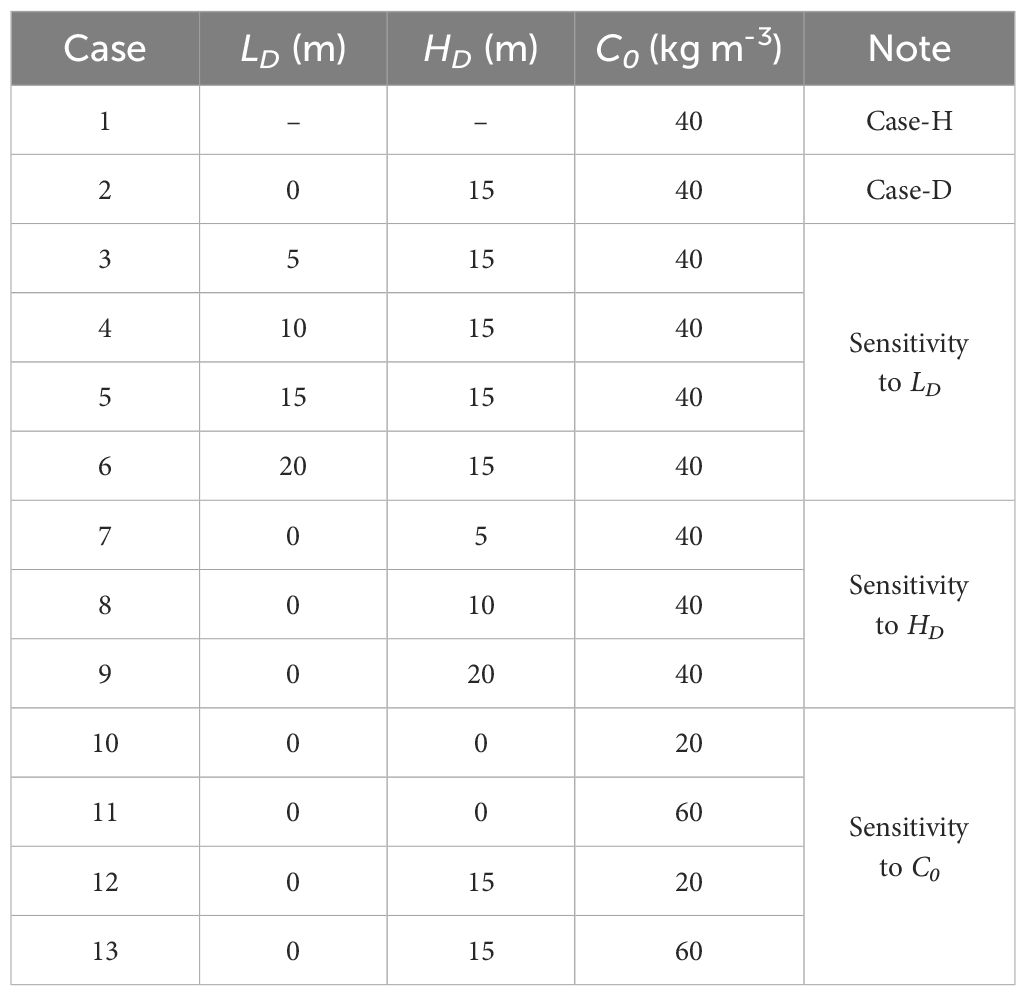
Table 1 Parameter values altered in sensitivity analysis.
Regarding the remaining hydraulic parameters, the same values were employed for both the aquifer and the subsurface dam, except for porosity. For example, the longitudinal (αL = 0.5 m) and transverse (αT = 0.05 m) dispersivity were applied. The porosity was consistently set at 0.45 for both Case-H and Case-D, while the porosity of subsurface dam was defined as 0.0001 solely for Case-D. The SWRES parameter was established as 0.1, and the constants a and n within the Van Genuchten (1980) function were designated as 2.68 and 14.5 m-1, respectively. These parameter settings are consistent with earlier studies on the movement of groundwater and the spreading of salt (Shen et al., 2019; Zhang et al., 2021). Given that the aforementioned three parameters primarily depict the unsaturated zone situated at the upper part of the aquifer in this study, the values of these parameters for the subsurface dam do not influence the outcomes. For more comprehensive insight into parameter values, readers are encouraged to consult Tables 1 and 2.
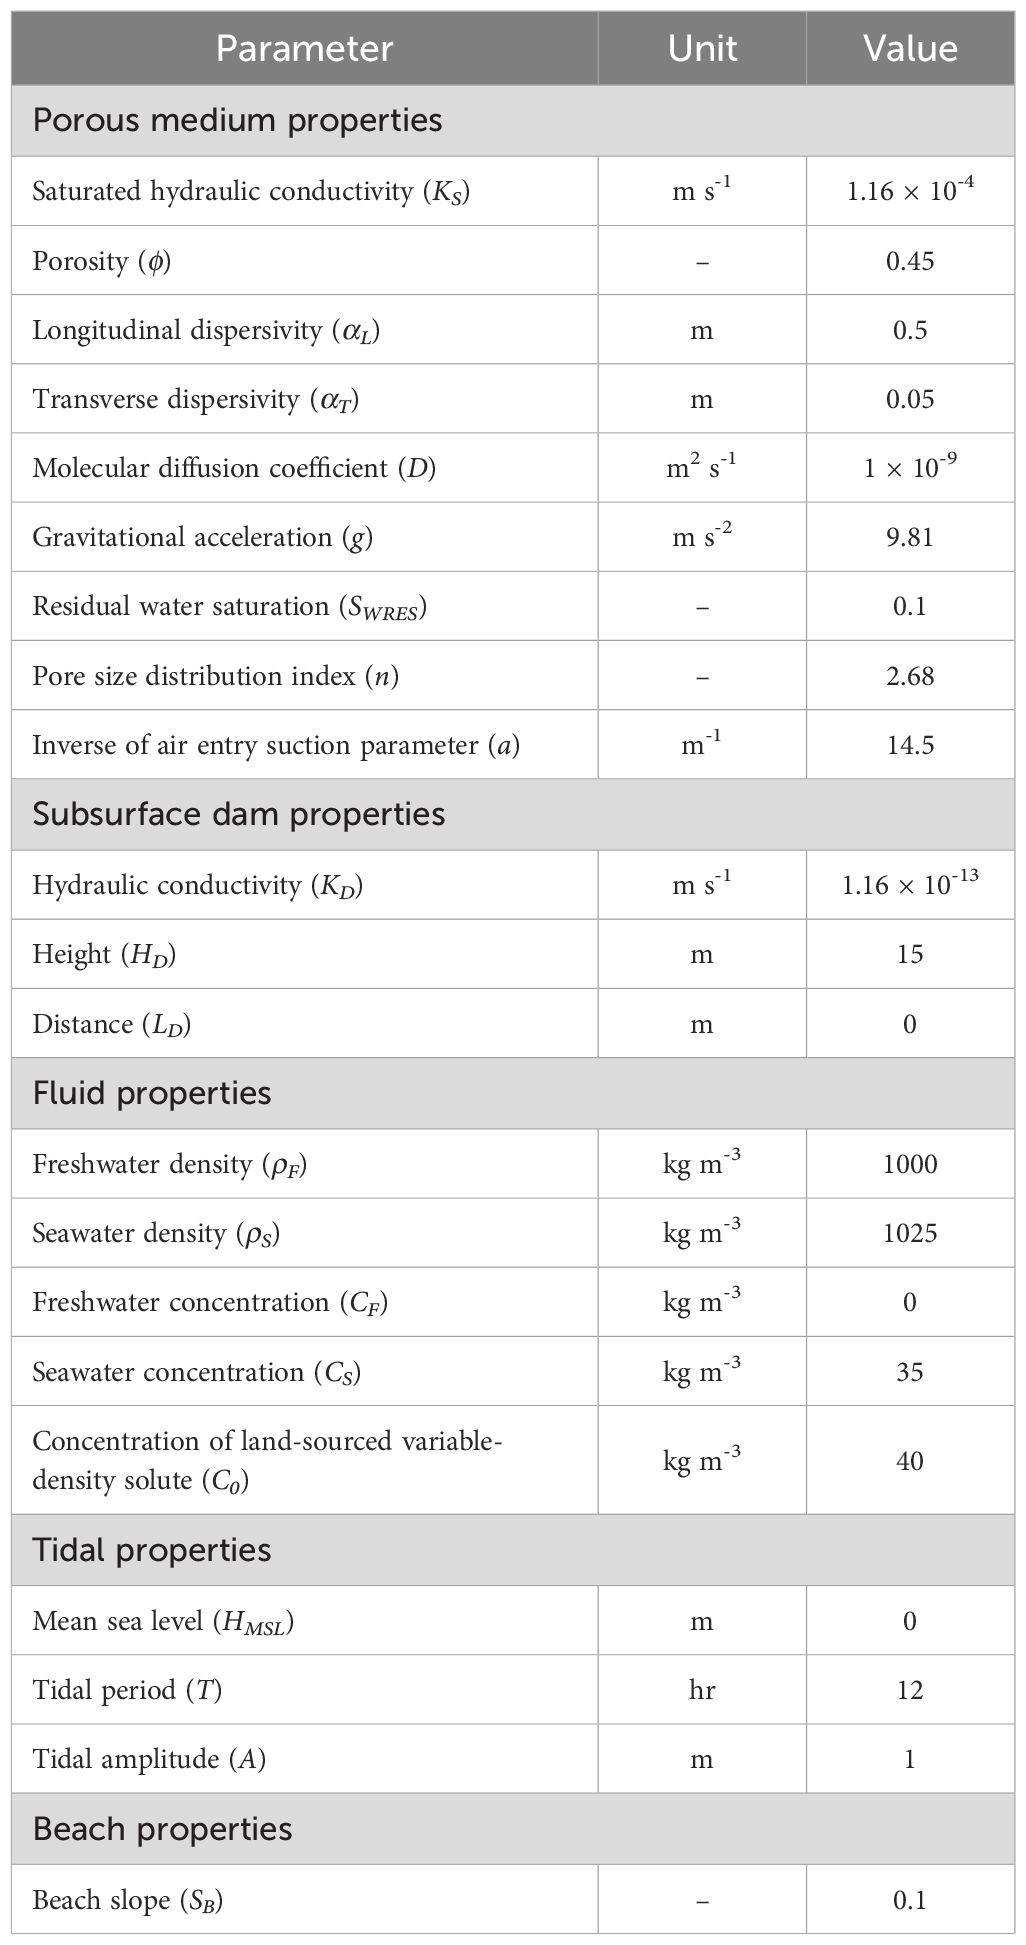
Table 2 Model parameters used in the current study.
In this study, the numerical model was initially run to achieve a steady state for each situation, excluding tidal effects. Subsequently, tidal fluctuations were introduced, and the model was then extended to attain a quasi-steady state. Once quasi-steady state conditions were achieved, which included stable flow patterns and consistent salinity distributions, a land source of variable-density solute was introduced into the model. This study relies on the findings of Bakhtyar et al. (2013) investigation into the transport characteristics of solutes with variable density in a coastal aquifer and also utilizes solute attributes that correspond to the salinity-density correlation. Within this article, the variable-density solute is positioned within the lower semicircular region, characterized by a radius of 2 m. Notably, the center of this semicircle is located at coordinates x = -120 m and z = -20 m (Figure 1). The land-sourced solute setup is given only an initial concentration (C0) of 40 kg m-3 and no further concentrations are given after the start of the simulation. This methodology for solute release has been applied in numerous studies, ensuring that the mass of solute released within the model remains unaffected by either inland or seaward boundary conditions (Shen et al., 2019; Zhang et al., 2021; Wu et al., 2022). As a result of this setup, the released solute mass within the model remains unaffected by either inland or seaward boundary conditions. Additionally, the concentration of the variable-density solute was systematically altered, enabling sensitivity analyses to investigate the impact of solute concentration on solute transport outcomes. The specific parameter values employed for this purpose are detailed in Table 1. To eliminate potential confusion, it is emphasized that the subsequent mentions of solute plumes specifically pertain to those originating from variable-density solutes (Specifically, the term “variable density solutes” refers to solutes other than salts that display different densities).
For all the simulations, the model was run with a time step of 240 seconds. The same mesh discretization with 20,301 nodes and 20,000 elements was used in all cases. Such discretization was determined based on the stability criterion of grid Péclet number Pe ≈ ΔL/αL ≤ 4 for avoiding numerical oscillations (Hughes and Sanford, 2004), where ΔL is the transport distance [L] between two sides of an element along the groundwater flow direction, and αL is the longitudinal dispersivity [L]. In the mesh discretization, the maximum grid Péclet number was 2, meeting the stability criterion. Grid-independence assessments were carried out to evaluate the impact of mesh resolution on the simulation outcomes for both Case-H and Case-D. We compared the hydraulic head and salt distributions in the beach aquifer, and the boundary fluxes for two grid resolutions: 15,251 nodes and 40,501 nodes. The results in the two resolutions were found to be virtually identical, which ensured that the results presented in this paper are converged numerical solutions of sufficient accuracy.
2.4 Metrics for solute migration
This paper employs the approach introduced by Freyberg (1986) to compute spatial moments for quantifying solute transport release attributes. The solute plume mass, center of mass (xc, zc), and variance (, ) can be derived from the zeroth-order (M00), first-order (M10, M01), and second-order (M20, M02) spatial moments of solute concentration. The center of mass indicates the path of the solute plume, while the variance illustrates the spreading magnitude of the solute plume along the horizontal (x) and vertical (z) axes, respectively. The expressions of these spatial moments are given as Equations 6a–6e below:
We define two key temporal parameters: the starting time of release (Tsta) and the residence time (Tres). Tsta refers to the point at which the solute begins to exit the aquifer, while Tres indicates the duration from initial introduction into the aquifer until its complete departure.
3 Results and discussions
3.1 Spatiotemporal variation of the solute plume
Figure 2 illustrates the salinity distribution, flow field, and solute migration paths for Case-H and Case-D, denoting the flow field with arrows, the color of which corresponds to the flow velocity. From Figures 2A and B, we discern the role of the subsurface dam in obstructing saline intrusion, thereby reducing the extent of the saltwater wedge. These findings align with previous research examining the impact of subsurface dams on aquifer salinity distribution (Chang et al., 2019; Fang et al., 2023; Yin et al., 2023). In a comparison of flow fields, the flow velocity in the saltwater wedge area, which comes into contact with the subsurface dam in Case-D, exceeds that in the saltwater wedge of Case-H.
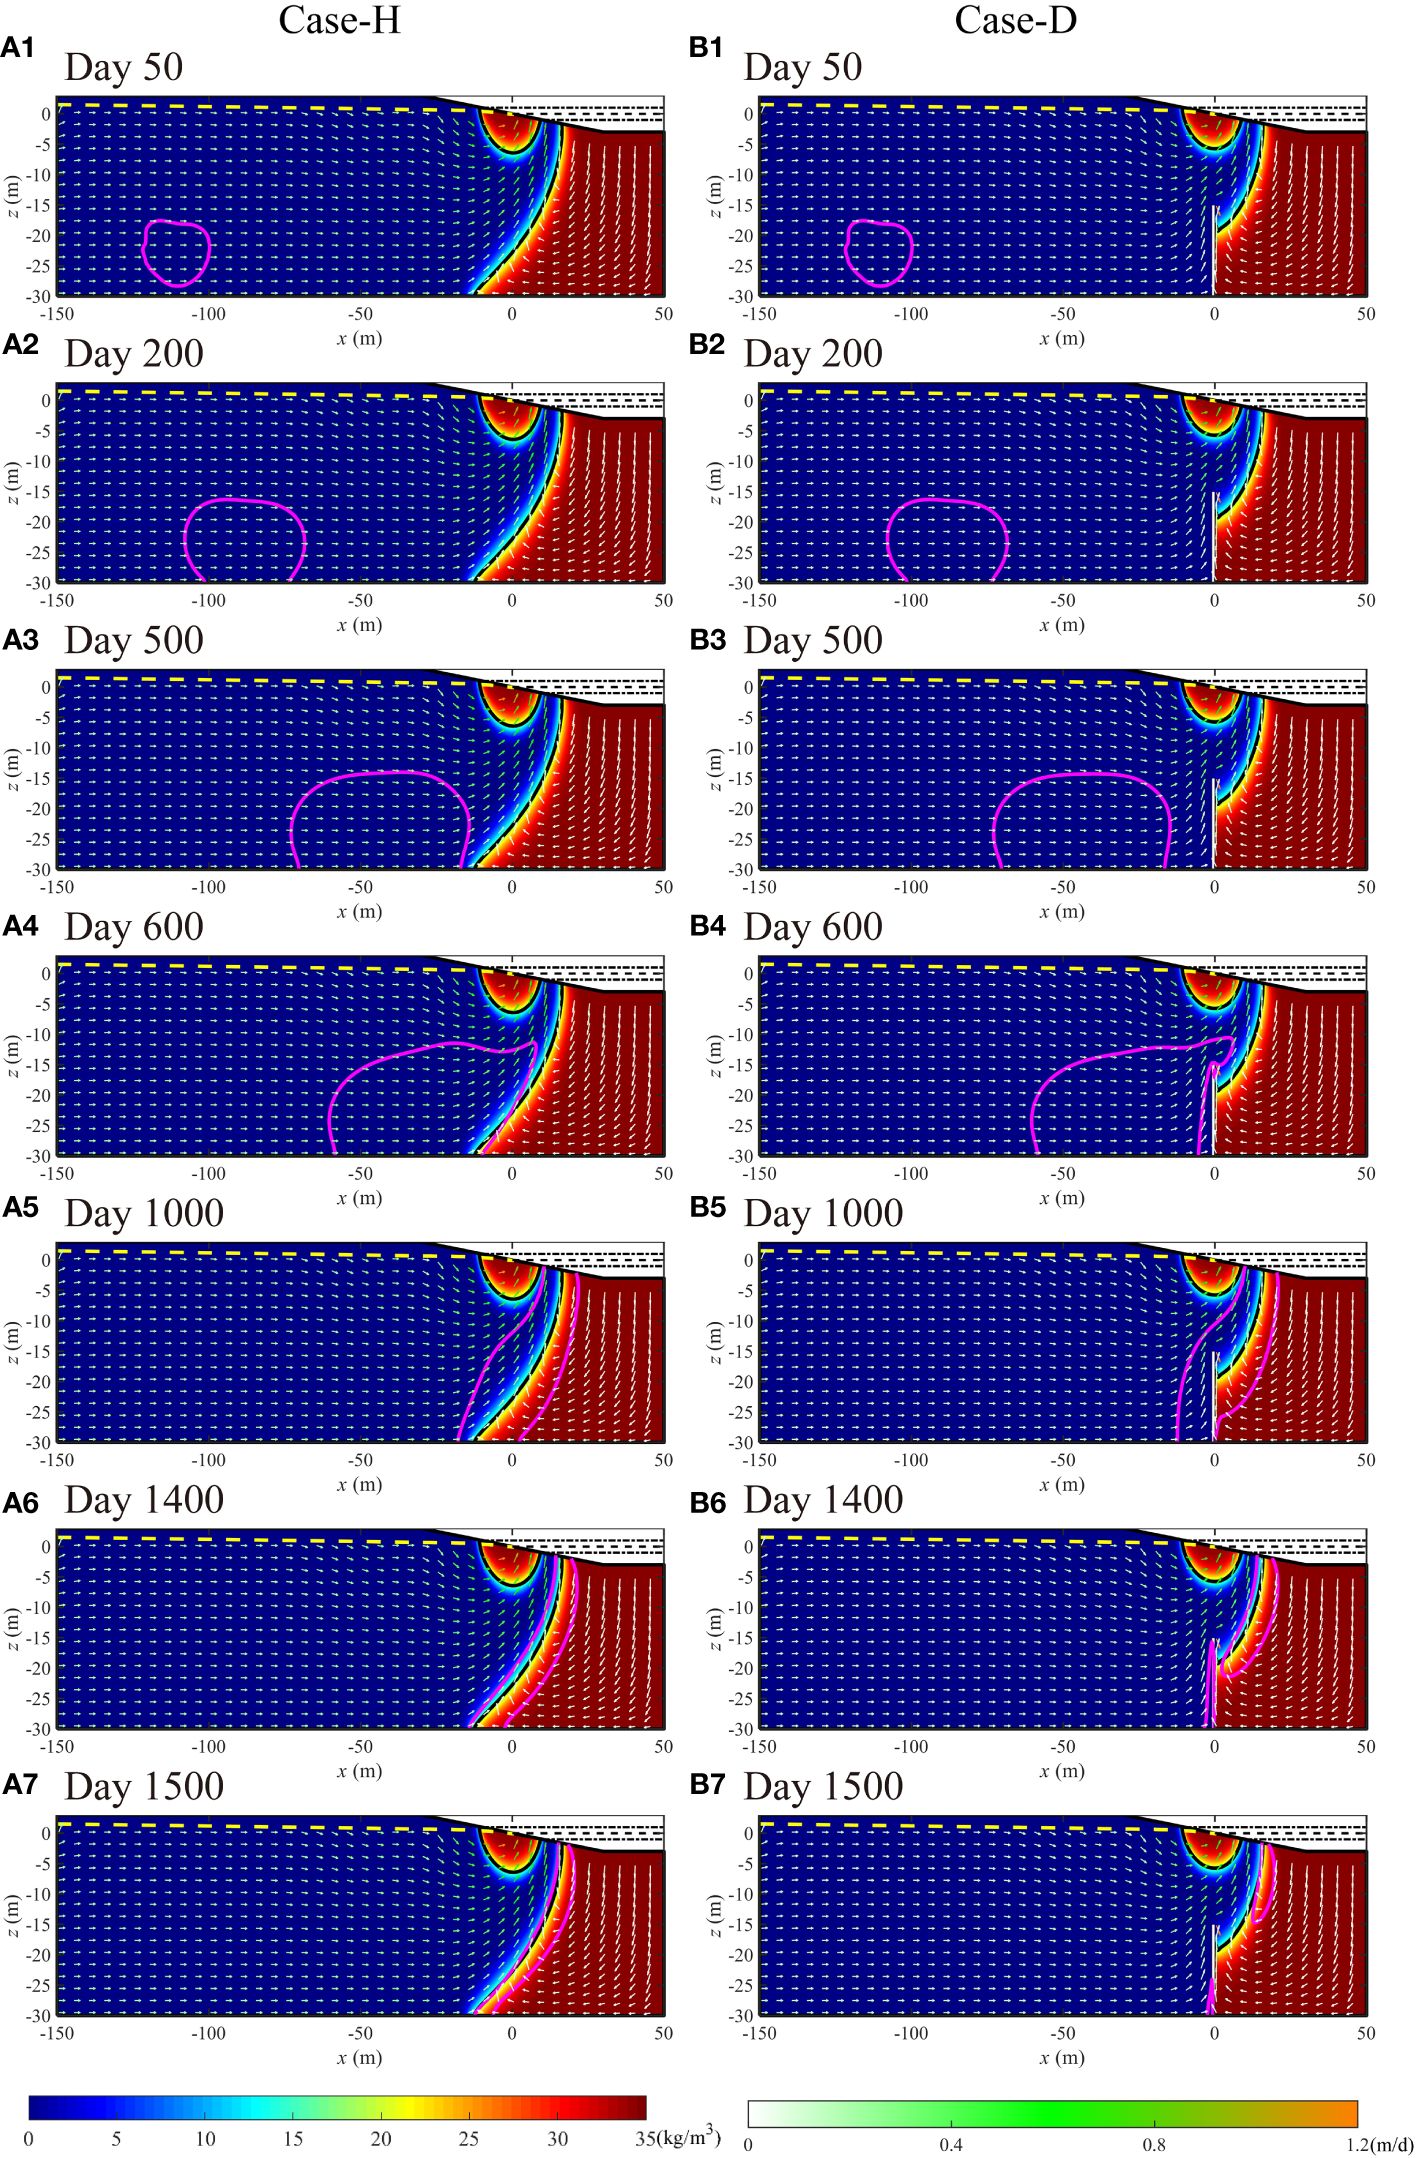
Figure 2 The time-dependent and spatial changes of the variable-density solute plume (depicted as a magenta solid line, with a contour interval of 0.0001C0) are presented for Case-H (A1–A7) and Case-D (B1–B7). Contour-filled diagrams depict the distribution of salinity, while solid black lines delineate contours of 0.5CS (17.5 ppt). The magnitude of the flow velocity in the flow field is represented by the color of the arrow, while the direction of the flow is indicated by the orientation of the arrow. Rectangular regions coloured in white represent subsurface dams, while yellow dashed lines denote groundwater levels. All the plots show conditions at rising mid-tide, and the white vectors represent the normalized instantaneous flow field at the time of these plots.
Figures 2A and B illustrate that within the initial 500-day period (before the solute plume reaches the subsurface dam), the variable-density solute descends in the force of gravity post-emission within the aquifer until it contacts the aquifer base. Despite similar trajectories and diffusion patterns between both Case-H and Case-D in the early stages, characterized by omnidirectional diffusion as a result of density effects and a seaward movement in the push of inland freshwater, the situations diverge post the 600-day mark [Figures 2(a4–a7), (b4–b7)]. In Case-H, the solute plume extends along the edge of the saltwater wedge and distributed across the freshwater-saltwater interface of saltwater wedge before eventually exiting the aquifer as a solute mass. Conversely, in Case-D, interference from the subsurface dam alters the solute plume shape and the solute plume splits into two parts during the outflow from the aquifer, with one portion located on the left of the dam and the other along the edge of the saltwater wedge, which results in a distinct solute discharge compared to Case-H. The discharge of the solute plume, located at the saltwater wedge boundary, mirrors the pattern observed in Case-H; it flows out as a solute mass along the freshwater-saltwater interface of the saltwater wedge. In contrast, the segment adjacent to the left of subsurface dam presents a marked deviation. The discharge procedure entails the following: the solute plume, impeded on the left of subsurface dam, cannot exit. Ongoing erosion of the solute plume periphery by the current facilitates its continual reduction, culminating in its complete discharge.
3.2 Retention time and spatial distance of the solute plume
The start time for the variable-density solute plume to exit the aquifer is not influenced by the subsurface dam, as evidenced in both Case-H and Case-D (Figure 3A). However, the rate of reduction in the solute plume residual mass fraction within the aquifer is slightly quicker in Case-H than in Case-D in the initial phase (Figure 3B). This suggests a retardation of solute plume egress by the subsurface dam. When considering overall residence time, the presence of the subsurface dam diminishes the solute plume residence time, elucidated further by Figure 2. Comparisons between Figures 2(a6, a7) and (b6–b7) show that the disappearance speed of the solute plume located on the left of subsurface dam in Case-D outpaces that of the solute plume at the saltwater wedge edge in Case-H. This anomaly is linked to the slower flow velocity in the saltwater wedge bottom in Case-H, relative to the left side of the subsurface dam in Case-D. In summary, the subsurface dam restricts the movement of variable-density solutes. Nevertheless, the diminished size of the saltwater wedge, consequent to the subsurface dam, reduces the area of low flow velocity, thereby shortening the duration of time. The residency period of the solute plume in the aquifer is co-regulated by both the subsurface dam and the saltwater wedge.
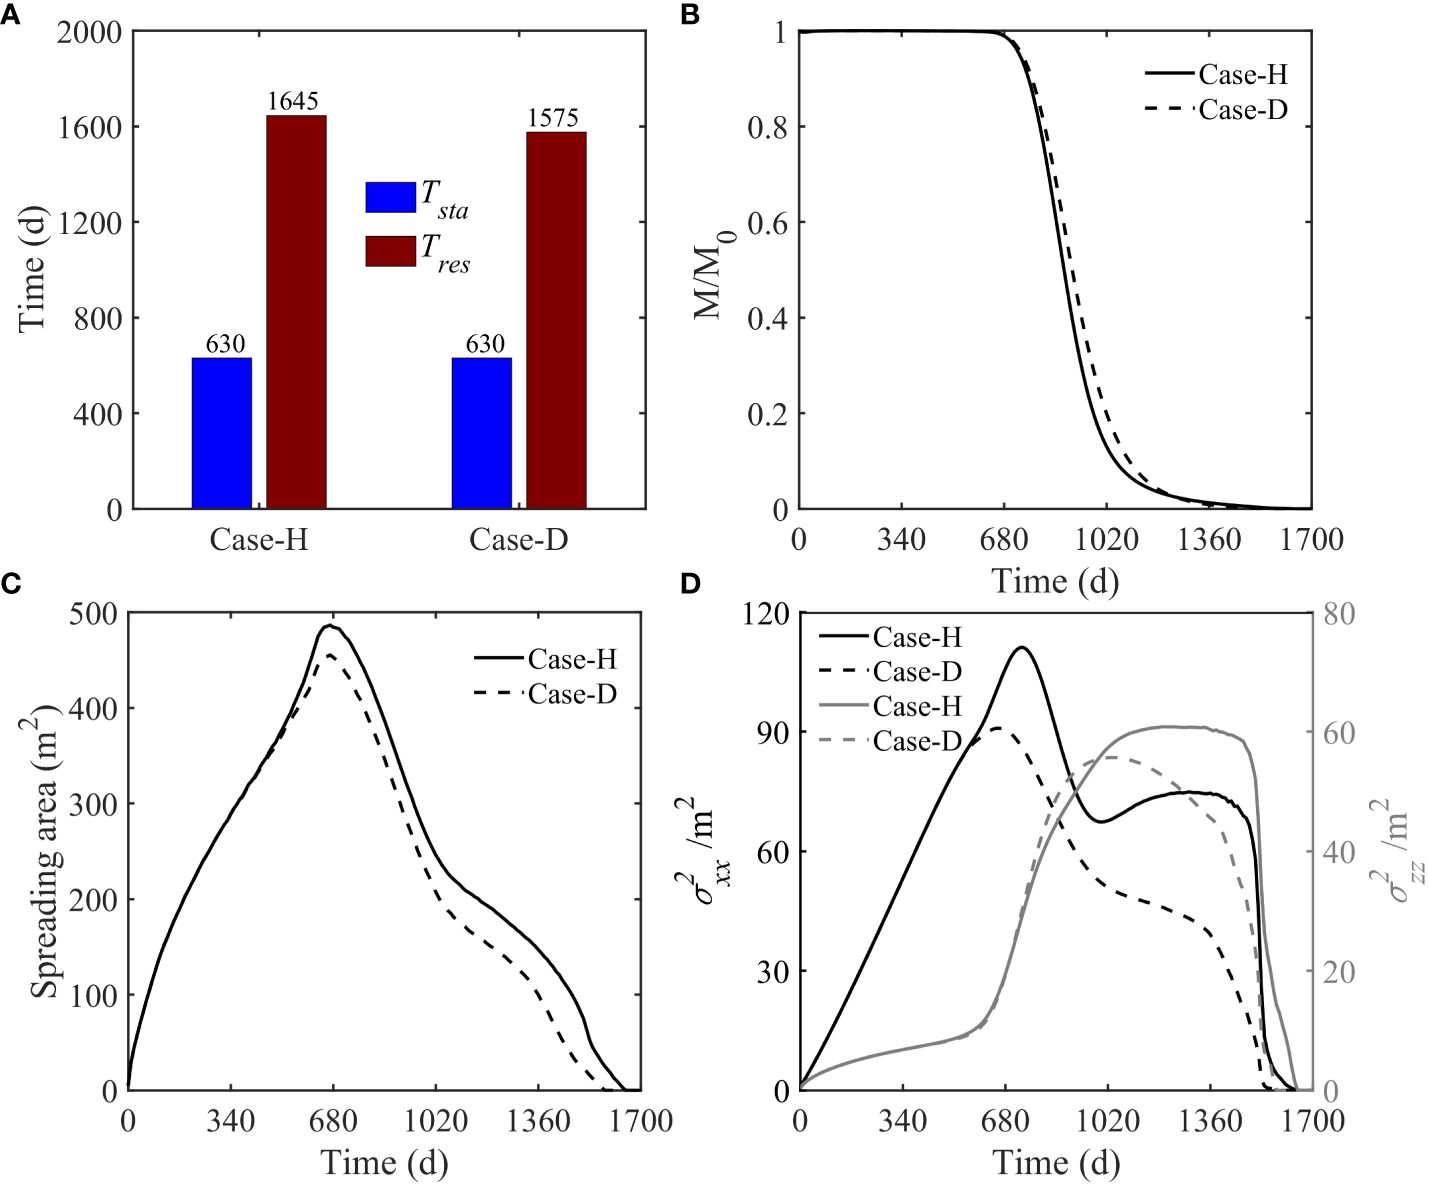
Figure 3 Comparison of (A) starting time of release and residence time for variable-density solute plumes, (B) time-dependent, normalized amount of solute mass (M/M0) remaining in the beach aquifer, (C) plume spreading area and (D) horizontal (left y-axis) and vertical (right y-axis) variance between Case-H and Case-D. The boundary of the plume was identified using the concentration threshold of 0.0001C0.
Assessing alterations in the spreading area (Figure 3C) reveals considerable inhibition by the subsurface dam of solute diffusion. Beyond a span of 600 days, the spreading area remains consistently smaller in Case-D compared to Case-H. Both Case-H and Case-D exhibit an initial surge followed by a decline in the variances across horizontal and vertical vectors (Figure 3D). Interestingly, vertical variance sporadically in Case-D surpasses that in Case-H, suggesting a slight facilitation of vertical spreading by the subsurface dam. To conclude, the subsurface dam primarily curtails the horizontal spreading of the solute plume, with a lesser impact on the vertical spreading, inherently underscoring its role as a vertical barrier.
3.3 Dynamic spatial distribution of solute mass
As derived from the prior analysis, the saltwater wedge significantly influences the solute plume residence time, prompting us to measure the solute mass that enters the saltwater region. In both scenarios, the mass of the variable-density solute in freshwater region displays a horizontal phase (before the solute exits the aquifer), succeeded by a progressive decline (Figure 4). Concerning the solute mass in the saltwater region, the peak in Case-D, at 39.21 kg comprising 40.96% of the initial total mass, is roughly twice that in Case-H, which is 18.96 kg. From a temporal perspective, the peak in Case-D occurs later than in Case-H. These phenomena primarily arise from changes in the salinity distribution of the aquifer induced by the subsurface dam, leading to a reduced saltwater wedge area. In Case-D, when the mass of solutes in the saltwater region reaches its maximum, a significant proportion (47.92%) of the solutes has exited the aquifer, which is much larger than that in Case-H (26.98%). The influence of subsurface dams on variable-density solutes within the aquifer is demonstrated through their capacity to diminish the influx of solutes into the saltwater region. This reduction facilitates the exit of a greater quantity of solutes via the freshwater zone, thereby decreasing their residence time in the aquifer.
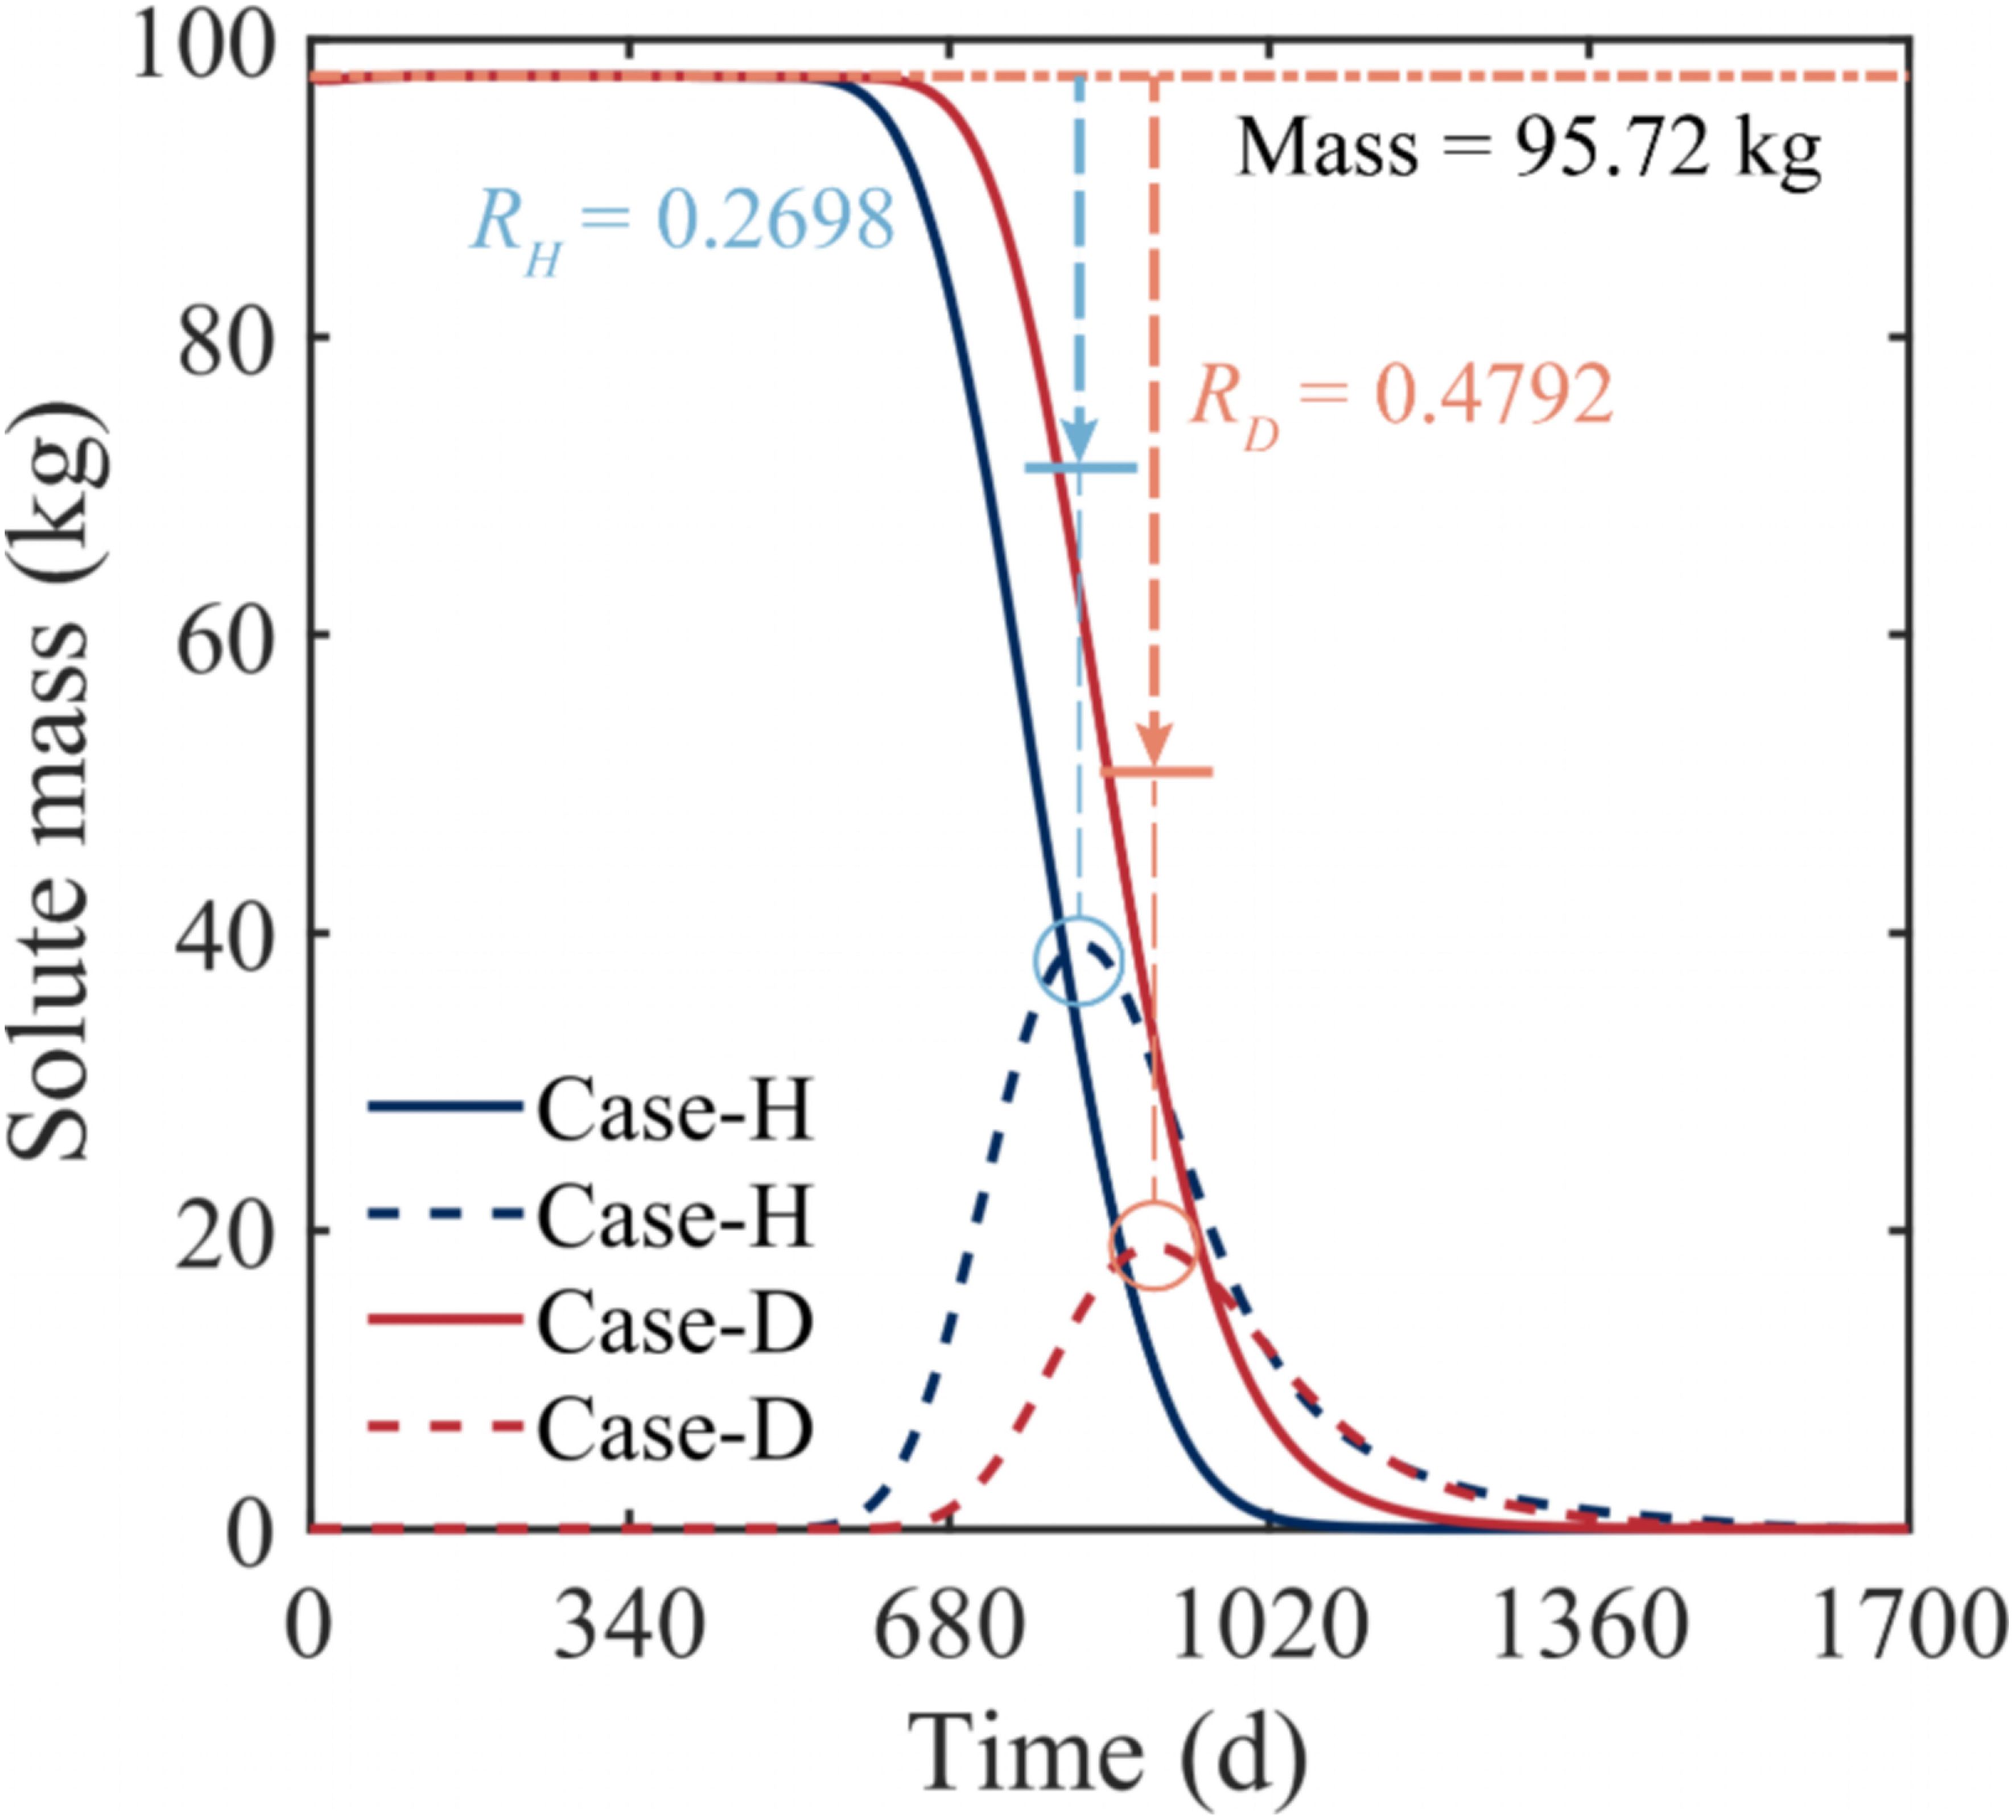
Figure 4 Comparison of temporal changes of solute mass in the freshwater region (solid line) and the saltwater region (dashed line), demarcated by 0.05CS, in the aquifer of Case-H and Case-D. The horizontal dotted line represents the initial total mass (Mass = 95.72 kg) released in the aquifer. RH and RD respectively represent the proportion of the solute mass that has already left the aquifer to the initial total mass when the solute mass in the saltwater region reaches its maximum value in Case-H and Case-D.
3.4 Spatial and temporal variation of solute plume fluxes
In both scenarios, temporal changes in solute outflow across the aquifer-ocean interface (Figure 1 CDE) display similar unimodal patterns (Figure 5A). However, differences still exist. During the initial stage of solute transport (approximately the first 1,000 days), the release volume from Case-D is lesser than that from Case-H, aligning with previous results seen in Figure 3B. The presence of the subsurface dam diminishes not only the peak value of solute flux but also delays the occurrence of the peak. As for the phenomenon where the flux from Case-D surpasses that from Case-H during the solute discharge later stages (commencing around day 920), this is corroborated by the analysis in Figure 4. In Case-D, day 920 precisely corresponds to the time when the solute reaches its maximum value in the saltwater zone. Meanwhile, only a minuscule amount of solute mass, 7.29 kg, remains in the freshwater zone of Case-H. Thus, the solute release in Case-H is primarily dependent on its saltwater zone. In contrast, both the freshwater (25.7 kg, approximately 26.84% of the total solute) and saltwater zones (18.58 kg) of Case-D are abundant in solutes, resulting in Case-D surpassing Case-H in speed during the later stages.
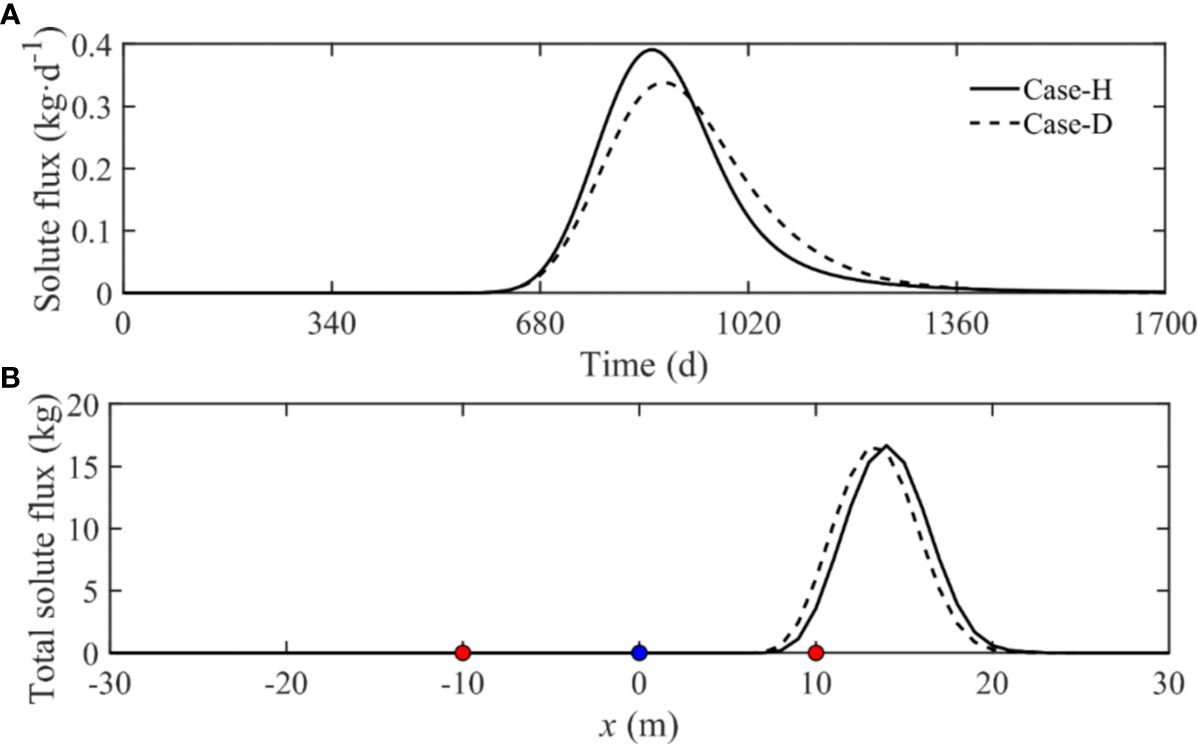
Figure 5 Comparison of (A) time-dependent total solute efflux and (B) spatial distribution of net solute efflux across the aquifer-ocean interface (CDE in Figure 1) between Case-H and Case-D. The blue node represents the mean shoreline, while the red nodes represent the high-tide (left) and low-tide (right) mark of Case-H and Case-D.
Regarding the spatial distribution of solute flux (Figure 5B), the emission interval for both scenarios remains below the mean tidal level, with nearly identical maximum spatial release fluxes. Previous results concerning the temporal shifts in solute flux indicate that the peak release in Case-D is less than in Case-H. Nevertheless, in spatial distribution, the peaks nearly align. The total emission interval of the solute across the aquifer-ocean interface slightly differs, with Case-D presenting a minor shift towards the high tidal direction. These observations suggest that the solute release intervals across the aquifer-ocean interface in both Case-H and Case-D are relatively stable.
Upon further analysis of the solute outflow spatial distribution at different times (Figure 6), it became apparent that the intervals of solute discharge across the aquifer-ocean interface remain fairly consistent for both Case-H and Case-D, primarily located between the upper saline plume and saltwater wedge. An examination of the changes in xH and xD revealed that the peak values of the solute outflow curves for both cases shift progressively in the positive x-axis direction. They eventually approximate the horizontal coordinate at the intersection between the 50% salinity line of the saltwater wedge and the aquifer-ocean interface (x = 15.83 m and 16.34 m). This finding aligns with the results depicted in Figure 2, indicating that the solute, upon outflow, ultimately congregates near the saltwater-freshwater mixing zone. The spatial distribution of solute outflow across various times, along with the overall spatial distribution of solute flux, exhibit analogous patterns. Compared to Case-H, the discharge interval for Case-D marginally shifts towards the direction of high tide. As seen in Figure 7, in the influence of the subsurface dam, Case-D alters the salinity distribution within the aquifer, generates a jacking effect on the USP, marginally reduces the size of the USP, and concurrently shifts the saltwater-freshwater mixing zone towards the land. These changes account for the variations in the spatial distribution of the solute flux between Case-H and Case-D.
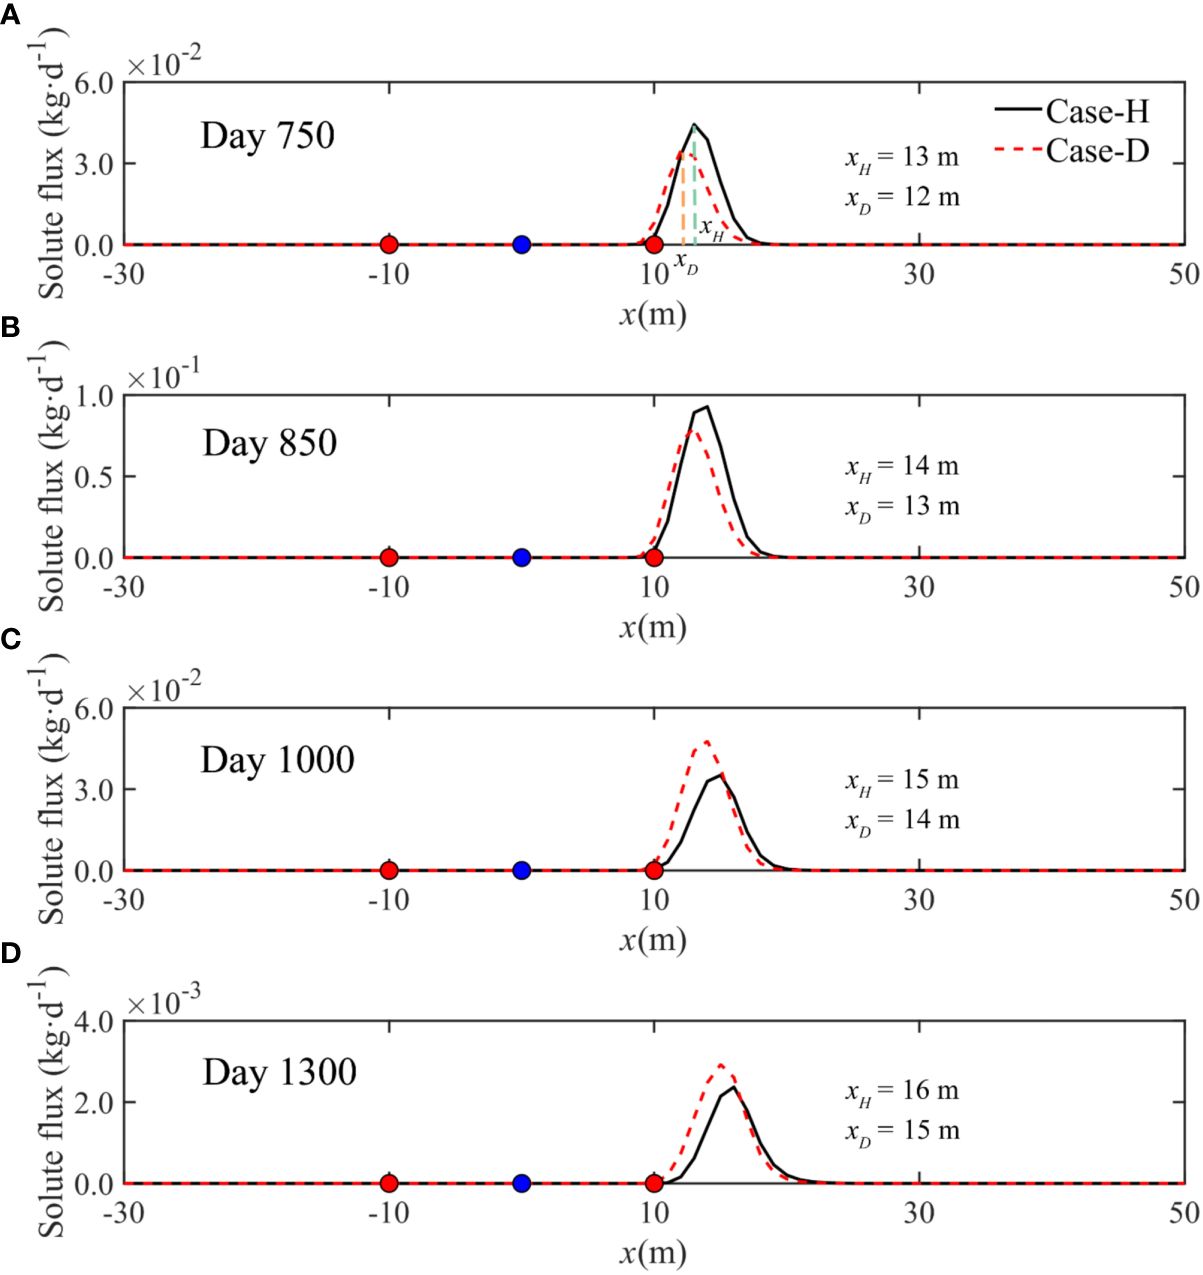
Figure 6 Temporal variations of daily integrated solute effluxes across the aquifer-ocean interface (CDE in Figure 1) between Case-H and Case-D. xH and xD represent the abscissa of the maximum integrated solute efflux across the aquifer-ocean interface for Case-H and Case-D, respectively. The blue node represents the mean shoreline, while the red nodes represent the high-tide (left) and low-tide (right) mark of Case-H and Case-D.
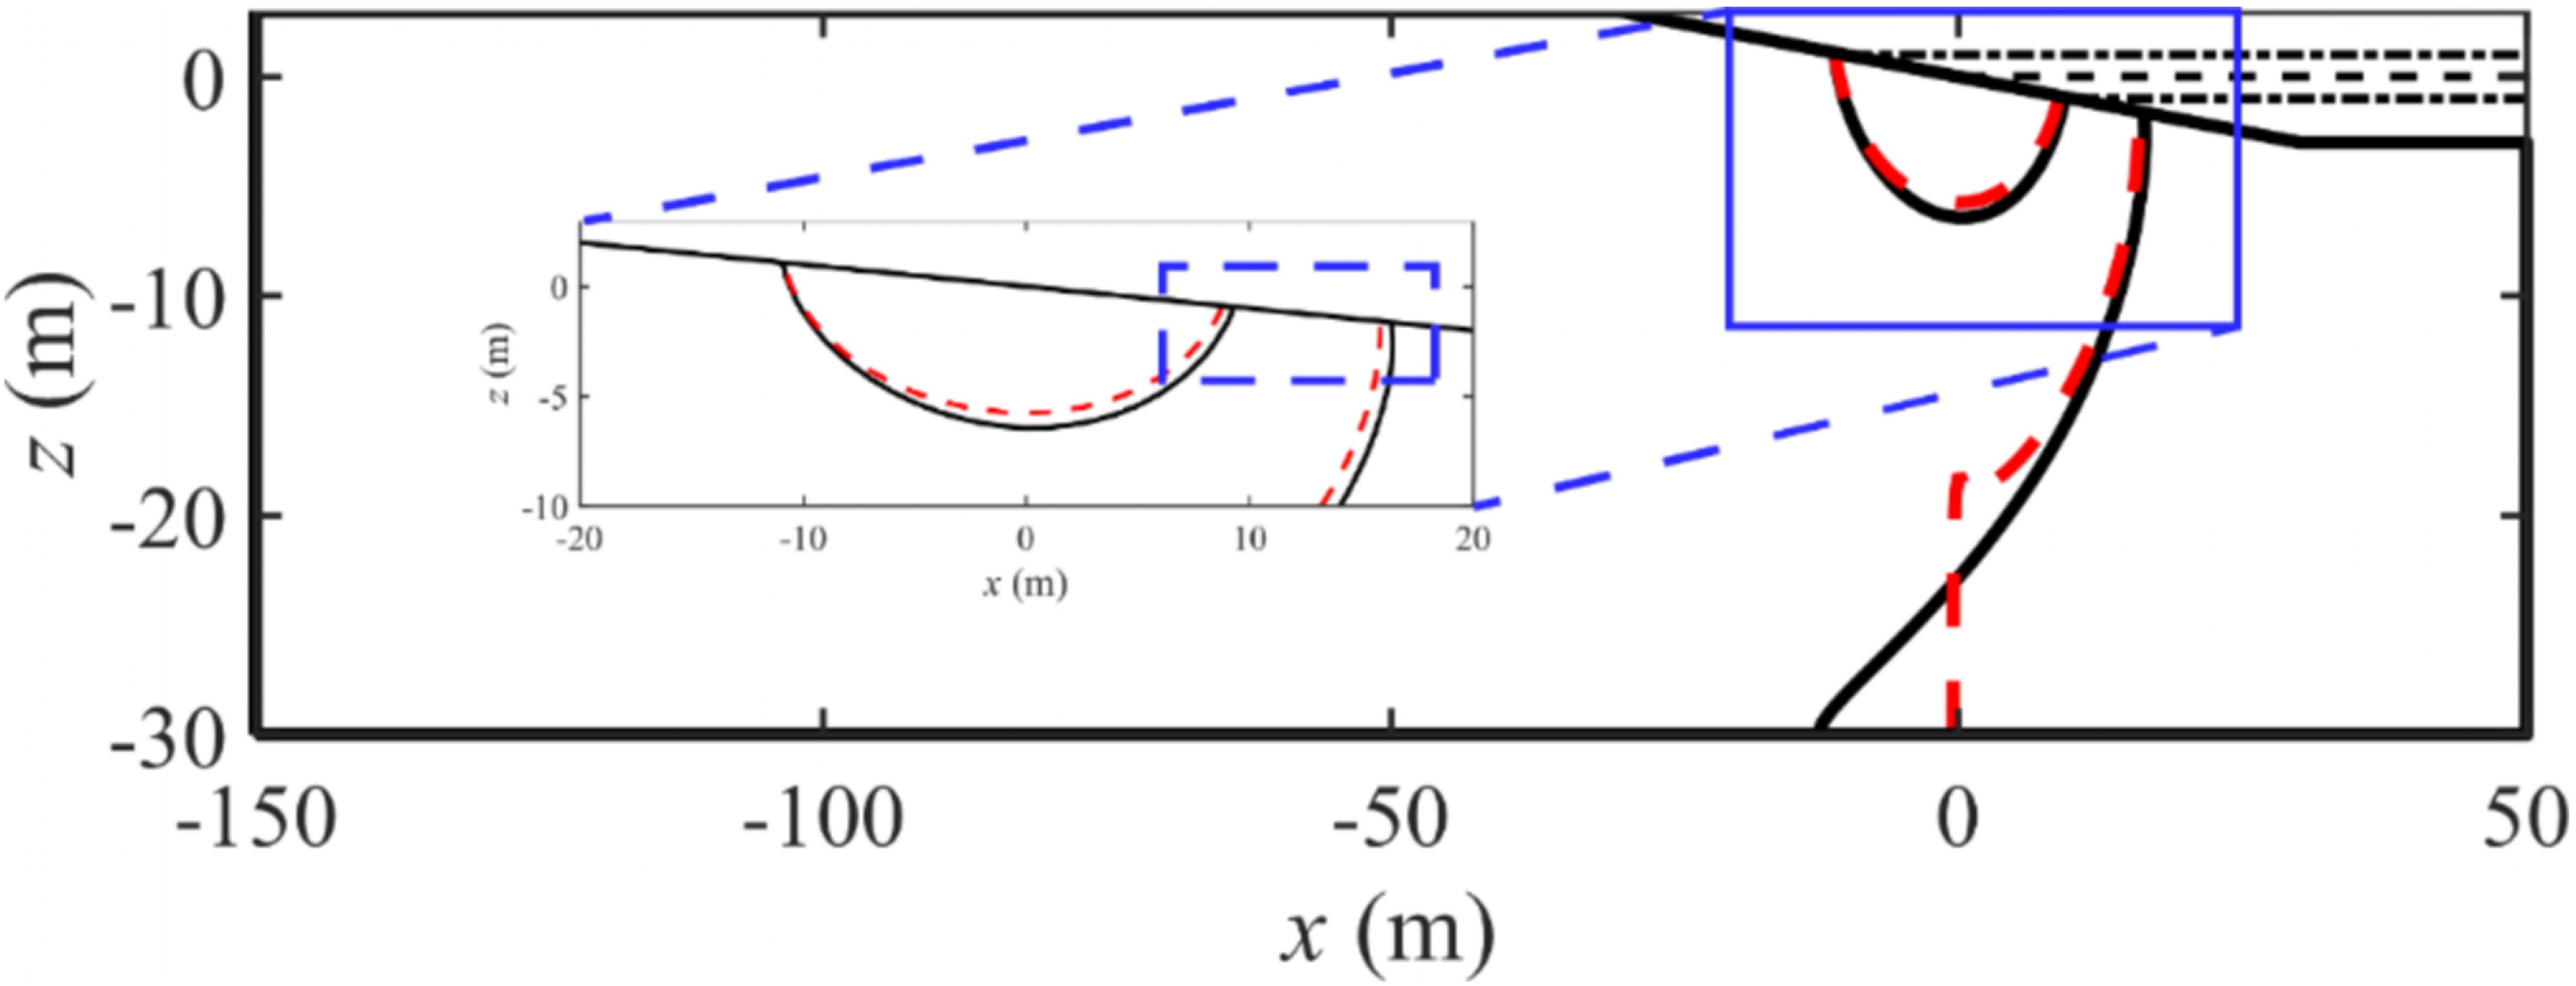
Figure 7 Comparison of salinity distributions for Case-H (black solid line) and Case-D (red dashed line). The solid and dashed lines represent the 50% salinity contour. The blue dashed rectangle highlights the four intersecting points of the 50% salinity isoclines of Case-H and Case-D with the CDE (Figure 1). The coordinates of these overlap points are (8.76 m, -0.876 m), (9.25 m, -0.925 m), (15.83 m, -1.583 m), and (16.34 m, -1.634 m), respectively.
3.5 Sensitivity analysis
Initially, employing Case-D as the base case, we further scrutinize the influences of HD and LD on the migration patterns of variable-density solutes. The parameters exploited for sensitivity analysis comprise the maximum horizontal variance () and vertical variance (), maximum spreading area (Ms), residence time (Tres, representing the duration of solute migration within the coastal aquifer), maximum discharge rate (Md, denoting the peak time-dependent total solute efflux across the aquifer-ocean interface), and the principal axis of the discharge interval across the aquifer-ocean interface (Mx, a surrogate encapsulating the spatial distribution of solute discharge). Subsequently, employing both Case-H and Case-D as the framework, we modify the solute density and examine the resulting solute migration features. The metrics for C0 sensitivity analysis align perfectly with the aforementioned indicators. Additionally, we illustrate the temporal variations of solute mass within the saltwater region of the aquifer (utilizing 0.05CS as the delineation line) in all specified conditions.
3.5.1 Sensitivity to LD
The location of the subsurface dam, denoted by LD, significantly influences the migration of variable-density solutes. LD values are fixed at 0 m, 5 m, 10 m, 15 m, and 20 m, respectively, with larger values indicating closer proximity of the subsurface dam to the inland freshwater boundary. As per Figure 8(a1), both Ms and Tres increase monotonically as the dam approaches inland. Figures 9(a1–d1) elucidates that the subsurface dam obstructs the solute, and its landward movement augments the diffusion of the solute throughout the aquifer. Given the previous analyses, the residence time is jointly modulated by the subsurface dam and the saltwater wedge. While the dam impedes and reduces the saltwater wedge, an increase in LD diminishes its inhibiting effect, thus enhancing solute plume residence time. This rise is considerable, marking a 67.94% increase (from 1575 days to 2645 days) as LD changes from 0 m to 20 m, thereby highlighting the high sensitivity of solute plume residence time to the location of subsurface dam. The trends of and do not display a consistent monotonic change with respect to LD [Figure 8(a2)]. However, demonstrates a discernible pattern, suggesting a gradual increase, significantly influenced by the stretching of the solute plume at the periphery of the saltwater wedge. Contrarily, displays a fluctuating trend, where the vertical spreading impact of the subsurface dam on the solute plume appears to be insignificant if the height of subsurface dam remains static. The continuous decline of Md (the maximum discharge rate of the solute) shown in Figure 8(a1) is consistent with the increase in residence time as LD increases. In equivalent total solute mass, extending the time scale corresponds to a decrease in the rate. Conversely, Mx shows a trend inverse to Md, implying that landward shift of the subsurface dam triggers a seaward transition of the primary solute discharge interval, distancing it from the mean sea level (x = 0 m).
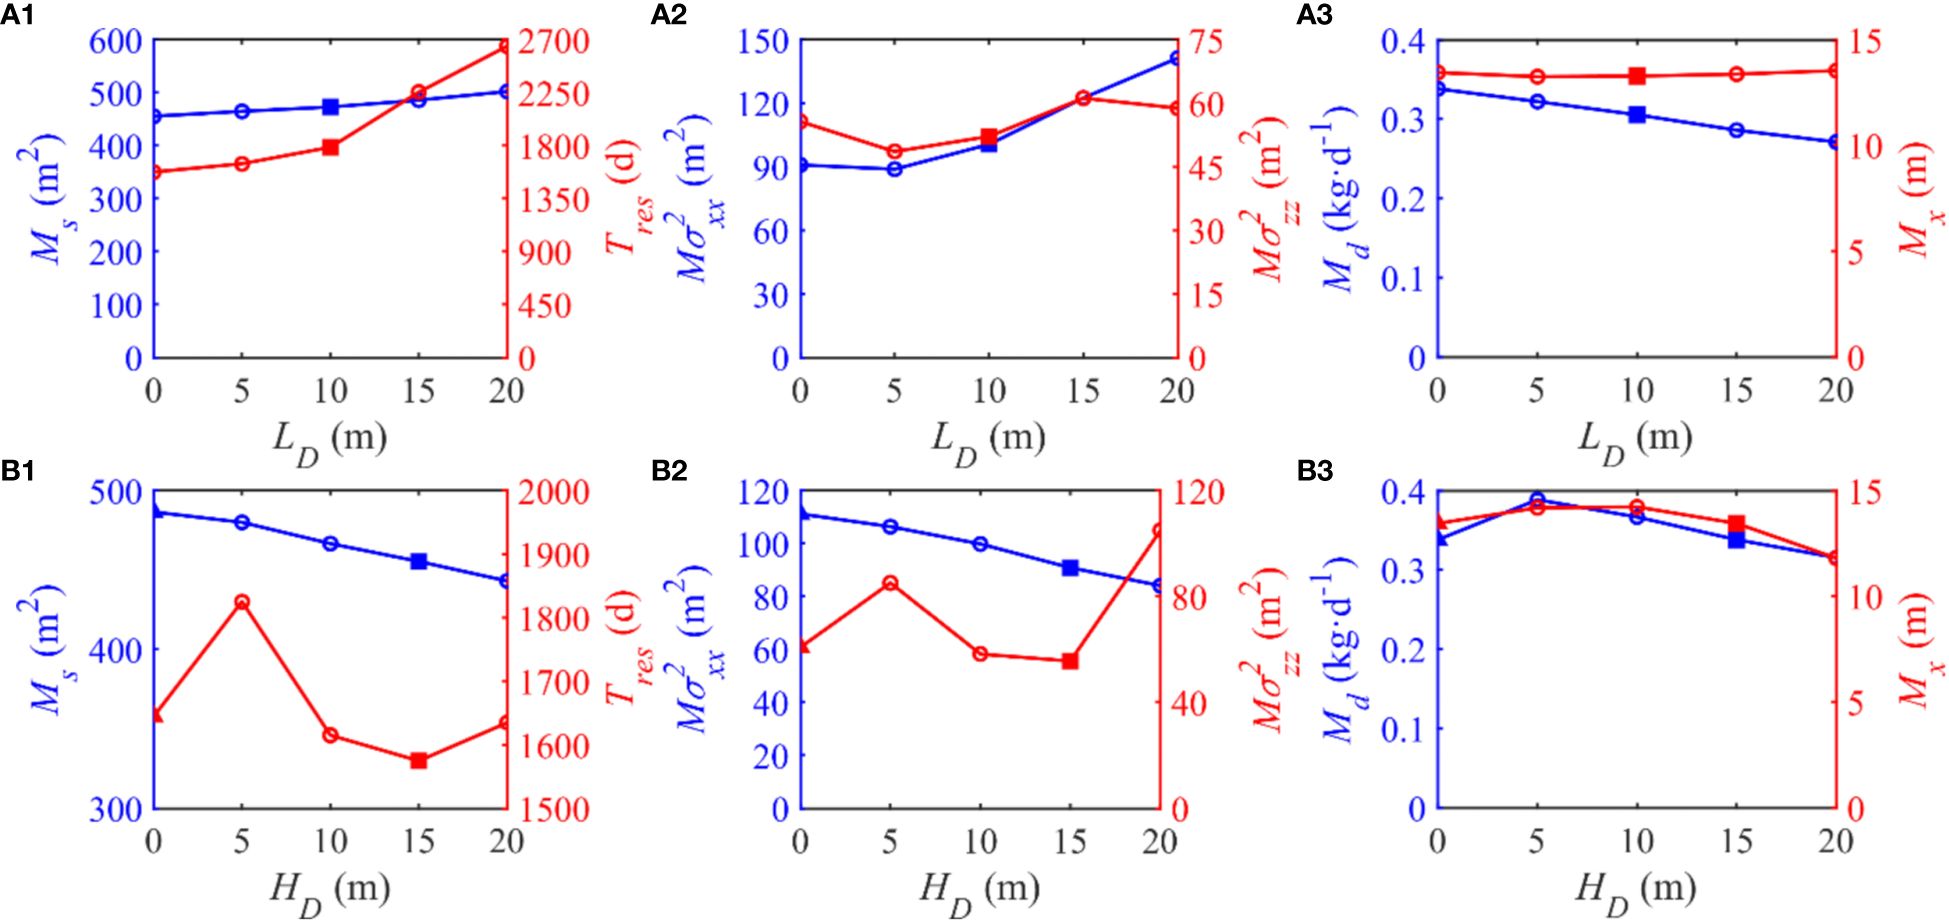
Figure 8 Comparison of the maximum spreading area (Ms), the residence time (Tres), the maximum horizontal variance (), the maximum vertical variance (), the maximum discharge rate (Md) and the principal axis of the discharge interval across the aquifer-ocean interface (Mx) responding to the variations of (A1–A3) LD and (B1–B3) HD. Note that triangles and squares represent Case-H and Case-D, respectively.
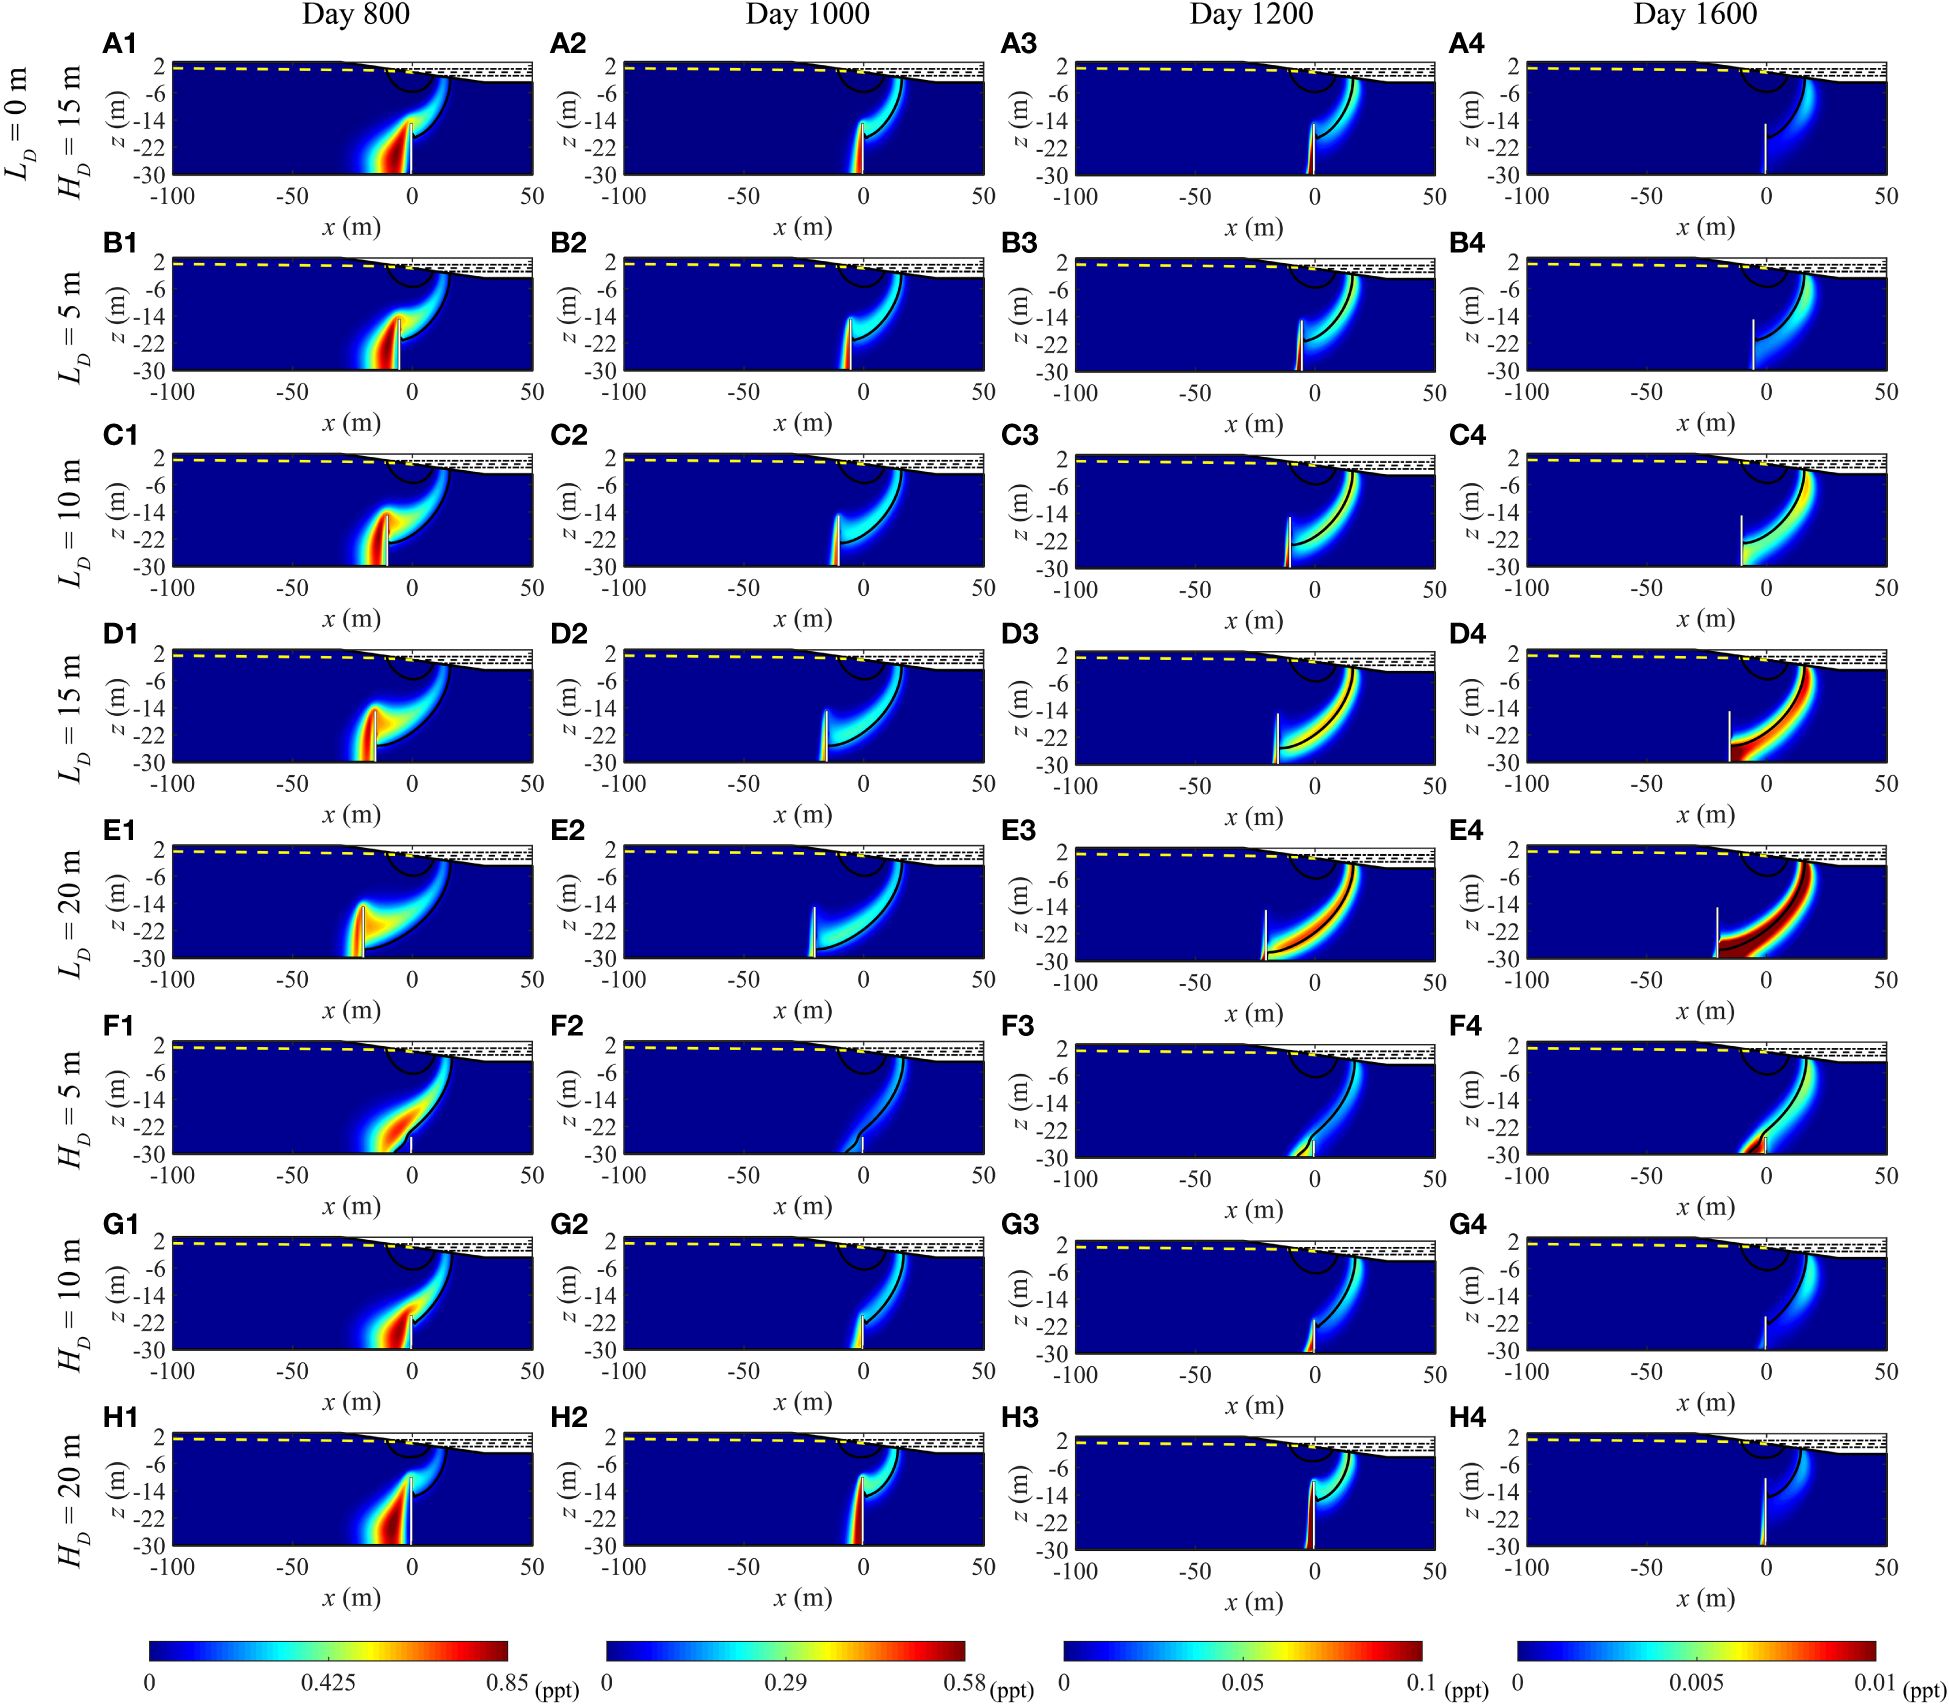
Figure 9 Temporal variations in the concentration of variable-density solute plume and salinity distribution (marked in black, 0.5Cs isopleths) in (A1–E4) LD and (F1–H4) HD sensitivity analyses case. The yellow dashed line symbolizes the water table, while the white rectangle denotes the subsurface dam. All the plots show conditions at the rising mid-tide.
Typically, as LD increases, the maximum solute mass in saltwater zone decreases, aligning with the changes observed in Tres according to Figure 10(a1). Figures 9A–D illustrates that both the area of the saltwater wedge and its penetration into the aquifer continually diminish with the increment of LD. Conversely, R behaves inconsistently in response to LD alterations. When LD equals 0 m, R manifests its largest value but does not attain its smallest magnitude at LD equal to 20 m, rather it does so at LD equal to 15 m. This can be rationalized by referring to Figures 9(a1–d1): as the proximity to land increases, the influence of freshwater on the variable-density solute plume intensifies (presenting a minimum solute concentration at 800 days when LD equals 20). Consequently, the solute is propelled to exit the aquifer more swiftly. Similarly, a quicker solute departure from the aquifer occurs when the subsurface dam is closer to the seaside. Therefore, an LD value of 15 m represents a transitional point of these two conditions.
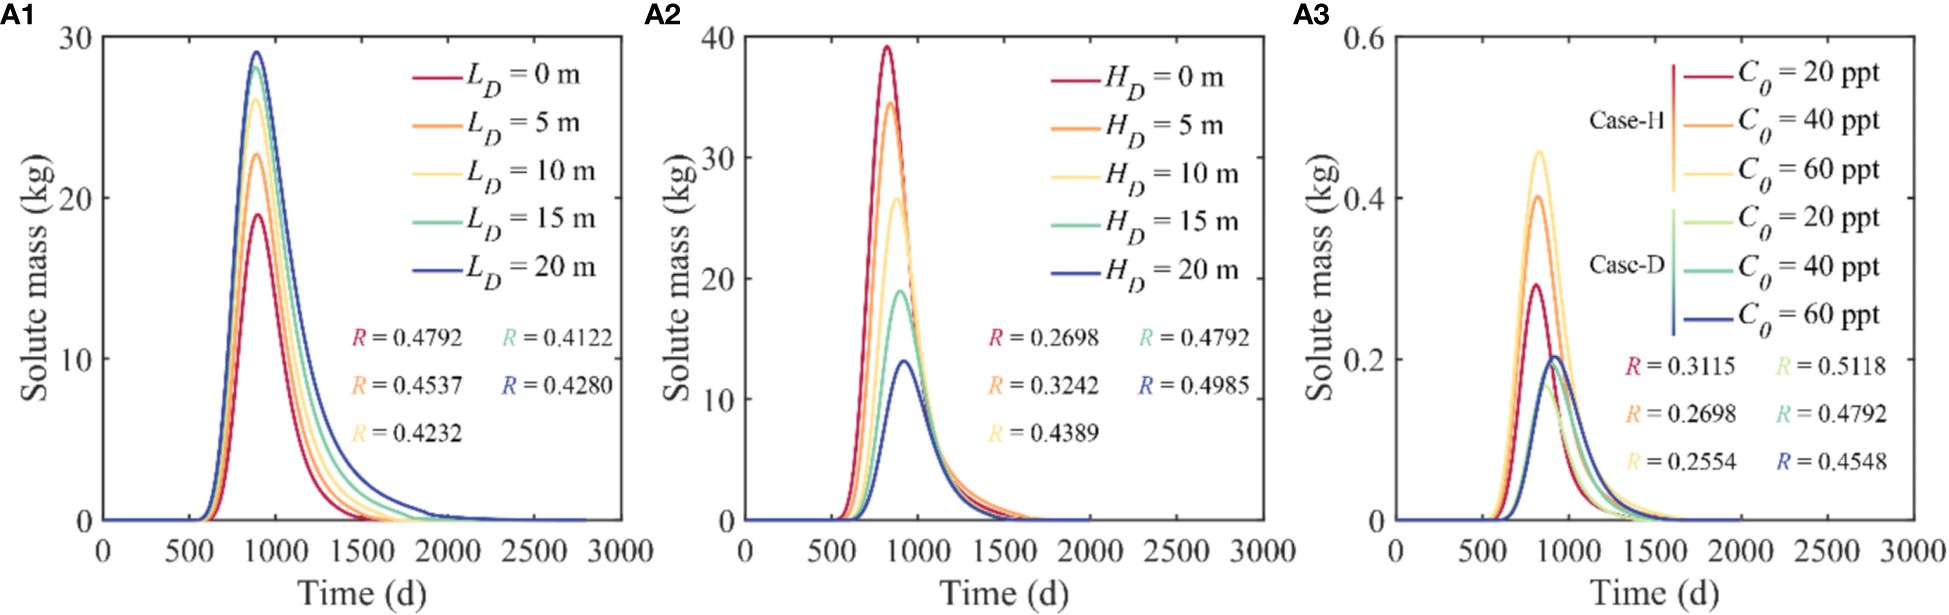
Figure 10 Temporal variations of the variable-density solute mass in the saltwater zone (with 0.05CS as the boundary) responding to the variations of (A1) LD, (A2) HD, and (A3) C0. R is the proportion of the solute mass that has already left the aquifer to the initial total mass when the solute mass in the saltwater region reaches its maximum value in each condition. Each R value corresponds to a curve of the same color.
3.5.2 Sensitivity to HD
This study investigates the influence of its height (HD) on variable-density solute plume migration by considering four distinct scenarios where HD equals 5m, 10m, 15m, and 20 m. Figures 8(b1–b3) quantify the response of solute migration to variations in HD. With an increase in HD, Ms decreases consistently. Keeping the position of the subsurface dam constant, the solute plume spread gets inhibited as the height rises. Tres varies across different HD. Specifically, when HD equals 5, Tres appears to escalate significantly compared to other conditions, while the changes are minor among the remaining scenarios. This divergence can be attributed to the HD equal to 5 scenario where, due to inadequate height, the subsurface dam ceases to block the saltwater wedge effectively, as can be witnessed in Figure 9F, hence exhibiting different behavior. Consequently, within a certain range where the subsurface dam acts to impede the saltwater wedge, the dam height (HD) exerts a negligible impact on residence time. Being a vertical physical barrier, the subsurface dam prompts to display an inverse relationship with HD, whereas shows a considerable increase when HD equals 20 m. The substantial height of the subsurface dam prompts the formation of an expanded low-velocity zone to the left of the dam compared to scenarios with a lower dam height. This conclusion aligns with the research of Yin et al. (2023) on subsurface dams. The consequence of this is the vertical spreading of the solute plume along the subsurface dam during the later phases of migration, as depicted in Figures 9(h2, h3).
Figure 8(b3) reveals that both Md and Mx do not exhibit monotonicity. This finding is due to conditions at HD = 0 m and 5 m, which significantly differ from the other three conditions (as shown in Figures 9F–H, where the subsurface dam fails to block the saltwater wedge). By focusing on the three cases of HD = 10 m, 15 m, and 20 m, it is noted that as HD enlarges, both Md and Mx steadily decrease, with the rate of decline inclined to increase gradually. Notably, a significant drop in Mx (ΔMx = 1.6 m) is witnessed when HD transitions from 15 m (Mx = 13.45 m) to 20 m (Mx = 11.81 m). The amplitude of this change not only reflects the diminished influence of inland freshwater flow on the saltwater wedge at HD = 20 m but also highlights the constriction caused by the subsurface dam to the freshwater path, thereby increasing the freshwater flow speed at the dam top area [aligning with the research conducted by (Yin et al., 2023)]. This finding results in a significant reduction in the upper saltwater plume size (as depicted in Figure 9H). This situation escalates the encroachment of the saltwater wedge into the aquifer, hence leading to the observed phenomenon.
In varying HD conditions, the peak solute mass within the saltwater zone displays consistent regularity [as seen in Figure 10(a2)]. It significantly diminishes as HD escalates. Transitioning from HD = 0 m to 20 m, the peak value experiences a 66.46% reduction (decreasing from 39.21 kg to 13.15 kg). Despite the notable contrast in the solute mass within the saltwater zone across the five scenarios, their corresponding Tres do not exhibit a parallel correlation based on the results in Figure 8(b1). This fact underscores our earlier conclusion: both the subsurface dam and the saltwater wedge exercise collective control over the residence time of the solute plumes in the aquifer. While the influx of solute mass into the saltwater zone is lowest at HD = 20, the considerable height of the subsurface dam results in a residence time not widely disparate from other conditions. The residence time becomes significantly pronounced at HD = 5 m, where the subsurface dam becomes submerged beneath the saltwater (refer to Figure 9F). Consequently, some solute is captured within the saltwater wedge to the left of the subsurface dam [as shown in Figures 9(f3, f4)]. Water exchange in this area is relatively sluggish, culminating in an extended departure time for the solute. A robust correlation exists between R values and the solute mass situation in the saltwater zone for this sensitivity analysis group. A larger peak solute mass corresponds to a smaller R value, indicating that less mass entering the saltwater zone correlates with more mass exiting the aquifer.
3.5.3 Sensitivity to C0
In both Case-H and Case-D, we modified the density of the released variable-density solute. We looked at three solutes with different densities (20, 40, and 60 ppt), aiming to scrutinise the impact of diverse densities on the migration patterns of the solute. Independently of whether it was Case-H or Case-D [Figure 11(a1)], an increase in the density of the released solute was linked to a steady decrease in Ms, while Tres correspondingly increased. This shift in Ms results from the solute migration to the bottom of the aquifer by gravitational force, where it eventually accumulates due to the impermeable boundary of the aquifer [Figures 12(a1–f1)]. Thus, as C0 increases, Ms decreases. Generally, the denser the solute, the more challenging it is to exit the aquifer [Figures 12(a2–f2)], resulting in an increased Tres. These findings align with investigations of Bakhtyar et al. (2013) on the migration of variable-density solute in homogeneous aquifers in tidal impacts. Furthermore, our comparison of Case-H and Case-D in the same density [Figure 11(a1)] showed that variation in solute density doesn’t affect the conclusion of the base case: the presence of a subsurface dam inhibits solute diffusion and lessens the residence time. Variances in densities of and in Case-H exhibit no significant differences; however, while in Case-D mirrors that of Case-H, escalates in correlation with the rise of C0. This shift can be elucidated through careful observation of Figures 12D–F, which show that the solute migration process in differing C0 conditions is alike – despite the peak values of being dissimilar, the trend lines of over time are equivalent. Consequently, the peak values of for the three different C0 arise approximately on the 1300th day. Figures 12(d4–f4) further depict the distinct distribution patterns of the solute plume on the 1200th day, revealing a larger quantity of solutes residuated on the left side of the subsurface dam in larger C0, resulting in an increase in as C0 surges. An overview of Figure 12(a2) reaffirms our previously drawn conclusion that the presence of the subsurface dam hinders solute diffusion. The behaviour of and across the three scenarios in Case-H in our study deviates from the findings (Bakhtyar et al., 2013) on variable-density solute. Bakhtyar et al. (2013) discovered that increased density in the solute enhances the conspicuousness of diffusion in both vertical and horizontal dimensions. Such discrepancies are understandable given the markedly smaller scale of the simulation area of Bakhtyar et al. (2013) compared to the model size in our current research, and the divergence in solute release locations. The larger model size in our study facilitates comprehensive diffusion of the variable-density solute, leading to a considerable decay in solute density before it departs the aquifer, resulting in outcomes that diverge from findings (Bakhtyar et al., 2013) due to more restricted experimental area.
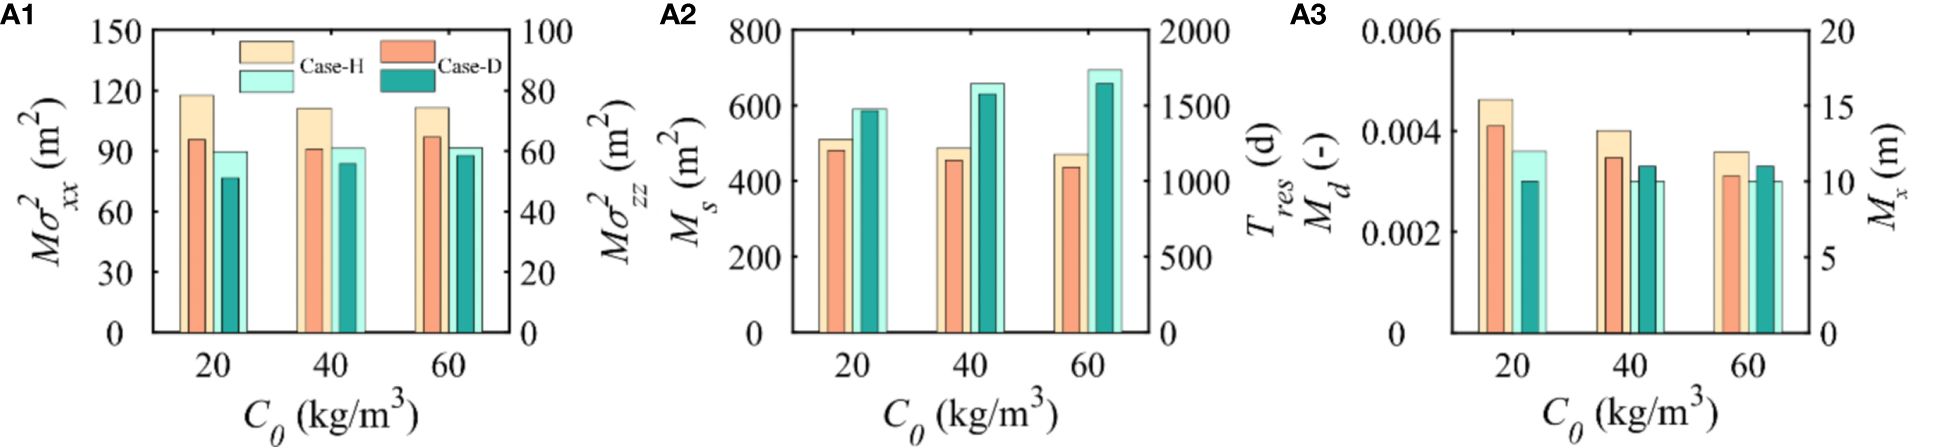
Figure 11 Comparison of (A1) maximum horizontal variance (Mσ2xx), the maximum vertical variance (Mσ2zz), (A2) maximum spreading area (Ms) and residence time (Tres), and (A3) maximum discharge rate (Md) and principal axis of the discharge interval across the aquifer-ocean interface (Mx) responding to the variations of C0. Meanwhile, the light yellow and yellow correspond to the left y-axis, and the light green and green correspond to the right y-axis. The Md parameter has been normalized (normalized by the initial total mass).
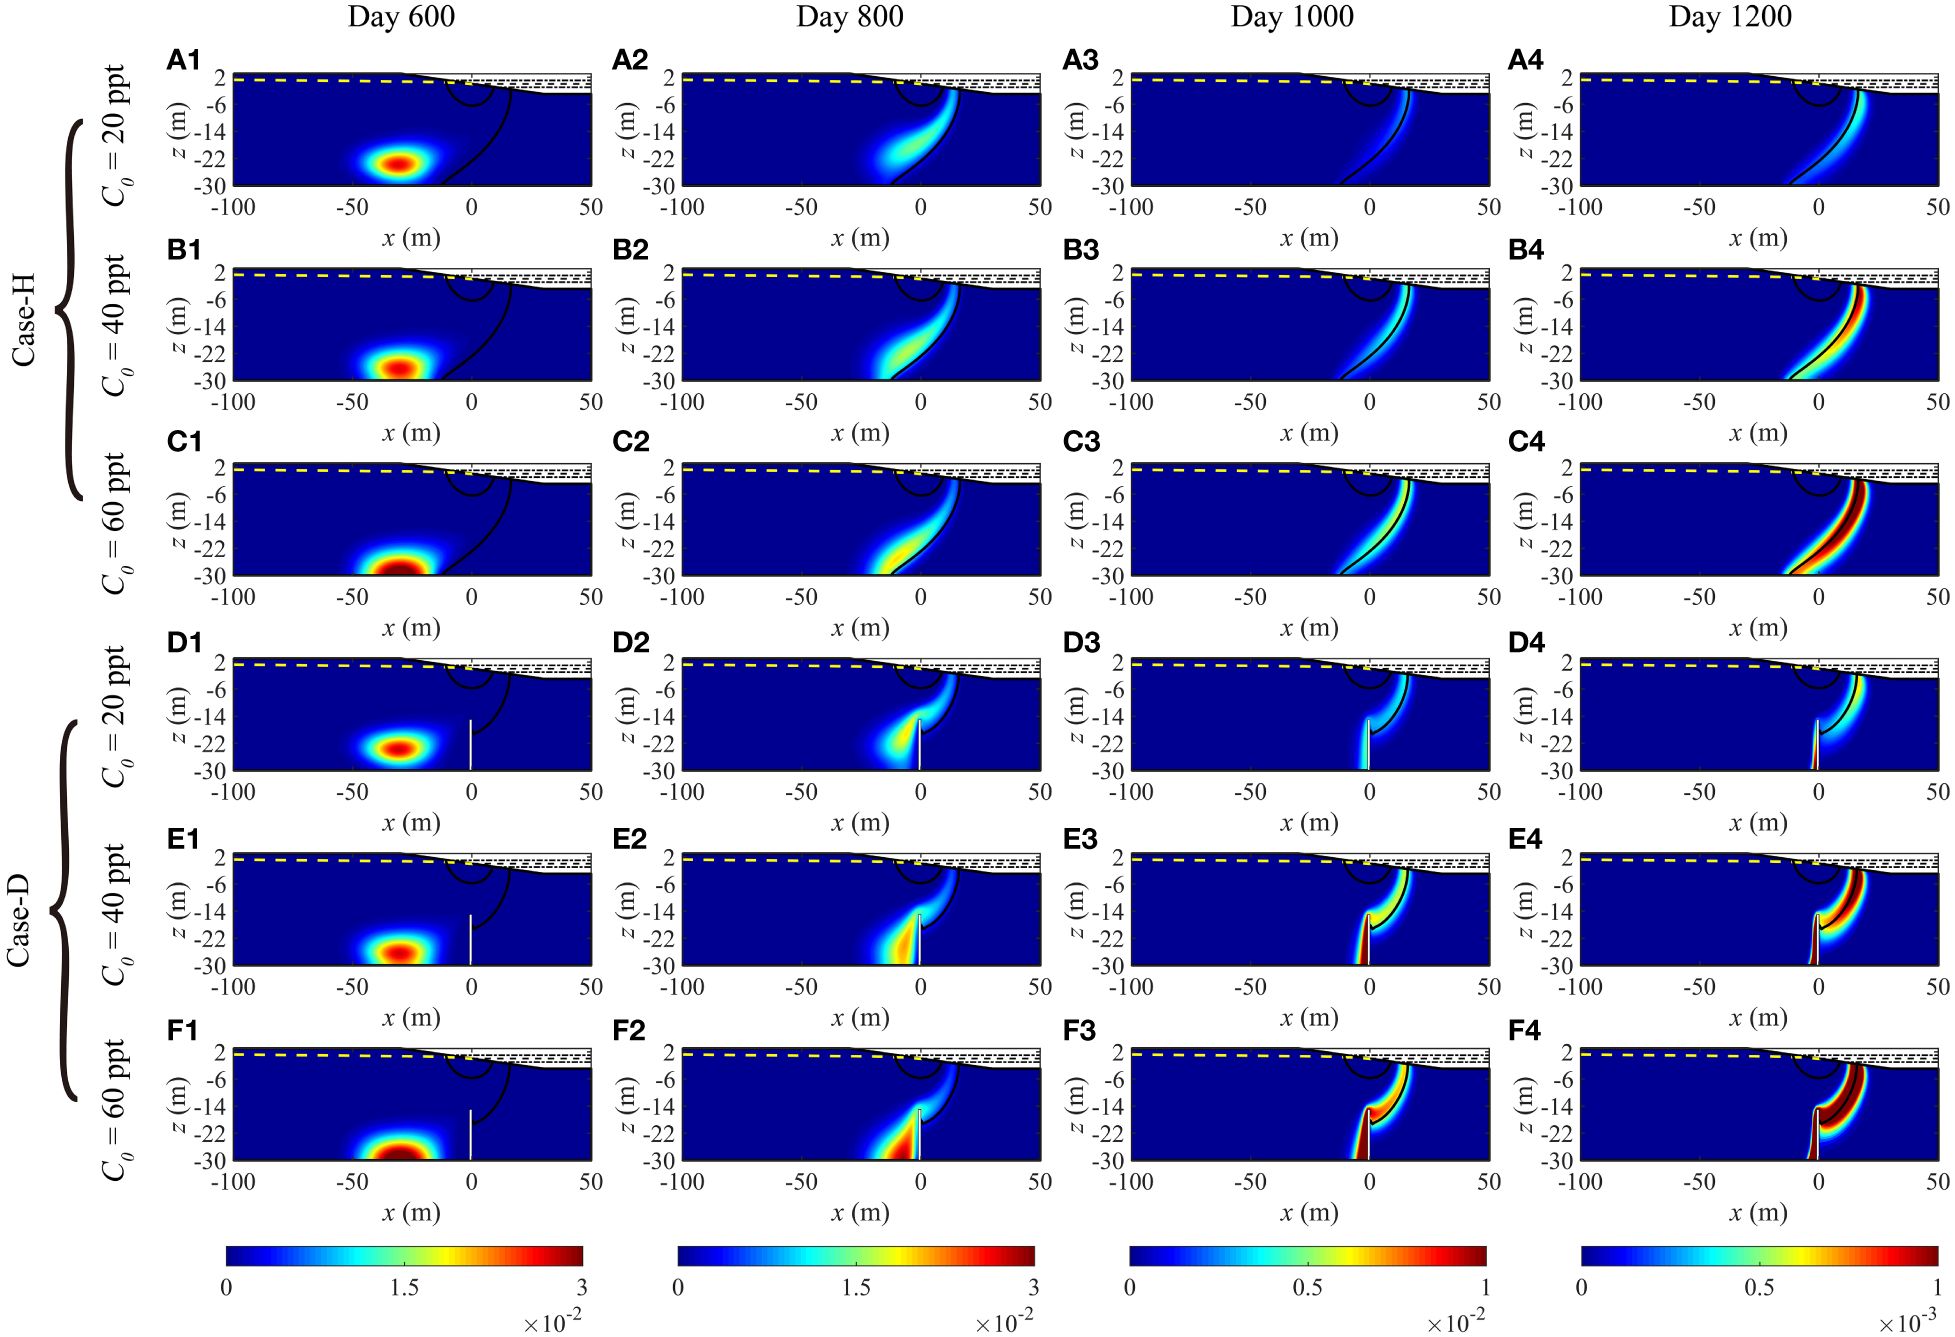
Figure 12 Temporal variations in the concentration (normalized by initial concentration, C/C0) of variable-density solute plumes and salinity distribution (indicated by black, 0.5CS isopleths) in C0 sensitivity analysis for (A1–C4) Case-H and (D1–F4) Case-D. The yellow dashed line symbolizes the water table, while the white rectangle denotes the subsurface dam. All the plots show conditions at the rising mid-tide.
In both Case-H and Case-D, Md diminishes as C0 augments and the presence of the subsurface dam results in a lower Md in Case-D compared to Case-H [Figure 11(b3)]. The fluctuation of Md in accordance with C0 in Case-H mirrors the change in the peak solute discharge rate reported in the study of Bakhtyar et al. (2013). On the contrary, Mx behaves opposingly to Md [Figure 11(b3)]. Regardless of whether it is Case-H or Case-D, Mx escalates with an elevated C0. This is attributed to the gravitational-induced sinking of the entire solute plume as the density increases, causing the release interface to migrate towards the seaside, which is the direction of Mx increase. It is noteworthy that in identical solute densities, Mx in Case-D is less than in Case-H, aligning with our prior findings. The intervention of the subsurface dam in Case-D alters the salinity spreading in the aquifer (Figure 7, 50% contour line), inducing the disparity between Case-D and Case-H. This trend remains intact despite variations in solute density.
In Case-H, solute mass peak values in the saltwater zone across the three C0 conditions exhibit an increase proportionate to the growth of solute density [Figure 10(a3)]. This progression is similarly noticeable amongst the three sets of conditions in Case-D. These observations support the premise that an enlargement in C0 amplifies the density gradient, thereby facilitating an uptake of solutes into the saltwater zone. Given the presence of the subsurface dam, solutes infiltrating the saltwater zone in all three C0 conditions reach lower peak values compared to Case-H [Figure 10(a3)]; additionally, the time taken to reach these peaks is also prolonged, corroborating conclusions drawn in Figure 4. Noteworthy is that the proximity in peak value representations of solute mass in the saline water section across the triad of conditions in Case-D, compared to the trio in Case-H, suggestive of the subsurface dam mitigating the density effect of variable-density solutes. As depicted in Figure 10(a3), R demonstrates strong consistency, where changes in R directly correlate with oscillations in C0. A lower density of solute expedites its exodus from the aquifer, an effect further amplified by the presence of an subsurface dam, resulting in the augmentation of R.
4 Concluding remarks
This research examines the impact of the subsurface dam and tide on the migration patterns of a variable-density solute in a coastal aquifer using numerical simulation. The main observations are as follows:
(1) The existence of the subsurface dam affects the discharge pattern and entry rate into the sea of variable density solute plumes. As some solute plumes are obstructed by the subsurface dam, they are continuously diluted and discharged through its edges, reducing the concentration of the solute released and simultaneously reducing the discharge rate of the solute.
(2) The residence time of variable density solute plumes is jointly controlled by the subsurface dam and the saltwater wedge, causing the response of the residence time to changes in the location and height of the subsurface dam to be a compounded process. It is also highly sensitive to the position of the subsurface dam; the subsurface dam restricts the spread of the solute plumes, this restriction is primarily evident in the horizontal direction, thus changing the height of the subsurface dam would achieve a better effect in inhibiting this diffusion.
(3) The subsurface dam alters the dynamic spreading of variable-density solute within the aquifer, diminishing the mass of solute plumes permeating the saltwater zone. Fluctuations in the height of subsurface dam trigger notable deviations in the peak solute mass within this zone.
(4) In certain conditions, regardless of whether the subsurface dam shifts landward or the dam height modifies, each scenario provokes a change in the primary outflow location of variable density solutes across the aquifer-ocean interface. The placement of the subsurface dam closer to landward will result in a shift of the outflow location towards the seaside, whereas a higher dam will have the opposite effect.
(5) Sensitivity analysis of solute density in variable-density solute reveals pronounced sensitivity of residence time to solute density, with Md diminishing in response to increased solute density. Augmentation of the solute density prompts a seaward shift in the primary outflow location across the aquifer-ocean interface. The presence of the subsurface dam, moreover, alleviates the density impact of variable density solutes within the seaward zone of the aquifer.
Although the conclusions were reached, this study focused solely on homogeneous aquifers and the release of solutes from inland freshwater. Future research should contemplate more intricate boundary conditions, including the superimposition of diverse tidal components [e.g., spring and neap tides (Jiang et al., 2021)], and seasonal variations in inland freshwater (Fang et al., 2022b). Moreover, the geological conditions ought to account for the heterogeneity (Gao et al., 2022; Yu and Michael, 2022) typically found within natural aquifers. These aspects influence salinity distribution and groundwater flow, consequently impacting the mobility of solutes in unconfined aquifers. Seasonal fluctuations in inland freshwater, for example, can instigate dynamic changes to hydraulic gradients, potentially modifying solute migration paths and complicating temporal fluctuations in solute flux across the aquifer-ocean interface. The presence of both low permeable layers and subsurface dam in aquifer may alter solute plume migration characteristics, such as residence time and spreading area. Further investigation is warranted to better comprehend the mechanisms underlying the impact of subsurface dam on the migration behavior of variable-density solutes in coastal aquifers.
Data availability statement
The raw data supporting the conclusions of this article will be made available by the authors, without undue reservation.
Author contributions
YF: Formal analysis, Investigation, Software, Visualization, Writing – original draft. CS: Conceptualization, Funding acquisition, Methodology, Supervision, Writing – review & editing. YX: Funding acquisition, Supervision, Writing – review & editing. CL: Funding acquisition, Methodology, Supervision, Writing – review & editing. CZ: Formal analysis, Funding acquisition, Supervision, Writing – review & editing. LL: Conceptualization, Funding acquisition, Supervision, Writing – review & editing.
Funding
The author(s) declare financial support was received for the research, authorship, and/or publication of this article. This study was financially supported by the National Key R&D Program of China (2021YFC3200503), the National Natural Science Foundation of China (42277416, 42277190), the Postgraduate Research & Practice Innovation Program of Jiangsu Province (KYCX24_0879), and the fund of National Key Laboratory of Water Disaster Prevention (524015282). The data that support the findings of this study are available upon reasonable request from the corresponding author.
Conflict of interest
The authors declare that the research was conducted in the absence of any commercial or financial relationships that could be construed as a potential conflict of interest.
Publisher’s note
All claims expressed in this article are solely those of the authors and do not necessarily represent those of their affiliated organizations, or those of the publisher, the editors and the reviewers. Any product that may be evaluated in this article, or claim that may be made by its manufacturer, is not guaranteed or endorsed by the publisher.
References
Abdoulhalik A., Ahmed A. A. (2017). The effectiveness of cutoff walls to control saltwater intrusion in multi-layered coastal aquifers: Experimental and numerical study. J. Environ. Manage. 199, 62–73. doi: 10.1016/j.jenvman.2017.05.040
Anwar N., Robinson C., Barry D. A. (2014). Influence of tides and waves on the fate of nutrients in a nearshore aquifer: Numerical simulations. Adv. Water Resour. 73, 203–213. doi: 10.1016/j.advwatres.2014.08.015
Bakhtyar R., Brovelli A., Barry D. A., Robinson C., Li L. (2013). Transport of variable-density solute plumes in beach aquifers in response to oceanic forcing. Adv. Water Resour. 53, 208–224. doi: 10.1016/j.advwatres.2012.11.009
Boufadel M. C., Suidan M. T., Venosa A. D. (2006). Tracer studies in laboratory beach simulating tidal influences. J. Environ. Eng. 132, 616–623. doi: 10.1061/(ASCE)0733–9372(2006)132:6(616
Chambers L. A., Hemmings B., Cox S. C., Moore C., Knowling M. J., Hayley K., et al. (2023). Quantifying uncertainty in the temporal disposition of groundwater inundation under sea level rise projections. Front. Earth Sci. 11. doi: 10.3389/feart.2023.1111065
Chang Q. P., Zheng T. Y., Zheng X. L., Zhan B., Sun Q. G., Walther M. (2019). Effect of subsurface dams on saltwater intrusion and fresh groundwater discharge. J. Hydrol. 576, 508–519. doi: 10.1016/j.jhydrol.2019.06.060
Fang Y., Zheng T., Wang H., Zheng X., Walther M. (2022a). Nitrate transport behavior behind subsurface dams under varying hydrological conditions. Sci. Total Environ. 838, 155903. doi: 10.1016/j.scitotenv.2022.155903
Fang Y. H., Zheng T. Y., Wang H., Zheng X. L., Walther M. (2022b). Influence of dynamically stable-unstable flow on seawater intrusion and submarine groundwater discharge over tidal and seasonal cycles. J. Geophys. Research-Oceans 127, e2021JC018209. doi: 10.1029/2021jc018209
Fang Y. H., Qian J. Z., Zheng T. Y., Wang H., Zheng X. L., Walther M. (2023). Submarine groundwater discharge in response to the construction of subsurface physical barriers in coastal aquifers. J. Hydrol. 617, 129010. doi: 10.1016/j.jhydrol.2022.129010
Freyberg D. L. (1986). A natural gradient experiment on solute transport in a sand aquifer: 2. Spatial moments and the advection and dispersion of nonreactive tracers. Water Resour. Res. 22, 2031–2046. doi: 10.1029/WR022i013p02031
Gao C., Kong J., Zhou L., Shen C. J., Wang J. (2023). Macropores and burial of dissolved organic matter affect nitrate removal in intertidal aquifers. J. Hydrol. 617, 129011. doi: 10.1016/j.jhydrol.2022.129011
Gao S. B., Zheng T. Y., Zheng X. L., Walther M. (2022). Influence of layered heterogeneity on nitrate enrichment induced by cut-off walls in coastal aquifers. J. Hydrol. 609, 127722. doi: 10.1016/j.jhydrol.2022.127722
Geng X., Boufadel M. C. (2017). The influence of evaporation and rainfall on supratidal groundwater dynamics and salinity structure in a sandy beach. Water Resour. Res. 53, 6218–6238. doi: 10.1002/2016WR020344
Guimond J. A., Mohammed A. A., Walvoord M. A., Bense V. F., Kurylyk B. L. (2022). Sea-level rise and warming mediate coastal groundwater discharge in the Arctic. Environ. Res. Lett. 17, 045027. doi: 10.1088/1748–9326/ac6085
Hughes J. D., Sanford W. E. (2004). SUTRA–MS: A version of SUTRA modified to simulate heat and multiple-solute transport (Reston, VA: US Geological Survey).
Jiang Z. P., Lv J.C., Li Q. L., Dai M. H., Kao S. J., Zheng N., et al. (2021). Tidal-driven submarine groundwater discharge and its influences on the carbonate system of a coastal coral reef in the Northern South China Sea. J. Geophys. Research-Oceans 126, e2021JC017203. doi: 10.1029/2021jc017203
Ke S., Chen J., Zheng X. (2021). Influence of the subsurface physical barrier on nitrate contamination and seawater intrusion in an unconfined aquifer. Environ. pollut. 284, 117528. doi: 10.1016/j.envpol.2021.117528
Lalehzari R., Tabatabaei S. (2015). Simulating the impact of subsurface dam construction on the change of nitrate distribution. Environ. Earth Sci. 74, 3241–3249. doi: 10.1007/s12665–015-4362–2
Li C., Zhang C., Gibbes B., Wang T., Lockington D. (2022). Coupling effects of tide and salting-out on perfluorooctane sulfonate (PFOS) transport and adsorption in a coastal aquifer. Adv. Water Resour. 166, 104240. doi: 10.1016/j.advwatres.2022.104240
Morales-Ojeda S. M., Herrera-Silveira J. A., Montero J. (2010). Terrestrial and oceanic influence on spatial hydrochemistry and trophic status in subtropical marine near-shore waters. Water Res. 44, 5949–5964. doi: 10.1016/j.watres.2010.07.046
Pandey A., Padhya V., Chakra S., Deshpande R. D. (2023). Seasonality in groundwater recharge in Coastal Southwestern India and its hydrological implications based on stable isotopes (?18O,?D). Phys. Chem. Earth 130, 103396. doi: 10.1016/j.pce.2023.103396
Reeves H. W., Thibodeau P. M., Underwood R. G., Gardner L. R. (2000). Incorporation of total stress changes into the ground water model SUTRA. Ground Water 38, 89–98. doi: 10.1111/j.1745–6584.2000.tb00205.x
Robinson C., Li L., Barry D. (2007). Effect of tidal forcing on a subterranean estuary. Adv. Water Resour. 30, 851–865. doi: 10.1016/j.advwatres.2006.07.006
Shen C., Zhang C., Kong J., Xin P., Lu C., Zhao Z., et al. (2019). Solute transport influenced by unstable flow in beach aquifers. Adv. Water Resour. 125, 68–81. doi: 10.1016/j.advwatres.2019.01.009
Shen C. J., Fan Y., Wang X. B., Song W. J., Li L., Lu C. H., et al. (2022). Effects of land reclamation on a subterranean estuary. Water Resour. Res. 58, e2022WR032164. doi: 10.1029/2022wr032164
Song J., Yang Y., Wu J. F., Wu J. C. (2022). The coastal aquifer recovery subject to storm surge: Effects of connected heterogeneity, physical barrier and surge frequency. J. Hydrol. 610, 127835. doi: 10.1016/j.jhydrol.2022.127835
Sun Q., Zheng T., Zheng X., Chang Q., Walther M. (2019). Influence of a subsurface cut-off wall on nitrate contamination in an unconfined aquifer. J. Hydrol. 575, 234–243. doi: 10.1016/j.jhydrol.2019.05.030
Sun Q., Zheng T., Zheng X., Walther M. (2021). Effectiveness and comparison of physical barriers on seawater intrusion and nitrate accumulation in upstream aquifers. J. Contaminant Hydrol. 243, 103913. doi: 10.1016/j.jconhyd.2021.103913
Vandenbohede A., Lebbe L. (2006). Occurrence of salt water above fresh water in dynamic equilibrium in a coastal groundwater flow system near De Panne, Belgium. Hydrogeol. J. 14, 462–472. doi: 10.1007/s10040–005-0446–5
Van Genuchten M. T. (1980). A closed-form equation for predicting the hydraulic conductivity of unsaturated soils. Soil Sci. Soc. America J. 44, 892–898. doi: 10.2136/sssaj1980.03615995004400050002x
Wang T., Zhang C. M., Shen C. J., Li C. R., Li L. (2023). Benchmarking water and salt dynamics at subterranean estuaries using TOUGHREACT. J. Hydrol. 618, 129271. doi: 10.1016/j.jhydrol.2023.129271
Werner A. D., Simmons C. T. (2009). Impact of sea-level rise on sea water intrusion in coastal aquifers. Groundwater 47, 197–204. doi: 10.1111/j.1745–6584.2008.00535.x
Wilson A. M., Gardner L. R. (2006). Tidally driven groundwater flow and solute exchange in a marsh: numerical simulations. Water Resour. Res. 42, W01405. doi: 10.1029/2005WR004302
Wu X. J., Wang Y. S., Shen C. J., Zhao Z. W. (2022). Variable-density flow and solute transport in stratified salt marshes. Front. Mar. Sci. 8. doi: 10.3389/fmars.2021.804526
Xie Y. F., Wang Y., Zhang J. X., Ye Y., Shen C. J., Zeng Y. P, et al. (2023). Seawater intrusion in fractured coastal aquifers influenced by tides: Laboratory and numerical investigations. J. Hydrol. 622, 129637. doi: 10.1016/j.jhydrol.2023.129637
Xin P., Jin G. Q., Li L., Barry D. A. (2009). Effects of crab burrows on pore water flows in salt marshes. Adv. Water Resour. 32, 439–449. doi: 10.1016/j.advwatres.2008.12.008
Xin P., Robinson C., Li L., Barry D. A., Bakhtyar R. (2010). Effects of wave forcing on a subterranean estuary. Water Resour. Res. 46, W12505. doi: 10.1029/2010WR009632
Yin J. N., Wang N., Lu C. H., Tsai F. T. C., Chen H. W. (2023). Fast desalinization of residual saltwater using subsurface dams combined with saltwater discharge or freshwater recharge. J. Hydrol. 619, 129282. doi: 10.1016/j.jhydrol.2023.129282
Yu X. Y., Xin P., Lu C. H., Robinson C., Li L., Barry D. A. (2017). Effects of episodic rainfall on a subterranean estuary. Water Resour. Res. 53, 5774–5787. doi: 10.1002/2017wr020809
Yu S. C., Zhang X. L., Li H. L., Wang X. J., Wang C. Y., Kuang X. X. (2022). Analytical study for wave-induced submarine groundwater discharge in subtidal zone. J. Hydrol. 612, 128219. doi: 10.1016/j.jhydrol.2022.128219
Yu X., Michael H. A. (2022). Impacts of the scale of representation of heterogeneity on simulated salinity and saltwater circulation in coastal aquifers. Water Resour. Res. 58, e2020WR029523. doi: 10.1029/2020wr029523
Zhang J. X., Lu C. H., Shen C. J., Zhang C. M., Kong J., Li L. (2021). Effects of a low-permeability layer on unstable flow pattern and land-sourced solute transport in coastal aquifers. J. Hydrol. 598, 126397. doi: 10.1016/j.jhydrol.2021.126397
Zhang Q., Volker R., Lockington D. (2001). Influence of seaward boundary condition on contaminant transport in unconfined coastal aquifers. J. Contaminant Hydrol. 49, 201–215. doi: 10.1016/S0169–7722(00)00194–7
Keywords: coastal aquifers, subsurface dams, variable-density solute, tides, variable-density flow
Citation: Fan Y, Shen C, Xie Y, Lu C, Zhang C and Li L (2024) Variable-density solute transport in unconfined coastal aquifers with a subsurface dam. Front. Mar. Sci. 11:1422615. doi: 10.3389/fmars.2024.1422615
Received: 24 April 2024; Accepted: 07 June 2024;
Published: 24 June 2024.
Edited by:
Meilin Wu, Chinese Academy of Sciences (CAS), ChinaReviewed by:
Zhilin Guo, Southern University of Science and Technology, ChinaYong-Woo Lee, Korea Marine Environment Management Corporation, Republic of Korea
Copyright © 2024 Fan, Shen, Xie, Lu, Zhang and Li. This is an open-access article distributed under the terms of the Creative Commons Attribution License (CC BY). The use, distribution or reproduction in other forums is permitted, provided the original author(s) and the copyright owner(s) are credited and that the original publication in this journal is cited, in accordance with accepted academic practice. No use, distribution or reproduction is permitted which does not comply with these terms.
*Correspondence: Chengji Shen, Yy5zaGVuQGhodS5lZHUuY24=