 Min Tian1
 Haifei Yang
 Wenxiang Zhang
 Benwei Shi
 Yaping Wang
 Shilun Yang
94% of researchers rate our articles as excellent or good
Learn more about the work of our research integrity team to safeguard the quality of each article we publish.
Find out more
ORIGINAL RESEARCH article
Front. Mar. Sci. , 05 June 2024
Sec. Coastal Ocean Processes
Volume 11 - 2024 | https://doi.org/10.3389/fmars.2024.1420559
This article is part of the Research Topic Processes, Mechanisms and Solutions in Coastal Wetland to Adapt to Changing Environment View all 10 articles
Storm-induced episodic sediment redistribution in coastal systems can reshape geomorphic bodies, disrupt ecosystems, and cause economic damage. However, cold-wave-storm-induced hydrodynamic changes and residual sediment transport in large, exposed subaqueous deltas, such as the Yangtze Delta, are poorly understood because it is typically expensive and difficult to obtain systematic field data in open coast settings during storm events. We conducted a successful field survey of waves, currents, changes in water depth, and turbidity at a station (time-averaged water depth of 20 m) in the offshore subaqueous Yangtze Delta over 10 days during winter, covering two storms and two fair-weather periods. During the storm events, strong northerly winds drove southward longshore currents (~0.2 m/s) and resulted in increased wave height and sediment resuspension, thereby leading to massive southward sediment transport. In contrast, both southward and northward transports were limited during the fair-weather periods. A better understanding of the storm-induced sediment transport can be obtained by using an approximately half-day lag in sediment transport behind wind force, given the time needed to form waves and longshore drift, the inertia of water motion, and the slow settling velocity of fine-grained sediment. Our results directly support previous findings of southward sediment transport from the Yangtze Delta during winter, which is deposited in the Zhejiang–Fujian mud belt in the inner shelf of the East China Sea. In addition, the southward sediment transport from the Yangtze Delta occurs mainly during episodic storm events, rather than during the winter monsoon, and winter storms dominate over typhoons in driving southward sediment transport from the delta. This study highlights the importance of storms, especially during winter storms, in coastal sediment redistribution, which is of particular significance when considering the projected increase in storm intensity with global warming.
Coastal environments and ecosystems are particularly vulnerable to the impacts of storms (e.g., typhoons, hurricanes, and cold-air outbreaks). Storm waves in coastal waters (i.e., local storm waves combined with swells propagating from the open ocean where larger waves are generated owing to storm winds) increase bed shear stress, and sediment resuspension occurs once the bed shear stress exceeds the critical limit for erosion (Partheniades, 1965; Winterwerp et al., 2012; Shi et al., 2021). Storm waves may also fluidize the seabed, making sediments more susceptible to erosion (Green & Coco, 2014). Storm-induced resuspension and redistribution of sediments in coastal seas have important implications for habitat stability, subsea pipeline/cable security, port and waterway maintenance, and morphological evolution. These impacts are being amplified under increasing trends in storm activity (i.e., integration of their frequency, lifetime, and intensity) and their destructiveness in response to global warming (Emanuel, 2013; Cheal et al., 2017; Bhatia et al., 2019; Zhou & Qian, 2021).
Winter storms derived from cold-air outbreaks, and typhoons and hurricanes as tropical cyclones can all bring strong wind events. Sediment redistribution induced by typhoons and hurricanes in coastal systems has been widely studied especially on rapid erosion/deposition in beach, coastal dune, and wetland environment (Turner et al., 2006; Leonardi et al., 2016; Williams & Liu, 2019; McKee et al., 2020), offshore sediment transport (Li et al., 2015; Lin et al., 2024), and sediment gravity flows across continental shelves (Puig et al., 2004; Wright & Friedrichs, 2006; Kudrass et al., 2018; Sequeiros et al., 2019). Compared to tremendous studies on typhoons- and hurricanes-induced sediment transport and hydrology changes, studies on winter storms and their impacts on sediment resuspension and longshore sediment transport in large subaqueous deltas seem relatively rare (Yang et al., 2007; Mo et al., 2021). Data on sediment transport across large subaqueous deltas are necessary because of the large magnitude of sediment transport and its potential influence on large ecosystems and socioeconomic megacenters. Therefore, it is vital to investigate the winter storm-induced redistribution of sediments in large deltas.
The Yangtze Delta is one of the world’s largest deltas in terms of area (60,000 km2), wetland ecosystem, population (110 million people), and economy (15% of China’s gross domestic product) (Xu et al., 2014; Wang et al., 2018a; Yang et al., 2020a). Shanghai is the largest harbor city in the world and lies at the mouth of the Yangtze River. The magnitude and direction of sediment transport in the subaqueous Yangtze Delta under fair weather conditions are controlled mainly by tidal currents (Milliman et al., 1985; Yang et al., 2017a). Located on the northwestern Pacific coast (Figure 1A), the Yangtze Delta is frequently affected by typhoons and cold fronts (Fan et al., 2006; Yang et al., 2019). Previous studies on the delta have focused mainly on storm-induced erosion and deposition in mudflat and wetland systems (Yang et al., 2003; Fan et al., 2006; Shi et al., 2017), and waterway siltation in mouth-bar areas (Kuang et al., 2014; Kong et al., 2015; Lu et al., 2018). In contrast, winter storm-induced changes in hydrodynamics and sediment transport in the offshore subaqueous Yangtze Delta are poorly understood. This lack of knowledge is mainly due to the difficulty in collecting high-resolution data for currents, waves, water-depth changes, and suspended sediment concentrations (SSCs) in the exposed offshore waters of the delta where waves are large. Ship-based field studies are dangerous and bottom-observation racks are often covered by sediment during storm events (Yang et al., 2007).
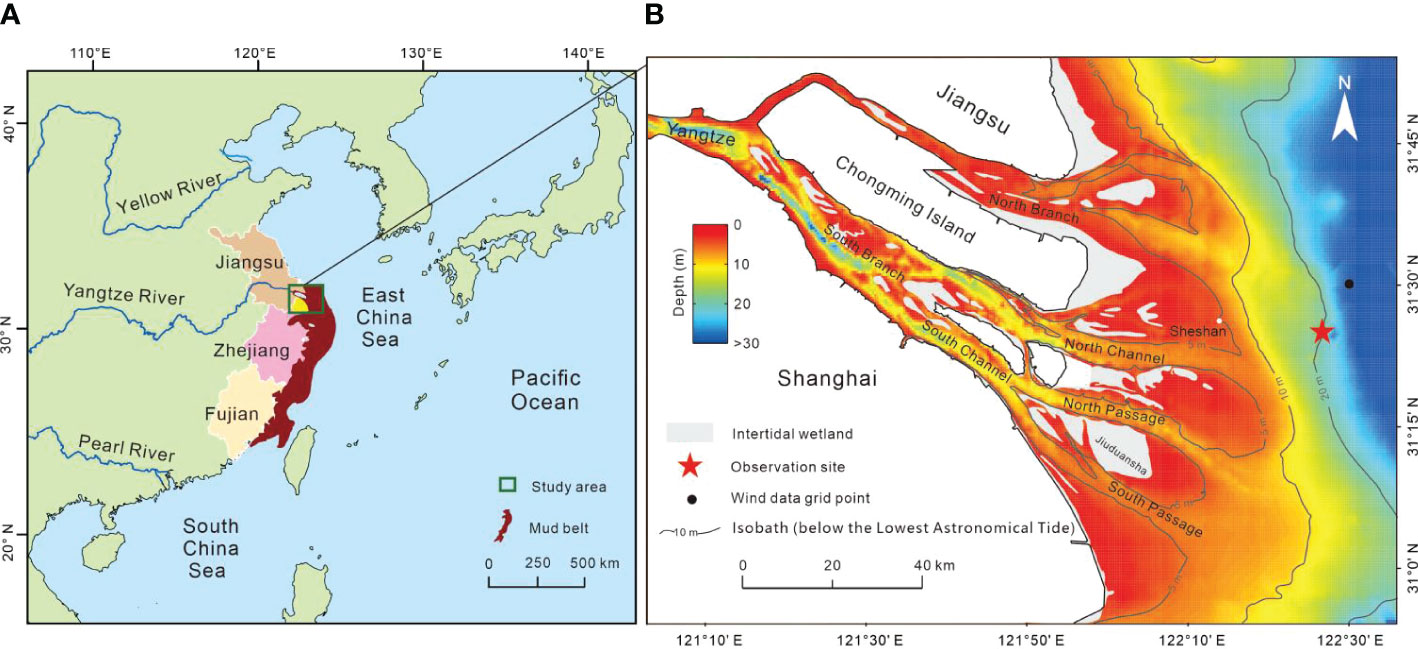
Figure 1 Maps of the study area. (A) Locations of the Yangtze Delta and the Zhejiang–Fujian mud belt. The mud belt is modified after Xu et al., 2012. (B) Location of the observation station in the offshore subaqueous Yangtze Delta. The topography data of river estuary is modified after Yang et al., 2023.
Since the mid-Holocene, a vast longshore mud belt (~1,000 km long, 100 km wide, and 40 m thick) has formed in the inner shelf of the East China Sea along the macrotidal coasts of Zhejiang and Fujian provinces in southeastern China (Figure 1A), mainly owing to southward transport of sediment from the Yangtze Delta (e.g., Fang et al., 2018; Xu et al., 2023). This mud belt is larger than the Yangtze Delta in terms of area and volume (Xu et al., 2012; Wang et al., 2018a), suggesting that more than half of the sediments from the Yangtze River have been transported southward to form the mud belt. The mud belt extends into coastal embayments, where it leads to the formation of tidal wetlands (Xie et al., 2017a). Historical reclamation of tidal wetlands in these embayments has yielded abundant new land and promoted socioeconomic development (Liao et al., 2016). Previous studies have attributed the southward transport of sediment from the Yangtze Delta to longshore currents (Shepard, 1932; Liu et al., 2007; Xu et al., 2023); however, it is controversial whether the southward longshore currents are driven mainly by monsoon winds or storms (Milliman et al., 1985; Deng et al., 2017; Tian et al., 2019; Yang et al., 2023), and whether the southward sediment transport occurs only in winter or also in other seasons (Xiao et al., 2006; Xu et al., 2023; Yang et al., 2023), and it is unclear whether winter storms or typhoons are more important in driving the southward sediment transport from the delta. Field observations during winter storm events, which would provide explanatory data, are particularly lacking.
In this study, we investigate the role of winter storms in southward sediment transport from the Yangtze Delta using high-resolution in situ observations in combination with systematic wind data. Our major objectives are to (1) identify the temporal variations in wave height, current velocity, and SSC; (2) estimate the residual currents and longshore sediment transport rates during tidal cycles; (3) compare the hydrodynamics and sediment transport between storm events and periods of fair weather; and (4) assess the relative importance of winter storms in driving southward sediment transport from the delta. Fulfilling these objectives will help us to determine whether massive southward longshore sediment transport from the offshore subaqueous Yangtze Delta occurs during winter, and whether it is continuous or episodic. We also consider the dominant factor driving southward sediment transport and whether southward sediment transport from the Yangtze Delta occur in seasons other than winter, as well as the season in which the greatest magnitude of sediment transport occurs.
The 6,300-km long Yangtze River is one of the world’s longest rivers and has a drainage area of 1.8 million km2, a water discharge rate of 900 km3/yr, and a sediment discharge rate of 500 Mt/yr (Mt: million tons) prior to the closure of the Danjiangkou Dam in the end of the 1960s (Milliman & Farnsworth, 2011; Wang et al., 2011). Because of numerous dams constructed in the past decades (in particular the Three Gorges Dam in 2003), the Yangtze sediment discharge rate has decreased to ~120 Mt/yr (Yang et al., 2018, 2023). The Yangtze River Basin is currently home to 450 million people (Yang et al., 2015).
The offshore subaqueous Yangtze Delta has an area of ~10,000 km2 (Figure 1B; Yang et al., 2023). Unconsolidated sediment in the delta is composed mainly of silt, clay, and very fine sand (Luo et al., 2017; Xue et al., 2020; Yan et al., 2022) that are readily resuspended by waves and currents (Yang et al., 2017a). The suspended sediment is composed mainly of silt and clay, with median grain sizes of 3–16 μm depending on the tidal stages and seasons (Liu et al., 2014; Xie et al., 2017b). Tides in the Yangtze Delta are semidiurnal with a diurnal inequality. The tidal range is 2.7 m on average, but can exceed 4.0 m during spring tides (Yang et al., 2020a). More than ten major storms impact the Yangtze Delta every year accompanied with interannual variations. On average, winter storms and typhoons respectively occupy ~67% and ~33%, based on the wind data during the last 40 years obtained from the European Centre for Medium-Range Weather Forecasts (https://www.ecmwf.int/). The significant wave height at Sheshan Station, a fixed gauging station at the 5-m isobath on the landward side of our observation site (Figure 1B) is < 1.0 m during fair weather, but can increase to several meters during storm events (Fan et al., 2006). The SSC in the offshore subaqueous delta ranges from < 0.1 to > 2.0 kg/m3, increasing from neap to spring tides, from fair to stormy weather, and from surface to near-bed water layers (Liu et al., 2014; Deng et al., 2017; Yang et al., 2020b). The offshore subaqueous Yangtze Delta is characterized by a long-term southward longshore current (Yang et al., 2023) that is believed to be driven mainly by the East Asian winter monsoon (Milliman et al., 1985; Deng et al., 2017). In response to the dam-induced decline in fluvial sediment supply, the subaqueous Yangtze Delta have converted from net accumulation to net erosion in recent years (Yang et al., 2011; Yang et al., 2017b; Guo et al., 2021; Luan et al., 2021). Sediments in the Zhejiang–Fujian longshore mud belt are dominated by silts and clays, with a gradual fining trend from north to south (Gao et al., 2019).
Field observations were conducted at an offshore station in the subaqueous Yangtze Delta at a mean water depth of ~20 m (122.44°E, 31.40°N; Figure 1B) during a winter period covering both storm events and fair weather (28 January to 7 February 2018). An acoustic Doppler current profiler (Teledyne RD Instruments, San Diego, USA) sensor was mounted 0.5 m above the seabed on a tripod and facing upward (with a blind spot of 0.7 m and a layer interval of 0.5 m) to measure current profiles at 20-min intervals. The currents in the first 32 layers between 1.2 and 17.2 m above the seabed (each with a thickness of 0.5 m) were effectively measured, and flow velocity and direction data were later used to calculate the residual currents. Layers located > 17.2 m above the seabed were only partly submerged because of water-level changes during tidal cycles; therefore, current data were incomplete and thus not used. A SBE 26plus Seagauge Wave and Tide Recorder (Sea-Bird Electronics, Bellevue, USA) was mounted 0.6 m above the seabed on the tripod to measure wave parameters and water-depth changes at 10-min intervals. An optical backscatter sensor (OBS637; Campbell Scientific, Salt Lake City, USA) was mounted 0.5 m above the seabed on the tripod to measure near-bed turbidities at 2.5-min intervals. An optical backscatter sensor (OBS344; Campbell Scientific, Salt Lake City, USA) tied to a windlass mounted on a boat was employed to measure turbidity profiles at 1-s intervals once an hour during a tidal cycle under fair weather (30–31 January 2018). During these measurements, the OBS was gradually moved from water surface to seabed and back again. Each measurement of the turbidity profile took ~3 min. During free periods between turbidity profile measurements, the OBS344 was used to measure near-surface (1.5 m below the water surface) turbidity at 1-s intervals.
Wind speed and direction data with a time resolution of 1 h and spatial resolution of 0.25° × 0.25° were obtained from the European Centre for Medium-Range Weather Forecasts (https://www.ecmwf.int/), and wind data collected at the grid point (122.5°E, 31.5°N) closest to the observation station were used to elucidate changes in wind speed and direction. Data on typhoon tracks were obtained from the National Meteorological Center of China (http://www.nmc.cn/).
In laboratory, the OBS637 was calibrated using water and sediment samples collected from the study area to establish correlation between turbidity and SSC. Firstly, the sediment was mixed thoroughly with water in a barrel (0.6-m diameter) to generate turbidity. Turbidity was measured using the OBS637, and the turbid water was sampled. Secondly, the volumes of water or sediment in the barrel were increased to produce new turbidities. The new turbidities were measured using the OBS637, and the new turbid water was sampled. Thirdly, the water samples were filtered, rinsed, dried, and weighed, and an SSC value was calculated as the ratio of dry sediment weight to water volume for each sample. By doing so, a series of SSC and turbidity data from low to high levels was obtained, and close correlations between SSC and turbidity (R2 =0.99, p < 0.001) were established (Figure 2A). The in situ turbidity data obtained from the OBS637 were then converted into SSC data using the regression equations shown in Figure 2A. To convert the turbidity data measured by OBS344 into SSC data, we identified a close correlation between the OBS344 and OBS637 turbidity data (R2 =0.95, p < 0.001) and used the resulting regression equation (Figure 2B).
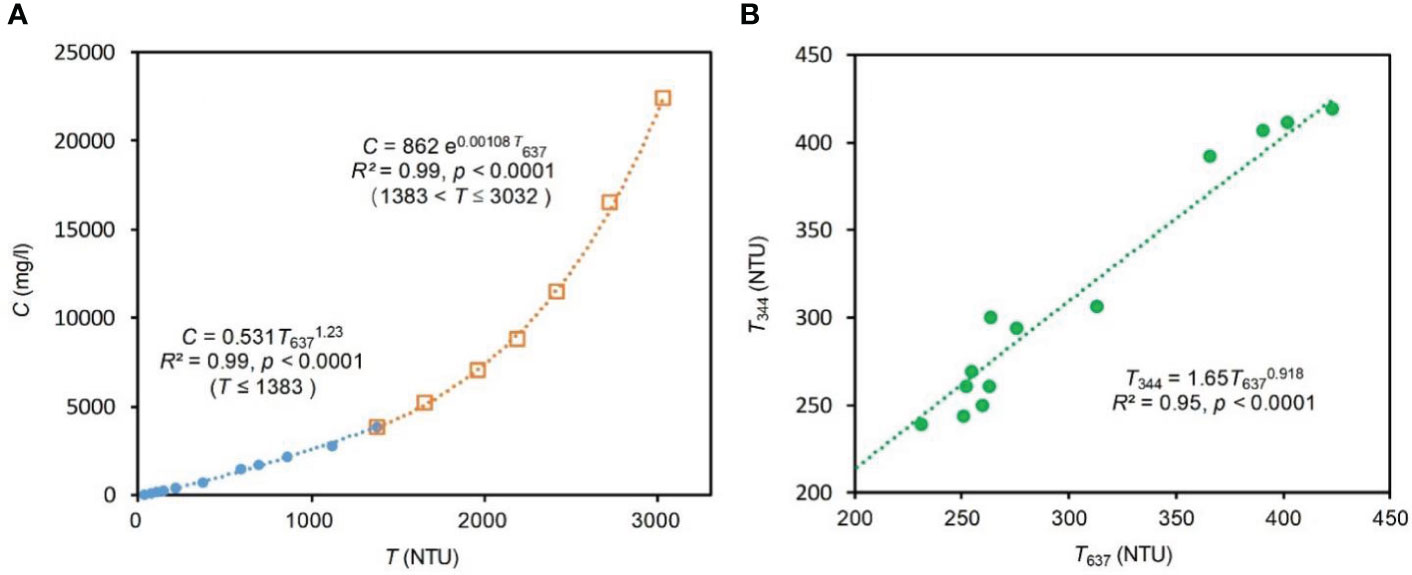
Figure 2 (A) Power-law correlations between the OBS637 turbidity (T637) and SSC (C) measurements based on calibration using in situ sediment samples (for maximum fit effect, two formulas were established in segments), and (B) power-law correlation between the OBS344 turbidity (T344) and OBS637 turbidity (T637) measurements. NTU: nephelometric turbidity unit. The OBS637 was used to measure near-bed turbidities, whereas the OBS344 was used to measure turbidity profiles.
Residual wind speed and direction, current velocity and direction, and sediment transport rate and direction were calculated by the method of vector composition. To effectively filter out the influence of the tidal signal on the residual current, we used a low-pass Butterworth filter (Thompson, 1983; Matte et al., 2014; Wan et al., 2015; Chen et al., 2016) with a filtering period of 34 h to process the raw flow data and obtained the residual currents. We define a tide cycle as the duration between two mean waters during the successive flood tides. Here, we identified 20 tidal cycles with durations of 12–13 h (average 12.5 h). In quantifying the influence of wind speed on wave height, to filter out the effect of tide-induced water-depth changes on wave height, we used tide-averaged data in constructing cross-correlations between wave height and wind speed. To find the optimal estimate for the time lag of wave height behind wind speed, we first constructed cross-correlations with different time lags of wave height behind wind speed, and then plotted the coefficient of determination (R2) against time lag.
In this study, we use the term “storm” to refer to an extreme weather event during which wind speed is markedly higher than that during fair weather (Leonardi et al., 2016). Upon consideration of the wind speed in the study area, and for the purpose of examining the impact of storms on residual sediment transport in tidal cycles, we define a storm event as a period during which 1) the wind speed exceeds 9.5 m/s for >20 h without interruption (i.e., markedly longer than a semidiurnal tidal cycle), 2) the maximum wind speed is >10.8 m/s (i.e., ≥ 6 on the Beaufort scale; Singleton, 2008), and 3) the mean wind speed is >10 m/s. To compare hydrodynamics and sediment transport between storm and fair weather periods, we define weak wind as a wind speed of < 5.0 m/s, moderate wind as a wind speed of 5.0–9.4 m/s, and storm wind as a wind speed of ≥ 9.5 m/s. We used the eight-orientation calculation method to describe wind directions, in which each orientation encompasses a direction scope of 45°. For example, northerly winds are winds that concentrated at 0°/360° and varied between 337.5° and 22.5°. The net wind component during a given period is defined as the algebraic sum of the wind components. The cumulative force of a wind component is defined as the sum of the products of the wind component and its duration.
During the field observation period, wind directions were generally northerly (i.e., southward), northwesterly, or northeasterly. The residual wind speed and direction were 6.7 m/s and 341°. There were two winter storm events, each followed by a fair-weather period. The durations of the first and second storm events were 21 and 42 hours, respectively. The storm winds were more stable in direction and had a greater southward component than the non-storm winds. Although the storm winds accounted for only 25% of the observation period, they contributed more than 40% of the total southward component of wind force (Figure 3A). The residual wind speed and direction were 10.1 m/s and 344°for the 6 tidal cycles with storm winds, 7.1 m/s and 338°for the 10 cycles with moderate winds, and 2.0 m/s and 7°for the 4 cycles with weak winds, respectively (Table 1). The time-averaged southward components of wind speed during the first and second storm events were 10.2 and 9.8 m/s, and the cumulative southward components of wind speed during the first and second storm events were 771,120 m (or 771,120 m/21 hours) and 1,446,480 m (or 1,446,480 m/42 hours), respectively.
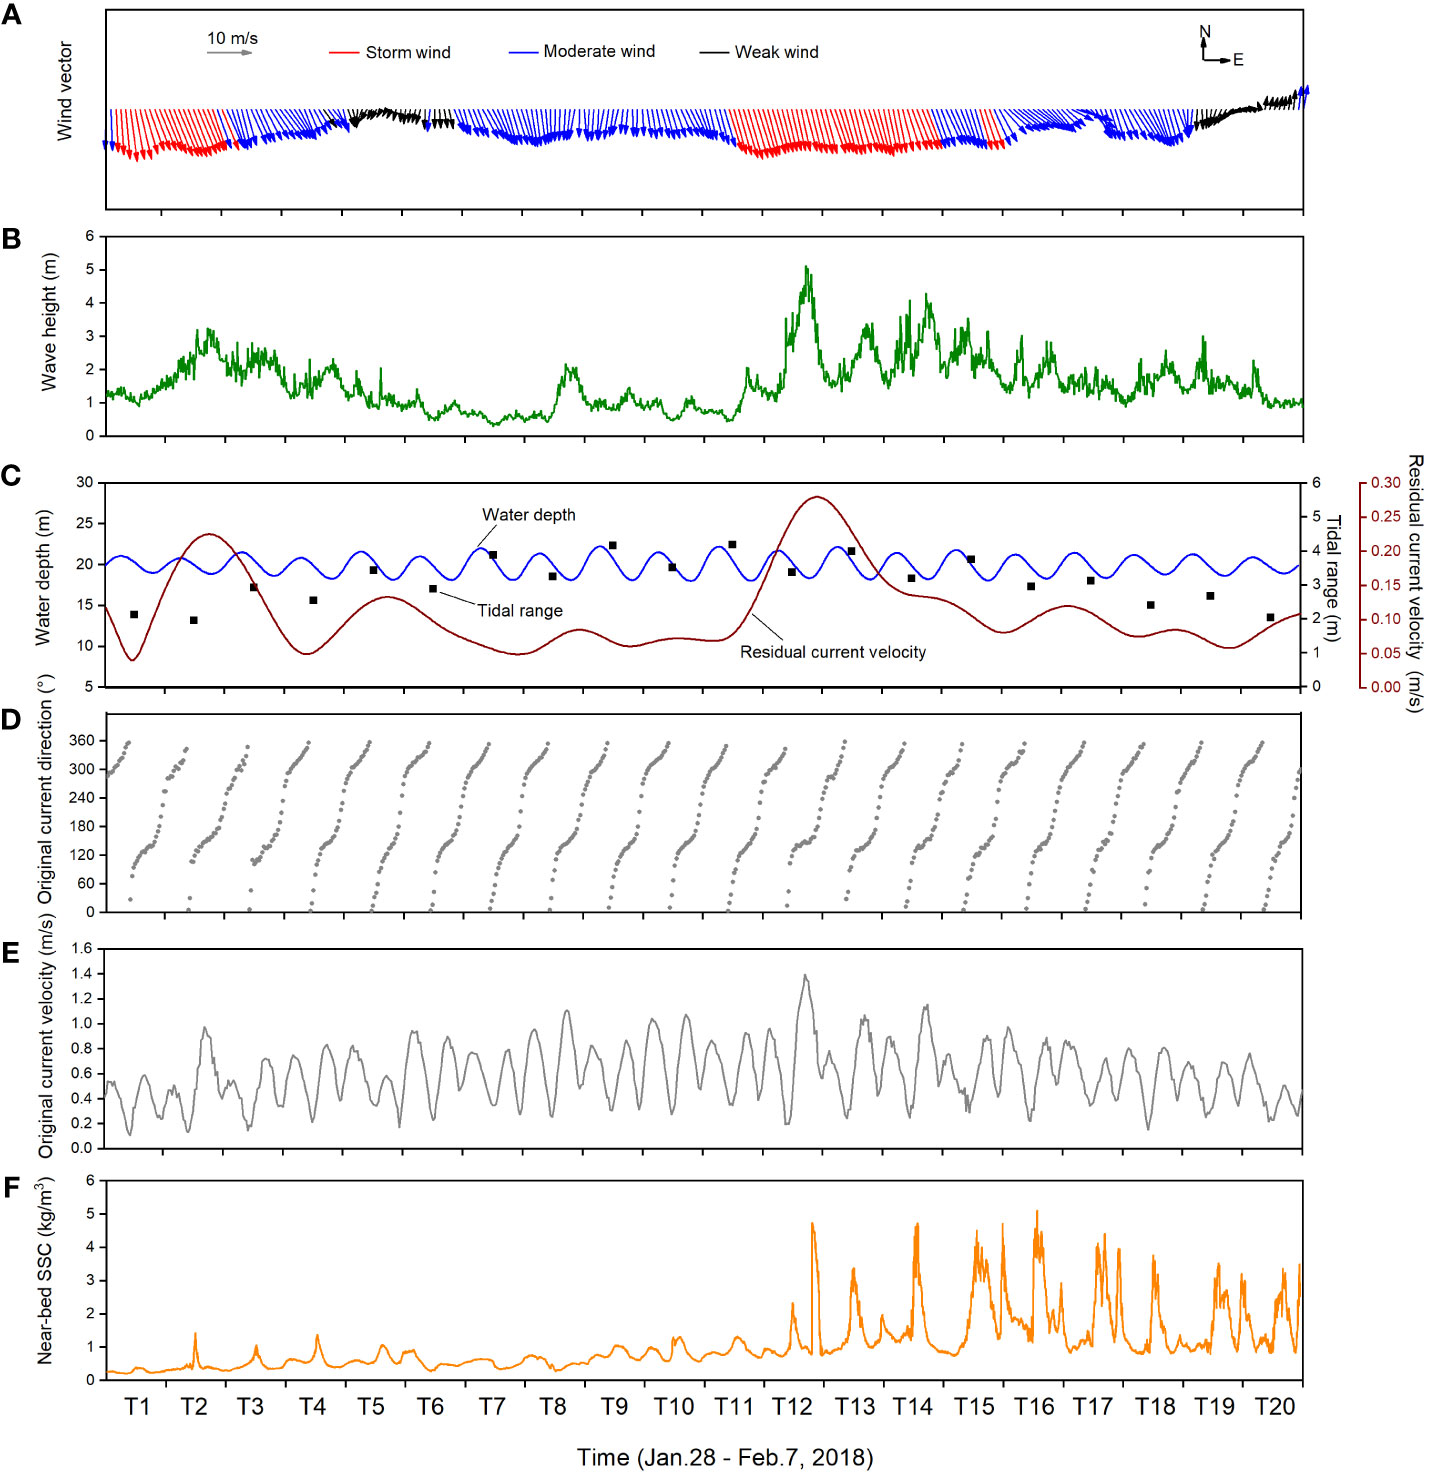
Figure 3 Time series of (A) wind speed and direction, (B) significant wave height, (C) water depth, depth-averaged residual current velocity and tidal range, (D) depth-averaged current direction, (E) depth-averaged original current velocity and (F) near-bed SSC during the observation period.
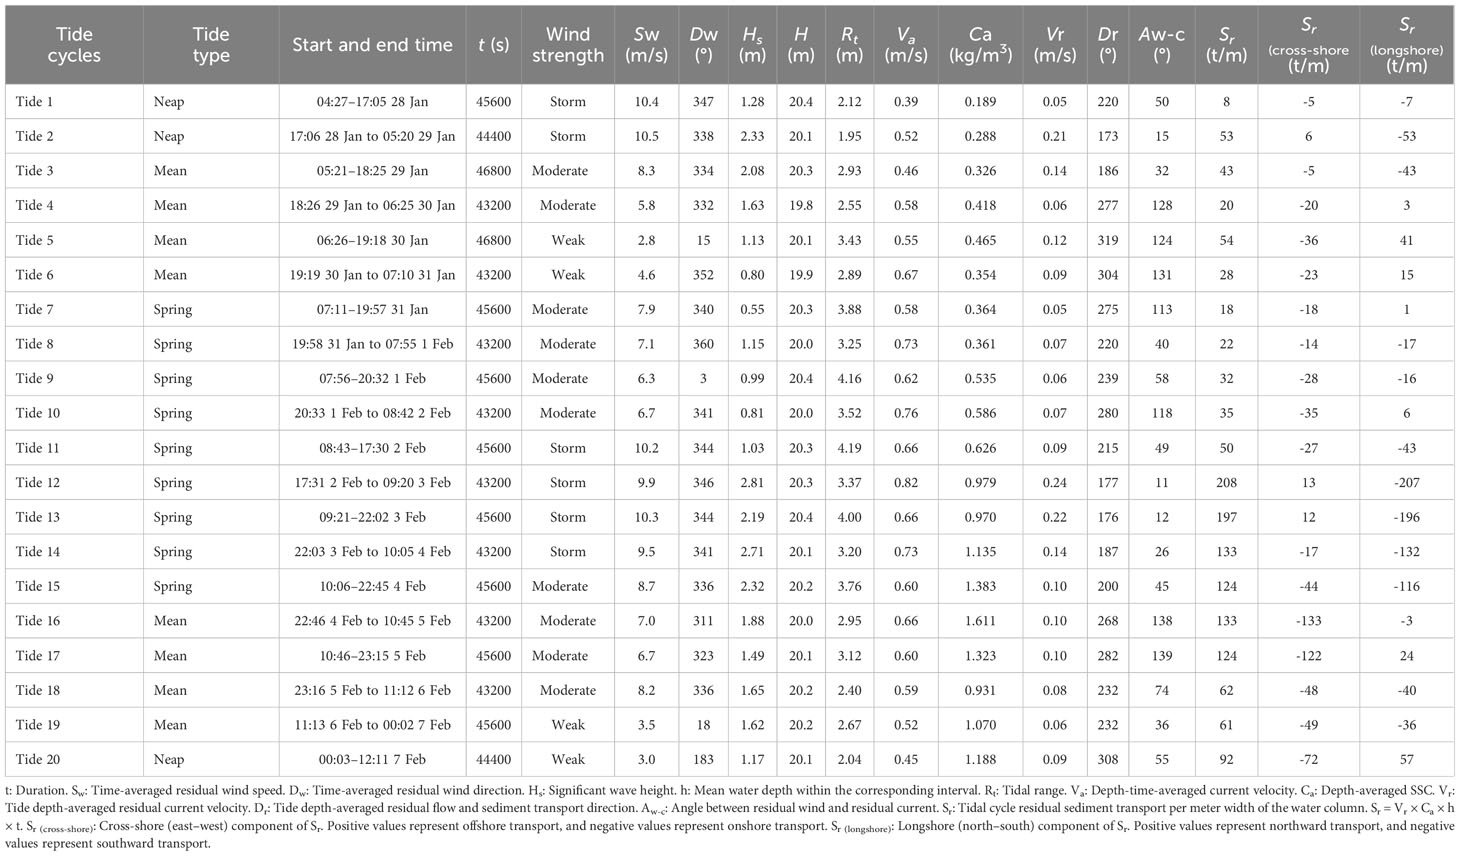
Table 1 Residual suspended sediment transport and influencing factors in tidal cycles.
Based on our definition, 21 storm events occurred in 2018. These events accounted for 9.2% of the annual total wind duration. Twelve storm events (57%) occurred in the winter half-year (mid-October to mid-April) and nine (43%) in the summer half-year. Eight storm events (38%) were associated with typhoons that occurred in July to early October, suggesting that most of the storm events were derived from cold-air outbreaks (Figure 4A). 14 of the 21 storm events (67%) had a dominant southward component. These storm events accounted for 6.4% of the annual total wind duration; however, they contributed 86% of the annual residual southward wind component. Three of the eight typhoon storm events (38%) had a dominant southward component. These events contributed 19% of the annual residual southward wind component. Overall, cold-wave-derived storm events contributed much more of the southward wind component compared with the typhoon storm events (Figure 4B). This dominance of winter storms over typhoons in contributing southward wind component is also true in the past four decades, based on analysis of wind data during the period 1979–2018 (Yang et al., 2023).
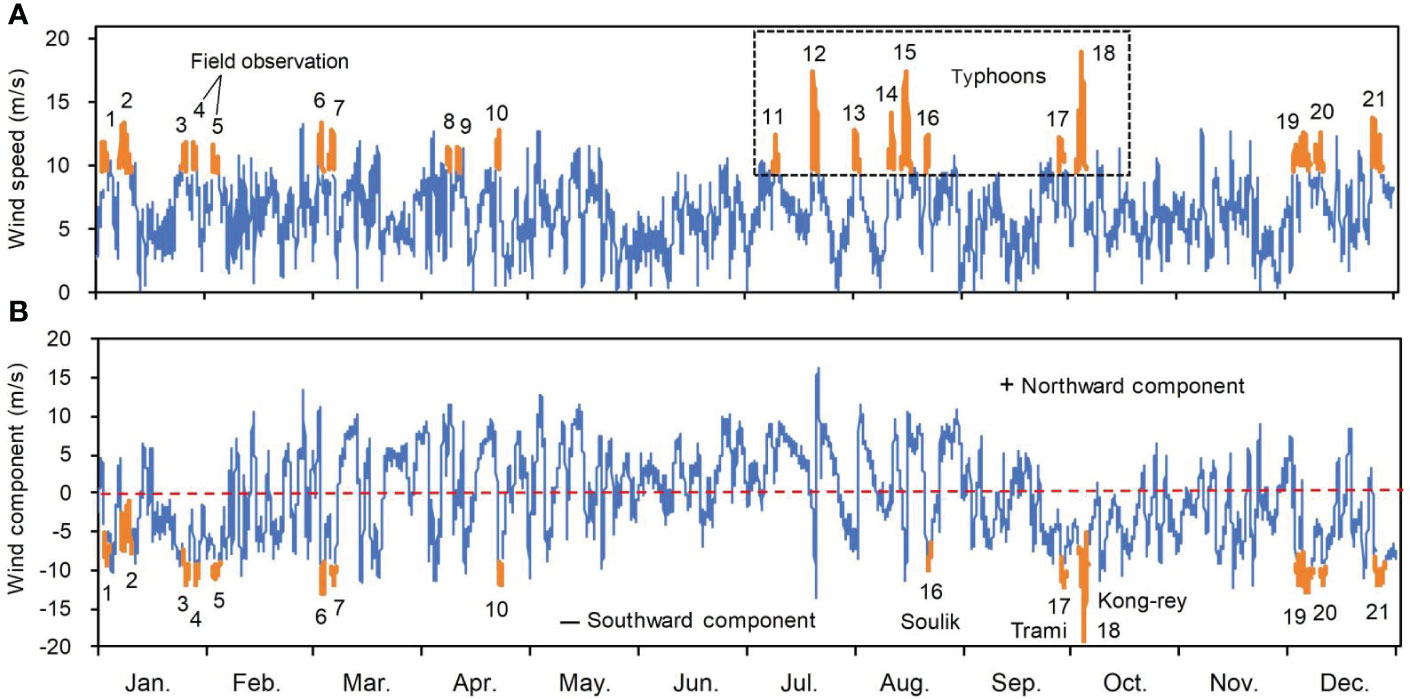
Figure 4 Time series of hourly wind speed and the longshore component in 2018. (A) Wind speed and storm events. (B) Wind component and storm events dominated by a southward component. The orange peaks in (A) represents storm events, as defined in the present study (see the Methods section). Numbers 1–21 represent storm events. Numbers 11–18 represent typhoons Maria, Ampil, Jangdari, Yagi, Rumbia, Soulik, Trami, and Kong-rey, respectively. Positive and negative values in (B) represent northward and southward components, respectively. The orange troughs in (B) represent storm events dominated by a southward component; numbers indicate storm events corresponding to those in (A).
The temporal pattern of wave height is similar to that of wind speed, allowing for a time lag of wave height behind wind speed. A peak wave height of 3.2 m occurred ~17 h after the maximum wind speed of the first storm event, and a peak wave height of 5.1 m occurred ~12 h after the maximum wind speed of the second storm event (Figure 3B). In order to identify the contributions of wind waves and swells, the analysis on power spectral density of water depth was conducted for the two periods of waves peaks (Figures 5A, B). The results showed that the energy of swells was weak and was barely detected in the former peak (Figures 5A, B). Therefore, the variations of wave height primarily reflected the domination of local winds, and the unsynchronization between wave height and wind speed was probably due to the time lag effect. Subsequently, changes in the coefficient of determination (R2) with time lag were analyzed (Figure 5C). The R2 is 0.24 for the in-phase wave height and wind speed. The value of R2 increases to a maximum of 0.75 in the case of a 12.5-hour lag of wave height behind wind speed. However, R2 decreases to 0.38 in the case of a 25-hour lag of wave height behind wind speed, and to ~0.01 in the case of a 50-hour lag (Figure 5C). On average, the significant wave height was 2.06 m for the 6 tidal cycles with storm winds, 1.46 m for the 10 cycles with moderate winds, and 1.18 m for the 4 cycles with weak winds. Allowing for a one-tide lag of wave height behind wind speed, the significant wave height was 2.41 m for the tidal cycles with storm winds, 1.33 m for the cycles with moderate winds, and 0.84 m for the cycles with weak winds. Allowing for a two-tide lag of wave height behind wind speed, the significant wave height was 2.14 m for the tidal cycles with storm winds, 1.43 m for the cycles with moderate winds, and 0.85 m for the cycles with weak winds (Table 2). Thus, the effect of storm wind on wave height is best reflected by a one-tide lag of wave height behind wind speed, and in this case the storm-increased wave height was nearly three folds high than that under calm weathers.
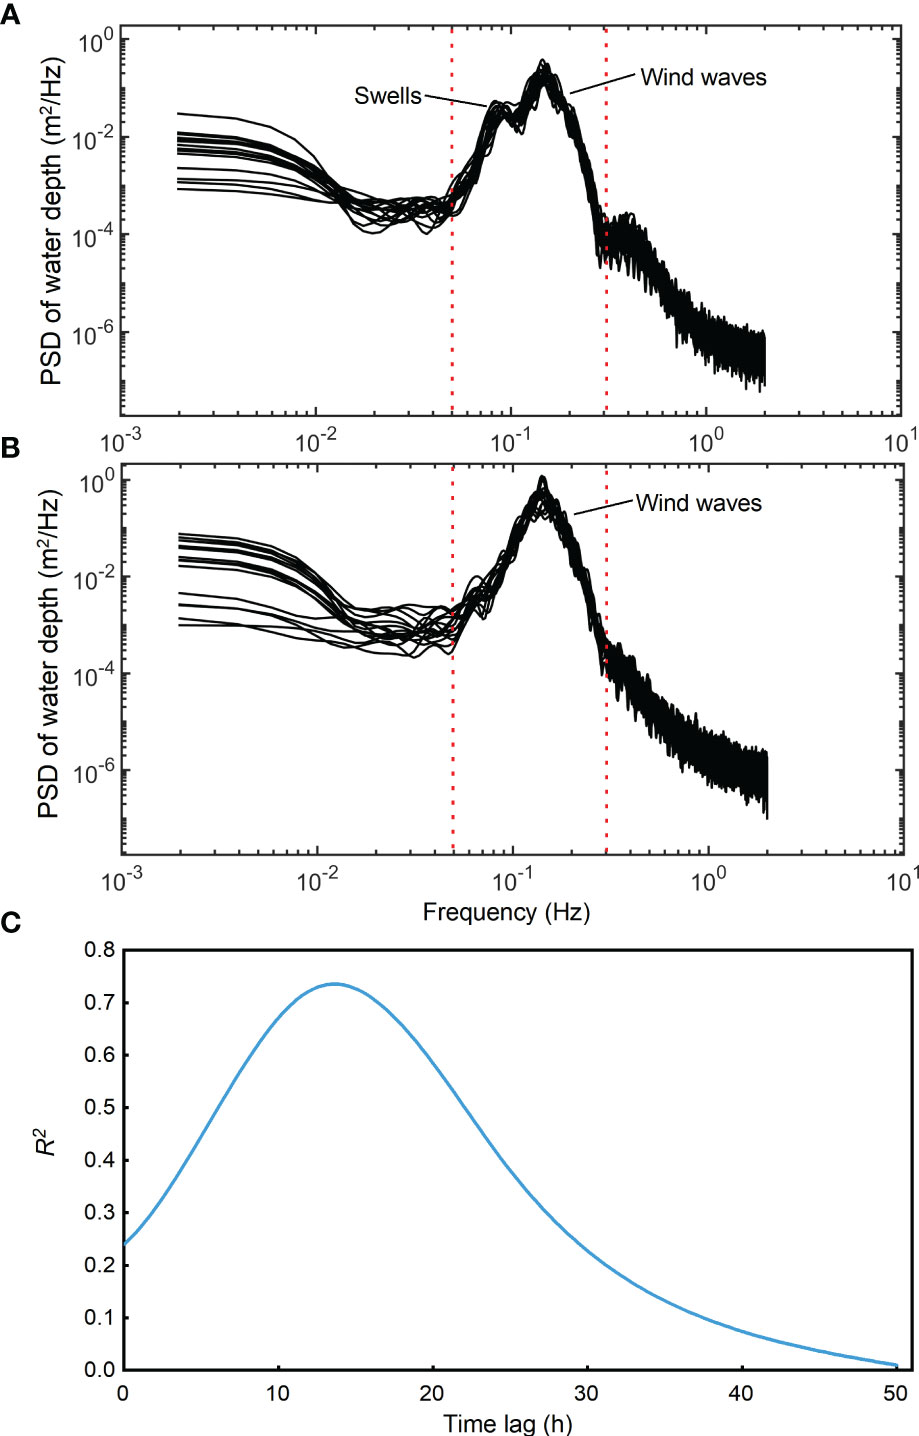
Figure 5 (A) The power spectral density of water depth during the first winter storm event. (B) The power spectral density of water depth during the second winter storm event. (C) Changes in the coefficient of determination (R2) with time lag of wave height behind wind speed, suggesting a maximum cross-correlation at a 12.5-hours lag. This plot is based on correlations using the wind speed and wave height data shown in Table 1.
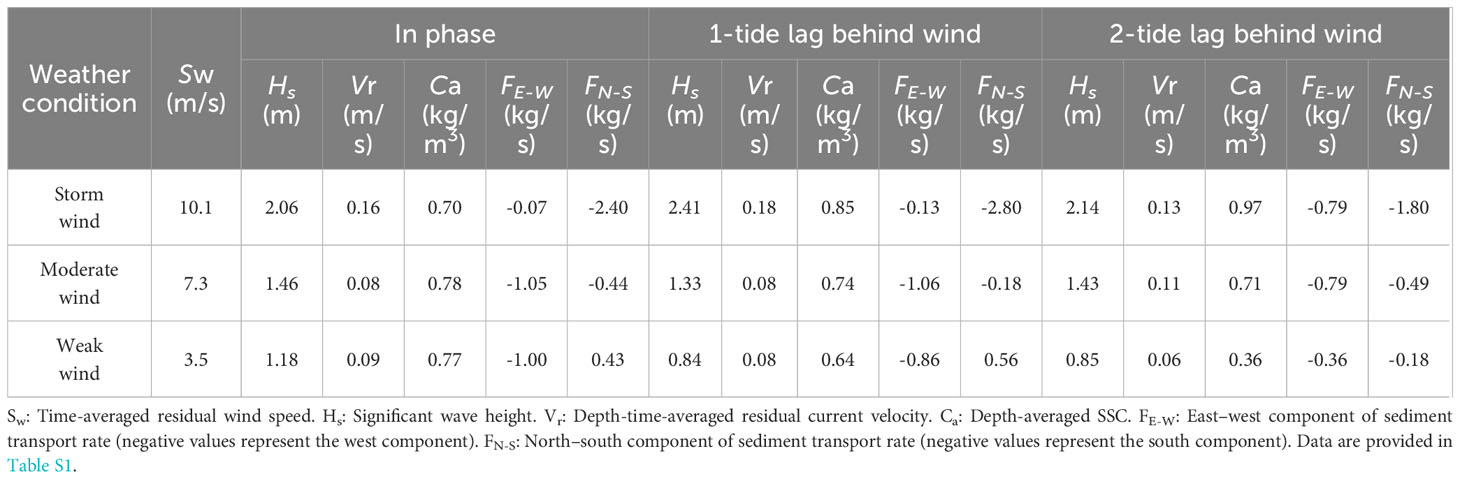
Table 2 Comparison of residual suspended sediment transport and key factors between storm and non-storm scenarios.
The temporal change in tidal range was fluctuant (Figure 3C), reflecting the occurrence of irregular, semi-diurnal tides. The mean tidal range of the 6 storm-wind tides was 3.14 m, and the mean tidal range of the 14 non-storm-wind tides was 3.11 m (3.25 m for the 10 moderate-wind tides and 2.76 m for the 4 weak-wind tides; Table 1). The current directions were mainly back and forth. The dominant directions during the flood phases were northwesterly (towards the inner Yangtze Estuary), whist the dominant directions during the ebb phases were southeasterly. These dominant directions normally corresponded to peak velocities during the flood and ebb phases, respectively (Figures 3C-E). Despite the intra-tidal cyclicity, the current velocity showed a temporal pattern of increase from neap to spring tides and decrease from spring to neap tides (Figure 3E; Table 1).
On average, the residual current velocity was 0.16 m/s under winter storm conditions and 0.08–0.09 m/s during fair weather. The tidal-cycle residual current directions varied between 173° and 220° under winter storm conditions and between 186° and 319° in fair weather. The residual current direction was southward during four of the six tidal cycles with winter storm winds and southwestward during the other two. The residual current direction during periods of moderate wind was southward during two tides, southwestward during three tides, and westward during five tides. The residual current direction during periods of weak wind was southwestward during one tide and northwestward during three tides. The angle between the residual current and wind ranged from 11° to 139°; the greater the wind speed, the smaller the angle between the residual current and wind. There was a significant negative correlation between this angle and wind speed (R2 = 0.27, p = 0.023). Assuming a one-tide lag of residual current behind the wind event, the coefficient of determination increased (R2 = 0.31, p = 0.017). However, the coefficient of determination decreased markedly for a two-tide lag, and the negative correlation between the angle and wind speed became insignificant (R2 =0.02, p > 0.05; Table 1). Similar patterns between residual current velocity and wind speeds were also revealed. The coefficient of determination were 0.21, 0.35 and 0.12 under the in phase, one-tide lag and two-tide lag, respectively. Therefore, to better understand the effect of wind on the residual current, a one-tide lag of residual current behind the wind event must be considered. Using this time lag, the average residual current velocity was 0.18 m/s under storm-wind conditions compared with 0.08 m/s under fair weather, and all the residual current directions under storm conditions were southward (173°–200°; Figures 6A, B; Tables 1, 2).
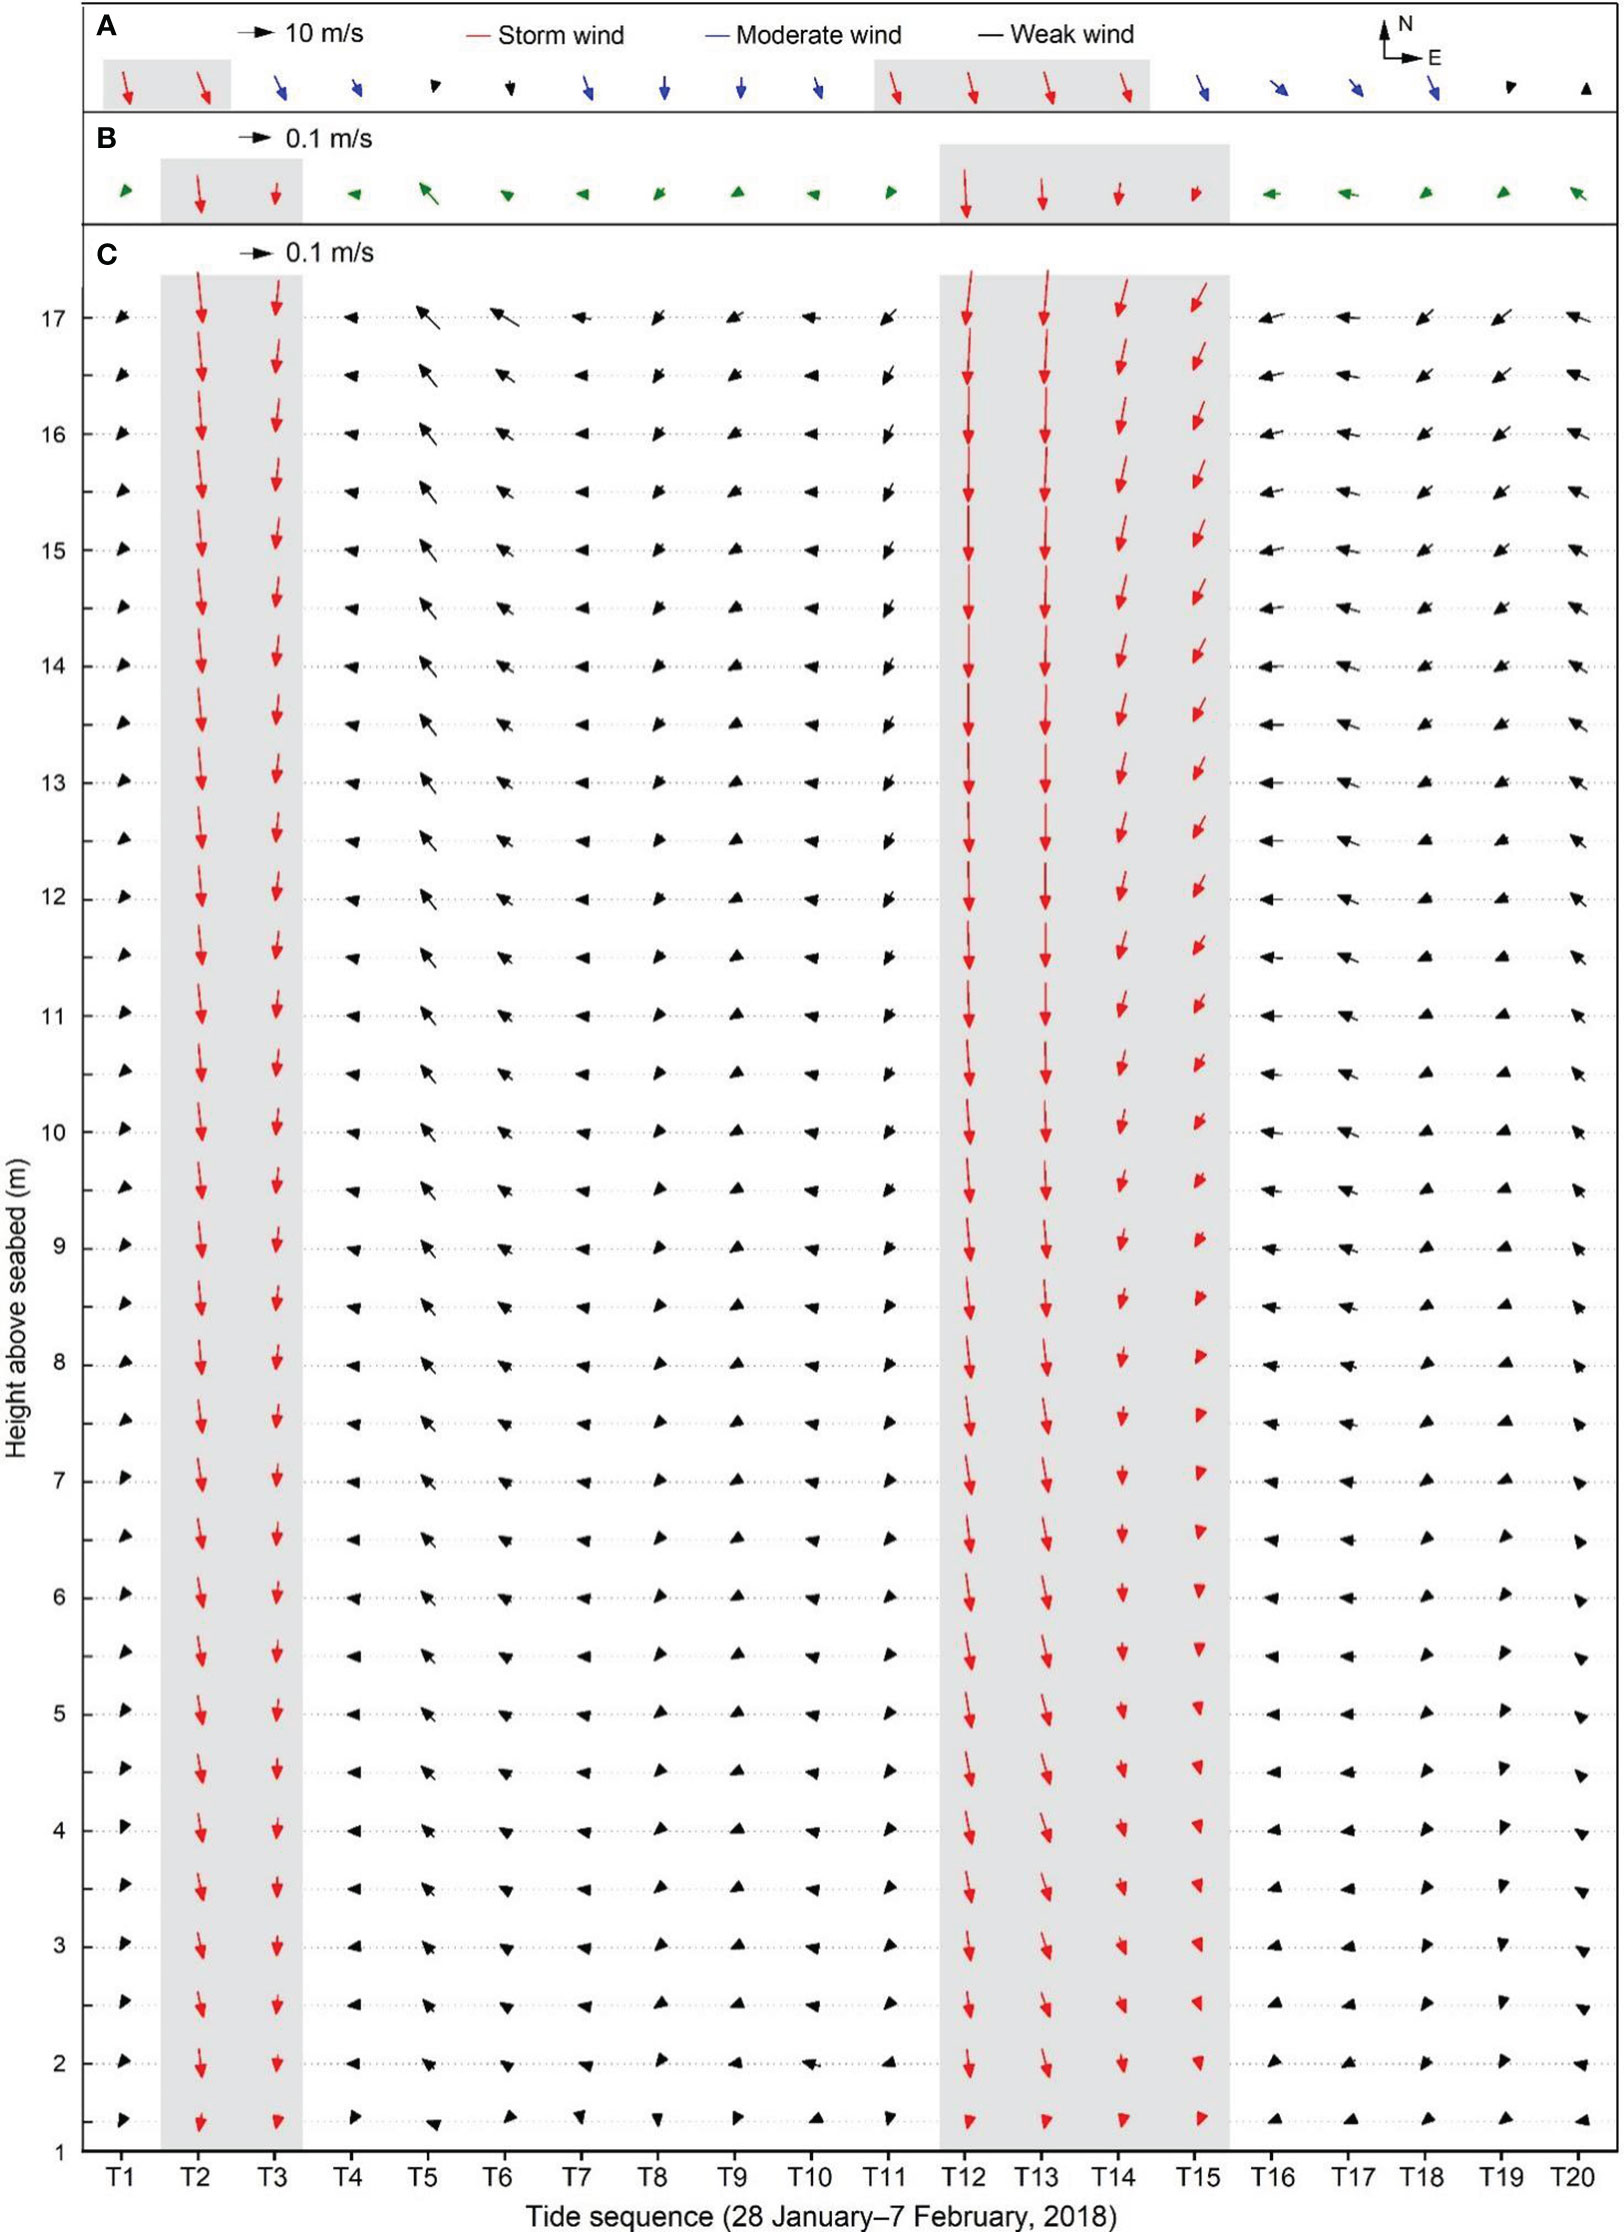
Figure 6 (A) Tidal-cycle residual wind vectors, (B) depth-averaged current, and (C) current profile during the study period. Gray shading in (A) represents storm winds, and in (B,C) represents residual currents under storm impacts that are best reflected with a one-tide lag behind storm winds. T1–T20 represent tides 1–20, respectively.
All the vertical profiles of residual current velocity show marked decreasing trends. Overall, the residual current velocity decreased from 0.11 m/s at the near-surface layer to 0.04 m/s at the near-bed layer. However, the profiles under storm conditions show greater regularity than those obtained under fair-weather conditions. For example, the R2 value between the residual current velocity and the height above the seabed ranged from 0.91 to 0.97 (average 0.94) for tidal cycles under storm conditions and from 0.20 to 0.96 (average 0.79) for tidal cycles under fair-weather conditions. The maximum difference in residual current direction in the profiles ranges from 9° to 54° (average 30°) for tidal cycles under storm conditions and from 24° to 122° (average 57°) for those under fair-weather conditions (Figure 6C; Supplementary Table S2).
In addition to exhibiting tidal cyclicity, SSCs increased from 28 January to 5 February (tides 1–16) and decreased from 5 to 7 February (tides 16–20). The SSC increased gradually during the period prior to 3 February, on which date there was an abrupt increase. The gradual increasing trend in SSC corresponds to the increasing trends in tidal range and current velocity, and the abrupt increase on 3 February corresponds to the highest significant wave height during the major storm event (Figure 3F; Table 1). A high SSC (0.7–5.6 kg/m3) was maintained until 5 February, despite reductions in wave height and tidal current velocity after 3 February, suggesting a time lag of SSC behind tidal hydrodynamics (Figure 3). Near-surface SSCs were consistently lower than near-bed SSCs, with difference varying during the tidal cycle. The SSC profiles show significant downward trends (Figure 7; Supplementary Figure S1). The regression trends indicate that the ratios of surface to near-bed SSC were 0.09–0.70 (average 0.34), and the ratios of depth-averaged to near-bed SSC were 0.49–0.90 (average 0.69; Table 3). The mean ratio of depth-averaged to near-bed SSC (0.69) and the tide-averaged near-bed SSCs (0.27–2.33 kg/m3) indicate that the tide-depth-averaged SSCs during the twenty observed tidal cycles ranged from 0.19 to 1.61 kg/m3 (average 0.76 kg/m3; Table 1).
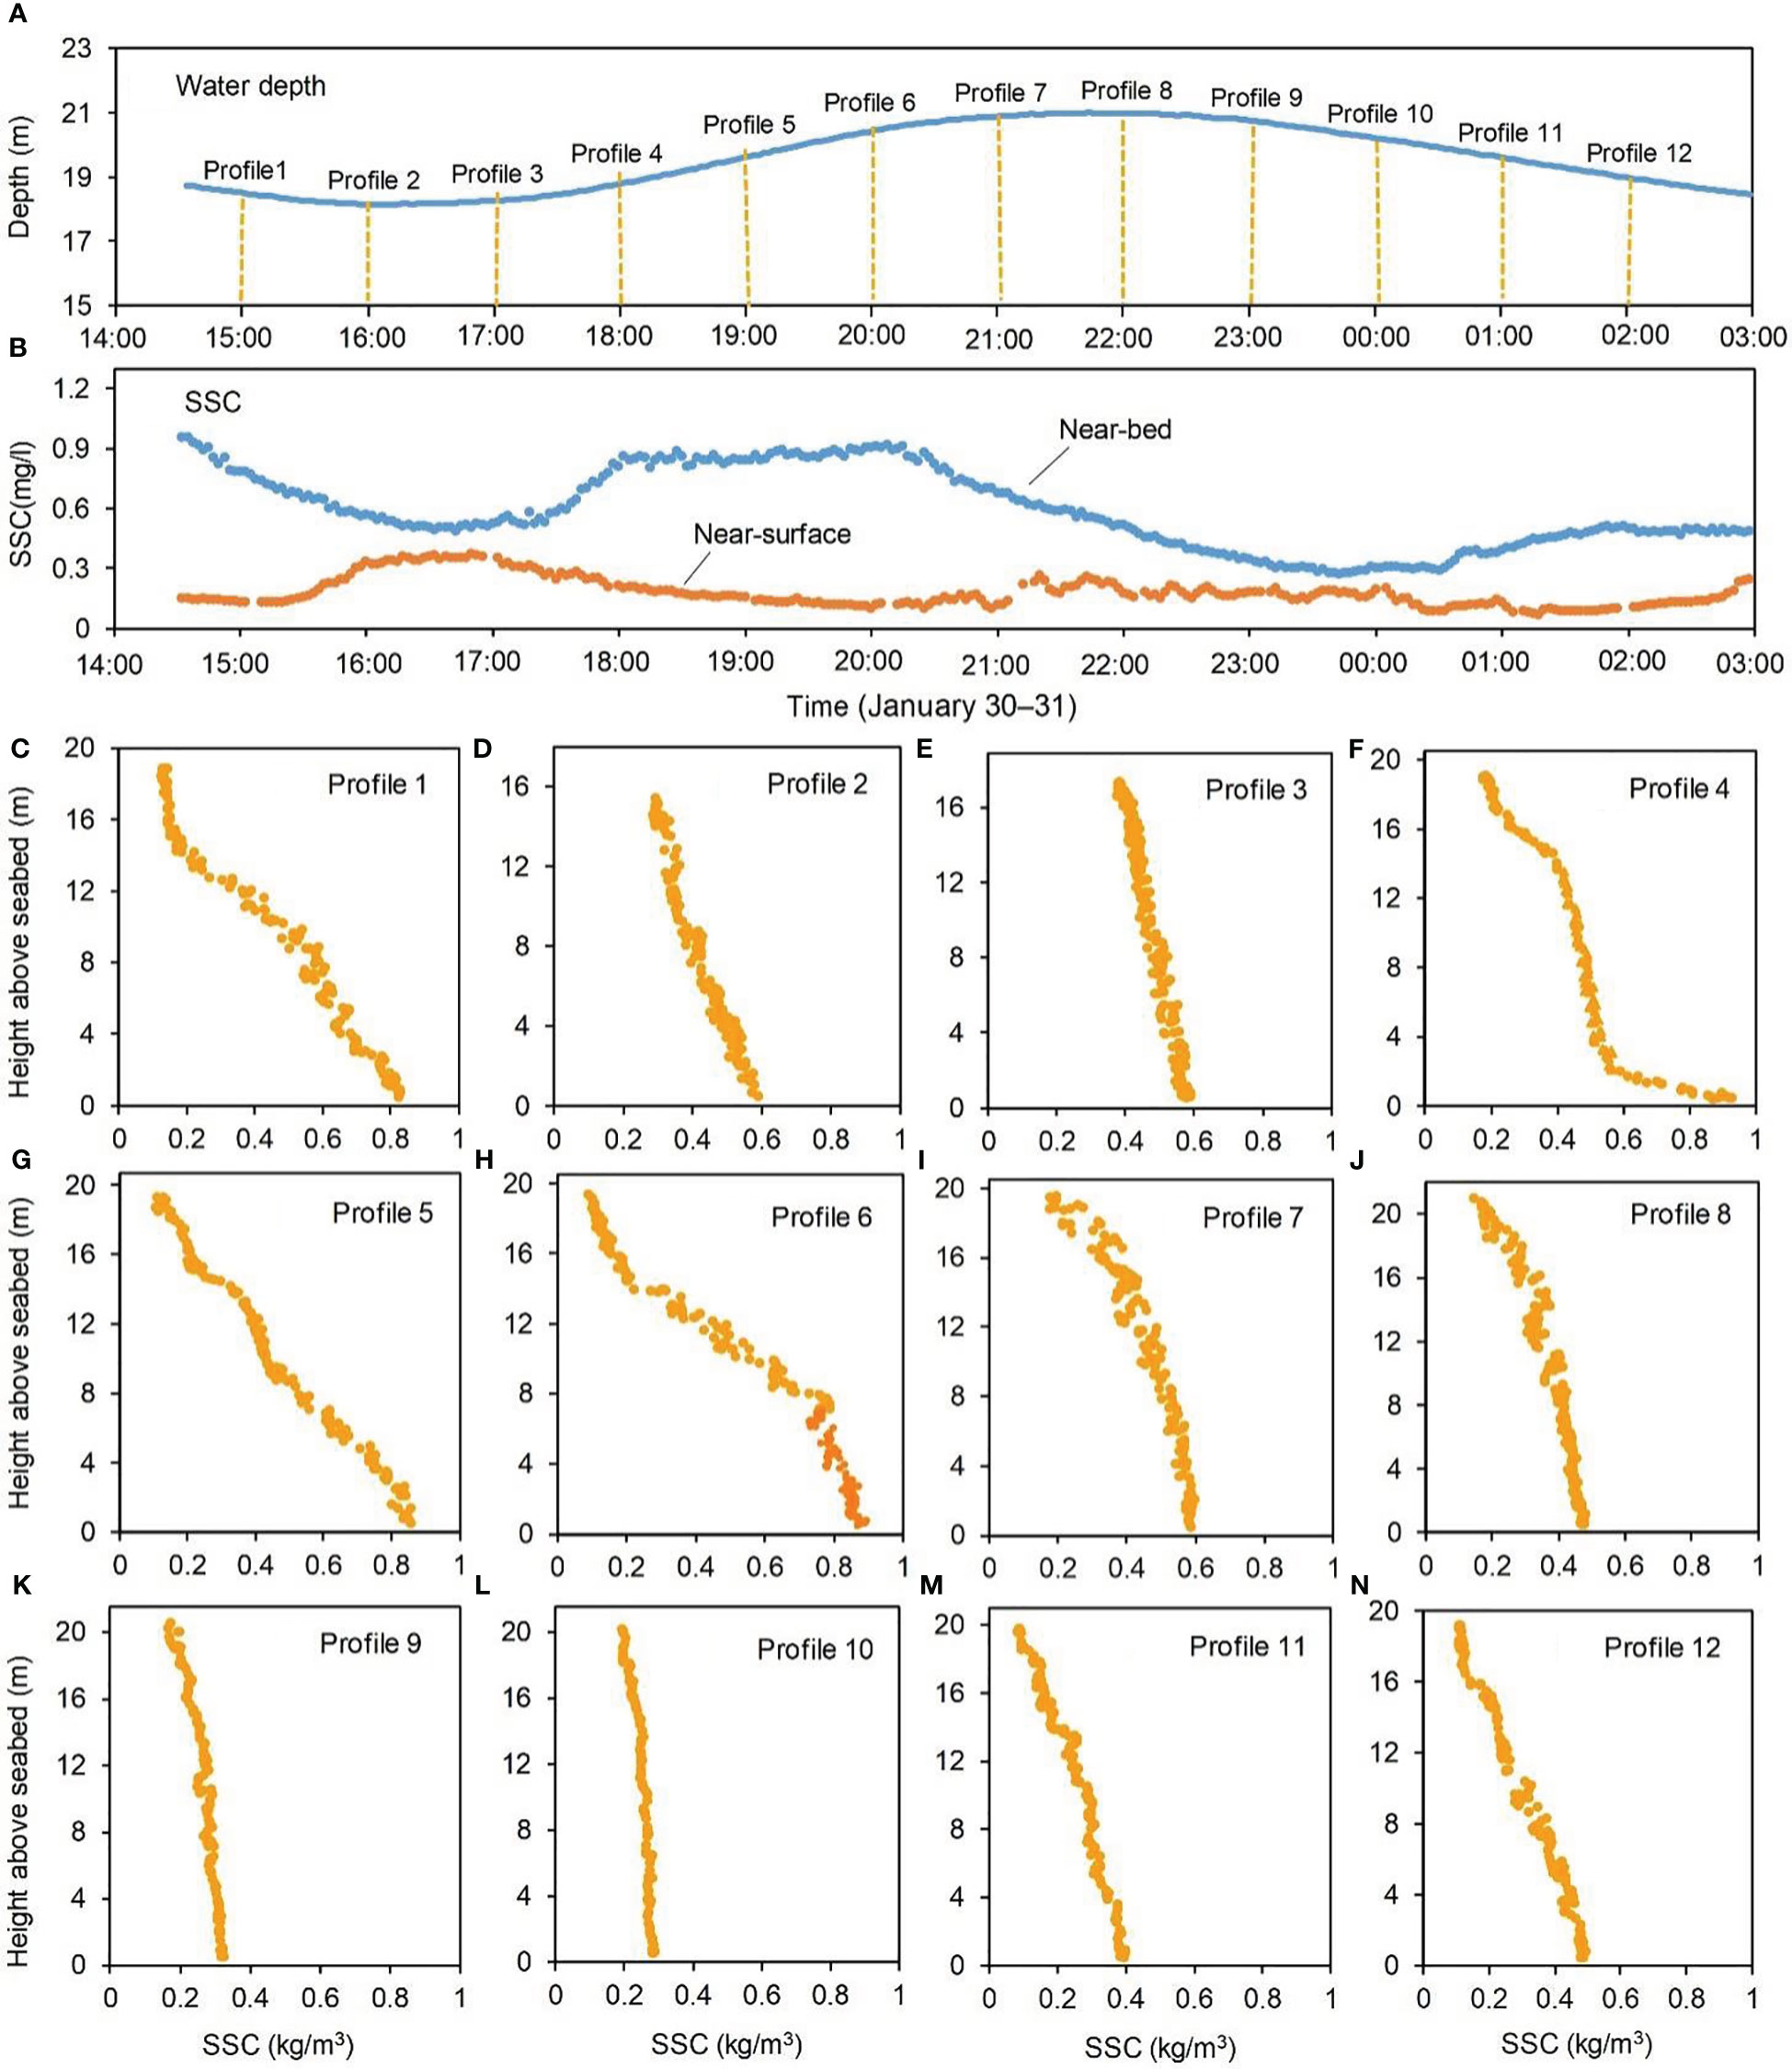
Figure 7 Intra-tidal variations in (A) water depth, (B) SSC, and (C–N) hourly vertical profiles of SSC, based on measurements obtained during tide 6.
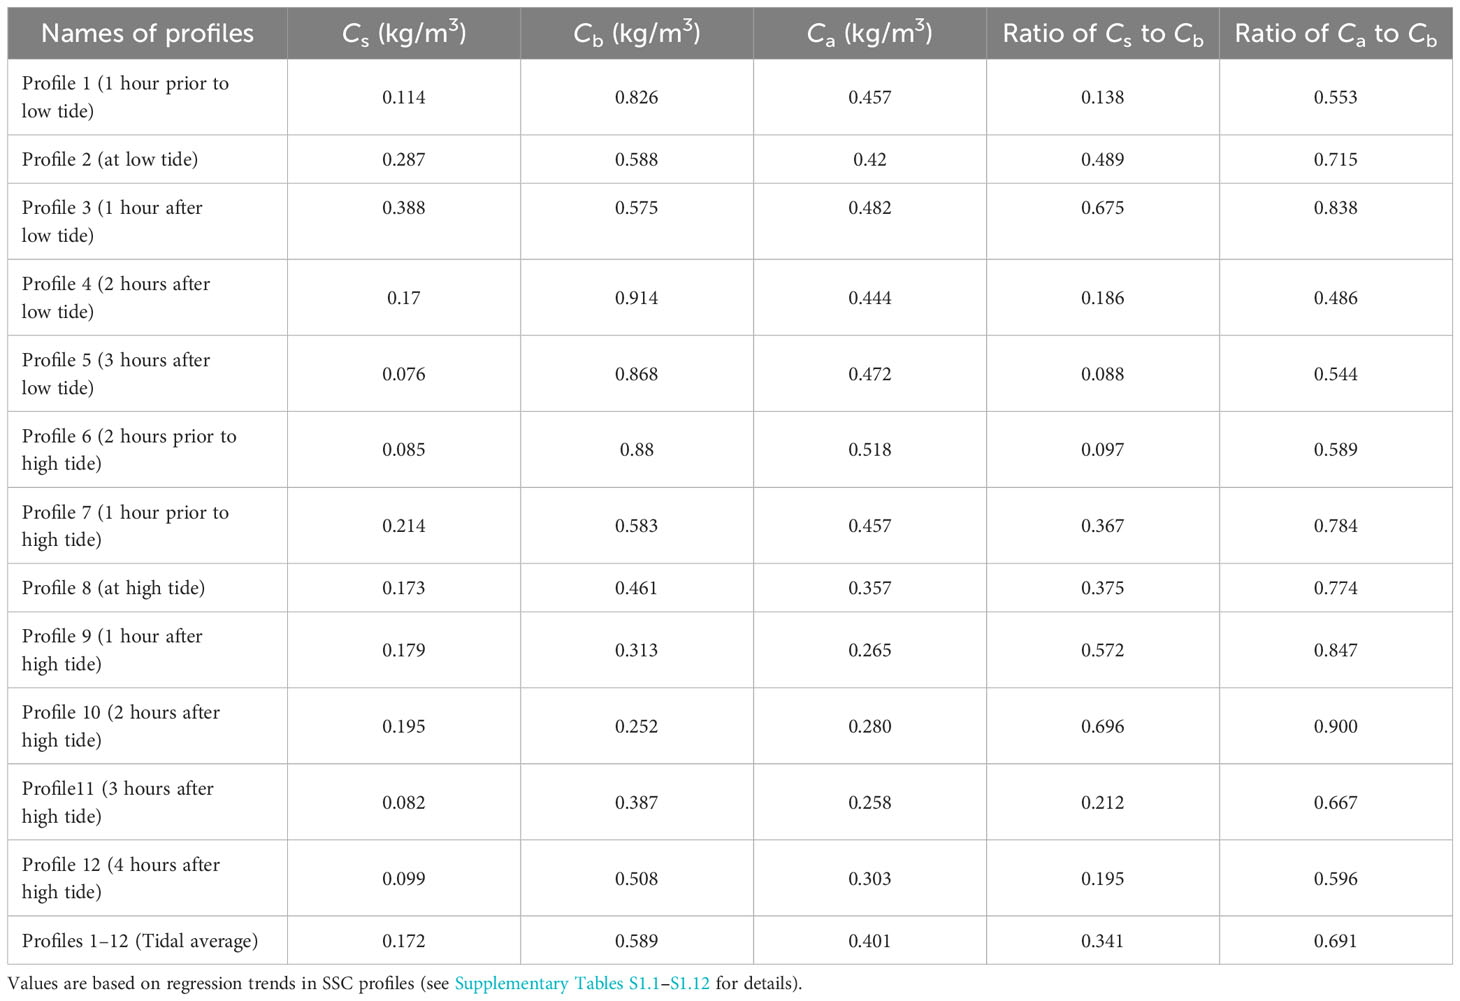
Table 3 Ratios of near-surface SSC (Cs) and depth-averaged SSC (Ca) to near-bed SSC (Cb) in vertical profiles of SSC during tidal cycles, based on measurements obtained during tide 6.
The cross-shore residual sediment transport component was onshore (westward) during 17 tidal cycles and offshore (eastward) during the other 3 (tides 2, 12, and 13) that occurred during storm events with northwesterly winds (338°–346°). The longshore residual sediment transport component was southward during 13 tidal cycles and northward during the other 7. The residual sediment transport direction was southward during the six tidal cycles under storm conditions, and the rates of sediment transport per unit width of cross-section ranged from 43 to 207 t/m (ton/meter) (average 125 t/m), considering a one-tide lag of sediment transport behind wind force (Table 1). During the tidal cycles under moderate-wind conditions, the residual sediment transport direction was either southward or northward, with the rates of the southward sediment transport ranging from 3 to 43 t/m (average 26 t/m) and those of northward sediment transport ranging from 3 to 41 t/m (average 19 t/m) (Table 1). During the tidal cycles under weak-wind conditions, the residual sediment transport direction was northward, and the rates of sediment transport ranged from 1 to 57 t/m (average 24 t/m) (Table 1). The highest northward residual transport rate (57 t/m) occurred at tide 20. Considering a one-tide lag of sediment transport behind wind force, the cumulative southward sediment transport at the six tidal cycles under storm impact (tides 2–3 and 12–15) (747 t/m) accounts for 82% of the total southward sediment transport during the thirteen tidal cycles (tides 1, 2–3, 8–9, 11–16 and 18–19) (909 t/m), and contributes 98% of the overall net southward sediment transport in the observation period (tides 1–20) (762 t/m) (Figure 8; Table 1).
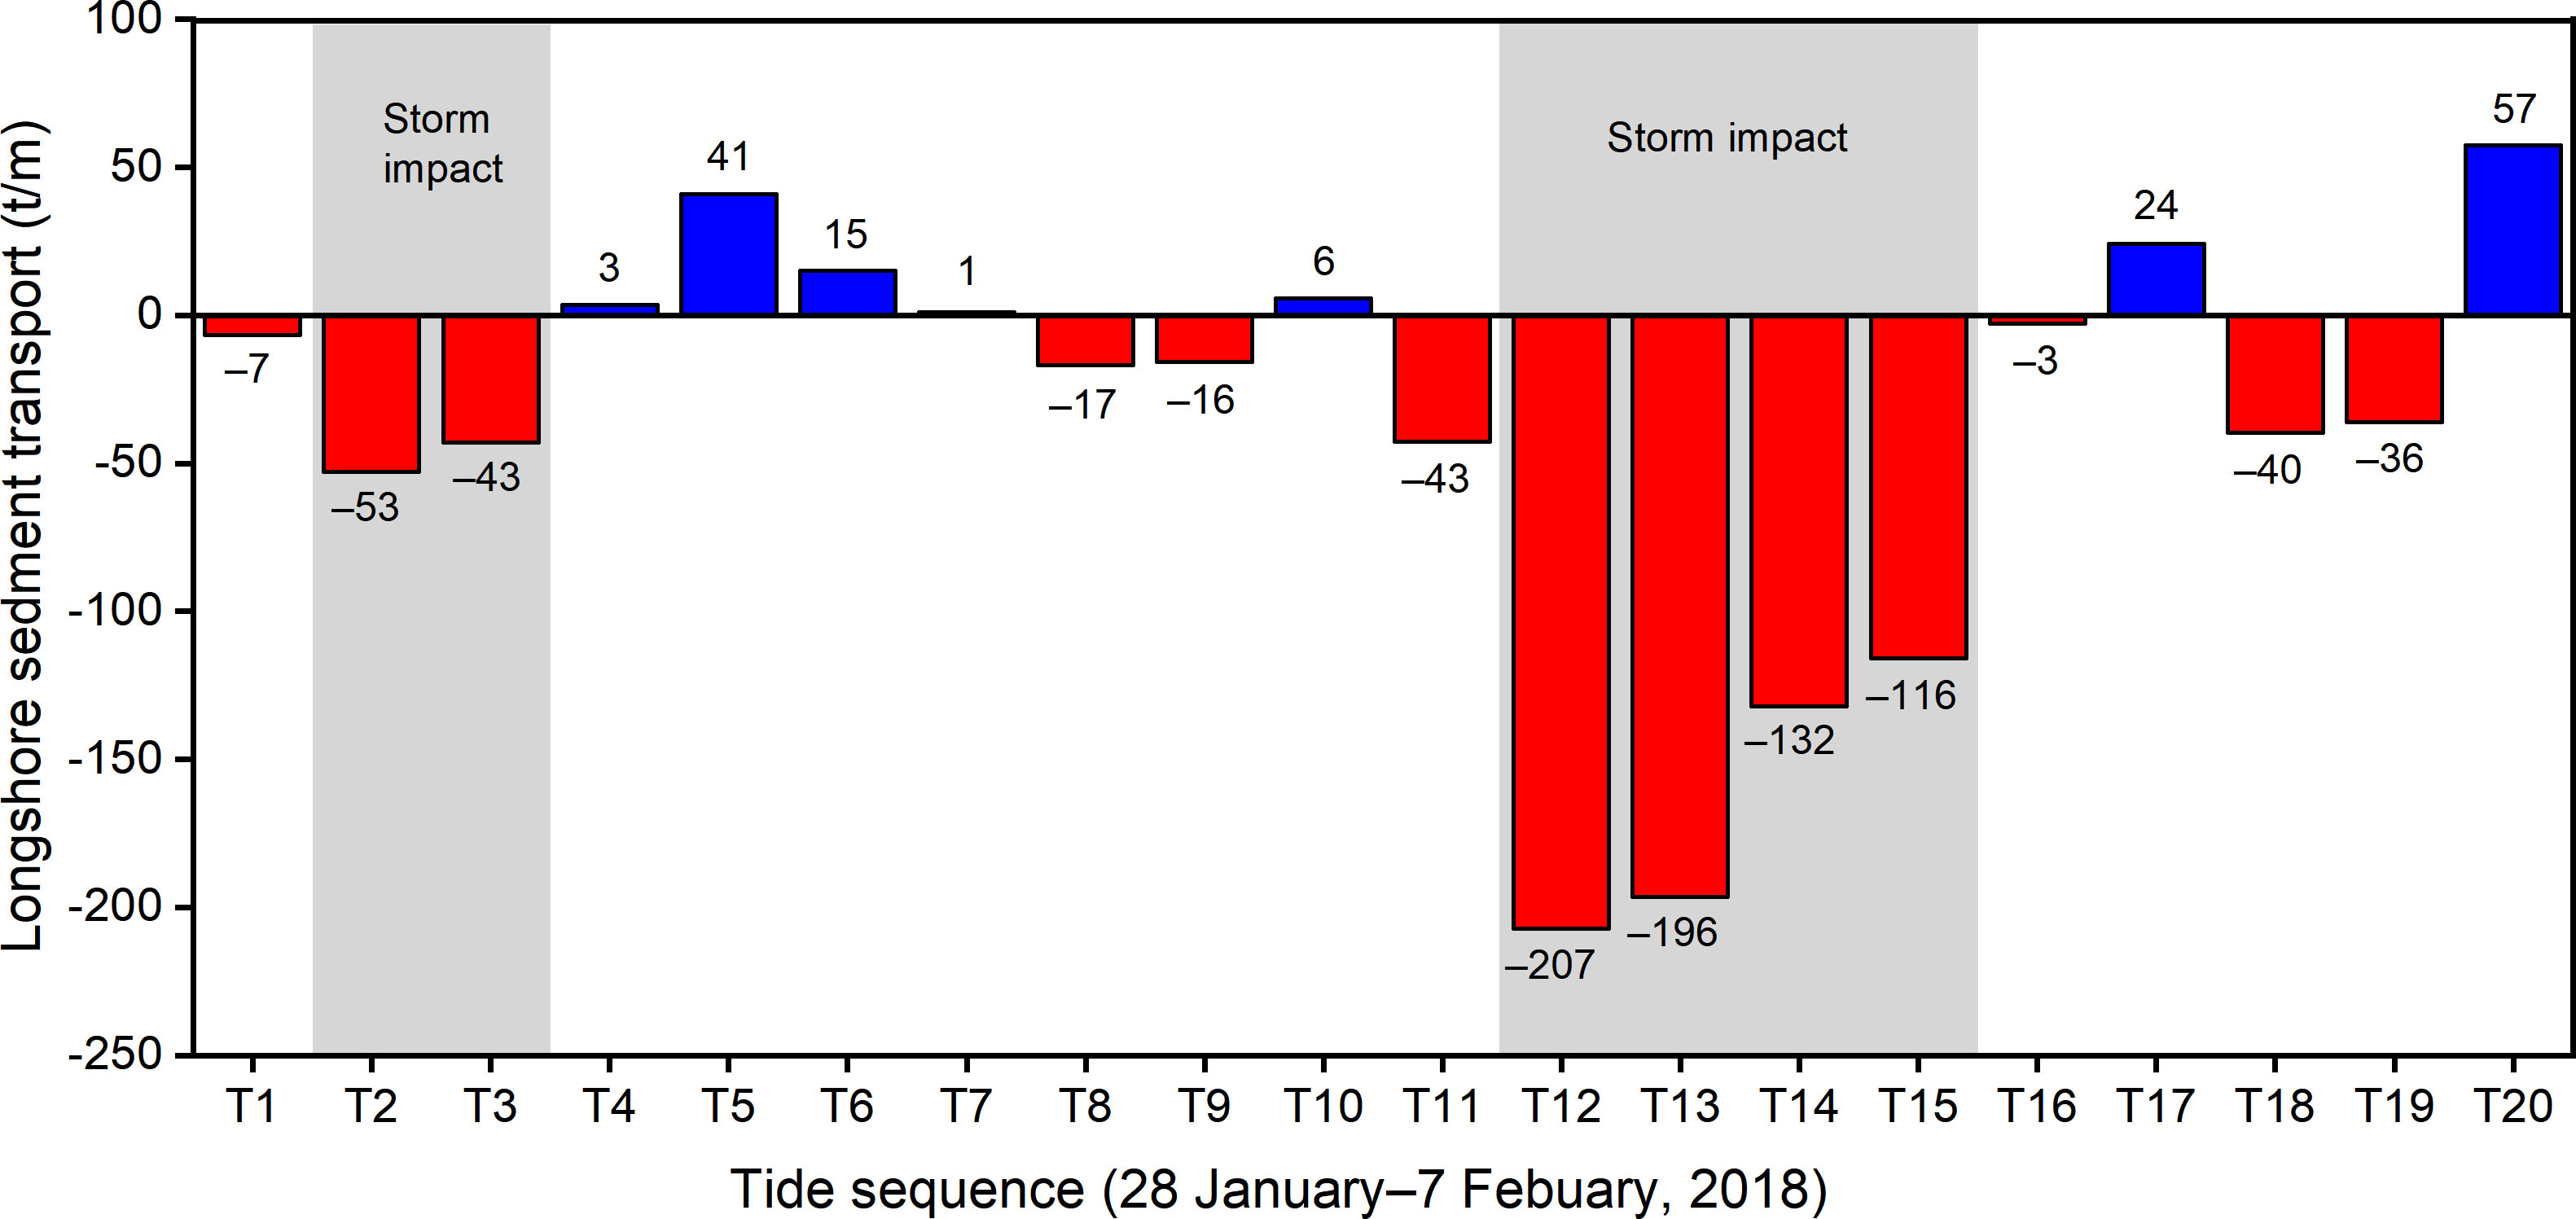
Figure 8 Residual longshore sediment transport per meter width of the water column during the tidal cycles in the study period. Negative values denote southward transport. Gray shading represents sediment transport under storm-weather conditions that are best reflected with a one-tide lag behind storm wind.
Our results suggest that massive southward longshore sediment transport from the offshore subaqueous Yangtze Delta occurred during the winter storm study period, and this was most likely the case during other winter storm periods over the course of the year. This southward sediment transport occurred mainly during storm events because storms result in enhanced wave power and sediment resuspension, and because most winter storms are dominated by a northerly wind component and thereby drive strong southward residual currents (Yang et al., 2023; Zhu et al., 2024). Minimal southward sediment transport occurs during fair-weather conditions, even if the winds are dominated by a southward component. Therefore, the southward sediment transport is episodic and discontinuous, even during the winter monsoon season. There is a nonlinear relation between longshore sediment rate and wind force. To better understand the impact of winter storms on longshore sediment transport, a certain time-lag effect should be considered.
It is expected that all winter storms in the Northern Hemisphere contribute a strong southward wind component. However, only some of the typhoons influencing the Yangtze Delta contribute a strong southward wind component. In the case of 2018, only three of the eight typhoons (i.e., Soulik, Trami, and Kong-rey) led to southward storm winds in the Yangtze Delta region. The tracks of Soulik, Trami, and Kong-rey indicate that they migrated from south to north over the Western Pacific and crossed the 31° latitude line to the east of the Yangtze Delta. The other five typhoons made landfall either at or south of the Yangtze Delta. This finding is consistent with the results of a previous study that demonstrated that the migration path of a typhoon dictates whether it would lead to the development of southward storm winds in the Yangtze Delta (Yang et al., 2023). In contrast, all storm events during winter were dominated by a southward wind component (Figure 4). During our observation period, winter storm events accounted for 30% of the wind duration and 40% of the net southward wind component (Figure 3A), and likely contributed 82% of the total southward sediment transport and 98% of the net southward sediment transport (Figure 8). During the winter season of 2018 (December–February), winter storm events accounted for 19% of the wind duration and 60% of the net southward wind component. During 2018, storm events accounted for 9% of the wind duration and 70% of the net southward wind component; but the winter storms contributed much more of the southward wind component than the typhoons (Figure 4). Therefore, storm events assumedly dominated the annual net southward sediment transport from the Yangtze Delta to the Zhejiang–Fujian coasts, but winter storms most likely dominated over typhoons in driving this transport. This dominance is the result of winter storms being the key driver of southward longshore currents (Figure 6) and because the storm-induced waves give rise to increased sediment resuspension (Figure 3). The dominance of winter storms over typhoons in driving southward delivery of sediment from the Yangtze Delta may be also true in decadal scale, considering that, as shown above, winter storms dominated over typhoons in contributing southward wind component during the period 1979–2018 (Yang et al., 2023). A recent study also emphasized the importance of winter storms. By utilizing long-term field observations, bathymetric data, and simulation modeling, they analyzed 108 deltas around the world and found that winter storms caused subaqueous deltas to degrade (Zhu et al., 2024).
Despite the general dominance of winter storms over typhoons in annual or long-term longshore sediment transport from the Yangtze Delta, individual typhoons may lead to greater sediment redistribution than individual winter storm, because the maximum wind speeds of typhoons tend to be higher than the maximum wind speeds of winter storms (e.g., Figure 4A), and the increased wave height and sediment resuspension during individual typhoons are usually greater than those during individual winter storms (Yang et al., 2023; Wu et al., 2024). Larger increased waves during typhoon events also mean greater area of sediment resuspension, because larger waves can disturb deeper seabed (Yang et al., 2023). In short, winter storm is a different extreme weather pattern from typhoon and hurricane. While both extreme weather patterns can cause massive coastal sediment redistribution, winter storm impact is higher in frequency and more consistent in southward sediment transport than typhoon and hurricane impacts. On the other hand, individual typhoons and hurricanes can lead to greater sediment redistribution than individual winter storms, even though the direction of sediment transport during typhoon and hurricane events is variable, depending on their tracks.
The time series of wind, wave, SSC, residual current, and longshore sediment transport data (Figures 3, 6; Table 1), and the coefficient of determination between wave height and wind speed as a function of time (Figure 5C) suggest an approximate one-tide lag in longshore sediment transport rate behind wind force. This time lag is due to the following factors. 1) The formation of waves and drifts requires a certain period of wind blowing. 2) Because of the inertia of water motion, wave propagation and tidal drift will continue for some time after the storm ends. 3) It takes time for sediment particles to be re-suspended and deposited, especially in deep water. 4) Immediately after the storm abates, wave power may be maintained at a level much higher than the critical water energy between sediment resuspension and deposition, which would lead to net resuspension and a continued increase in SSC (Liu et al., 2014; Yang et al., 2019). The settling velocities of the Yangtze Estuary sediments are 0.016–0.39 mm/s (Chen, 2013). Therefore, a period of 14–350 h would be required for storm-resuspended sediments to settle out from the water to the seafloor at our observation site (~20 m water depth). The coarser the sediment particle and the smaller the distance from the particle to the seabed, the shorter the time for the particle to settle out. Strictly speaking, the time lag in wave power behind a winter storm and the time lag in SSC behind tidal hydrodynamics should be variable. Different storm intensities may result in varying time delays. In this study, a one-tide lag is an optimal estimation but is not the only option. A one-tide lag may be partly relevant to the statistical unit (i.e., one tide); e.g., if the statistical unit is a day, the optimal estimation would be a one-day lag. An optimal estimation of a one-day lag in SSC behind tidal range has been suggested for the offshore subaqueous Yangtze Delta (Yang et al., 2023). In the present study, the high SSC maintained in the first few tidal cycles after the end of the second storm was likely caused by a lag in the effects of wind waves and tides on the SSC (Figure 3; Table 1). A similar time lag in SSC behind storm winds (i.e., where the maximum SSC occurred after the storm had abated) has also been determined for the mud belt area south of the Yangtze Delta (Yang et al., 2007).
In addition to wind speed and direction, which control wave-induced sediment resuspension and drift-induced residual sediment transport, other factors (e.g., sediment properties, tidal conditions, and wave power under fair weather) may also influence the rate of longshore sediment transport under storm-weather conditions. As noted above, the sediments of the offshore subaqueous Yangtze Delta are composed mainly of silt and clay (Luo et al., 2017). The water content of these sediments is relatively high (suggesting low compaction) because of the rapid deposition since the late Holocene. Macrotidal (spring tidal range > 4 m; Davies, 1964) and semidiurnal tidal conditions in the offshore subaqueous Yangtze Delta result in a high current velocity (Figure 3E). The Yangtze Delta is exposed to the East China Sea (Figure 1A), leading to the development of large waves even during periods of fair weather. Therefore, background SSCs are usually high, even under fair-weather and neap-tide conditions (Figure 3F; Yang et al., 2007; Yang et al., 2020b, 2023). Storm waves increase SSCs, but they are not the sole cause of the high SSCs in the Yangtze Delta. The massive southward sediment transport from the Yangtze Delta during the study period should be attributed not only to a direct contribution from storm winds but also an indirect contribution from other factors such as easily erodible loose sediments, macrotidal conditions and moderate background wave heights. Without the storm winds, southward longshore currents and sediment transport would be minimal. Without the other factors, the rate of the southward sediment transport would be greatly decreased, even during individual storm events, although it is difficult for us to quantify this decrease in sediment transport. Specifically, if neap tides had occurred during the second storm event in the study period, the SSCs would have been much lower than those observed, and the southward sediment transport from the Yangtze Delta would have been greatly reduced.
The Mississippi and Yangtze rivers have a comparable sediment discharge (~500 Mt/yr prior to dam construction in the last century and ~120 Mt/yr in the recent decade), and both deltas are among the world’s largest deltas (Yang et al., 2021). However, in contrast to the Yangtze Delta, the subaqueous Mississippi Delta is microtidal (tidal range < 0.5 m) and has a diurnal tidal cycle (Arndorfer, 1973), leading to much weaker tidal currents (tidal-depth-averaged velocities of < 0.2 m/s) than in the Yangtze Delta (tide-depth-averaged velocities of 0.4–0.8 m/s, Table 1) (Wang et al., 2018b). And the significant wave height in the subaqueous Mississippi Delta is typically < 0.4 m, which is also lower than that in the Yangtze Delta (Figure 3B; Fan et al., 2006; Wang et al., 2018b). As a result, SSCs in the subaqueous Mississippi Delta are an order of magnitude lower than those in the subaqueous Yangtze Delta (Yang et al., 2021). Under these low-SSC conditions, residual sediment transport would be limited, even under storm-weather conditions, which is most likely why the Mississippi Delta forms a bird-foot delta. Like the Mississippi Delta, the Nile Delta is microtidal (tidal range ≤ 0.5 m), and the progradation of the Nile Delta formed promontories prior to river damming. After the construction of the Aswan High Dam, rapid retreat of the promontories was observed (Milliman & Farnsworth, 2011). If the subaqueous Yangtze Delta was microtidal, the delta would be substantially larger and the Zhejiang–Fujian mud belt would be much smaller. There are many other deltas such as the Ebro, Mackenzie, Rhone, Rio Grande, Vistula, Yenisei and Yesil deltas whose tidal range is very small (≤ 0.5 m). On the other hand, some deltas (e.g., Amazon, Irrawaddy, Gange, Namada, and Han deltas) have tidal ranges greater than or equal to the tidal range of the Yangtze Delta (Yang et al., 2020a). In short, the rate of longshore sediment transport during a storm event is controlled not only by the storm itself but also by local tides, waves, and sediment properties.
This study has several limitations. First, we conducted field observations at only one station, and the observations lasted for only ten days; therefore, it is difficult to estimate the total sediment transport over the cross-shore section during winter or over the entire year. Second, we defined storms and storm events based on the characteristics of local winds to evaluate the effects of the low-frequency but strongest winds on longshore sediment transport. This definition might not apply to winds in regions elsewhere. Third, our identification of a one-tide lag in sediment transport behind wind force may be partly related to the time unit (one tide) needed to calculate the residual current; i.e., the one-tide lag is an estimation and is not precise. These limitations need to be addressed in future work.
Our results suggest the occurrence of massive southward longshore residual sediment transport from the offshore subaqueous Yangtze Delta during winter storm events. The mechanisms controlling this transport include intense resuspension of fine-grained sediments in the delta and strong southward longshore residual currents during storm events. There is a half-day lag in longshore sediment transport behind the winter storm winds because the development of waves and drifts requires a certain period of wind, water flow and wave propagation are subject to inertia, and the settling velocity of fine-grained sediments is slow. Under fair-weather conditions during periods between winter storms, there is minimal sediment transport from the Yangtze Delta. Although southward storms occur mainly during winter, they also occur at other times, including in the typhoon season. Despite their low frequency (~6%), the southward storm events mainly derived from winter storms may make the greatest contribution to the southward sediment transport from the Yangtze Delta and play a dominant role in the supply of sediment to the Zhejiang–Fujian mud belt. Because the sediments transported southward from the delta during storm events are derived mainly from the resuspension of delta deposits, the rate of southward sediment transport would not be markedly affected by the recent decline in fluvial sediment discharge caused by dam construction. However, erosion of the Yangtze Delta and the southward transport of sediment will most likely increase with storm activity under global warming. Although the effects of storms on longshore sediment transport are influenced by local tidal hydrodynamics and sediment properties, and may vary among different coasts, our findings may be helpful for evaluating the relative importance of low-frequency storms and high-frequency non-storm winds in terms of sediment redistribution, especially for ecosystems such as wetland and tidal flats that are highly sensitive to hydrological and climate change.
The original contributions presented in the study are included in the article/Supplementary Material. Further inquiries can be directed to the corresponding authors.
MT: Conceptualization, Methodology, Visualization, Writing – original draft. HY: Writing – review & editing, Investigation. WZ: Data curation, Investigation, Supervision, Writing – review & editing. KX: Supervision, Writing – review & editing. BS: Writing – review & editing. YW: Writing – review & editing. SY: Funding acquisition, Supervision, Validation, Writing – review & editing.
The author(s) declare financial support was received for the research, authorship, and/or publication of this article. This work was supported by the National Natural Science Foundation of China (U2240220, 42106167, 41576092, 42076170).
We Thank S. S. Zhang, J. Q. Fan and Q.Y. Wu for their assistance in the filed observation.
The authors declare that the research was conducted in the absence of any commercial or financial relationships that could be construed as a potential conflict of interest.
All claims expressed in this article are solely those of the authors and do not necessarily represent those of their affiliated organizations, or those of the publisher, the editors and the reviewers. Any product that may be evaluated in this article, or claim that may be made by its manufacturer, is not guaranteed or endorsed by the publisher.
The Supplementary Material for this article can be found online at: https://www.frontiersin.org/articles/10.3389/fmars.2024.1420559/full#supplementary-material
Arndorfer D. J. (1973). Discharge patterns in two crevasses of the Mississippi River delta. Mar. Geol. 15, 269–287. doi: 10.1016/0025-3227(73)90074-1
Bhatia K. T., Vecchi G. A., Knutson T. R., Murakami H., Kossin J., Dixon K. W., et al. (2019). Recent increases in tropical cyclone intensification rates. Nat. Commun. 10, 635. doi: 10.1038/s41467-019-08471-z
Cheal A. J., MacNeil M. A., Emslie M. J., Sweatman H. (2017). The threat to coral reefs from more intense cyclones under climate change. Global Change Biol. 23, 1511–1524. doi: 10.1111/gcb.13593
Chen X. (2013). Experimental study on deposition in static water of fine-grained sediments of the Yangtze River Estuary. Ocean University of China, Shandong, Qingdao, 78.
Chen Z. G., Wang S. P., Leng C., Wang Z. X. (2016). Study on synthesized filtering algorithm for ADCP velocity data (in Chinese). Yangtze River 47, 42–47 + 89. doi: 10.16232/j.cnki.1001–4179.2016.13.010
Davies J. L. (1964). A morphogenic approach to world shorelines. Z. fur. Geomorphol. 8, 127–142. doi: 10.1127/zfg/mortensen/8/1964/127
Deng B., Wu H., Yang S. L., Zhang J. (2017). Longshore suspended sediment transport and its implications for submarine erosion off the Yangtze River Estuary. Estuar. Coast. Shelf Sci. 190, 1–10. doi: 10.1016/j.ecss.2017.03.015
Emanuel K. A. (2013). Downscaling CMIP5 climate models shows increased tropical cyclone activity over the 21st century. Proc. Natl. Acad. Sci. 110, 12219–12224. doi: 10.1073/pnas.1301293110
Fan D. D., Guo Y. X., Wang P., Shi J. Z. (2006). Cross-shore variations in morphodynamic processes of an offshore-coast mudflat in the Changjiang Delta, China: With an emphasis on storm impacts. Cont. Shelf Res. 26, 517–538. doi: 10.1016/j.csr.2005.12.011
Fang J. Y., Liu Z. F., Zhao Y. L. (2018). High-resolution clay mineral assemblages in the inner shelf mud wedge of the East China Sea during the Holocene: Implications for the East Asian Monsoon evolution. Sci. China: Earth Sci. 61, 1316–1329. doi: 10.1007/s11430–017-9208–1
Gao J. H., Shi Y., Sheng H., Kettneret A. J., Yang Y., Jia J. J., et al. (2019). Rapid response of the Changjiang (Yangtze) River and East China Sea source-to-sink conveying system to human induced catchment perturbations. Mar. Geol. 414, 1–17. doi: 10.1016/j.margeo.2019.05.003
Green M. O., Coco G. (2014). Review of wave-driven sediment resuspension and transport in estuaries. Rev. Geophys. 52, 77–117. doi: 10.1002/rog.v52.1
Guo X. J., Fan D. D., Zheng S. W., Wang H. M., Zhao B. C., Qin C. J. (2021). Revisited sediment budget with latest bathymetric data in the highly altered Yangtze (Changjiang) Estuary. Geomorphology 391, 107873. doi: 10.1016/j.geomorph.2021.107873
Kong L. S., Gu F. F., Wang W., Shen Q. (2015). Statistics and analysis of typhoon-induced sudden siltation for Yangtze estuary deepwater channel (in Chinese). Port Waterway Eng. 503, 150–152. doi: 10.16233/j.cnki.issn1002-4972.2015.05.027
Kuang C. P., Chen W., Gu J., He L. L. (2014). Comprehensive analysis on the sediment siltation in the upper reach of the deepwater navigation channel in the Yangtze Estuary. J. Hydrodyn. 26, 299–308. doi: 10.1016/S1001-6058(14)60033-0
Kudrass H. R., Machalett B., Palamenghi L., Meyer I., Zhang W. Y. (2018). Sediment transport by tropical cyclones recorded in a submarine canyon off Bangladesh. Geo-Mar Lett. 38, 481–496. doi: 10.1007/s00367-018-0550-x
Leonardi N., Ganju N. K., Fagherazzi S. (2016). A linear relationship between wave power and erosion determines salt-marsh resilience to violent storms and hurricane. PNAS 133, 64–68. doi: 10.1073/pnas.1510095112
Li Y. H., Xu X. H., Yin X. J., Fang J. Y., Hu W. Y., Chen J. (2015). Remote-sensing observations of typhoon soulik, (2013) forced upwelling and sediment transport enhancement in the northern Taiwan Strait. Int. J. Remote Sens. 36, 2201–2218. doi: 10.1080/01431161.2015.1035407
Liao T., Cai T. L., Liu Y. F., Xia X. M. (2016). Continental shoreline change in Zhejiang during the last one hundred years (in Chinese). J. Mar. Sci. 34, 25–33. doi: 10.3969/j.issn.1001-909X.2016.03.005
Lin Y., Li Y., Liu M., Wang L., Zheng B., Long Z., et al. (2024). Typhoon chan-hom, (2015) induced sediment cross-shore transport in the mud depocenter of the East China Sea inner shelf. Mar. Geol. 469, 107443. doi: 10.1016/j.margeo.2024.107223
Liu J. H., Yang S. L., Zhu Q., Zhang J. (2014). Controls on suspended sediment concentration profiles in the shallow and turbid Yangtze Estuary. Cont. Shelf Res. 90, 96–108. doi: 10.1016/j.csr.2014.01.021
Liu J. P., Xu K. H., Li A. C., Millinman J. D., Velozzi D. M., Xiao S. B., et al. (2007). Flux and fate of Yangtze River sediment delivered to the East China Sea. Geomorphology 85, 208–224. doi: 10.1016/j.geomorph.2006.03.023
Lu C. T., Jia X., Han Y. F., Bai Y. B. (2018). Numerical simulation of sudden silting in the Yangtze Estuary deepwater channel by the wave of typhoon. Adv. Water Sci. 29, 696–705. doi: 10.14042/j.cnki.32.1309.2018.05.010
Luan H. L., Ding P. X., Yang S. L., Wang Z. B. (2021). Accretion-erosion conversion in the subaqueous Yangtze Delta in response to fluvial sediment decline. Geomorphology 382, 107680. doi: 10.1016/j.geomorph.2021.107680
Luo X. X., Yang S. L., Wang R. S., Zhang C. Y., Li P. (2017). New evidence of Yangtze delta recession after closing of the Three Gorges Dam. Sci. Rep. 7, 41735. doi: 10.1038/srep41735
Matte P., Secretan Y., Morin J. (2014). Quantifying lateral and intratidal variability in water level and velocity in a tide-dominated river using combined RTK GPS and ADCP measurements. Limnol. Oceanogr.: Methods 12, 280–302. doi: 10.4319/lom.2014.12.281
McKee K. L., Mendelssohn I. A., Hester M. W. (2020). Hurricane sedimentation in a subtropical salt marsh-mangrove community is unaffected by vegetation type. Estuarine Coast. Shelf Sci. 239, 106733. doi: 10.1016/j.ecss.2020.106733
Milliman J. D., Farnsworth K. L. (2011). River Discharge to the Coastal Ocean: A Global Synthesis (Cambridge: Cambridge University Press), 384. doi: 10.1017/cbo9780511781247
Milliman J. D., Shen H. T., Yang Z. S., Meade R. H. (1985). Transport and deposition of river sediment in the Changjiang estuary and adjacent continental shelf. Cont. Shelf Res. 4, 37–45. doi: 10.1016/0278-4343(85)90020-2
Mo D. X., Li J., Hou Y. J. (2021). Assessing the impact of wave-wurrent interactions on storm surges and waves during cold air outbreaks in the Northern East China Sea. J. Mar. Sci. Eng. 9, 824. doi: 10.3390/jmse9080824
Partheniades E. (1965). Erosion and deposition of cohesive soils. Am. Soc Civ. Eng. 90, 105–139. doi: 10.1061/JYCEAJ.0001165
Puig P., Ogston A. S., Mullenbach B. L., Nittrouer C. A., Parsons J. D., Sternberg R. W. (2004). Storm-induced sediment gravity flows at the head of the Eel submarine canyon, northern California margin. J. Geophys. Res. 109, C03019. doi: 10.1029/2003JC001918
Sequeiros O. E., Pittaluga M. B., Frascati A., Pirmez C., Masson D. G., Weaver P., et al. (2019). How typhoons trigger turbidity currents in submarine canyons. Sci. Rep. 9, 9220. doi: 10.1038/s41598–019-45615-z
Shepard F. P. (1932). Sediments of the continental shelves. GSA Bull. 43, 1017–1040. doi: 10.1130/GSAB-43-1017
Shi B. W., Yang S. L., Temmerman S., Bouma T., Ysebaert T., Wang S., et al. (2021). Effect of typhoon-induced intertidal-flat erosion on dominant macrobenthic species (Meretrix meretrix). Limnol. Oceanogr. 66, 4197–4209. doi: 10.1002/lno.11953
Shi B. W., Yang S. L., Wang Y. P., Li G. C., Li M. L., Li P., et al. (2017). Role of wind in erosion-accretion cycles on an estuarine mudflat. J. Geophys. Res.: Oceans 122, 193–206. doi: 10.1002/2016JC011902
Singleton F. (2008). The Beaufort scale of winds - its relevance, and its use by sailors. Weather 63, 37–41. doi: 10.1002/wea.153
Thompson R. O. R. Y. (1983). Low-pass filters to suppress iner-tial and tidal frequencies. J. Phys. Oceanogr. 13, 1077–1083. doi: 10.1175/1520–0485(1983)013<1077:lpftsi>2.0.co;2
Tian Y., Fan D. J., Zhang X. L., Chen B., Wang L., Liu M., et al. (2019). Event deposits of intense typhoons in the muddy wedge of the East China Sea over the past 150 years. Mar. Geol. 410, 109–121. doi: 10.1016/j.margeo.2018.12.010
Turner R. E., Baustian J. J., Swenson E. M., Spicer J. S. (2006). Wetland sedimentation from hurricanes Katrina and Rita. Science 314, 449–452. doi: 10.1126/science.1129116
Wan K., Bao X. W., Wang Y., Wan X. Q., Li H. Q., Liu K. (2015). Barotropic current fluctuations coupled with sea level drawdown in Yellow and Bohai Seas. Chin. J. Oceanol. Limnol. 33, 272–281. doi: 10.1007/s00343-015-4056-3
Wang H. J., Saito Y., Zhang Y., Bi N. S., Sun X. X., Yang Z. S. (2011). Recent changes of sediment flux to the western Pacific Ocean from major rivers in East and Southeast Asia. Earth-Sci. Rev. 108, 80–100. doi: 10.1016/j.earscirev.2011.06.003
Wang Z. H., Saito Y., Zhan Q., Nian X. M., Pan D. L., Wang L., et al. (2018a). Three-dimensional evolution of the Yangtze River mouth, China during the Holocene: Impacts of sea level, climate and human activity. Earth-Sci. Rev. 185, 938–955. doi: 10.1016/j.earscirev.2018.08.012
Wang J. Z., Xu K. H., Li C. Y., Obelcz J. (2018b). Forces driving the morphological evolution of a mud-capped dredge pit, Northern Gulf of Mexico. Water 10, 1001. doi: 10.3390/w10081001
Williams H., Liu K.-b. (2019). Contrasting Hurricane Ike washover sedimentation and Hurricane Harvey flood sedimentation in a Southeastern Texas coastal marsh. Mar. Geol. 417, 10601. doi: 10.1016/j.margeo.2019.106011
Winterwerp J. C., van Kesteren W. G. M., van Prooijen B., Jacobs W. (2012). A conceptual framework for shear flow–induced erosion of soft cohesive sediment beds. J. Geophys. Res. 117, C10020. doi: 10.1029/2012JC008072
Wright L. D., Friedrichs C. T. (2006). Gravity driven sediment transport on continental shelves: a status report. Cont. Shelf Res. 26, 2092–2107. doi: 10.1016/j.csr.2006.07.008
Wu X. F., He Q., Shen J., Peng Z., Guo L. C., Xie W. M., et al. (2024). Different effects between cold front and tropical cyclone on short-term morphodynamics in the Changjiang Delta. J. Mar. Syst. 243, 103961. doi: 10.1016/j.jmarsys.2023.103961
Xiao S. B., Li A. C., Liu J. P., Chen M. H., Xie Q., Jiang F. Q., et al. (2006). Coherence between solar activity and the East Asian winter monsoon variability in the past 8000 years from Yangtze River-derived mud in the East China Sea. Palaeogeogr. Palaeoclimatol. Palaeoecol. 237, 293–304. doi: 10.1016/j.palaeo.2005.12.003
Xie D. F., Pan C. H., Wu X. G., Gao S., Wang Z. B. (2017a). Local human activities overwhelm decreased sediment supply from the Changjiang River: Continued rapid accumulation in the Hangzhou Bay-Qiantang Estuary system. Mar. Geol. 392, 66–77. doi: 10.1016/j.margeo.2017.08.013
Xie D. F., Pan C. H., Wu X. G., Gao S., Wang Z. B. (2017b). The variations of sediment transport patterns in the outer Changjiang Estuary and Hangzhou Bay over the last 30 years. J. Geophys. Res. Oceans 122, 2999–3020. doi: 10.1002/2016JC012264
Xu G., Bi S. P., Gugliotta M., Liu J., Liu J. P. (2023). Dispersal mechanism of fine-grained sediment in the modern mud belt of the East China Sea. Earth-Science Rev. 240, 104388. doi: 10.1016/j.earscirev.2023.104388
Xu K. H., Liu A. C., Liu J. P., Milliman J. D., Yang Z. S., Liu C.-S., et al. (2012). Provenance, structure, and formation of the mud wedge along inner continental shelf of the East China Sea: a synthesis of the Yangtze dispersal system. Mar. Geol. 291–294, 176–191. doi: 10.1016/j.margeo.2011.06.003
Xu X. B., Tan Y., Chen S., Yang G. S. (2014). Changing patterns and determinants of natural capital in the Yangtze River Delta of China 2000–2010. Sci. Total Environ. 466–467, 326–337. doi: 10.1016/j.scitotenv.2013.07.043
Xue C. F., Sheng H., Wei D. Y., Yang Y., Wang Y. P., Jia J. J. (2020). Dry bulk density analysis for inner shelf sediments of the East China Sea and its sedimentary implications (in Chinese). Oceanol. Limnol. Sin. 51, 1093–1107. doi: 10.11693/hyhz20191000200
Yan C. Y., Zhang W. G., Chen Y. L., Nian X. M., Hu Z. X. (2022). Change of sediment composition in the Yangtze River subaqueous delta and its environmental implications. Quat. Sci. 42, 412–420. doi: 10.11928/j.issn.1001–7410.2022.02.07
Yang S. L., Bouma T. J., Xu K. H., Shi B. W., Yang H. F., Zhang W. X., et al. (2023). Storms dominate the erosion of the Yangtze Delta and southward sediment transport. Sci. Bull. 68, 553–556. doi: 10.1016/j.scib.2023.03.005
Yang S. L., Fan J. Q., Shi B. W., Bouma T. J., Xu K. H., Yang H. F., et al. (2019). Remote impacts of typhoons on the hydrodynamics, sediment transport and bed stability of an intertidal wetland in the Yangtze Delta. J. Hydrol. 575, 755–766. doi: 10.1016/j.jhydrol.2019.05.077
Yang S. L., Friedrichs C. T., Shi Z., Ding P. X., Zhu J., Zhao Q. Y. (2003). Morphological response of tidal marshes, flats and channels of the deeper Yangtze River mouth to a major storm. Estuaries 26, 1416–1425. doi: 10.1007/BF02803650
Yang Z. S., Lei K., Guo Z. G., Wang H. J. (2007). Effect of a winter storm on sediment transport and resuspension in the distal mud area, the East China Sea. J. Coast. Res. 232, 310–318. doi: 10.2112/03-0130.1
Yang H. F., Li B. C., Zhang C. Y., Qiao H. J., Liu Y. T., Bi J. F., et al. (2020b). Recent spatio-temporal variations of suspended sediment concentrations in the Yangtze Estuary. Water 12, 818. doi: 10.3390/w12030818
Yang S. L., Luo X. X., Temmerman S., Kirwan M., Bouma T., Xu K. H., et al. (2020a). Role of delta-front erosion in sustaining salt marshes under sea-level rise and fluvial sediment decline. Limnol. Oceanogr. 65, 1990–2009. doi: 10.1002/lno.11432
Yang S. L., Milliman J. D., Li P., Xu K. H. (2011). 50,000 dams later: Erosion of the Yangtze River and its delta. Global Planet. Change. 75, 14–20. doi: 10.1016/j.gloplacha.2010.09.006
Yang S. L., Xu K. H., Milliman J. D., Yang H. F., Wu C. S. (2015). Decline of Yangtze River water and sediment discharge: Impact from natural and anthropogenic changes. Sci. Rep. 5, 12581. doi: 10.1038/srep12581
Yang H. F., Yang S. L., Li B. C., Wang Y. P., Wang J. Z., Zhang Z. L., et al. (2021). Different fates of the Yangtze and Mississippi deltaic wetlands under similar riverine sediment decline and sea-level rise. Geomorphology 381, 107646. doi: 10.1016/j.geomorph.2021.107646
Yang H. F., Yang S. L., Xu K. H. (2017a). River-sea transitions of sediment dynamics: A case study of the tide-impacted Yangtze River estuary. Estuarine Coast. Shelf Sci. 196, 207–216. doi: 10.1016/j.ecss.2017.07.005
Yang H. F., Yang S. L., Xu K. H., Milliman J. D., Wang H., Yang Z., et al. (2018). Human impacts on sediment in the Yangtze River: A review and new perspectives. Glob. Planet. Change 162, 8–17. doi: 10.1016/j.gloplacha.2018.01.001
Yang H. F., Yang S. L., Xu K. H., Wu H., Shi B. W., Zhu Q., et al. (2017b). Erosion potential of the Yangtze Delta under sediment starvation and climate change. Sci. Rep. 7, 10535. doi: 10.1038/s41598-017-10958-y
Zhou B. T., Qian J. (2021). Changes of weather and climate extremes in the IPCC AR6. ACCR 17, 713–718. doi: 10.12006/.issn.1673–1719.2021.167
Keywords: sediment resuspension, longshore current, sediment transport, winter storm, Yangtze Delta
Citation: Tian M, Yang H, Zhang W, Xu K, Shi B, Wang Y and Yang S (2024) Sediment resuspension and transport in the offshore subaqueous Yangtze Delta during winter storms. Front. Mar. Sci. 11:1420559. doi: 10.3389/fmars.2024.1420559
Received: 20 April 2024; Accepted: 22 May 2024;
Published: 05 June 2024.
Edited by:
Qing Wang, Beijing Normal University, Zhuhai, ChinaReviewed by:
Shaohua Zhao, Third Institute of Oceanography, MNR, ChinaCopyright © 2024 Tian, Yang, Zhang, Xu, Shi, Wang and Yang. This is an open-access article distributed under the terms of the Creative Commons Attribution License (CC BY). The use, distribution or reproduction in other forums is permitted, provided the original author(s) and the copyright owner(s) are credited and that the original publication in this journal is cited, in accordance with accepted academic practice. No use, distribution or reproduction is permitted which does not comply with these terms.
*Correspondence: Haifei Yang, aGZ5YW5nQHNrbGVjLmVjbnUuZWR1LmNu; Shilun Yang, c2x5YW5nQHNrbGVjLmVjbnUuZWR1LmNu
Disclaimer: All claims expressed in this article are solely those of the authors and do not necessarily represent those of their affiliated organizations, or those of the publisher, the editors and the reviewers. Any product that may be evaluated in this article or claim that may be made by its manufacturer is not guaranteed or endorsed by the publisher.
Research integrity at Frontiers
Learn more about the work of our research integrity team to safeguard the quality of each article we publish.