
94% of researchers rate our articles as excellent or good
Learn more about the work of our research integrity team to safeguard the quality of each article we publish.
Find out more
ORIGINAL RESEARCH article
Front. Mar. Sci., 15 July 2024
Sec. Marine Ecosystem Ecology
Volume 11 - 2024 | https://doi.org/10.3389/fmars.2024.1420179
This article is part of the Research TopicMarine Plankton: Biological and Chemical InteractionsView all 6 articles
 Sarat C. Tripathy1*
 Anvita U. Kerkar1,2
 P. Sabu1Sunil K. Padhi1Sudarsana R. Pandi1Amit Sarkar1,3Bhaskar V. Parli1
 Rahul Mohan1
The optical characteristics of coastal Antarctic waters exhibit complexity due to the dynamic hydrography influenced by meltwater intrusion, which alters nutrient levels, thermohaline structure, and optically active substances (OAS) regimes. Studies on bio-optical variability and its implications on phytoplankton productivity (PP) are scanty in coastal polar regions. On this backdrop, time-series measurements (72 h at 6 h intervals) of bio-optical properties such as phytoplankton biomass (chlorophyll-a), absorption (aph), and total suspended matter (TSM) concurrently with PP were measured to understand their interplay and variability in relation to the ambient physicochemical settings in the under-sampled Prydz Bay, coastal Antarctica. Our findings revealed thermohaline stratification within the bay, likely attributed to the inflow of less saline meltwater from nearby glaciers and minimal wind activity. The consistent presence of sub-surface chlorophyll maximum (SCM) beneath the stratified layer underscored the light-acclimatization response of shade-adapted phytoplankton. Surface waters exhibited higher TSM compared to deeper layers, indicating glacial melt influence, while the depth of the sunlit layer remained relatively stable, suggesting limited water mass movement and/or variability in OAS at the study site. An inverse relation between chlorophyll-a and chlorophyll-a-specific phytoplankton light absorption (a*ph(λ)) manifested ‘pigment package effect’ within the prevailing phytoplankton community, implying reduced light-absorption efficiency and consequent lower PP. Compared to chlorophyll-a, the phytoplankton light absorption (aph(λ)) emerged as a better proxy for explaining PP variability. Nutrient availability was not limiting, which was conducive to micro (large) phytoplankton growth. Classification of phytoplankton size classes (micro, nano, and pico) based on the B/R ratio (aph at Blue (443 nm)/Red (676 nm) region) confirmed the dominance of larger (micro) phytoplankton that are more susceptible to package effect, thus have implications on reduced PP potential of this polar marine ecosystem.
● Phytoplankton size-class could be derived from its light-absorption spectral ratio.
● Phytoplankton productivity is strongly linked to light-absorption than biomass.
● Reduced productivity is linked to phytoplankton pigment package effect.
● Meltwater-induced nutrients influence phytoplankton size-class.
Owing to their ability to synthesize organic matter (primary production) and fix atmospheric CO2, the oceanic phytoplankton forms the base of the marine food chain. Arguably, one of the most consequential activities of marine phytoplankton is their influence on the global C-cycle and climate (Falkowski, 2002), irrespective of their habitat. The process of sequestering atmospheric CO2 into the deep ocean through primary production, known as the “biological carbon pump (BCP)”, varies as a function of various factors, including light availability, temperature, nutrient levels, phytoplankton composition, and other environmental forcings. The biological pump facilitates the removal of approximately 11-16 pg of atmospheric CO2 annually from the surface layers of the global oceans, representing 12-18% of the overall carbon sequestration by the oceans (Falkowski et al., 2000), thereby emphasizing the role of oceans as a carbon sink. The Southern Ocean (SO) is no exception, serving as a sink for atmospheric CO2 through both solubility and BCPs (Chisholm et al., 2001; Prasanna et al., 2016; Tripathy et al., 2018). Consequently, it is pivotal in regulating the global carbon cycle and climate.
In the Indian sector of the SO (ISSO), it is documented that the magnitude of phytoplankton productivity (PP) is influenced by the pigment packaging effect (Tripathy et al., 2014; Kerkar et al., 2020, 2021), the presence of deep chlorophyll maximum (Tripathy et al., 2015), and the substantial influence of nutrient-rich freshwater inflow from melting sea ice (Sabu et al., 2014). Despite this, studies elucidating the biophysical interactions, particularly in coastal regions such as the Prydz Bay area within the ISSO (located between 70 °E and 80 °E), are scarce (Sabu et al., 2021; Kerkar et al., 2023). The Prydz Bay has a unique topography, and it ranks as the 3rd largest bay in the eastern Antarctic region, spanning over nearly 80,000 km2 (Smith et al., 1984). Connected to the Amery Ice Shelf, the largest ice shelf in eastern Antarctica, Prydz Bay experiences significant influence from this ice shelf, which supplies nutrient-rich freshwater through the melting of nearby glaciers. This influx profoundly affects the water quality and circulation processes within the bay (Smith et al., 1984; Liu et al., 2017; Sabu et al., 2021).
It has been observed that alterations in hydrological conditions influence changes in phytoplankton communities and their average cell size (Margalef, 1978; Yentsch and Phinney, 1989), consequently affecting the internal build-up of pigments and their packaging pattern (Allali et al., 1997; Vidussi et al., 2001). This, in turn, regulates the light absorption or photosynthetic efficiency of surrounding phytoplankton communities. The ‘pigment package effect,’ i.e., the absence of linearity between light-harvesting efficacy and pigment packaging due to intracellular overlapping within the chloroplasts (Bricaud et al., 1995), is typically more prominent in the larger phytoplankton (size > 10 µm). In simpler terms, when chlorophyll-a (Chl-a) increases, cell size also increases (Bricaud et al., 1995), leading to an augmentation in the size of a community’s cells or an increase in pigment density within cells, resulting in heightened pigment packaging. Consequently, this decrease in light absorption or photosynthetic efficiency ultimately leads to reduced PP (Marra et al., 2007).
Generally, the optical characteristics of coastal waters are complex due to the prevailing dynamic hydrographic settings, such as freshwater influx, upwelling, and mixing (Babin et al., 2003). Studies indicate that the intrusion of freshwater can substantially alter the distribution of light absorption properties among the optically active substances (OAS) viz., phytoplankton, detritus, and colored dissolved organic matter (Babin et al., 2003; Brunelle et al., 2012). During austral summer, the SO (south of 60°S) is significantly influenced by meltwater intrusion from the Antarctic ice shelf (Dierssen et al., 2002). When nutrient-rich freshwater, containing both macro and micronutrients, mixes with the adjacent high-saline waters, it induces alterations in the phytoplankton community, resulting in increased Chl-a and PP in the upper, sunlit layers of the SO (Moore and Abbott, 2000). These changes in the phytoplankton community would likely impact the overall light-absorption efficiency of phytoplankton. Therefore, it is imperative to assess this aspect, particularly given the limited available information in the ISSO (Tripathy et al., 2014; Kerkar et al., 2023).
Based on point measurements, several surveys have been carried out in the frontal regions of the ISSO to explain the variability of PP (Jasmine et al., 2009; Tripathy et al., 2014, 2015, 2018; Kerkar et al., 2020, 2021, 2022), community structure (Mendes et al., 2012; 2015), and bio-optical variability (Pandi et al., 2023a, b). However, time-series observations evaluating the link between bio-optical variables and PP are obscure in the coastal region to date. Against this backdrop, the present study aims to investigate the temporal variation (at a single location) of ambient physicochemical factors and their impact on PP and bio-optical variability in Prydz Bay during the austral summer of 2016-2017. The study hypothesizes that in Prydz Bay, (i) meltwater governs the underwater light regime, vertical mixing, nutrient supply, and thus phytoplankton community and production/carbon sequestration; (ii) the pigment packaging effect predominates and significantly influences the light-absorption efficiency of phytoplankton with varying depths, (iii) phytoplankton light-absorption, compared to its biomass, can serve as a better proxy for predicting variability in PP. This study is anticipated to advance our understanding of the linkage between bio-optical properties and PP variability in the coastal polar oceans, with particular emphasis on this lesser-studied region of the Southern Ocean.
All the measurements were conducted in a fixed location (68°.33’ S and 74°.36’ E) in Prydz Bay, a deep embayment in coastal Antarctica (Figure 1A). Water sampling was carried out aboard research vessel MV-S.A. Agulhas 1 during the 9th Indian Scientific Expedition to the Southern Ocean (ISESO-9), which spanned over two months (December 2016-February 2017). Time-series measurements at 6h intervals were carried out starting at 06:30 h (local time) on 26-Jan-2017 and culminated at 00:30 h on 29-Jan-2017. In total, 12 casts were performed for the collection of samples. Vertical profiles of hydrographical parameters viz., temperature, salinity, fluorescence, photosynthetically active radiation (PAR), and dissolved oxygen (DO) were measured by an array of sensors assembled with the conductivity-temperature-depth (CTD, SBE 911+) probe integrated with a carousel water sampler (Sea-Bird Scientific, USA). Waters samples were collected using 10L Niskin samplers mounted on the carousel and then sub-sampled into respective pre-washed bottles for further analysis. The vertical diffuse light attenuation coefficient (Kd, m-1) was calculated by linear regression fitting of log-transformed vertical PAR data. The depth of the euphotic zone (Zeu) was estimated as Zeu(m) = −ln(0.001)/Kd (Kirk, 1994). A bucket thermometer (Theodor Friedrichs & Co, Germany) with an accuracy of ± 0.2°C was used for measuring sea surface temperature (SST) in the studied location.
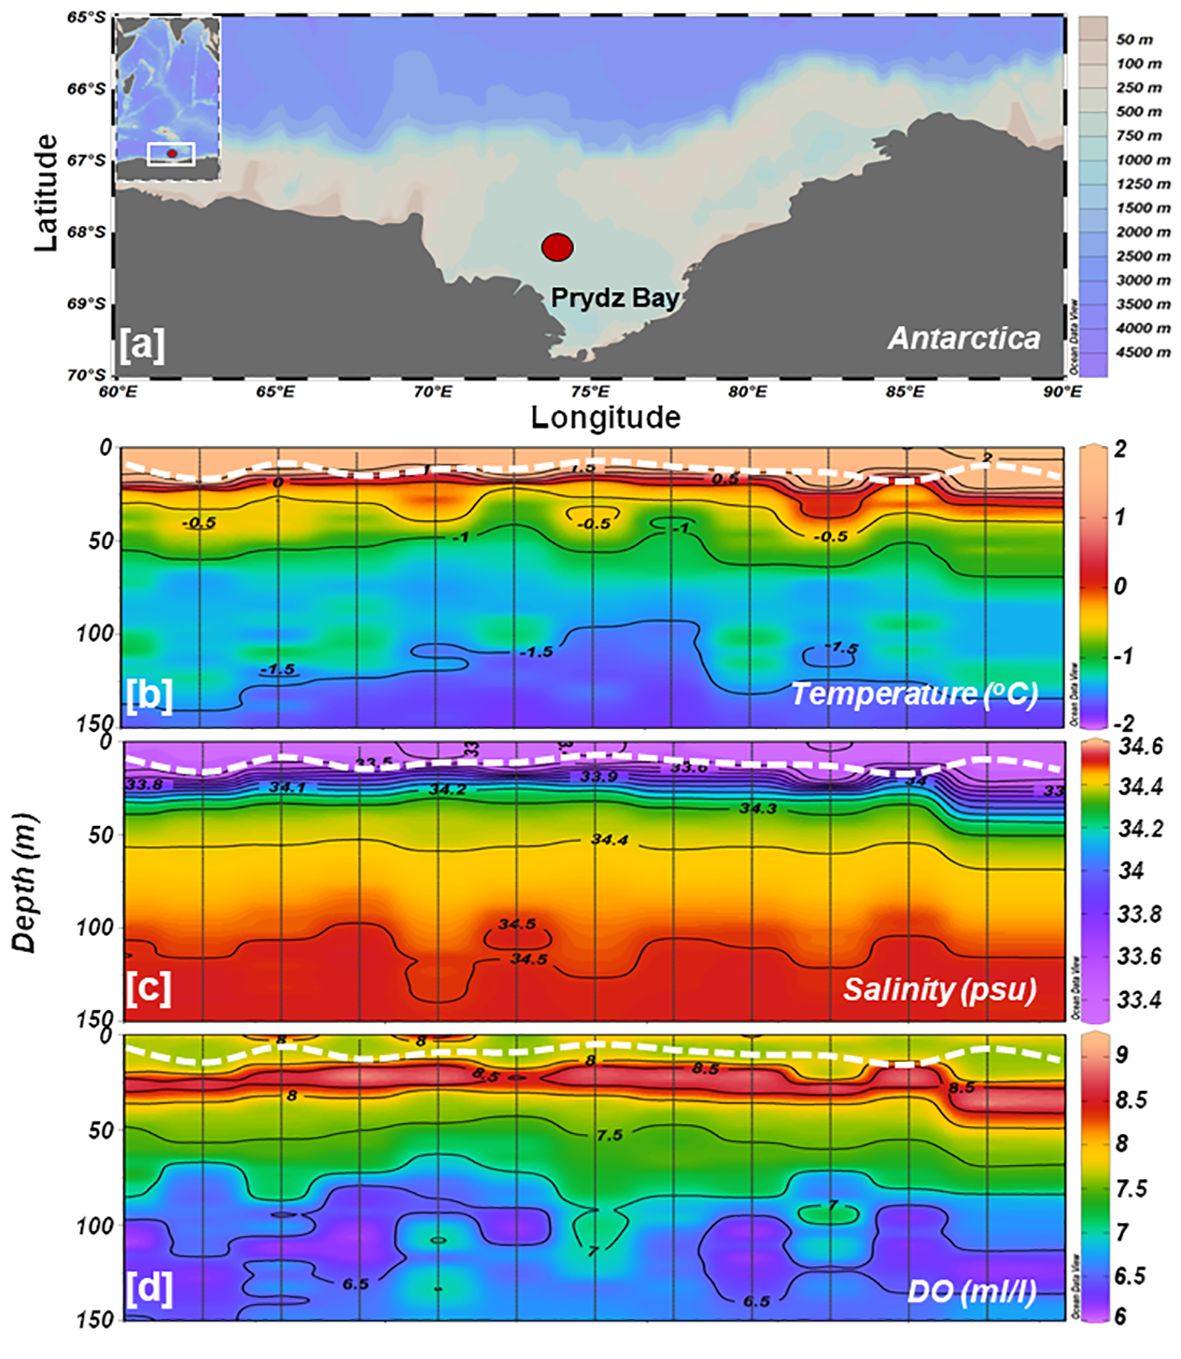
Figure 1 (A) Study area map showing the sampling location in Prydz Bay, coastal Antarctica. Time-series vertical distributions of (B) temperature, (C) salinity, and (D) dissolved oxygen measured by CTD. The white dotted line in each panel indicates the depth of the mixed layer.
Phytoplankton biomass, including Chlorophyll-a (Chl-a), and phaeopigments concentrations were measured using a fluorometer (AU-10, Turner Designs). Water samples from designated depths (0, 10, 30, 50/SCM, 75, 100, 120 m) were filtered under low vacuum pressure onto Whatman GF/F filters (diameter: 47 mm, pore size: 0.7 μm) and afterward stored at -20 °C until further analysis. The filters containing the sample were soaked in 10 ml of 90% acetone for a day, and the pigments extraction was performed in the dark in a refrigerated condition. Following extraction, the fluorescence was measured before (Fo) and after (Fa) acidification with 2-3 drops of 10% HCl. The actual concentrations of Chl-a and phaeopigments were calculated following a standard protocol (JGOFS, 1994). The water column-integrated Chl-a (Chlint) was obtained by integrating the Chl-a value within 0-150 m.
A 100 ml aliquot of water samples was directly transferred from the Niskin sampler into pre-cleaned polypropylene tubes. These samples were stored frozen at -20°C until analysis. The concentrations (μM) of nitrate (NO3), nitrite (NO2) phosphate (PO4), and silicate (SiO4) were determined by a continuous segmented flow autoanalyzer (Model-AA3, Seal Analytical Ltd., GmbH, Germany) according to JGOFS (1994). The standard error of less than 2% was maintained for all triplicate analyses. To estimate total suspended matter (TSM), water samples (2L) were filtered through pre-weighted 47 mm (pore size: 0.2 μm) Millipore filters under low vacuum pressure, and it was subsequently weighed (w1). Following filtration, the filters were dried in an oven at 60°C for four hours and weighed (w2) at room temperature. The concentration of TSM (mg l-1) was determined by deducting w1 from w2.
Water samples ranging from 1-2 L were filtered onto Whatman GF/F filters (diameter: 25 mm, pore size: 0.7 µm) under low vacuum suction (<0.01 MPa) and were analyzed by a spectrophotometer equipped with an integrated sphere (UV-2600, Shimadzu Inc., Japan) to estimate light-absorption coefficient of total particulate matter (ap(λ)) and non-phytoplankton particles (anph(λ)) adopting quantitative filter technique (QFT) suggested by Mitchell and (1990 1990) and as detailed in Kerkar et al. (2021). The light-absorption coefficient of phytoplankton (aph(λ)) was determined by subtracting anph(λ) from ap(λ). Additionally, the Chl-a specific light-absorption coefficient of phytoplankton, i.e., aph*(λ), was calculated by normalizing aph(λ) to fluorometrically measured Chl-a at respective depths.
The daily phytoplankton carbon fixation rate or productivity (PP) was quantified by carrying out 24 h simulated in situ (SIS) incubations onboard the vessel. Waters samples from two depths (surface and SCM) were collected gently in acid-washed transparent bottles (NALGENE®) after passing through a mesh (diameter: 200 µm) to exclude zooplankton (grazers). The bottles were spiked with 13C-labelled sodium bicarbonate (NaH13CO3, 99 atom %, Icon Services, USA) and incubated in an on-deck transparent tank enabled with circulated surface seawater facility to maintain surrounding water temperatures. Appropriate neutral density filter covers were used for SCM samples to simulate reduced light intensity that prevailed at SCM depth. After completion of incubations, samples were filtered onto pre-combusted (450 °C, 4 h) GF/F filters of 25 mm diameter and stored at -20 °C for estimation of particulate organic carbon (POC, mgC L-1) and isotopic ratio of 13C and 12C (13C atomic %) of the samples by a stable isotope ratio mass spectrometer (Isoprime) in continuous-flow mode coupled with a Vario ISOTOPE cube elemental analyzer (Elementar) as detailed in Kerkar et al. (2021). The phytoplankton daily carbon fixation rate (PP, mgC m-3 d-1) was calculated according to Hama et al. (1983). The terminologies and abbreviations used in this study are given in Table 1.
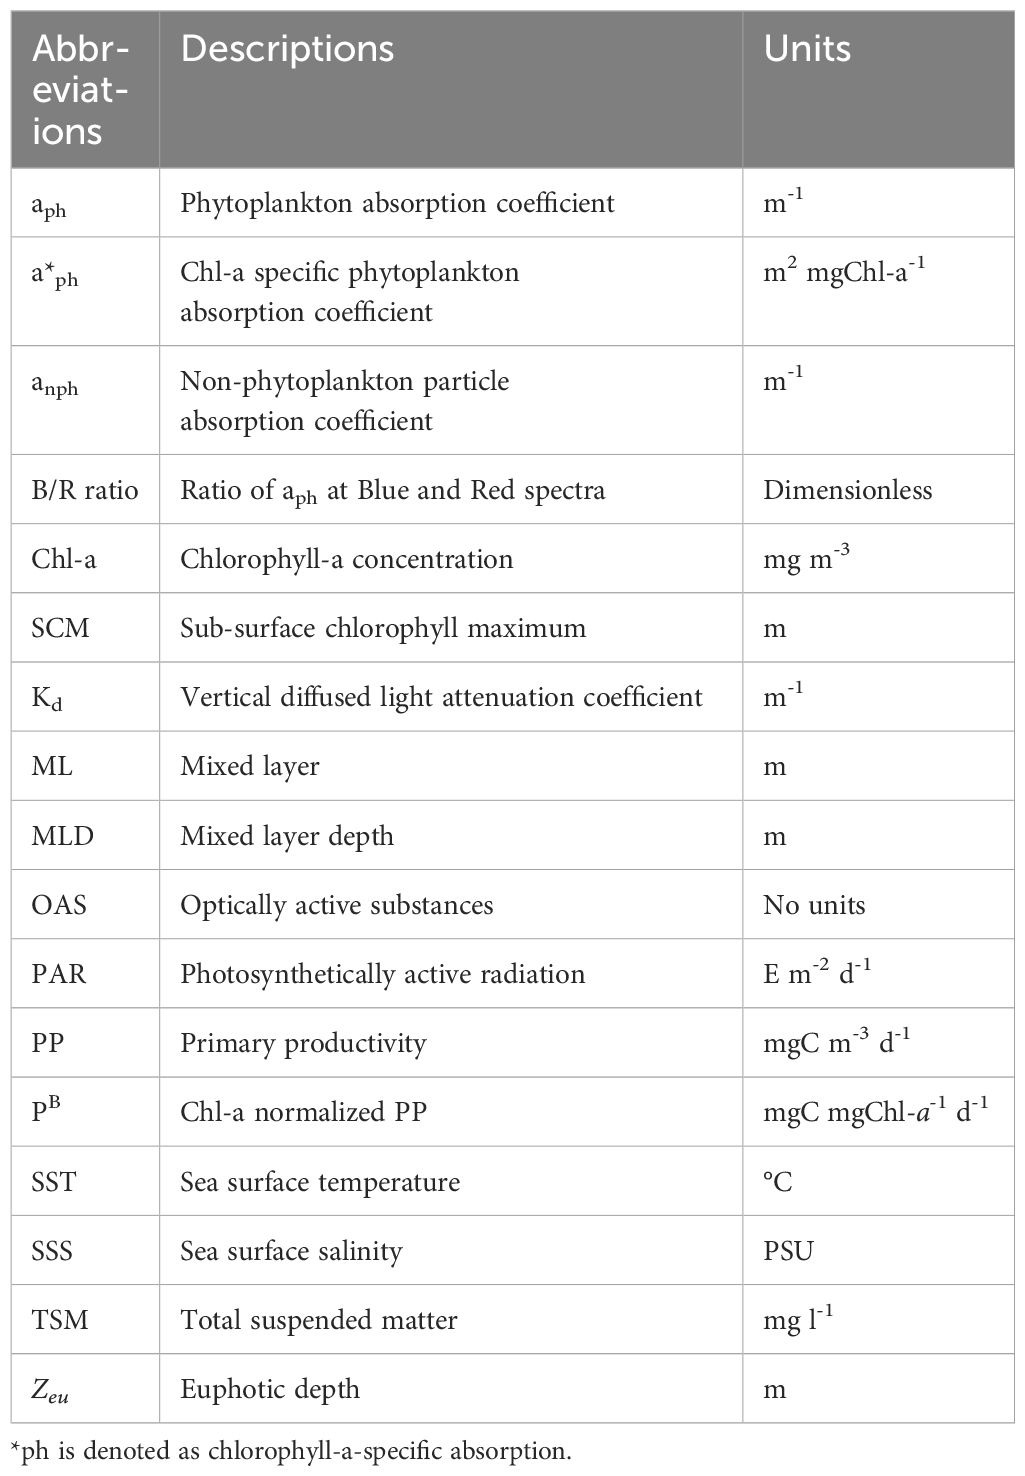
Table 1 List of terms and abbreviations used in this study.
To know the wind speed (m s-1) in Prydz Bay, we acquired the daily averaged wind speed over the time-series from the Advanced Scatterometer (ASCAT, http://apdrc.soest.hawaii.edu). The daily climatological data was generated using the daily wind data from the ASCAT from 2010 to 2020. The daily wind speed anomalies (m s-1) during the observation were estimated from the daily wind climatological data.
Hydrography examination suggests that the water column’s physical attributes at the time-series station remained relatively stable throughout the sampling period. Water column (up to 150 m) temperature and salinity varied from –1.80°C to 2.09°C (avg -0.82 ± 1.01°C) and 33.36 to 34.52 (avg 34.29 ± 0.33 psu), respectively. In the upper ~25 m depths, the water temperature was > 0 degrees, and salinity was > 33.8 (Figures 1B, C), indicating the presence of Antarctic Surface Water (AASW; -1.5< Temp< 2°; 32.5< Sal< 34.2 psu) during the observations (Figure 2A). Both temperature and salinity exhibited similar vertical distribution and temporal variations, with deeper layers (100-150 m) characterized by high salinity (> 34.0) and low temperature (> -1.5 °C). Notably, a clear stratification was observed in the surface layers where comparatively low-saline and high-temperature water prevailed in the upper 20-25 m (Figures 1B, C), resulting in a restricted mixed layer depth (MLD) ranging from 9-20 m (Table 2). Water density (sigma-t) ranged between 26.69 and 28.55 kg m-3 (avg 27.76 ± 0.36 kg m-3). Sigma-t increased with decreasing temperature and increasing salinity (Figures 2B, C). Water column temperature and salinity (Supplementary Figure S1A) were negatively correlated (R2 = 0.93, p< 0.001), whereas linear regression between sigma-t, temperature, and salinity (Supplementary Figures S1B, C) demonstrated that variation in sigma-t was almost equally driven by temperature (R2 = 0.95, p< 0.001) and salinity (R2 = 0.99, p< 0.001). Dissolved oxygen (DO; ml l–1) values were slightly elevated in the surface layer but displayed markedly higher values just below the stratified layer, decreasing gradually with depth (Figure 1D). Sea surface temperature (SST) and sea surface salinity (SSS) exhibited nearly opposite trends during the initial 24 h of the time-series measurements and the varied correspondingly (Figures 1B, C). The relatively high saline and colder water observed at the beginning of the time-series measurement may be due to localized/small-scale upwelling or mixing events (Dinniman and Klinck, 2004; Wallace et al., 2008); however, it could also be owing to internals waves. Alas, we can not confirm this using this dataset.
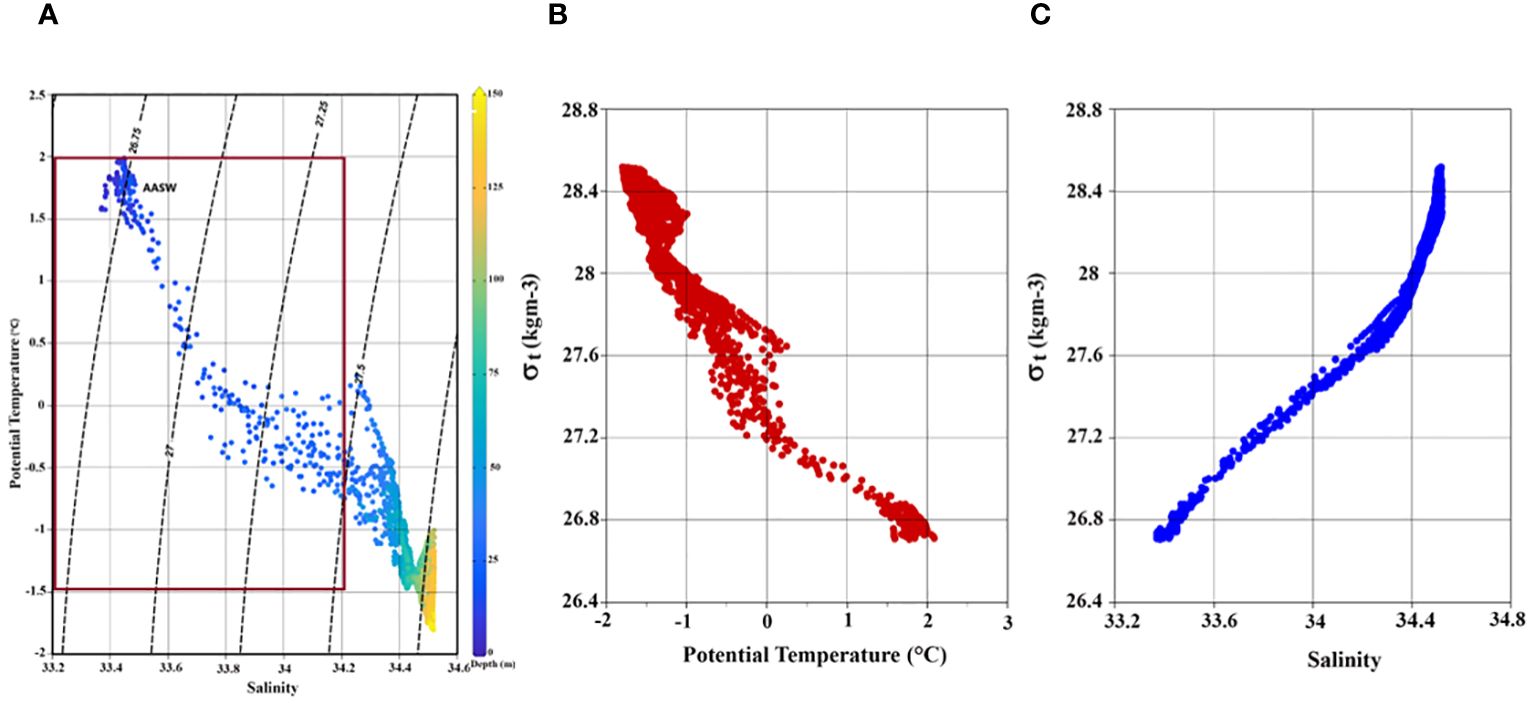
Figure 2 (A) A TS diagram with density (sigma-t) contours. The AASW was identified using the potential temperature (-1.5< T< 2) and salinity range (32.5< S< 34.2) described by Guo et al. (2019). Scatter plot of time-series (B) sigma-t versus temperature, and (C) sigma-t versus salinity in the study area.
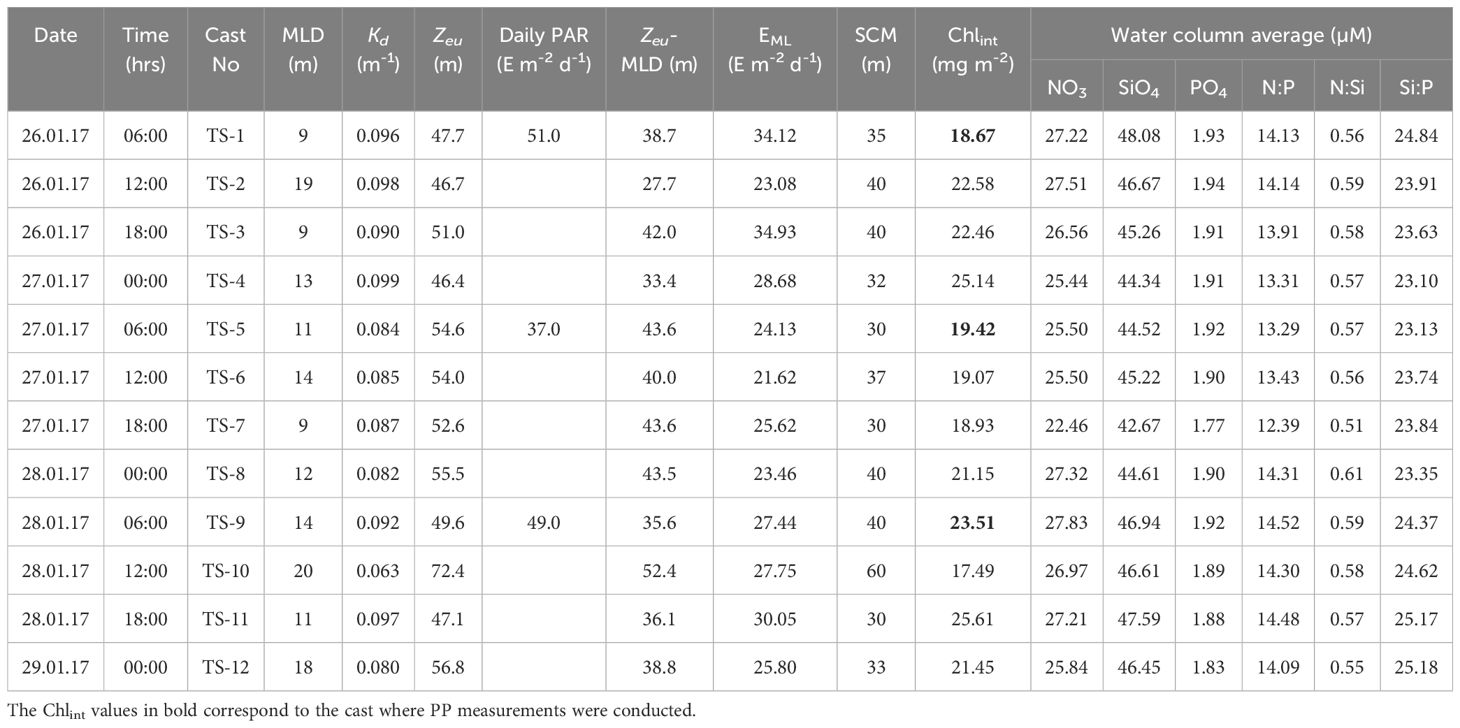
Table 2 Sampling date, time, cast number, mixed layer depth (MLD), vertical light attenuation coefficient (Kd), euphotic depth (Zeu), daily surface photosynthetically active radiation (D-PAR), difference between Zeu and MLD (Zeu-MLD), mean PAR level in the mixed layer (EML), depth of the SCM, water column-integrated chlorophyll a, water column average of nutrients and nutrient ratios observed in the study location (68 00’°S and 74 00’°E).
Macronutrients concentrations, i.e., nitrate (NO3), silicate (SiO4), and phosphate (PO4), varied from (9.89 – 33.76, avg 27.29 ± 5.35 µM), (23.73 – 61.15, avg 47.55 ± 9.66 µM), and (1.12 – 2.22, avg 1.93 ± 0.30 µM), respectively in the water column during the entire study period. The concentrations were relatively low in the mixed layer (ML), gradually increasing with depth (Figures 3A-C), suggesting less nutrient limitation, if any, for diatoms/silicoflagellates at greater depths. Profiles at TS7 showed some spiked values, possibly attributable to manual/instrumental errors in sample handling. The N:P, N:Si, and Si:P ratio, a proxy for nutrient limitations, varied from (8.83 – 15.62, avg 14.04 ± 9.66 µM), (0.41 – 0.68, avg 0.57 ± 9.66 µM), and (16.52 – 28.05, avg 24.43 ± 9.66 µM), respectively. Average values of these nutrients within the water column during each cast are given in Table 2.
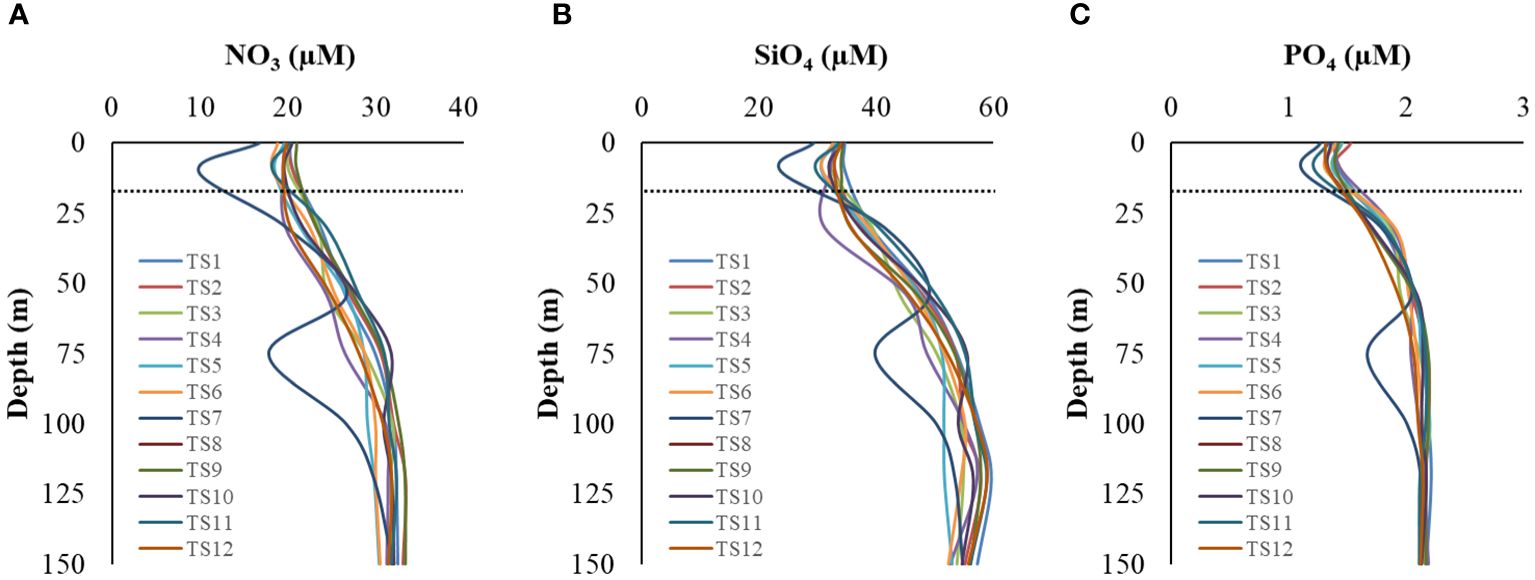
Figure 3 Vertical profiles of macronutrient concentrations (A) nitrate, (B) silicate, and (C) phosphate in the study location. The dotted line indicates the mixed layer depth.
The CTD-based fluorescence data (Figure 4A) revealed a reduction in surface fluorescence and a slight deepening of the SCM layer during the noon cast (at 1200 h), which could be the manifestation of higher incident sunlight. Diurnal variations in fluorescence caused by intense solar radiation were evident. The fluorescence profiles were consistent with fluorometrically measured Chl-a measurements (R2 = 0.75, p< 0.05). Fluorometrically measured in situ Chl-a concentrations within the water column (150 m) varied from 0.007 to 0.456 mg m-3 (avg 0.144 ± 0.107 mg m-3) during the sampling time (Figure 4B). Concurrently, the phaeopigments (degraded products of Chl-a) concentrations varied from -0.049 to 0.246 mg m-3 (avg 0.074 ± 0.045 mg m-3) in the studied location (Figure 4C). Despite the surface water displaying a greenish hue, indicative of higher algal growth or bloom conditions, Chl-a values were lower at the surface and showed a distinct subsurface maximum (SCM) layer below the stratification, spreading from 25-60 m of the water column (Figure 4B). This phenomenon suggests a potential decline phase of a phytoplankton bloom that might have occurred at the onset of austral summer, i.e., prior to the sampling period, although further confirmation is warranted. The in situ Chl-a concentrations showed minimal variation at the surface layer but exhibited notable fluctuations at the SCM layer. Initially, Chl-a values were low at SCM, gradually increasing after 12 hours before decreasing again. The water column-integrated Chl-a (Chlint) showed a random pattern and varied between 17.49 and 25.61 mg m-2 at the studied location (Table 2).
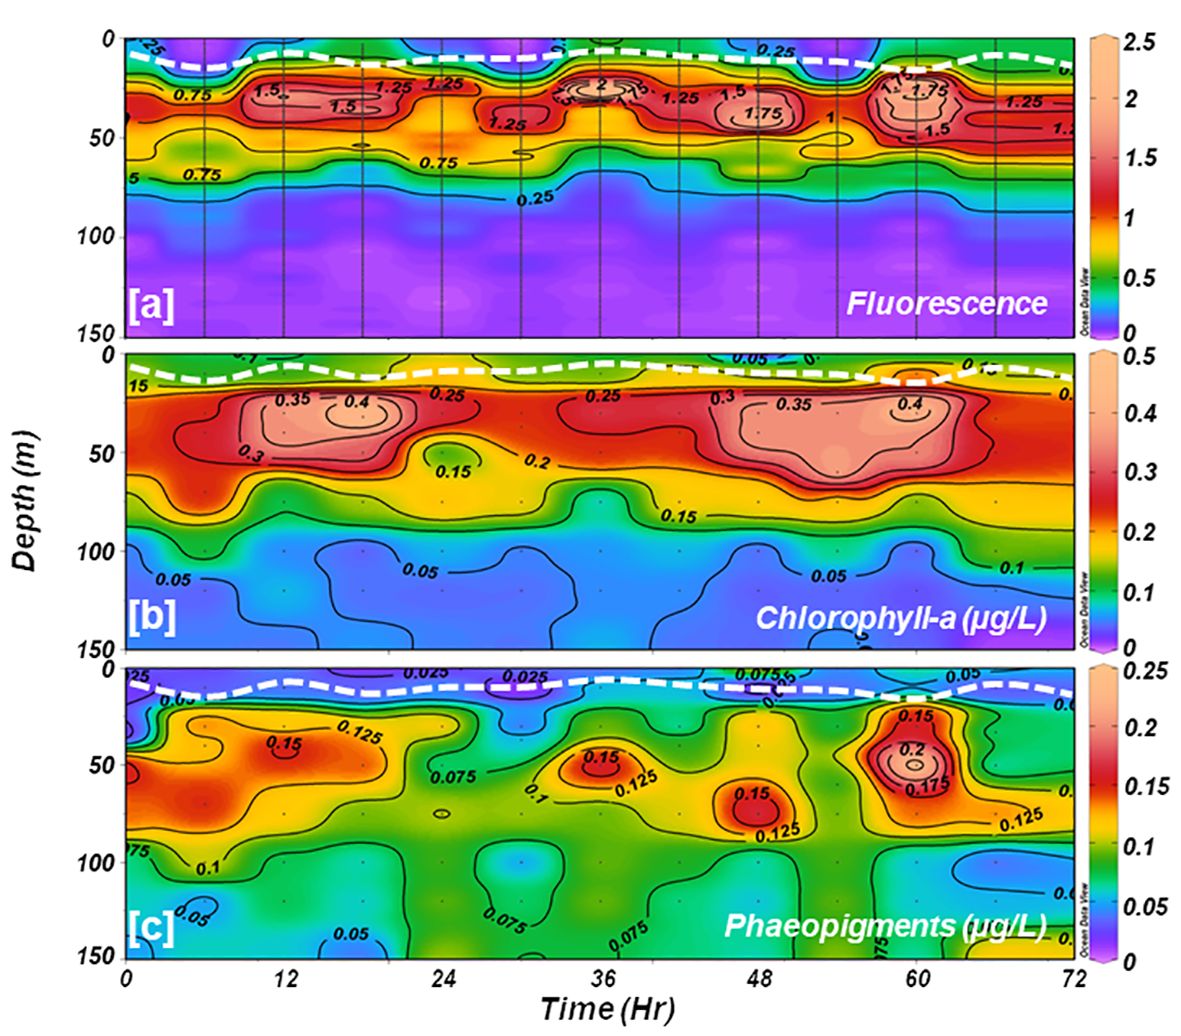
Figure 4 Time-series vertical distributions of (A) CTD-based fluorescence; and fluorometrically estimated (B) chlorophyll-a, and (C) phaeopigments. The white dotted line in each panel indicates the depth of the mixed layer.
Total suspended matter (TSM) concentrations were relatively higher at the surface compared to the SCM layer, ranging between 6.2 and 8.1 mg l-1 (avg 7.29 ± 0.67 mg l-1) and 5.1 and 7.9 mg l-1 (avg 6.35 ± 0.97 mg l-1), respectively. The TSM concentrations at the surface and SCM were positively correlated (R2 = 0.43, figure not shown) and displayed a decreasing trend over time (Figure 5A). Higher TSM levels measured at the surface could be due to meltwater influx from the Antarctic Peninsula, which is prone to carry some sediment or soil resulting from atmospheric deposition and/or coastal erosion.
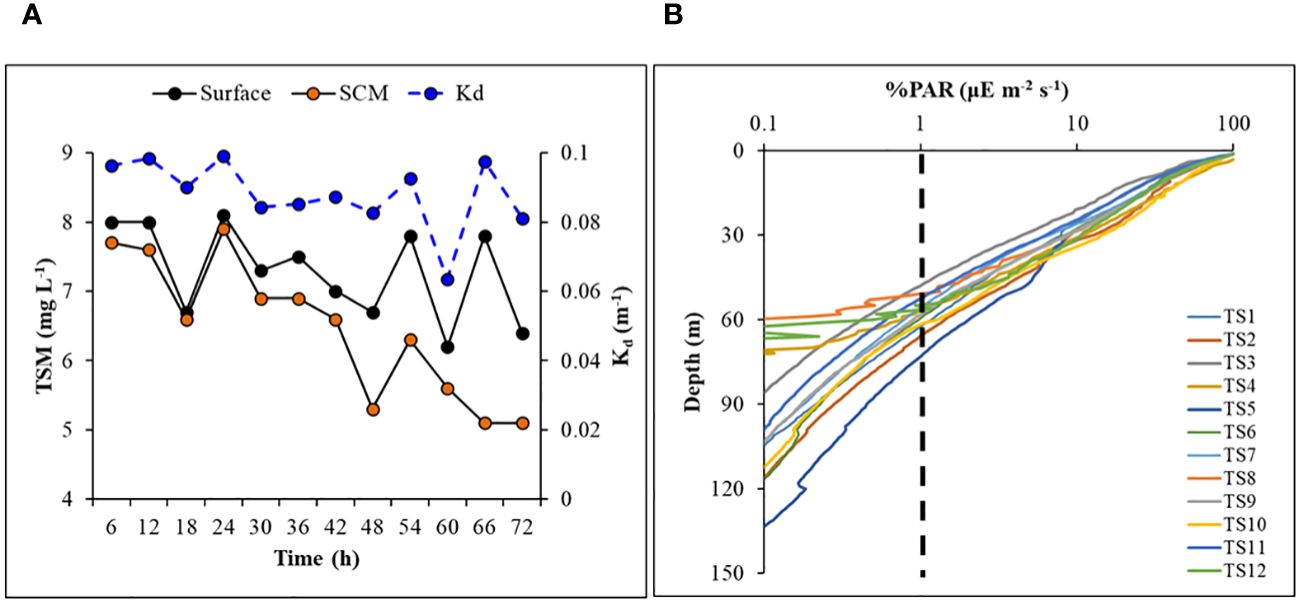
Figure 5 Time-series of (A) concentrations of total suspended matter (at surface and SCM layer), and diffuse light attenuation coefficient in the water column, (B) vertical profiles of photosynthetically active radiation (%) in log-scale showing euphotic depth (dashed line) in the study area.
A typical exponential decline in the vertical light or photosynthetically active radiation (PAR) profiles (Figure 5B) was observed during the study. The vertical penetration of PAR in the water column remained stable throughout the 72 h measurements, showing minimal variation. The depth at which PAR reaches 1% of its value just below the surface, also known as the base of the euphotic zone (Zeu), varied within ~50-70 m (Figure 5B), delineating the depth conducive for phytoplankton photosynthesis. The variability in Zeu could be attributed to the varying diffuse light attenuation coefficient (Kd) values influenced by the incident solar elevation angle and concentrations of optically active substances (OAS) viz., Chl-a, total suspended matter (TSM) and colored dissolved organic matter (CDOM) in the water column. The Kd ranged from 0.063 to 0.099 (mean 0.088 ± 0.010 m-1) (Table 2; Figure 5A) and showed strong (R2 = 0.73), moderate (R2 = 0.56) and weak (R2 = 0.45) positive correlations (Figure 6) with surface TSM, SCM TSM, and water column-integrated Chl-a (Chlint, mg m-2), indicating the impact of these OAS on its variability. As obvious, the penetration of PAR was least during the 18:00 h casts and was highest during the noon cast due to high and low solar angles, respectively, implying that light attenuation was more linked to the higher solar angle than the concentrations of the constituents in the water column.
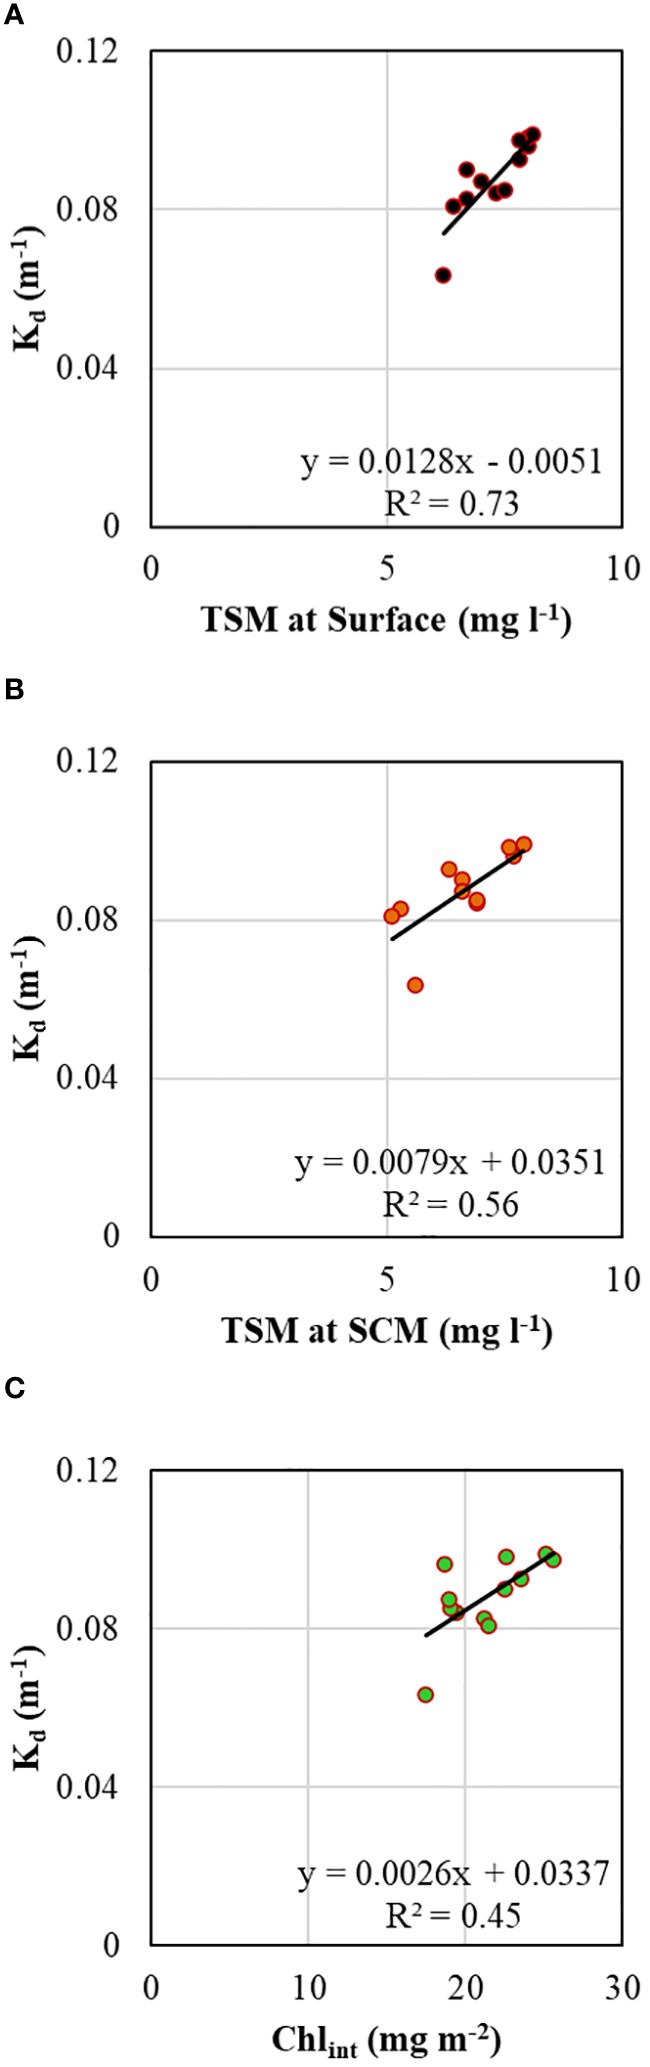
Figure 6 Scatterplots showing relationships between vertical diffuse light attenuation coefficient and (A) total suspended matter at the surface layer, (B) total suspended matter at SCM, and (C) integrated chlorophyll-a in the water column.
Overall, the wind speed during the observation was weak, with a three-day average of ~4 m s-1). The magnitude of the wind during day 1 (26 January) and day 3 (28 January) was slightly higher than the climatology, whereas, on day 2 (27 January) and day 4 (28 January), it was almost similar to the climatological values (Figure 7A). The resulting wind anomalies (Figure 7B) indicates possible weak mixing or water mass movement vertically. The Brunt-Vaisala frequency (N) plot indicated a weekly stratified upper layer, with highly stratified waters below this layer (between 20-50 m) and lesser stratified waters beyond 65 m during the study (Figure 7C). N, when positive, zero, and negative, means the water column is stable, neutral, and unstable, respectively (Pond and Pickard, 1983).
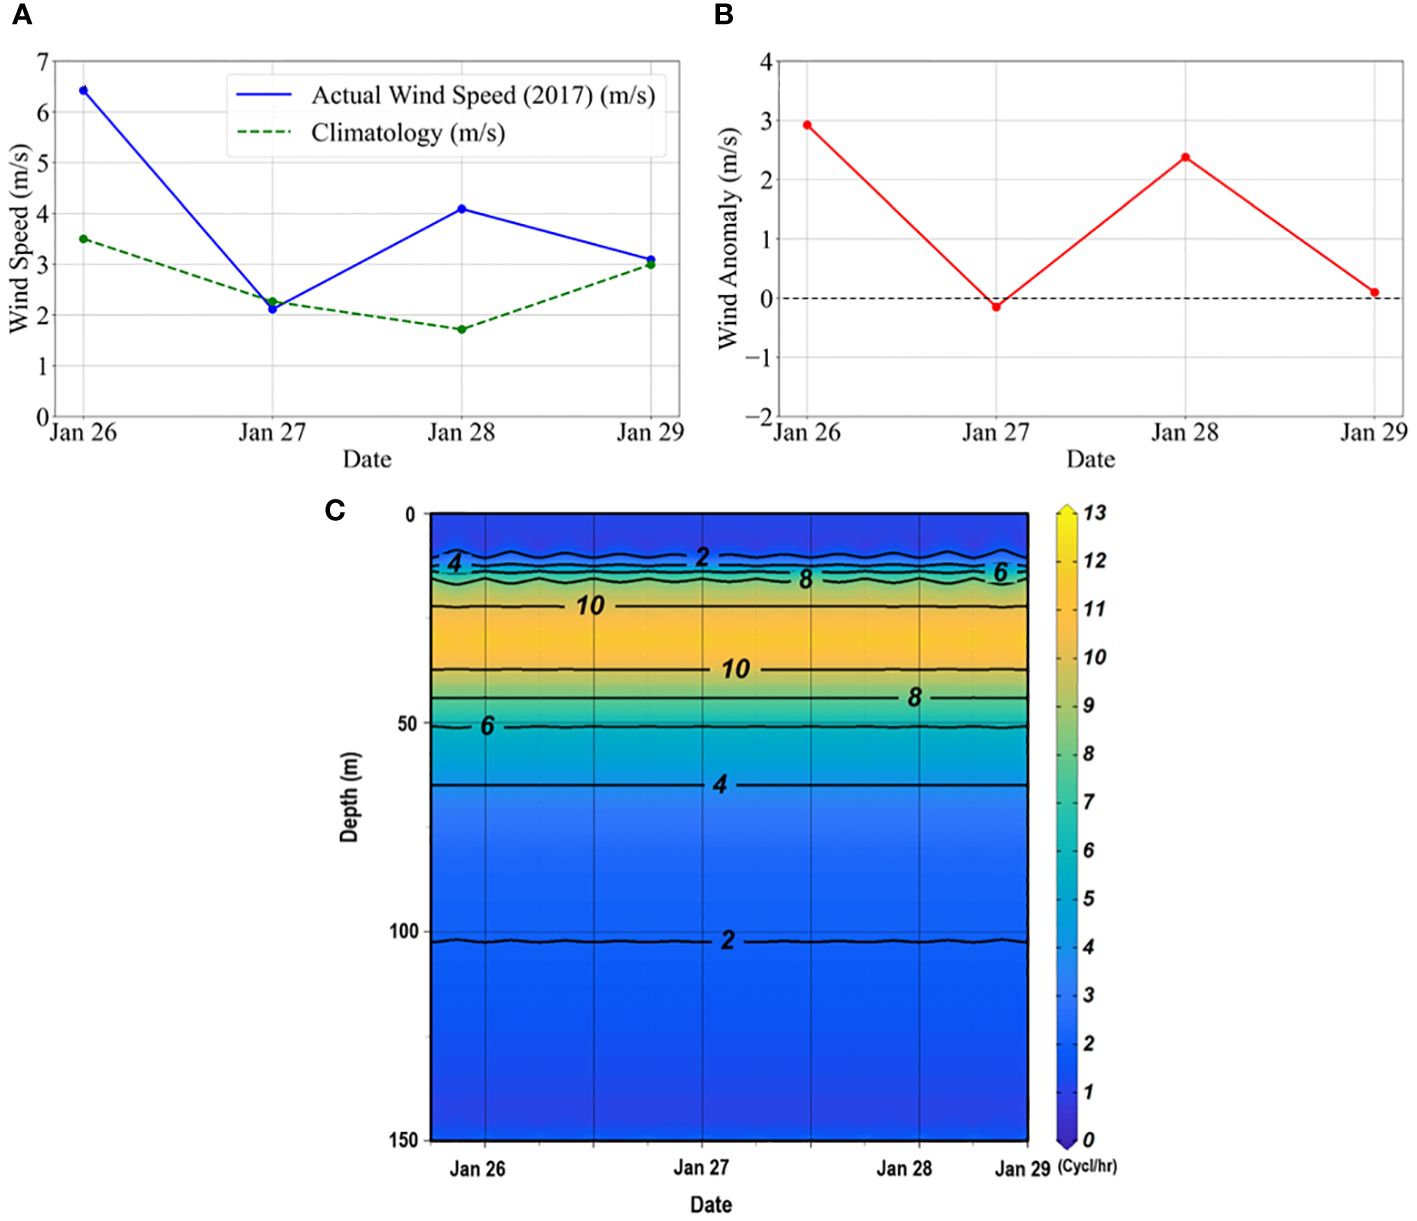
Figure 7 (A) Daily averaged wind speed during the time-series observation compared to the climatological data. The daily climatological data was generated using the daily wind data from the ASCAT for the period 2010-2020. (B) Daily wind anomalies during the observation. The anomalies were estimated from the daily wind climatological data. (C) The Brunt–Vaisala frequency (N) diagram indicates buoyancy frequency or water column stability in the study area. The CTD profiles were used to calculate the, according to Pond and Pickard (1983), where g is the acceleration due to gravity, is the density of seawater and is the vertical potential density gradient.
The aph(λ) spectra were categorized by absorption peaks at the blue (443 nm) and red (675 nm) wavelength regions. The aph(λ) spectra were noticeably different between the surface and SCM layers. On average, aph(λ) values were higher at the SCM layer compared to the surface (Figure 8A), indicating more light absorption at SCM layers. The standard deviations (SD) for both peaks were more pronounced in the blue band than the red band due to the role of accessory pigments (other than Chl-a) in light absorption, which was corroborated by the linear relationship between aph(λ) and Chl-a (Figure 8C) at 443 nm (R2 = 0.60, p< 0.01) and 676 nm (R2 = 0.62, p< 0.01). In contrast to the aph(λ) spectra, the a*ph(λ), a proxy for the ‘pigment package effect’, were higher for the surface layer than at SCM, implying higher Chl-a specific light-absorption in the surface layers than SCM (Figure 8B). The prominent, inverse relationship between a*ph(λ) and Chl-a (Figure 8D) showed that absorption at both 443 nm (R2 = 0.53, p< 0.01) and 676 nm (R2 = 0.42, p< 0.01) experienced ‘pigment package effect’, with a relatively stronger packaging effect at the blue band. Higher SD values observed for SCM could be due to the influence of elevated fluctuating light conditions on the a*ph(λ) variability in the deeper layer. The average a*ph(λ) in the study location exhibited a typical flattening in the blue (450–470 nm) region.
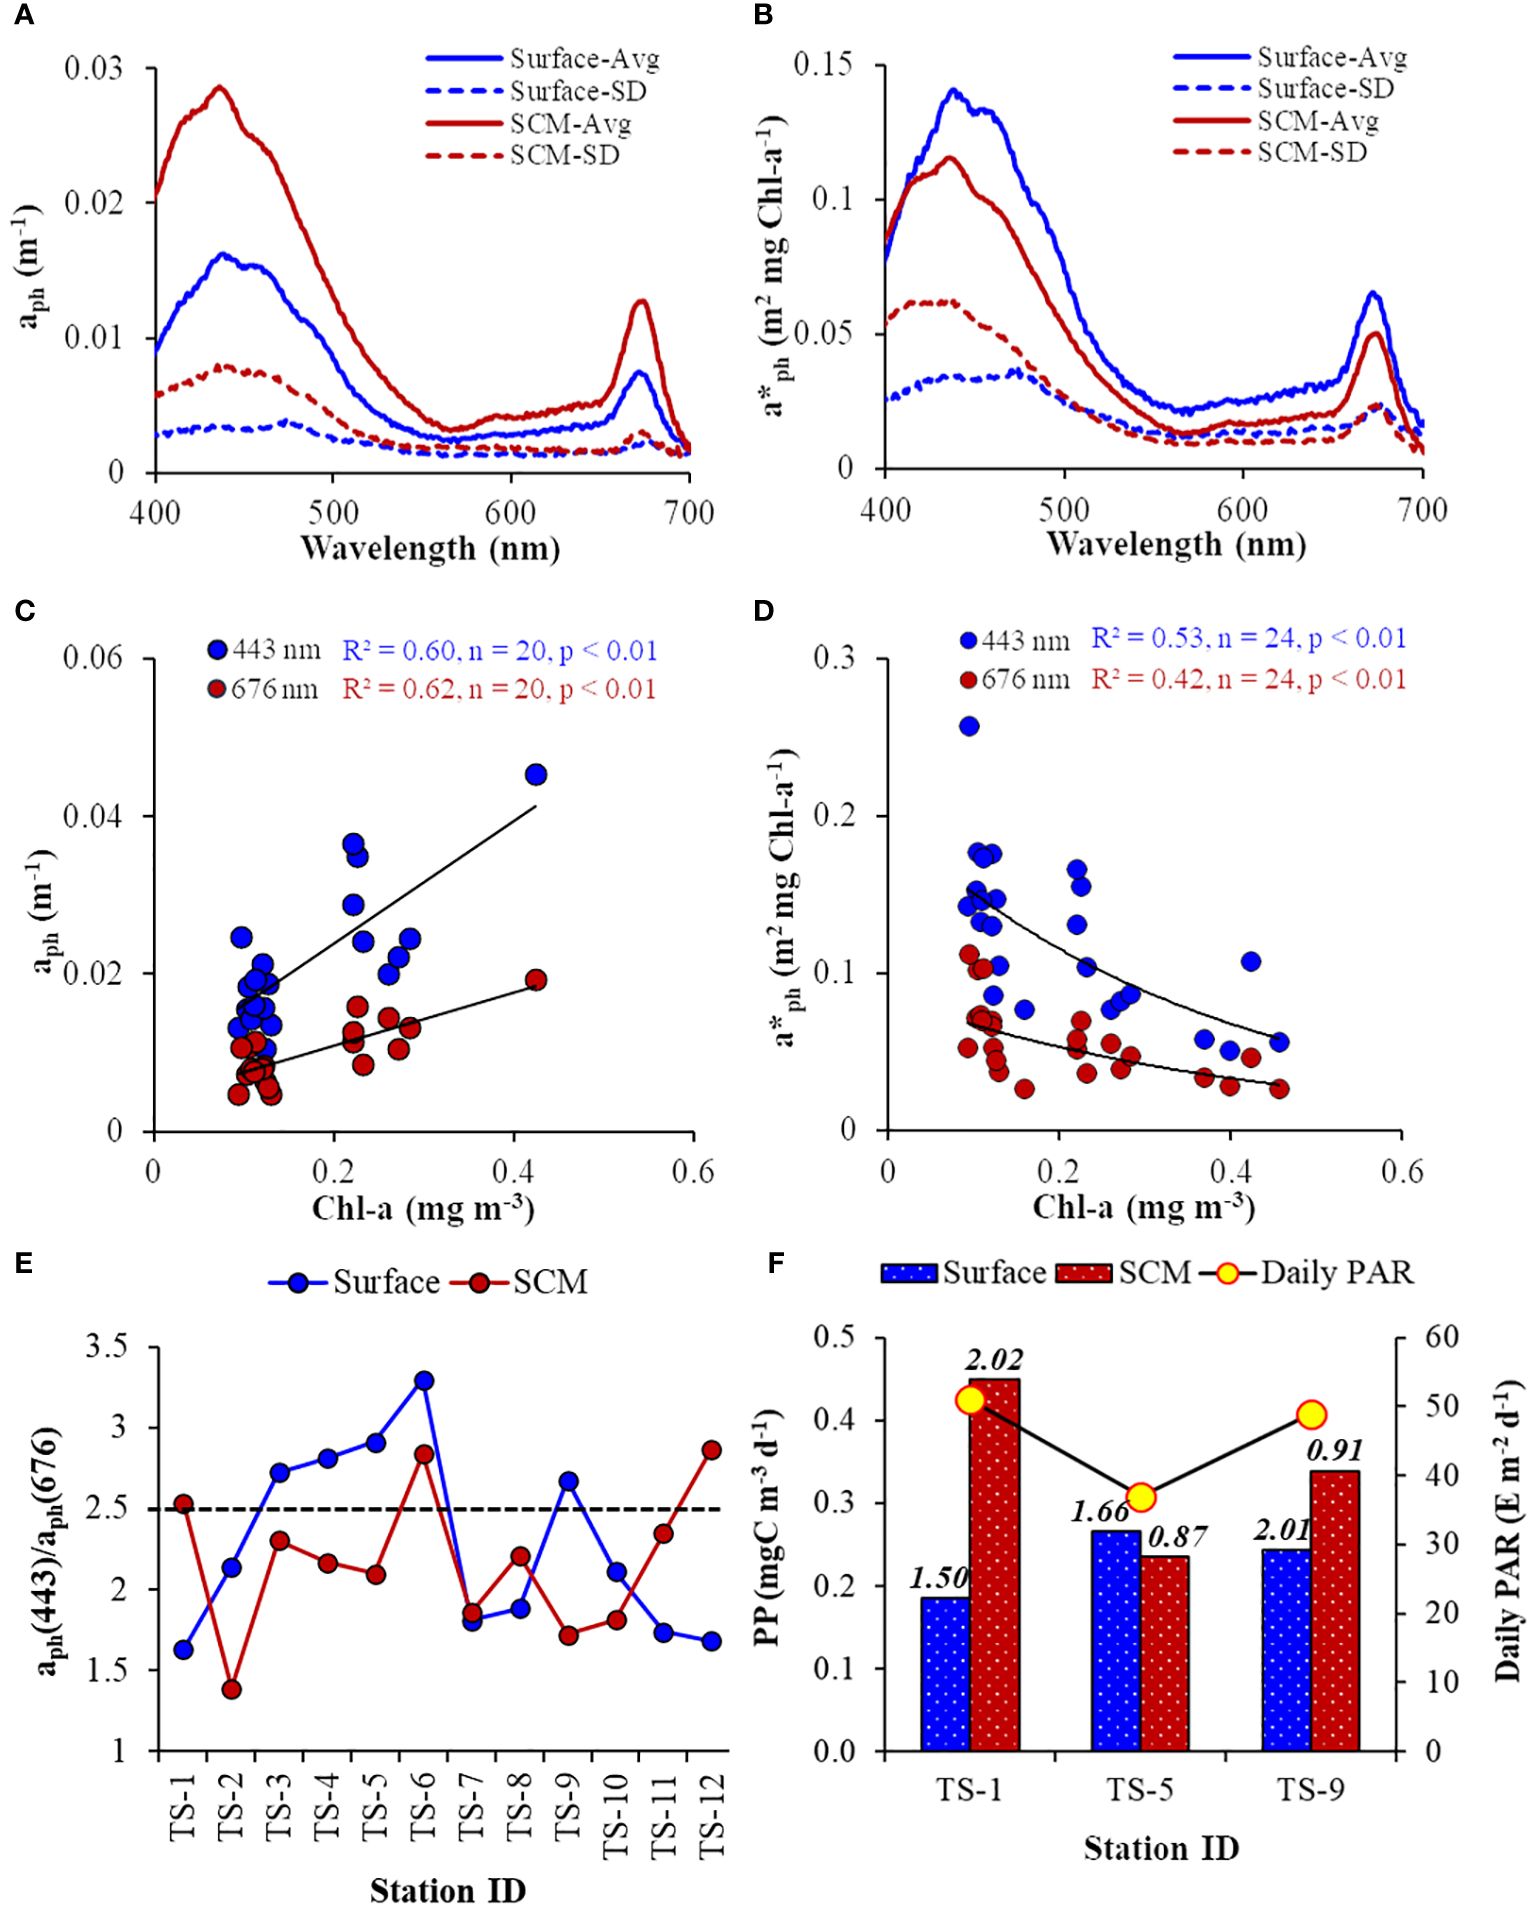
Figure 8 (A) Spectral average (Avg) and standard deviation (SD) of phytoplankton absorption (aph(λ)), and (B) chlorophyll-specific phytoplankton absorption (a*ph(λ)) at the surface and SCM layer. Scatter plot of (C) aph(λ) vs Chl-a (at 443 nm: y = 0.0774Chl-a+0.0084; at 676 nm: y = 0.034Chl-a+0.0041), and (D) Chl-a vs a*ph(λ) (at 443 nm: y = 0.1971e-2.673Chl-a; at 676 nm: y = 0.849e-2.361Chl-a). Line diagram showing B/R ratio (aph(443)/aph(676)) as a proxy for phytoplankton size-class, where the dashed line at 2.5 indicates the upper limit for microphytoplankton, (F) daily surface PAR, and daily phytoplankton productivity at surface and SCM layer measured on alternative days during the time-series, where the numbers on the top of the histograms indicate the chlorophyll-specific PP (PB) for respective stations.
Understanding the prevailing size structure of phytoplankton communities is crucial for comprehending related physiological phenomena, viz., ‘pigment package effect” and the impact of accessory pigments on light absorption. This study derives the dominant phytoplankton size-class using previously established bio-optical criteria. The blue/red (B/R) ratio of the light-absorption spectra, represented as aph(443)/aph(676), serves as an indicator to categorize the dominant phytoplankton community size classes (Wu et al., 2007; Aguilar-Maldonado et al., 2018; Kerkar et al., 2021, 2023). This index classifies phytoplankton size classes as pico- (< 2 μm), micro- (> 20 μm), and nano-phytoplankton dominant communities when the B/R ratio is > 3.0, < 2.5, and 2.5< B/R< 3.0, respectively. The disparity in the B/R ratio was evident between the surface and SCM layer (Figure 8E), with values ranging from 1.63 to 3.29 (at the surface) and from 1.38 to 2.87 (at SCM). Overall, the B/R ratio for most samples was < 2.5, indicating a micro-phytoplankton-dominant community prevailing in the study location. Precisely, the dominance of micro-phytoplankton was observed in the SCM, while at the surface, there was a fluctuation between the dominance of nano- and micro-phytoplankton. At the PP stations, the phytoplankton community structure was consistent between TS-5 and TS-9 (surface dominated by nano-phytoplankton) but differed for TS-1 (surface dominated by micro-phytoplankton).
Similar to phytoplankton biomass (Chl-a), PP was higher at SCM than the surface layer (Figure 8F). The lower PP observed at SCM during TS-5 could be due to the relatively diminished incident daily PAR (37.0 E m-2 d-1) due to cloudy conditions on that particular day. The PP ranged from 0.185 to 0.266 and from 0.236 to 0.449 mgC m-3 d-1 in surface and SCM layers, respectively. The Chl-a-specific PP (PB), an index for the physiological status of the phytoplankton, varied from 0.87 to 2.02 mgC (mgC Chl-a)-1 d-1. The relationships between productivity (PP), biomass (Chl-a), and absorption (aph) were evaluated to determine the better proxy for PP variability. The PP values were positively correlated with aph(443) and Chl-a, where PP and aph(443) relationship was stronger (R2 = 0.58, n = 6) (Figure 9A) than between PP and Chl-a (R2 = 0.20, n = 6) (Figure 9B), suggesting that the variability in PP was better explained by phytoplankton light-absorption coefficient than biomass. The aph(443) and Chl-a showed a typical positive but weak relationship (R2 = 0.21, n = 6) (Figure 9C), indicating that higher biomass leads to higher absorption. In contrast to PP, the PB values were higher at the surface than the SCM layer except at TS-1 (Figure 8F) and depicted a weak and moderate inverse linear relation with aph (R2 = 0.27, n = 6) (Figure 9D) and Chl-a (R2 = 0.52, n = 6) (Figure 9E), respectively revealing a decrease in PB with increasing light-absorption and biomass. The Chlint values at TS-1, TS-5, and TS-9 stations were not reflected in the observed PP values, implying that high or low Chl-a levels do not essentially translate to high or low rates of PP. Additionally, the Chl-a (mg m-2) integrated up to SCM depths at TS-1 (9.33), TS-5 (10.18), and TS-9 (18.99) also did not align with the observed PP patterns.
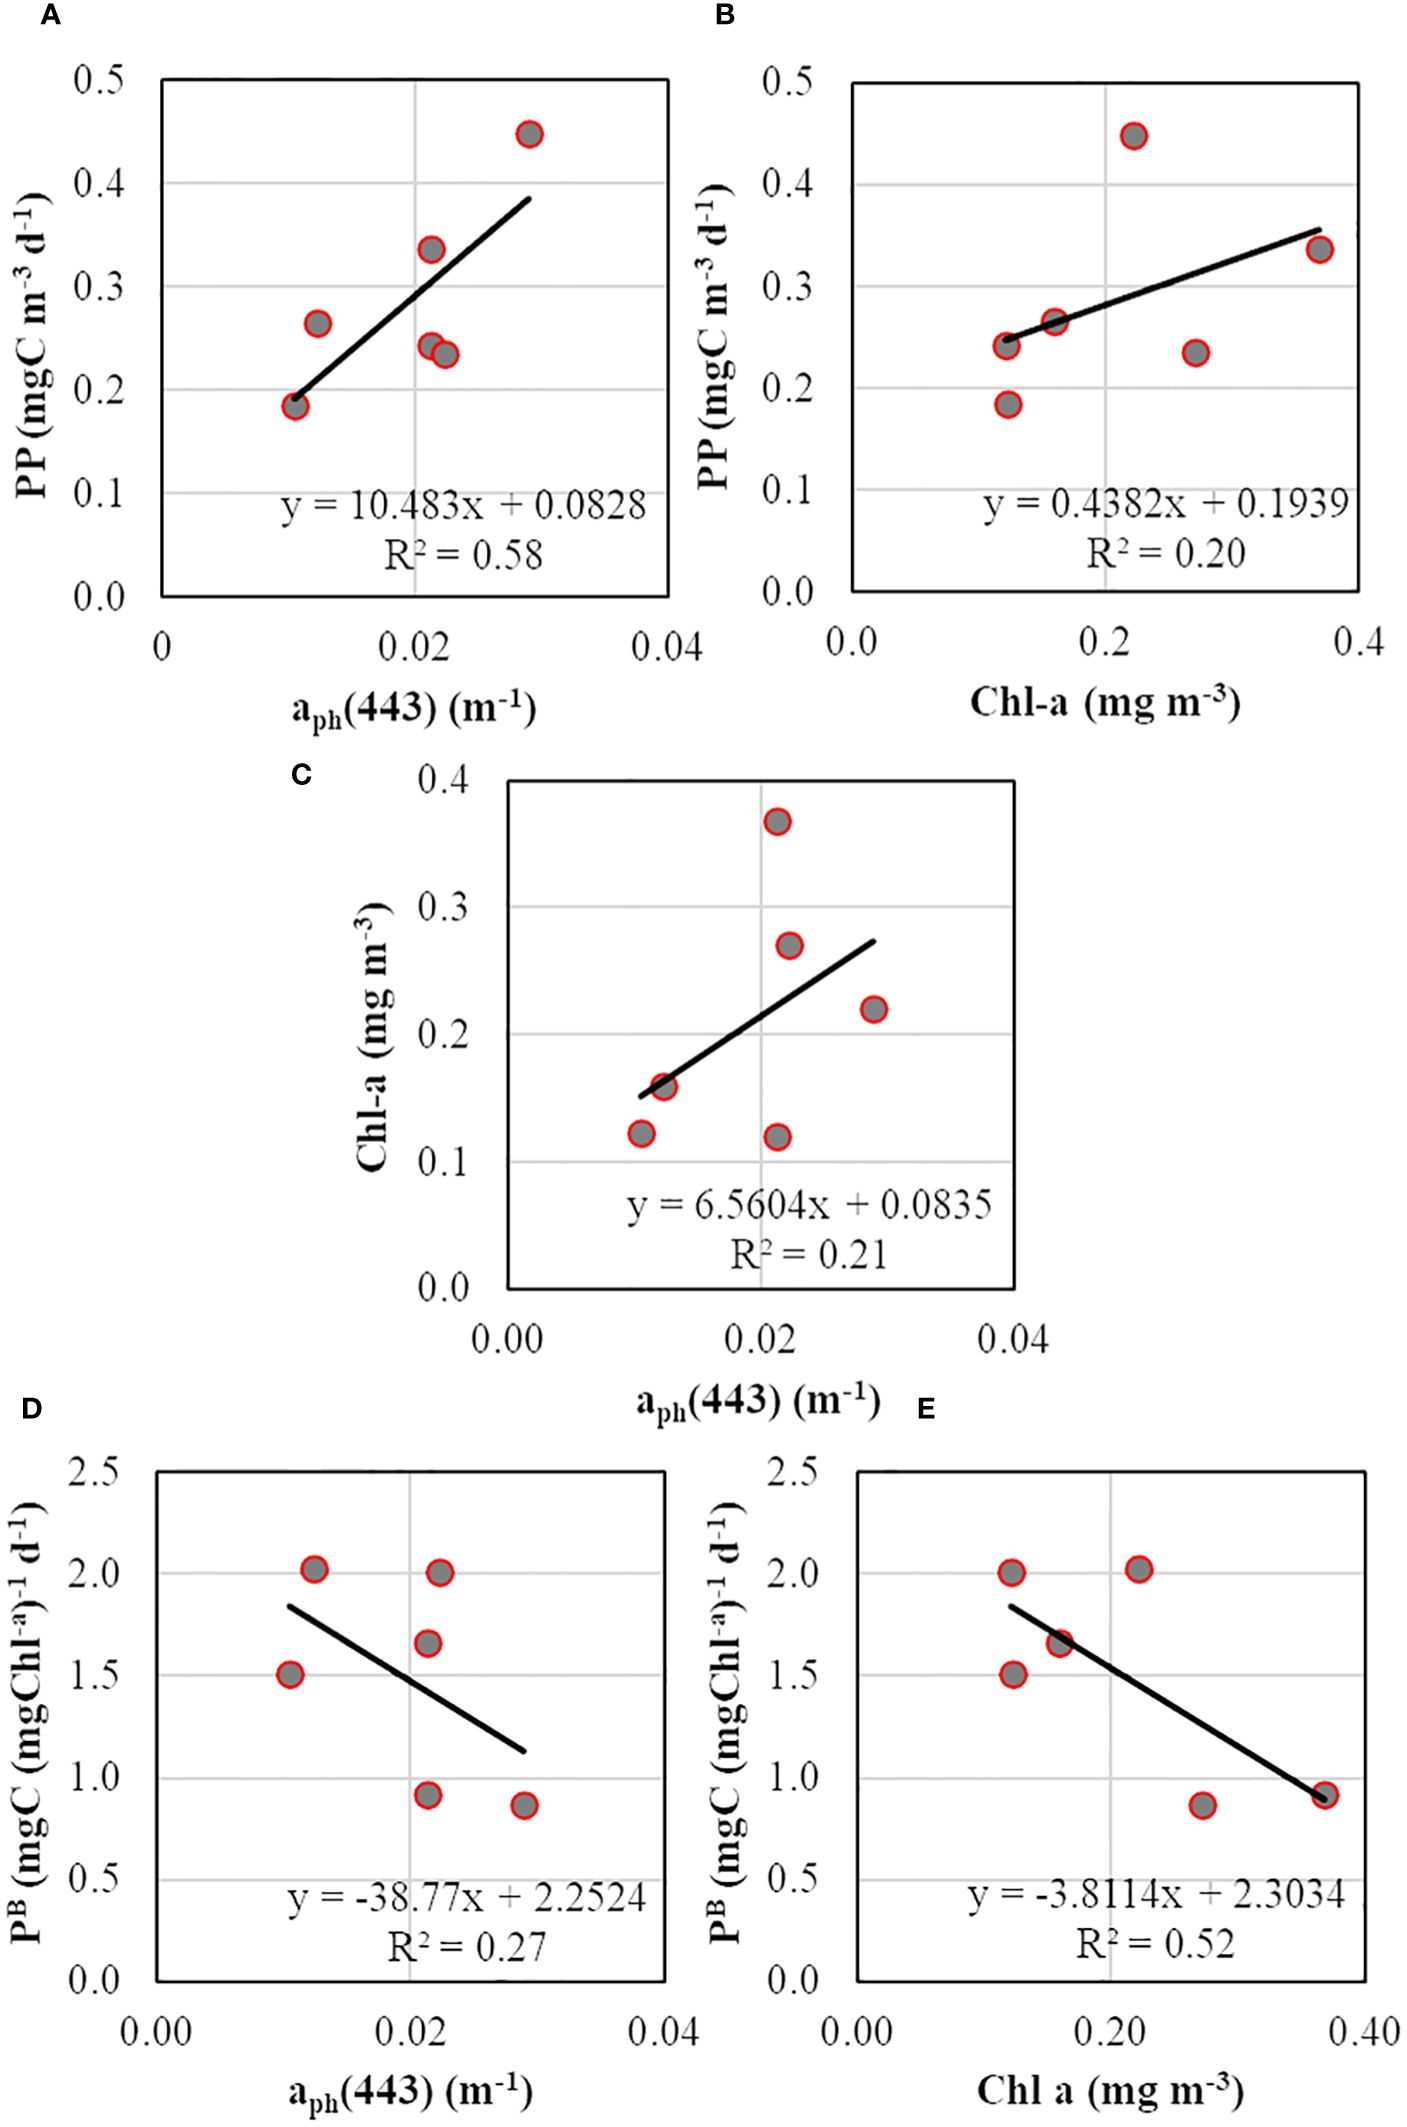
Figure 9 Scatterplots showing relationships between (A) primary productivity and phytoplankton absorption coefficient at 443 nm, (B) primary productivity and chlorophyll-a, (C) chlorophyll-a and phytoplankton absorption coefficient at 443 nm, (D) chlorophyll-a specific PP and phytoplankton absorption coefficient at 443 nm, and (E) chlorophyll-a specific PP and chlorophyll-a.
The observed upper water column characteristics were consistent with previously reported (Sabu et al., 2021; Kerkar et al., 2023) in Prydz Bay. Throughout this study, the salinity gradient appeared more pronounced than the temperature gradient, potentially attributed to the formation of a buoyant layer comprising relatively low-salinity waters resulting from sea-ice melting and the influx of fresher meltwater originating from glaciers. Salinity exerted a stronger influence on water density (sigma-t) than temperature, aligning with the conclusions drawn by Tripathy et al. (2015), who highlighted the significant salinity dependency of sigma-t variations. Notably, distinct stratification was observed within the surface layers, extending to approximately 20-25 m (Figures 1B, C), leading to a confined MLD ranging from 9 to 20 m (Table 2). Wind events are crucial in influencing the upper ocean’s physical and biological processes (Tang et al., 2003). Limited wind activity within the bay resulted in a stratified thermohaline structure of the water column. While the wind speed during the study period generally aligned with climatological values (Figures 7A, B), the three-day average wind speed was weak (~4 m s-1), suggesting weak or absence of mixing. Weak and strong stratifications at the surface and subsurface layers could be confirmed by the lower and higher positive N values, respectively, showing water column stability. However, the relatively high salinity and colder water observed initially and the slight deepening of water column stratification observed towards the end of the three-day measurement period (Figures 1B, C) could be attributed to localized events. Previous studies have indicated that upwelling and mixing processes are highly localized and temporally variable, influenced by factors such as local stratification, winds, tides, sea-ice cover, and bathymetry (Dinniman and Klinck, 2004; Wallace et al., 2008). The stratification limited upward nutrient fluxes from deeper layers, resulting in relatively lower nutrient concentrations within the MLD (Figure 3). The DO values exhibited an inverse correlation with salinity and a positive correlation with temperature (figure not shown), indicating that warmer and fresher water, predominant in the upper 30 m, contained higher DO concentrations (> 8.5 ml l-1) compared to subsurface water. DO values decreased to < 7.0 ml l-1 at temperatures below -1.0 °C, indicating lessened photosynthetic activity beyond 50 m (Figure 1D). Additionally, DO and Chl-a were significantly correlated (R2 = 0.43, p< 0.05), implying the influence of oxygenic photosynthetic activities on regulating DO concentrations within the water column.
The vertical distribution of underwater PAR remained stable throughout the 72 h measurements, displaying minimal variation. The observed variability in Zeu could be attributed to the varying Kd values influenced by the incident solar angle and concentrations of OAS. The Kd showed strong and weak linear positive correlations with TSM concentrations at the surface (R2 = 0.73) and SCM (R2 = 0.56), respectively (Figures 6A, B), suggesting that surface water contains more OAS compared to the DCM layer (Kerkar et al., 2023). The moderate positive correlation between Kd and Chint (R2 = 0.45) indicated that phytoplankton biomass significantly attenuated underwater light (Pan et al., 2019). The measured concentrations of TSM (Figure 5A) were consistent with earlier reports by Dessai et al. (2011) but somewhat lower than reported by Kerkar et al. (2023), who observed TSM concentrations varying between 4.3 to 15.5 mg l-1 in the Prydz Bay. The higher TSM concentration at the surface suggests a relatively lower abundance of biogenic material than the SCM, which is consistent with earlier observations by Kerkar et al. (2020). Likely, the TSM sources in this bay can be attributed to the influx of dust-laden meltwater from nearby coastal Antarctica (Sabu et al., 2014; Pan et al., 2019).
The MLD was generally shallower than Zeu, with positive Zeu-MLD values indicating vertically stratified waters (Ferreira et al., 2017). This stratification provided favorable light conditions for phytoplankton carbon fixation, as phytoplankton did not encounter light limitation while vertically mixing through the ML. Furthermore, extremely high (> 35 m) Zeu-MLD values (Table 2) implied that light conditions within the ML was remarkably conducive to phytoplankton growth (Westwood et al., 2011; Cheah et al., 2013; Tripathy et al., 2020) during the observation period. The mean PAR level in the shallow ML (EML) was > 60% of the daily incident PAR (Table 2), corroborating a good ‘light climate’ (mean irradiance available to phytoplankton in the ML) for the growth of phytoplankton (Boyd et al., 2007; Venables and Moore, 2010) and overall metabolism (Lee et al., 2007) in this region.
Despite the surface water displaying a greenish hue, indicative of higher algal growth or bloom conditions, Chl-a values were lower at the surface and displayed a distinct subsurface maximum (SCM) layer below the stratification, extending from 25 to 60 m of the water column (Figures 4A, B). This phenomenon implies a potential decline phase of a phytoplankton bloom that may have occurred at the onset of the austral summer, with phytoplankton potentially entering a sinking phase, as indicated by earlier studies (Parslow et al., 2001; Gomi et al., 2010) highlighting the role of sinking diatoms in SCM formation and maintenance in the eastern ISSO. However, the possibility of the bloom extending to the base of the mixed layer cannot be ruled out. Furthermore, the SCM maintenance could be associated with a sub-mesoscale mixing process, which constantly provides nutrients at the base of the MLD during summer (Sangra et al., 2014). The build-up of diatom cells in the subsurface depths is controlled by the availability of SiO4 and/or trace nutrients (presumably iron; Fe). When sinking cells reach the SiO4- and Fe-rich subsurface depth, they are released from nutrient limitation-induced stress, leading to buoyancy recovery and cell accumulation in the subsurface depth (Parslow et al., 2001). Furthermore, the observed variation in SCM depth at the study location may be ascribed to the interplay between ambient light settings and nutrient availability, typically governing SCM depth (Tripathy et al., 2015).
Analysis of CTD-based fluorescence data revealed a reduction in surface fluorescence and a slight deepening of the SCM layer during the noon cast (at 1200 h), likely due to increased incident sunlight. Diurnal variations in fluorescence caused by intense solar radiation were evident. The distribution pattern of phaeopigments (Pheo) (Figure 4C) mirrored diurnal fluorescence variation (Figure 4A) caused by incoming solar radiation. Pheopigment concentration was notably higher at deeper depths than Chl-a distribution, indicating the sinking of Chl-a degraded materials resulting from phytoplankton death, decay, or zooplankton grazing (Gomi et al., 2010; Pillai et al., 2018; Venkataramana et al., 2022). Usually, photo-degradation diminishes exponentially with depth, mainly contributing to Pheo disappearance in the presence of PAR (i.e., accelerated removal in the well-lit zone (surface layer)), leading to reduced Chl-a/Pheo ratios with increasing depth (Welschmeyer, 1994; Tripathy et al., 2021). Our results revealed higher Chl-a/Pheo ratios in well-lit upper layers, decreasing with depth and with the lowest ratios at deeper depths, further confirming favorable light conditions in the ML conducive for phytoplankton growth.
Nutrient concentrations observed aligned with previous findings documented in the austral summer (Tripathy et al., 2014; Henly et al., 2017; Jones et al., 2023; Kerkar et al., 2023). Optimal growth conditions for microphytoplankton, particularly diatoms, are achieved when the atomic ratios of nitrate, silicate, and phosphate (N:Si:P) within the cell are approximately 16:16:1 (Redfield et al., 1963; Brzezinski, 1985). Aberrations from these standard ratios may indicate potential nutrient limitation and create a favorable environment for smaller (nano and pico) phytoplankton growth due to their competitive utilization of nutrients, especially at high N:P ratios with low PO4 values (Mackey et al., 2013). The observed N:P, N:Si, and Si:P ratios in the water column were consistent with the previous reports by Tripathy et al. (2014, 2015) and Kerkar et al. (2021). High average N:P (14.04 ± 1.14 µM) and Si:P (24.43 ± 1.90 µM) ratios in the study area indicated no nitrate and silicate limitation, while a high Si:P ratio (> 3) and low N:Si ratio (<1; 0.57 ± 0.03 µM) suggested Si-enriched water in the studied area and higher SiO4 concentration than NO3 (Harrison et al., 1977) at the sampling site. The nutrient ratios (Table 2) suggested favorable conditions for the growth of micro-phytoplankton (larger and presumably shade-adapted diatoms and ciliates), with occasional instances of nano-phytoplankton dominance (Figure 8E), possibly due to low phosphate concentrations, and/or high light conditions. Gomi et al. (2010) demonstrated that no specific diatom assemblages are characteristic of the SCM layer in the ISSO, as, at times, ciliates also occur abundantly in the SCM layer. Low PO4 concentrations relative to other nutrients could potentially result from co-precipitation with ikaite (abiotic calcium carbonate) (Jones et al., 2023). The proliferation of a particular phytoplankton species and its relative impacts on community composition are typically influenced by ambient physicochemical parameters, viz., temperature, salinity, nutrients, and light availability (Reynolds and Reynolds, 1985). Consequently, the community composition of phytoplankton is viewed as a comprehensive response to ambient environmental conditions (Claustre et al., 2005).
Phytoplankton pigments play a significant role in photosynthesis and are pivotal for moderating oceanic ecological and biogeochemical processes. Assessing phytoplankton pigments by ‘optical’ means is desirable as it can be extrapolated to satellite remote sensing (Sun et al., 2021) for comprehensive oceanic studies at a synoptic scale. Among the means, the phytoplankton absorption coefficient (aph(λ)) is the widely preferred optical index for delineating phytoplankton variability (Moisan et al., 2011). The aph(λ) is influenced by shifts in phytoplankton species structure and physiological conditions; hence, the measurement of aph(λ) is a crucial aspect of bio-optical studies and absorption-based models of PP. The average aph(λ) and a*ph(λ) values (Figures 8A, B) of this study were higher than those reported by Clementson et al. (2001) but consistent with the values observed by Kerkar et al. (2022, 2023). These differences correspond to the variable ranges of ambient Chl-a concentration observed in the respective studies. While Chl-a does not provide taxonomic information, significant variance in Chl-a concentrations typically indicates variations in photosynthetic and accessory pigments, leading to fluctuations in the light absorption spectra (Barlow et al., 2002; Chase et al., 2013) characteristics of different phytoplankton size classes. For both surface and SCM, we observed a higher standard deviation in aph(λ) in the blue region than in the red region of the spectrum, suggesting the influence of accessory pigments in light absorption (Barlow et al., 2002). The mean aph(λ) at SCM was higher than the surface, indicating more light absorption at SCM owing to greater phytoplankton concentrations at SCM, as shown by the positive correlation between aph(λ) and Chl-a (Figure 8C).
The a*ph(λ) signifies phytoplankton light absorption efficiency for carbon fixation and is a crucial factor in estimating PP (Platt and Sathyendranath, 1988; Robinson et al., 2017). In contrast to aph(λ), the average spectra of a*ph(λ) were higher at the surface than the SCM, signifying higher Chl-a-specific light absorption at the surface (Figure 8B), indicative of efficient or healthier phytoplankton taxa predominant in this layer. As we move from the surface to deeper waters, there is an anticipated rise in Chl-a content per cell due to photoacclimation, leading to vertically declining a*ph(λ). So, the observed lower a*ph(λ) in SCM reveals the presence of a photoacclimated phytoplankton community. More variability in aph(λ) and a*ph(λ) was noticed at SCM than at the surface, especially in the blue region of the spectrum (443 nm). Mostly, in the global ocean, a*ph(λ)< aph(λ), whereas we noticed a reverse trend. The observed a*ph(λ) values were noticeably higher than the aph(λ), possibly due to the adaptive response of the dominant phytoplankton group (presumably shade-adapted) to the surrounding light condition, resulting in effective light harvesting (Matsuoka et al., 2009; Gomi et al., 2010; Tripathy et al., 2015). Usually, lower and higher values of a*ph(λ) are associated with larger and smaller pigment packaging and cell sizes and with lower and higher relative significance of accessory pigments, respectively (Ferreira et al., 2017). The higher a*ph(λ) at the surface observed in this study could be attributed to smaller pigment packaging and the prevalence of efficient and/or smaller phytoplankton taxa (discussed in section 4.3), underscoring that the light absorption efficiency of the surface phytoplankton was better than the SCM phytoplankton due to higher contribution of accessory pigment to total absorption at the surface. Additionally, the positive correlation between aph(λ) and temperature (figure not shown) suggests higher light absorption in the comparatively warmer surface layer in Prydz Bay, which is consistent with the findings of Kerkar et al. (2020) in the ISSO and Kheireddine et al. (2018) elsewhere in the global ocean. Both studies credited this to the predominance of smaller phytoplankton.
Generally, the aph(λ) typically increases, while the a*ph(λ) decreases nonlinearly with increasing Chl-a concentration, attributed to a diminishing contribution of non-photosynthetic pigments and increasing pigment packaging. This results in no linearity between light-harvesting efficiency and pigment packaging due to intracellular overlapping of the chloroplasts is known as the “package effect,” and the a*ph(λ) serves as an effective proxy for studying “package effect” (Bricaud et al., 1995, 2004). Various laboratory studies have demonstrated that package effects account for 58 and 71% of the variability in absorption (Sathyendranath et al., 1987; Stuart et al., 1998), and this variability in optical properties may introduce noise, thereby limiting the accuracy of bio-optical algorithms, in the global oceans in general and Polar oceans in particular. The observed inverse relationship between a*ph(λ) and Chl-a (Figure 8D) indicates the occurrence of a package effect in the study area. The a*ph(λ) versus Chl-a relationship of this study was consistent with other studies from high-latitude regions (e.g., Naik et al., 2013; Ferreira et al., 2017; Kerkar et al., 2020, 2022; D’Sa et al., 2021; Pandi et al., 2023a, b), albeit lower than the fit noticed by Bricaud et al. (1995) for lower and middle latitude waters. The package effect is noticeable in both the blue and red regions of the spectrum, with a more pronounced effect observed in the blue region due to the substantial contribution of accessory pigments to total absorption. The observed a*ph(λ) > aph(λ) could be due to (i) the changes in the relative abundance of chlorophyll (primary pigment) and accessory pigments within the phytoplankton and/or (ii) variation in packaging effect (i.e., pigment packaging within the shade-adapted phytoplankton cells) (Sathyendranath et al., 1987; Bricaud et al., 1995). In higher latitudes like Polar Oceans, significant variability in a*ph(λ) is expected (Ferreira et al., 2017) since it is derived based on the concentration of the primary pigment, i.e., Chl-a. However, higher concentrations of accessory pigments that absorb light can substantially affect a*ph(λ) estimates across the blue-to-red spectral range. This variability can be influenced by factors such as light acclimatization within species, leading to instances where a*ph(λ) > aph(λ) under specific environmental conditions.
The majority of the a*ph(λ) values in this study were > 0.07 m2 mgChl-a−1, suggesting either a reduced packaging effect or an increase in non-photosynthetic pigments concentrations, indicating the prevalence of smaller phytoplankton (Bricaud et al., 2010) in the study area. However, the presence of a*ph(λ) values < 0.07 m2 mgChl-a−1 also emphasizes the co-presence of large or microphytoplankton in the Prydz Bay. Significant light absorption by accessory pigments impacts a*ph(λ) estimates across the blue-to-red spectral range. Furthermore, variations in the package effect result from two primary factors: (i) alterations in cell size, shape, or morphology, and (ii) fluctuations in intracellular pigment concentration, often induced by photo-adaptive responses (Morel and Bricaud, 1981; Kirk, 1994). Although our dataset does not permit a detailed explanation of the processes involved, studies (Palmisano et al., 1986; Mendes et al., 2015; D’Sa et al., 2021) have indicated that phytoplankton can adjust their photosynthetic efficacy in response to varying light intensity (photo-adaptive responses) in Polar Regions. Pigment packaging holds significance in high-latitude oceans as phytoplankton adapts to the low-light and high-nutrient environment (Cota et al., 2003; Deppeler and Davidson, 2017; Baldry et al., 2020) by adjusting their pigment concentration and type. Fucoxanthin production, an essential mechanism for diatom assemblages to increase light harvesting, has been reported to occur at the tip of the Antarctic Peninsula (Mendes et al., 2018). Indeed, the synthesis of photosynthetic pigments is viable under non-limiting nutrient conditions, as observed in the nutrient-replete environment of the studied location in Prydz Bay.
Understanding the size distribution of phytoplankton communities can offer insights into related physiological phenomena, such as the pigment packaging effect and the impact of accessory pigments on light absorption. In this investigation, variation in phytoplankton absorption properties was utilized as an indicator to categorize the prevailing phytoplankton community structure, employing established bio-optical criteria known as the blue-to-red ratio of aph(λ) (i.e., B/R = aph(443)/aph(676)) as adopted in numerous studies (Stuart et al., 1998; Lohrenz et al., 2003; Wu et al., 2007; Aguilar-Maldonado et al., 2018; Kerkar et al., 2022, 2023; Pandi et al., 2023b). Overall, the B/R for most samples was < 2.5 (Figure 8E), indicative of the micro-phytoplankton dominant community prevailing in both layers of the studied location. However, values 2.5< B/R< 3.0 indicate a predominance of nano-phytoplankton (Aguilar-Maldonado et al., 2018) or mixed community (Stuart et al., 1998). We noted variations in community structure between casts, with instances of nano-phytoplankton or mixed communities prevailing at five and three instances in the surface and SCM layers, respectively. This suggests phytoplankton movement within the water column to achieve a better photo-adaptive state, often through photoacclimation to shade, in response to fluctuating ambient light and nutrient conditions (Bricaud et al., 1998). The observed community shift could also be because large phytoplankton species gain a competitive advantage over small plankton species by exploiting fluctuating and low light regimes; thus, they can maintain optimal photosynthetic rates in the deeper layer (Sangra et al., 2014) where variability in the light environment is significantly high for phytoplankton.
The B/R ratio approach indicated the dominance of micro-phytoplankton in most sampling points, complementing the observed pigment packaging effect in Prydz Bay, a nutrient-replete environment. A study by Kerkar et al. (2021) reported B/R values ranging between 1.6 and 3.2 at the coastal waters of ISSO, with most values of B/R< 2.5 suggesting a micro-phytoplankton-dominated community. The nutrient stoichiometry observed in this study is consistent with previously observed, indicating conducive growth conditions for larger plankton in the coastal waters (Iida and Odate, 2014; Tripathy et al., 2014; Mendes et al., 2015). However, the SO is usually characterized by the dominance of the nano and micro-phytoplankton communities during summers (Mendes et al., 2015; Jeon et al., 2023) with nanoplanktonic diatoms (2-20 μm) such as Fragilariopsis spp., small centrics (10-15 μm) from the genus Thalassiosira and Minidiscus spp. (< 10 μm) can dominate the coastal waters (Kim et al., 2018; Mascioni et al., 2023), which are characterized by a higher B/R ratio and are less inclined to pigment package effect (Tripathy et al., 2021). The B/R ratio suggests that the observed package effect could be ascribed to the diatom or the prymnesiophytes (mostly Phaeocystis) and prasinophytes blooms regularly reported in this region (Irion et al., 2021; Kauko et al., 2021).
The Antarctic continental shelves are critical sites for the biological uptake of CO2 by phytoplankton, as the area-normalized primary productivity rates here surpass those of any other SO region (Arrigo et al., 2008a). Consequently, these shelf regions disproportionately impact the SO carbon system and the CO2 exchange between the atmosphere and ocean, with potential implications for large-scale biogeochemical cycles and climate dynamics (Arrigo et al., 2008b). In this study, both Chl-a and PP were higher at SCM than the surface layer. However, the Chlint values were not mirrored in the observed PP values, indicating that high or low Chl-a levels do not necessarily correspond to high or low rates of PP. Instead, light absorption by phytoplankton and its subsequent utilization emerges as the fundamental factor governing oxygenic photosynthesis in the ocean (Marra et al., 2007; Ferreira et al., 2017). The low PP observed at SCM of TS-5 could be attributed to the low incident PAR due to overcast conditions on that particular day. The magnitudes of observed PP were equivalent to those reported by Kerkar et al. (2021) in Prydz Bay but were lesser than those reported by Tripathy et al. (2014) in coastal Antarctica (far west of Prydz Bay).
Various studies have elucidated the environmental mechanisms influencing SO and/or Antarctic PP, including effects of temperature (Neori and Holm-Hansen, 1982; Tilzer and Dubinsky, 1987), light (El-Sayed et al., 1970), and nutrients (Tsunogai and Watanabe, 1983; Iida and Odate, 2014). In this study, clear relationships between PP and physicochemical and bio-optical parameters (figures not shown) were observed, complementing the findings of previous studies. The PP (mgC m-3 d-1) at surface and SCM layer exhibited positive correlations with salinity (R2 = 0.35), NO3 (R2 = 0.7), SiO4 (R2 = 0.36), PO4 (R2 = 0.38), Chl-a (R2 = 0.20), and aph(443) (R2 = 0.58); while showing inverse correlation with water temperature (R2 = 0.53) and PAR (R2 = 0.46) at corresponding depths. However, PP did not show any relationship with MLD, a*ph(443) and daily PAR. Nevertheless, previous studies (i.e., Claustre et al., 2005; Kahru et al., 2017; Kerkar et al., 2021) observed a notable absence of physical controls (i.e., temperature and salinity) on PP variability in the SO, possibly due to the spatial distribution of their sampling stations, whereas the present study represents time-series approach.
The PB or assimilation numbers, an index for phytoplankton physiological status, were comparatively higher at the surface than the SCM except at TS-1 (Figure 8F). Notably, the higher PB at TS-1 was aligned with the corresponding phytoplankton size class present at that time i.e., TS-1 (SCM dominated by nano-phytoplankton), and TS-5, TS-9 (SCM dominated by micro-phytoplankton) (Figure 8E), revealing less package effect at the surface resulting in higher photosynthetic efficiency. Both a*ph(λ) and PB showed an inverse relationship Chl-a (Figures 8D; Figure 9E), indicating diminishing photosynthetic efficiency with elevated biomass in the study area, which is consisted with the earlier studies (Tripathy et al., 2014; Ferreira et al., 2017; Kerkar et al., 2020). Thus, if Chl-a increases in a particular region, we should see a decrease in PB if pigment packaging is affecting PP, which could also be confirmed by the observed inverse relationship between PB and aph(443) (Figure 9D). However, it is essential to acknowledge the limited number of observations in the present study, and we caution that further corroboration of this approach using a larger dataset is necessary to confirm the robustness of our results. Marra et al. (2007) have underscored that the commonly observed low PB in the SO and Ross Sea is not caused by low temperatures or low irradiance but rather attributed to pigment packaging and prevailing phytoplankton community structure.
Phytoplankton production forms the base of the marine food chain, playing a pivotal role in the oceanic biogeochemical cycles and food webs by providing sustenance for all higher trophic levels (Falkowski et al., 2000). However, measuring in situ PP is labor-intensive and time-consuming, prompting the search for proxies to estimate PP. Marra et al. (2007) demonstrated that across various trophic conditions in the ocean’s surface layer, variations in PP were more closely linked to variations in aph(λ) than changes in Chl-a concentration, suggesting that environmental variability is better captured by the absorption properties of phytoplankton pigments rather than their quantity. To validate this assertion, we evaluated the relationship between PP, Chl-a, and aph(λ) to ascertain the superior proxy for PP variability in the ISSO. Our study revealed a stronger positive linear relationship between PP and aph(443) compared to Chl-a (Figures 9A, B), indicating that phytoplankton light absorption, rather than biomass, better explains PP variability. This finding is consistent with the previous studies in SO (Marra et al., 2007; Lee et al., 2011) and ISSO (Kerkar et al., 2020; 2021). Additionally, we observed that the ratio of PP to aph(λ) was lower at the SCM layer than at the surface (figure not shown), supporting the assumption of Marra et al. (2007), whose study was restricted to the surface only, that the ratio of PP to aph(λ) would systematically decline with optical depth. The results presented in this study suggest that analytical retrieval of aph(λ) (Hirata et al., 2008) may be preferable over Chl-a for satellite-based PP studies in the ISSO. However, further validation using datasets of higher spatiotemporal resolution is warranted (Kerkar et al., 2021). A recent bio-argo-based survey by Vives et al. (2023) has shown that Chl-a did not serve as a good indicator while investigating the onset of spring blooms in SO. Our findings are consistent with Lee et al. (2011), who demonstrated the advantages of estimating satellite-based PP using an aph(λ)-based model (R2 = 0.74) over Chl-a-based model (R2 = 0.5). They indicated significant differences between the two model estimates, with aph(λ)-based model yielding results closer to the in situ PP, suggesting that if we are to calculate the contribution of the “biological pump” to global carbon cycle, it would be more precise if aph(λ)-based approach is used rather than the traditionally used Chl-a-based approach. Studies have highlighted the uncertainty associated with satellite estimation of Chl-a concentrations in the SO (Hirawake et al., 2000; Marrari et al., 2006; Lance et al., 2007) and have emphasized the efficacy of aph(λ)-based PP models in estimating phytoplankton carbon fixation (Hirawake et al., 2011). Long-term monitoring of phytoplankton physiological properties in the under-sampled ISSO is recommended to advance our understanding of these processes further.
This study conducted concurrent time-series measurements (72 h at 6 h intervals) of phytoplankton productivity along with physicochemical and bio-optical properties to elucidate their interplay and variability in the under-sampled Prydz Bay, coastal Antarctica, during the austral summer of 2018. Results indicated the upper layer stratification in Prydz Bay, likely due to the influx of meltwater from nearby glaciers and low wind activity. The occurrence of SCM below the stratified layer could be attributed to the light acclimatization response of the shade-adapted phytoplankton. The distribution pattern of phaeopigments indicated the sinking of degraded biogenic materials and the prevalence of active zooplankton grazing. Surface layers exhibited more TSM than the SCM layers, emphasizing the role of glacial meltwater, which typically carries optically active substances (suspended particles). Stable light penetration indicates less movement of water mass in the studied location. Additionally, the underwater light climate and macronutrient concentrations and/or ratio indicated a conducive environment for the growth of large or micro-phytoplankton. Classification of phytoplankton size classes (micro, nano, and pico) using aph at Blue (443 nm)/Red (676 nm) region confirmed the dominance of larger (micro) phytoplankton, mainly in the SCM layer, that are more susceptible to package effect, thus having implications for the reduced potential for PP in this polar marine ecosystem. Light abortion properties indicated the prevalence of ‘pigment packaging’ effect in both layers, which in turn was reflected in the observed variability in the magnitude of the PP. We have shown that the PP variability is better explained by aph(λ) than Chl-a, reaffirming the advantages of aph(λ)-based approach in estimating PP from space-borne sensors or ocean color, over the traditionally used Chl-a approach, which can significantly alter our calculation of the contribution of biological pump to the global carbon cycle. This study has provided evidence that is expected to enhance our understanding of the variability in PP with respect to ambient environmental conditions in this under-sampled region of the Southern Ocean.
The datasets presented in this study are available upon request.
SCT: Conceptualization, Data curation, Formal analysis, Investigation, Writing – original draft, Writing – review & editing. AUK: Data curation, Formal analysis, Writing – review & editing. PS: Data curation, Formal analysis, Writing – review & editing. SKP: Data curation, Formal analysis, Writing – review & editing. SRP: Data curation, Formal analysis, Writing – review & editing. AS: Data curation, Formal analysis, Writing – review & editing. BVP: Data curation, Formal analysis, Writing – review & editing. RM: Funding acquisition, Writing – review & editing.
The author(s) declare financial support was received for the research, authorship, and/or publication of this article. The Ministry of Earth Sciences, Government of India provided funding for research and 50% of the APC.
The authors thank the Director NCPOR for his encouragement and support. Financial support from the Ministry of Earth Sciences, Government of India, is highly acknowledged. We thank the captain, officers, and crew of MV-S. A. Agulhas I for their exemplary support and cooperation during the 9th Indian Scientific Expedition to the Southern Ocean. This article is NCPOR contribution number J-15/2024-25.
The authors declare that the research was conducted in the absence of any commercial or financial relationships that could be construed as a potential conflict of interest.
All claims expressed in this article are solely those of the authors and do not necessarily represent those of their affiliated organizations, or those of the publisher, the editors and the reviewers. Any product that may be evaluated in this article, or claim that may be made by its manufacturer, is not guaranteed or endorsed by the publisher.
The Supplementary Material for this article can be found online at: https://www.frontiersin.org/articles/10.3389/fmars.2024.1420179/full#supplementary-material
Supplementary Figure 1 | Scatter plot of time-series (A) temperature and salinity, (B) sigma-t versus temperature, and (C) sigma-t versus salinity in the study area.
Aguilar-Maldonado J., Santamaría-del-Angel E., Gonzalez-Silvera A., Cervantes- Rosas O., Lopez L., Gutierrez-Magness A., et al. (2018). Identification of phytoplankton blooms under the index of Inherent Optical Properties (IOP index) in optically complex waters. Water 10, 129. doi: 10.3390/w10020129
Alalli K., Bricaud A., Claustre H. (1997). Spatial variations in the chlorophyll-specific absorption coefficients of phytoplankton and photosynthetically active pigments in the equatorial Pacific. J. Geophys. Res. 102, 12413–12423.
Arrigo K. R., van Dijken G. L., Bushinsky S. (2008a). Primary production in the southern ocean 1997–2006. J. Geophys. Res. – Ocean 113, C08004. doi: 10.1029/2007JC004551
Arrigo K. R., van Dijken G., Long M. (2008b). Coastal Southern Ocean: a strong anthropogenic CO2 sink. Geophys. Res. Lett. 35, L21602. doi: 10.1029/2008GL035624
Babin M., Stramski D., Ferrari G. M., Claustre H., Bricaud A., Obolensky G., et al. (2003). Variations in the light absorption coefficients of phytoplankton, non-algal particles, and dissolved organic matter in coastal waters around Europe. J. Geophys. Res. 108, 3211. doi: 10.1029/2001JC000882
Baldry K., Strutton P. G., Hill N. A., Boyd P. W. (2020). Subsurface chlorophyll-a maxima in the Southern Ocean. Front. Mar. Sci. 7. doi: 10.3389/fmars.2020.00671
Barlow R. G., Aiken J., Holligan P. M., Cummings D. G., Maritorena S., Hooker S.. (2002). Phytoplankton pigment and absorption characteristics along meridional transects in the Atlantic Ocean. Deep-Sea Res. I 47, 637–660. doi: 10.1016/S0967-0637(01)00081-4
Boyd P. W., Jickells T., Law C. S., Blain S., Boyle E. A., Buesseler K. O., et al. (2007). Mesoscale iron enrichment experiments 1993-2005: synthesis and future directions. Science 315, 612–617. doi: 10.1126/science.1131669
Bricaud A., Babin M., Claustre H., Ras J., Tièche F. (2010). Light absorption properties and absorption budget of Southeast Pacific waters. J. Geophys. Res. 115, C08009. doi: 10.1029/2009JC005517
Bricaud A., Babin M., Morel A., Claustre H. (1995). Variability in the chlorophyll-specific absorption coefficients of natural phytoplankton: analysis and parameterization. J. Geophys. Res.- Oceans 100, 13321–13332. doi: 10.1029/95JC00463
Bricaud A., Claustre H., Ras J., Oubelkheir K. (2004). Natural variability of phytoplankton absorption in oceanic waters: Influence of the size structure of algal populations. J. Geophys. Res. 109, C11010. doi: 10.1029/2004JC002419
Bricaud A., Morel A., Babin M., Allali K., Claustre H.. (1998). Variations of light absorption by suspended particles with chlorophyll a concentration in oceanic (case 1) waters: Analysis and implications for bio-optical models. J. Geophys. Res. 103 (C13), 31033–31044. doi: 10.1029/98JC02712
Brunelle C. B., Larouche P., Gosselin M. (2012). Variability of phytoplankton light absorption in Canadian Arctic seas. J. Geophys. Res. 117, C00G17. doi: 10.1029/2011JC007345
Brzezinski M. A. (1985). The Si:C:N ratio of marine diatoms: interspecific variability and the effect of some environmental variables. J. Phycol. 21, 347–357. doi: 10.1111/j.0022-3646.1985.00347.x
Chase A., Boss E., Zaneveld R., Bricaud A., Claustre H., Ras J., et al. (2013). Decomposition of in situ particulate absorption spectra. Methods Oceanogr. 7, 110–124. doi: 10.1016/j.mio.2014.02.002
Cheah W., McMinn A., Griffiths F. B., Westwood K. J., Wright S. W., Clementson L. A.. (2013). Response of phytoplankton photophysiology to varying environmental conditions in the sub-antarctic and polar frontal zone. PloS One 8, 72165. doi: 10.1371/journal.pone.0072165
Chisholm W. S., Falkowski P. G., Cullen J. J. (2001). Dis-crediting ocean fertilization. Science 294, 309–310. doi: 10.1126/science.1065349
Claustre H., Babin M., Merien D., Ras J., Prieur L., Dallot S., et al. (2005). Toward a taxon-specific parameterization of bio-optical models of primary production: A case study in the North Atlantic. J. Geophys. Res.-Oceans 110, C07S12. doi: 10.1029/2004JC002634
Clementson L. A., Parslow J. S., Turnbull A. R., McKenzie D. C., Rathbone C. E. (2001). "Optical properties of waters in the Australasian sector of the Southern Ocean.". J. Geophys. Res.- Oceans 106, C12, 31611–31625. doi: 10.1029/2000JC000359
Cota G. F., Harrison W. G., Platt T., Sathyendranath S., Stuart V. (2003). Bio-optical properties of the labrador sea. J. Geophys. Res. 108 (C7). doi: 10.1029/2000JC000597
D’Sa E. J., Kim H.-C., Ha S.-Y., Joshi I. (2021). Ross sea dissolved organic matter optical properties during an austral summer: biophysical influences. Front. Mar. Sci. 8. doi: 10.3389/fmars.2021.749096
Deppeler S. L., Davidson A. T. (2017). Southern ocean phytoplankton in a changing climate. Front. Mar. Sci. 4. doi: 10.3389/fmars.2017.00040
Dessai D. V., Singh K. T., Mohan R., Nayak G. N., Sudhakar M. (2011). Reading source and processes from the distribution of suspended particulate matter and its selected elemental chemistry in the Southern and Indian Oceans. Curr. Sci. 25, 1193–1200.
Dierssen H. M., Smith R. C., Vernet M. (2002). Glacial meltwater dynamics in coastal waters west of the Antarctic peninsula. Proc. Natl. Acad. Sci. U.S.A. 99, 1790–1795. doi: 10.1073/pnas.032206999
Dinniman M. S., Klinck J. M. (2004). A model study of circulation and cross-shelf exchange on the west Antarctic Peninsula continental shelf. Deep-Sea Res. II 51, 2003–2022. doi: 10.1016/j.dsr2.2004.07.030
El-Sayed S. Z., Mandelli E. F., Sugimura Y. (1970). On the productivity of the Southern Ocean (Atlantic and Pacific sectors). Antarctic Ecol. 1, 119–135.
Falkowski P. G. (2002). The Ocean’s invisible forest. Sci. Am. 287 (2), 54–61. doi: 10.1038/scientificamerican0802-54
Falkowski P., Scholes R. J., Boyle E., Canadell J., CanÞeld D., Elser J., et al. (2000). The global carbon cycle: A test of our knowledge of earth as a system. Science 290, 291–296. doi: 10.1126/science.290.5490.291
Ferreira A., Ciotti A. M., Mendes C. R. B., Uitz J., Bricaud A. (2017). Phytoplankton light absorption and the package effect in relation to photosynthetic and photoprotective pigments in the northern tip of Antarctic Peninsula. J. Geophy. Res.-Oceans 122, 7344–7363. doi: 10.1002/2017JC012964
Gomi Y., Fukuchi M., Taniguchi A. (2010). Diatom assemblages at subsurface chlorophyll maximum layer in the eastern Indian sector of the Southern Ocean in summer. J. Plankton Res. 32, 1039–1050. doi: 10.1093/plankt/fbq031
Guo G., Shi J., Gao L., Tamura T., Williams G. D. (2019). Reduced sea ice production due to upwelled oceanic heat flux in Prydz Bay, East Antarctica. Geophys. Res. Lett. 46, 4782–4789. doi: 10.1029/2018GL081463
Hama T., Miyazaki T., Ogawa Y., Iwakuma T., Takahashi M., Otsuki A., et al. (1983). Measurement of photosynthetic production of a marine phytoplankton population using a stable 13C isotope. Mar. Biol. 73, 31–36. doi: 10.1007/BF00396282
Harrison P. J., Conway H. L., Holmes R. W., Davis C. O. (1977). Marine diatoms in chemostats under silicate or ammonium limitation. III. Cellular chemical composition and morphology of three diatoms. Mar. Biol. 43, 19–31. doi: 10.1007/BF00392568
Henley S. F., Tuerena R. E., Annett A. L., Fallick A. E., Meredith M. P., Venables H. J., et al. (2017). Macronutrient supply, uptake and recycling in the coastal ocean of the west Antarctic Peninsula. Deep-Sea Res. II 139, 58–76. doi: 10.1016/j.dsr2.2016.10.003
Hirata T., Aiken J., Hardman-Mountford N., Smyth T. J., Barlow R. (2008). An absorption model to determine phytoplankton size classes from satellite ocean colour. Remote Sens. Environ. 112, 3153–3159. doi: 10.1016/j.rse.2008.03.011
Hirawake T., Satoh H., Ishimaru T., Yamaguchi Y., Kishino M. (2000). Bio-optical relationship of Case I waters: the difference between the low- and mid-latitude waters and the Southern Ocean. J. Oceanogr. 56, 245–260. doi: 10.1023/A:1011147515805
Hirawake T., Takao S., Horimoto N., Ishimaru T., Yamaguchi Y., Fukuchi M. (2011). A phytoplankton absorption-based primary productivity model for remote sensing in the Southern Ocean. Polar Biol. 34, 291–302. doi: 10.1007/s00300-010-0949-y
Iida T., Odate T. (2014). Seasonal variability of phytoplankton biomass and composition in the major water masses of the Indian Ocean sector of the Southern Ocean. Polar Sci. 8, 283–297. doi: 10.1016/j.polar.2014.03.003
Irion S., Christaki U., Berthelot H., L’helguen S., Jardillier L. (2021). Small phytoplankton contribute greatly to CO2-fixation after the diatom bloom in the Southern Ocean. ISME J. 15, 2509–2522. doi: 10.1038/s41396-021-00915-z
Jasmine P., Muraleedharan K. R., Madhu N. V., Asha Devi C. R., Alagarsamy R., Achuthankutty C. T., et al. (2009). Hydrographic and productivity characteristics along 450E longitude in the southwestern Indian Ocean and Southern Ocean during austral summer. Mar. Ecol. Prog. Ser. 389, 97–116. doi: 10.3354/meps08126
Jeon M., Iriarte J. L., Yang E. J., Park J., Alvesde-Souza C., Park S. J. (2023). Importance of nanophytoplankton biomass during summer 2019 in a retreating marineterminating glacier-fjord system, Marian Cove, West Antarctica (62°S). Front. Mar. Sci. 10. doi: 10.3389/fmars.2023.1174722
JGOFS (1994). Protocols for the joint global ocean flux study (JGOFS) core measurements. IOC manuals guides no. 29, 181.
Jones E. M., Henley S. F., van Leeuwe M. A., Stefels J., Meredith M. P., Fenton M., et al. (2023). Carbon and nutrient cycling in Antarctic landfast sea ice from winter to summer. Limnol. Oceanogr. 68, 208–231. doi: 10.1002/lno.12260
Kahru M., Lee Z., Mitchell B. G. (2017). Contemporaneous disequilibrium of bio-optical properties in the Southern Ocean. Geophys. Res. Lett. 44, 2835–2842. doi: 10.1002/2016GL072453
Kauko H. M., Hattermann T., Ryan-Keogh T., Singh A., de Steur L., Fransson A., et al. (2021). Phenology and environmental control of phytoplankton blooms in the Kong Håkon VII Hav in the Southern Ocean. Front. Mar. Sci. 8. doi: 10.3389/fmars.2021.623856
Kerkar A. U., Tripathy S. C., Hughes D. J., Sabu P., Pandi S. R., Sarkar A., et al. (2021). Characterization of phytoplankton productivity and bio-optical variability in a polar marine ecosystem. Prog. Oceanogr. 195, 102573. doi: 10.1016/j.pocean.2021.102573
Kerkar A. U., Tripathy S. C., Minu P., Baranval N., Sabu P., Patra S., et al. (2020). Variability in primary productivity and bio-optical properties in the Indian sector of the Southern Ocean during an austral summer. Polar Biol. 43, 1469–1492. doi: 10.1007/s00300-020-02722-2
Kerkar A. U., Tripathy S. C., Pandi S. R. (2022). Bio-optical depiction of a polar ocean under global change: Exploring the regional absorption traits. Global Planet. Change 213, 103818. doi: 10.1016/j.gloplacha.2022.103818
Kerkar A. U., Tripathy S. C., Sabu P. (2023). Concurrent measurements of phytoplankton productivity and light absorption from a global carbon hotspot: variability, features, and causes. Global Planet. Change 228, 104193. doi: 10.1016/j.gloplacha.2023.104193
Kheireddine M., Ouhssain M., Organelli E., Bricaud A., Jones B. H. (2018). Light absorption by suspended particles in the Red Sea: effect of phytoplankton community size structure and pigment composition. J. Geophys. Res. - Oceans 123, 902–921. doi: 10.1002/2017JC013279
Kim H., Ducklow H. W., Abele D., Ruiz Barlett E. M., Buma A. G. J., Meredith M. P., et al. (2018). Inter-decadal variability of phytoplankton biomass along the coastal West Antarctic Peninsula. Phil. Trans. R. Soc A. 376, 20170174. doi: 10.1098/rsta.2017.0174
Kirk J. T. O. (1994). Light and photosynthesis in aquatic ecosystems (Cambridge: Cambridge University Press). doi: 10.1017/CBO9780511623370
Lance V. P., Hiscock M. R., Hilting A. K., Stuebe D. A., Bidigare R. R., Smith W. O. Jr., et al. (2007). Primary productivity, differential size fraction and pigment composition responses in two Southern Ocean in situ iron enrichments. Deep-Sea Res. I 54, 747–773. doi: 10.1016/j.dsr.2007.02.008
Lee Z., Lance V. P., Shang S., Vaillancourt R., Freeman S., Lubac B., et al. (2011). An assessment of optical properties and primary production derived from remote sensing in the Southern Ocean (SO GasEx). J. Geophys. Res. Oceans 116, C00F03. doi: 10.1029/2010JC006747
Lee Z., Weidemann A., Kindle J., Arnone R., Carder K. L., Davis C. (2007). Euphotic zone depth: Its derivation and implication to ocean-color remote sensing. J. Geophys. Res. 112, C03009. doi: 10.1029/2006JC003802
Liu C., Wang Z., Cheng C., Xia R., Li B., Xie Z. (2017). Modeling modified circumpolar deep water intrusions onto the Prydz bay continental shelf, east Antarctica. J. Geophys. Res.- Oceans 122, 5198–5217. doi: 10.1002/2016JC012336
Lohrenz S. E., Weidemann A. D., Tuel M. (2003). Phytoplankton spectral absorption as influenced by community size structure and pigment composition. J. Plankton Res. 25, 35–61. doi: 10.1093/plankt/25.1.35
Mackey K. R. M., Hunter D., Fischer E. V., Jiang Y., Allen B., Chen Y., et al. (2013). Aerosol-nutrient-induced picoplankton growth in Lake Tahoe. J. Geophys. Res. 118, 1–14. doi: 10.1002/jgrg.20084
Margalef R. (1978). Life-forms of phytoplankton as survival alternatives in an unstable environment. Ocean. Acta 1, 493–509.
Marra J., Trees C. C., O’Reilly J. E. (2007). Phytoplankton pigment absorption: a strong predictor of primary productivity in the surface ocean. Deep-Sea Res. I 54, 155–163. doi: 10.1016/j.dsr.2006.12.001
Marrari M., Hu C., Daly K. (2006). Validation of SeaWiFS chlorophyll a concentrations in the Southern Ocean: a revisit. Remote Sens. Environ. 105, 367–375. doi: 10.1016/j.rse.2006.07.008
Mascioni M., Almandoz G. O., Cusick A., Pan B. J., Vernet M. (2023). Phytoplankton dynamics in nearshore regions of the western Antarctic Peninsula in relation to a variable frontal zone in the Gerlache Strait. Front. Mar. Sci. 10. doi: 10.3389/fmars.2023.1139293
Matsuoka A., Larouche P., Poulin M., Vincent W., Hattori H. (2009). Phytoplankton community adaptation to changing light levels in the southern Beaufort Sea Canadian Arctic. Estuar. Coast. Shelf Sci. 82, 537–546. doi: 10.1016/j.ecss.2009.02.024
Mendes C. R. B., deSouza M. S., Garcia V. M. T., Leal M. C., Brotas V., Garcia C. A. E. (2012). Dynamics of phytoplankton communities during late Summer around the tip of the Antarctic Peninsula. Deep-Sea Res. I 65, 1–14. doi: 10.1016/j.dsr.2012.03.002
Mendes C. R. B., Kerr R., Tavano V. M., Cavalheiro F. A., Garcia C. A., Dessai D. R., et al. (2015). Cross-front phytoplankton pigments and chemotaxonomic groups in the Indian sector of the Southern Ocean. Deep-Sea Res. II 118, 221–232. doi: 10.1016/j.dsr2.2015.01.003
Mendes C. R. B., Tavanoa V. M., Dottob T. S., Kerr R., de Souzaa M. S., Garcia C. A. E., et al. (2018). New insights on the dominance of cryptophytes in Antarctic coastal waters: A case study in Gerlache Strait. Deep–Sea Res. II 149, 161–170. doi: 10.1016/j.dsr2.2017.02.010
Mitchell B. G. (1990). Algorithms for determining the absorption coefficient for aquatic particulates using the quantitative filter technique, in: SPIE. Ocean Opt. X, Orlando. United States 1 September 1302, 137–148.
Moisan J. R., Moisan T. A. H., Linkswiler M. A. (2011). An inverse modeling approach to estimating phytoplankton pigment concentrations from phytoplankton absorption spectra. J. Geophys. Res. 116, C09018. doi: 10.1029/2010JC006786
Moore J. K., Abbott M. R. (2000). Phytoplankton chlorophyll distributions and primary production in the Southern Ocean. J. Geophys. Res. 105, 28709–28722. doi: 10.1029/1999JC000043
Morel A., Bricaud A. (1981). Theoretical results concerning light absorption in a discrete medium, and application to specific absorption of phytoplankton. Deep-Sea Res. I 28A, 1375–1393. doi: 10.1016/0198-0149(81)90039-X
Naik P., D’Sa E. J., Gomes H. R., Goes J. I., Mouw C. B. (2013). Light absorption properties of southeastern Bering Sea waters: analysis, parameterization and implications for remote sensing. Remote Sens. Environ. 134, 120–134. doi: 10.1016/j.rse.2013.03.004
Neori A., Holm-Hansen O. (1982). Effect of temperature on rate of photosynthesis in Antarctic phytoplankton. Polar Biol. 1, 33–38. doi: 10.1007/BF00568752
Palmisano A. C., SooHoo J. B., SooHoo S. L., Kottmeier S. T., Craft L. L., Sullivan C. W. (1986). Photoadaptation in Phaeocystispouchetii advected beneath annual sea ice in McMurdo Sound, Antartica. J. Plankton Res. 8, 891–906. doi: 10.1093/plankt/8.5.891
Pan B. J., Vernet M., Reynolds R. A., Mitchell B. G. (2019). The optical and biological properties of glacial meltwater in an Antarctic fjord. PloS One 14, 211107. doi: 10.1371/journal.pone.0211107
Pandi S. R., Tripathy S. C., Shaju S. S., Anilkumar N. (2023a). Cross frontal variability in bio-optical characteristics in the Indian sector of the Southern Ocean during an austral summer. Reg. Stud. Mar. Sci. 61, 102892. doi: 10.1016/j.rsma.2023.102892
Pandi S. R., Tripathy S. C., Shaju S. S., Minu P., Kerkar A. U., Bajish C. C., et al. (2023b). Interannual variability of surface bio-optical characteristics in the frontal zones of the Indian sector of the Southern Ocean during austral summer. Polar Sci. 36, 100944. doi: 10.1016/j.polar.2023.100944
Parslow J. S., Boyd P. W., Rintoul S. R., Griffiths F. B. (2001). A persistent susbsurface chlorophyll maximum in the Interpolar Frontal Zone south of Australia: Seasonal progression and implications for phytoplankton-light-nutrient interactions. J. Geophys. Res. 106, C12, 31543–31557. doi: 10.1029/2000JC000322
Pillai H. U. K., Anilkumar N., Achuthankutty C. T., Mendes C. R., Sabu P., Jayalakshmi K. V., et al. (2018). Planktonic food web structure at SSTF and PF in the Indian sector of the Southern Ocean during austral summer 2011. Polar Res. 37:1, 1495545. doi: 10.1080/17518369.2018.1495545
Platt T., Sathyendranath S. (19884873). Oceanic primary production: estimation by remote sensing at local and regional scales. Science 241, 1613–1620. doi: 10.1126/science.241.4873.1613
Pond S., Pickard G. L. (1983). Introductory dynamical oceanography. 2nd Edition, Pergamon international library of science, technology, engineering, and social studies. Elsevier Science., 5–9, 329.
Prasanna K., Ghosh P., Bhattacharya S. K., Mohan K., Anilkumar N. (2016). Isotopic disequilibrium in Globigerina bulloides and carbon isotope response to productivity increase in Southern Ocean. Sci. Rep. 6, 21533. doi: 10.1038/srep21533
Redfield A. C., Ketchum B. H., Richards A., Hill M. M. (1963). “The influence of organisms on the composition of sea water,” in The sea, vol. 2. (Interscience, New York), 26–77.
Reynolds C. S., Reynolds J. B. (1985). The atypical seasonality of phytoplankton in Crose Mere 1972: an independent test of the hypothesis that variability in the physical environment regulates community dynamics and structure. Brit. Phycol. J. 20, 227–242.
Robinson C. M., Cherukuru N., Hardman-Mountford N. J., Everett J. D., McLaughlin M. J., Davies K. P., et al. (2017). Phytoplankton absorption predicts patterns in primary productivity in Australian coastal shelf waters. Estuar. Coast. Shelf Sci. 192, 1–6. doi: 10.1016/j.ecss.2017.04.012
Sabu P., Anilkumar N., George J. V., Chacko R., Tripathy S. C., Achuthankutty C. T. (2014). The influence of air-sea-ice interaction on the anomalous phytoplankton bloom in the Indian Ocean sector of Antarctic Zone of the Southern Ocean during austral summer 2011. Pol. Sci. 8, 370–384. doi: 10.1016/j.polar.2014.08.001
Sabu P., Subeesh. M. P., Sivakrishnan K. K., Anilkumar N. (2021). Causes and impacts of anomalous warming in the Prydz Bay, East Antarctica during austral summer 2016-17. Polar Sci. 30, 100660. doi: 10.1016/j.polar.2021.100660
Sangrà P., García-Muñoz C., García C. M., Marrero-Díaz A., Sobrino C., Mouriño-Carballido B., et al. (2014). Coupling between upper ocean layer variability and size-fractionated phytoplankton in a non-nutrient-limited environment. Mar. Ecol. Prog. Ser. 499, 35–46. doi: 10.3354/meps10668
Sathyendranath. S., Lazzara J. L., Prieur. L. (1987). Variations in the spectral values of specific absorption of phytoplankton. Limnol. Oceanogr. 32, 403–415. doi: 10.4319/lo.1987.32.2.0403
Smith N. R., Zhaoqian D., Kerry K. R., Wright S. (1984). Water masses and circulation in the region of Prydz Bay, Antarctica. Deep-Sea Res. I 31, 1121–1147. doi: 10.1016/0198-0149(84)90016-5
Stuart V., Sathyendranath S., Platt T., Maass H., Irwin B. D. (1998). Pigments and species composition of natural phytoplankton populations: Effect on the absorption spectra. J. Plankton Res. 20, 187–217. doi: 10.1093/plankt/20.2.187
Sun D., Pan T., Wang S., Hu C. (2021). Linking phytoplankton absorption to community composition in Chinese marginal seas. Prog. Oceanogr. 192, 102517. doi: 10.1016/j.pocean.2021.102517
Tang D. L., Kawamura H., Lee M. A., Van-Dien T. (2003). Seasonal and spatial distribution of chlorophyll-a concentrations and water conditions in the Gulf of Tonkin, South China Sea. Remote Sens. Environ. 85, 475–483. doi: 10.1016/S0034-4257(03)00049-X
Tilzer M. M., Dubinsky Z. (1987). Effects of temperature and day length on the mass balance of Antarctic phytoplankton. Polar Biol. 7, 35–42. doi: 10.1007/BF00286822
Tripathy S. C., Patra S., Vishnu Vardhan K., Sarkar A., Mishra R. K., Anilkumar N. (2018). Nitrogen uptake by phytoplankton in surface waters of the Indian sector of Southern Ocean during austral summer. Front. Earth Sc. 12, 52–62. doi: 10.1007/s11707-017-0649-9
Tripathy S. C., Pavithran S., Sabu S., Naik R. K., Noronha S. B., Bhaskar P. V., et al. (2014). Is phytoplankton productivity in the Indian Ocean sector of Southern Ocean affected by pigment packaging effect? Curr. Sci. 107, 1019–1026.
Tripathy S. C., Pavithran S., Sabu P., Pillai H. U. K., Dessai D. R. G., Anilkumar N. (2015). Deep chlorophyll maximum and primary productivity in Indian Ocean sector of the Southern Ocean: Case study in the Subtropical and Polar Front during austral summer 2011. Deep-Sea Res. II 118, 240–249. doi: 10.1016/j.dsr2.2015.01.004
Tripathy S. C., Sabu P., Patra S., Naik R. K., Sarkar A., Venkataramana V., et al. (2020). Biophysical control on variability in phytoplankton production and composition in the south-western tropical Indian ocean during monsoon 2014. Front. Mar. Sci. 7. doi: 10.3389/fmars.2020.00515
Tripathy S. C., Varunan T., Shanmugam P., Kerkar A. U., Bhaskar J. T., Kurian S., et al. (2021). Summer variability in bio−optical properties and phytoplankton pigment signatures in two adjacent high Arctic fjords, Svalbard. Int. J. Environ. Sci. Technol. 20, 239–258. doi: 10.1007/s13762-021-03767-4
Tsunogai S., Watanabe Y. (1983). Role of dissolved silicate in the occurrence of phytoplankton bloom. J. Oceanogr. Soc Japan 39, 231–239. doi: 10.1007/BF02070393
Venables H., Moore C. M. (2010). Phytoplankton and light limitation in the Southern Ocean: Learning from highnutrient, high-chlorophyll areas. J. Geophys. Res. 115, C02015. doi: 10.1029/2009JC005361
Venkataramana V., Kerkar A. U., Mishra R. K., Sabu P., Anilkumar N. (2022). Hydrodynamics and zooplankton assemblages in Prydz Bay, East Antarctica, during the austral summer of 2017. Reg. Stud. Mar. Sci. 52, 102341. doi: 10.1016/j.rsma.2022.102341
Vidussi F., Claustre H., Manca B., Luchetta A., Marty J. C. (2001). Phytoplankton pigment distribution in relation to upper thermocline circulation in the eastern Mediterranean Sea during winter. J. Geophys. Res. 106, 19939–19956. doi: 10.1029/1999JC000308
Vives C. R., Schallenberg C., Strutton P. G., Boyd P. W. (2023). Biogeochemical-Argo floats show that chlorophyll increases before carbon in the high-latitude Southern Ocean spring bloom. Limnol Oceanogr. Lett. 9, 172–182. doi: 10.1002/lol2.10322
Wallace M. I., Meredith M. P., Brandon M. A., Sherwin T. J., Dale A., Clarke A. (2008). On the characteristics of internal tides and coastal upwelling behaviour in Marguerite Bay, west Antarctic Peninsula. Deep-Sea Res. II 55, 2023–2040. doi: 10.1016/j.dsr2.2008.04.033
Welschmeyer N. A. (1994). Fluorometric analysis of chlorophyll a in the presence of chlorophyll b and pheopigments. Limnol. Oceanogr. 39, 1985–1992. doi: 10.4319/lo.1994.39.8.1985
Westwood K. J., Griffiths F. B., Webb J. P., Wright S. W. (2011). Primary production in the Sub-Antarctic and Polar Frontal Zones south of Tasmania. Australia; SAZ-Sense survey 2007. Deep-Sea Res. II 58, 2162–2178. doi: 10.1016/j.dsr2.2011.05.017
Wu Y., Tang C. C. L., Sathyendranath S., Platt T. (2007). The impact of bio-optical heating on the properties of the upper ocean: A sensitivity study using a 3-D circulation, model for the Labrador Sea. Deep-Sea Res. II 54, 2630–2642. doi: 10.1016/j.dsr2.2007.08.019
Keywords: bio-optics, chlorophyll, light-absorption, phytoplankton, productivity, Prydz Bay, coastal Antarctica
Citation: Tripathy SC, Kerkar AU, Sabu P, Padhi SK, Pandi SR, Sarkar A, Parli BV and Mohan R (2024) Short-term time-series observations of phytoplankton light-absorption and productivity in Prydz Bay, coastal Antarctica. Front. Mar. Sci. 11:1420179. doi: 10.3389/fmars.2024.1420179
Received: 19 April 2024; Accepted: 26 June 2024;
Published: 15 July 2024.
Edited by:
Christine Johanna Band-Schmidt, Centro Interdisciplinario de Ciencias Marinas (IPN), MexicoReviewed by:
Jose Luis Iriarte, Austral University of Chile, ChileCopyright © 2024 Tripathy, Kerkar, Sabu, Padhi, Pandi, Sarkar, Parli and Mohan. This is an open-access article distributed under the terms of the Creative Commons Attribution License (CC BY). The use, distribution or reproduction in other forums is permitted, provided the original author(s) and the copyright owner(s) are credited and that the original publication in this journal is cited, in accordance with accepted academic practice. No use, distribution or reproduction is permitted which does not comply with these terms.
*Correspondence: Sarat C. Tripathy, c2FyYXRAbmNwb3IucmVzLmlu
Disclaimer: All claims expressed in this article are solely those of the authors and do not necessarily represent those of their affiliated organizations, or those of the publisher, the editors and the reviewers. Any product that may be evaluated in this article or claim that may be made by its manufacturer is not guaranteed or endorsed by the publisher.
Research integrity at Frontiers
Learn more about the work of our research integrity team to safeguard the quality of each article we publish.