 Zhi-Ping Mei
 Diane Lavoie
 Nicolas Lambert
 Michel Starr
 Joël Chassé
 William Perrie
 Zhenxia Long
- 1Bedford Institute of Oceanography, Fisheries and Oceans Canada, Dartmouth, NS, Canada
- 2Maurice-Lamontagne Institute, Fisheries and Oceans Canada, Mont-Joli, QC, Canada
- 3Gulf Fisheries Centre, Fisheries and Oceans Canada, Moncton, NB, Canada
- 4Canadian Centre for Climate Modelling and Analysis, Environment and Climate Change Canada, Victoria, BC, Canada
The Gulf of St. Lawrence (GSL), along with the St. Lawrence Estuary, is the largest estuarine system in North America. It is a biologically productive sea and an important fishing ground in Canada. The objectives of this study are to determine how climate changes will affect primary production in the GSL and on the eastern Scotian Shelf, and to determine the drivers of the changes. We use a regional ocean model forced with downscaled output of the Max-Planck Institute Earth System Model to study the changes in net primary production under the climate change scenario of Representative Concentration Pathway 8.5 (RCP8.5). Results reveal a projected 13.4% decrease in annual primary production across the GSL system over the next 70 years. This decline primarily stems from reduced nutrient concentrations in the upper layer, despite the increase in nutrients supplied by rivers. Enhanced freshwater influx and ocean surface warming contribute to heightened stratification, that in turn reduce the vertical nutrient fluxes from deeper layers. This mechanism affects the upwelling of nutrient-rich water at the head of the Laurentian Channel in the Lower St. Lawrence Estuary, leading to a 22% reduction in the vertical nitrate flux in the future. Additionally, nutrient concentrations in the water masses entering the GSL at the Strait of Belle Isle and at Cabot Strait are also reduced. Due to declining sea-ice concentration, the phytoplankton bloom is expected to occur between 9 and 23 days earlier under a warmer climate, and last for up to 24 days longer, depending on the GSL subregions, compared to the historical period (2001-2020). Biological productivity at higher trophic levels, and thus fisheries productivity, could be negatively impacted under the RCP8.5 climate change scenario.
1 Introduction
Carbon dioxide (CO2) concentration in the atmosphere increased from ~280 ppm in the preindustrial era (1850-1900) to 417.2 ppm in 2021 (Friedlingstein et al., 2022). Approximately 26.6% of these CO2 emissions have been absorbed by the ocean (Friedlingstein et al., 2022). Nevertheless, the higher atmospheric CO2 concentrations have contributed to both air and ocean warming. Since the pre-industrial period, the global surface air temperature has increased by about 1.09°C (Allen et al., 2018; Fox-Kemper et al., 2021), and the ocean surface temperature has risen by 0.88°C (Fox-Kemper et al., 2021). This ocean surface warming, combined with freshening at high latitudes, led to a 4.9% increase in the strength of the stratification of the upper ocean (0-200 m) between 1971 and 2018 (Fox-Kemper et al., 2021).
The response of net primary production (netPP) to warming differs according to the ocean region, depending on changes in dominant physical forcings, such as stratification of the water column, water temperature, circulation, and presence of sea ice (e.g., Fu et al., 2016; Holt et al., 2016; Kwiatkowski et al., 2017, 2020; Raven and Beardall, 2021). NetPP ultimately limits the productivity of marine ecosystems and fisheries economic performance (Stock et al., 2017; Marshak and Link, 2021). Therefore, changes in biological production at lower trophic levels are expected to have cascading effects on marine organisms occupying higher trophic levels, yielding either beneficial or detrimental impacts for fisheries (Lotze et al., 2019; Bryndum-Buchholz et al., 2020). Alterations in netPP are often accompanied by changes in the size structures and functional groups of the phytoplankton community (Marañón et al., 2012), which in turn favor zooplankton of different size classes. These shifts in size categories, prompted by climate change, exert far-reaching effects on the food web structure and dynamics of marine ecosystems. The sinking of organic matter resulting from primary production, such as cells or fecal pellets, drives the removal of atmospheric CO2 by the ocean (Takahashi et al., 2002; Oschlies and Kähler, 2004; Henson et al., 2022), while its subsequent remineralization contributes to the deoxygenation and acidification of subsurface and deep waters (Rivkin et al., 1996; Gilbert et al., 2005).
The Gulf of St. Lawrence (GSL), located in eastern Canada, is one of the largest semi-enclosed estuarine systems in the world. The water column is typically separated into three layers: surface (0-50 m), cold intermediate layer (50-150 m), and warm Atlantic layer (150-300 m) (e.g. Koutitonsky and Budgen, 1991; Drinkwater and Gilbert, 2004). The GSL receives Labrador Current water through the Strait of Belle Isle (SBI in Figure 1). Labrador Current water also enters at depth via Cabot Strait after mixing with Gulf Stream water around the tail of the Grand Banks (Han et al., 1999). The deep water masses composed of variable proportions of Gulf Stream and Labrador Current water move up the deep Laurentian Channel and ultimately upwell to the surface at its head (head of the Laurentian Channel, HLC, pink square in Figure 1) in the Lower St. Lawrence Estuary (LSLE) (Koutitonsky and Budgen, 1991). The GSL receives large amounts of freshwater, particularly from the St. Lawrence River (about 12000 m3 s-1). This freshwater mixes with nutrient-rich subsurface water from the cold intermediate layer or deeper upwelled at the HLC under tidal action (Saucier et al., 2003; Cyr et al., 2015). The upwelling and mixing of the deep nutrient-rich water at HLC plays a pivotal role in fueling large amounts of netPP in the GSL and this process is known as the nutrient pump (Steven, 1974; Coote and Yeats, 1979; Savenkoff et al., 2001; Cyr et al., 2015; Jutras et al., 2020a). Large amount of colored dissolved organic matter (CDOM) and suspended materials are also carried with river water into the LSLE, reducing the availability of light for phytoplankton growth within the LSLE and downstream of the estuary (Nieke et al., 1997; Le Fouest et al., 2010; Mei et al., 2010; Xie et al., 2012; Araujo and Belanger, 2022). Surface waters exit the GSL mainly through the southern side of Cabot Strait, flowing towards the Scotian Shelf and the northwest Atlantic (Petrie and Drinkwater, 1993; Petrie and Yeats, 2000; Saucier et al., 2003; Dever et al., 2016). Therefore, the GSL is biogeochemically connected to the Northwest Atlantic, through the estuarine circulation of the GSL.
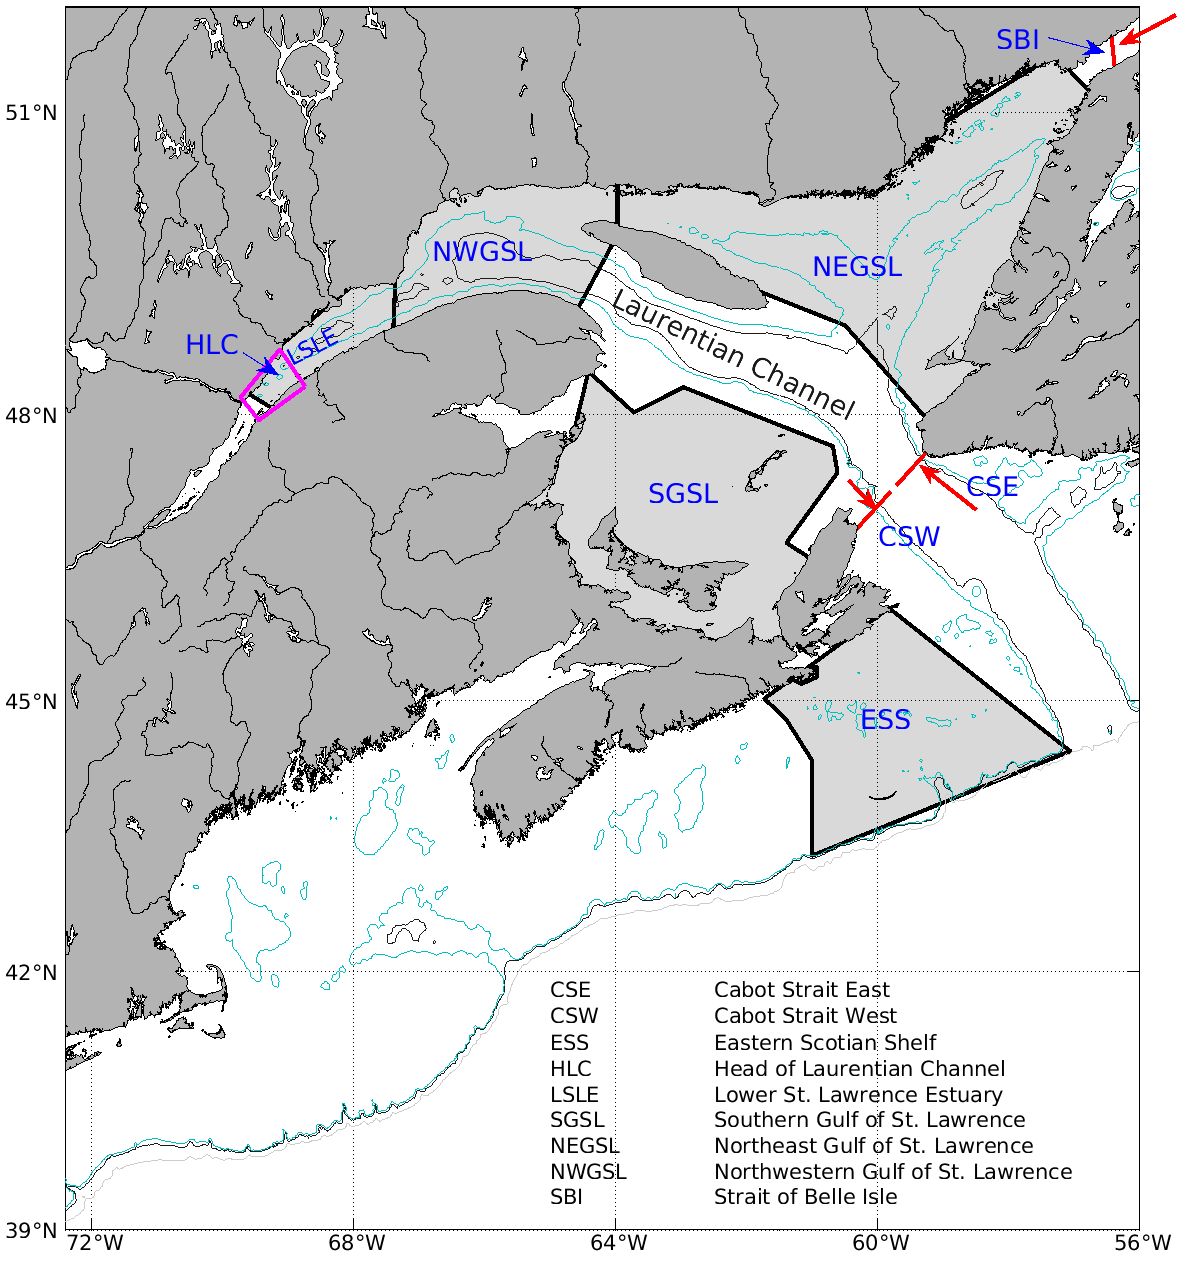
Figure 1. The map of the model domain. Pink polygon is the area of upwelling at the head of the Laurentian Channel (HLC). Areas of Lower St Lawrence Estuary (LSLE), northwest Gulf of St. Lawrence (NWGSL), northeast Gulf of St. Lawrence (NEGSL), southern Gulf of St. Lawrence (SGSL), and Eastern Scotian Shelf (ESS) are the focal areas of comparisons, in the changes of atmospheric, physical, chemical and biological variables. The red lines are transects (Strait of Belle Isle – SBI, Eastern Cabot Strait – CSE, and western Cabot Strait – CSW), where the water and nutrient fluxes are calculated. The arrows indicate the prevalent flow direction across the transects. The depth contours of 200 m, 300 m and 1000 m are shown as cyan, black, and gray lines, respectively.
The GSL and Scotian Shelf are important fishing ground in Canada. The main fisheries in the GSL include pelagic and ground fishes, crustaceans, such as lobsters and crabs, and mollusks, that are at various positions of the higher trophic levels (DFO, 1996). In addition to abiotic environment, availability, and phenology of prey organisms are critical factors for fisheries recruitment and landing (Burbank et al., 2023). Fisheries catch in the GSL is comparable to total combined catch from Labrador, Grand Banks, Scotian Shelf, and Georges Bank (Chadwick and Sinclair, 1991).
The climate change effects on the global ocean, such as warming, freshening, increased stratification, decrease in sea ice, and acidification, are also at play in the GSL and Scotian Shelf (Lavoie et al., 2020) and are expected to affect the distribution and amounts of netPP. The position and strength of both the Gulf Stream and Labrador Current are subject to change, depending on atmospheric conditions (Saba et al., 2016; Jutras et al., 2023). In recent decades, warming in the northwest Atlantic has been greater than the average global ocean temperature increases, because of reductions in the Atlantic meridional overturning circulation, accompanied by northward shift in the position of the Gulf Stream (Smeed et al., 2018; Alexander et al., 2020; Seidov et al., 2021). The northward shift of the Gulf Stream, has led to an increased influx of Gulf Stream water into the deep Laurentian Channel resulting in warmer and saltier deep waters in the channel (Brickman et al., 2018; Galbraith et al., 2021). Due to the different nutrient, salinity and temperature properties between Gulf Stream water and Labrador Current water (Townsend et al., 2006, 2010), the supply of nutrients, salt and heat into the deep GSL through the Laurentian Channel changes with the variable contributions from these water masses. In addition to the changing proportions of the two water masses at depth, the water mass properties of the source water change as well. The Labrador Current water salinity is decreasing due to freshening in the Arctic Ocean (Zhang et al., 2021).
Phytoplankton biomasses, measured as chlorophyll (Chl) a concentration, and their variability in the GSL have undergone extensive monitoring through both in situ sampling and remote sensing methods (e.g., Blais et al., 2021; Laliberté and Larouche, 2023). In contrast to the wealth of data on phytoplankton biomass, netPP studies have been limited to specific productive areas such as the LSLE and southern GSL (SGSL) and to the productive season within the GSL and Scotian Shelf. Coupled biogeochemical models have been applied to understand how the physical processes, such as river runoff, light and temperature in the water column, and circulation, drive the seasonal and spatial dynamics of netPP in the GSL at the annual scale (Zakardjian et al., 2000; Le Fouest et al., 2005; Lavoie et al., 2008; Le Fouest et al., 2010; Mei et al., 2010). Future changes in netPP in the northwest Atlantic were investigated using the Coupled Model Intercomparison Project Phase 5 (CMIP5) Earth System Models output (Lavoie et al., 2013, 2019). These studies were inconclusive with respect to future changes in netPP due to the divergence in the projections provided by the Earth System Models. However, they showed some robustness in predicting future declines in nitrate concentrations near the mouth of the GSL (Lavoie et al., 2019).
To improve the future projections of netPP and other biogeochemical variables at the scale of the GSL under climate change, Long et al. (2015) and Lavoie et al. (2020) developed a regional climate model covering both the GSL and Scotian Shelf (Figure 1). This high-resolution regional model was forced with the downscaled output of three CMIP5 Earth System Models: the Canadian Earth System Model (CanESM2), the Hadley Centre Global Environment Model (HadGEM2-ES), and the Max-Planck Institut für Meterologie Earth System Model with low resolution (MPI-ESM-LR). In the present study, we focus on the results of an updated version of the MPI-ESM-LR forced simulation to determine the factors driving the changes in netPP within the GSL and on the eastern Scotian Shelf (ESS). In ranking analyses of CMIP5 Earth System models, no single model consistently outperforms others across all tracers in the northwest Atlantic (e.g., Lavoie et al., 2013, 2019; Vissio et al., 2020; Laurent et al., 2021). We opted for MPI-ESM-LR due to its higher resolution in the northwest Atlantic and its effective representation of salinity, temperature and nitrate concentration at the surface in our region of interest. In the deep layers, average conditions and trends are comparable to other model outputs as shown in Lavoie et al. (2019). The objective of this study is to quantify the netPP changes in relation to changes in ice-ocean physics and estuarine circulation in the GSL and eastern Scotian Shelf under climate change.
2 Materials and methods
2.1 Description of the regional downscaling system
The GSBM model (Lavoie et al., 2021) is coupled with the regional circulation model CANOPA (Brickman and Drozdowski, 2012), and the coupled numerical model is forced with downscaled atmospheric conditions (Guo et al., 2013) from the MPI-ESM-LR Earth System Model (Jungclaus et al., 2006; Giorgetta et al., 2013), under the representative concentration pathway 8.5 (RCP8.5) scenario (van Vuuren et al., 2011). Future ocean boundary conditions are obtained using the delta method and the output of MPI-ESM-LR. The latter consists of monthly means for the 3D physical variables and 2D (surface) biogeochemical variables, and annual means for the 3D output of the biogeochemical variables. Some transformations were made to the data to obtain a seasonal cycle for the biogeochemical variables in the mixed layer at the open boundaries (see Lavoie et al., 2020 for a complete description of the method).
The various components of CANOPA are described in detail in Brickman and Drozdowski (2012) and Lavoie et al. (2016), while the biogeochemical components of the model, GSBM, are described in Lavoie et al. (2021). The GSBM module includes phytoplankton of two size fractions; large (representing diatoms), and small (representing flagellates), along with two zooplankton groups; microzooplankton and mesozooplankton. Microzooplankton feed on flagellates and detritus, while mesozooplankton feed on large-sized phytoplankton and microzooplankton (Lavoie et al., 2021). The model is nitrogen-based, with nitrate (NO3), and ammonium (NH4) as nutrient sources of phytoplankton. Silicate and phosphate are not included in the model, as nitrogen is the limiting nutrient for phytoplankton growth in our region (Coote and Yeats, 1979; Jutras et al., 2020a). Particulate organic nitrogen, originating from zooplankton defecation, and plankton mortality is fragmented into dissolved organic nitrogen (DON), and the latter is remineralized to NH4, at a constant rate (Lavoie et al., 2021). Primary production of diatoms, flagellates, and netPP are converted to carbon unit of gram (g) from nitrogen production using Redfield C:N molar ratio (6.6×12). Chl biomass of phytoplankton is converted from N biomass at 1.5 mg Chl (mmol N)-1, following Lavoie et al. (2021).
The runoff seasonal cycle was also improved. The monthly average runoff of 78 rivers was obtained with a simple hydrological model (Lambert et al., 2013) forced with solid and liquid precipitation and evaporation, based on the downscaled MPI-ESM-LR atmospheric conditions (Long et al., 2015; Lavoie et al., 2020). The resulting runoff exhibited a delayed spring freshet compared to the observed pattern, which may influence the timing of the phytoplankton bloom in some regions. To obtain a more realistic timing of the spring freshet, we first calculated the monthly anomaly for the entire time series of the MPI-ESM-LR simulation by subtracting monthly values from the mean values averaged over 1971-2000. This anomaly was then added to the monthly climatology obtained from simulating the runoff using precipitation and evaporation from the NCEP atmospheric reanalysis (NCEP/DOE Reanalysis II data, https://psl.noaa.gov. Kalnay et al., 1996), as described in detail by Galbraith et al. (2021). The resulting river runoff is thus the sum of the monthly historical climatology and the monthly anomaly of the MPI-ESM-LR simulation.
Rivers also carry nitrogenous nutrients, including NO3, NH4, and DON into the system. Nitrogen concentrations in rivers do not change over years in the model setup (see Lavoie et al., 2020, 2021). Projected changes in the riverine flux of the different chemical constituents are thus solely caused by the changes in the flux of freshwater runoff over years. This simplification stems from the difficulty of predicting the impact of climate change on nitrogen concentrations in rivers, since future changes in land use are uncertain and nitrogen concentration is influenced by multiple biogeochemical processes in soils, groundwater, rivers, wetlands and lakes (Seitzinger and Harrison, 2008).
The simulation was run from 1970 to 2099 and the output includes biweekly averaged 3-D (x, y, z) of the physical and biogeochemical state variables, as well as 2-D (x and y) daily output of the phytoplankton concentrations integrated over the top 7 layers (0-50 m) to calculate the bloom metrics. The 0-50 m layer generally encompasses the euphotic layer whose depth varies between 10 and 45 m (Lavoie et al., 2008). For time series analysis, only the last 100 years of output (1999-2099) were used, in order to avoid the influence of initial conditions.
2.2 Changes in stratification
Stratification of the water column in the upper 50 m is calculated as the difference between densities at 50 m and the surface layer. The top 50 m encompasses the mixed layer from spring to fall in most regions [observations show mixed layer depths between <10 m and 40 m across the GSL between May and Novembre (Doyon and Ingram, 2000) while the model simulates annual mean mixed layer depths between 5 and 30 m in historical years (Supplementary Figure S6)]. The density is calculated as a function of salinity, temperature and pressure for each time point according to the Thermodynamic Equation of Seawater – 2010 (TEOS-10, www.TEOS-10.org). In order to calculate the change in stratification from historical to future years, we first calculate the stratification for each time step (biweekly) before averaging over each period, considering that density depends nonlinearly on salinity, temperature and pressure.
In order to calculate the contribution of salinity and temperature changes to the stratification change between historical and future years, densities at the surface and at 50 m are calculated after salinity and temperature were averaged for the historical and future years, respectively. Then the changes in density due to salinity () and temperature () are calculated as:
where and are the density changes due to changes in mean temperature and mean salinity, respectively, and are the mean temperature, and and , the mean salinities, in historical and future years, respectively. Changes in stratification due to salinity and temperature are calculated based on and (Capotondi et al., 2012).
2.3 Timing of the phytoplankton bloom
To better assess the Chl a evolution throughout the year, a bloom period was calculated by analysing the daily values of diatom and flagellate Chl a integrated over the upper 50 m of the water column (total Chl a). The bloom start date was defined as the day of the year when total Chl a is higher than 50% of the difference between the winter minimum and the spring maximum. This threshold of 50% was chosen instead of 20% as in Zhai et al. (2011) because false blooming dates were generated in some areas with low Chl a concentration when using the 20% threshold. The spring bloom peak is taken as the date with the maximum total Chl a integrated over the water column. The termination of the bloom is defined as the time when Chl a declines from the peak of the bloom to 50% of the difference between spring maximum and winter minimum, after the bloom. The duration of the bloom was calculated as the number of days between the start and end dates of the bloom.
2.4 Statistical analysis
The future changes are presented either as trends over years 1999 to 2099 for specific regions or as the difference between annual mean concentrations calculated over two twenty-year periods, 2001-2020 to represent the “historical” period, and 2071-2090 to represent the future period. The standard deviation was also calculated over the historical period and a change in the future is considered significant only when it is greater than twice that standard deviation. The trend of the time series is calculated as the slope of the linear least square regression of the annual mean of a variable against year. The trend analysis was done for five different regions: HLC, northwest GSL (NWGSL), northeast GSL (NEGSL), SGSL and ESS, and for the river runoff, and at two transects, SBI and CSE, depicted in Figure 1.
3 Results
Mean atmospheric forcing and simulated output for the physical and biogeochemical conditions were compared between the two 20-year periods: historical (2001-2020) and future (2071-2090). Since the focus of this paper is on future changes in netPP a greater attention is given to the changes occurring in the upper 50 m of the water column, where most of the primary production occurs.
3.1 Atmospheric forcing, sea ice, and water column physics
We first look at the downscaled atmospheric conditions derived from Guo et al. (2013), including precipitation, air temperature, shortwave radiations, and wind speed. Precipitation includes both snow and rain. Over the historical period, the annual mean precipitation oscillated around 900 mm y-1 in the GSL with higher levels simulated in the NEGSL and in the ESS (Figure 2A; Supplementary Table S2). Projections indicate an increase in precipitation, however given the large variability over the historical period, the projected increase in precipitation is not statistically significant.
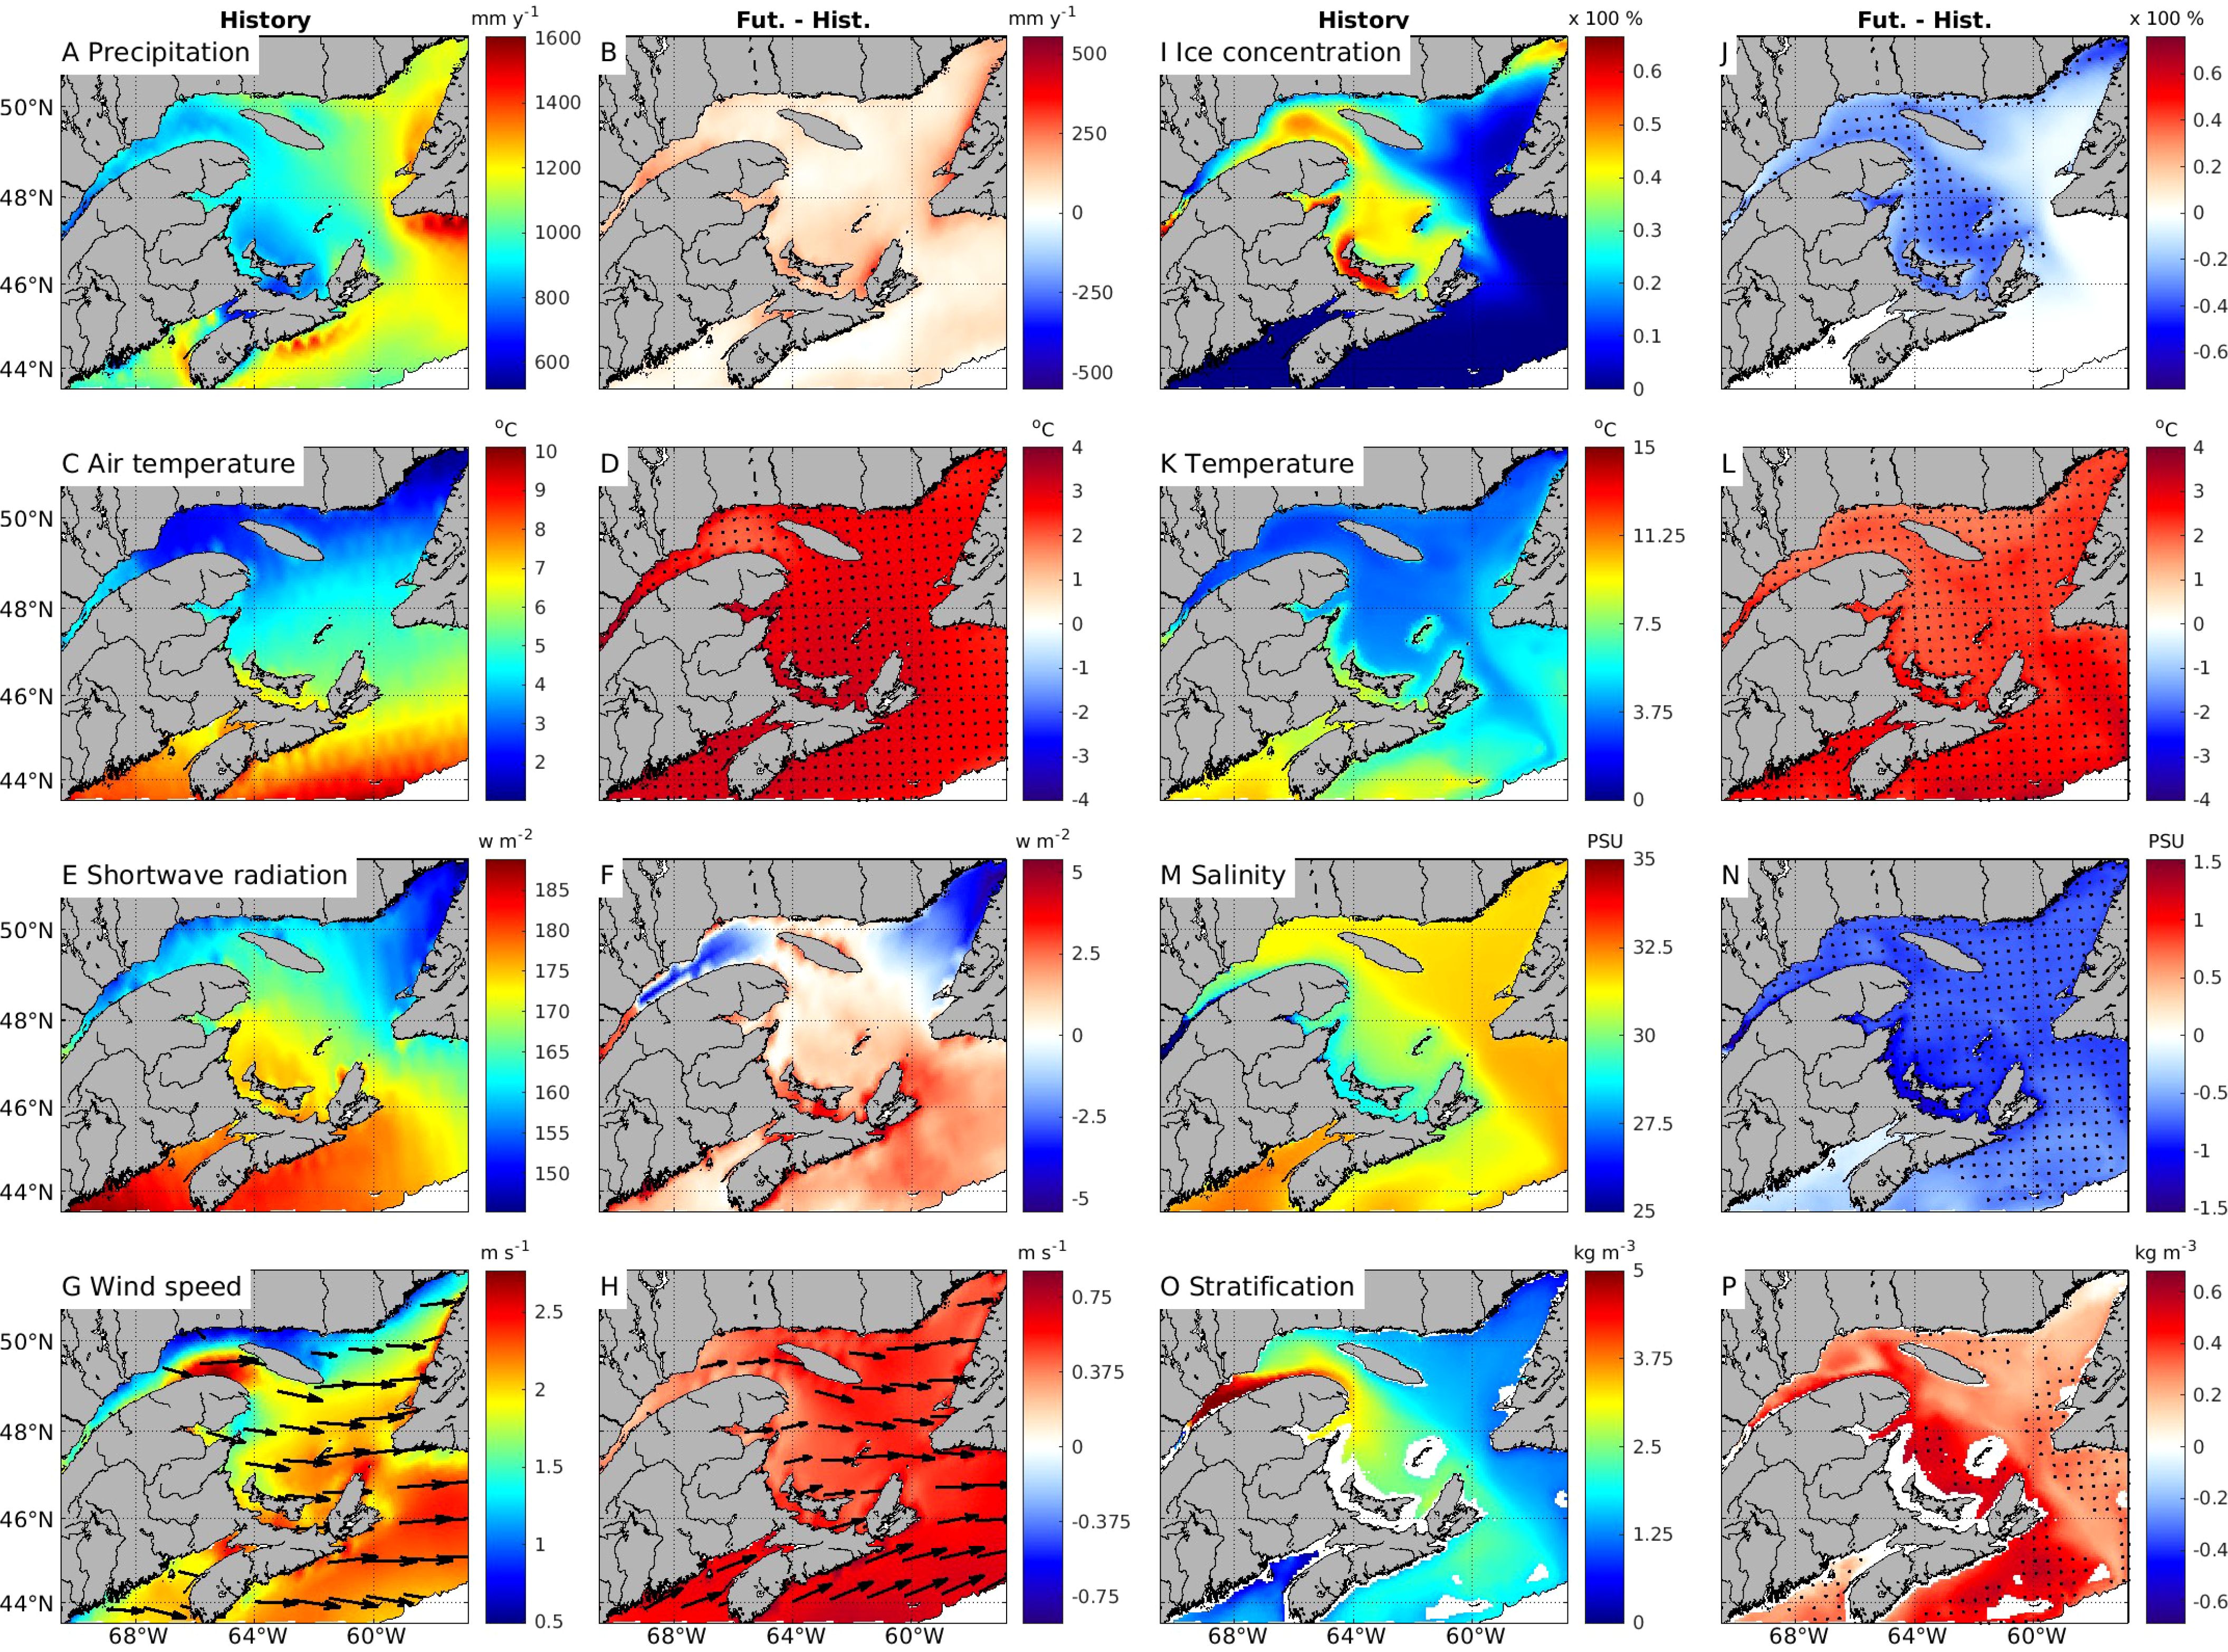
Figure 2. Mean annual atmospheric forcing over the 2001-2020 period (the ‘Historical’ period), and the difference between the mean of the 2071-2090 period (Future) and the mean of the 2001-2020 period (Fut. - Hist.) for precipitation (A, B), air temperature at 10 m above sea surface (C, D), surface shortwave radiation (E, F), wind speed (G, H) and sea-ice concentration between January and April (I, J), and similarly, mean 0-50 m water temperature (K, L), mean 0-50 m salinity (M, N), and stratification of the water column in the upper 50 m (O, P). Dots in the figures indicate the cells where future changes are significant from the historical period. The stratification, salinity, and water temperature are not calculated for areas shallower than 50 m, shown as blank.
Surface air temperature displays a general latitudinal gradient, with lower temperatures at higher latitudes (Figure 2C). In the historical period, annual mean air temperature values in the LSLE (3.6 ± 0.5°C), NWGSL (2.3 ± 0.3°C), and NEGSL (3.0 ± 0.4°C) are colder than in the SGSL (5.1 ± 0.4°C) and ESS areas (7.7 ± 0.6°C). Mean air temperature is expected to increase significantly and relatively uniformly (by about 2.4-3.1°C) over the domain in future years (Figure 2D).
Annual mean surface shortwave radiations over the historical period are slightly higher in SGSL and ESS than in LSLE and NEGSL (Figure 2E). The future trends in shortwave radiations vary regionally, with a slight decrease in the LSLE, NWGSL and NEGSL, and a slight increase in the SGSL and ESS. However, these changes, representing less than 2%, are not significant (Figure 2F).
The prevalent annual mean wind direction is westerly, with slightly lower wind speeds in the LSLE, NWGSL, and NEGSL than in the SGSL and ESS during the historical period (Figure 2G). In future years, mean wind speed is expected to increase throughout the model domain. Overall, the estimated wind speed increased by 24 to 32% (Figure 2H; Supplementary Table S2) and a southerly component appears over the Scotian Shelf. However, these changes in wind speed and direction are not significant (Figure 2H).
During the historical period, some areas of the GSL are ice-covered from January through April. Mean sea-ice concentrations from January to April are higher in the SGSL (39 ± 8.3%), followed by the NWGSL (37 ± 9%), and the LSLE (25 ± 8%). The sea-ice concentration is lower in the NEGSL (17 ± 7%) due to warmer water entering through Cabot Strait (Figure 2I; Supplementary Figure S7A). Sea-ice concentration is expected to decrease significantly in the future. Sea ice almost disappears completely in areas with relatively low concentrations during historical years, such as the NEGSL where sea-ice concentrations decrease by 93.6%. Significant reductions are simulated in southern portions of the LSLE (75%) and NWGSL (71%), and in the SGSL (78%) (Figure 2J).
Annual mean temperatures of the upper water column (0-50 m) are cold in the LSLE (3.21 ± 0.48°C), NWGSL (3.21 ± 0.32°C), and NEGSL (3.85 ± 0.32°C). Warmer annual mean temperature are simulated for the SGSL and ESS, at 5.22 ± 0.30°C, and 6.28 ± 0.56°C, respectively (Figure 2K). The temperature distributions simulated for historical years are consistent with the validated hindcast version of the regional model (Lavoie et al., 2016) and observations (Galbraith et al., 2012; 2021). In future years, a significant increase in the mean 0-50 m temperature of about 2-3°C is anticipated across the whole domain (Figure 2L).
Annual mean salinities of the upper 50 meters progressively increase from the LSLE (29) to the ESS (31), with higher salinities found in the NEGSL (32) (Figure 2M). In future years, there is a significant freshening of the upper 50 m over the domain with the lowest salinity decrease of 0.7 on the ESS and the highest salinity decrease of 0.9 in the SGSL (Figure 2N).
Stratification is stronger in areas influenced by large freshwater runoff (Figure 2O), such as the LSLE (4.7 ± 0.4 kg m-3), NWGSL (2.8 ± 0.2 kg m-3), SGSL (2.6 ± 0.2 kg m-3), and ESS (2.0 ± 0.2 kg m-3), compared to the NEGSL (1.3 ± 0.1 kg m-3) which receives little runoff. In future years, an increase in stratification is simulated over the whole GSL, even though the changes are significant only in the SGSL (19%), NWGSL (12%) and ESS (24%) (Figure 2P).
As both warming and freshening of the water column contribute to increased stratification, the relative contributions of salinity and temperature changes are also calculated (Figure 3). In the LSLE, NWGSL, and SGSL, salinity changes contribute 40-80% to the increase in stratification, and in the Scotian Shelf, salinity change contributes up to 100% of the increase. Temperature contributes only moderately to the stratification in the LSLE, SGSL and Scotian Shelf. In contrast, salinity change contributes less than 40% to the increase in stratification, with most of the contribution from salinity being less than 20%, in the NEGSL and over the Laurentian Channel (Figure 3B). In the NEGSL, along the northern coast of the NWGSL, and over the Laurentian Channel, temperature effects dominate, contributing 60-100% to the increased stratification (Figure 3C).
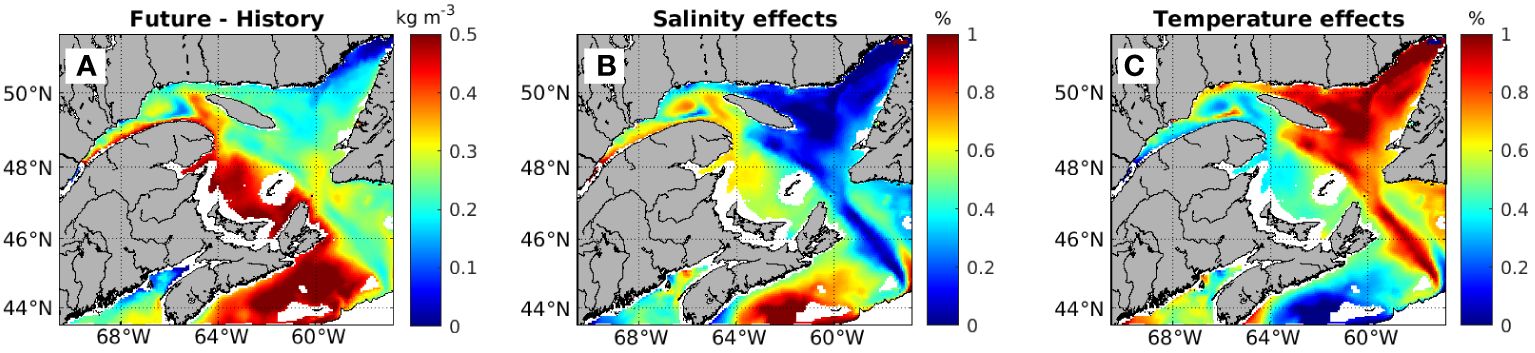
Figure 3. Projected changes in stratification in the upper 50 m water column (A), the contribution to changes in stratification due to salinity (%) (B), and due to temperature (%) (C). Calculations do not apply to areas where the bottom depth is shallower than 50 m (shown as blank).
3.2 Trends in water column salinity and temperature
As shown in the previous section, substantial changes in temperature and salinity are simulated for the upper 50 m of the water column. In this section we present the changes occurring in different layers of the water column (Figures 4, 5). In the LSLE (Figure 4A), NWGSL (Figure 4B), and NEGSL (Figure 4C), the warming trends for the cold intermediate layer, and warm Atlantic layer are larger than those of the surface layer, except for the SGSL (Figure 4D), where the maximum depth is less than 100 m. In the ESS (Figure 4E), the difference in the trends for the 0-50 m and 50-150 m layers is less pronounced, and not significant (p>0.05) compared to the LSLE and GSL. The warming trends for the 150-300 m layer are significantly higher than in the upper layers in all the regions (p<0.05). A different simulated salinity pattern emerged, with significantly greater freshening in the 0-50 m layer than in the 50-150 m layer (p<0.05), but with increasing salinities in the deep layer in all the regions (Figure 5). The salinity increases in the warm Atlantic layer are not significantly different from each other (p>0.05) (Figure 5).
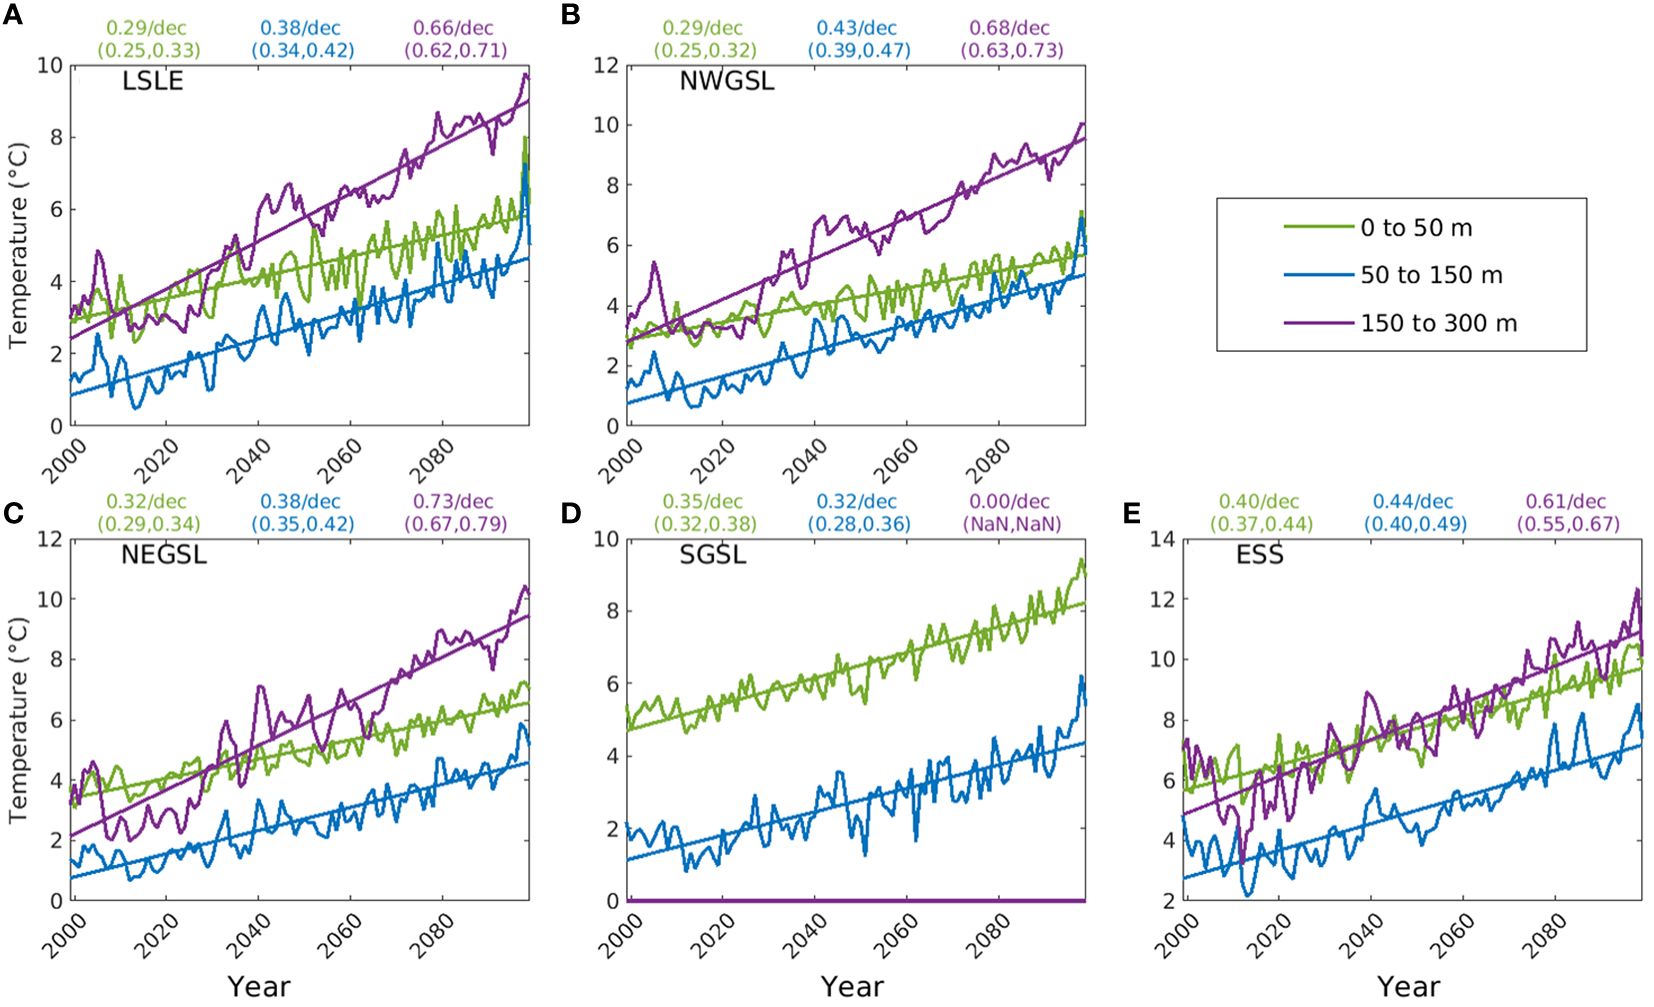
Figure 4. Trends of annual mean temperature of different depth layers (0-50 m, 50-150 m, and 150-300 m) in five subregions of the Gulf of St. Lawrence (GSL) and Scotian Shelf: (A) Lower St. Lawrence Estuary (LSLE), (B) northwest Gulf of St. Lawrence (NWGSL), (C) northeast Gulf of St. Lawrence (NEGSL), (D) southern Gulf of St. Lawrence (SGSL), and (E) eastern Scotian Shelf (ESS). The slopes of the trendlines in °C per decade, with lower and upper limit of 95% confidence interval in the parenthesis, are displayed on the top of each panel for the respective depth layer.
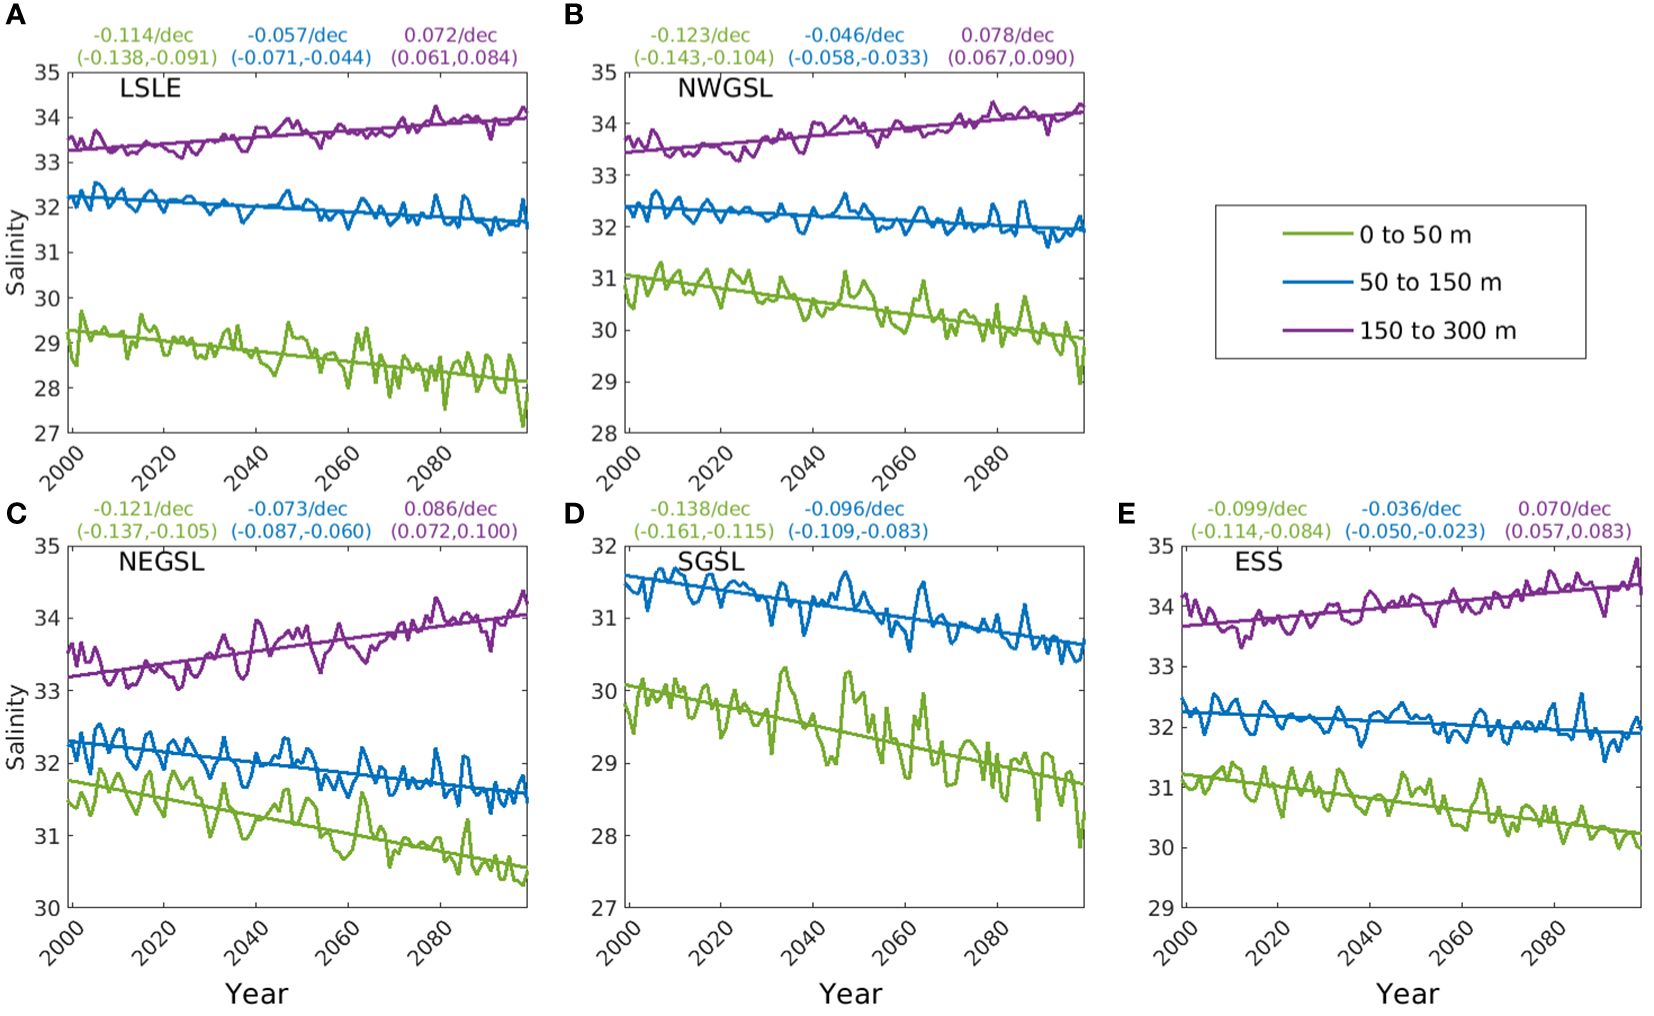
Figure 5. Trends of annual mean salinity of 3 depth layers (0-50 m, 50-150 m, and 150-300 m) in five subregions of the Gulf of St. Lawrence (GSL) and Scotian Shelf: (A) Lower St. Lawrence Estuary (LSLE), (B) northwest Gulf of St. Lawrence (NWGSL), (C) northeast Gulf of St. Lawrence (NEGSL), (D) southern Gulf of St. Lawrence (SGSL), and (E) eastern Scotian Shelf (ESS). The slopes in change in PSU per decade, with lower and upper limit of 95% confidence interval in the parenthesis, for each trend line obtained from least squares linear regression are displayed on the top of each panel for the respective subregions.
3.3 Nutrient input at the head of Laurentian Channel and at the boundaries
3.3.1 Freshwater and nutrient from river runoff
The total freshwater runoff from the 56 simulated rivers flowing into the GSL, averaged over the 2001-2020 period, amounts to 21746 m3 s-1, exhibiting an increasing trend of 223 m3 s-1 per decade, significantly different from 0 (p< 0.05), between 1999 and 2099 (Figure 6A). This inflow provides a relatively large amount of NO3 and DON, and a small amount of NH4, to the GSL system, with average fluxes of 360, 285 and 21.7 mol N s-1, respectively, over the historical period (Figures 6B–D). The increased runoff leads to increases in NO3, DON, and NH4 fluxes at respective rates of 3.46, 2.7, and 0.2 mol N s-1 per decade with significantly higher mean fluxes in the future compared to the historical period (p< 0.05, n = 20) (Figures 6B–D).
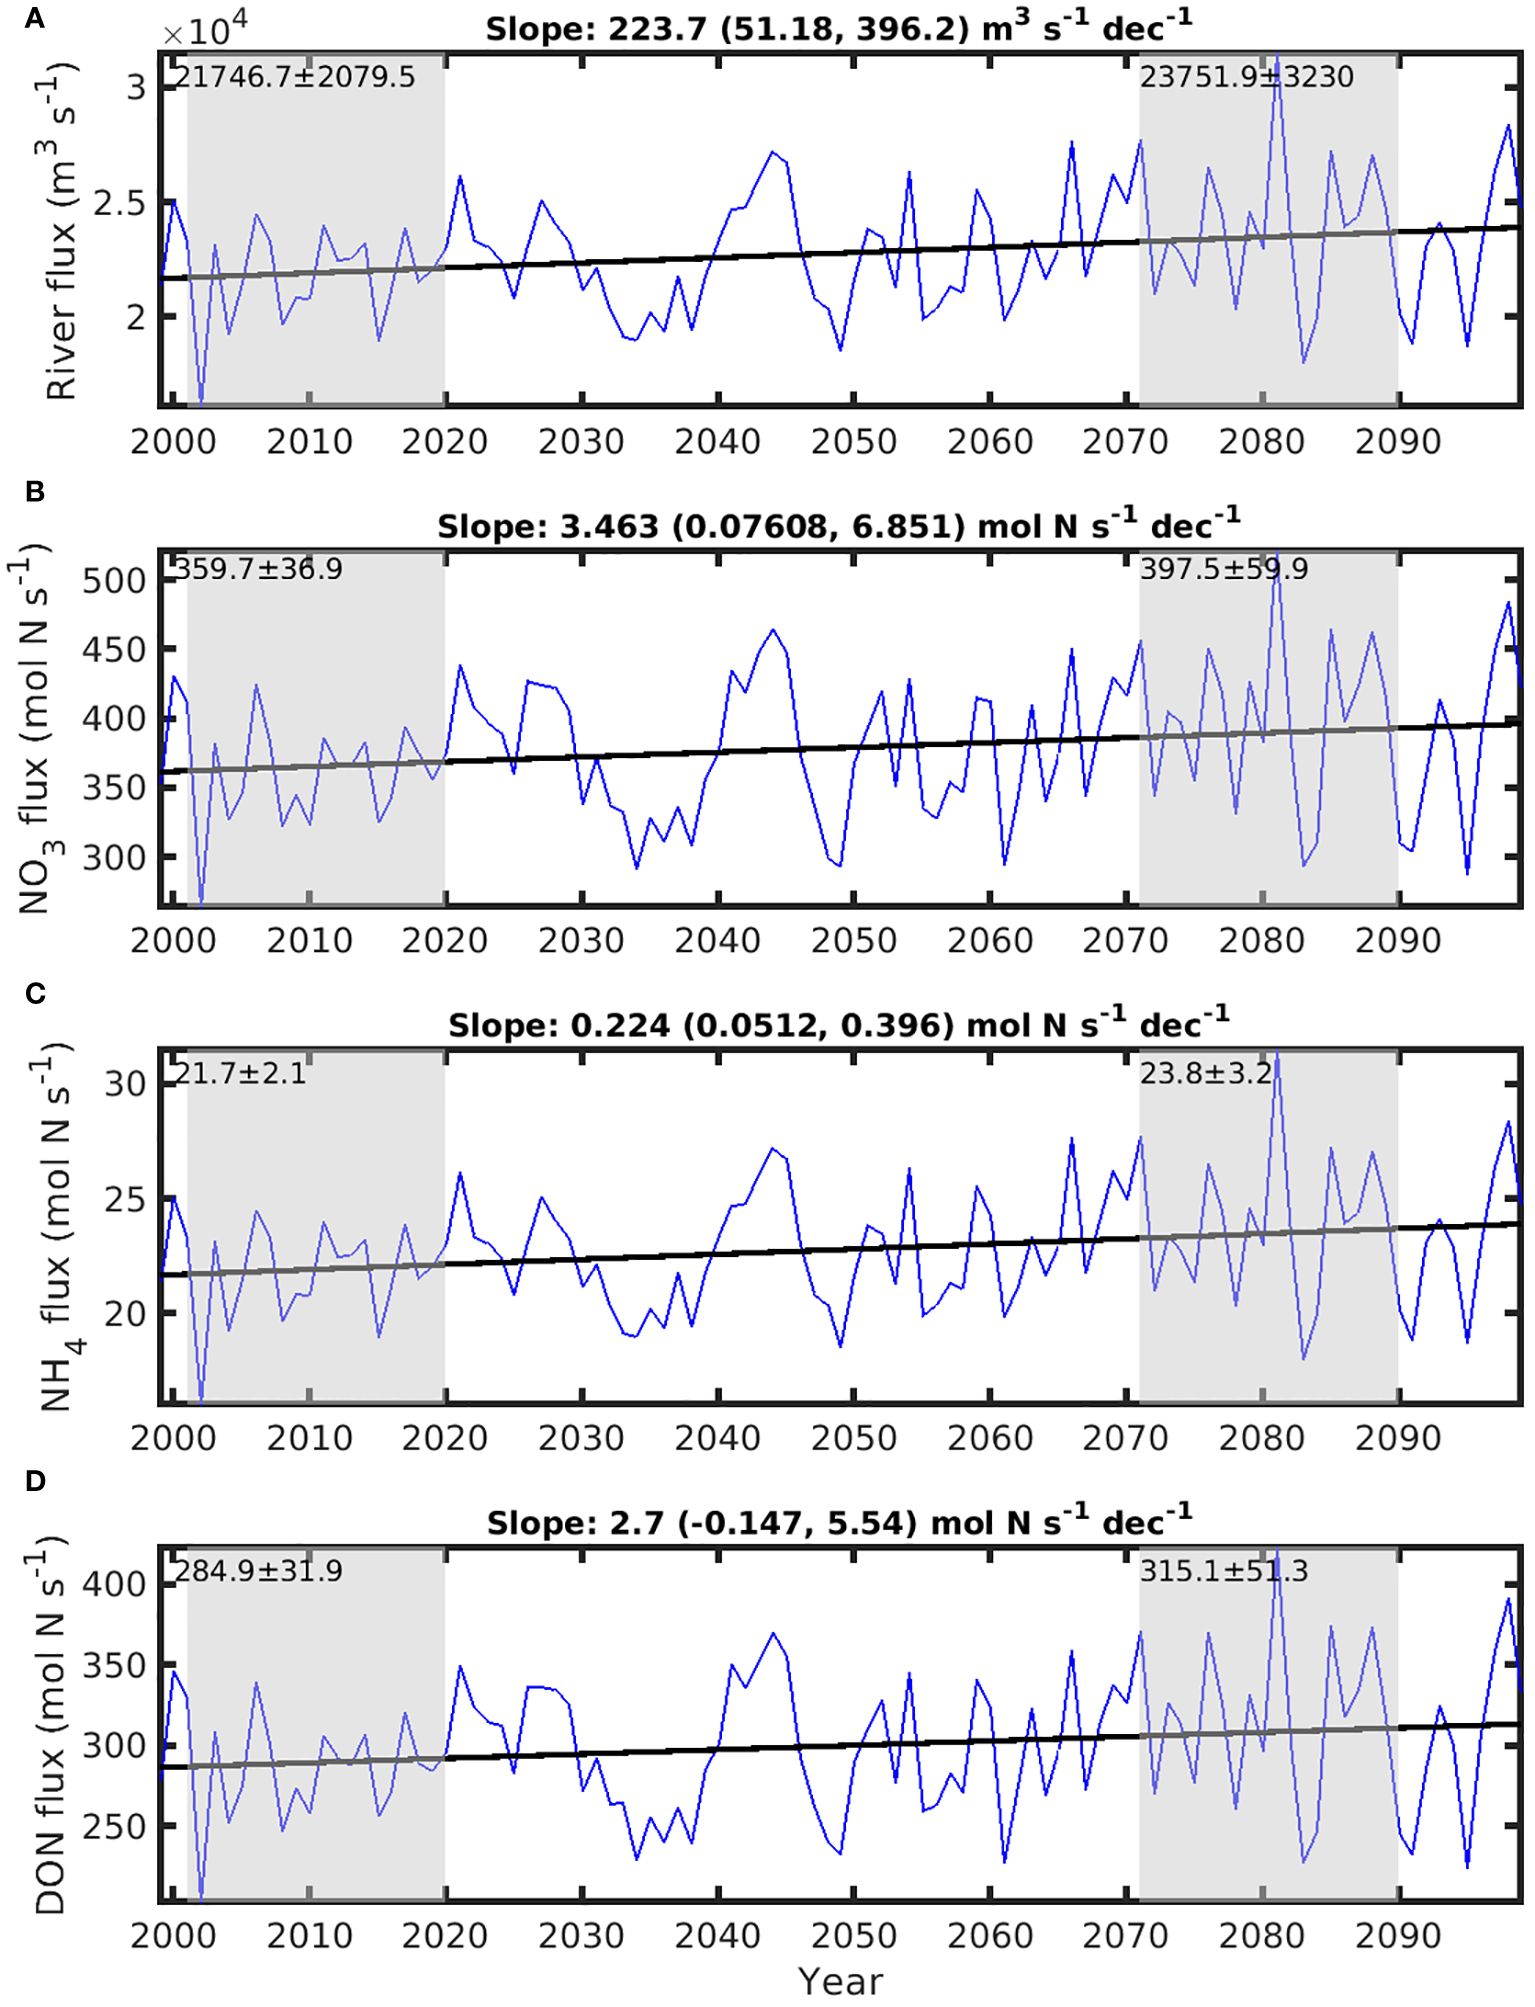
Figure 6. Fluxes of river runoff and nutrients from the 56 rivers included in the model in the Lower St. Lawrence Estuary and the Gulf of St. Lawrence (GSL) between 1999 and 2099. (A) flux of river runoff, (B) Total nitrate (NO3) riverine flux, (C) Total ammonium (NH4) riverine flux, and (D) Total dissolved organic nitrogen (DON) riverine flux. Historical period years (2001-2020) and future years (2071-2090) are highlighted with gray shading. The average flux ± standard deviation for these two periods are indicated above. The numbers on the top of each panel are the slope, with lower and upper limit of 95% confidence interval in the parenthesis, of the trend lines between 1999 through 2099.
3.3.2 Upwelling at the head of the Laurentian Channel
The mean transport resulting from upwelling through the 46 m depth horizon at the HLC (see the purple polygon on Figure 1) over the historical period (0.046 Sv, Figure 7A) is twice the total river runoff in the GSL (Figure 6A). This vertical transport results in a mean upward flux of NO3 of about 804 mol N s-1 (Figure 7B), more than twice the riverine NO3 flux (Figure 6B). The mean vertical transport of NH4 and DON is very small in comparison (12 and 1.7 mol N s-1, respectively, Figures 7C, D). Over the course of the 1999-2099 period, the upwelling flux through the HLC decreases at a rate of -5.2×10⁻⁴ Sv per decade, significantly different from 0 (p< 0.05) (Figure 7A). This reduced transport is accompanied by a decrease in the total annual NO3 fluxes through the HLC, at a rate of -26 mol N s-1 per decade (significantly different from 0, p< 0.05), throughout the period (Figure 7B). The trends for total NH4 and DON fluxes at the HLC are not significantly different from 0 (p>0.05) (Figures 7C, D). There is a total reduction of nitrogenous nutrients upwelling flux of about 180 mol N s-1 at the HLC between the historical and future periods (Figure 7B). This reduction is approximately 3.8 times greater than the concurrent increase in all nitrogenous nutrient inputs originating from rivers (70 mol N s-1, Figure 6B).
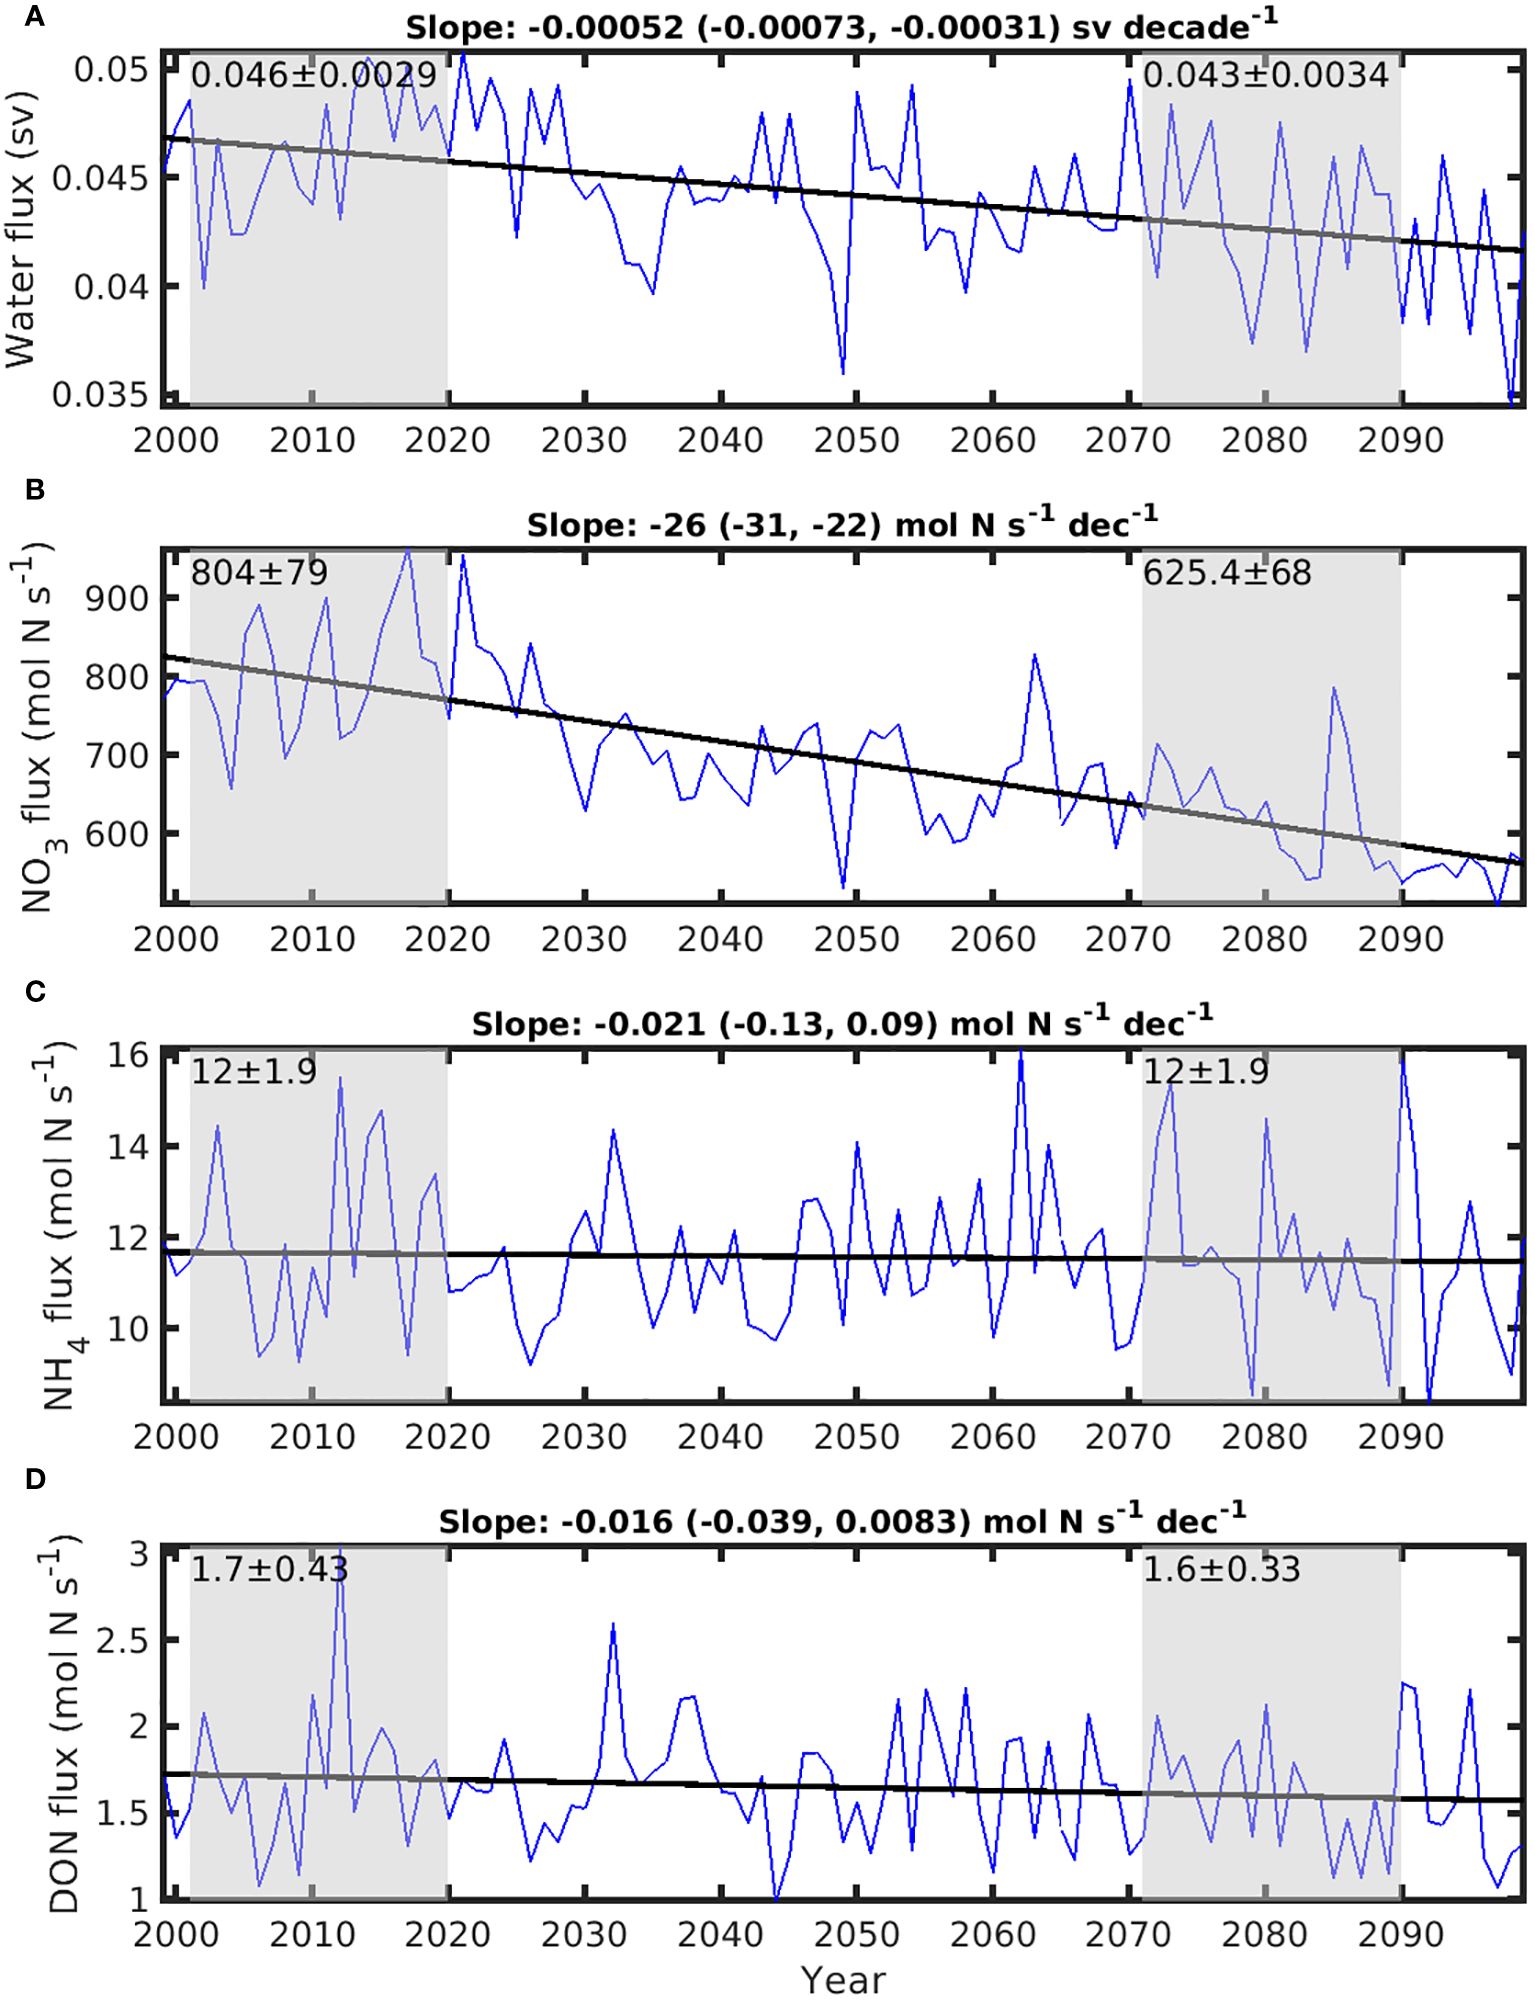
Figure 7. Time series of the upwelling flux of water and nutrients across the 46 m depth horizon at Head of Laurentian Channel (HLC). (A) flux of water; (B) upwelling flux of nitrate (NO3), (C) upwelling flux of ammonium (NH4); and (D) upwelling flux of dissolved organic nitrogen (DON). The solid line on each panel is the trend line for each time series. The slopes, with lower and upper limit of 95% confidence interval in the parenthesis, of the trend lines are labeled on the top of each panel. Gray areas mark the mean ± std of historical period (2001-2020) and future climate years (2071-2090), respectively.
3.3.3 Strait of Belle Isle
The transport at the SBI is anticipated to decrease slightly from 0.26 ± 0.005 Sv during the historical period, to 0.25 ± 0.005 Sv in the future, with an overall decreasing rate of -6.04×10⁻⁴ Sv per decade (significantly different from 0, p< 0.05) (Figure 8A). The NO3 flux across the transect decreases significantly from 1097 ± 117 mol N s-1 in the historical period to 354 ± 80 mol N s-1 in the future, demonstrating an overall decreasing rate of 98.3 mol N s-1 per decade (significantly different from 0, p< 0.05) (Figure 8B). This decrease in NO3 flux is mainly due to decreasing NO3 concentration at the SBI open boundary (-0.34 mmol N m-3 per decade, significantly different from 0, p< 0.05,; Supplementary Figure S3A, see Figure 13 of Lavoie et al., 2020). Conversely, the NH4 and DON fluxes across the SBI transect remain small and exhibit negligeable changes (p > 0.05) over the analyzed period (Figures 8C, D). It is noteworthy that this decrease of 746 mol N s-1 in NO3 flux is approximately 4.2 times the reduction of upwelling input of N at HLC, and approximately 10 times greater than the increased N input of 70 mol s-1 from rivers.
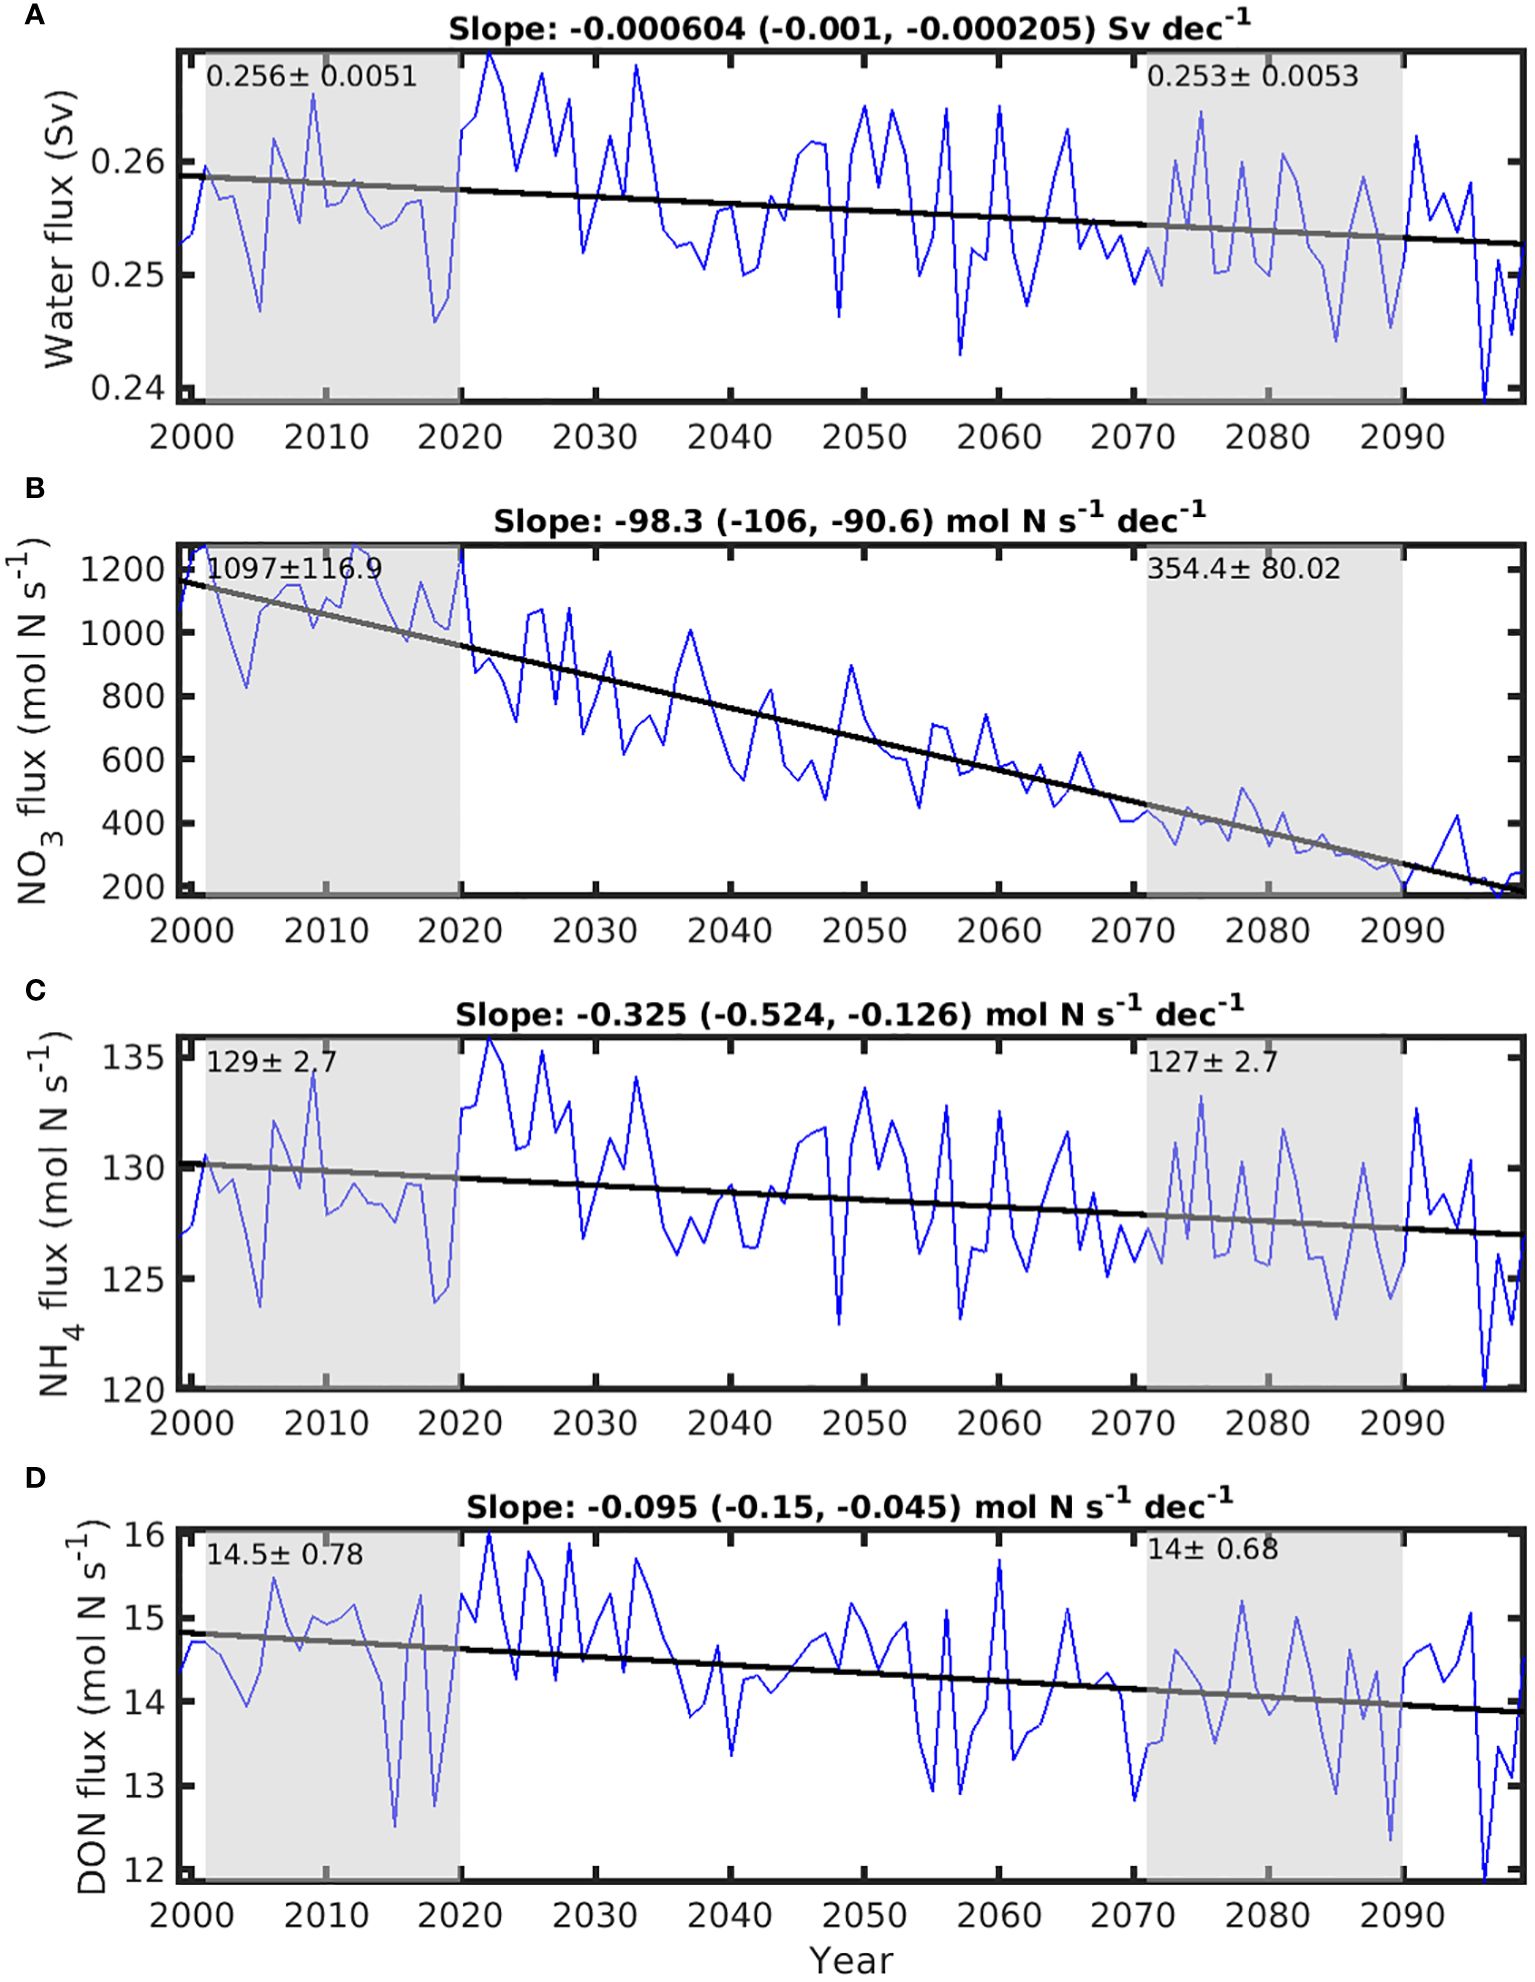
Figure 8. Time series of annual mean inflow flux of water and nitrogenous nutrient inputs between 0-75 m from the Strait of Belle Isle (SBI) transect. (A) flux of water, (B) flux of nitrate (NO3), (C) flux of ammonium (NH4), and (D) flux of dissolved organic nitrogen (DON). The gray areas of each panel indicate the historical period (2001-2020) and future climate years (2071-2090), for which the mean ± standard deviations of the respective periods are indicated. The solid lines are the trend lines estimated from least squares regression. Their slopes, with lower and upper level of 95% confidence interval in the parenthesis, are shown on the top of each panel.
3.3.4 Cabot Strait
Since the inflow of surface water across Cabot Strait predominantly takes place on the northeast side of Cabot Strait, our attention is directed towards the inflow through that sub-section (CSE in Figure 1). The simulated inflow into the GSL at CSE (0.31 ± 0.039 Sv) is decreasing at a low rate of -2.54 × 10⁻³ Sv per decade (Figure 9A), but these changes are not significantly different from 0 (p > 0.05). However, the NO3 flux through the CSE decreases significantly (p = 3.16 × 10⁻⁴), demonstrating a trend of -44.2 (95% CI: -50.8 to -37.6) mol N s-1 per decade (Figure 9B). This declining trend of the NO3 flux across CSE is due to a significant reduction (p<0.05) in NO3 concentration in the inflowing water (Supplementary Figure S3B). The NO3 flux through CSE declines by 340 mol N s-1 between the historical and future periods, which is 4.9 times the magnitude of the increased N input from rivers. Contribution of NH4 (Figure 9C) and DON (Figure 9D) across the transect and their changes from historical to future periods are relatively small, compared to the pronounced change in NO3.
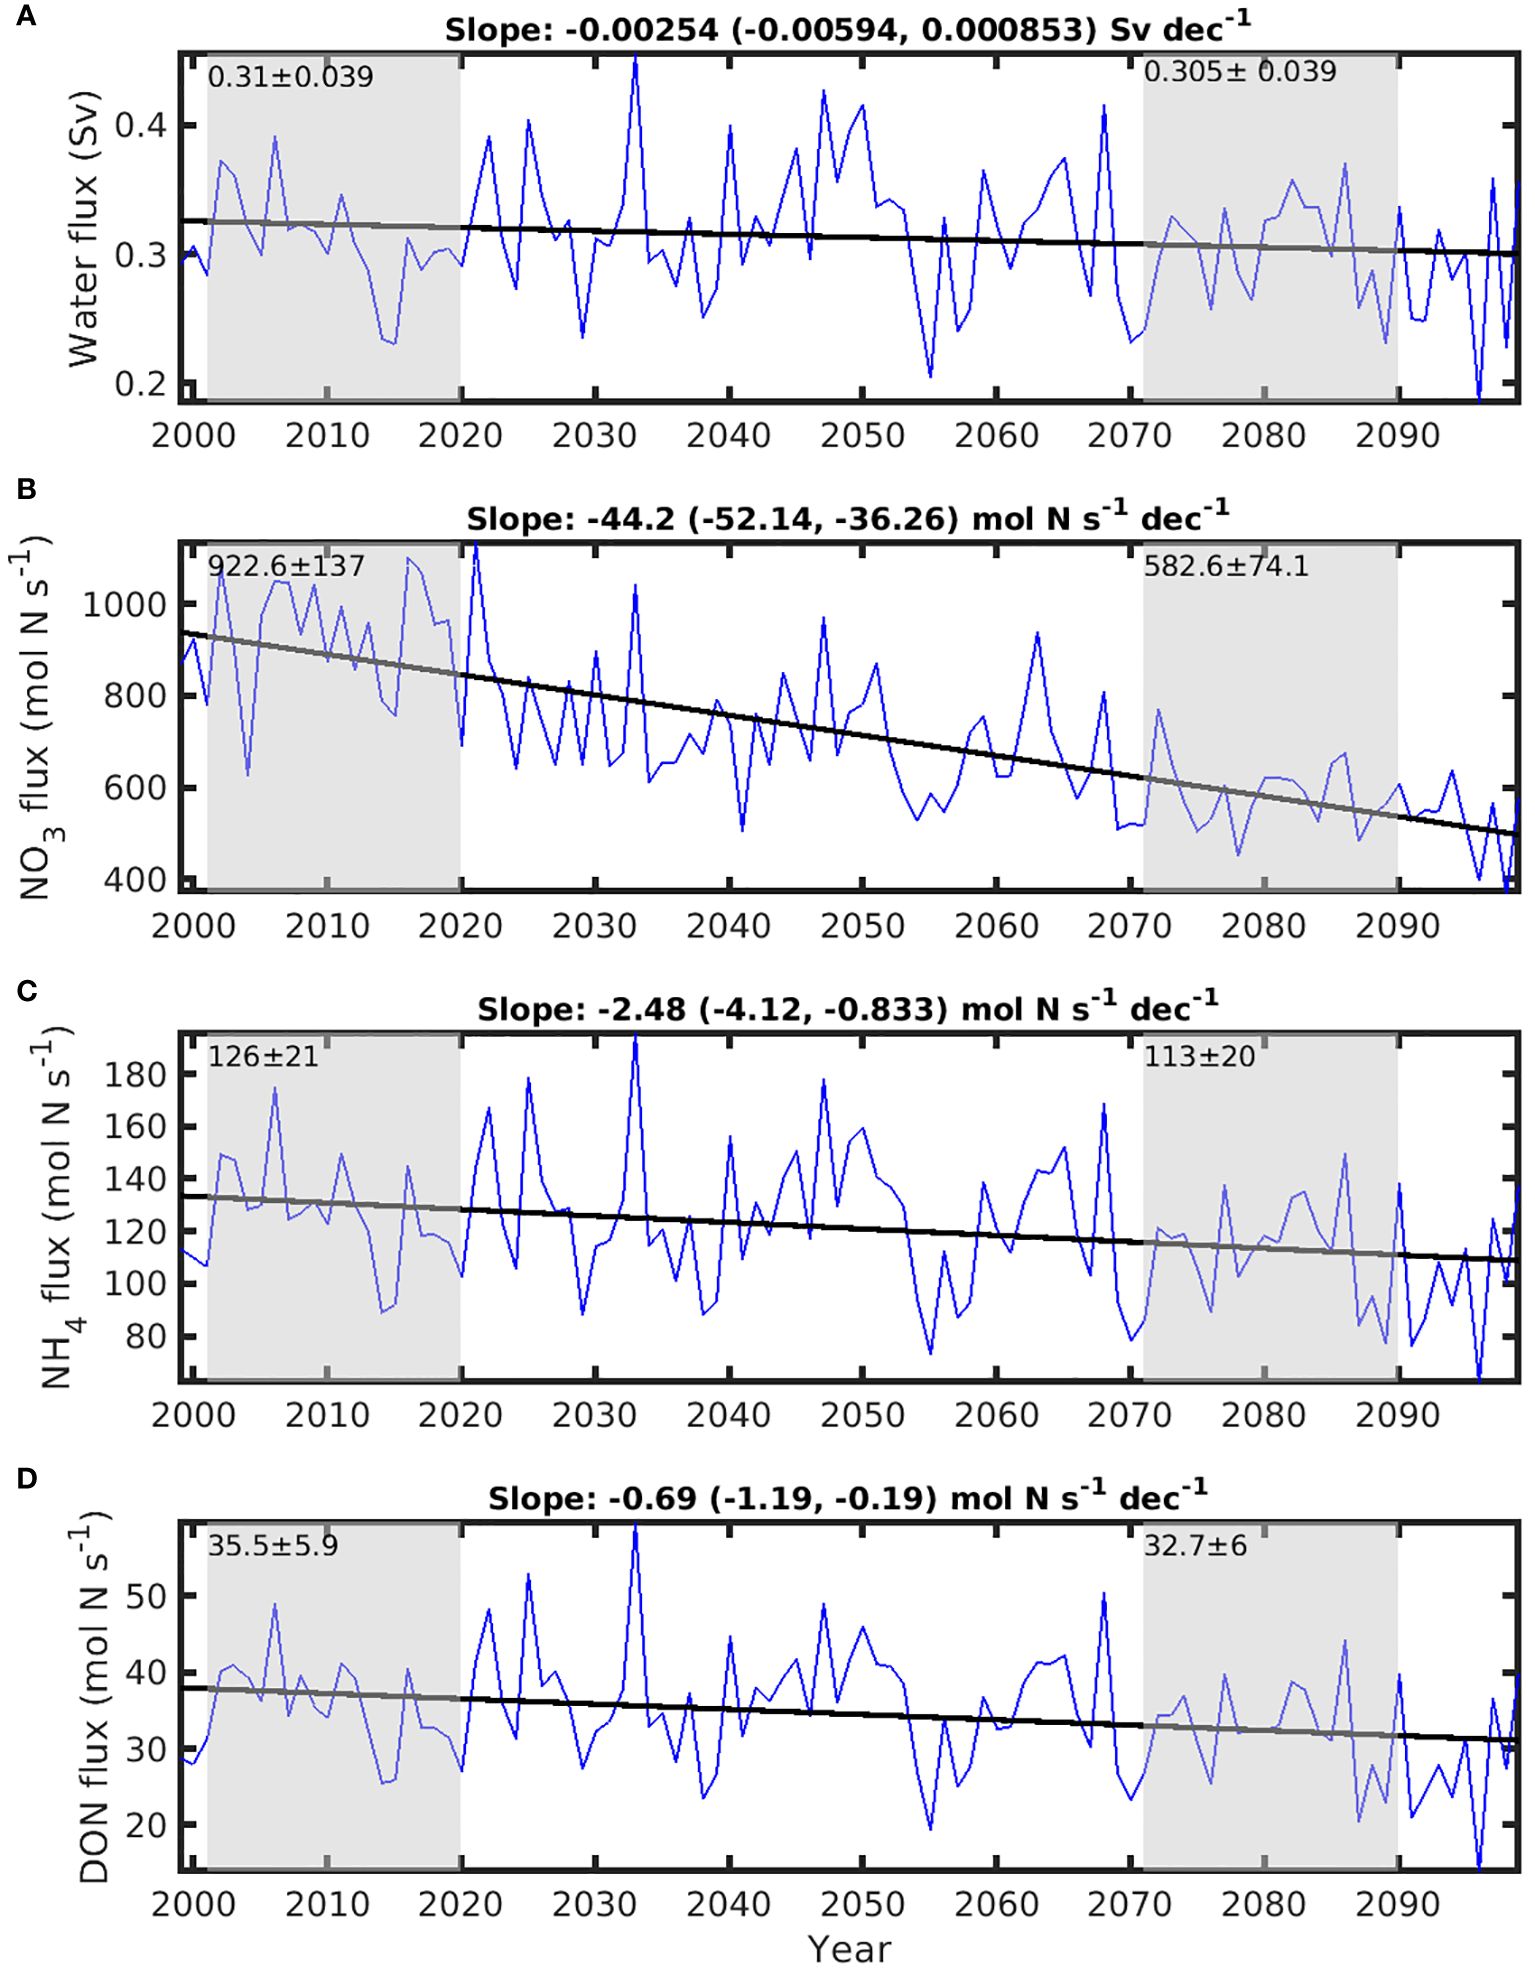
Figure 9. Time series of fluxes of water and nitrogenous nutrients between 0-50 m across the east Cabot Strait (CSE). (A) water flux, (B) nitrate (NO3) flux, (C) ammonium (NH4) flux, and (D) dissolved organic nitrogen (DON) flux. The gray areas of each panel indicate the historical period (2001-2020) and future climate years (2071-2090). The mean ± std for historical and future years are marked on the respective gray areas. The straight lines are the trend lines of time series, estimated with least squares regression. The slopes of the trend lines, with the lower and upper limit of 95% confidence interval in the parenthesis, are shown on the top of each panel.
3.4 Changes in nitrogenous nutrients and plankton biomass
3.4.1 Changes in nitrogenous nutrients
The mean concentration of NO3 in the 0-50 m layer (Figure 10A) is projected to decrease over the whole region by 0.7 to 1.7 mmol N m-3 when compared to the historical period (Figure 10B). However, this decline is significant only in the NEGSL, and parts of the NWGSL and ESS (Figure 10B), with respective reductions of 36% (1.2 mmol N m-3), 21% (1.4 mmol N m-3), and 23% (1.1 mmol N m-3) (Figure 10B). Time series of NO3 concentration in the 0-50 m layer show decreasing trends of -0.16, -0.15, and -0.14 mmol N m-3 per decade, significantly different from 0 (p<0.05), in the three regions respectively (Supplementary Figures S5B, C, E).
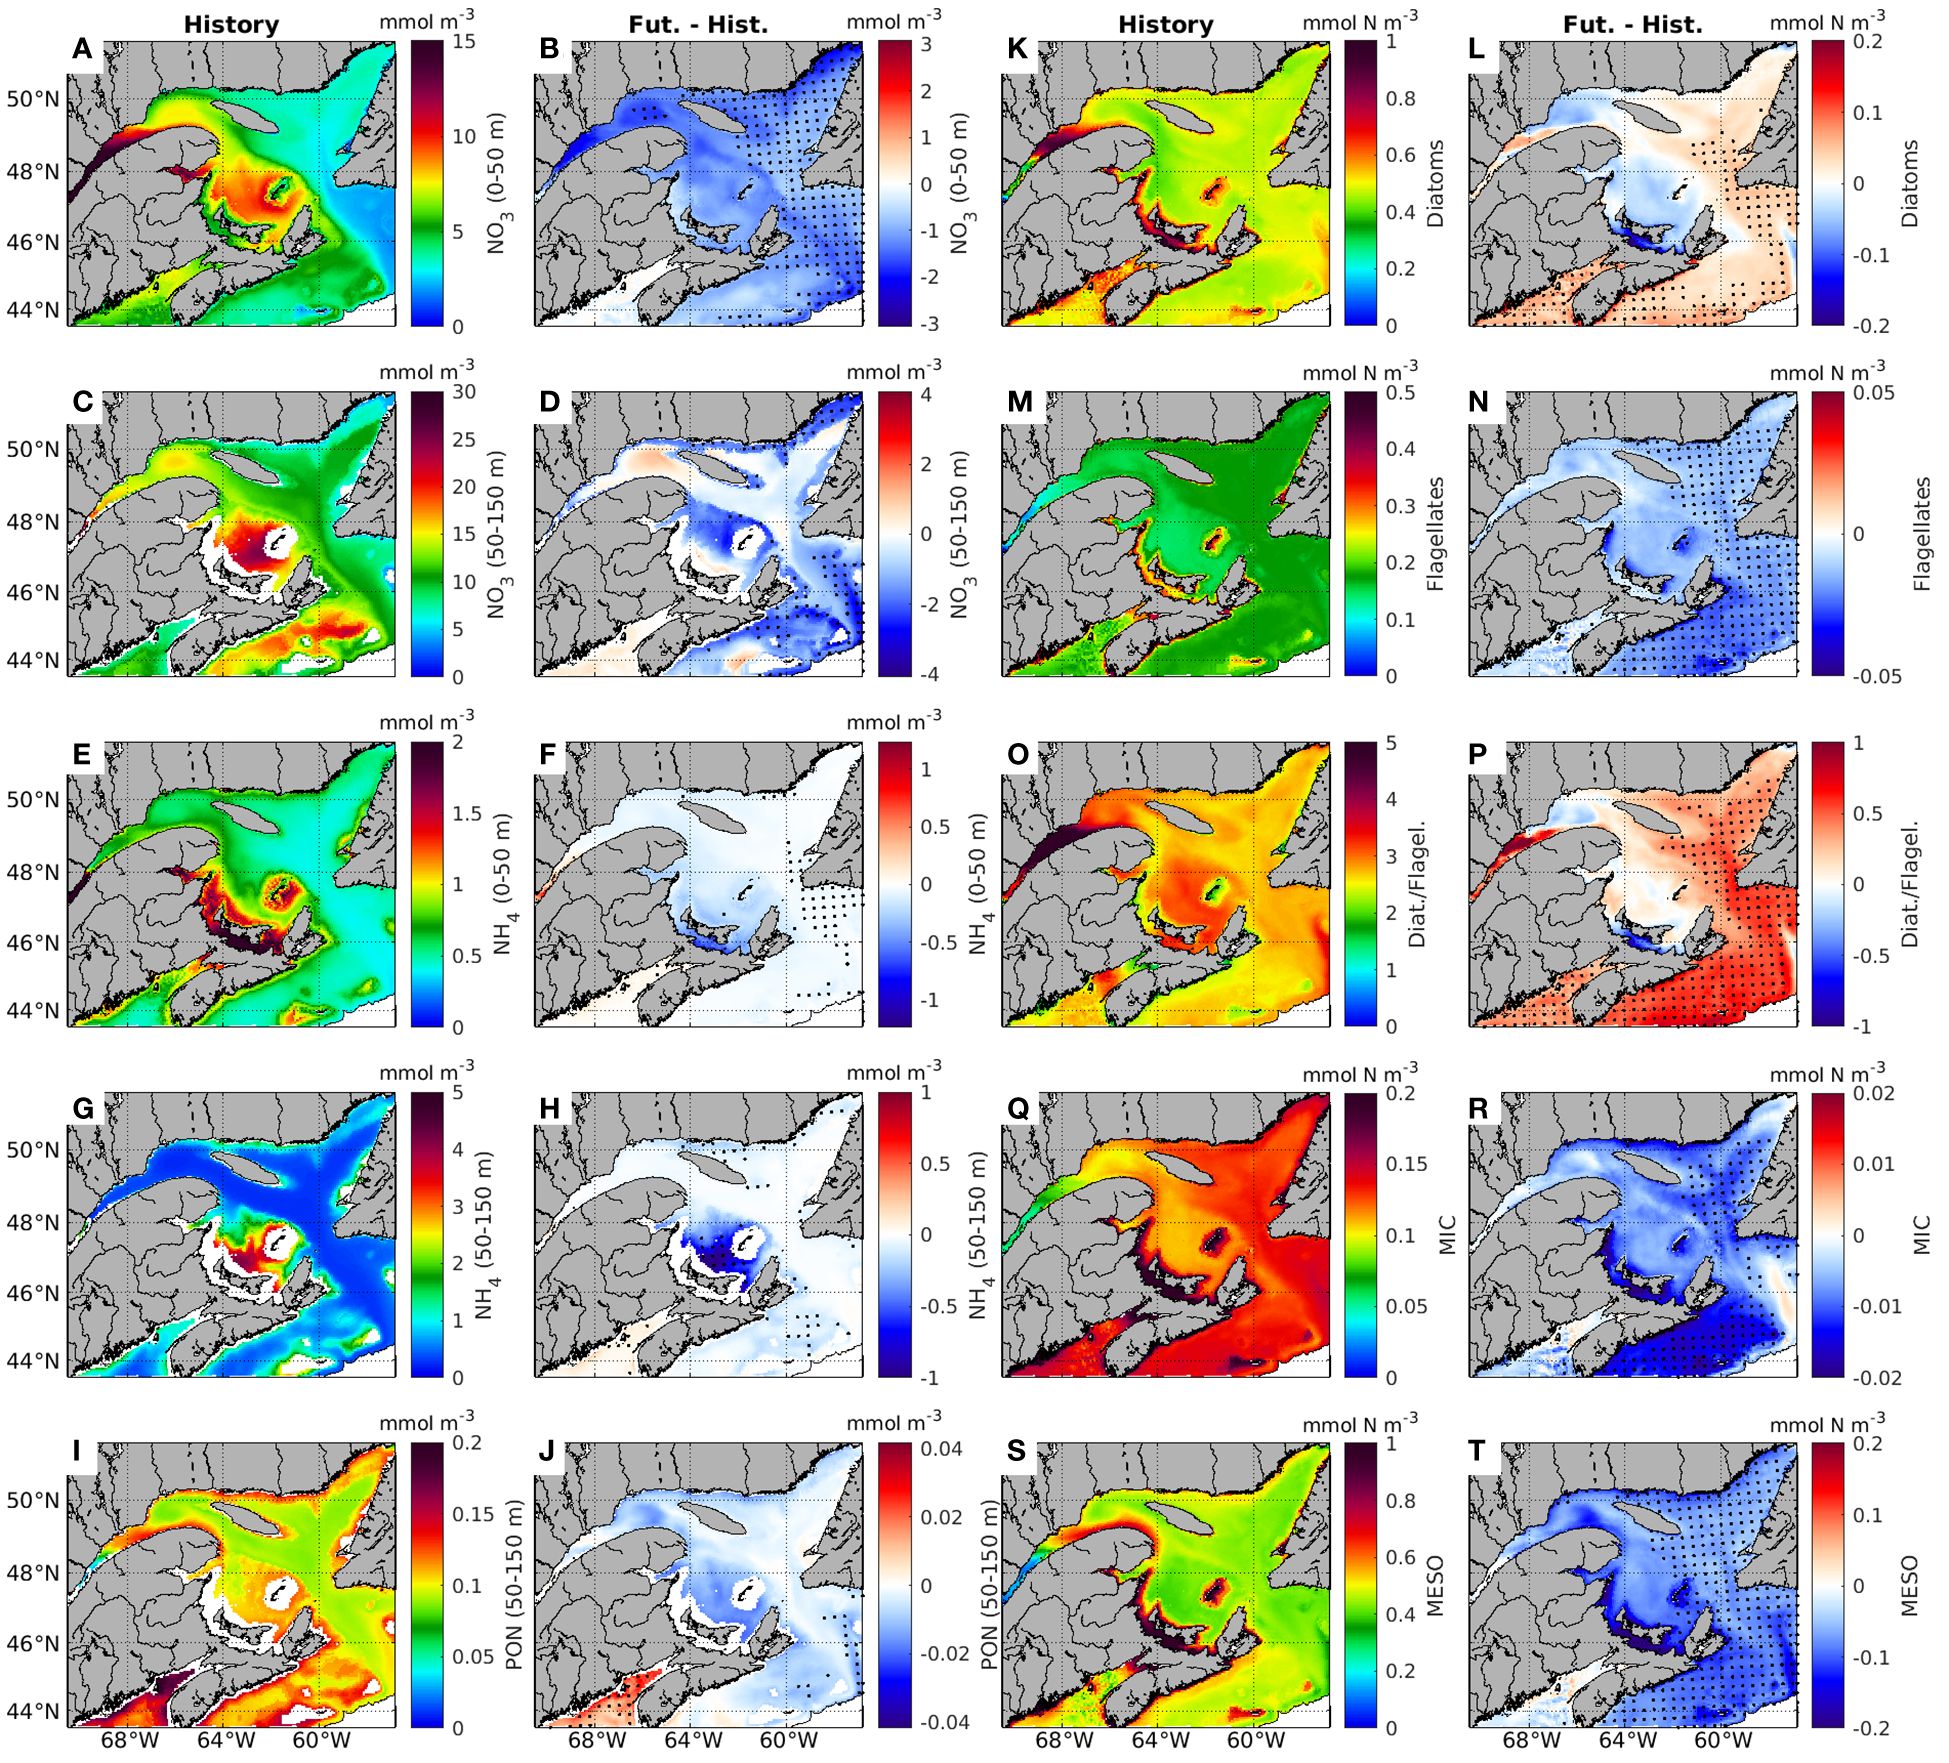
Figure 10. Annual mean distribution of biogeochemical variables in historical period years (2001-2020, denoted ‘History’) and their change in future years (2071-2090) from historical years (Fut.-Hist.) of the surface layer (0-50 m) or cold intermediate layer (50-150 m). The variables include nitrate (NO3) at 0-50 m (A, B), NO3 at 50-150 m (C, D), ammonium (NH4) at 0-50 m (E, F), NH4 at 50-150 m (G, H), particulate organic nitrogen (PON) at 0-50 m (I, J), biomass of diatoms (K, L), biomass of flagellates (M, N), ratio between biomass of diatoms to flagellates (D/F, (O, P), biomass of microzooplankton (Q, R), and biomass of mesozooplankton (S, T) at 0-50 m. Dots on the maps indicate the grid cells where changes between future and historical years are significant.
A significant decrease in NO3 concentrations is also simulated in the 50-150 m layer along the northern shoreline of the NEGSL and in certain sections of the ESS (Figure 10D). When averaging by regions (Supplementary Figure S5), a slight decrease in NO3 concentrations is simulated except for the NWGSL where an increase is projected (Figure 10B). An increase in the center of the NWGSL is also evident in both Figure 10 and Supplementary Figure S5B. Below 150 m, NO3 concentrations are increasing at rates significantly different from 0 (p<0.05), except the ESS (Figure 10D; Supplementary Figure S5).
Ammonium concentrations are generally low in the 0-50 m (Figure 10E) and 50-150 m (Figure 10G) layers in the GSL and ESS, except in the SGSL (Figures 10E, G), where NH4 concentrations can be as high as 5 mmol N m-3. The projected changes in NH4 concentrations are not significant except along the north shore of the GSL (even though the changes are small), and in the 50-150 m layer in the SGSL (decreases by 22%, Figures 10F, H). Particulate organic nitrogen concentrations in the 0-50 m layer are relatively low (less than 0.2 mmol N m-3), with higher concentration simulated in the LSLE, along the Gaspé Peninsula and in the Scotian Shelf (Figure 10I). The simulation shows a particulate organic nitrogen decline over the whole GSL in the future, even though not significant (Figure 10J).
3.4.2 Changes in plankton biomass
Changes in phytoplankton biomass in future years show distinct patterns for the two phytoplankton groups (diatoms and flagellates) represented in the model (Figures 10K–N). The diatom concentrations decrease in the NWGSL and SGSL but increase in other areas, while flagellates decrease over the whole GSL. However, significant increases for diatoms and decrease for flagellates, are found in the NEGSL and ESS (Figures 10L, N). These opposite trends lead to significant increases of 12.0% and 23% in the ratio of diatoms to flagellates (D/F) in the NEGSL and ESS, respectively (Figure 10P; Supplementary Table S3).
During the historical period, the distribution of microzooplankton mirrors that of flagellates, featuring low concentrations in the LSLE (0.08 ± 0.005 mmol N m-3), intermediate values in the NWGSL and SGSL, and higher concentrations of 0.14 mmol N m-3 in the remaining regions (Figure 10Q). In future years, as for flagellates, the decreases in microzooplankton are significant only in the NEGSL and ESS. The concentration of mesozooplankton follows the same pattern as the diatom concentrations during the historical period (Figure 10S). In future years mesozooplankton biomass is projected to decrease significantly in the NEGSL (-16.3%), and in the ESS (-20%) (Figure 10T).
3.4.3 Changes in phytoplankton bloom phenology
The phytoplankton bloom first occurs in the ESS (on Julian day 48 on average), then in ice-free waters of the NEGSL (around Julian day 67) and SGSL (Julian day 79), and at last in the LSLE (on Julian day 123, Figure 11A). The timing of the bloom is more variable in areas influenced by the St. Lawrence River outflow (standard deviation of 23 and 15 days in the LSLE and SGSL, respectively). A significantly earlier bloom is simulated for the 2071-2090 period along the north shore of the GSL and in the SGSL (Figure 11B). In the LSLE the bloom is delayed by about 7 days. Other regions of the GSL and ESS exhibit minor, non-significant changes.
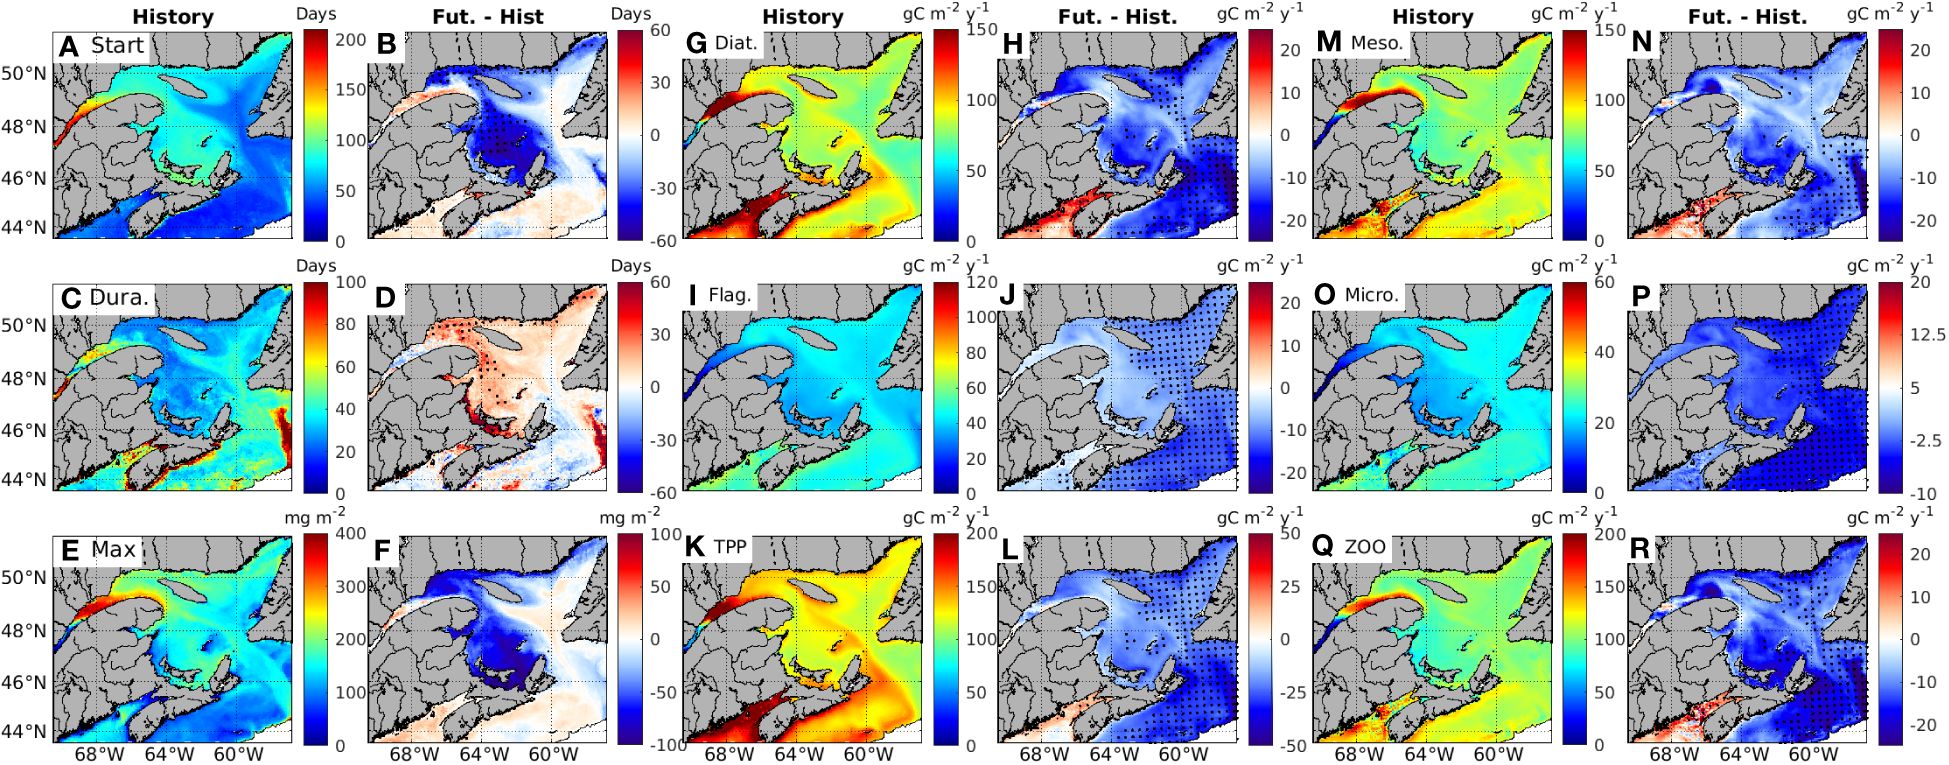
Figure 11. The characteristics of phytoplankton bloom, primary production and zooplankton production in the historical period years (2001-2020), and their changes in future climate years (2071-2090) from the historical years (Fut.-Hist.). Three parameters of the characteristics of phytoplankton bloom, (A, B) the day of bloom start (Start, with 0 representing January 1st), (C, D) bloom duration (Durat.), and (E, F) maximum biomass during bloom (Max), were calculated based on chlorophyll (Chl) integrated over the whole water column of each model grid. Primary production is calculated over the 0-50 m depth layer for diatoms (Diat., (G, H), flagellates (Flag., (I, J) and total primary production is the sum of diatom and flagellates production (TPP, K, L). Zooplankton production is calculated over the 0-50 m depth layer for mesozooplankton (Meso., (M, N), microzooplankton (Micro., (O, P), and total zooplankton production (ZOO) is the sum of microzooplankton and mesozooplankton production (Q, R).
During the historical period, the blooms in the LSLE and ESS last longer on average (57 ± 19 and 50 ± 8 days respectively), than in other regions (32-34 days for the NEGSL, NWGSL and SGSL, Figure 11C). The regions experiencing an earlier bloom in the future are also characterized with a longer bloom duration, and vice versa (Figure 11D). As for the timing of the bloom, the duration changes are significant only along the north shore of the GSL, in the NWGSL (extended by 14 days), and in a small portion of the SGSL (about 24 days longer) (Figure 11D). It is interesting to note that the SGSL and NWGSL also show the most substantial reductions in sea-ice concentration in future climate years (Figures 2I, J).
The maximum biomass of phytoplankton integrated from surface to 50 m depth, are the highest in the LSLE (320 ± 52 mg m-2), followed by the NWGSL (233 ± 46 mg m-2), and the lowest in the ESS (121 ± 12 mg m-2, Figure 11E) during the historical period. The bloom peak concentration is projected to decrease along the north shore of the GSL, in the NWGSL (by 23%), and in the SGSL (by 48%, Figure 11F). In contrast, the bloom peak increases slightly in the LSLE and by 14% in the ESS in the future (Supplementary Table S4).
3.4.4 Changes in primary and zooplankton production
Primary production (netPP) in the model includes the production by two phytoplankton groups, diatoms and flagellates, with diatoms being the dominant producers (Figures 11G, I, K). The diatom production is projected to decrease in all the regions of the GSL and in the ESS in the future, with the strongest decrease of 17% (16 gC m-2 y-1) in the ESS, and the smallest decrease of 4.7% (7.8 gC m-2 y-1) in the LSLE (Figure 11H). Diatom production in the remaining regions is estimated to decrease by 12% to 14% (Figure 11H). However, the changes are significant only in part of the NEGSL and in the ESS.
Flagellate production is also projected to decrease (Figure 11J). Due to lower historical production level of flagellates compared to diatoms (Figures 11G, I), the proportion of the decrease projected for flagellates is higher than for diatoms. As for diatoms, the most important and significant decreases in flagellate production in the future period are in the ESS (-28%) and NEGSL (-22%). The other regions show smaller (especially in the LSLE) non-significant decreases (between -15 and -17%, Figure 11J).
The resulting netPP is thus projected to decrease throughout the region in the future (-13.4%), with significant decreases in the NEGSL (-16.6%) and ESS (-20.5%) (Figure 11L). As for diatoms, only a limited number of grid cells show a significant decrease in the SGSL. In the LSLE, the simulated decrease is small and not significant (Figure 11L).
During the historical period the production of flagellates accounts for 14-34% of netPP, depending on the location within the GSL. The contribution of flagellates to netPP is lowest in the LSLE (14%). In the remainder of the regions, flagellates contribute 31% (NWGSL), 34% (NEGSL), 30% (SGSL), and 34% (ESS) to netPP (Figures 11G, I, K). The future contribution of flagellates to netPP is projected to decrease slightly by 0.1% (LSLE), 0.7% (NWGSL), 2.2% (NEGSL), 0.6% (SGSL), and 3.1% (ESS), with diatoms remaining the dominant primary producers in the GSL ecosystem in the future scenario.
The distribution of meso- and microzooplankton production is similar to that of diatoms and flagellates, respectively (Figures 11M, O vs Figures 11G, I), with total zooplankton production being dominated by mesozooplankton in historical years (Figure 11Q). In future years, the production of mesozooplankton, microzooplankton, and total zooplankton are projected to decrease, following a similar pattern to that of the diatoms, flagellates, and total phytoplankton, respectively (Figures 11N, P, R, vs Figures 11H, J, L). Projected total zooplankton production decreases significantly in the NEGSL (14%), SGSL (16%), and ESS (16%), with the smallest decrease occurring in LSLE (4.6%) (Figure 11R).
4 Discussion
This study shows a projected decrease of approximately 13.4% in netPP in the GSL and ESS in the future. As the GSL and Scotian Shelf are important fishing grounds in Canada, decline in netPP will have negative consequences to fisheries production in the region.
The main driver behind these changes in netPP is the reduction in nutrient availability in the upper 50 m water column, which is driven by a series of changes in physical processes along with climate change, as detailed below. Additionally, the simulation indicates alterations in the phytoplankton bloom phenology, characterized by an earlier onset and a prolonged duration, but with a smaller peak biomass. As expected, these modifications in turn affect zooplankton production. Further details regarding the causes of these changes are discussed in the subsequent sections.
4.1 Impact of large-scale hydrography on external nutrient inputs through the Strait of Belle Isle and eastern Cabot Strait
Our model does not directly simulate the large scale circulations of the Labrador Current in the north, and the Gulf Stream off the Scotian Shelf. However, the boundary conditions of our model are downscaled from the MPI-ESM-LR output that includes the large-scale circulation in a climate change scenario (Lavoie et al., 2019; Wang et al., 2019). Therefore, the changes in water properties and nutrient fluxes across SBI and CSE reflect the large-scale changes in ocean circulation and water mass properties occurring beyond our model domain (see Supplementary Figure S1 for the surrounding regions and main currents). The decreasing NO3 concentrations and salinity of the water masses entering the GSL through the SBI and CSE (Supplementary Figures S3A, B, D, E) reflect in part the increasing nutrient depletion (Doherty et al., 2021, Figures 3, 4 of Lavoie et al., 2019) and freshening (Zhang et al., 2021) observed in the upstream Labrador Current water along with climate change. The SBI inflow originates from the inshore branch of the Labrador Current (Brickman et al., 2018), while the inflow across CSE is derived from the southward Labrador Current that turns westward at the tail of the Grand Banks. After crossing CSE the flow continues northward along the west coast of Newfoundland and into the NEGSL (Han et al., 1999; Supplementary Figures S1, S7A). Changes in the strength of the upstream Labrador Current and increases in sea surface height within the GSL both contribute to the reduced inflow of Labrador Shelf water (Brickman et al., 2015).
In recent decades, the North Atlantic Oscillation center of action shifted westward, resulting in a northward shift of the position of Gulf Stream, an eastward deflection of the Labrador Current as well as in a reduction of the southwestward transport of Labrador Current water to the Scotian Shelf (Austin et al., 2019; Wang et al., 2019; Jutras et al., 2023). The decreasing fraction of Labrador Shelf water entering the GSL is consistent with both observations of long-term trends in the LSLE deep water properties (i.e., deoxygenation and warming) and changes in large-scale atmospheric conditions (Gilbert et al., 2005; Jutras et al., 2020).
The reduced influx of Labrador Shelf water is compensated by an increased fraction of lower latitude Gulf Stream water (Figures 4, 5), entering the GSL at depth through the CSE, and by increased river runoff in the surface (Brickman et al., 2015), as simulated in this study (Figure 6A). The GFDL Climate Change model (Claret et al., 2018) and other Earth System Models also project a northward shift of the Gulf Stream, reduced proportion of Labrador Current water entering the GSL through CSE, and an increase of Gulf Stream water on the Scotian Shelf and shelf break in future climate change scenarios at the end of the 21st century (Lavoie et al., 2019). Due to the decreased density in surface component of Gulf Stream, which is father away from the nutrient rich core Gulf Stream with density of 26.8 to 27.2 due to slowdown of AMOC (Wang et al., 2022; Lehmann et al., 2023), nutrient concentrations in Gulf Stream water have been decreasing in recent decades. This can be seen in the decreasing trend of NO3 in the Warm Atlantic Water entering the CSE in our model (Supplementary Figure S3C).
4.2 Impact of river runoff changes on nutrient input
With warming in the climate change scenario, total river discharge in the GSL increased at 223.7 m3 s-1 per decade (Figure 6A), which is equivalent to a trend of 0.7 km3 per year. This is lower than the trend in pan-Arctic rivers of 18 km3 per year during 1981-2070, but close to other rivers in the central and eastern North America predicted with a climate model (Stadnyk et al., 2021). Increasing trend of river discharge in Canadian high latitudes is due to increased precipitations with warming, with regional differences, that is, the wet becomes wetter, and dry becomes drier (Stadnyk and Déry, 2021). As river nutrient concentrations in our regional model are set to be temporally invariant, increasing discharge results in increasing nutrient flux of 70 mol s-1 from historical to future years. This increased flux corresponds to 39% of the reduced upwelling flux of 179 mol s-1 and is smaller than the reductions in the influxes via SBI (745.1 mol s-1) and CSE (355.8 mol s-1). Therefore, the reductions of nutrient input from SBI and CSE, and upwelling dominate the changes in nutrient supply to the surface of GSL.
In contrast to our model assumption of time-independent river nutrient concentrations, many studies suggest that nutrient concentrations in river waters may increase in response to climate change. Nutrient input to the watershed of the St. Lawrence sub-basin has been increasing in the past 110 years (Goyette et al., 2016). While nitrogen loads in freshwater runoff increase with precipitation, warming may offset the nutrient loading through a series of biological activities under warming conditions (Zhao et al., 2023). Some human activities, such as damming, may reduce the nutrient concentration in rivers (Seitzinger and Harrison, 2008). Dams built on the rivers flowing into GSL will not only change the circulation of GSL (Lavoie et al., 2017), but may also reduce nutrient concentration in river runoff. Therefore, the future direction of changes in nutrient concentrations in river runoff is uncertain. This expected change in nutrient fluxes due to variable riverine nutrient concentrations in response to climate change and human activities remains to be accounted for in models. So far, there is no model available to predict the changes in riverine nutrient concentrations. Nonetheless, even if we assume the doubling of the nutrient flux from rivers, from 0.12×10¹⁰ to 0.24×10¹⁰ mol y-1, this increase is roughly <10% of the combined reduction (3.83×10¹⁰ mol y-1) of fluxes from the HLC, SBI and CSE (Supplementary Table S1). Consequently, it is unlikely that variations in the nutrient concentration in river runoff to the GSL will alter the declining trend of nutrient input, and thus netPP, at the surface of GSL.
4.3 Impact of increased stratification on nutrient supply
The decline in netPP in the GSL and ESS is primarily associated with stronger stratification in the future climate scenario (Figures 2P, 10B) resulting from the warming and freshening of the upper layer (Figures 2L, N, P) as reported by other CMIP5 studies (e.g., Fu et al., 2016; Nakamura and Oka, 2019). The future climate scenario for the GSL and Scotian Shelf indicates spatial differences in the main driver of the stratification increase, i.e., salinity or temperature. Increased stratification is predominantly driven by freshening in the areas strongly influenced by river runoff, such as the LSLE, SGSL and Scotian Shelf (Figures 2, 3; Sheng, 2001; Saucier et al., 2003).
The NEGSL, on the other hand, receives little freshwater from rivers (Drinkwater and Gilbert, 2004), but as mentioned in Section 4.1, it receives relatively fresh Labrador Shelf water that flows through SBI and CSE. The NEGSL is thus less stratified than the other sub-regions (Figure 2O) but it nevertheless presents a significant increase in stratification in the future (Figure 2P), resulting from both warming and freshening (Figures 2L, N). Warming in NEGSL results from not only local atmospheric forcing (Figure 2B), but also from warming of Labrador shelf water flowing into the GSL across the SBI and CSE (Supplementary Figures S3D–F). Salinity changes in that region do not contribute substantially to the increased stratification in the upper 50 m, because the salinity decrease at the surface and at 50 m is similar. In areas affected by the freshwater outflow, salinity, rather than temperature, contributes predominantly to the increased stratification, because the temperature increases at both the surface and 50 m are similar, while the reduction in salinity is greater at the surface than at 50 m.
On top of contributing to the water column stratification, runoff from the St. Lawrence River contributes between 25 and 50% of the nutrient supply to the upper layer of the LSLE, the rest coming mostly from the upwelling of nutrient-rich water at the HLC (Greisman and Ingram, 1977; Cyr et al., 2015; Lavoie et al., 2021). Riverine nutrient fluxes increase in the future (Figure 6B), while the vertical nutrient flux at the HLC decreases by about 22% (175 mol N s-1, Figure 7B). These changes combined lead to an increase in the relative contribution of NO3 supply from the St. Lawrence River to LSLE from 31% in historical years to 39% in future years. Thus, even though the heightened river runoff delivers more nutrient, its suppressive effect on upwelling at the LSLE through increased stratification leads to a decrease in nutrient availability in the upper layer of the LSLE and downstream regions. Suppression of vertical nutrient supply by increased stratification throughout the region could be higher, as we focused on upwelling in HLC only, which is the dominant upwelling area in the GSL (Koutitonsky and Budgen, 1991).
The reduction in nutrient concentrations of inflow water at depth at Cabot Strait (Supplementary Figure S3C) would intuitively lead us to think a decrease in nutrient would be observed in the deep layers of the GSL in the future. However, the simulation results rather show an increase in NO3 concentrations over time (Supplementary Figures S5A–C). Local processes are responsible for this unexpected difference in trends within and outside of the GSL. The increased stratification leads to reduced exchanges between the upper and deeper layers in general, and to a shallowing of the blocking depth at the HLC (i.e. the depth down to which the deep waters can be advected over the sills, see Lavoie et al., 2000). This change in upwelling depth results in the reduced flux of nutrient to the upper layer and to a reduced ventilation of the deep layer. Even though there is a decrease in primary production and thus in the delivery of particulate organic matter at depth, the reduced ventilation leads to a greater isolation of the deep layer and to a cumulative effect of the recycling that consumes oxygen, and produces DON, which is remineralized to NH4 and subsequently nitrified, increasing the deep pool of NO3 over time (Coote and Yeats, 1979). This increasing NO3 concentration in warm Atlantic layer are however not readily available for netPP in the surface layer, and could potentially be denitrified as hypoxia becomes increasingly severe under the influence of climate change (Gilbert et al., 2005; Jutras et al., 2020).
4.4 Changes in primary production in different subregions
Due to differences in the processes that drives primary production in the GSL and ESS and how they are impacted by climate change, netPP changes in the future differ in each subregions. Primary production in the LSLE decreased slightly in the future climate scenario, as net PP in this region is generally not nutrient limited (Levasseur et al., 1984), but light limited due to the turbidity associated with freshwater runoff (Le Fouest et al., 2010). The supply of nutrients from river runoff and upwelling at HLC generally sustains high netPP in the regions under the influence of the St. Lawrence River outflow (LSLE, NWGSL, and SGSL). Accordingly, these regions show non-significant reductions in the future (Figure 11L). Although there is a reduction in NO3 levels in future period, these NO3 concentrations are still greater than the limiting nutrient thresholds for most phytoplankton groups, based on the nutrient uptake kinetics (Eppley et al., 1969; Lomas and Gilbert, 2000). Consequently, the relatively large reduction in nutrient availability (Figure 10B) only results in a minor decline in netPP within LSLE.
The strongest stratification increases occur in the SGSL and ESS (Figure 2P). A moderate reduction in netPP is simulated in the SGSL, with only small sub-regions showing significant changes, but significant reductions in netPP are simulated in the ESS (Figures 10L, 11L; Supplementary Table S4). The SGSL benefits from nutrients supplied directly from the LSLE via the Gaspé Current (Cyr et al., 2015). Moreover, it receives an important amount of organic matter that is regenerated on the shallow shelves of the SGSL (Lavoie et al., 2021), producing high amount of NH4 (Figure 10G) that are nitrified over time (Figure 10C). This process represents an additional source of nutrient to the upper layer of the SGSL (following vertical mixing) and to the ESS via horizontal transport. Our results show that this source of nutrient is reduced in the future (Figures 10D, H). The increase in light availability resulting from the significant reduction in sea-ice concentration in the GSL (Figure 2J) does lead to an earlier and longer (by 24 days in future years, Figure 11D; Supplementary Table S4) phytoplankton bloom but the peak is reduced, resulting in small changes in netPP. Conversely, the ESS is not an ice-covered area in historical years. The amplified stratification leads to the largest future netPP reduction. The increased stratification in the ESS attributed in part to freshwater discharge from the GSL, highlights the far-reaching impact of river runoff on the netPP in the Scotian Shelf (Lavoie et al., 2017).
While the projected stratification increase is comparatively smaller in the NEGSL than in the SGSL, the reduction in netPP is more pronounced in the NEGSL than in SGSL, and significant over the whole region (Figures 11K, L; Supplementary Table S4). In the NEGSL, nutrients are supplied to the upper layer mostly in fall and winter through vertical mixing with sub-surface water. Nutrients also flow in through SBI and CSE but the transport as well as the nutrient concentration decrease in the future (Figures 7, 8; Supplementary Figures S2A, B). The stronger stratification (Figure 2P) also reduces vertical mixing, and thus the vertical supply of nutrients in the future. As NO3 concentrations in the NEGSL are already at the limitation level for phytoplankton growth in historical years, according to nutrient uptake kinetics for most phytoplankton (Eppley et al., 1969; Lomas and Gilbert, 2000), even a small future reduction in NO3 is expected to have non-linear impacts on phytoplankton growth.
4.5 Impact of changes in light and sea-ice cover
The projected decline in netPP in the GSL and Scotian Shelf cannot be attributed to changes in shortwave radiations (Figure 2I), particularly photosynthetically available radiation (PAR, Supplementary Figure S2A) in the first model layer of the water column. Although a reduction in shortwave radiations is anticipated in the LSLE and NEGLS (Figure 2F), there is no concurrent reduction in PAR in the first layer (Supplementary Figure S1B). This is due to the compensatory effect of a substantial reduction in sea-ice concentration (Figure 2J). The mixed layer depth (MLD) is shallower than 50 m throughout the region in historical years (Supplementary Figure S6). Even though stratification increases in the future, the MLD decreases in the SGSL and Scotian Shelf, while it increases slightly in the LSLE, NWGSL and NEGSL. However, the changes in MLD are <5 m, and are not significant. Consequently, the alteration in MLD only results in minor changes in mean PAR available for phytoplankton photosynthesis in the surface mixed layer.
Changes in sea-ice concentrations have been reported to influence the phytoplankton bloom phenology in the GSL (Laliberté and Larouche, 2023) and other ice-covered polar oceans (Marchese et al., 2017; Manizza et al., 2023). Due to significant decreases in sea-ice concentration in historically ice-covered regions, such as the LSLE, NWGSL, and SGSL (Figure 2J), the phytoplankton bloom occurs earlier in the future (Figure 11B; Supplementary Table S4) and last longer, except for the LSLE. In our model, light attenuation increases with decreasing salinity, as a representation of turbidity from CDOM and suspended materials from river discharge (Nieke et al., 1997; Le Fouest et al., 2010; Xie et al., 2012; Lavoie et al., 2021). However, the projected increases in river runoff in future years (Figure 6) did not decrease the annual mean PAR in the first layer (0-6 m) of the water column (Supplementary Figure S2). Light limitation due to water turbidity is more critical in spring, when runoff is higher and incident radiations are relatively low. Turbidity associated with increased river runoff may exert a more substantial influence on the timing of phytoplankton bloom and the distribution of netPP than on the annual primary production (Mei et al., 2010). Our results indeed show a slightly delayed bloom in the LSLE (Figure 11B), compensated by a larger peak biomass (Figure 11F). The majority of the NEGSL area is ice free during historical years, except for Mecatina Trough on the NEGSL northern coast close to SBI, where ice concentration decreases significantly in future years (Figure 2J). This reduction in sea-ice concentration accounts for a two-week advancement of the bloom and an eight-day extension in its duration in the future years of the climate change scenario.
In the subarctic North Atlantic, the phytoplankton bloom duration shortens with warming that reduces nutrient supply to the surface mixed layer (Whitt and Jansen, 2020). In contrast, the bloom durations become longer in the GSL, particularly in the NWGSL and SGSL (Figures 11A–F). However, reduced nutrient supply in the GSL in future climate years results in lower biomass of peak phytoplankton bloom (Figure 11F). Longer durations accompany earlier initiation of phytoplankton growth before the daily shortwave radiations reach their peak in June. When shortwave radiations increase toward its peak in June, surface nutrient pool becomes depleted leading to slower growth and a reduced peak of blooms.
The future alterations in the timing, duration, and biomass of the phytoplankton bloom will have important consequences for the match/mismatch dynamics between zooplankton development and phytoplankton bloom, as the development of zooplankton and other grazers at higher trophic levels are more dependent on seasonal temperature signals than on changes in light (e.g., Ouellet et al., 2007; Janout et al., 2016). The potential mismatch between phytoplankton and zooplankton could disrupt the food chain that links primary producers to higher trophic level organisms (Koeller et al., 2009).
4.6 Impact of warming on phytoplankton concentrations
Our results show that the reduction in nutrient supply to the surface layer is the main driver of the projected decline in netPP in the future. Reduction in nutrient supply from upwelling at HLC and net reduction in horizontal input from rivers, and at SBI and CSE combined, account for 19% and 81%, respectively. Figure 10I however shows that diatom concentrations can increase even though netPP is reduced, leading to an increase in the diatoms/flagellate ratio (Figure 10L). This increase in diatom concentration results from a greater mortality of mesozooplankton with warming, as mesozooplankton mortality is formulated as temperature dependent in the model as in Buitenhuis et al. (2006). Consequently, warming reduces the grazing pressure of mesozooplankton on diatoms, particularly in ESS, where temperature increase is the strongest (Figures 2L, 4E; Supplementary Table S2). This formulation demonstrates that the bottom-up effect of warming induces a shift in the community structure by altering top-down grazing dynamics. This version of the model does not incorporate the temperature-dependent growth of phytoplankton and zooplankton (Lavoie et al., 2021). Including a temperature dependence on all physiological processes could slightly modify our results but it is unlikely that the general trend would change since the biomass produced during the spring bloom is largely dependent on the nutrient stock available. During the summer post-bloom season, the growth of phytoplankton becomes primarily nutrient-limited, while zooplankton growth remains food-limited (Lavoie et al., 2021). Though temperature-dependent growth rates can be important during the transition from light-limited to nutrient-limited regimes, Marañón et al. (2018) show that the temperature-sensitivity of phytoplankton metabolic rates is suppressed under nutrient limitation. A recent mesocosm experiment on the effects of warming on primary production in the LSLE suggests that a 5°C increase in temperature enhances maximum daily primary production but does not affect the total primary production integrated over the study period (Benard et al., 2018). Their results suggest that total primary production is constrained by nutrient supply in the LSLE under 5°C warming.
There are uncertainties in temperature-dependent growth of phytoplankton and zooplankton, which may take different forms, depending on the community structure (Rose and Caron, 2007; Anderson et al., 2021) and nutrient limitation (Marañón et al., 2018). A new version of the model that includes various forms of temperature-dependent growth of different plankton groups is under development and will allow us to investigate its impact on primary production projections. However, the present study unequivocally demonstrates the impact of climate change-induced alteration in hydrography, leading to reduced nutrient supplies and subsequent decreases in netPP in the GSL and ESS.
5 Conclusions
This model study projects that the Gulf of St. Lawrence and Scotian Shelf will experience warming, and freshening of surface water under the RCP8.5 climate change scenario. Over the next 60 years, net primary production is projected to decrease by roughly 13.4% (varying from 7.4% to 20.5%) across the model domain. Consequently, zooplankton production is expected to decline by 10%. The primary drivers of these ecosystem changes are the reduced nutrient input from the Strait of Belle Isle and eastern Cabot Strait, as well as the reduced vertical supply of nutrients to the upper layer resulting from the increased stratification. Even though the riverine nutrient supply is expected to increase with higher runoff, that is insufficient to offset the combined reductions in nutrient supply from the upwelling at the head of Laurentian Channel and from the Labrador Current via the Strait of Belle Isle and the eastern Cabot Strait. These changes at the straits are manifestations of the impact of large-scale ocean circulation changes resulting from climate change on the supply of nutrients, heat and salt to the Gulf of St. Lawrence and Scotian Shelf. In the Gulf of St. Lawrence, surface warming is not the only contributor to the increasing stratification. However, warming reduces sea-ice concentration in winter-spring, and significantly affects the timing and duration of the phytoplankton bloom in the GSL in the future climate scenario.
The findings of this study unequivocally showcase the impact of climate change on primary and secondary productions, driven by alterations in ice cover and hydrography in the GSL and Scotian Shelf. The Gulf of St. Lawrence and Scotian Shelf are complex estuarine and shelf sea systems, characterized by heterogenous biogeochemical processes that elicit, under the RCP8.5 climate change scenario, varied responses in net primary production across distinct areas. The effects of net primary production declines will be amplified at the higher trophic levels (Kwiatkowski et al., 2019). Therefore, the significant reduction in biological production expected at the end of this century, in the SGSL, NEGSL, and ESS will likely negatively impact fisheries production in these areas. Additional projections will be produced with temperature-dependent phytoplankton and zooplankton growth included, as well as with forcing from additional Earth System Models and with output from the more recent CMIP experiment to have an ensemble of projections and strengthen our confidence in the projected net primary production in future climate scenarios.
Data availability statement
The raw data supporting the conclusions of this article will be made available by the authors, without undue reservation.
Author contributions
Z-PM: Data curation, Formal analysis, Investigation, Methodology, Validation, Visualization, Writing – original draft, Writing – review & editing. DL: Conceptualization, Funding acquisition, Investigation, Methodology, Project administration, Resources, Supervision, Validation, Writing – review & editing. NL: Methodology, Software, Writing – review & editing. MS: Conceptualization, Funding acquisition, Writing – review & editing. JC: Conceptualization, Funding acquisition, Methodology, Writing – review & editing. WP: Conceptualization, Data curation, Funding acquisition, Writing – review & editing. ZL: Conceptualization, Data curation, Writing – review & editing.
Funding
The author(s) declare financial support was received for the research, authorship, and/or publication of this article. Funding support, granted to DL, was provided by the Fisheries and Oceans Canada (DFO) Competitive Science Research Fund (CSRF; project code 21-CC-01-01).
Acknowledgments
Jacqueline Dumas corrected English text in a previous version of the manuscript. Olivier Riche provided technical support for model simulation. Catherine Brennan and David Brickman provided valuable comments that improved the manuscript. Critical and constructive comments from the two reviewers and Associate Editor Dr. Shin-ichi Ito contributed to the improvement of the manuscript.
Conflict of interest
The authors declare that the research was conducted in the absence of any commercial or financial relationships that could be construed as a potential conflict of interest.
Publisher’s note
All claims expressed in this article are solely those of the authors and do not necessarily represent those of their affiliated organizations, or those of the publisher, the editors and the reviewers. Any product that may be evaluated in this article, or claim that may be made by its manufacturer, is not guaranteed or endorsed by the publisher.
Supplementary material
The Supplementary Material for this article can be found online at: https://www.frontiersin.org/articles/10.3389/fmars.2024.1416744/full#supplementary-material
Supplementary Figure 1 | The extended map showing the surrounding regions of the model and currents that influence the hydrography in the model domain. LC: main Labrador Current, and its inner branch, and extensions (blue) that flows into the GSL via the Strait of Belle Isle and Cabot Strait (Figure 1). GS: Gulf stream, and the warm Atlantic water derived from GS that reaches the depth of Cabot Strait (red). GSPC: Gaspé current. The warm Atlantic water and LC mix at the shelf break (SB) before entering the Laurentian Channel at the depth and flows upstream toward the head of Laurentian Channel (green). MT: Mecatina Trough.
Supplementary Figure 2 | Photosynthetically available radiation (PAR, w m−2) in the upper layer (0-50 m) of the water column averaged for historical period years (2001-2020, left) and changes in future climate years (2071-2090), from historical period. Areas with dots indicate grid cells where the change (Future – Historical) is significant (right).
Supplementary Figure 3 | Time series of nitrate (NO3) concentration (top row), and temperature and salinity (bottom row) averaged over 0-75 m across the Strait of Belle Isle transect (a, d), 0-50 m at East Cabot Strait transect (CSE) (b, e), and 150-300 m at CSE (c, f). The dashed lines on each panel are trend lines for NO3 (blue), salinity (blue), and temperature (red) with their respective slopes, and their lower and upper limits of 95% confidence interval in the parenthesis, indicated.
Supplementary Figure 4 | Density trends for three depth layers, 0-50 m, 50-150 m, and 150-300 m, of the water column in five subregions of the Gulf of St. Lawrence (GSL) and the Scotian Shelf: a) The Lower St. Lawrence estuary (LSLE), b) northwest Gulf of St. Lawrence (NWGSL), c) northeast Gulf of St. Lawrence (NEGSL), d) southern Gulf of St. Lawrence (SGSL), and e) eastern Scotian Shelf (ESS). The trend lines (solid) obtained from least squares linear regression are superimposed, and their respective slopes in density change per decade, with their lower and upper limits of 95% confidence interval in the parenthesis, are displayed at the top of each panel.
Supplementary Figure 5 | Time series of annual mean nitrate (NO3) at three depth layers, 0-50 m, 50-150 m, and 150-300 m, for five regions of the Gulf of St. Lawrence (GSL) and Scotian Shelf: a) The Lower St. Lawrence estuary (LSLE), b) northwest Gulf of St. Lawrence (NWGSL), c) northeast Gulf of St. Lawrence (NEGSL), d) southern Gulf of St. Lawrence (SGSL), and e) eastern Scotian Shelf (ESS). The trends are indicated by the superimposed straight lines for each depth layer. Their respective slopes, and their lower and upper limits of 95% confidence interval in the parenthesis, are labelled on top of each panel.
Supplementary Figure 6 | Mixed layer depth (MLD) defined as the depth where the density is 0.25 kg m−3 more than at surface, for historical years (2001-2020, left), and the difference between future (2071-2090) and historical years (right).
Supplementary Figure 7 | Mean regional circulation in the historical period (2001-2020, a) and the difference between future (2071-2090) and historical years (b). The arrows indicate the direction of the current, and the color contour is the mean velocity in the 0-50 m depth layer averaged over the period.
Supplementary Table 1 | Nutrient input (mean ± std) from upwelling at the Head of Laurentian Channel (HLC), the fluxes across the transects of strait of Belle Isle (SBI), and east Cabot strait (CSE) of the upper water column, 0-50 m, during historical (2001-2020) and future (2071-2090) years.
Supplementary Table 2 | Changes in physical variables from historical (2001-2020) to future (2071-2090) years in selected regions, as indicated in Figure 1.
Supplementary Table 3 | Changes in mean values of biogeochemical variables for selected regions from historical (2001-2020) to future (2071-2090) years.
Supplementary Table 4 | Timing of phytoplankton bloom and mean primary and secondary production in selected regions, for historical (2001-2020) and future (2071-2090) years.
References
Alexander M. A., Shin S., Scott J. D., Curchister E., Stock C. (2020). The response of the Northwest Atlantic Ocean to climate change. J. Clim. 33, 405–428. doi: 10.1175/JCLI-D-19-0117.1
Allen M. R., Dube O. P., Solecki W., Aragón-Durand F., Cramer W., Humphreys S., et al. (2018). “Framing and Context,” in Global Warming of 1.5°C. An IPCC Special Report on the impacts of global warming of 1.5°C above pre-industrial levels and related global greenhouse gas emission pathways, in the context of strengthening the global response to the threat of climate change, sustainable development, and efforts to eradicate poverty. Eds. Masson-Delmotte V., Zhai P., Pörtner H.-O., Roberts D., Skea J., Shukla P. R., Pirani A., Moufouma-Okia W., Péan C., Pidcock R., Connors S., Matthews J. B. R., Chen Y., Zhou X., Gomis M. I., Lonnoy E., Maycock T., Tignor M., Waterfield T. (Cambridge University Press, Cambridge, UK and New York, NY, USA), 49–92. doi: 10.1017/9781009157940.003
Anderson S. I., Barton A. D., Clayton S., Dutkiewicz S., Rynearson T. (2021). Marine phytoplankton functional types exhibit diverse responses to thermal change. Nat. Comm 12, 1–9. doi: 10.1038/s41467-021-26651-8
Araujo C. A. S., Belanger S. (2022). Variability of bio-optical properties in nearshore waters of the estuary and Gulf of St. Lawrence: absorption and backscattering coefficients. Estuar. Coast. Shelf Sci. 264, 107688. doi: 10.1016/j.ecss.2021.107688
Austin A. M., Bisagni J. J., Schmidt A. (2019). Inter-annual variability of shelf water volume on the northeastern Canadian and United States Continental Shel 1973-2017. Continent. Shelf Res. 187, 103962. doi: 10.1016/j.csr.2019.103962
Benard R., Levasseur M., Scarratt M., Blais M.-A., Mucci A., Gerreyra G., et al. (2018). Experimental assessment of the sensitivity of an estuarine phytoplankton fall bloom to acidification and warming. Biogeosciences 15, 4883–4904. doi: 10.5194/bg-15-4883-2018
Blais M., Galbraith P. S., Plourde S., Devred E., Clay S., Lehoux C., et al. (2021). Chemical and biological oceanographic conditions in the estuary and gulf of st. Lawrence during 2020. DFO Can. Sci. Advis. Sec. Res. Doc. 060, +67p.
Brickman D., Drozdowski A. (2012). Development and validation of a regional shelf model for Maritime Canada based on the NEMO-OPA circulation model. Can. Tech. Rep. Hydrogr. Ocean Sci. 278, vii + 57.
Brickman D., Hebertz D., Wang Z. (2018). Mechanism for the recent ocean warming events on the Scotian Shelf of eastern Canada. Cont. Shelf Res. 156, 11–22. doi: 10.1016/j.csr.2018.01.001
Brickman D., Wang Z., DeTracey B. (2015). Variability of current streams in Atlantic Canadian Waters: a model study. Atmosphere-Ocean 54, 218–229. doi: 10.1080/07055900.2015.1094026
Bryndum-Buchholz A., Boyce D. G., Tittensor D. P., Christensen V., Bianchi D., Lotze H. K. (2020). Climate-change impacts and fisheries management challenges in the North Atlantic Ocean. Mar. Ecol. Prog. Ser. 648, 1–17. doi: 10.3354/meps13438
Buitenhuis E., Le Quéré C., Aumont O., Beaugrand G., Bunker A., Hirst A., et al. (2006). Biogeochemical fluxes through mesozooplankton. Global Biogeochemical Cycles 20, GB2003. doi: 10.1029/2005GB002511
Burbank J., DeJong R. A., Turcotte F., Rolland N. (2023). Understanding factors influencing Atlantic herring (Clupea harengus) recruitment: From egg deposition to juveniles. Fisheries Oceanography 32, 147–159. doi: 10.1111/fog.12621
Capotondi A., Alexander M. A., Bond N. A., Curchitser E. N., Scott J. D. (2012). Enhanced upper ocean stratification with climate change in the CMIP3 models. J. Geophys. Res. 117, 2011JC007409. doi: 10.1029/2011JC007409
Chadwick M., Sinclair A. (1991). "Fisheries production in the Gulf of St. Lawrence,". in The Gulf of St. Lawrence: small ocean or big estuary? Therriault J.-H. (Ed.), 113, 125–136.
Claret M., Galbraith E. D., Palter J. B., Bianchi D., Fennel K., Gilbert D., et al. (2018). Rapid coastal deoxygenation due to ocean circulation shift in the northwest Atlantic. Nat. Climate Change 8, 868–872. doi: 10.1038/s41558-018-0263-1
Coote A., Yeats P. (1979). Distribution of nutrients in the gulf of st. Lawrence. J. Fish. Bd. Can. 36, 122–131. doi: 10.1139/f79-021
Cyr F., Bourgault D., Galbraith P. S., Gosselin M. (2015). Turbulent nitrate fluxes in the Lower St. Lawrence Estuary, Canada. J. Geophys. Res. Oceans 120, 2308–2330. doi: 10.1002/2014JC010272
Dever M., Hebert D., Greenan B. J. W., Sheng J., Smith P. C. (2016). Hydrography and coastal circulation along the Halifax Line and the connections with the Gulf of St. Lawrence. Atmos.-Ocean. 54, 199–217. doi: 10.1080/07055900.2016.1189397
DFO. (1996). The Gulf of St. Lawrence Overview. Atlantic Fisheries, Stock Status Report 96/50. Available online at: https://waves-vagues.dfo-mpo.gc.ca/library-bibliotheque/196768.pdf.
Doherty J. M., Williams B., Kline E., Adey W., Thibodeau B. (2021). Climate-modulated nutrient conditions along the Labrador Shelf: evidence from nitrogen isotopes in a six-hundred-year-old crustose coralline alga. Paleoceanogr. Paleoclimat 36, e2020PA004149. doi: 10.1029/2020PA004149
Doyon P., Ingram R. G. (2000). Seasonal upper-layer T-S structure in the Gulf of St. Lawrence during the ice-free months. Deep-Sea Res. Part II: Topical Stud. Oceanography 47, 385–413. doi: 10.1016/S0967-0645(99)00112-5
Drinkwater K. F., Gilbert D. (2004). Hydrographic variability in the waters of the Gulf of St. Lawrence, the Scotian Shelf and the eastern Gulf of Maine (NAFO Subarea 4) during 1991-2000. J. Northwest Atlantic. Fish. Sci. 34, 85–101. doi: 10.2960/J.v34.m545
Eppley R. W., Rogers J. N., McCarthy J. J. (1969). Half-saturation constants for uptake of nitrate and ammonium by marine phytoplankton. Limnol. Oceanogr. 14, 912–920. doi: 10.4319/lo.1969.14.6.0912
Fox-Kemper B., Hewitt H. T., Xiao C., Aðalgeirsdóttir G., Drijfhout S. S., Edwards T. L., et al. (2021). “Ocean, Cryosphere and Sea Level Change,” in Climate Change 2021: The Physical Science Basis. Contribution of Working Group I to the Sixth Assessment Report of the Intergovernmental Panel on Climate Change. Eds. Masson-Delmotte V., Zhai P., Pirani A., Connors S. L., Péan C., Berger S., Caud N., Chen Y., Goldfarb L., Gomis M. I., Huang M., Leitzell K., Lonnoy E., Matthews J. B. R., Maycock T. K., Waterfield T., Yelekçi O., Yu R., Zhou B. (Cambridge University Press, Cambridge, United Kingdom and New York, NY, USA), 1211–1362. doi: 10.1017/9781009157896.011
Friedlingstein P., O’sullivan M., Jones M. W., Andrew R. M., Gregor L., Hauck J., et al. (2022). Global carbon budget 2022. Earth Syst. Sci. Data 14, 4811–4900. doi: 10.5194/essd-14-4811-2022
Fu W., Randerson J. T., Moore J. K. (2016). Climate change impacts on net primary production (NPP) and export production (EP) regulated by increasing stratification and phytoplankton community structure in the CMIP5 models. Biogeoscience 13, 5151–5170. doi: 10.5194/bg-13-5151-2016
Galbraith P. S., Chassé J., Shaw J.-L., Dumas J., Caverhill C., Lefaivre D., et al. (2021). Physical oceanographic conditions in the gulf of st. Lawrence during 2020. DFO Can. Sci. Advis. Sec. Res. Doc., iv + 81.
Galbraith P. S., Larouche P., Chassé J., Petrie B. (2012). Sea-surface temperature in relation to air temperature in the Gulf of St. Lawrence: Interdecadal variability and long term trends. Deep Sea Res. Part II: Topical Stud. Oceanography 77–80, 10–20. doi: 10.1016/j.dsr2.2012.04.001
Gilbert D., Sundby B., Gobeil C., Mucci A., Tremblay G. H. (2005). A seventy-two-year record of diminishing deep-water oxygen in the St. Lawrence estuary: The northwest Atlantic connection. Limnol. Oceanogr. 50, 1654–1666. doi: 10.4319/lo.2005.50.5.1654
Giorgetta M. A., Jungclaus J., Reick C. H., Legutke S., Bader J., Böttinger M., et al. (2013). Climate and carbon cycle changes from 1850 to 2100 in MPI-ESM simulations for the Coupled Model Intercomparison Project phase 5. J. Adv. Model. Earth Syst. 5, 572–597. doi: 10.1002/jame.20038
Goyette J.-O., Bennett E. M., Howarth R. W., Maranger R. (2016). Changes in anthropogenic nitrogen and phosphorus inputs to the St. Lawrence sub-basin over 110 years and impacts on riverine export. Global Biogeochemical Cycles 30, 1000–1014. doi: 10.1002/2016GB005384
Greisman P., Ingram G. (1977). Nutrient distribution in the St. Lawrence estuary. J. Fish. Res. Board Can. 34, 2117–2123. doi: 10.1139/f77-278
Guo L., Perrie W., Long Z., Chassé J., Zhang Y., Huang A. (2013). Dynamical downscaling over the Gulf of St. Lawrence using the Canadian Regional Climate Model. Atmos.-Ocean 51, 265–283. doi: 10.1080/07055900.2013.798778
Han G., Loder J. W., Smith P. C. (1999). Seasonal-mean hydrography and circulation in the Gulf of St. Lawrence and on the eastern Scotian and southern Newfoundland shelves. J. Phys. Oceanogr. 29, 1279–1301. doi: 10.1175/1520-0485(1999)029<1279:SMHACI>2.0.CO;2
Henson S. A., Laufkötter C., Leung S., Giering S. L. C., Palevsky H. I., Cavan E. L. (2022). Uncertain response of ocean biological carbon export in a changing world. Nat. Geosci. 15, 248–254. doi: 10.1038/s41561-022-00927-0
Holt J., Schrum C., Cannaby H., Daewel U., Allen I., Artioli Y., et al. (2016). Potential impacts of climate change on the primary production of regional seas: a comparative analysis of five European seas. Prog. Oceanogr. 140, 91–115. doi: 10.1016/j.pocean.2015.11.004
Janout M. A., Hölemann J., Waite A. M., Krumpen T., von Appen W. J., Martynov F. (2016). Sea-ice retreat controls timing of summer plankton blooms in the Eastern Arctic Ocean. Geophys. Res. Let. 43, 12493–12501. doi: 10.1002/2016GL071232
Jungclaus J. H., Keenlyside N., Botzet M., Haak H., Luo J. J., Latif M., et al. (2006). Ocean circulation and tropical variability in the coupled model ECHAM5/MPI-OM. J. Clim. 19, 3952–3972. doi: 10.1175/JCLI3827.1
Jutras M., Dufour C. O., Mucci A., Cyr F., Gilbert D. (2020). Temporal changes in the causes of the observed oxygen decline in the St. Lawrence Estuary. J. Geophys. Res.-Oceans 125, e2020JC016577. doi: 10.1029/2020JC016577
Jutras M., Dufour C. O., Mucci A., Talbot L. C. (2023). Large-scale control of the retroflection of the Labrador Current. Nat. Commun. 14, 2623. doi: 10.1038/s41467-023-38321-y
Jutras M., Mucci A., Sundby B., Gratton Y., Katsev S. (2020a). Nutrient cycling in the Lower St. Lawrence Estuary: Response to environmental perturbations. Est. Coast. Shelf Sci. 239, 106715. doi: 10.1016/j.ecss.2020.106715
Kalnay E., Kanamitsu M., Kistler R., Collins W., Deaven D., Gandin L., et al. (1996). The NCEP/NCAR 40-Year reanalysis project. Bull. Amer. Meteorol. Soc 77, 437–472. doi: 10.1175/1520-0477(1996)077<0437:TNYRP>2.0.CO;2
Koeller P., Fuentes-Yaco C., Platt T., Sathyendranath S., Richards A., Ouellet P., et al. (2009). Basin-scale coherence in phenology of shrimps and phytoplankton in the North Atlantic ocean. Science 324, 791–793. doi: 10.1126/science.1170987
Koutitonsky V. G., Budgen G. L. (1991). The physical oceanography of the Gulf of St. Lawrence: a review with emphasis on the synoptic variability of the motion. Can. Spec. Publ. Fish. Aquat. Sci. 113, 57–90.
Kwiatkowski L., Aumont O., Bopp L. (2019). Consistent trophic amplification of marine biomass declines under climate change. Global Change Biol. 25, 218–229. doi: 10.1111/gcb.14468
Kwiatkowski L., Bopp L., Aumont O., Ciais P., Cox P. M., Laufkötter C., et al. (2017). Emergent constraints on projections of declining primary production in the tropical oceans. Nat. Climate Change 7, 355–358. doi: 10.1038/nclimate3265
Kwiatkowski L., Torres O., Bopp L., Aumont O., Chamberlain M., Christian J. R., et al. (2020). Twenty-first century ocean warming, acidification, deoxygenation, and upper-ocean nutrient and primary production decline from CMIP6 model projections. Biogeosciences 17, 3439–3470. doi: 10.5194/bg-17-3439-2020
Laliberté J., Larouche P. (2023). Chlorophyll-a concentration climatology, phenology, and trends in the optically complex waters of the St. Lawrence Estuary and Gulf. J. Mar. Syst. 238, 103830. doi: 10.1016/j.jmarsys.2022.103830
Lambert N., Chasse J., Perrie W., Long Z., Morrison J. (2013). Projection of future river runoffs in Eastern Atlantic Canada from global and regional climate models. Can. Tech. Rep. Hydrogr. And Ocean Sci. 288, viii + 34.
Laurent A., Fennel K., Kuhn A. (2021). An observation-based evaluation and ranking of historical Earth system model simulations in the northwest North Atlantic Ocean. Biogeosciences 18, 1803–1822. doi: 10.5194/bg-18-1803-2021
Lavoie D., Chasse J., Simard Y., Lambert N., Galbraith P. S., Roy N., et al. (2016). Large-scale atmospheric and oceanic control on krill transport into the St. Lawrence Estuary evidenced with three-dimensional numerical modelling. Atmosphere-Ocean 54, 299–325. doi: 10.1080/07055900.2015.1082965
Lavoie D., Gilson G., Chassé J., Lambert N., B.-Brunelle C., Starr M., et al. (2017). Impacts of freshwater flow regulation of Quebec’s large rivers on the physical environment and krill transport in the Gulf of St. Lawrence and on the Scotian Shelf. Can. Tech. Rep. Hydrogr. Ocean Sci., xii + 101.
Lavoie D., Lambert N., Gilbert D. (2019). Projections of future trends in biogeochemical conditions in the Northwest Atlantic using CMIP5 Earth System Models. Atmosphere-Ocean 57, 18–40. doi: 10.1080/07055900.2017.1401973
Lavoie D., Lambert N., Mustapha S. B., van der Baaren A. (2013). Projections of future physical and biogeochemical conditions in the northwest Atlantic from CMIP5 global climate models. Can. Tech. Rep. Hydrogr. Ocean Sci. 285, xiv + 156.
Lavoie D., Lambert N., Rousseau S., Dumas J., Chassé J., Long Z., et al. (2020). Projections of future physical and biogeochemical conditions in the Gulf of St. Lawrence, on the Scotian Shelf and in the Gulf of Maine using a regional climate model. Can. Tech. Rep. Hydrogr. Ocean Sci. 334, xiii + 102.
Lavoie D., Lambert N., Starr M., Chassé J., Riche1 O., Le Clainche Y., et al. (2021). The Gulf of St. Lawrence biogeochemical model: a modelling tool for fisheries and ocean management. Front. Mar. Sci. 8. doi: 10.3389/fmars.2021.732269
Lavoie D., Simard Y., Saucier F. J. (2000). Aggregation and dispersion of krill at channel heads and shelf edges: the dynamics in the Saguenay - St. Lawrence Marine Park. Can. J. Fish. Aquat. Sci. 57 (9), 1853–1869. doi: 10.1139/f00-138
Lavoie D., Starr M., Zakardjian B., Larouche P. (2008). Identification of Ecologically and Biologically Significant Areas (EBSA) in the Estuary and Gulf of St. Lawrence: Primary Production. DFO Can. Sci. Adv. Secret. Res. Doc. 2007/079 (Ottawa, ON: Fisheries and Oceans Canada Canadian Science Advisory Secretariat). Available at: https://waves-vagues.dfo-mpo.gc.ca/library-bibliotheque/334644.pdf.
Le Fouest V., Zakardjian B., Saucier F. (2010). Plankton ecosystem response to freshwater-associated bulk turbidity in the subarctic Gulf of St. Lawrence (Canada): a modelling study. J. Mar. Syst. 81, 75–85. doi: 10.1016/j.jmarsys.2009.12.003
Le Fouest V., Zakardjian B., Saucier F. J., Starr M. (2005). Seasonal versus synoptic variability in planktonic production in a high-latitude marginal sea: The Gulf of St. Lawrence (Canada). J. Geophys. Res. Oceans 110, 1–21. doi: 10.1029/2004JC002423
Lehmann N., Reed D. C., Buchwald C., Lavoie D., Yeats P. A., Mei Z.-P., et al. (2023). Decadal variability in subsurface nutrient availability on the Scotian Shelf reflects changes in the northwest Atlantic Ocean. J. Geophys. Res.-Ocean 128, e2023JC019928. doi: 10.1029/2023JC019928
Levasseur M., Therriault J.-C., Legendre L. (1984). Hierarchical control of phytoplankton succession by physical factors. Mar. Ecol. Prog. Ser. 19, 211–222. doi: 10.3354/meps019211
Lomas M. W., Gilbert P. M. (2000). Comparisons of nitrate uptake, storage, and reduction in marine diatoms and flagellates. J. Phycol. 36, 903–913. doi: 10.1046/j.1529-8817.2000.99029.x
Long Z., Perrie W., Chassé J., Brickman D., Guo L., Drozdowski A., et al. (2015). Impacts of climate change in the Gulf of St. Lawrence. Atmosphere-Ocean 54, 337–351. doi: 10.1080/07055900.2015.1029869
Lotze H. K., Tittensor D. P., Bryndum-Buchholz A., Eddy T. D., Cheung W. W. L., Galbraith E. D., et al. (2019). Global ensemble projections reveal trophic amplification of ocean biomass declines with climate change. Proc. Nation. Acad. Sci. U.S.A. 116, 12907–12912. doi: 10.1073/pnas.1900194116
Manizza M., Carroll D., Menemenlis D., Zhang H., Miller C. E. (2023). Modeling the recent changes of phytoplankton blooms dynamics in the Arctic Ocean. J. Geophys. Res.: Oceans 128, e2022JC019152. doi: 10.1029/2022JC019152
Marañón E., Cermeño P., Latasa M., Tadonleke R. D. (2012). Temperature, resources, and phytoplankton size structure in the ocean. Limnol. Oceanogr. 57, 1266–1278. doi: 10.4319/lo.2012.57.5.1266
Marañón E., Lorenzo M. P., Cermeño P., Mouriño-Carballido B. (2018). Nutrient limitation suppresses the temperature dependence of phytoplankton metabolic rates. ISME J. 12, 1836–1845. doi: 10.1038/s41396-018-0105-1
Marchese C., Albouy C., Tremblay J.-É., Dumont D., D’Ortenzio F., Vissault S., et al. (2017). Changes in phytoplankton bloom phenology over the North Water (NOW) polynya: a response to changing environmental conditions. Pol. Biol. 40, 1721–1737. doi: 10.1007/s00300-017-2095-2
Marshak A. R., Link J. S. (2021). Primary production ultimately limits fisheries economic performance. Sci. Rep. 11, 12154. doi: 10.1038/s41598-021-91599-0
Mei Z.-P., Saucier F. J., Le Fouest V., Zakardjian B., Sennville S., Xie H., et al. (2010). Modeling the timing of spring phytoplankton bloom and biological production of the Gulf of St. Lawrence (Canada): Effects of colored dissolved organic matter and temperature. Continent. Shelf Res. 30, 2027–2042. doi: 10.1016/j.csr.2010.10.003
Nakamura Y., Oka A. (2019). CMIP5 model analysis of future changes in ocean net primary production focusing on differences among individual oceans and models. J. Oceanogr. 75, 441–462. doi: 10.1007/s10872-019-00513-w
Nieke B., Reuter R., Heuermann R., Wang H., Babin M., Therriault J. C. (1997). Light absorption and fluorescence properties of chromophoric dissolved organic matter (CDOM), in the St. Lawrence Estuary (Case 2 waters). Cont. Shelf Res. 17, 235–252. doi: 10.1016/S0278-4343(96)00034-9
Oschlies A., Kähler P. (2004). Biotic contribution to air-sea fluxes of CO2 and O2 and its relation to new production, export production, and net community production. Global Biogeochemical Cycles 18, GB10.15. doi: 10.1029/2003GB002094
Ouellet P., Savard L., Larouche P. (2007). Spring oceanographic conditions and northern shrimp Pandalus borealis recruitment success in the north-western Gulf of St. Lawrence. Mar. Ecol. Prog. Ser. 339, 229–241. doi: 10.3354/meps339229
Petrie B., Drinkwater K. (1993). Temperature and salinity variability on the Scotian Shelf and in the Gulf of Maine 194-1990. J. Geophys. Res.-Ocean 98, 20079–20089. doi: 10.1029/93JC02191
Petrie B., Yeats P. (2000). Annual and interannual variability of nutrients and their estimated fluxes in the Scotian Shelf-Gulf of Maine region. Can. J. Fish. Aquat. Sci. 57, 2536–2546. doi: 10.1139/f00-235
Raven J. A., Beardall J. (2021). Influence of global environmental change on plankton. J. Plankton Res. 43, 779–800. doi: 10.1093/plankt/fbab075
Rivkin R. B., Legendre L., Deibel D., Tremblay J. E., Klein B., Crocker K., et al. (1996). Vertical flux of biogenic carbon in the ocean: Is there food web control? Science 272, 1163–1166. doi: 10.1126/science.272.5265.1163
Rose J. M., Caron D. A. (2007). Does low temperature constrain the growth rates of heterotrophic protists? Evidence and implications for algal blooms in cold waters. Limnol. Oceanogr. 52, 886–895. doi: 10.4319/lo.2007.52.2.0886
Saba V. S., Griffies S. M., Anderson W. G., Winton M., Alexander M. A., Delworth T. L., et al. (2016). Enhanced warming of the Northwest Atlantic Ocean under climate change. J. Geophys. Res.- Oceans 121, 118–132. doi: 10.1002/2015JC011346
Saucier F. J., Roy F., Gilbert D. (2003). Modelling the formation and circulation processes of water masses and sea-ice in the Gulf of St. Lawrence, Canada. J. Geophys. Res.-Ocean 108, 3269. doi: 10.1029/2000JC000686
Savenkoff C., Vézina A. F., Smith P. C., Han G. (2001). Summer transports of nutrients in the gulf of St. Lawrence estimated by inverse modelling. Est. Coast. Shelf Sci. 52, 565–587. doi: 10.1006/ecss.2001.0774
Seidov D., Mishonov A., Parsons R. (2021). Recent warming and decadal variability of Gulf of Maine and Slope Water. Limnol. Oceanogr. 66, 3472–3488. doi: 10.1002/lno.11892
Seitzinger S. P., Harrison J. A. (2008). “Land-based nitrogen sources and their delivery to coastal systems,” in Nitrogen in the marine environment, 2nd edition. Eds. Capone D. G., Bronk D. A., Mulholland M. R., Carpenter E. J. (Elsevier, Amsterdam), 469–510.
Sheng J. (2001). Dynamics of a buoyancy-driven coastal jet: The Gaspé Current. J. Phys. Oceanogr. 31, 3146–3162. doi: 10.1175/1520-0485(2001)031<3146:DOABDC>2.0.CO;2
Smeed D. A., Josey S. A., Beaulieu C., Johns W. E., Moat B. I., Frajka-Williams E., et al. (2018). The North Atlantic Ocean is in a state of reduced overturning. Geophys. Res. Let. 45, 1527–1533. doi: 10.1002/2017GL076350
Stadnyk T. A., Déry S. J. (2021). Canadian continental-scale hydrology under a changing climate: A review. Water (Switzerland) 13, 906. doi: 10.3390/w13070906
Stadnyk T. A., Tefs A., Broesky M., Déry S. J., Myers P. G., Ridenour N. A., et al. (2021). Changing freshwater contributions to the Arctic: A 90-year trend analysis, (1981- 2070). Elementa 9 (1). doi: 10.1525/elementa.2020.00098
Steven D. M. (1974). “Primary and secondary production in the gulf of St. Lawrence,” in Marine Science Centre Manuscript, Report No. 26 (Montreal, Canada: McGill University).
Stock C. A., John J. G., Rykaczewski R. R., Asch R. G., Cheung W. W. L., Dunne J. P., et al. (2017). Reconciling fisheries catch and ocean productivity. Proc. Nation. Acad. Sci. U.S.A. 114, E1441–E1449. doi: 10.1073/pnas.1610238114
Takahashi T., Sutherland S. C., Sweeney C., Poisson A., Metzl N., Tilbrook B., et al. (2002). Global sea-air CO2 flux based on climatological surface ocean pCO2, and seasonal biological and temperature effects. Deep-Sea Res. Part II: Topical Stud. Oceanogr. 49, 1601–1622. doi: 10.1016/S0967-0645(02)00003-6
Townsend D. W., Rebuck N. D., Thomas M. A., Karp-Boss L., Gettings R. M. (2010). A changing nutrient regime in the Gulf of Maine. Cont. Shelf Res. 30, 820–832. doi: 10.1016/j.csr.2010.01.019
Townsend D. W., Thomas A. C., Mayer L. M., Thomas M. A., Quinlan J. A. (2006). “Chapter 5: Oceanography of the Northwest Atlantic continental shelf,” in The Sea. Eds. Robinson A. R., Brink K. H. (Cambridge, Massachusetts, USA: Harvard University Press), 119–168.
van Vuuren D. P., Edmonds J., Kainuma M., Riahi K., Thomson A., Hibbard K., et al. (2011). The representative concentration pathways: An overview. Climatic Change 109, 5–31. doi: 10.1007/s10584-011-0148-z
Vissio G., Lembo V., Lucarini V., Ghil M. (2020). Evaluating the performance of climate models based on Wasserstein Distance. Geophys. Res. Lett. 47, e2020GL089385. doi: 10.1029/2020GL089385
Wang Z., Brickman D., Greenan B. J. W. (2019). Characteristic evolution of the Atlantic Meridional Overturning Circulation from 1990 to 2015: An eddy-resolving ocean model study. Deep-Sea Res. Part I: Oceanogr. Res. Papers 149, 103056. doi: 10.1016/j.dsr.2019.06.002
Wang Z., Yang J., Johnson C., DeTracey B. (2022). Changes in deep ocean contribute to a “see-sawing” Gulf Stream path. Geophys. Res. Let. 49, e2022GL100937. doi: 10.1029/2022GL100937
Whitt D. B., Jansen M. F. (2020). Slower nutrient stream suppresses Subarctic Atlantic Ocean biological productivity in global warming. Proc. Nation. Acad. Sci. U.S.A. 7, 15504–15510. doi: 10.1073/pnas.2000851117
Xie H., Aubry. C., Belanger S., Song G. (2012). The dynamics of absorption coefficients of CDOM and particles in the St. Lawrence estuarine system: biogeochemical and physical implications. Mar. Chem. 128/129, 44–56. doi: 10.1016/j.marchem.2011.10.001
Zakardjian B. A., Gratton Y., Vézina A. F. (2000). Late spring phytoplankton bloom in the Lower St. Lawrence Estuary: The flushing hypothesis revisited. Mar. Ecol. Prog. Ser. 192, 31–48. doi: 10.3354/meps192031
Zhai L., Platt T., Tang C., Sathyendranath S., Walls R. H. (2011). Phytoplankton phenology on the scotian shelf. ICES J. Mar. Sci. 68, 781–791. doi: 10.1093/icesjms/fsq175
Zhang J., Weijer W., Steele M., Cheng W., Verma T., Veneziani M. (2021). Labrador Sea freshening linked to Beaufort Gyre freshwater release. Nat. Commun. 12, 1229. doi: 10.1038/s41467-021-21470-3
Keywords: climate change, Gulf of St. Lawrence, Eastern Scotian Shelf, primary production, nutrient supply, estuarine circulation, river runoff
Citation: Mei Z-P, Lavoie D, Lambert N, Starr M, Chassé J, Perrie W and Long Z (2024) Modelling the bottom-up effects of climate change on primary production in the Gulf of St. Lawrence and eastern Scotian Shelf. Front. Mar. Sci. 11:1416744. doi: 10.3389/fmars.2024.1416744
Received: 13 April 2024; Accepted: 05 July 2024;
Published: 15 August 2024.
Edited by:
Shin-ichi Ito, The University of Tokyo, JapanReviewed by:
Sonja Maria Van Leeuwen, Royal Netherlands Institute for Sea Research (NIOZ), NetherlandsDavid Rivas, University of Bergen, Norway
Copyright © 2024 His Majesty the King in Right of Canada as represented by Fisheries and Oceans Canada. This is an open-access article distributed under the terms of the Creative Commons Attribution License (CC BY). The use, distribution or reproduction in other forums is permitted, provided the original author(s) and the copyright owner(s) are credited and that the original publication in this journal is cited, in accordance with accepted academic practice. No use, distribution or reproduction is permitted which does not comply with these terms.
*Correspondence: Diane Lavoie, RGlhbmUuTGF2b2llQGRmby1tcG8uZ2MuY2E=