 Carla Chevillard
 Mélanie Juza
 Lara Díaz-Barroso
 Emma Reyes
 Romain Escudier
 Joaquín Tintoré
95% of researchers rate our articles as excellent or good
Learn more about the work of our research integrity team to safeguard the quality of each article we publish.
Find out more
ORIGINAL RESEARCH article
Front. Mar. Sci. , 27 September 2024
Sec. Ocean Observation
Volume 11 - 2024 | https://doi.org/10.3389/fmars.2024.1416486
The Argo array of profiling floats has considerably increased the observing capability of the three-dimensional global ocean and the knowledge of the ocean response to climate change. In particular, the Argo sampling has allowed observing relevant ocean indicators over the whole Mediterranean Sea especially during the last decade. In this study, the Mediterranean Argo network is comprehensively described from its spatio-temporal coverage to its capability to observe ocean monitoring indicators at sub-regional scale. For this purpose, the Argo array, as a non-interpolated product of profiles, is used to estimate the ocean heat and salt contents integrated within the upper, intermediate and deep layers over the period 2013-2022 in the different sub-regions of the basin. The same computational method is also applied to a model reanalysis product to estimate the impact of sampling of the sole Argo array. The sampling error is defined at sub-regional scale by comparing estimations from the whole model grid (full-sampled model) and from the Argo-like sampled model grid (sub-sampled model). Warming and salinification trends are well captured by the Argo array over the period of study, warming trends being the highest in the sub-regions of the western Mediterranean Sea from surface to depth and salinification trends being higher in the eastern sub-basin for the upper layer and in the western sub-basin for the deeper layers. This study also demonstrates the capability of the Argo array to capture local ocean structures and dynamics (e.g. anticyclonic and cyclonic gyres, intermediate and deep convection events and Atlantic Water inflows) and to account for their impact in the sub-regional variability of ocean heat and salt contents in the upper, intermediate and deep layers from seasonal to interannual scales. Considering these structures is fundamental for the understanding of the thermohaline circulation and changes observed in the Mediterranean Sea, and thus for future climate studies.
In the last decades, the Earth system has been accumulating heat due to the increasing anthropogenic greenhouse gases emissions (WMO, 2022). Around 90% of the excess of heat accumulated is absorbed by the ocean (Rhein et al., 2013; von Schuckmann et al., 2020), and the ocean heat content (OHC) has been the highest on record in 2022 (Cheng et al., 2023). Ocean warming significantly impacts the physical, biogeochemical and biological properties of the ocean whose changes directly affect human-being through negative impacts on food security, water resources and health, and increased exposure to climate-related hazards such as tropical cyclones, floodings or marine heat waves (Hoegh-Guldberg et al., 2018; Smith et al., 2021; Cooley et al., 2022). In the search for a better understanding of the changes that the ocean is facing, the Mediterranean Sea is of strong interest since it is a semi-enclosed basin particularly affected by climate change effects (Giorgi, 2006; Lionello and Scarascia, 2018) and is responding to global warming and changes in freshwater inputs more strongly than the open ocean. More precisely, its surface warming rate is approximately two to three times higher than the one of the global ocean with a basin-averaged trend of 0.038 ± 0.002°C/year over the period 1982-2020 (Juza and Tintoré, 2021) and marine heat waves have been substantially increasing in intensity, duration and frequency in the region over the last four decades (Juza et al., 2022; Dayan et al., 2023). Such changes and impacts are not restricted to the surface and propagate into the ocean interior (Fedele et al., 2022; Juza et al., 2022; Dayan et al., 2023; Kubin et al., 2023). The Mediterranean Sea is also an evaporation-dominated region where evaporation is increasing (Jordà et al., 2017; Skliris et al., 2018) and for which a further decrease in precipitation is projected in the 21th century (Giorgi and Lionello, 2008; Sanchez-Gomez et al., 2009). Finally, this marginal sea can be considered a small-scale ocean (Robinson et al., 2001) where physical processes found in the global ocean also occur (Tintoré et al., 2013; Malanotte-Rizzoli et al., 2014) with shorter turnover timescales (Schroeder et al., 2016) making this region an ideal basin for climate change assessment.
The existing observing and modelling systems in the Mediterranean Sea have enabled the detection of warming and salinification trends over the last decades. Satellite and numerical simulations have shown significant increases of sea surface temperature over the whole basin (Pisano et al., 2020; Juza and Tintoré, 2021; Juza et al., 2022) and of the upper ocean salinity, in particular within the eastern sub-basin (Juza and Tintoré, 2021; Aydogdu et al., 2023). Multi-platform in situ observations from moorings, oceanographic campaigns, profiling floats and gliders have also detected the warming and salinification of the intermediate and deep layers addressing specific areas such as the south-western Mediterranean (Borghini et al., 2014; Schroeder et al., 2016), Sicily Channel (Schroeder et al., 2017), north-western Mediterranean (Margirier et al., 2020), Gulf of Lion (Houpert et al., 2016), Balearic Sea (Juza et al., 2019; Vargas-Yáñez et al., 2020, 2021), western Levantine (Taillandier et al., 2022) and Levantine basin (Ozer et al., 2017).
To address the impact of climate change on the three-dimensional ocean over the whole Mediterranean Sea, Argo profiling floats are a crucial component of the ocean observing systems (Roemmich et al., 2019). The Argo Program has deployed and maintained the array for more than two decades over the global ocean, collecting vertical hydrographic profiles of physical and biogeochemical ocean properties in the water column (Roemmich et al., 2019). Previous studies have shown that OHC computed from Argo measurements allows monitoring the state of the global ocean and its changes (von Schuckmann and Le Traon, 2011; von Schuckmann et al., 2014, 2023). In the Mediterranean Sea, recent studies have addressed the long-term variations of OHC or integrated salinity using reconstructed products based on mapping techniques incorporating Argo floats, sometimes combined with other sources of data (Skliris et al., 2018; von Schuckmann et al., 2019; Kubin et al., 2023). In the cited papers, the authors computed (sub-)basin-averaged trend estimates in the Mediterranean, western and eastern sub-basins, and/or addressed specific sub-regions.
Although the Argo array has played a crucial role in the understanding of ocean changes, a sound interpretation of Argo-derived estimations requires a careful estimation of associated errors such as the measurement noise, systematic instrumental biases, sampling error, data processing errors, including the effect of unresolved ocean variability scales (Lyman et al., 2010; von Schuckmann and Le Traon, 2011). In the Mediterranean Sea, while the instrumental biases are managed through more systematic calibration and improved quality-control procedures, the estimation of Argo sampling errors has not been specifically addressed. Moreover, this marginal sea is a complex basin in terms of ocean dynamics, diversity of ocean processes, bathymetry and coastlines, inducing strong spatial variations of ocean variables and indicators (Malanotte-Rizzoli et al., 2014; Tintoré et al., 2019; Juza and Tintoré, 2021), and thus making the estimation of sampling errors fundamental. To properly estimate the ocean variability as well as the associated errors and uncertainties, the Mediterranean Sea requires to be divided into different sub-regions (Juza and Tintoré, 2021; Fedele et al., 2022; Juza et al., 2022).
This study proposes a comprehensive assessment of the Argo array capability to observe key climate change indicators in the whole Mediterranean Sea at sub-regional scale from the surface to the deep layers and from seasonal to interannual timescales. The implemented methodology is applied to the Argo array (as a non-interpolated product of profiles) to avoid the introduction of processing and interpolation errors through mapping techniques. OHC and ocean salt content (OSC) estimations and variability are jointly analyzed over the period 2013-2022 ensuring a consistent amount of Argo profiles to provide robust statistics in the different sub-regions of study. In addition, the analysis from seasonal to interannual scale enables the detection of events and mesoscale structures as well as the estimation of their contribution to long-term changes. The spatial and vertical connectivity in ocean dynamics is then investigated through the correlation analysis between OHC and OSC, between the sub-regions and between the upper, intermediate and deep layers. Finally, since the Argo array is not evenly distributed in space and time, the impact of sampling is examined using model data from reanalysis and comparing the full-sampled and sub-sampled (like Argo) outputs.
This paper is organized as follows: section 2 provides a detailed description of the Argo floats network in the Mediterranean Sea, in particular its spatial, vertical and temporal coverage at sub-regional scale. Section 3 describes the complementary data and methodology applied. The variability of OHC and OSC in the different layers at seasonal scale along with linear trends over the period of study are analyzed in section 4. Finally, the results are discussed and perspectives are proposed in section 5.
Argo profiling floats collect vertical hydrographic profiles in repeated up and down cycles over the global ocean. In the Mediterranean Sea, during a cycle, floats generally park at a target pressure of 350 dbar, drift with the ocean currents during five days and finally descend up to 2000 dbar - when bathymetry is deep enough - before going up to the surface and collect a profile of physical and biogeochemical properties during the ascent (Poulain et al., 2007; Roemmich et al., 2019). In addition, sensors are switched off at around 5 dbar during ascent to avoid contamination of the conductivity cell at the surface (Wong et al., 2020).
For every float, files with profile data are sorted by data mode (Argo, 2022). The real-time (RT) profile files are available within 12 – 24 hours after the float completes its cycle. The delayed-mode (DM) profile files are generally available one or two years after collecting the profile when they have been validated and corrected by oceanographic experts. Indeed, the data delivered in RT may be affected by sensor drift whereas the DM files are visually examined by experts (Roemmich et al., 2019). The parameters are also quality-controlled, assigning a quality control (QC) flag (Argo, 2022; Wong et al., 2023). DM profiles flagged as good data with QC=1 (DMQC) are recommended for scientific study by the international Argo community (Roemmich and Gilson, 2009; Roemmich et al., 2019; Argo, 2022).
In the Mediterranean Sea, 184 Argo floats have collected pressure, temperature and salinity (P, T, S) profiles since they started to be deployed in the region in 2001. Their trajectory can be visualized through the Argo Data Selection Tool1, and their associated data files downloaded through the Coriolis Global Data Assembly Centers FTP (Cabanes et al., 2021). The initial dataset is composed of 77.259 (P, T, S) profiles in the Mediterranean Sea from 2001 to 2022. The time series of the number of profiles for different data modes is displayed in Figure 1 for the western and eastern Mediterranean Sea (WMed and EMed, respectively). In this study, WMed refers to the Alboran, Algerian, Balearic, Ligurian, Tyrrhenian and Sicily sub-regions, and EMed to the Ionian, Adriatic, Cretan, Aegean and Levantine sub-regions (Figure 2). The temporal evolution of RT and DM profiles shows similarities between WMed and EMed until 2019 while for the last years (2020, 2021 and 2022), the number of DM profiles remains high in the WMed and decreases in the EMed. The use of the Python software Argopy2 (Maze and Balem, 2020) facilitates the first steps of data processing and visualization. In this work, DM profiles (70% of all profiles) with QC=1 for (P, T, S) parameters (77% of the DM profiles) are considered. As a result, over the period 2001-2022, the dataset is composed of 41.859 DMQC profiles (54% of the initial dataset).
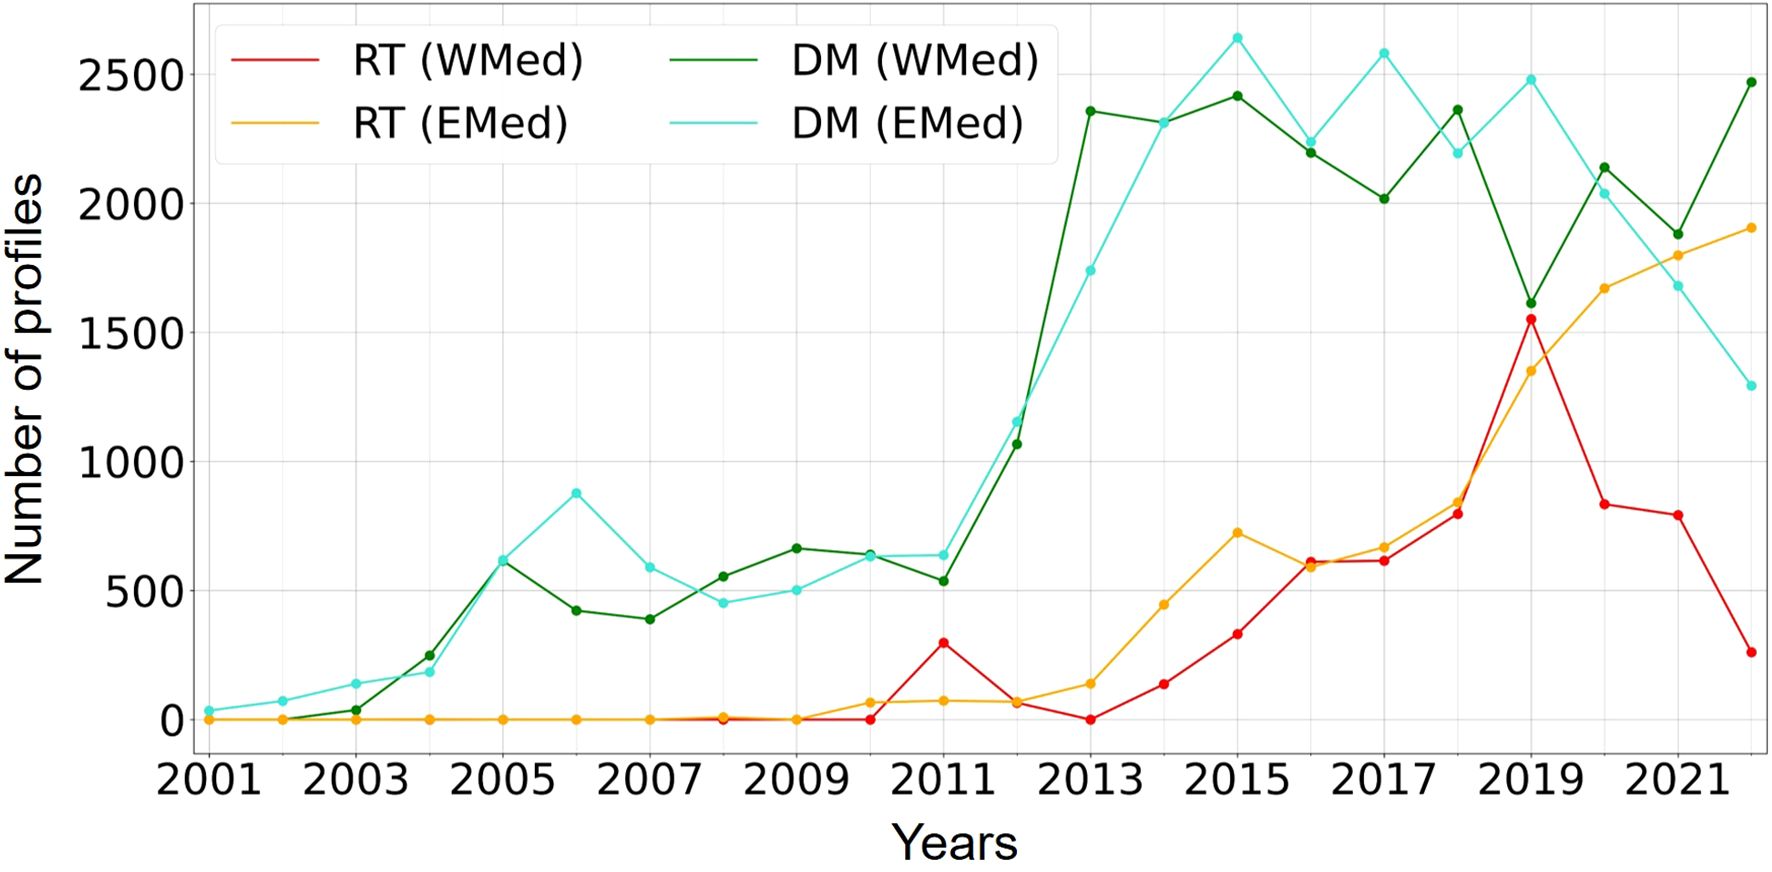
Figure 1. Annual number of DM (RT) profiles from 2001 to 2022 in the WMed and EMed, in green and blue (red and orange), respectively.
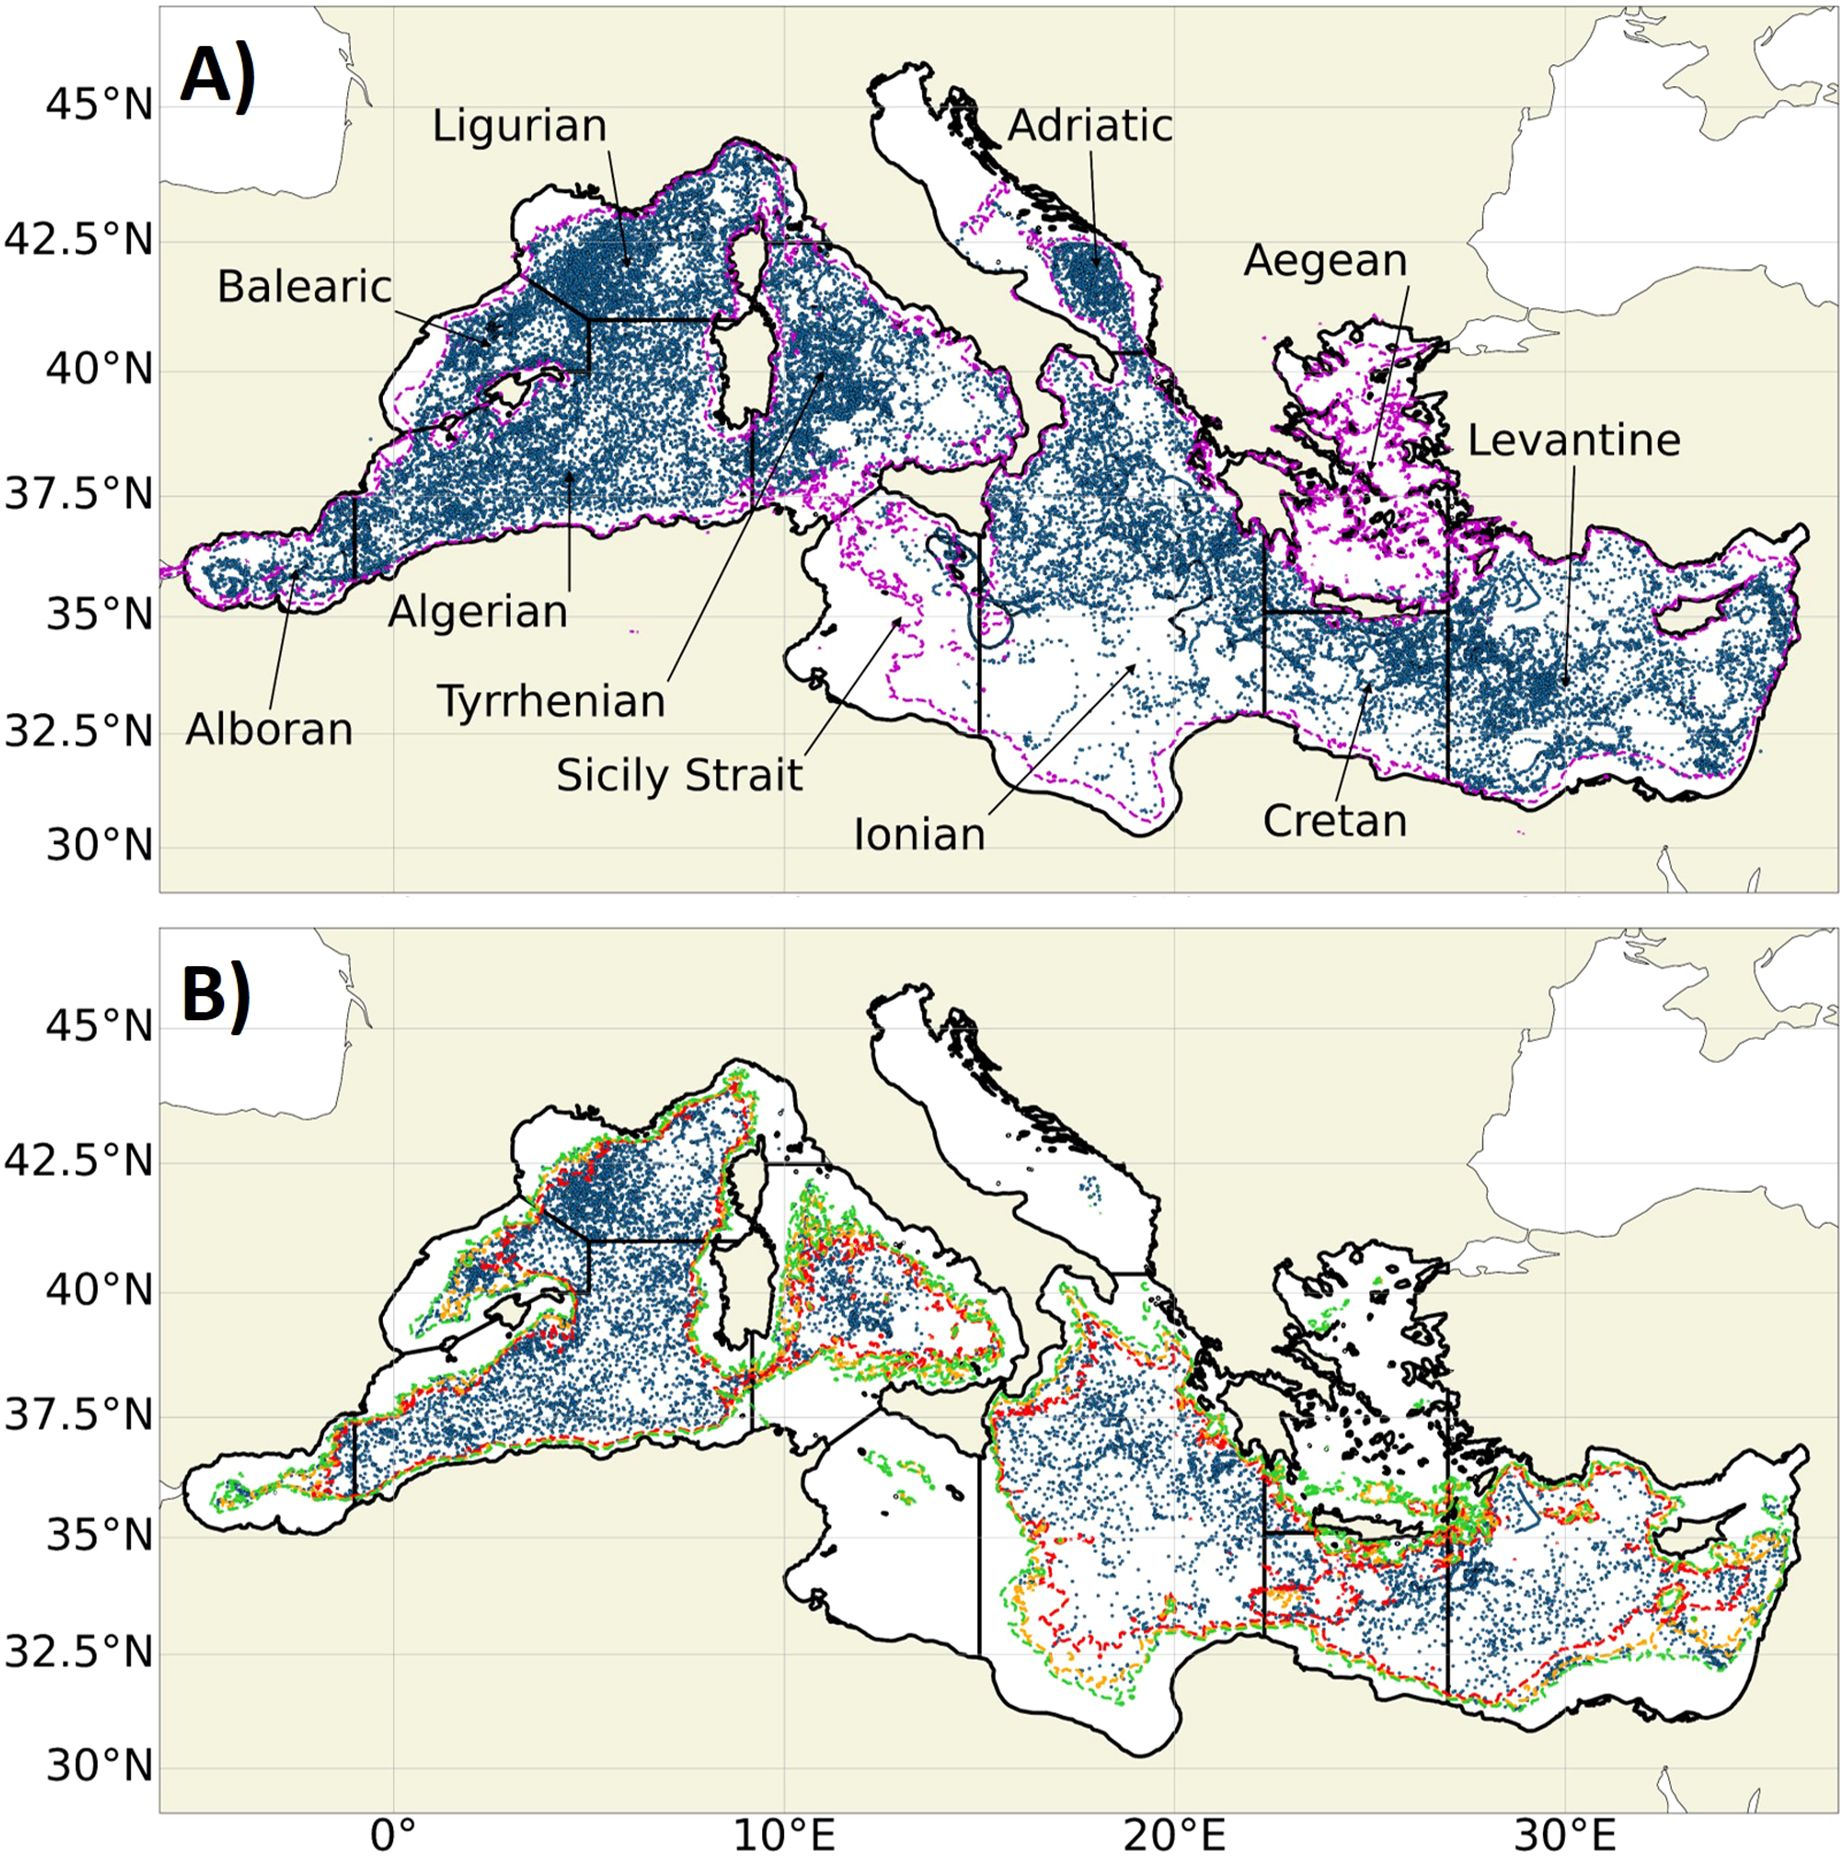
Figure 2. (P,T,S) DMQC Argo profiles (blue dots) in the Mediterranean Sea over the period 2013-2022 with the sub-regions of study and bathymetry contours at 200 m (magenta) (A). DMQC profiles going down 1200 m over 2013-2022 with bathymetry contours at 1200 m (green), 1500 m (orange) and 2000 m (red) (B).
In this study, sub-regions have been defined (Figure 2) in line with Fedele et al. (2022), to consider ocean dynamics of the Mediterranean Sea (Manca et al., 2004), ocean warming variations (Juza and Tintoré, 2021; Juza et al., 2022) and the spatial coverage of Argo profiles, maximizing the number of available observations in each sub-region. First, the initial years 2001 to 2004 are removed since the number of profiles is small (Figure 1) and some sub-regions are not sampled. The dataset is now composed of 41.219 DMQC profiles from 2005 to 2022. In most sub-regions, the number of annual profiles sharply increases from 2013 and becomes more than twice the value over the previous period 2005-2012 (Figures 1, 3). To ensure the spatial and temporal sampling consistencies, the period 2013-2022 is chosen for the study, beginning later than in previous studies using Argo floats in the Mediterranean Sea (e.g. 2001-2019 in Fedele et al., 2022; 2005-2020 in Kubin et al., 2023). The Aegean Sea and Sicily Channel remain strongly under-sampled and thus are not considered in this study. The Adriatic Sea, Cretan passage and Alboran Sea contain fewer observations than other sub-regions but are kept for the analysis when enough data are available. The study at sub-regional scale can be conducted where the number of profiles and coverage are sufficient to compute robust statistics and reduce the sampling error in the estimations of climate indicators. Thereby, the final Argo dataset used in this study is composed of 32.642 DMQC profiles in the Mediterranean Sea collected from 2013 to 2022 (Figure 2A).
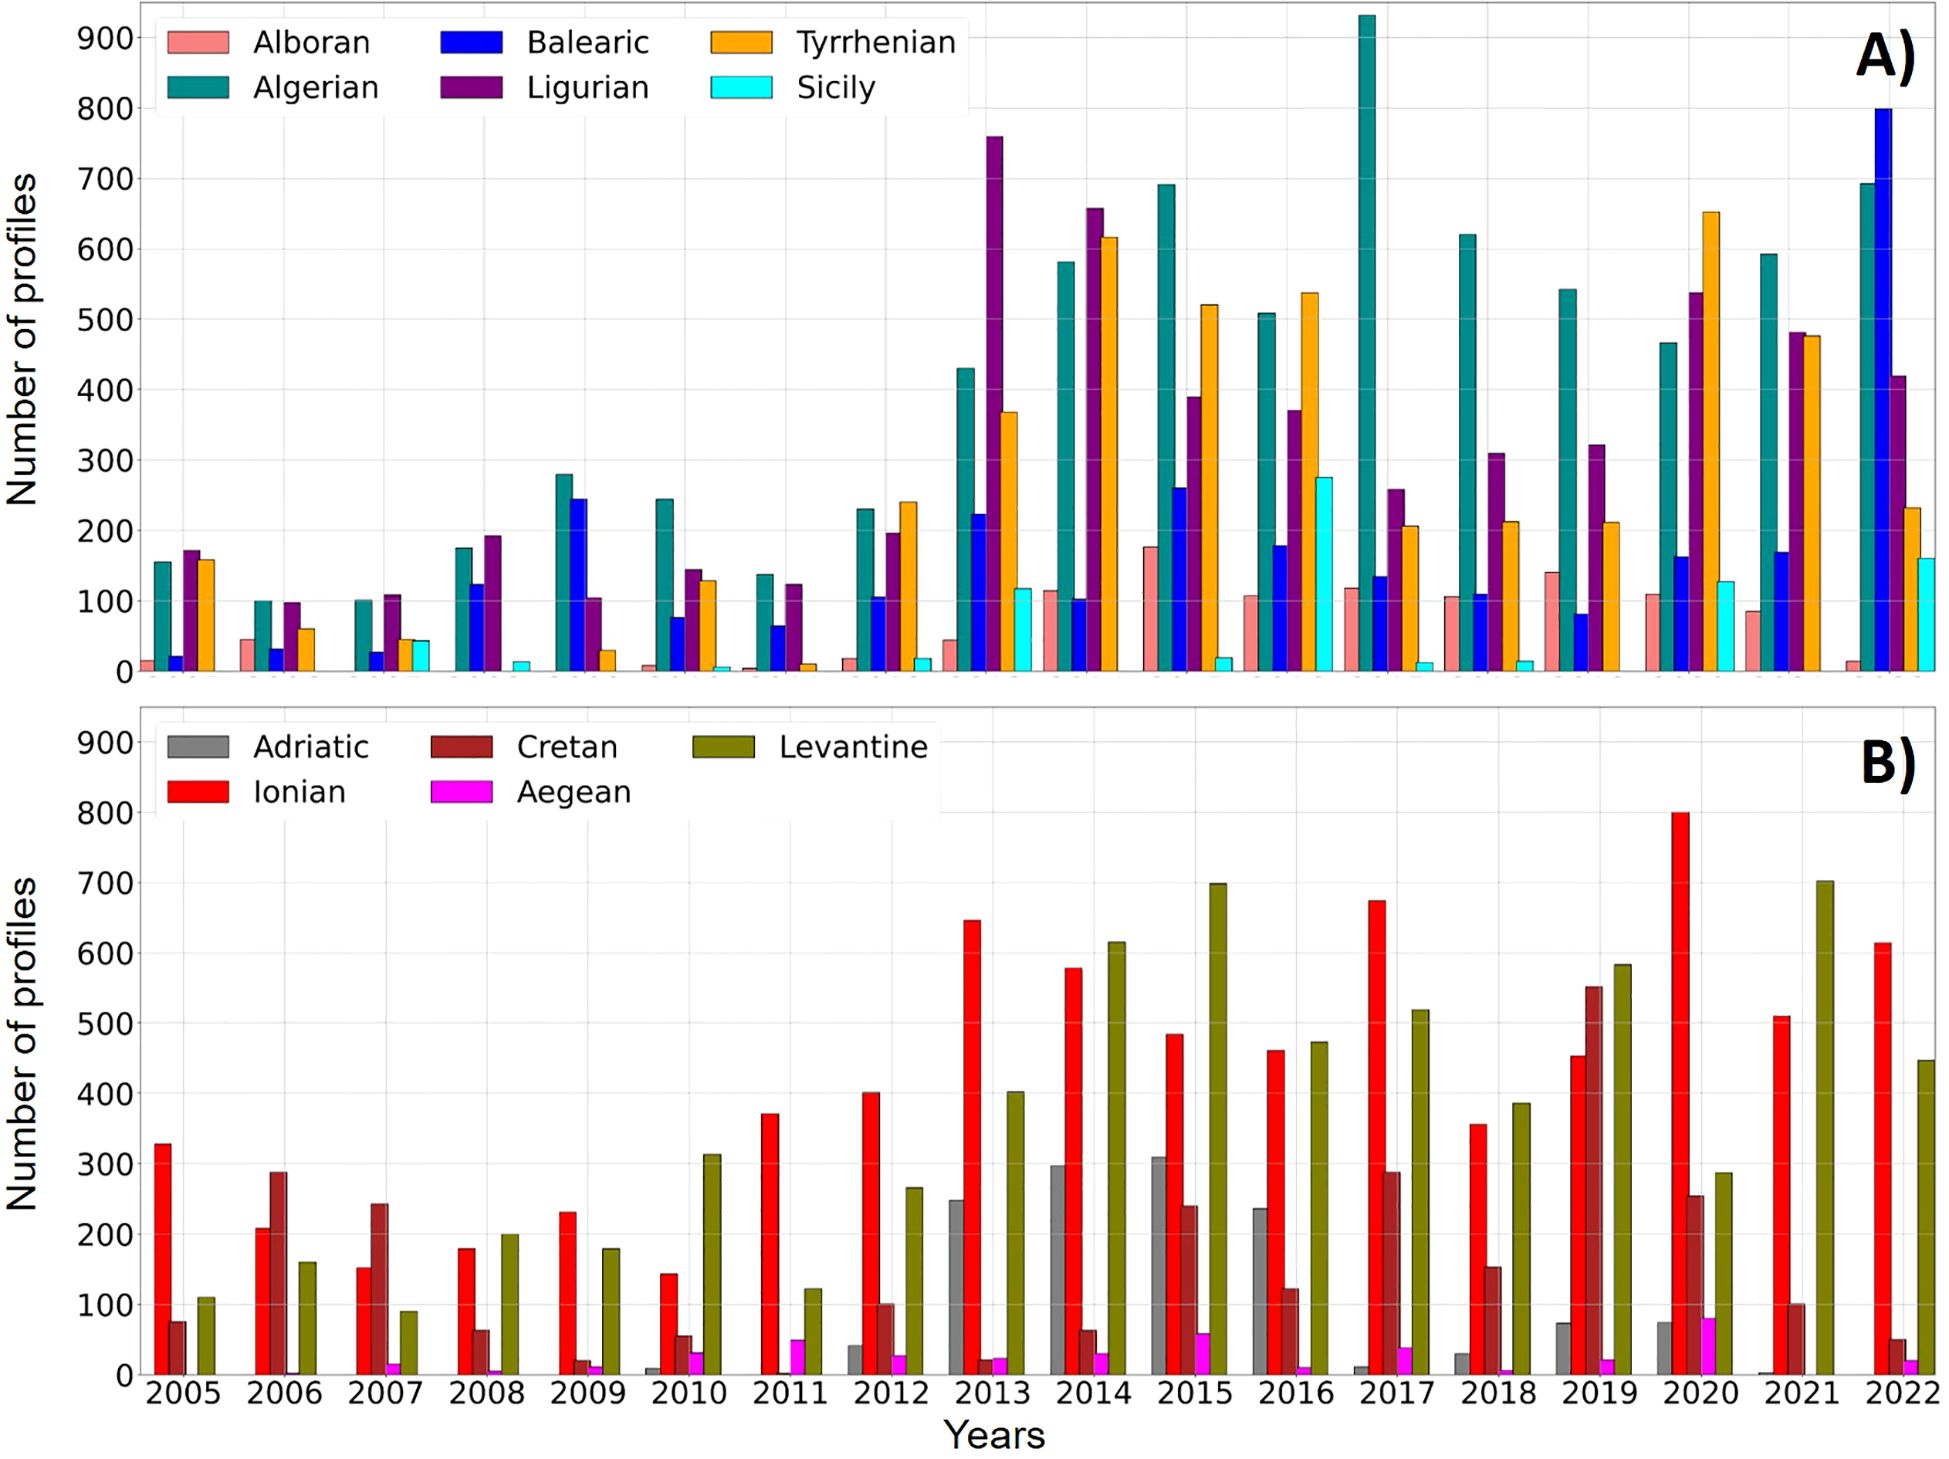
Figure 3. Annual numbers of profiles from 2005 to 2022 in the sub-regions of WMed (A) and EMed (B).
The characteristics of the upper and deeper monitoring depths of DMQC profiles are also considered (Supplementary Figure 1). At the surface, 61% of profiles over the whole basin start before 5 m while 97% start before 10 m. Because of this Argo vertical sampling scheme, the upper 10 m of the Mediterranean Sea is under-sampled by the Argo network and will not be studied here. Regarding the deep layer, the bathymetry of the Mediterranean Sea reduces the number of profiles reaching the deep ocean (Figure 2B). More precisely, 33, 30, 27 and 25% of profiles reach the depths of 1200, 1500, 1700 and 1900 m, respectively (Supplementary Figure 1). The bottom depth of 1500 m seems to be a good compromise between the number of profiles available and reaching the deeper parts of the ocean in most sub-regions. The Alboran and northern Adriatic Seas will be excluded from the deep ocean studies due to their relatively shallow bathymetry (Figure 2B).
This study also uses T/S profiles from the Mediterranean Sea Physical reanalysis product (Escudier et al., 2020, 2021), distributed by the Copernicus Marine Service3. This product is computed using a numerical system composed of a hydrodynamic model, supplied by the Nucleus for European Modelling of the Ocean (NEMO), coupled with a variational data assimilation scheme (OceanVAR) that ingests temperature and salinity vertical profiles as well as satellite Sea Level Anomaly in the Mediterranean Sea. Atmospheric forcings come from ERA5 reanalysis dataset and SST satellite observations are used to correct heat fluxes in the numerical model. Temperature and salinity 3D fields are available at a daily resolution over the period 1987-2022 on a grid with a horizontal resolution of 1/24° and 141 unevenly spaced vertical levels. This dataset has been validated showing good performance compared to observations and other reanalyses (Escudier et al., 2016, 2021, 2022).
The regional SeaDataCloud Temperature and Salinity Climatology for the Mediterranean Sea (Simoncelli et al., 2020a, 2020) is also used to estimate anomalies of hydrographic properties. The product contains monthly temperature and salinity climatologies for the Mediterranean Sea that were computed from an integrated Mediterranean Sea data set combining ocean measures from SeaDataNet and Coriolis databases. In this study, monthly fields of interpolated data into a regular grid of 1/8° spatial resolution with 92 vertical levels from surface to 5.000 m depth over the period 1985-2018 are used.
OHC and OSC are relevant integrated quantities to monitor and estimate climate change impacts on the three-dimensional ocean (von Schuckmann et al., 2020; Juza and Tintoré, 2021; Cheng et al., 2023; von Schuckmann et al., 2023). They are defined as the following equations (von Schuckmann et al., 2009; Juza and Tintoré, 2021) and expressed in GJ/m2 and Mg/m2 in the study, respectively:
with the potential density of seawater ρ = 1030 kg/m3 and the specific heat capacity Cp = 3980 J/kg/°C, z1 and z2 being the lower and upper limits of the layer depth, θ the potential temperature of seawater in °C and S the practical salinity of seawater in g/kg (Feistel, 2012).
In this study, three vertical layers are chosen to compute OHC and OSC from the available T/S profiles. The upper layer is defined from 10 to 150 m, corresponding to the euphotic zone in the Mediterranean Sea, where ocean life is mainly concentrated (Lavigne et al., 2015). This layer also strongly interacts with the atmosphere and is characterized by the presence of the Atlantic Water (AW) (Juza and Tintoré, 2021). Below, the intermediate layer is selected from 150 to 700 m, where the intermediate water masses of the Mediterranean Sea are found (Millot, 1999). It is important to note that the major fraction of heat is stored in the upper 700 m of the world ocean (von Schuckmann et al., 2023) and two thirds of the change in OHC occurred in this layer over the period 1955-1998 (Levitus et al., 2005). For these reasons, 700 m is also the bottom depth chosen for the Copernicus Marine Service Ocean Monitoring Indicators (von Schuckmann et al., 2019). Finally, the deep layer goes from 700 to 1500 m. The limit values of 10 and 1500 m are selected according to the vertical sampling characteristics of the Argo network described in section 2. As such, OHC and OSC are computed for a given profile when a valid value is available above and below the limits of the layer to avoid any extrapolation. Also, since no vertical interpolation is performed, profiles must satisfy the condition that the maximum distance between two consecutive profile points is smaller than 50 m (Juza et al., 2012; Juza and Tintoré, 2021).
Finally, OHC is computed using potential temperature. Although no impact is observed in the upper layer, the use of measured temperature would engender a slight overestimation in OHC of approximately 0.15 and 0.55 GJ/m2 in the intermediate and deep layers in all sub-regions, respectively, representing approximately 0.5 and 1.3% of the mean OHC value in the layer, without impact on the OHC variability.
The OHC and OSC anomalies (OHCA and OSCA, respectively) are also computed to estimate trends with respect to the SeaDataCloud climatology product (described in section 3.2). They are defined as follows (von Schuckmann et al., 2009):
with θclim and Sclim being respectively θ and S from the climatology at the closest point to the position of the Argo profile and vertically interpolated onto the levels of the Argo profile. A temporal interpolation is carried out to get the monthly climatology data at the date of the corresponding Argo profile.
To have a reasonable number of profiles in the different sub-regions, the estimations of OHC and OSC are done seasonally. The seasons are defined as follows: winter (January, February, March), spring (April, May, June), summer (July, August, September) and autumn (October, November, December). The seasonal time series are built computing the median of the seasonal distributions of OHC and OSC for each sub-region and each layer. They are referred to as where is the Argo distribution of OHC or OSC in layer l, sub-region r and season s, and the median operator. The median value has been preferred to the mean value since distributions tend to deviate from normality (Vargas-Yáñez et al., 2020; Juza and Tintoré, 2021) and it allows reducing the influence of sporadic values (Juza and Tintoré, 2021). The 17th and 83th percentiles are also computed to provide complementary information about the distribution’ shape.
This approach avoids the introduction of mapping errors related to interpolation processes, which is one of the main sources of errors in OHC computation (Lyman et al., 2010). Also, part of the observational information can be lost during the mapping process (Juza et al., 2012). The proposed method therefore provides useful objective information about the Argo network and the impact of sampling without further assumptions, which may beneficially complement the outcomes of mapping-based and more sophisticated methods (Juza et al., 2012).
Basic statistics are then computed to analyze the observed seasonal OHC and OSC time series: the mean, standard deviation and Pearson correlation coefficient (Murphy, 1995).
Linear trends are computed over the period 2013-2022 using a linear least square fit on the sub-regional seasonal time series of OHCA and OSCA. Anomalies are used since they allow removing the seasonal cycle as well as some extreme values due to the Argo sampling in recurrent small oceanic features. Considering the seasonal time series rather than annual time series also allows keeping enough data points to reduce the uncertainty in the linear regression. Indeed, the seasonal cycle could also be removed working with OHC/OSC mean annual values as done in previous studies (Lyman and Johnson, 2008; Fedele et al., 2022; Kubin et al., 2023), but the number of points would be reduced to 10 (years), against 40 (seasons during 10 years) with seasonal time series. Trends are expressed in W/m2 for OHCA, as commonly used in the literature, and in kg/m2/y for OSCA, and are given with the associated confidence intervals at 95%. The trend uncertainty is computed taking into account the effective number of degrees of freedom of the timeseries (Chelton, 1983). Considering the serial correlation of the data is necessary since environmental data are often autocorrelated and the hypothesis of independent data could thus lead to an underestimation of the trend uncertainty. According to probability theory, a trend is considered significant with a probability of 95% if at least twice higher than its uncertainty (Mieruch et al., 2008).
The temporal and spatial distribution of the Argo array can introduce errors in OHC and OSC estimations (Lyman et al., 2010; von Schuckmann and Le Traon, 2011; Juza et al., 2012). In this study, this impact is evaluated using numerical model reanalysis data (section 3.1.1). Here, the seasonal OHC and OSC time series are computed using the same method as described in 3.3.1 but applied to the daily T/S profiles from the model. Time series are computed from the model considering the whole model grid (full-sampled model) and from the Argo-like model considering T/S profiles interpolated at the Argo location, date and vertical levels (sub-sampled model; Juza et al., 2012). The sampling error on variable (OHC or OSC) is then defined for each layer l, sub-region r and seasonal time step s as:
Classical statistics are then used to evaluate the impact of the sampling error in a given sub-region and layer. The mean error (ME) and root mean squared error (RMSE) (Murphy, 1995) are defined on variable for each layer l and sub-region r as follows:
The sampling error on Argo trend estimates is also evaluated. Linear trends are computed from the full-sampled and sub-sampled model time-series, and the bias error due to sampling on trend estimate is defined for each layer l and sub-region r as:
Thus, the error due to the temporal, horizontal and vertical sampling of Argo floats will be evaluated for both seasonal variability () and trends ().
In the upper 10-150 m layer, OHC variations are characterized by a strong seasonal variability, with higher values in summer-autumn and lower values in winter-spring in all sub-regions (Figure 4) while for the upper OSC variations, there is no visible seasonal cycle (Figure 5). The upper layer is warmer and saltier in the EMed sub-regions (Ionian, Adriatic, Crete and Levantine) with higher mean values of OHC and OSC over the period 2013-2022 than in the WMed sub-regions (Alboran, Algerian, Balearic, Ligurian and Tyrrhenian). The dynamics driving the upper layer variability vary between sub-regions. Atmospheric forcing globally plays an important role at seasonal and sub-regional scale. The Ligurian basin is the coldest sub-region with an OHC mean value of 8.27 GJ/m2, which can be explained by the strong winds which generate low temperature at the surface, especially in winter and early spring (Estournel et al., 2003). The observed minima of OHC associated with maxima of OSC in winters 2013 and 2018 are related to the severe winter conditions which generated cold surface waters and high evaporation leading to deep convection events (Houpert et al., 2016; Juza and Tintoré, 2021). The Levantine basin is the warmest sub-region in the upper layer with an OHC mean value of 10.35 GJ/m2, related to the strong SST values in the area (Pisano et al., 2020; Juza and Tintoré, 2021). These high SST values also cause strong evaporation (Schroeder et al., 2017) making the upper layer of the Levantine basin the saltiest sub-region of the Mediterranean Sea, with an OSC mean value of 5.64 Mg/m2. Also, the high OHC values observed in the Levantine basin in spring 2018 or in the Algerian basin in winter 2020 are related to high sub-regional SST values (Juza and Tintoré, 2021). The upper ocean variability in the south WMed sub-regions is also driven by the entrance of AW at the Strait of Gibraltar which is characterized by warmer and less saline waters when entering the Mediterranean Sea (Schroeder et al., 2016). The lowest mean value of OSC is thus observed in the Alboran Sea (5.41 Mg/m2) where the OHC and OSC variability is negatively correlated (-0.76). The signature of recent AW in OHC and OSC values is particularly strong in autumn 2017 in the Algerian and Balearic sub-regions. These observations are in agreement with glider sections in the Mallorca and Ibiza Channels which observed strong AW inflows in 2017 (Juza and Tintoré, 2020, 2021).
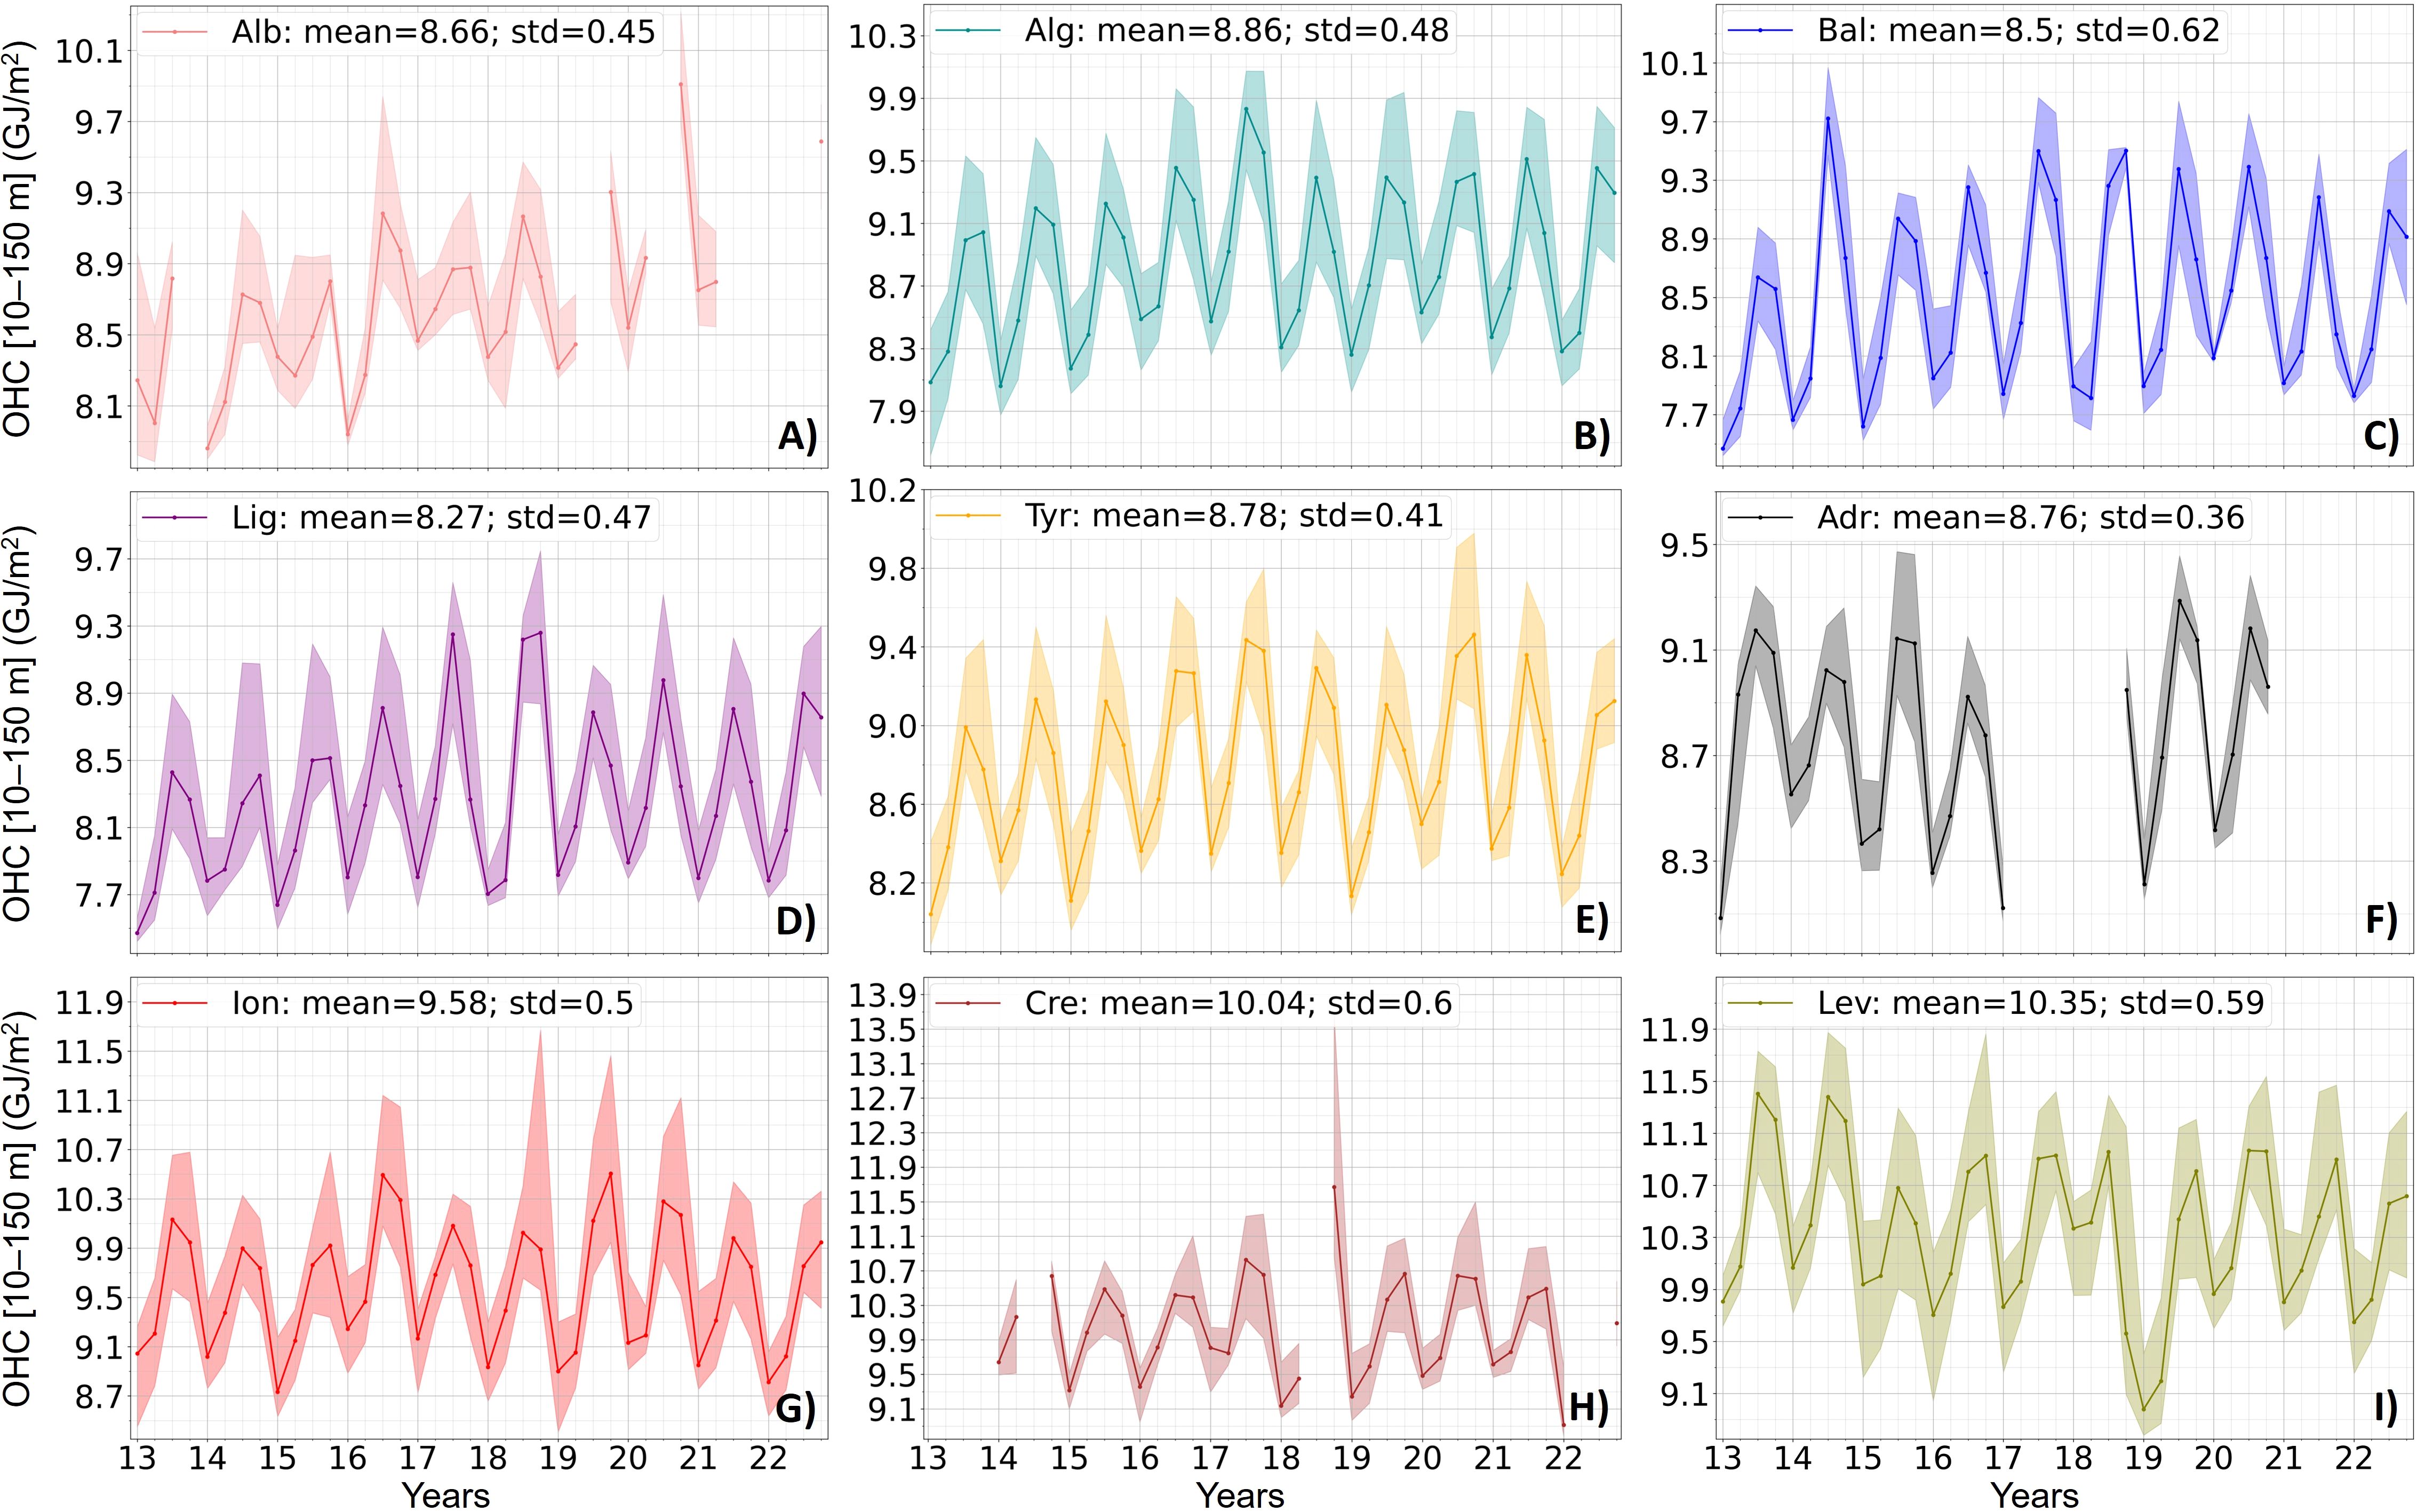
Figure 4. Medians of seasonal distributions of OHC (in GJ/m2) in the 10-150 m layer from 2013 to 2022 in the sub-regions of study: Alboran (A), Algerian (B), Balearic (C), Ligurian (D), Tyrrhenian (E), Adriatic (F), Ionian (G), Cretan (H) and Levantine (I). The associated mean and standard deviation are indicated. The shaded area represents the interval between the 17th and 83th percentiles of the seasonal distributions.
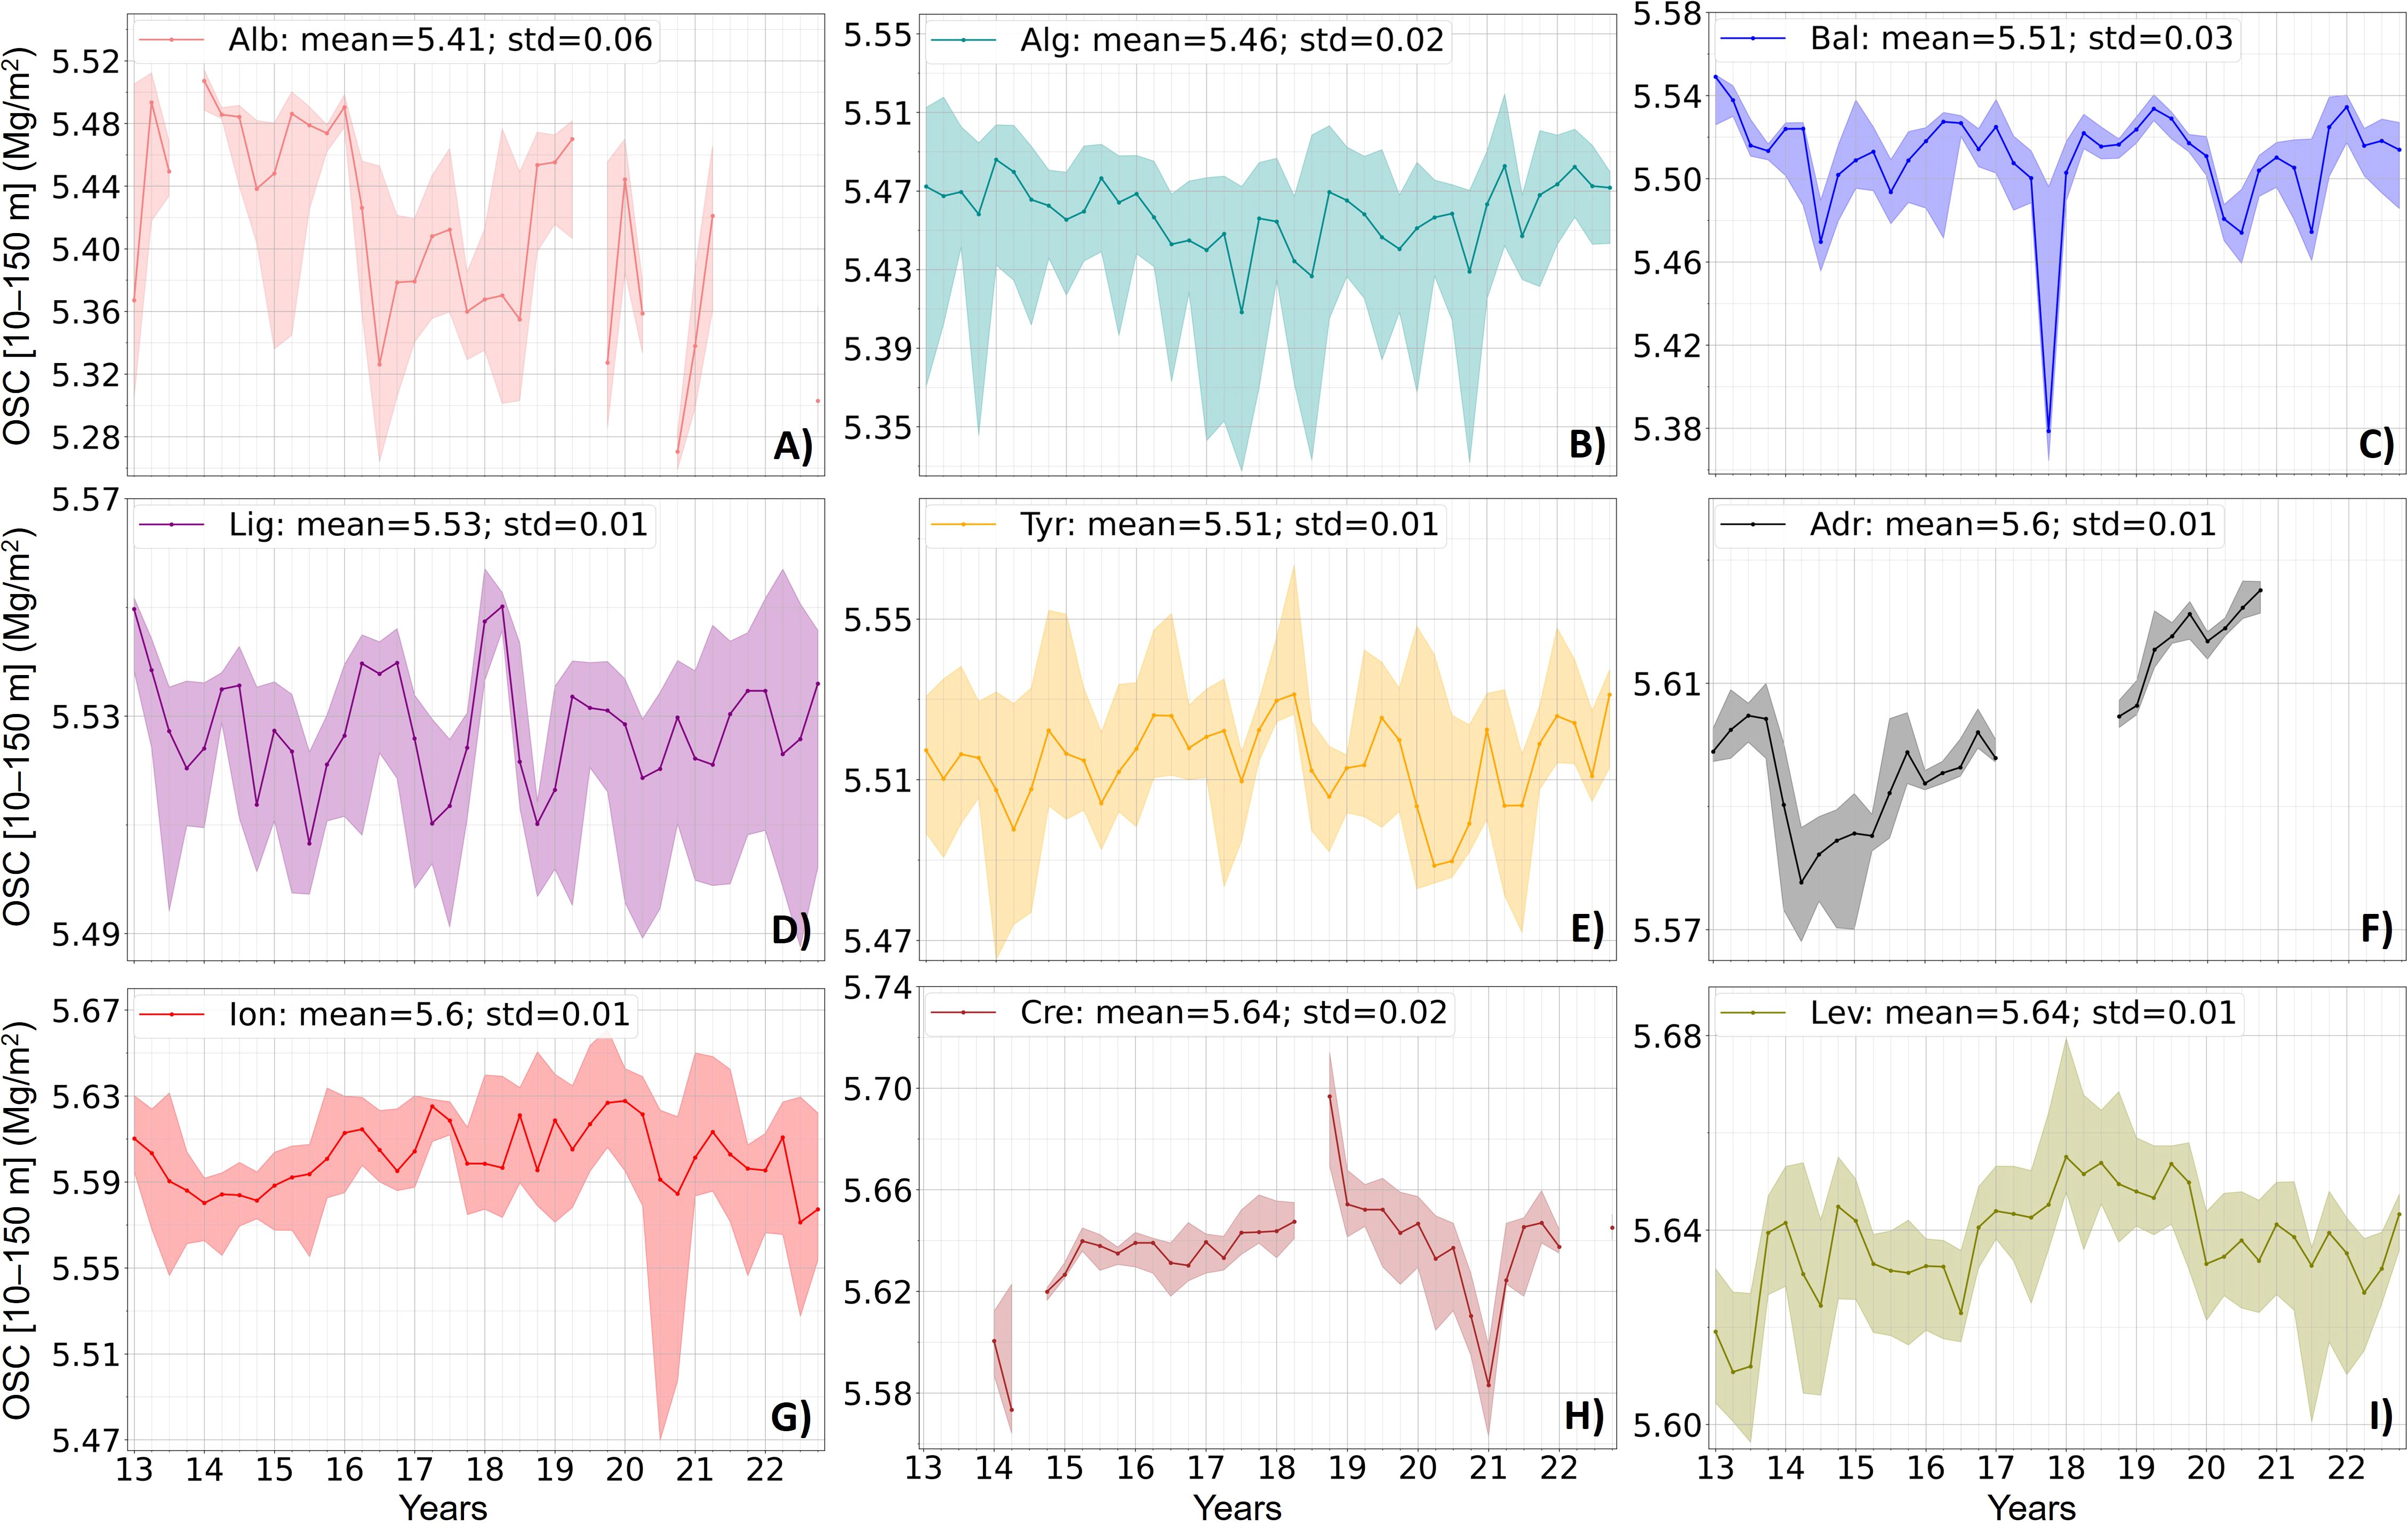
Figure 5. (A-I) Same as Figure 4 for OSC (in Mg/m2) in the 10-150 m layer.
The analysis of the sub-regional variability needs to be interpreted carefully since it may depend on the sampling of Argo floats. More precisely, the observation of some extreme values can be due to the location of the floats in specific areas without being representative of the dynamics of the whole sub-region. This is particularly the case in the EMed sub-regions, where high OHC variability is observed by Argo floats in the upper layer especially in the Levantine basin, which is mainly due to the complex dynamics of the region (Özsoy et al., 1993) combined with the impact of Argo sampling. Indeed, the EMed is characterized by the presence of important mesoscale structures such as anticyclonic and cyclonic gyres. They can explain the strong minimum of OHC observed in winter 2019 in the Levantine basin when all floats were located inside the Rhodes cyclonic gyre, bringing colder waters to the surface, or the high OHC and OSC values observed in autumn 2018 in Crete when all floats sampled the lerapetra anticyclonic gyre, bringing heat and salt at depth (Supplementary Figure 2). The influence of Argo sampling on extremes can also be observed in the Ligurian sea in autumn 2018, when the maximum value of OHC is probably due to the proximity of the floats to the coast of France, and in the Balearic Sea in autumn 2017 when a float was trapped in the AW inflow through the Ibiza Channel as mentioned above, generating the particularly low minimum of OSC.
In the intermediate 150-700 m layer, there is no seasonal cycle in OHC or OSC variations (Figures 6, 7). Similar to the upper layer, this layer is warmer and saltier in the EMed than in the WMed sub-regions. The Levantine basin has the warmest and saltiest intermediate layer of all sub-regions, with OHC and OSC mean values of 32.93 GJ/m2 and 22.05 Mg/m2, respectively. Similar OSC mean values are found in the Ionian, Cretan and Levantine sub-regions which are zones of accumulation of LIW (Taillandier et al., 2022). Inversely, the Alboran Sea has the freshest and coldest intermediate layer, with means of OHC and OSC of 30.02 GJ/m2 and 21.81 Mg/m2, respectively. The intermediate layer is much more stable than the upper layer especially for temperature (Figures 6, 7) with standard deviations of the OHC time series reduced by almost half in all sub-regions (except for the Levantine basin), due to the absence of seasonal cycle.
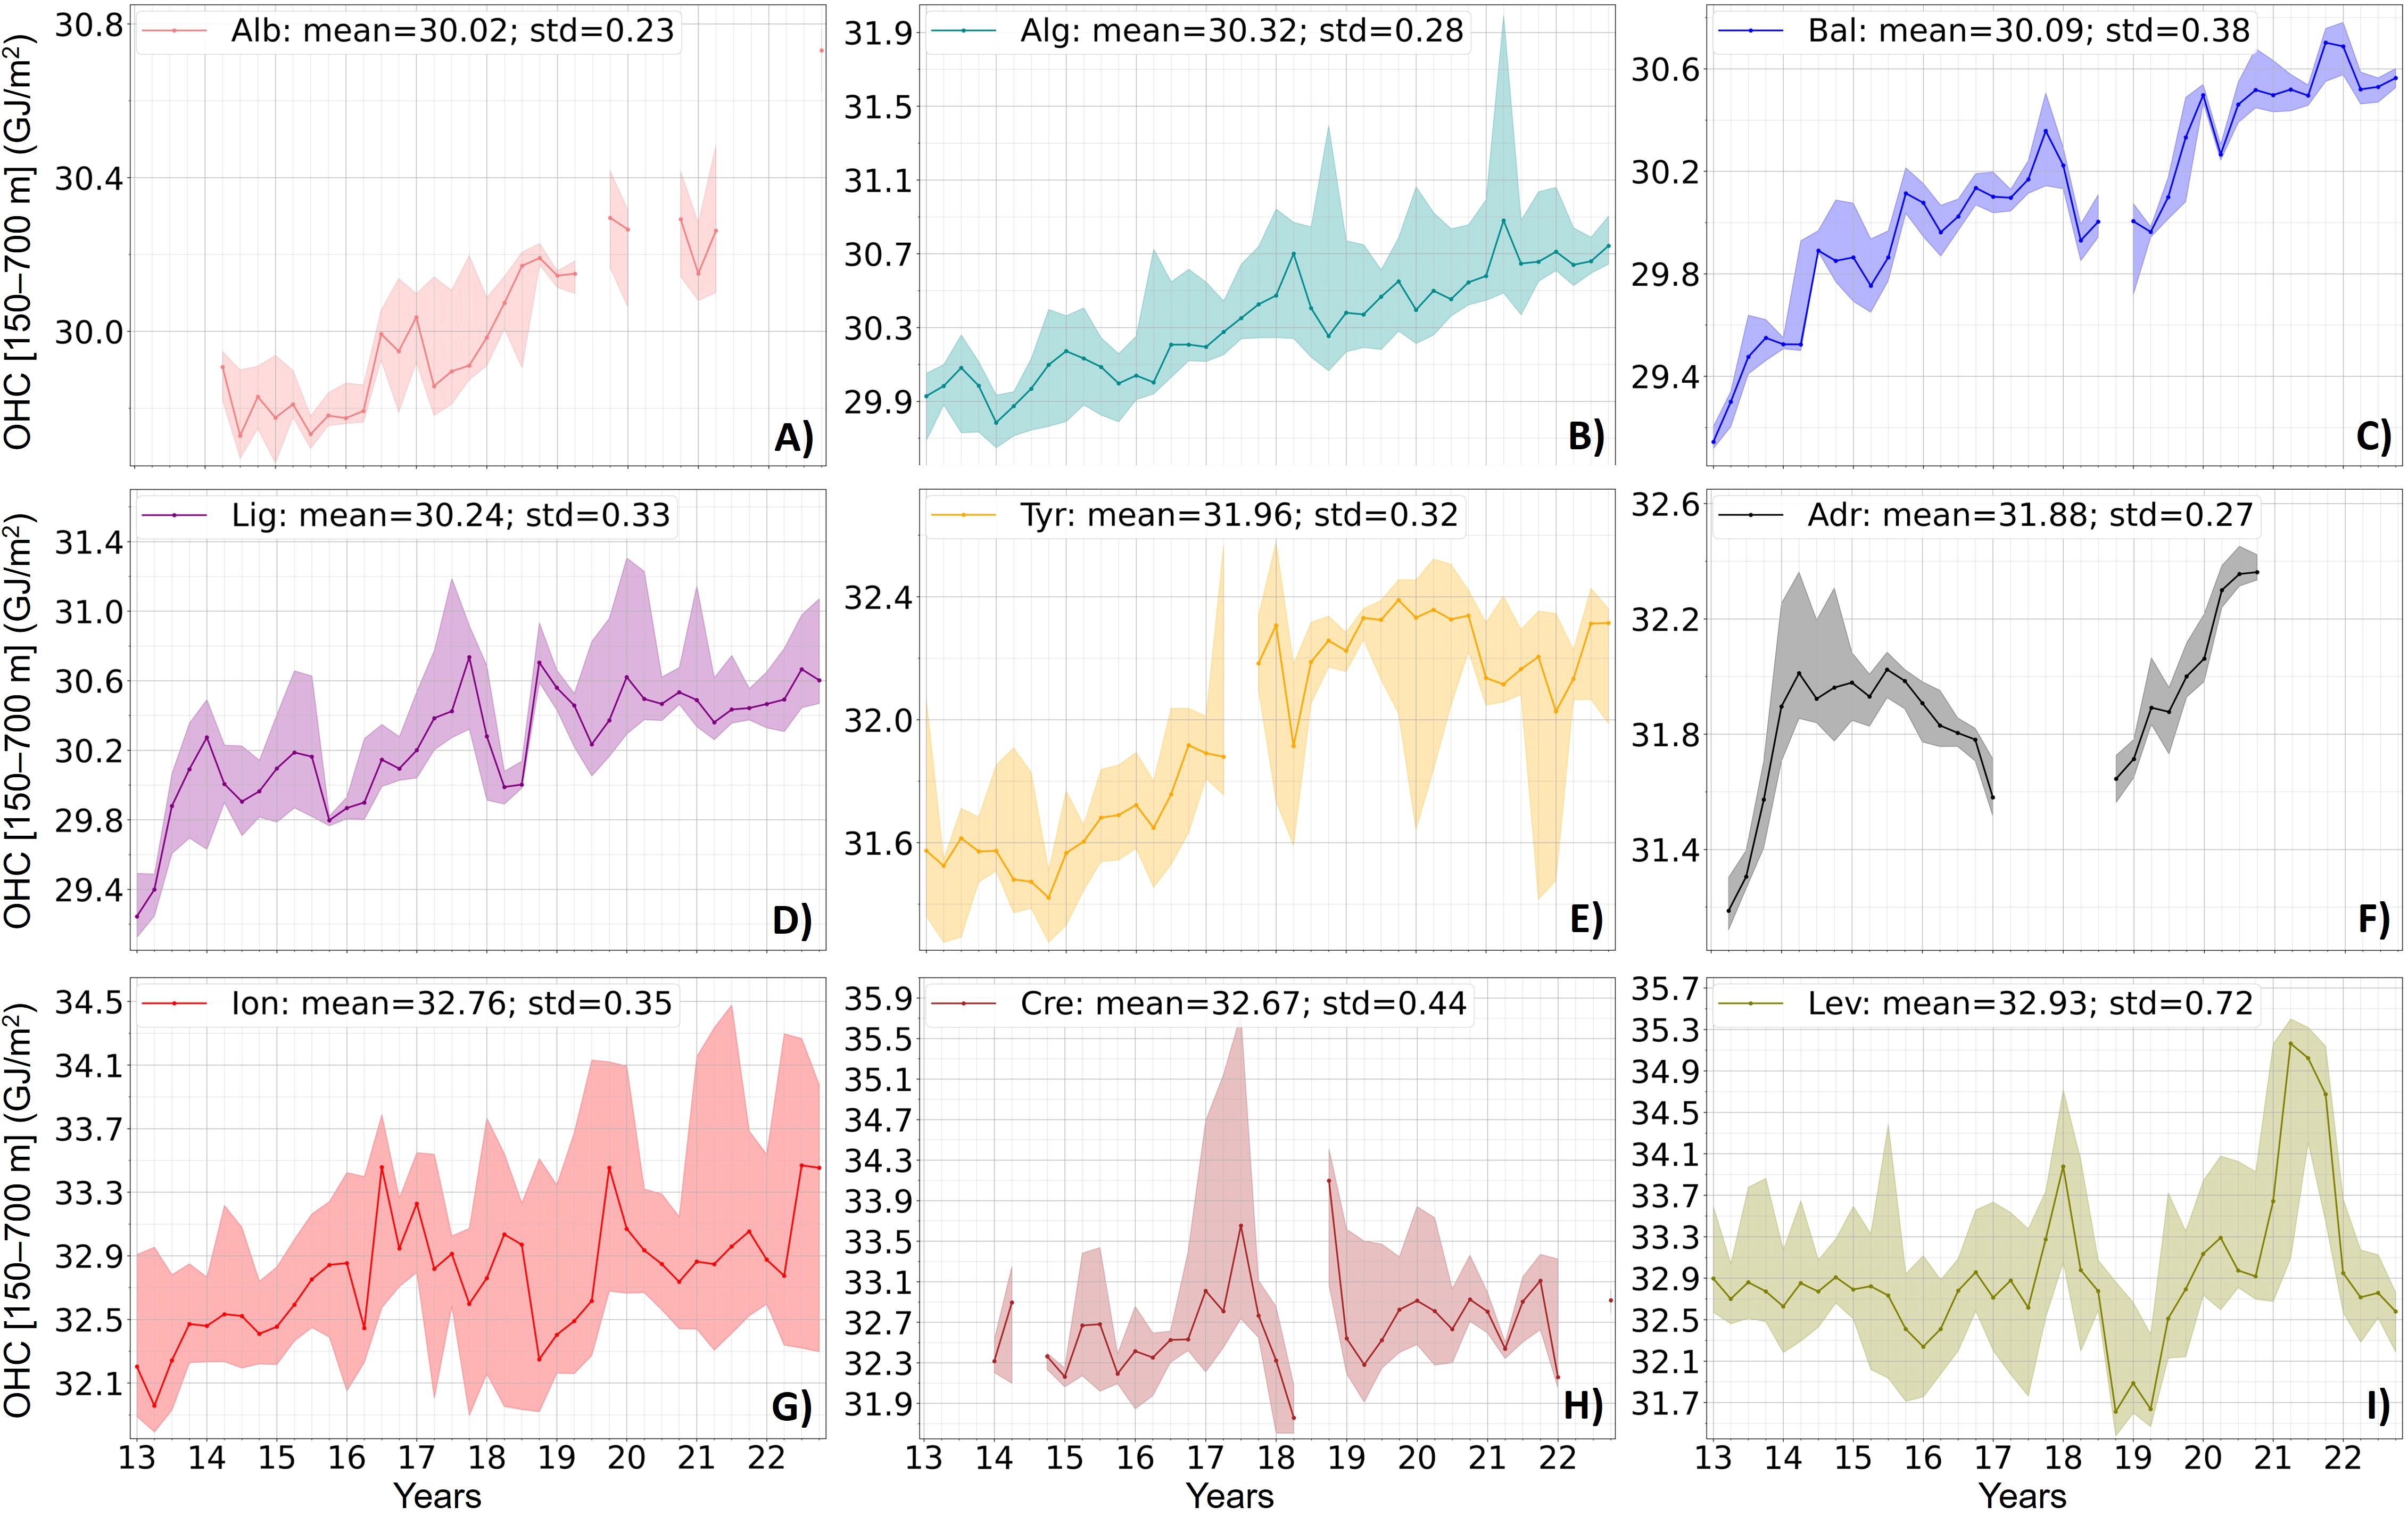
Figure 6. (A-I) Same as Figure 4 for OHC (in GJ/m2) in the 150-700 m layer.
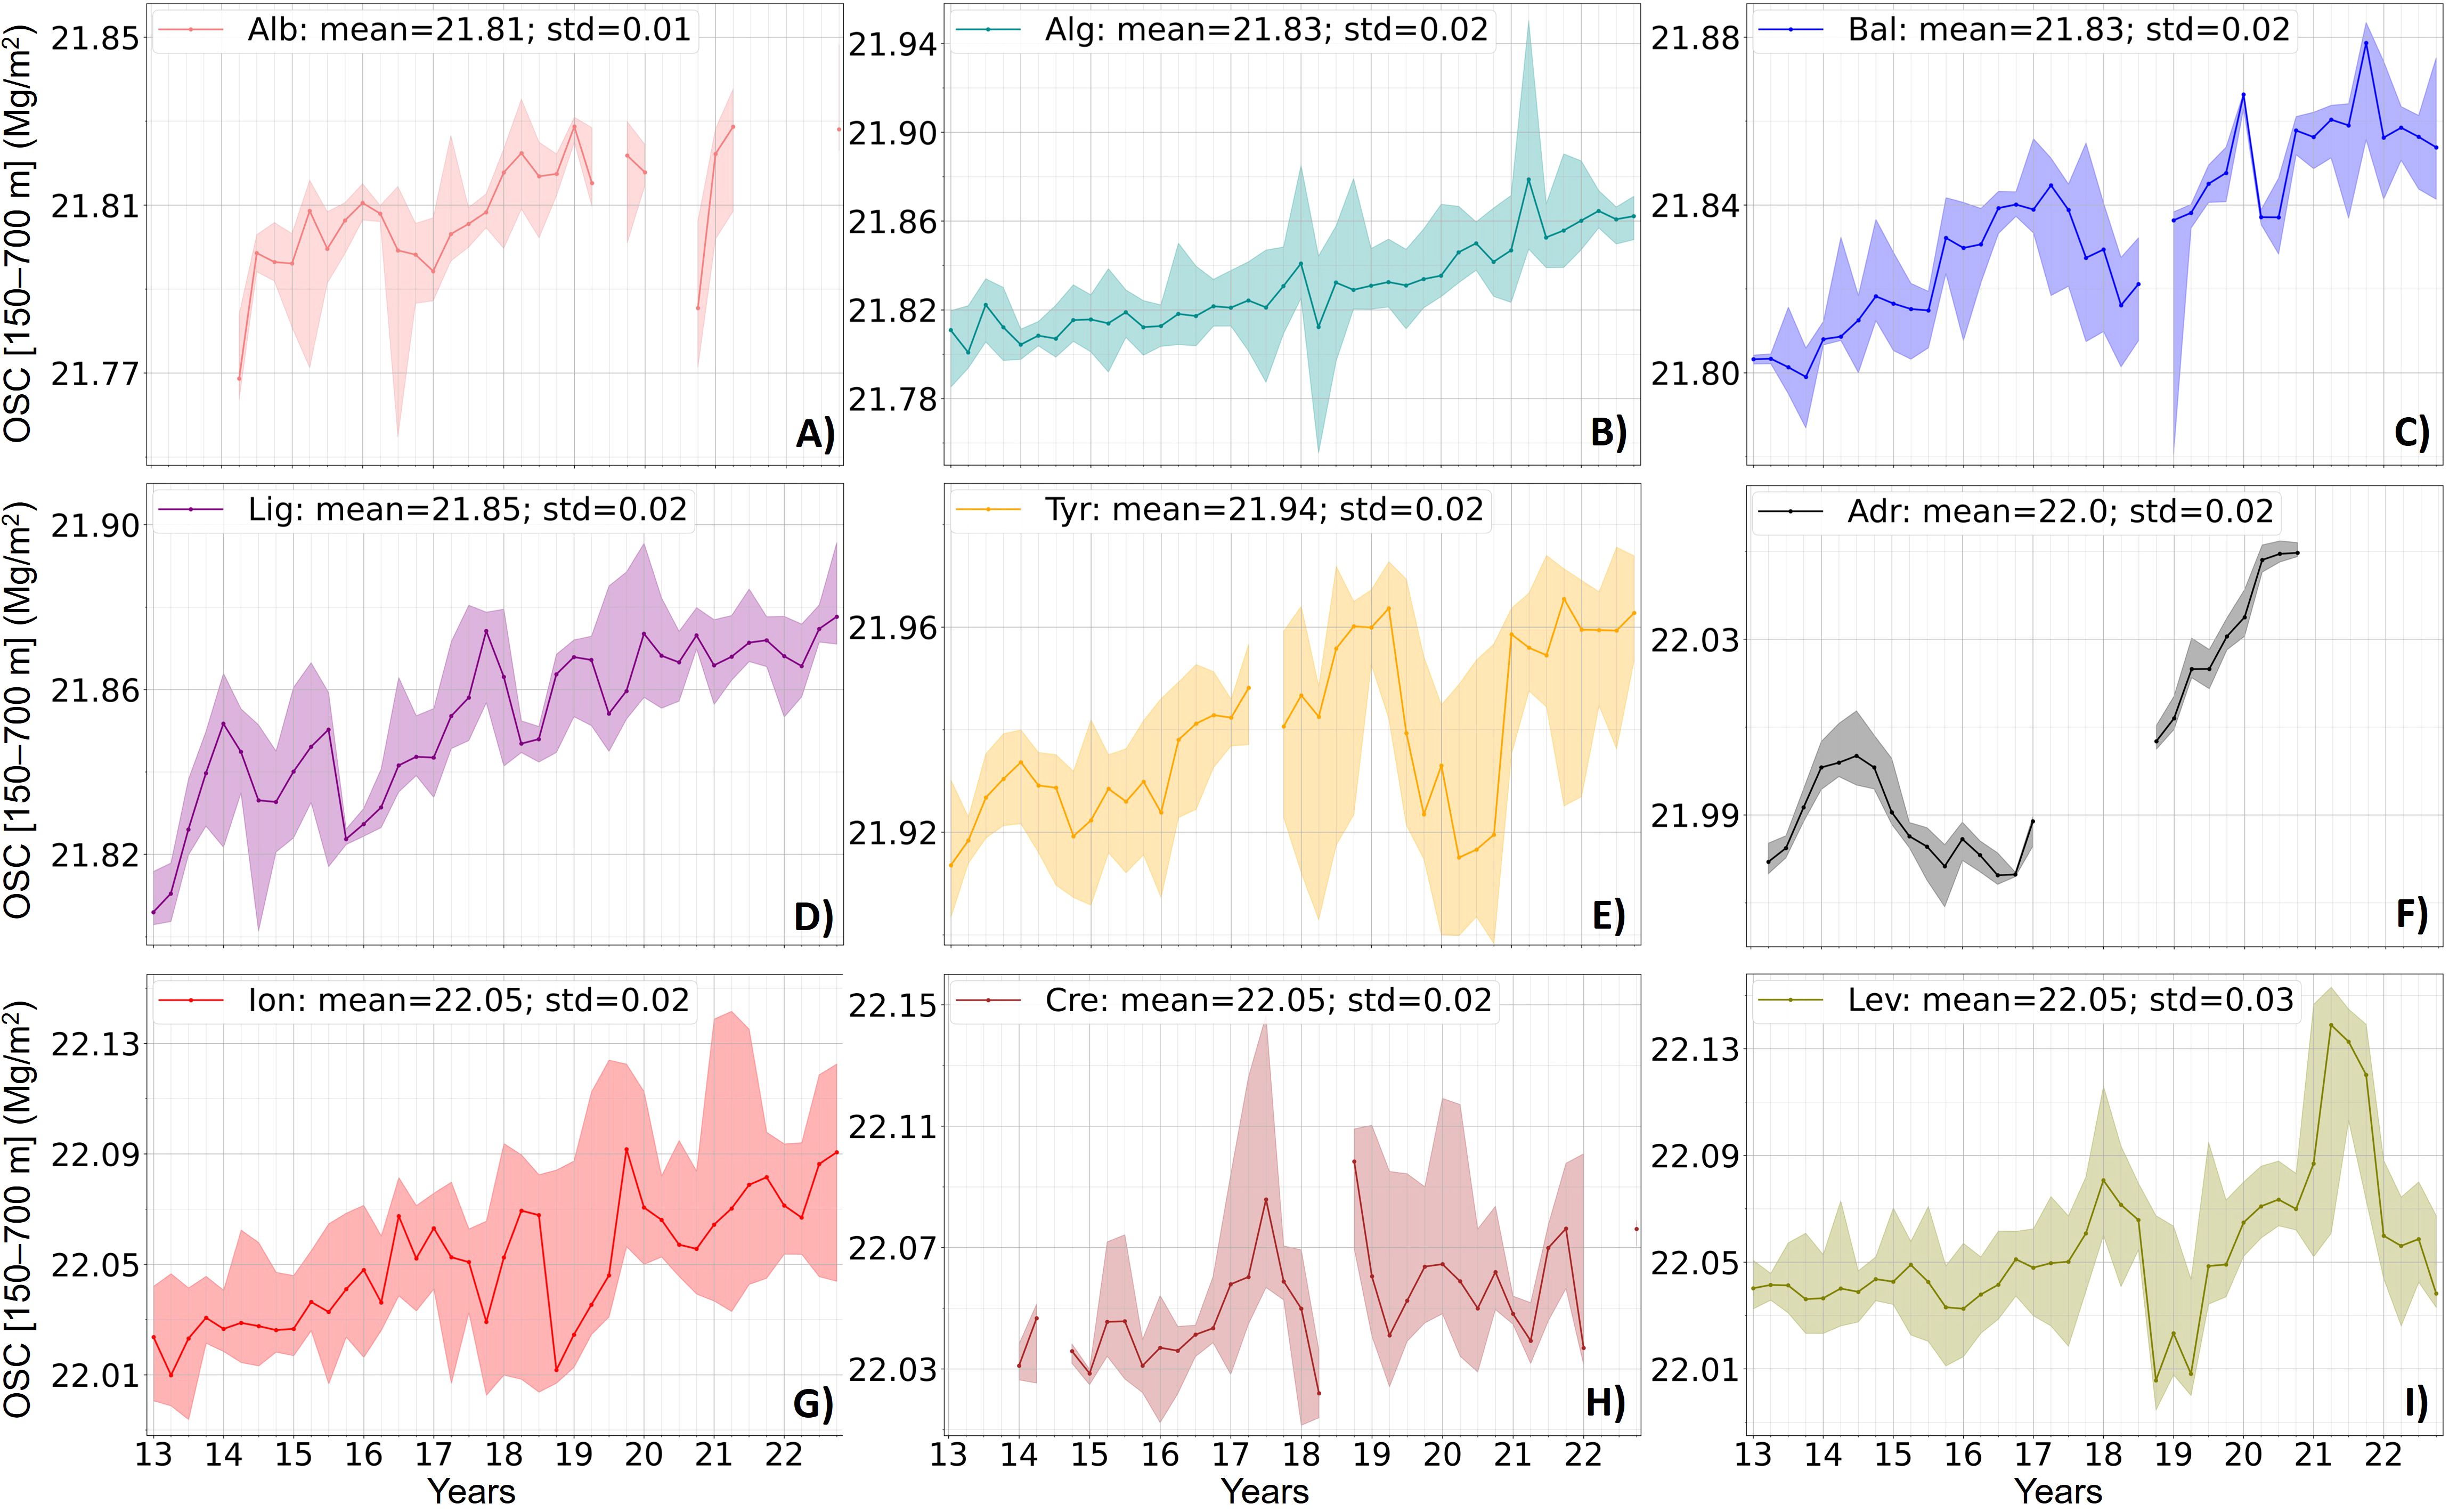
Figure 7. (A-I) Same as Figure 4 for OSC (in Mg/m2) in the 150-700 m layer.
The higher variability observed in the EMed sub-regions can be related to the dynamics of the region combined with the impact of Argo sampling. Indeed, as explained above, the high OHC and OSC values observed by Argo floats can be explained by their location in anticyclonic gyres such as the Mersa-Matruh gyre (Levantine basin) in winter 2018 and throughout 2021, the lerapetra gyre (Cretan passage) in summer 2017 and autumn 2018, and the Pelops gyre (Ionian Sea) in autumn 2019 (Supplementary Figure 2). In the same way, the low values of observed OHC and OSC can be induced by the position of the floats in cyclonic gyres such as the Cretan gyre (Cretan Passage) in winter and spring 2018 and the Rhodes gyre (Levantine basin) from autumn 2018 to spring 2019. In winter 2019, the location of the floats along the edge of the gyre and close to the northern coast of the Levantine basin associated with an increase in OHC and OSC could suggest the observation of the convection event reported by Taillandier et al. (2022). Through mixing of surface and intermediate waters, heat and salt were brought at intermediate depth forming LIW (Taillandier et al., 2022).
In the WMed, the presence of Argo floats in mesoscale structures can also influence the variability estimation in the intermediate layer. The lower OSC values observed in the Alboran Sea in autumn 2020 and in the Algerian sub-basin in spring 2018 might be explained by the detection of AW entrance in the upper layer (section 4.1.1) and the location of the floats in the sub-regional anticyclonic gyres (Escudier et al., 2016; Juza et al., 2016) carrying surface fresh waters at intermediate depths. In the Ligurian and Balearic Seas, the variability observed in the intermediate layer is mainly driven by convection events (Houpert et al., 2016; Testor et al., 2018). The Argo floats observed the deep convection events of winters 2013 and 2018 in the Ligurian Sea (also reported in Houpert et al., 2016; Testor et al., 2018; Juza and Tintoré, 2021). They are characterized by OHC and OSC decreases at intermediate depths during winter and spring (Figures 6, 7) due to the vertical mixing of the warm and saline LIW with colder and fresher waters. Less important convections were also observed in winter 2016, 2019 and 2021 with decreases in the intermediate OHC and OSC. The impact of these convection events is also observed in the Balearic Sea, due to its proximity to the convection zone of the north WMed (Figures 6, 7). Also, an intermediate convection event in spring 2015 was detected in this sub-region associated with a decrease of OHC and OSC at intermediate depth. Such variations might be explained by the detection of Western Intermediate Water formed in the area as observed by gliders in the Ibiza Channel (Juza et al., 2019).
The observed impact of mesoscale eddies and convection events might explain the high correlations between OHC and OSC variations in the intermediate layer of the Algerian (0.88), Balearic (0.91), Ligurian (0.96), Ionian (0.91), Cretan (0.92) and Levantine (0.95) sub-regions. The highest correlations are observed in the Ligurian and Levantine sub-basins, where convection events were observed by Argo floats, which suggests the importance of these processes in the sub-regional variability. Moderate and low correlations are found in the Alboran, Tyrrhenian and Adriatic Seas.
The study of the deep layer is restricted to the Algerian, Balearic, Ligurian, Tyrrhenian, Ionian and Levantine sub-regions where enough data are available to build seasonal time series. As for the intermediate layer, there is no seasonal cycle in OHC or OSC variations for the deep layer (Figures 8, 9). The EMed (Ionian and Levantine sub-regions) is warmer and saltier on average than the WMed sub-regions. In the deep layer, the Ionian Sea is the warmest sub-region with a mean OHC value of 44.82 GJ/m2 while the Balearic Sea is the coldest sub-region with a mean value of 42.68 GJ/m2. The Ionian Sea is also the saltiest sub-region with a mean OSC value of 31.95 Mg/m2, while the lowest OSC values are found in the Algerian, Balearic and Ligurian sub-regions with means around 31.73 Mg/m2.
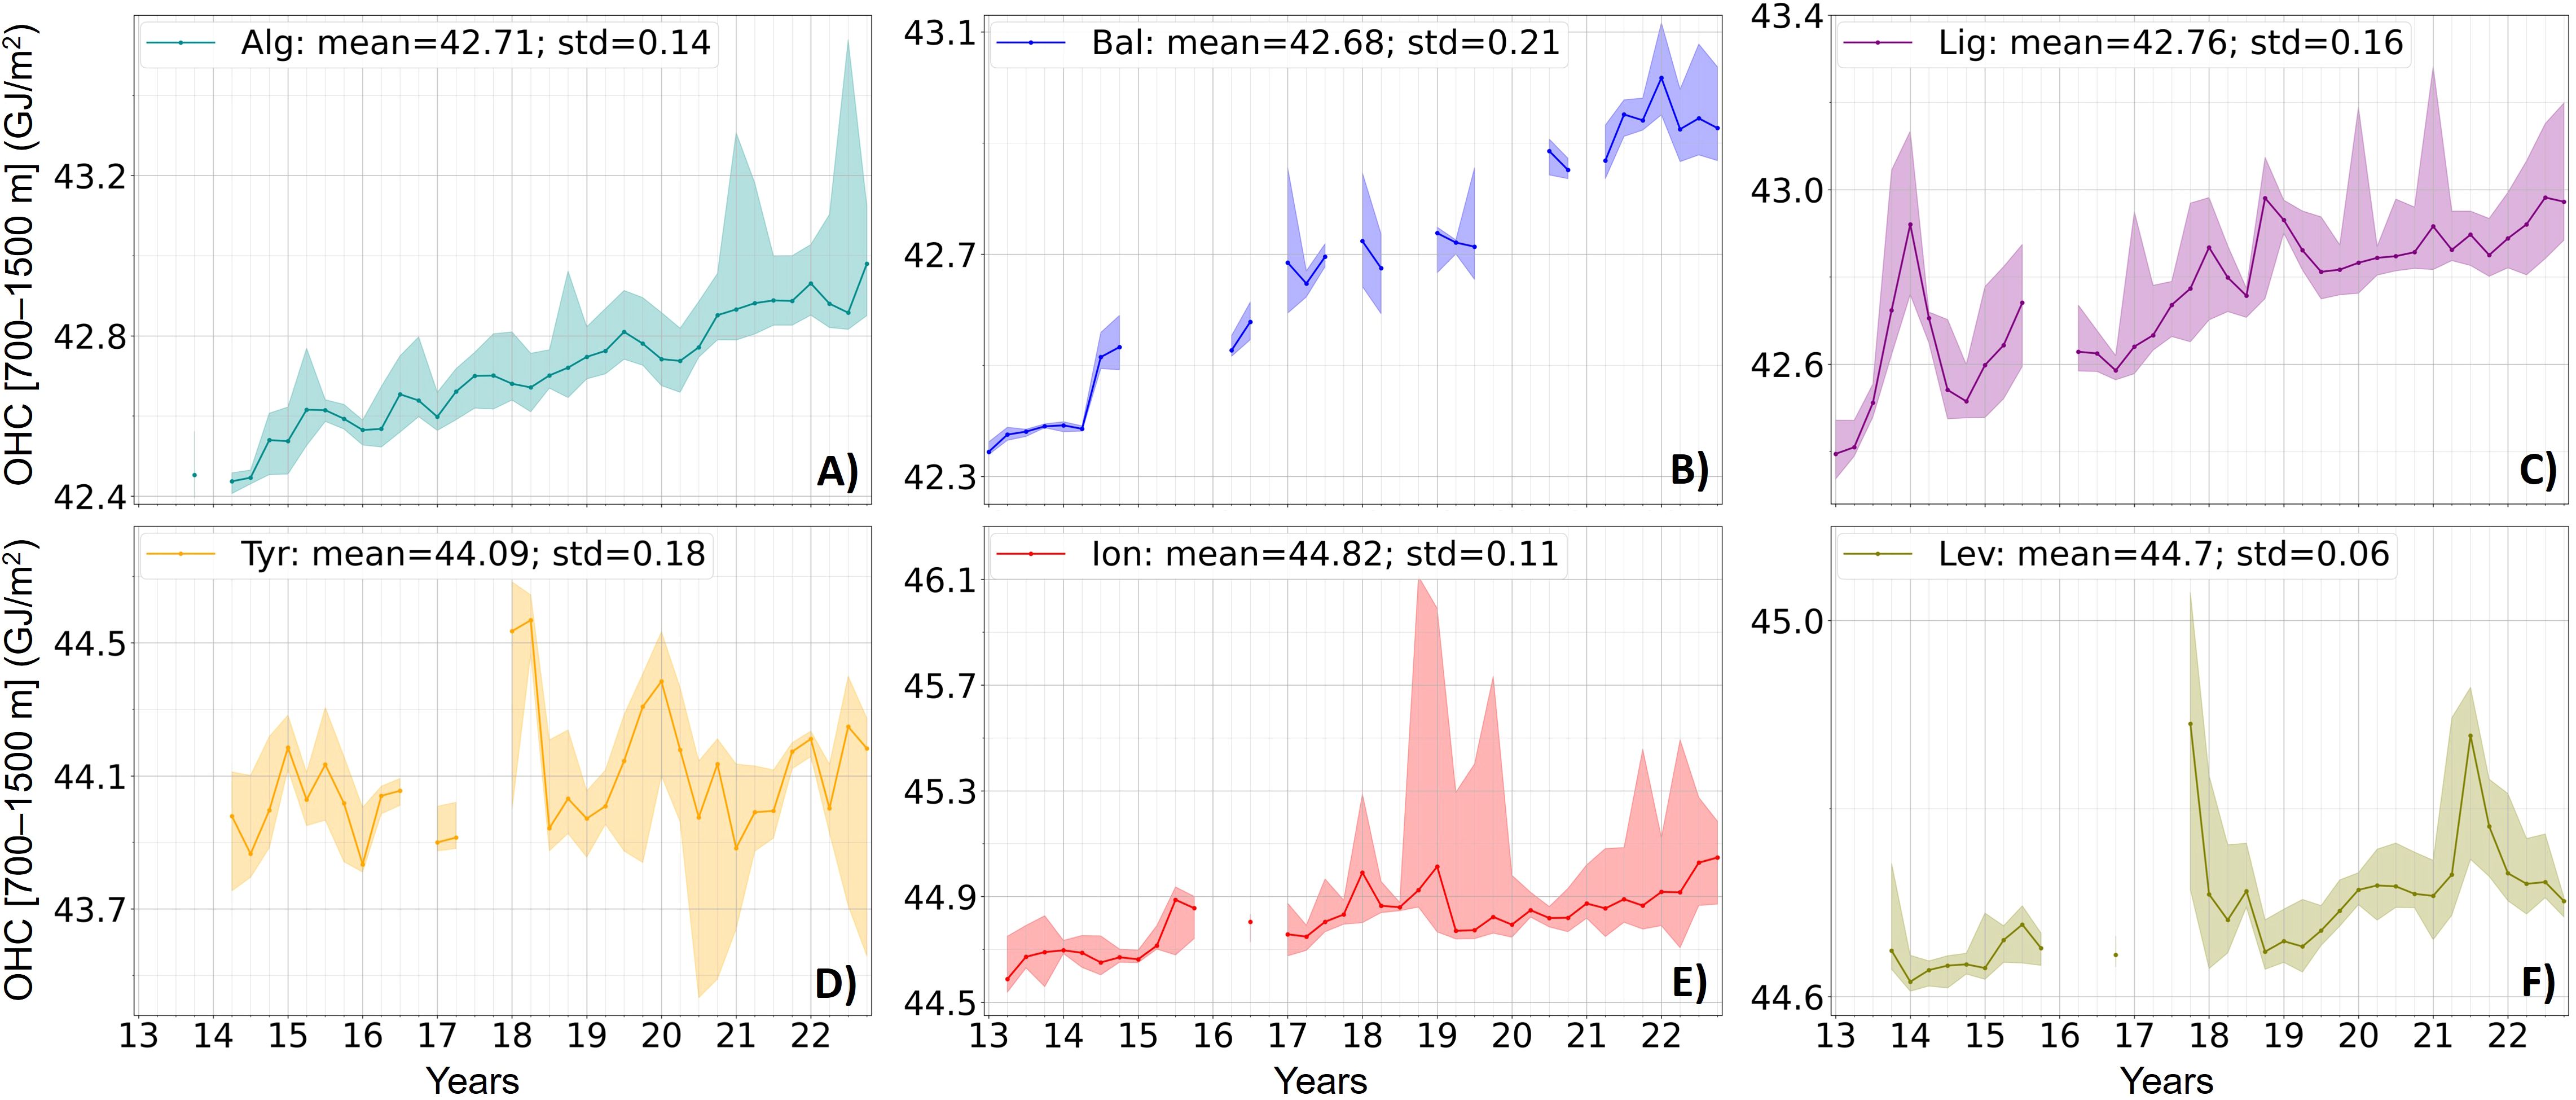
Figure 8. Same as Figure 4 for OHC (in GJ/m2) in the 700-1500 m layer for in the sub-regions of study: Algerian (A), Balearic (B), Ligurian (C), Tyrrhenian (D), Ionian (E) and Levantine (F).
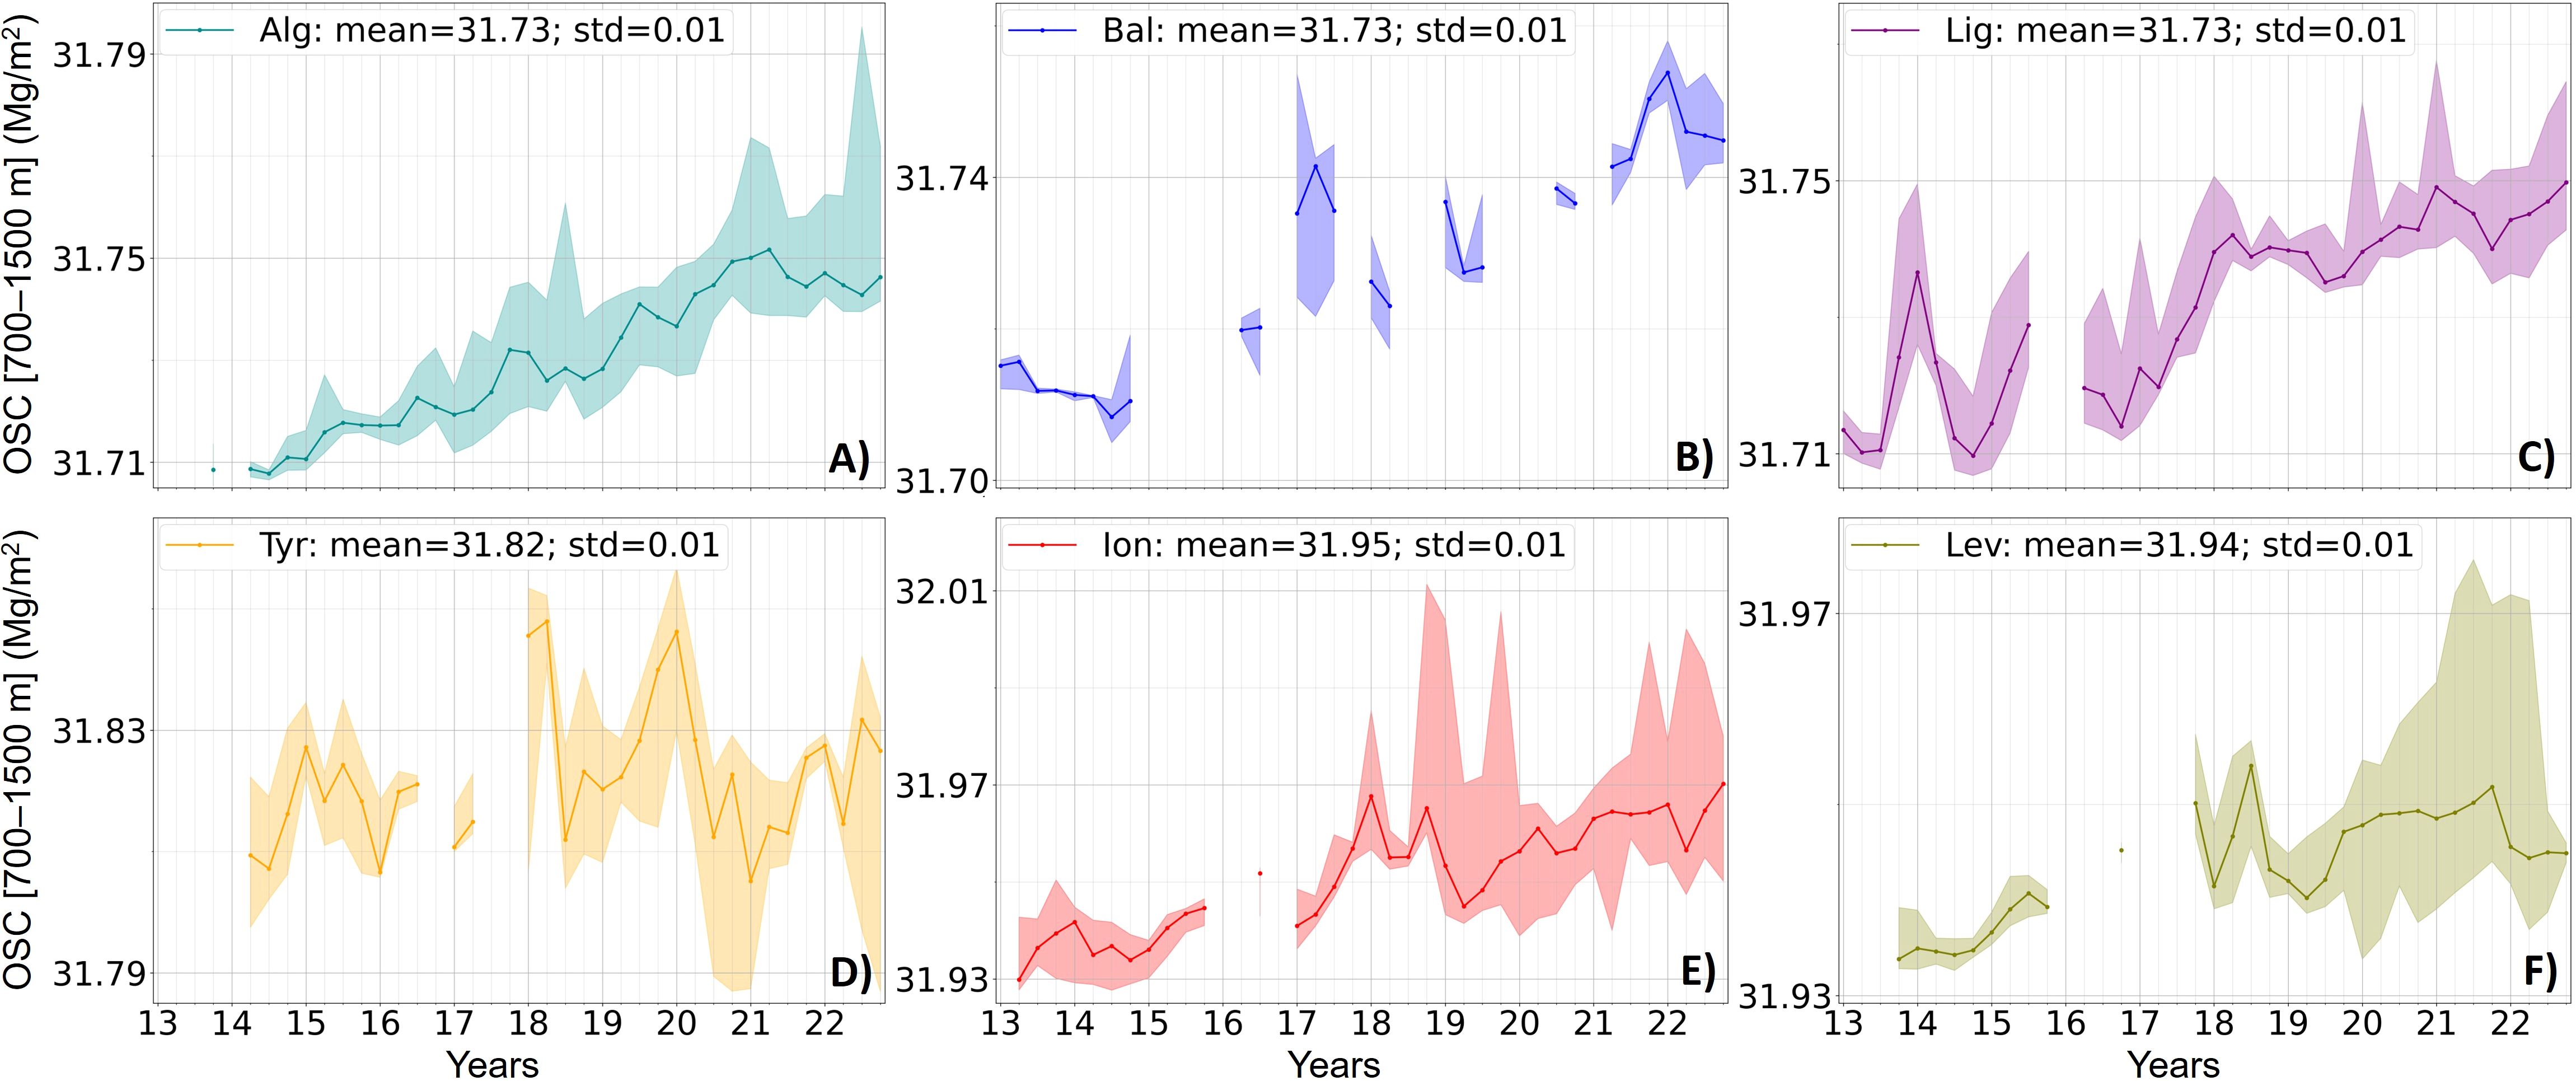
Figure 9. (A-F) Same as Figure 8 for OSC (in Mg/m2) in the 700-1500 m layer.
The deep layer is more stable than the above layers with low standard deviation values. Contrary to the other layers, the standard deviation of OHC time series is higher in the WMed than in the EMed sub-regions. This is the result of deep convection events in the north WMed, which drive the variability of the deep layer in this area. Indeed, the deep convection events of 2013 and 2018 reaching the seabed (Houpert et al., 2016) are well marked in the deep OHC and OSC time series in the Ligurian Sea (Figures 8, 9). The heat and salt inputs from LIW in the deep layer form the new Western Mediterranean Deep Water (WMDW), which is saltier and denser than the old WMDW. When flowing and reaching the bottom of the Tyrrhenian Sea (Schroeder et al., 2016), the recently formed WMDW meets the warmer and saltier Tyrrhenian resident deep waters. This process leads to negative jumps in both OHC and OSC in the deep layer of the Tyrrhenian basin and could explain the high OHC standard deviation observed in the sub-region (Figures 8, 9). In the Levantine basin, as for the intermediate layer, the high OHC and OSC values observed in autumn 2017 and summer-autumn 2021 might be related to the position of the floats inside the Mersa-Matruh anticyclonic gyre. Bringing heat and salt at both intermediate and deep levels, such structure might play a role in the future formation of intermediate and deep water masses (Moutin and Prieur, 2012).
Finally, OHC and OSC variability in the deep layer is well correlated in all sub-regions of the study. Correlations are higher in the WMed (0.95, 0.93, 0.94 and 0.96 in the Algerian, Balearic, Ligurian and Tyrrhenian, respectively) than in the EMed sub-regions (0.86 and 0.72 for the Ionian and Levantine, respectively), which suggests that OHC and OSC variations in the deep layer highly coincide in areas influenced by deep convection.
The spatial and vertical correlations of OHC and OSC are now investigated through the computation of the correlations between the different sub-regions in each layer (Figure 10) and between the different layers in each sub-region.

Figure 10. Correlation coefficients between the OHC and OSC seasonal time series over the period 2013-2022 of the different sub-regions in the upper, intermediate and deep layers. For each matrix, the lower part (below the diagonal) shows the correlation for OHC time series and the upper part (above the diagonal) shows the correlations for OSC time series.
In the upper layer, OHC variability is well correlated between the different sub-regions, resulting from the marked seasonal cycle in all sub-regions (Figure 4). The minimum correlation for the upper OHC is observed between the Alboran Sea and other sub-regions since the dynamics of this region is highly influenced by the entries of AW. The upper OHC tends to be more correlated between the WMed sub-regions (excluding the Alboran Sea) with correlations varying between 0.85 and 0.96 compared to the EMed sub-regions with correlations varying between 0.59 and 0.80. This might be due to the very different local dynamics from one sub-region to another in the EMed. Regarding the upper OSC variability where no seasonal cycle is visible, there is no correlation between sub-regions in both WMed and EMed. In the intermediate layer, both OHC and OSC time series show a correlation between the WMed sub-regions, with values varying between 0.63 and 0.83, and between 0.58 and 0.80, respectively, while correlation coefficients are lower between the EMed sub-regions. In the deep layer, the Algerian, Balearic and Ligurian sub-regions are also highly correlated in both OHC and OSC variations, which is a result of the extended deep convection events of the north WMed with correlations varying between 0.76 and 0.95 for OHC, and 0.74 and 0.88 for OSC. Contrary to the intermediate layer, there is no correlation between the variability of the Tyrrhenian Sea and other WMed sub-regions for OHC and OSC since deep convection events have opposite impacts - increase and decrease - on OHC and OSC in the deep layer in the Ligurian and Tyrrhenian Seas.
The vertical correlation of OHC and OSC time series shows that for all sub-regions, the variability of the upper layer is not correlated with the variability of the intermediate and deep layers (not shown). This might be due to the strong spatio-temporal variability of the upper layer associated with the effect of Argo sampling. However, the intermediate and deep layers are highly correlated for both OHC and OSC variability, especially in the WMed sub-regions with correlations of 0.91, 0.96 and 0.85 in the Algerian, Balearic and Ligurian sub-regions for OHC, respectively, and 0.91, 0.91 and 0.86 for OSC. This vertical correlation is not as strong in the EMed sub-regions and neither in the Tyrrhenian Sea, for the reasons explained previously.
The seasonal time series of OHCA and OSCA in the 10-150 m, 150-700 m and 700-1500 m layers in the different sub-regions show positive mean values in all sub-regions over the period 2013-2022 (not shown), meaning that the upper, intermediate and deep layers of the Mediterranean Sea have been globally warmer and saltier than over the reference period 1985-2018 which is used for the climatology. In this section, the linear trends of OHCA and OSCA in the three vertical layers and their associated uncertainties are estimated from the seasonal Argo data in the Algerian, Balearic, Ligurian, Tyrrhenian, Ionian and Levantine sub-regions. The Alboran, Adriatic and Cretan sub-regions are discarded since their associated time series are incomplete. In section 4.3, the model reanalysis will be also used to compute the sampling error on trend estimates. For this reason, the common period from winter 2013 to spring 2022 is used here. Results are summarized in Table 1.
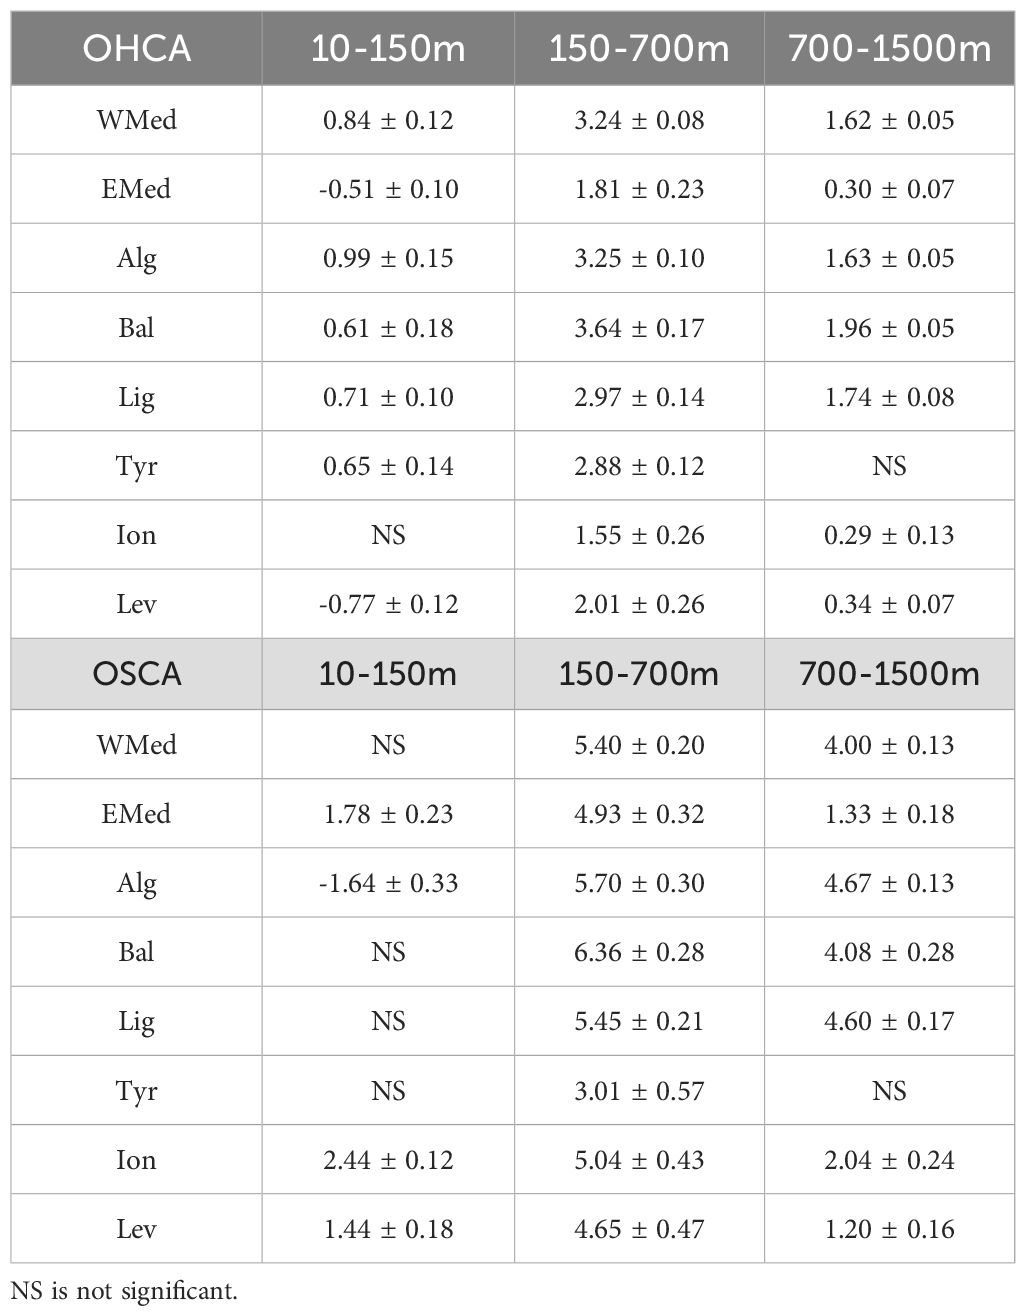
Table 1. Linear trends in OHCA (in W/m2) and OSCA (in kg/m2/y) from winter 2013 to spring 2022 with associated confidence intervals at 95% in the different sub-regions as computed from Argo data.
In the upper layer, the observed OHCA and OSCA show different trends in the WMed and in the EMed. As observed by Argo, the upper layer of the WMed is warming at a rate of 0.84 ± 0.12 W/m2 with no significant trend in salinity, while the EMed shows a decreasing rate in OHCA of -0.51 ± 0.10 W/m2 and a salinification increase of 1.78 ± 0.23 kg/m2/y. The observed warming trends in the Algerian, Balearic, Ligurian and Tyrrhenian Seas vary between 0.61 ± 0.18 and 0.99 ± 0.15 W/m2 (Table 1), respectively. The Ionian Sea does not show a significant trend in upper OHCA while the Levantine basin shows a negative trend, as detected by the Argo array. For the upper OSCA, no significant trend is observed in the WMed sub-regions except for the Algerian sub-basin, where a decreasing rate of -1.64 ± 0.33 kg/m2/y is observed, which could be explained by entries of AW (section 4.1.1). The strongest salinification rates of the upper layer are observed in the Ionian and Levantine sub-regions, with trends of 2.44 ± 0.12 and 1.44 ± 0.18 kg/m2/y, respectively.
The intermediate layer is clearly getting warmer and saltier over the period 2013-2022 in all sub-regions, the WMed warming faster than the EMed, with rates of 3.24 ± 0.08 and 1.81 ± 0.23 W/m2, respectively. The observed salinification rates are also higher in the WMed than in the EMed, with rates of 5.40 ± 0.20 and 4.93 ± 0.32 kg/m2/y, respectively. The Algerian, Balearic, Ligurian and Tyrrhenian sub-basins show the highest increasing trends in OHCA with values varying from 2.88 ± 0.12 to 3.64 ± 0.17 W/m2, the maximum being reached in the Balearic Sea. The lowest warming rates are observed in the Ionian Sea and Levantine sub-basin with values of 1.55 ± 0.26 and 2.01 ± 0.26 W/m2, respectively. Salinification rates in the intermediate layer are also higher in the WMed sub-regions (except the Tyrrhenian Sea) than in the EMed sub-regions (Ionian and Levantine), the maximum value of 6.36 ± 0.28 kg/m2/y being observed in the Balearic Sea.
As for the intermediate layer, the observed Mediterranean deep layer is globally getting warmer and saltier over the period 2013-2022 in all sub-regions except the Tyrrhenian Sea. The observed increasing trends in OHCA and OSCA are much higher in the WMed than in the EMed, with sub-basin scale values of 1.62 ± 0.05 W/m2 and 4.00 ± 0.13 kg/m2/y, respectively. In the WMed sub-regions, warming trends are detected by Argo in the deep Algerian, Balearic and Ligurian sub-regions with values of 1.63 ± 0.21, 1.96 ± 0.15 and 1.74 ± 0.15 W/m2, respectively, while there is no significant trend in OHCA in the Tyrrhenian Sea which is very likely due to the decreases in OHC generated by the inputs of new WMDW in the region (section 4.1.3). In the EMed sub-regions (Ionian and Levantine), the observed trends in OHCA increase at smaller rates than in the WMed. Increasing trends in OSCA are observed in the deep layer of all sub-regions (except in the Tyrrhenian Sea, for the same reasons as for OHCA), with salinification rates twice higher in the WMed sub-regions compared to the Ionian and Levantine Seas, with the maximum value of 4.67 ± 0.13 kg/m2/y reached in the Algerian sub-basin.
Data from reanalysis are used to estimate the sampling error of the Argo array (section 3.4). Model-observation comparisons show good model skills for this study. The values of seasonal OHC and OSC obtained from the sub-sampled model are relatively in agreement with the results obtained from Argo data. More precisely, the sub-regional RMSEs between Argo and sub-sampled model data are low in the upper, intermediate and deep layers, ranging over 0.04-0.10, 0.03-0.13 and 0.03-0.08 GJ/m2 for OHC, respectively, and 0.001-0.021, 0.002-0.006 and 0.003-0.007 Mg/m2 for OSC, respectively. Good agreement is also observed for the trend estimations in OHC and OSC anomalies within the three layers of study over the period 2013-2022 in both the western and eastern Mediterranean sub-basins (Supplementary Table 1).
In this section, the sampling error impact on OHC and OSC estimations and variability is thus evaluated by comparing the full-sampled and sub-sampled model data (section 3.4). Figures 11, 12 provide illustrations in the sub-regions where the sampling error is the highest. For the intermediate and deep layers, sampling errors are illustrated for OHC times series only (Figure 12) since the OHC and OSC variability is correlated in these layers (section 4.1) and the sampling errors have globally the same impacts on OHC and OSC in a given sub-region.
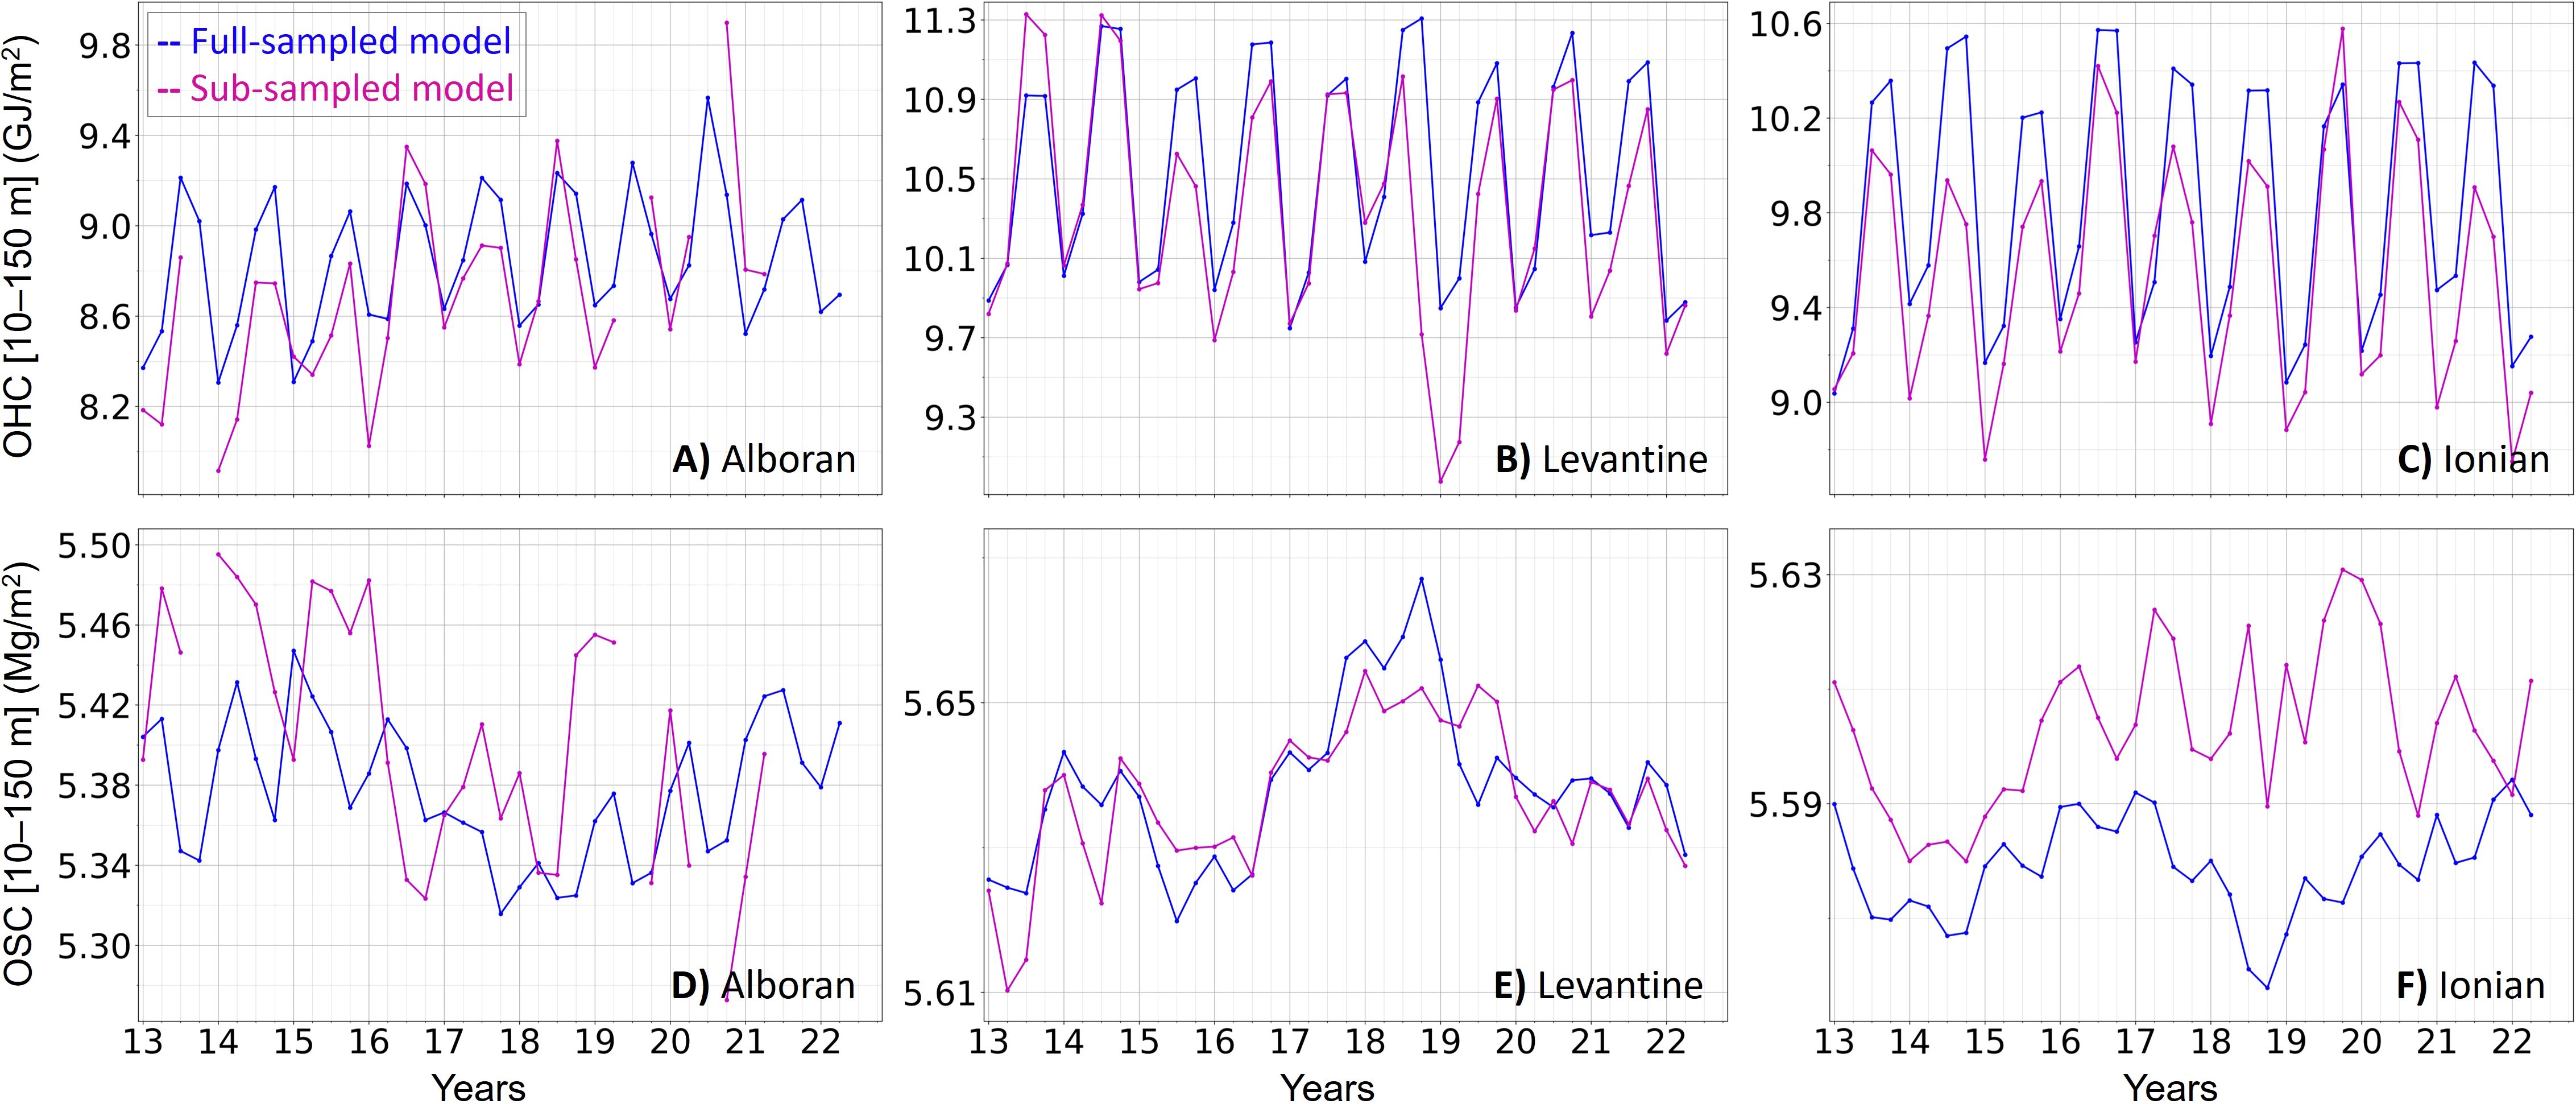
Figure 11. Seasonal 10-150 m OHC (in GJ/m2, A-C) and OSC (in Mg/m2, D-F) estimations from the fully-sampled (blue) and sub-sampled as Argo (magenta) model in the Alboran (A, D), Levantine (B, E) and Ionian (C, F) sub-regions.
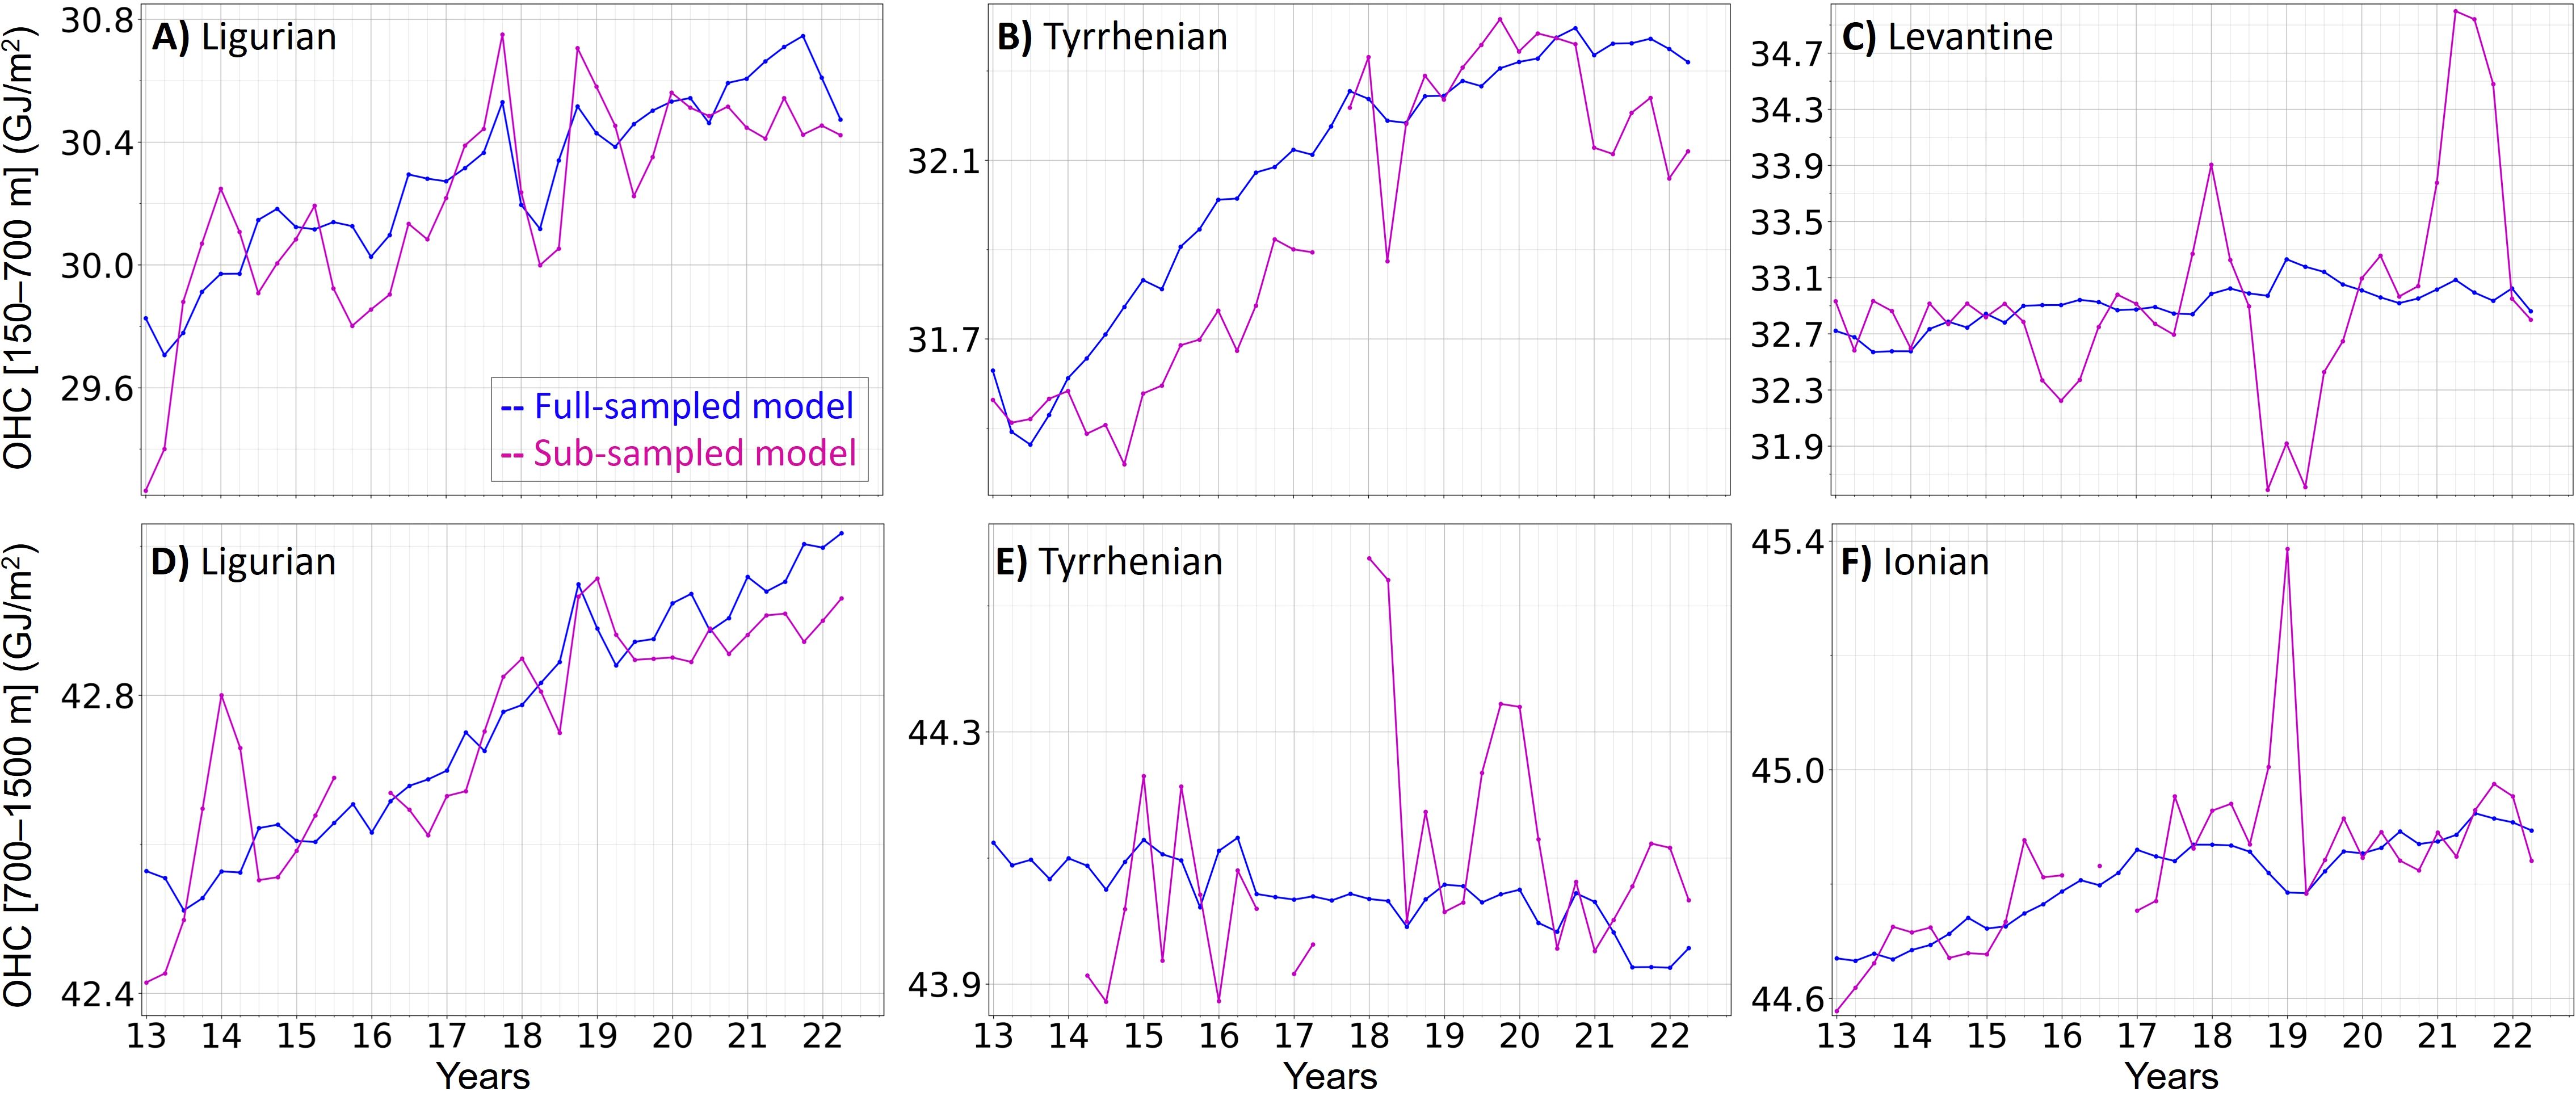
Figure 12. Same as Figure 11 for OHC within in the 150-700 m layer in the Algerian, Ligurian and Levantine sub-regions (A-C) and within the 700-1500 m layer in the Algerian, Ligurian and Tyrrhenian sub-regions (D-F).
In the upper layer, the seasonal cycle of OHC is well captured by the Argo array in all sub-regions (Figures 11A–C). The associated sub-regional MEs tend to be negative except in the Cretan passage, meaning that the Argo sampling tends to underestimate OHC (Table 2, Figures 11A–C). The opposite is observed for OSC with positive MEs in all sub-regions except in the Levantine sub-basin (Table 2, Figures 11D–F). This tendency to underestimate OHC and overestimate OSC in the upper layer remains small since these errors correspond to 0.1 to 2.8% and 0.04 to 0.5%, respectively, of the sub-regional mean OHC and OSC values. This impact is more pronounced in the Alboran and Ionian Seas (Figures 11A, C, D, F). MEs in OHC and OSC are high in the Ionian Sea with values of -0.27 GJ/m2 and 0.02 Mg/m2, respectively, where the sampling error introduces a rather constant bias (Figures 11C, F) due to the concentration of profiles in the northern part of the region (Supplementary Figure 2) which is colder and saltier at the surface on a yearly average compared to the rest of the sub-region. By considering the square of the error, the RMSE gives additional information on where the sampling error is the highest, either positive or negative. For OHC, RMSE is high in the Alboran, Ionian, Cretan and Levantine sub-regions (Table 2) (Figures 11B, C). In the case of the Alboran and Cretan sub-regions, the sampling leads to an increase of the standard deviations of OHC time series of 39 and 14%, respectively. However, in the Ionian and Levantine Seas, RMSE is high due to the bias introduced by the sampling but the variability is not affected (Figures 11B, C). For OSC, the observed RMSE is high in the Alboran, Balearic, Ionian and Cretan sub-regions (Table 2, Figures 11D, F), with standard deviations being multiplied by 3 in the Balearic Sea and Cretan passage, due to the sampling of AW entries and mesoscale structures, respectively (section 4.1). In the intermediate layer, the sub-regional MEs tend to be negative in OHC and OSC (Table 2), which means that the Argo sampling leads to slight underestimations of OHC and OSC, reaching at maximum 0.4% and 0.05% of the sub-regional mean values, respectively, both maxima being reached in the Tyrrhenian Sea (Figure 12B). The impact of sampling on OHC and OSC variations is important in this layer, with high RMSE observed in the Ionian, Cretan and Levantine sub-regions for OHC and in the Tyrrhenian, Cretan and Levantine for OSC (Table 2). The standard deviation of OHC and OSC time series is increased by a factor 5 and 2, respectively, in the Levantine (Figure 12C), due to the detection of gyres (section 4.1.2). Finally, in the deep layer, MEs oscillate between positive and negative values and there is no clear overestimation or underestimation due to the sampling (Table 2). However, the Argo sampling has an impact on variability and extreme values with high RMSE observed in both OHC and OSC in the Tyrrhenian and Ionian seas (Table 2, Figures 12E, F). This leads to increases of OHC and OSC standard deviations of 80% and 38% in the Ionian Sea, respectively, and by a factor 3 for both OHC and OSC in the Tyrrhenian Sea (Figure 12F) probably due to the detection of new WMDW (section 4.1.3).
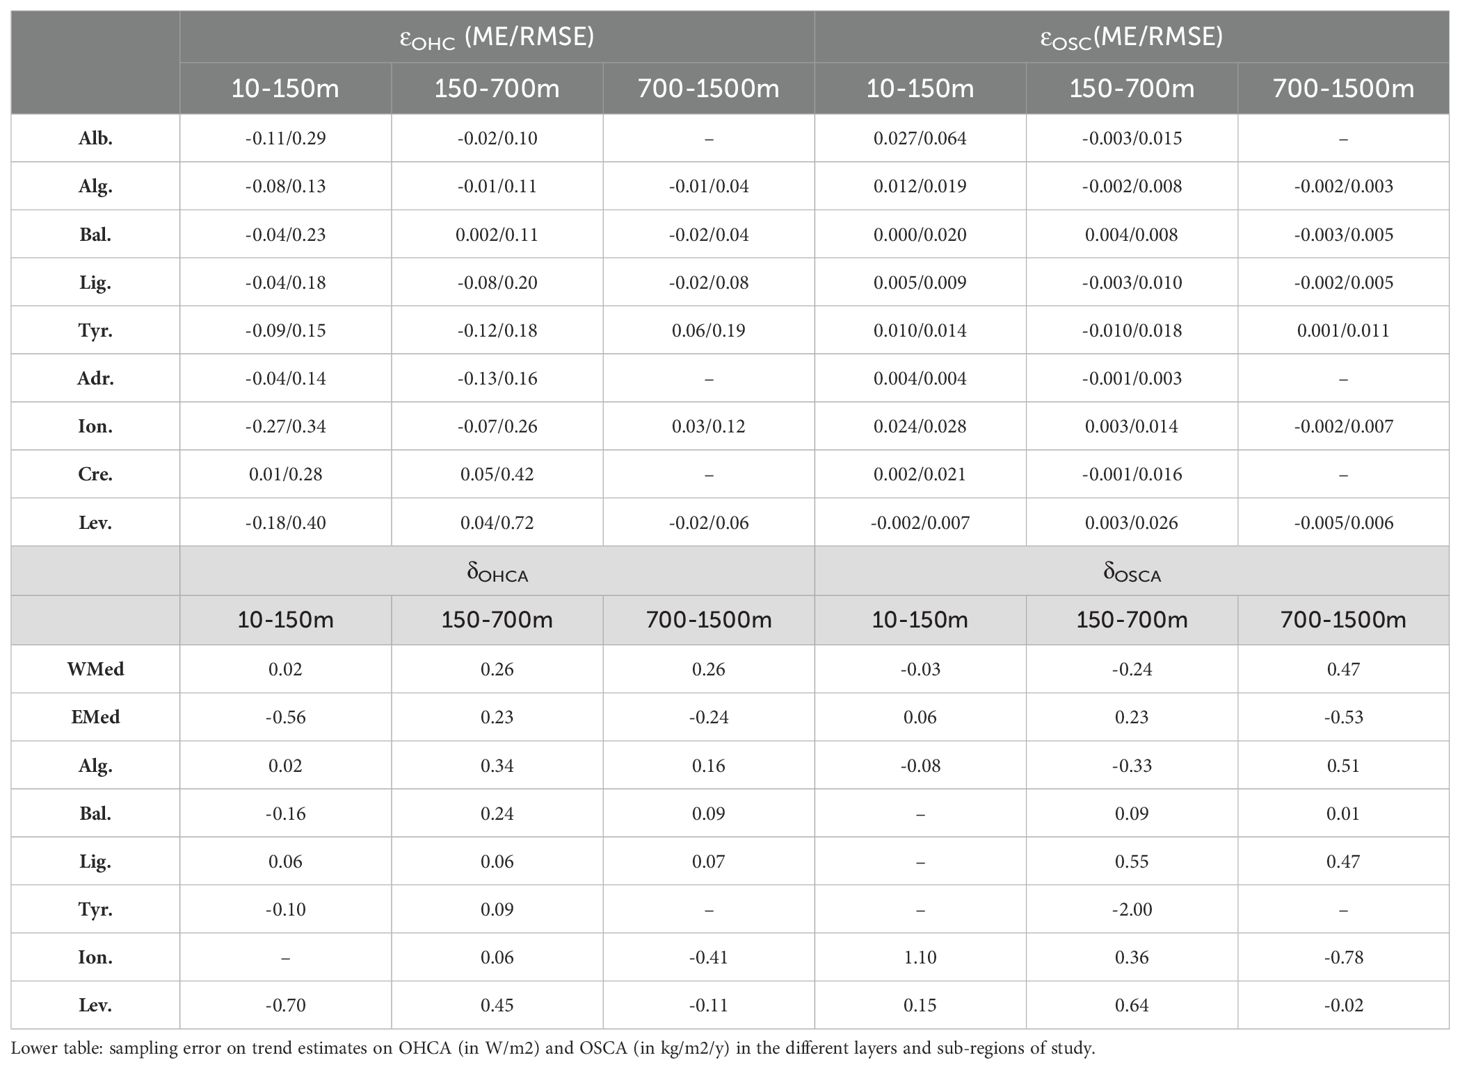
Table 2. Upper table: ME (left number) and RMSE (right number) between the sub-sampled and full-sampled models in seasonal OHC (in GJ/m2) and OSC (in Mg/m2) within the layers 10-150 m, 150-700 m and 700-1500 m from winter 2013 to spring 2022 in the sub-regions of study.
In this section, the impact of Argo sampling on trend estimates is evaluated by analyzing the sampling error in OHCA and OSCA trends (, Table 2). In the upper layer, the absolute value of the sampling error on warming trends varies from 0.02 W/m2 in the Algerian sub-basin to 0.70 W/m2 in the Levantine basin, where the sampling error represents 91% of the trend estimate from Argo (Table 1). For salinification trends, the sampling error varies from -0.08 kg/m2/y in the Algerian sub-basin to 1.10 kg/m2/y in the Ionian Sea, representing 45% of the trend estimation in this sub-region. In the intermediate layer, the sampling errors on warming trends in the different sub-regions oscillate between 2% in the Ligurian Sea to 22% in the Levantine basin. For salinification trends, the sampling errors are lower than 14% except in the Tyrrhenian Sea where the error reaches 40% of the trend estimate. These results show that Argo captured most of the sub-regional trends well in the intermediate layer. Finally, in the deep layer, the Argo sampling has the strongest impact in the Ionian Sea. In this sub-region, the error reaches -0.41 W/m2 and -0.78 kg/m2/y for OHCA and OSCA, representing 141% and 38% of the trend estimates, respectively. The lowest errors on OHCA and OSCA trends are observed in the Ligurian basin and Balearic Sea, respectively, where the error represents 4% and 0.25% of the trend estimates, respectively.
In this study, the capacity of the Argo floats network to estimate OHC and OSC variability over the period 2013-2022 in the Mediterranean Sea has been assessed at sub-regional scale from seasonal to interannual timescales.
The observed OHC and OSC are larger in the EMed than in the WMed in all layers in agreement with recent studies (Aydogdu et al., 2023; Kubin et al., 2023). The observed OHC and OSC variability is higher in the upper layer than in the intermediate and deep layers, which are more stable. The upper layer variability is driven by atmospheric forcings and local dynamics while the underlying layers are mainly influenced by convection events and mesoscale structures. These two latter seem to play an important role in the vertical and spatial connection of the sub-regions of the Mediterranean Sea, since the variability of the intermediate and deep layers is well correlated in sub-regions concerned by these processes (Algerian, Balearic, Ligurian and Levantine sub-basins). Also, a high correlation between OHC and OSC within these layers is observed in the WMed sub-regions resulting from the deep convection events that bring heat and salt at depth.
Although the sampling of the Argo network leads to slight underestimations of OHC and overestimations of OSC in the upper layer, the values and variability of OHC and OSC are well observed at sub-regional scale by the Argo array. The impact of sampling rather concerns the extreme values of the time series observed by Argo and depends more on the spatio-temporal distribution of profiles than on their number, due to the sub-regional dynamics. The highest sampling errors are thus observed in the intermediate layer of EMed sub-regions for OHC due to the detection of mesoscale structures, and in the upper layer of the Alboran Sea for OSC due to the detection of AW entries. The spatial scale of the sub-regional dynamics might also influence the sampling error since higher RMSE are observed in the intermediate layer of the EMed compared to the WMed, mainly because of the detection of local mesoscale structures (section 4.1.2). Due to the higher stability of the deep ocean, the sampling error is lower in the deep layer of most sub-regions but the detection of events can induce high increases of variability, like in the Tyrrhenian Sea. Finally, the sampling error is higher in the EMed than in the WMed for almost all layers and sub-regions, except for upper salinity in the Alboran Sea and the deep layer of the Tyrrhenian Sea. The sampling error thus tends to overestimate OHC and OSC variability in the EMed. A more precise division of this area may be recommendable, under the condition to have enough profiles available, highlighting the need for a further deployment of Argo in these sub-regions of the Mediterranean Sea.
Considering the anomalies of OHC and OSC for the computation of trends has allowed removing the seasonal cycle and reducing the impact of Argo sampling, which is particularly relevant in the surface layer. Results highlight opposite tendencies of OHCA and OSCA in the upper layer in the WMed and EMed over the period 2013-2022: the WMed is getting warmer with no significant trend observed in salinity while the EMed is clearly getting saltier with no apparent warming trend. Thus, the increasing upper salinity in the EMed may be not only caused by upper warming but also by decreases in river runoff and/or precipitation (Skliris et al., 2018). These results are also in agreement with the higher SST trends observed in the WMed than in the EMed over the same period (not shown). The intermediate layer is getting warmer and saltier over 2013-2022 in both the WMed and EMed, at higher rates than in other layers, which confirms that the intermediate layer is particularly affected by the warming and salinification of the Mediterranean Sea (Schroeder et al., 2016, 2017). The high salinification rate of the intermediate layer might be related to the observed upper salinification of the Levantine sub-basin, which favors the formation of saltier intermediate waters through the sinking of surface waters. The intermediate layer of WMed sub-regions (Algerian, Balearic and Ligurian) is particularly affected by these changes with higher warming and salinification trends than in the upper layer. These changes could modify the stratification and affect the formation of deep water masses as they contribute to the warming and salinification of the deep layer of the WMed over the period of study through deep convection processes (Houpert et al., 2016; Schroeder et al., 2016; Margirier et al., 2020). So, although the WMed holds less OHC and OSC than the EMed, its intermediate and deep layers are clearly getting warmer and saltier more rapidly over the period 2013-2022. Such changes might have significant consequences on the Mediterranean Outflow Water (MOW), whose properties are fundamental in modulating the global ocean circulation and climate pattern. The increase in salt observed in the deep layer of the WMed leads to a density increase of water masses feeding MOW, which might potentially shift its equilibrium depth in the North Atlantic to deeper levels (Candela, 2001).
In the upper layer, the highest sampling errors on OHCA trends are found in the EMed and Levantine Sea, where the sampling errors reach more than 90% of the associated trend estimates. The Argo floats were able to retrace the linear trends of OHCA and OSCA pretty well in the intermediate layer in all sub-regions, except for the salinity trend in the Tyrrhenian Sea. Although the deep layer is rather stable (section 4.1.3), the sampling error on trend estimations is important in the EMed and its sub-regions, which might be linked to the lack of Argo observations at depth in this part of the Mediterranean Sea. Again, this result confirms the need for a further deployment of Argo in the EMed.
The Argo network enables a robust evaluation of the OHC and OSC seasonal variability and annual trends from surface to depth at sub-regional scale in the Mediterranean Sea over the period 2013-2022. The use of a non-interpolated product of profiles allows identifying strong variations associated with sub-regional or local events and at the same time estimating the associated error induced by Argo array sampling since the location of the floats is known. In addition, the agreement of the trends with literature shows that the impact of local events like mesoscale circulation features or intermittent convection events has been taken into account without being overestimated. Therefore, the method proposed in this study has the advantage of taking into consideration ocean processes that might be underestimated in interpolated products, and contributing to a better understanding of the ocean dynamics and variability in the context of climate change.
Given the Argo observing capacity in the Mediterranean Sea as described in section 2, this study provides estimations on the sub-regional OHC and OSC variability within vertical layers from 10 to 1500 m over the period 2013-2022. The impacts of such limitations are now investigated using ensemble products and model outputs.
The OHCA trend computed from the Argo array in the 10-700 m layer over the whole Mediterranean Sea over the period 2013-2022 (3.40 ± 0.80 W/m2) is in accordance with estimations from Kubin et al. (2023) in the 5-700 m layer over the period 2005-2020 (3.59 ± 1.02 W/m2). However, combining observing and modeling products, the E.U Copernicus Marine Service Information estimates a warming rate of 1.4 ± 0.3 W/m2 in the 0-700 m layer of the Mediterranean Sea over the period 1993-2019 (von Schuckmann et al., 2020), with a sharp increase of the trend after 2005 with respect to the previous decade, as observed by Iona et al. (2018). Regarding trends in salinity, the Argo array observed an increase of 0.008 ± 0.0003 psu/y in the 10-300 m of the Mediterranean Sea over the period 2013-2022, which is 30% higher than the trend obtained from the Copernicus Marine Service reanalysis for the 0-300m over the period 1993-2019 with a value of 0.006 ± 0.0004 psu/y (Aydogdu et al., 2023). As for warming trends, the period of study might explain the higher trends observed by the Argo array in this study (along with the use of different data, processing methods and layer’s limits). Schroeder et al. (2017) and Placenti et al. (2022) also showed that the warming and salinification trends of the intermediate layer in the Sicily Channel, which is the transition zone of intermediate waters, had been accelerating in recent decades. This could explain the higher warming rate observed by Argo in the 150-700 m layer of the whole Mediterranean Sea (0.041 °C/y and 0.009 psu/y) compared to the LIW warming rate observed by Fedele et al. (2022) over the period 2001-2019 (0.022°C/y and 0.006 psu/y). Computations from the full-sampled model used in this study over the periods 1993-2022 and 2013-2022 confirm this result (Supplementary Table 1). In the WMed, the warming and salinification trends are 2.6 to 3.8 times larger in the upper, intermediate and deep layers of the WMed (except for upper salinity) over the last decade compared to the period 1993-2022, the highest increase being in the warming rate of the intermediate layer. In the EMed, where the observed increase of trends over the last decade is lower than in the WMed, the impact of the period of study mostly affects the deep layer where warming and salinification trends over 2013-2022 are 1.9 and 2.5 larger compared to 1993-2022, respectively. The differences of warming and salinification trends between the three different decades 1993-2002, 2003-2012 and 2013-2022 compared to the whole period 1993-2022 and between the WMed and EMed confirm the non-negligible impact of the period and area of study on trends computations in the Mediterranean Sea (Supplementary Table 1).
Because of the vertical sampling of the Argo array, trends in the upper 0-10 m and the layer below 1500 m have not been estimated using the Argo data. Trends computed from the full-sampled model in the 0-150 m and 10-150 m layers over the period 2013-2022 show an underestimation of 7% of the warming trend in the WMed when removing the upper 10 m and no significant trend in upper OHCA in the EMed. Trend comparisons also show an underestimation of 5% for the salinification trend in the EMed and no significant trend in upper salinity in the WMed. At depth, estimations from the full-sampled model show that the warming and salinification trends in the 700-1500 m of the WMed (1.43 ± 0.03 W/m2 and 3.26 ± 0.10 kg/m2/y, respectively) seem to propagate deeper since warming and salinification trends are also detected from 1500 m to the bottom of the WMed (0.46 ± 0.02 W/m2 and 2.03 ± 0.11 kg/m2/y, respectively). These results show that an increased sampling of the deep ocean by the Argo network could improve the understanding of the changes in the whole water column of the Mediterranean Sea.
Finally, Argo floats mainly observe the open ocean leaving the coastal shallow waters poorly sampled (Figure 2A). The deployment of coastal profiling floats (Kassis et al., 2021) would reinforce the ocean monitoring program in coastal areas which are of major interest for climate change assessment with crucial socio-economic implications (e.g. UNEP/MAP and Plan Bleu, 2020; Smith et al., 2021; CoastPredict programme as a contribution to the UN Decade of Oceans).
This study has contributed to estimate the variability of key ocean monitoring indicators, which are considered essential for climate change assessment by the international community (e.g. Copernicus Marine Service, Global Ocean Observing System, Intergovernmental Panel for Climate Change). The datasets and methodology used in this study could be implemented in operational applications for monitoring and visualization of ocean indicators (Juza and Tintoré, 2020). This easy-to-implement and cost-efficient approach could also be easily extended to other relevant derived variables (e.g. stratification, mixed layer and water masses’ properties) and applied to any regions of the global ocean. Similarly, the combined analyses of physical and biogeochemical data from Argo floats could help to understand the connection between the dynamics of the Mediterranean sub-regions and the impact of the observed physical changes on the biogeochemical ocean properties. BGC Argo floats have been deployed since 2012 in the Mediterranean Sea and have performed 30.463 cycles (all data modes and QC included) over the period 2013-2022, including 10.460 and 16.176 containing chlorophyll concentration and dissolved oxygen data, respectively, among other variables. These numbers are less than half the number of (P, T, S) profiles performed by Argo over the same period (65.523 cycles, all data modes and QC included), which supports the need for a further deployment of BGC Argo floats in the region. Such a monitoring program joined to Deep Argo, which is an expansion of Argo’s capabilities to depths up to 6000 m, would allow addressing the impact of the observed changes on abyssal ecosystems and on the carbon cycle which are crucial for the equilibrium of the whole region (Danovaro et al., 2001; Herrmann et al., 2014).
Regarding the methodology, if errors related to systematic instrumental biases are considered to be removed with the selection of DMQC profiles, the errors caused by measurement noise are not taken into account and their quantifications could improve the precision of the results. Also, although the error of climatology is decreased in the present method (no filling gap processes using climatology products is performed as done in some interpolated products), it might affect the computation of OHCA and OSCA time series. Sensitivity tests to various climatology datasets could help to quantify the contributions of climatology errors. Finally, the reanalysis product assimilates Argo data, which might influence the results obtained on the sampling error. Although its own dynamics allow its use to assess the Argo sampling, it could be interesting to apply the methodology to a free run simulation, being a totally independent source of data for estimating the impact of Argo sampling.
Finally, this study provides information on the ability of the Argo network to evaluate key ocean indicators at sub-regional scale. Results support the need to maintain the Mediterranean Argo network at least with its present spatial and temporal coverage to better understand the influence of sub-regional dynamics in the region, which is crucial for climate studies. Such work can also help to understand the future needs of the Argo community in the Mediterranean Sea, and supports the development of coastal and deep Argo data. The proposed approach also benefits the international community (e.g. Global Ocean Observing System, Global Climate Observing System and United Nations Framework Convention on Climate Change) by contributing to the evaluation of the needs for future monitoring of long-term ocean trends and climate change assessment.
Publicly available datasets were analyzed in this study. The datasets presented in this study can be found in online repositories. The names of the repository/repositories and accession number(s) can be found in the article/Supplementary Material.
CC: Writing – review & editing, Writing – original draft, Visualization, Software, Methodology, Investigation, Formal analysis, Data curation, Conceptualization. MJ: Writing – review & editing, Writing – original draft, Visualization, Supervision, Methodology, Investigation, Formal analysis, Conceptualization. LD-B: Writing – review & editing, Supervision, Methodology, Investigation, Formal analysis. ER: Writing – review & editing, Supervision, Methodology, Investigation, Formal analysis. RE: Writing – review & editing, Resources, Methodology, Formal analysis. JT: Writing – review & editing.
The author(s) declare that no financial support was received for the research, authorship, and/or publication of this article.
We gratefully acknowledge the two reviewers and the associate editor for their careful reading and very relevant comments that helped us to improve the manuscript. The Argo data were collected and made freely available by the International Argo Program and the national programs that contribute to it. The Argo Program is part of the Global Ocean Observing System. This study was conducted using Argo profiling floats distributed by Ifremer (www.ifremer.fr), model reanalysis from E.U. Copernicus Marine Service Information (https://doi.org/10.25423/CMCC/MEDSEA_MULTIYEAR_PHY_006_004_E3R1) and climatology provided by SeaDataCloud. The authors thank Guillaume Maze for making available the Argopy software for data processing.
The authors declare that the research was conducted in the absence of any commercial or financial relationships that could be construed as a potential conflict of interest.
All claims expressed in this article are solely those of the authors and do not necessarily represent those of their affiliated organizations, or those of the publisher, the editors and the reviewers. Any product that may be evaluated in this article, or claim that may be made by its manufacturer, is not guaranteed or endorsed by the publisher.
The Supplementary Material for this article can be found online at: https://www.frontiersin.org/articles/10.3389/fmars.2024.1416486/full#supplementary-material
Aydogdu A., Miraglio P., Escudier R., Clementi E., Masina S. (2023). The dynamical role of upper layer salinity in the Mediterranean Sea. State Planet 1, 1–9. doi: 10.5194/sp-2022-11
Borghini M., Bryden H., Schroeder K., Sparnocchia S., Vetrano A. (2014). The Mediterranean is becoming saltier. Ocean Sci. 10, 693–700. doi: 10.5194/os-10-693-2014
Cabanes C., Angel-Benavides I., Buck J., Coatanoan C., Dobler D., Herbert G., et al. (2021). DMQC cookbook for core Argo parameters. doi: 10.13155/78994
Candela J. (2001). “Mediterranean water and global circulation,” in Ocean Circulation and Climate. Eds. Siedler G., Church J., Gould J. (Academic Press, San Diego, Ca), 419–429. doi: 10.1016/S0074-6142(01)80132-7
Chelton D. B. (1983). Effects of sampling errors in statistical estimation. Deep Sea Res. Part A Oceanogr. Res. Papers 30, 1083–1103. doi: 10.1016/0198-0149(83)90062-6
Cheng L., Abraham J., Trenberth K. E., Fasullo J., Boyer T., Mann M. E., et al. (2023). Another year of record heat for the oceans. Adv. Atmos. Sci. 40, 963–974. doi: 10.1007/s00376-023-2385-2
Cooley S., Schoeman D., Bopp L., Boyd P., Donner S., Ghebrehiwet D. Y., et al. (2022). “Oceans and Coastal Ecosystems and Their Services,” in Climate Change 2022: Impacts, Adaptation and Vulnerability. Contribution of Working Group II to the Sixth Assessment Report of the Intergovernmental Panel on Climate Change. Ed. Pörtner H.-O., et al (Cambridge University Press, Cambridge, UK and New York, NY, USA), 379–550. doi: 10.1017/9781009325844.005
Danovaro R., Dell’Anno A., Fabiano M., Pusceddu A., Tselepides A. (2001). Deep-sea ecosystem response to climate changes: The eastern Mediterranean case study. Trends Ecol. Evol. 16, 505–510. doi: 10.1016/S0169-5347(01)02215-7
Dayan H., McAdam R., Juza M., Masina S., Speich S. (2023). Marine heat waves in the Mediterranean Sea: An assessment from the surface to the subsurface to meet national needs. Front. Mar. Sci. 10. doi: 10.3389/fmars.2023.1045138
Escudier R., Clementi E., Cipollone A., Pistoia J., Drudi M., Grandi A., et al. (2021). A high resolution reanalysis for the Mediterranean sea. Front. Earth Sci. 9. doi: 10.3389/feart.2021.702285
Escudier R., Clementi E., Nigam T., Aydogdu A., Fini E., Pistoia J., et al. (2022). EU Copernicus Marine Service Quality Information Document for Mediterranean Sea Physical Reanalysis, Issue 2.3, Mercator Ocean International. Available online at: https://catalogue.marine.copernicus.eu/documents/QUID/CMEMS-MED-QUID-006-004.pdf (Accessed 11 June 2024).
Escudier R., Clementi E., Omar M., Cipollone A., Pistoia J., Aydogdu A., et al. (2020). Mediterranean Sea Physical Reanalysis (CMEMS MED-Currents (Copernicus Monitoring Environment Marine Service (CMEMS). doi: 10.25423/CMCC/MEDSEA_MULTIYEAR_PHY_006_004_E3R1
Escudier R., Mourre B., Juza M., Tintoré J. (2016). Subsurface circulation and mesoscale variability in the Algerian subbasin from altimeter-derived eddy trajectories. J. Geophys. Res.: Oceans 121, 6310–6322. doi: 10.1002/2016JC011760
Estournel C., Durrieu de Madron X., Marsaleix P., Auclair F., C. and Vehil R. (2003). Observation and modeling of the winter coastal oceanic circulation in the Gulf of Lion under wind conditions influenced by the continental orography (FETCH experiment). J. Geophys. Res. (8059) 108. doi: 10.1029/2001JC000825
Fedele G., Mauri E., Notarstefano G., Poulain P. M. (2022). Characterization of the Atlantic Water and Levantine Intermediate Water in the Mediterranean Sea using 20 years of Argo data. Ocean Sci. 18, 129–142. doi: 10.5194/os-18-129-2022
Feistel R. (2012). TEOS-10: A new international oceanographic standard for seawater, ice, fluid water and humid air. Int. J. Thermophys. 33, 1335–1351. doi: 10.1007/s10765-010-0901-y
Giorgi F., Lionello P. (2008). Climate change projections for the Mediterranean region. Glob. Planet. Change 63, 90–104. doi: 10.1016/j.gloplacha.2007.09.005
Herrmann M., Estournel C., Adloff F., Diaz F. (2014). Impact of climate change on the northwestern Mediterranean Sea pelagic planktonic ecosystem and associated carbon cycle. J. Geophys. Res. Oceans 119, 5815–5836. doi: 10.1002/2014JC010016
Hoegh-Guldberg O., Jacob D., Taylor M., Bindi M., Brown S., Camilloni I., et al. (2018). “Impacts of 1.5°C Global Warming on Natural and Human Systems,” in Global Warming of 1.5°C. Ed. Masson-Delmotte V., et al (Cambridge University Press, Cambridge, UK and New York, NY, USA), 175–312. An IPCC Special Report on the impacts of global warming of 1.5°C above pre-industrial levels and related global greenhouse gas emission pathways, in the context of strengthening the global response to the threat of climate change, sustainable development, and efforts to eradicate poverty. doi: 10.1017/9781009157940.005
Houpert L., Durrieu de Madron X., Testor P., Bosse A., d’Ortenzio F., Bouin M. N., et al. (2016). Observations of open-ocean deep convection in the northwestern Mediterranean Sea: Seasonal and interannual variability of mixing and deep water masses for the 2007-2013 Period. J. Geophys. Res.: Oceans 121, 8139–8171. doi: 10.1002/2016JC011857
Iona A., Theodorou A., Sofianos S., Watelet S., Troupin C., Beckers J. M. (2018). Mediterranean Sea climatic indices: Monitoring long-term variability and climate changes. Earth Sys. Sci. Data 10, 1829–1842. doi: 10.5194/essd-10-1829-2018
Jordà G., von Schuckmann K., Josey S. A., Caniaux G., García-Lafuente J., Sammartino S., et al. (2017). The Mediterranean Sea heat and mass budgets: Estimates, uncertainties and perspectives. Prog. Oceanogr. 156, 174–208. doi: 10.1016/j.pocean.2017.07.001
Juza M., Escudier R., Pascual A., Pujol M. I., Taburet G., Troupin C., et al. (2016). Impacts of reprocessed altimetry on the surface circulation and variability of the Western Alboran Gyre. Adv. Space Res. 58, 277–288. doi: 10.1016/j.asr.2016.05.026
Juza M., Escudier R., Vargas-Yáñez M., Mourre B., Heslop E., Allen, et al. (2019). Characterization of changes in Western Intermediate Water properties enabled by an innovative geometry-based detection approach. J. Mar. Sys. 191, 1–12. doi: 10.1016/j.jmarsys.2018.11.003
Juza M., Fernández-Mora A., Tintoré J. (2022). Sub-regional marine heat waves in the Mediterranean sea from observations: long-term surface changes, sub-surface and coastal responses. Front. Mar. Sci. 9. doi: 10.3389/fmars.2022.785771
Juza M., Penduff T., Brankart J. M., Barnier B. (2012). Estimating the distortion of mixed layer property distributions induced by the Argo sampling. J. Oper. Oceanogr. 5, 45–58. doi: 10.1080/1755876X.2012.11020131
Juza M., Tintoré J. (2020). Sub-regional Mediterranean Sea Indicators: from event detection to climate change (Balearic Islands Coastal Observing and Forecasting System, SOCIB). Available at: www.apps.socib.es/subregmed-indicators.
Juza M., Tintoré J. (2021). Multivariate sub-regional ocean indicators in the Mediterranean sea: from event detection to climate change estimations. Front. Mar. Sci. 8. doi: 10.3389/fmars.2021.610589
Kassis D., Notarstefano G., Ruiz-Parrado I., Taillandier V., Díaz-Barroso L., Evrard E., et al. (2021). “Investigating the capability of Argo floats to monitor shallow coastal areas of the Mediterranean Sea,” in 9th EuroGOOS International conference, Shom; Ifremer; EuroGOOS AISBL, May 2021, Brest, France. 110–117, hal-03330612v2.
Kubin E., Menna M., Mauri E., Notarstefano G., Mieruch S., Poulain P. M. (2023). Heat content and temperature trends in the Mediterranean Sea as derived from Argo float data. Front. Mar. Sci. 10. doi: 10.3389/fmars.2023.1271638
Lavigne H., D’Ortenzio F., Ribera D’Alcalà M., Claustre H., Sauzède R., Gacic M. (2015). On the vertical distribution of the chlorophyll a concentration in the Mediterranean Sea: a basin-scale and seasonal approach. Biogeosci 12, 5021–5039. doi: 10.5194/bg-12-5021-2015
Levitus S., Antonov J., Boyer T. (2005). Warming of the world oceaocean 1955-2003. Geophys. Res. Lett. 32. doi: 10.1029/2004GL021592
Lionello P., Scarascia L. (2018). The relation between climate change in the Mediterranean region and global warming. Region. Environ. Change 18, 1481–1493. doi: 10.1007/s10113-018-1290-1
Lyman J. M., Good S. A., Gouretski V. V., Ishii M., Johnson G. C., Palmer M. D., et al. (2010). Robust warming of the global upper ocean. Nature 465, 334–337. doi: 10.1038/nature09043
Lyman J. M., Johnson G. C. (2008). Estimating annual global upper-ocean heat content anomalies despite irregular in situ ocean sampling. J. Climate 21, 5629–5641. doi: 10.1175/2008JCLI2259.1
Malanotte-Rizzoli P., Artale V., Borzelli-Eusebi G. L., Brenner S., Crise A., Gacic, et al. (2014). Physical forcing and physical/biochemical variability of the Mediterranean Sea: A review of unresolved issues and directions for future research. Ocean Sci. 10, 281–322. doi: 10.5194/os-10-281-2014
Manca B., Burca M., Giorgetti A., Coatanoan C., Garcia M. J., Iona A. (2004). Physical and biochemical averaged vertical profiles in the Mediterranean regions: an important tool to trace the climatology of water masses and to validate incoming data from operational oceanography. J. Mar. Sys. 48, 83–116. doi: 10.1016/j.jmarsys.2003.11.025
Margirier F., Testor P., Heslop E., Mallil K., Bosse A., Houpert L., et al. (2020). Abrupt warming and salinification of intermediate waters interplays with decline of deep convection in the Northwestern Mediterranean Sea. Sci. Rep. 10, 20923. doi: 10.1038/s41598-020-77859-5
Maze G., Balem K. (2020). Argopy: A Python library for Argo ocean data analysis. J. Open Source Software 5. doi: 10.21105/joss.02425
Mieruch S., Noël S., Bovensmann H., Burrows J. P. (2008). Analysis of global water vapour trends from satellite measurements in the visible spectral range. Atmos. Chem. Phys. 8, 491–504. doi: 10.5194/acp-8-491-2008
Millot C. (1999). Circulation in the western Mediterranean sea. J. Mar. Sys. 20, 423–442. doi: 10.1016/S0924-7963(98)00078-5
Moutin T., Prieur L. (2012). Influence of anticyclonic eddies on the Biogeochemistry from the Oligotrophic to the Ultraoligotrophic Mediterranean (BOUM cruise). Biogeosci 9, 3827–3855. doi: 10.5194/bg-9-3827-2012
Murphy A. H. (1995). The coefficients of correlation and determination as measures of performance in forecast verification. Weather forecast. 10, 681–688. doi: 10.1175/1520-0434(1995)010<0681:TCOCAD>2.0.CO;2
Ozer T., Gertman I., Kress N., Silverman J., Herut B. (2017). Interannual thermohaline, (1979–2014) and nutrient, (2002–2014) dynamics in the Levantine surface and intermediate water masses, SE Mediterranean Sea. Glob. Planet. Change 151, 60–67. doi: 10.1016/j.gloplacha.2016.04.001
Özsoy E., Hecht A., Ünlüata Ü., Brenner S., Sur H. I., Bishop J., et al. (1993). A synthesis of the Levantine Basin circulation and hydrography 1985-1990. Deep-Sea Res. Part II 40, 1075–1119. doi: 10.1016/0967-0645(93)90063-S
Pisano A., Marullo S., Artale V., Falcini F., Yang C., Leonelli F. E., et al. (2020). New evidence of Mediterranean climate change and variability from sea surface temperature observations. Remote Sens. 12, 132. doi: 10.3390/rs12010132
Placenti F., Torri M., Pessini F., Patti B., Tancredi V., Cuttitta A., et al. (2022). Hydrological and biogeochemical patterns in the Sicily Channel: new insights from the last decade, (2010–2020). Front. Mar. Sci. 9. doi: 10.3389/fmars.2022.733540
Poulain P.-M., Barbanti R., Font J., Cruzado A., Millot C., Gertman I., et al. (2007). MedArgo: a drifting profiler program in the Mediterranean Sea. Ocean Sci. 3, 379–395. doi: 10.5194/os-3-379-2007
Rhein M., Rintoul S. R., Aoki S., Campos E., Chambers D., Feely R. A., et al. (2013). “Observations: Ocean,” in Climate Change 2013: The Physical Science Basis. Contribution of Working Group I to the Fifth Assessment Report of the Intergovernmental Panel on Climate Change. Ed. Stocker T. F. (Cambridge University Press, Cambridge, United Kingdom and New York, NY, USA).
Robinson A. R., Leslie W. G., Theocharis A., Lascaratos A. (2001). Mediterranean sea circulation. Ocean Currents 1, 19. doi: 10.1016/B978-012374473-9.00376-3
Roemmich D., Alford M. H., Claustre H., Johnson K., King B., Moum J., et al. (2019). On the future of Argo: A global, full-depth, multi-disciplinary array. Front. Mar. Sci. 6. doi: 10.3389/fmars.2019.00439
Roemmich D., Gilson J. (2009). The 2004–2008 mean and annual cycle of temperature, salinity, and steric height in the global ocean from the Argo Program. Prog. oceanogr. 82, 81–100. doi: 10.1016/j.pocean.2009.03.004
Sanchez-Gomez E., Somot S., Mariotti A. (2009). Future changes in the Mediterranean water budget projected by an ensemble of regional climate models. Geophys. Res. Lett. 36. doi: 10.1029/2009GL040120
Schroeder K., Chiggiato J., Bryden H. L., Borghini M., Ben Ismail S. (2016). Abrupt climate shift in the Western Mediterranean Sea. Sci. Rep. 6, 23009. doi: 10.1038/srep23009
Schroeder K., Chiggiato J., Josey S. A., Borghini M., Aracri S., Sparnocchia S. (2017). Rapid response to climate change in a marginal sea. Sci. Rep. 7, 4065. doi: 10.1038/s41598-017-04455-5
Simoncelli S., Oliveri P., Mattia G. (2020a). SeaDataCloud Mediterranean Sea - V2 Temperature and Salinity Climatology. doi: 10.12770/3f8eaace-9f9b-4b1b-a7a4-9c55270e205a
Simoncelli S., Oliveri P., Mattia G., Myroshnychenko V., Barth A., Troupin C. (2020b). SeaDataCloud Temperature and Salinity Climatology for the Mediterranean Sea (Version 2) (Product Information Document (PIDoc). doi: 10.13155/77514
Skliris N., Zika J. D., Herold L., Josey S. A., Marsh R. (2018). Mediterranean sea water budget long-term trend inferred from salinity observations. Clim. Dyn. 51, 2857–2876. doi: 10.1007/s00382-017-4053-7
Smith K. E., Burrows M. T., Hobday A. J., Sen Gupta A., Moore P. J., Thomsen M., et al. (2021). Socioeconomic impacts of marine heatwaves: Global issues and opportunities. Sci 374, eabj3593. doi: 10.1126/science.abj3593
Taillandier V., D’Ortenzio F., Prieur L., Conan P., Coppola L., Cornec M., et al. (2022). Sources of the levantine intermediate water in winter 2019. J. Geophys. Res.: Oceans 127. doi: 10.1029/2021JC017506
Testor P., Bosse A., Houpert L., Margirier F., Mortier L., Legoff H., et al. (2018). Multiscale observations of deep convection in the northwestern Mediterranean Sea during winter 2012–2013 using multiple platforms. J. Geophys. Res. Oceans 123, 1745–1776. doi: 10.1002/2016jc012671
Tintoré J., Pinardi N., Álvarez-Fanjul E., Aguiar E., Álvarez-Berastegui D., Bajo M., et al. (2019). Challenges for sustained observing and forecasting systems in the Mediterranean sea. Front. Mar. Sci. 6. doi: 10.3389/fmars.2019.00568
Tintoré J., Vizoso G., Casas B., Ruiz S., Heslop E., Renault L., et al. (2013). SOCIB; the Balearic Islands Observing and Forecasting System responding to science, technology and society needs. Mar. Tech Soc J. 47, 101–117. doi: 10.4031/MTSJ.47.1.10
United Nations Environment Programme/Mediterranean Action Plan and Plan Bleu. (2020). State of the Environment and Development in the Mediterranean (Nairobi). Available online at: https://planbleu.org/wp-content/uploads/2021/04/SoED_full-report.pdf (Accessed 25 March, 2024).
Vargas-Yáñez M., Juza M., Balbín R., Velez-Belchí P., García-Martínez M. C., Moya F., et al. (2020). Climatological hydrographic properties and water mass transports in the Balearic channels from repeated observations over 1996–2019. Front. Mar. Sci. 7. doi: 10.3389/fmars.2020.568602
Vargas-Yáñez M., Juza M., García-Martínez M. C., Moya F., Balbín R., Ballesteros E., et al. (2021). Long-term changes in the water mass properties in the Balearic channels over the period 1996–2019. Front. Mar. Sci. 8. doi: 10.3389/fmars.2021.640535
von Schuckmann K., Gaillard F., Traon P. Y. L. (2009). Global hydrographic variability patterns during 2003-2008. J. Geophys. Res.: Oceans 114. doi: 10.1029/2008JC005237
von Schuckmann K., Le Traon P. Y. (2011). How well can we derive Global Ocean Indicators from Argo data? Ocean Sci. 7, 783–791. doi: 10.5194/os-7-783-2011
von Schuckmann K., le Traon P. Y., Smith N., Pascual A., Djavidnia S., Gattuso J. P., et al. (2019). Copernicus marine service ocean state report, issue 3. J. Oper. Oceanogr. 12, S1–S123. doi: 10.1080/1755876X.2019.1633075
von Schuckmann K., le Traon P. Y., Smith N., Pascual A., Djavidnia S., Gattuso J. P., et al. (2020). Copernicus marine service ocean state report, issue 4. J. Oper. Oceanogr. 13, S1–S172. doi: 10.1080/1755876X.2019.1633075
von Schuckmann K., Minère A., Gues F., Cuesta-Valero F. J., Kirchengast G., Adusumilli S., et al. (2023). Heat stored in the Earth system 1960–2020: where does the energy go? Earth Sys. Sci. Data 2022, 1–55. doi: 10.5194/essd-15-1675-2023
von Schuckmann K., Sallée J. B., Chambers D., le Traon P. Y., Cabanes C., Gaillard F., et al. (2014). Consistency of the current global ocean observing systems from an Argo perspective. Ocean Sci. 10, 547–557. doi: 10.5194/os-10-547-2014
Wong A. P. S., Gilson J., Cabanes C. (2023). Argo salinity: bias and uncertainty evaluation. Earth Sys. Sci. Data 15, 1–21. doi: 10.5194/essd-15-383-2023
Wong A. P. S., Wijffels S. E., Riser S. C., Pouliquen S., Hosoda S., Roemmich D., et al. (2020). Argo data 1999–2019: two million temperature-salinity profiles and subsurface velocity observations from a global array of profiling floats. Front. Mar. Sci. 7. doi: 10.3389/fmars.2020.00700
Keywords: Argo floats, observing capability, sampling error, ocean heat and salt contents, Mediterranean Sea
Citation: Chevillard C, Juza M, Díaz-Barroso L, Reyes E, Escudier R and Tintoré J (2024) Capability of the Mediterranean Argo network to monitor sub-regional climate change indicators. Front. Mar. Sci. 11:1416486. doi: 10.3389/fmars.2024.1416486
Received: 12 April 2024; Accepted: 27 August 2024;
Published: 27 September 2024.
Edited by:
Pierre-Marie Poulain, National Institute of Oceanography and Applied Geophysics (Italy), ItalyReviewed by:
Anna Teruzzi, National Institute of Oceanography and Applied Geophysics (Italy), ItalyCopyright © 2024 Chevillard, Juza, Díaz-Barroso, Reyes, Escudier and Tintoré. This is an open-access article distributed under the terms of the Creative Commons Attribution License (CC BY). The use, distribution or reproduction in other forums is permitted, provided the original author(s) and the copyright owner(s) are credited and that the original publication in this journal is cited, in accordance with accepted academic practice. No use, distribution or reproduction is permitted which does not comply with these terms.
*Correspondence: Carla Chevillard, Y2FybGEuY2hldmlsbGFyZDJAZ21haWwuY29t; Mélanie Juza, bWp1emFAc29jaWIuZXM=
†Present address: Carla Chevillard, IFREMER, Unité de Recherche Lagons, Ecosystèmes et Aquaculture Durable en Nouvelle Calédonie (LEAD-NC), Nouméa, New Caledonia
Disclaimer: All claims expressed in this article are solely those of the authors and do not necessarily represent those of their affiliated organizations, or those of the publisher, the editors and the reviewers. Any product that may be evaluated in this article or claim that may be made by its manufacturer is not guaranteed or endorsed by the publisher.
Research integrity at Frontiers
Learn more about the work of our research integrity team to safeguard the quality of each article we publish.