 Chao Li
 Yu-Ze Song
 Hui-Min Si1,2
95% of researchers rate our articles as excellent or good
Learn more about the work of our research integrity team to safeguard the quality of each article we publish.
Find out more
ORIGINAL RESEARCH article
Front. Mar. Sci. , 04 July 2024
Sec. Marine Pollution
Volume 11 - 2024 | https://doi.org/10.3389/fmars.2024.1414686
Monitoring the quality of marine water is crucial for ensuring the health and sustainability of marine ecosystems. The conventional monitoring approach involves manual sampling using a water sampler, followed by packaging the water samples in plastic bottles and transporting them to a terrestrial laboratory for analysis. However, this method is time consuming, labor intensive, and cannot provide real-time data for addressing unforeseen circumstances. In response to these challenges, an advanced shipborne integrated platform for water quality inspection (ASIPWQI) has been proposed and implemented. This system automates the collection of multi-layer seawater samples in the vertical profile, conducts online measurements of monitoring elements, and provides real-time measurement data. In multiple sea trials, ASIPWQI successfully conducted on-site collection and measurement of a significant number of samples, meeting the water quality monitoring requirements in China’s nearshore waters. Comparative analysis of the laboratory measurement results for nutrients, heavy metals, and total phosphorus and nitrogen in water samples collected using automatic and manual methods revealed no significant differences between the two sampling approaches and demonstrated strong correlation. Further analysis using practical relative error (PRE) statistical methods showed that the data rate of most monitoring elements with relative errors less than 10% was higher than 70%, with nitrite, silicate, and phosphate even exceeding 90%. This indicate that ASIPWQI has excellent stability and applicability, offering a viable alternative to traditional manual sampling and laboratory testing. This innovation makes water quality monitoring significantly more efficient.
The quality of ocean water is a critical concern and is influenced by various factors, including natural processes and human activities. As the global population continues its rapid growth, land resources are becoming increasingly scarce, and so countries are turning their attention to the ocean and developing marine resources (Zheng et al., 2013; He et al., 2018). Marine development offers significant economic benefits and is now crucial to the national economies of coastal countries, but it poses numerous ecological and environmental challenges (MNR, 2011; McEliece et al., 2020). A significant contributor to changes in ocean water quality is ship navigation. Ranging from small vessels to large cargo carriers, ships traverse the world’s oceans for transportation, trade, and commerce. However, these maritime activities can have substantial impacts on the marine environment, including water quality (Popek et al., 2022). As ships move through the ocean, they release various pollutants and contaminants into the water, both intentionally and unintentionally. These pollutants include oil, fuel, sewage, ballast water, and chemicals used for cleaning and maintenance. Oil spills from ship accidents or illegal discharges can cause catastrophic environmental damage, affecting marine life and coastal habitats (Singh et al., 2020). Furthermore, the physical disturbance caused by ship movements can disrupt sediment and seabed ecosystems, further influencing water quality (Marghany, 2021). The rapid expansion of coastal cities has exacerbated the issue by increasing the spread of land-based pollutants into the ocean, resulting in a deterioration of marine ecosystems, and posing significant obstacles to the sustainable development of coastal economies (Edinger and Risk, 2013; Cebe and Balas, 2018). Consequently, major coastal nations protect the health and integrity of ocean ecosystems through effective management strategies, regulations, and technological innovations (EU, 2008; Zhang et al., 2018; MNR, 2023). Marine environmental monitoring is essential for safeguarding marine environments and is very important for environmental protection and governance; monitoring outcomes serve as the fundamental basis for crafting protection policies and managing pollution incidents, and they are integral to marine environmental scientific research (Zhang et al., 2021; Cao and Jiang, 2022). Advances in marine environmental monitoring technology are crucial for understanding the natural laws governing marine environments, preserving ecological balance, promoting the sustainable development of marine resources, enhancing early-warning capabilities, and reducing the impact of marine disasters (Bai and Zhao, 2019; Wang et al., 2023).
As society and technology advance, so automatic online monitoring technology becomes increasingly prevalent in marine environmental monitoring because it offers real-time data collection, high integration, and labor-saving capabilities. The advent of buoy observation technology in the 1940s was a significant milestone because it introduced sensors that could detect oceanic and atmospheric conditions, enabling continuous online monitoring during operational hours (Dai et al., 2014). Subsequent decades witnessed a rapid evolution in ocean monitoring buoys, particularly in the 1970s with the integration of computer and satellite communication technologies, further enhancing their capabilities (Helmi et al., 2014; Wang et al., 2016; Lu et al., 2022). By the 1980s, the United States had established coastal ocean automatic monitoring stations, facilitating real-time monitoring of atmospheric and hydrological data (Zhu, 1997). Continuous enhancement of the functionalities of automatic monitoring stations has made them the primary means of marine environmental monitoring, and this evolution underscores the pivotal role of technological advancements in revolutionizing marine environmental monitoring practices (Qi and Li, 2019). In the 21st century, human exploration of the ocean has extended to the seabed at depths of several thousand meters, and the use of seabed observation network technology is enabling high-resolution and real-time in situ observations of physical, chemical, biological, and geological processes in specific areas (Barnes et al., 2013; Li et al., 2021; Xu et al., 2021).
The aforementioned monitoring methods involve installing lightweight online monitoring sensors on various platforms to achieve long-term continuous monitoring of the target area. However, these monitoring systems are limited by the fact that the monitoring area is fixed and so cannot be moved freely. Also, certain online monitoring sensors—such as those for trace heavy metals, nutrients, and hydrocarbons—face challenges in miniaturization and integration into existing platforms, thereby necessitating the development of new monitoring platforms. Shipborne monitoring platforms offer significant advantages, including ample space, high mobility, and a wide monitoring range, thereby effectively addressing the shortcomings of existing platforms (Wang et al., 2021). In 1993, the Finnish Institute of Marine Research used ferries to study the regular online monitoring of algal blooms and nutrient distribution in the Baltic Sea (Ruokanen et al., 2003). Subsequently, from 2003 to 2005, the European Union funded the development of the FerryBox observation system, operating primarily on shipborne observation platforms such as volunteer ships, merchant ships, and cargo ships; this system provided ocean monitoring data to the European Global Ocean Observing System, encompassing parameters such as temperature, salinity, pH, dissolved oxygen, turbidity, chlorophyll, partial pressure of carbon dioxide, and nutrients (Marrec et al., 2014; Petersen, 2014). Building on the success of the European FerryBox system, countries such as the United States, Canada, Japan, and Australia have initiated similar shipborne online monitoring projects (Paerl et al., 2009; Halverson and Pawlowicz, 2013). However, it is important to note that these onboard monitoring systems measure surface seawater during navigation, thereby limiting their ability to monitor middle and bottom seawater layers. Nevertheless, the variable vertical distributions of nutrients, heavy-metal ions, and hydrocarbons in seawater due to factors such as suspended sediment flocculation and diffusion of seabed sediment layers make it essential to monitor those layers as well (Turetta et al., 2005; Zhang et al., 2010).
To the best of our knowledge, there have been no reports to date of shipborne online monitoring systems that can monitor the quality of surface, middle, and bottom waters imultaneously. With the support of the National High-tech Research and Development Program, we have conducted research on an advanced shipborne integrated platform for water quality inspection (ASIPWQI), which in the form described herein is installed on the Xiangyanghong 08 marine monitoring ship. In ASIPWQI, a pump is used to draw water samples onto the ship and store them in multiple tanks; these water samples are then delivered to water quality analysis instruments through distribution pipelines for real-time analysis; finally, the analysis results are transmitted to the integrated management platform for storage via the ship’s local area network (LAN). ASIPWQI can rapidly collect water samples from multiple layers in the same vertical profile of the station and conduct online water quality monitoring. Compared to the traditional method of manually collecting water samples and transporting them back to a laboratory for analysis, ASIPWQI is far more timely, and its efficiency, labor-saving features, and flexibility make it highly suitable for routine monitoring of nearshore water quality, as well as for sampling and investigating sudden marine disasters.
This paper is organized as follows. Section 2 details the development and sea trials of ASIPWQI. Section 3 reports and discusses the experimental results from long-duration sea trials. Finally, Section 4 concludes the paper.
As shown in Figure 1, ASIPWQI comprises three main systems: the water sample collection and distribution system (WSCDS), the multi-parameter water quality analysis system (MPWQAS), and the integrated management platform system (IMPS). WSCDS includes a deck unit located on the front deck and an indoor unit located in the wet laboratory on the same floor of the deck. The primary function of WSCDS is to collect, store, and distribute multi-layer water samples, thereby ensuring the provision of high-quality seawater samples to MPWQAS. Conventional water quality monitoring only requires water samples to be collected from the surface, middle, and bottom layers, whereas WSCDS was designed to collect samples from six layers, with the additional three layers serving as backups. MPWQAS is located in the dry laboratory on the second floor below deck, which is equipped with an automatic nutrient analyzer, a heavy-metal analyzer, and a total phosphorus and nitrogen analyzer; these instruments perform real-time water quality analysis and then send the results to IMPS for further processing. Acting as the central control unit of ASIPWQI, IMPS is located in the information center on the same floor of the deck and coordinates the operation of all systems via the ship’s LAN. The locations of WSCDS, MPWQAS, and IMPS are shown in Figure 2.
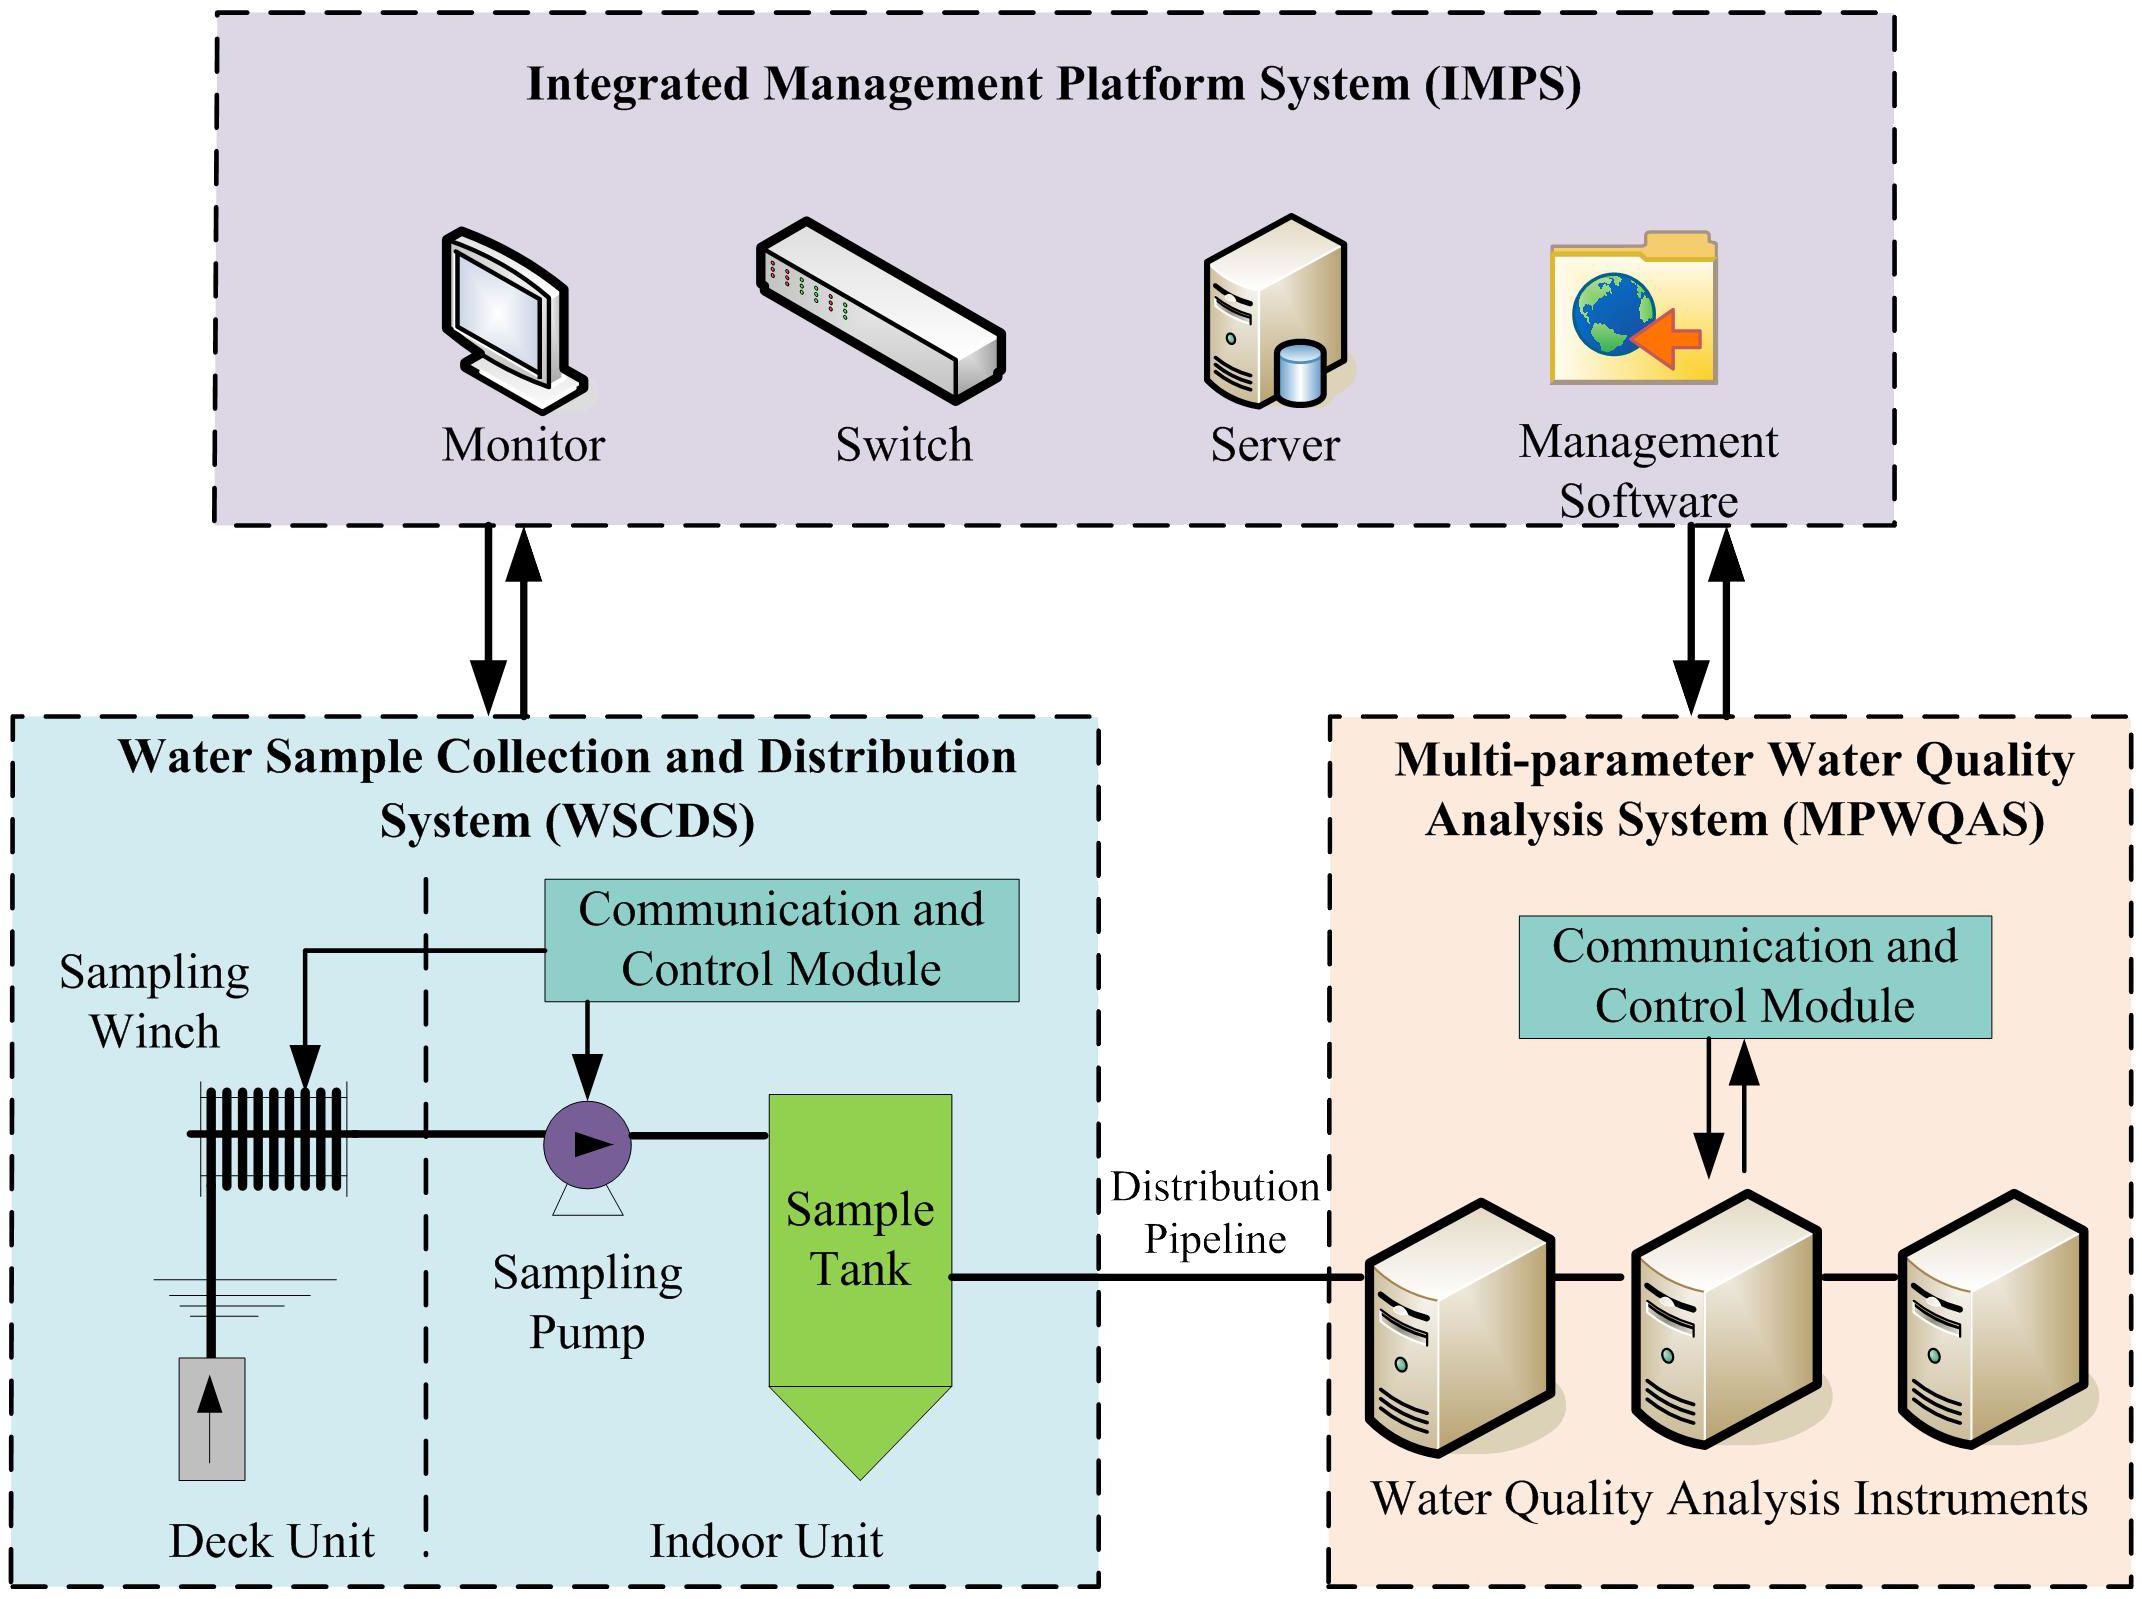
Figure 1 Overall structure of ASIPWQI.
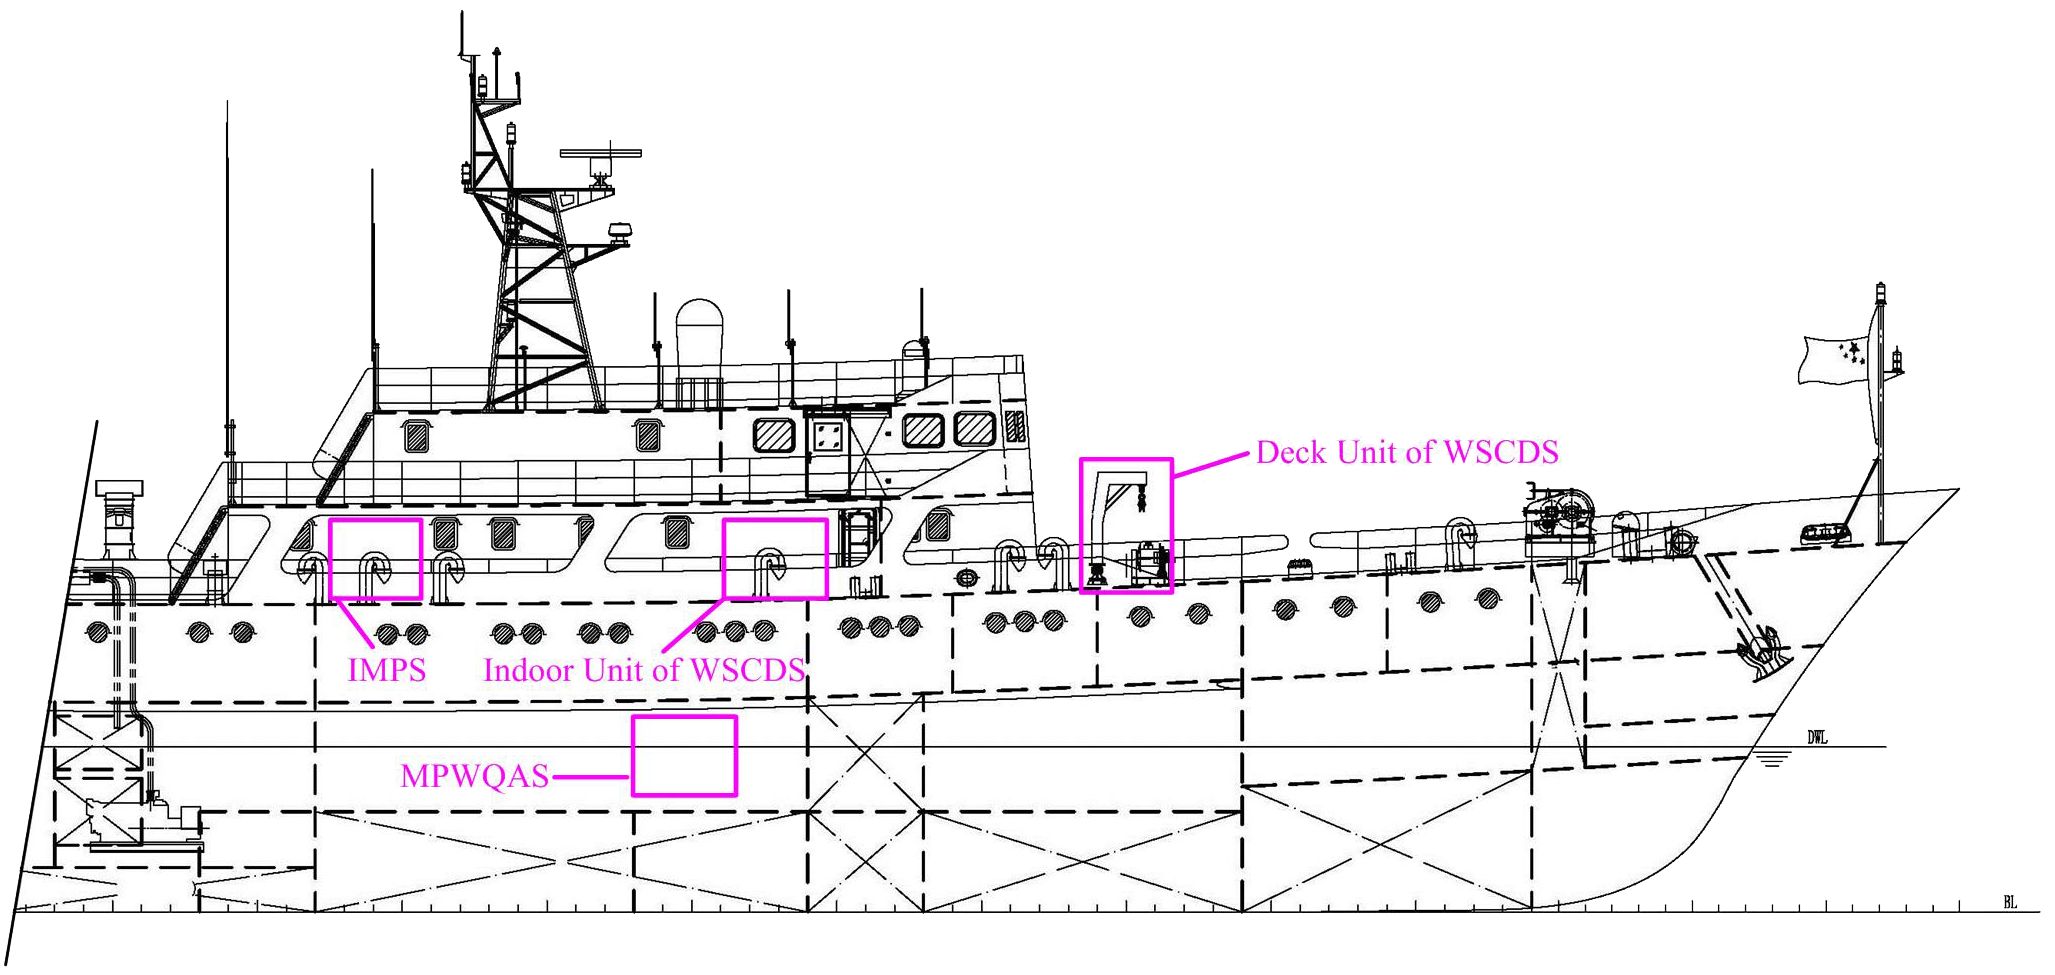
Figure 2 Location layout of ASIPWQI.
In the design process, we adopted the following principles. 1) Each station was allocated a measurement time of 90 min: 25 min for sample collection from the three layers, 60 min for water quality analysis, and less than 5 min for data processing. 2) The samples necessarily come into contact with the pipeline materials, so the latter were chosen to be non-polluting in order to prevent extraneous elements precipitating into the samples and so avoid any impact on the measurement results. 3) Considering the pump’s suction head and the water flow resistance in the pipelines, the maximum sample collection depth was limited to 50 m. 4) To ensure stable operation, all system components are products that are well established and commercially available.
As shown schematically in Figure 3, WSCDS mainly comprises a composite sampling cable, a sampling winch, a controler, a sampling pump, pipelines, sampling tanks, and valves. We use collection of a surface sample to exemplify the operational process of the system. Initially, all solenoid valves and sampling port valves in the system are closed, as are all the manual valves except for S10, S11, S13, and S15, which are open. Upon receiving work instructions from IMPS, the sampling controller initiates the sampling winch to lower the composite sampling cable and the sampling port to the designated depth. The pressure sensor at the sampling port transmits real-time depth information to the controller via the communication cable within the composite water collection cable. When the set depth is reached, the controller halts the winch, opens solenoid valves Y24 and Y11, and activates the sampling pump to begin collecting a water sample, which passes through a filter and enters tank 1. Upon receiving the trigger signal from level switch X1, the controller stops the pump and closes solenoid valves Y24 and Y11, marking the completion of the sampling process. When collecting samples from three layers (bottom, middle, and surface), the process remains the same as described above, and the samples are stored in tanks 5, 3, and 1, respectively. Following a sea trial, it is essential to flush out any remaining seawater and sediment in the sample tanks and pipelines with tap water, followed by filling them with pure water to prevent mold growth.
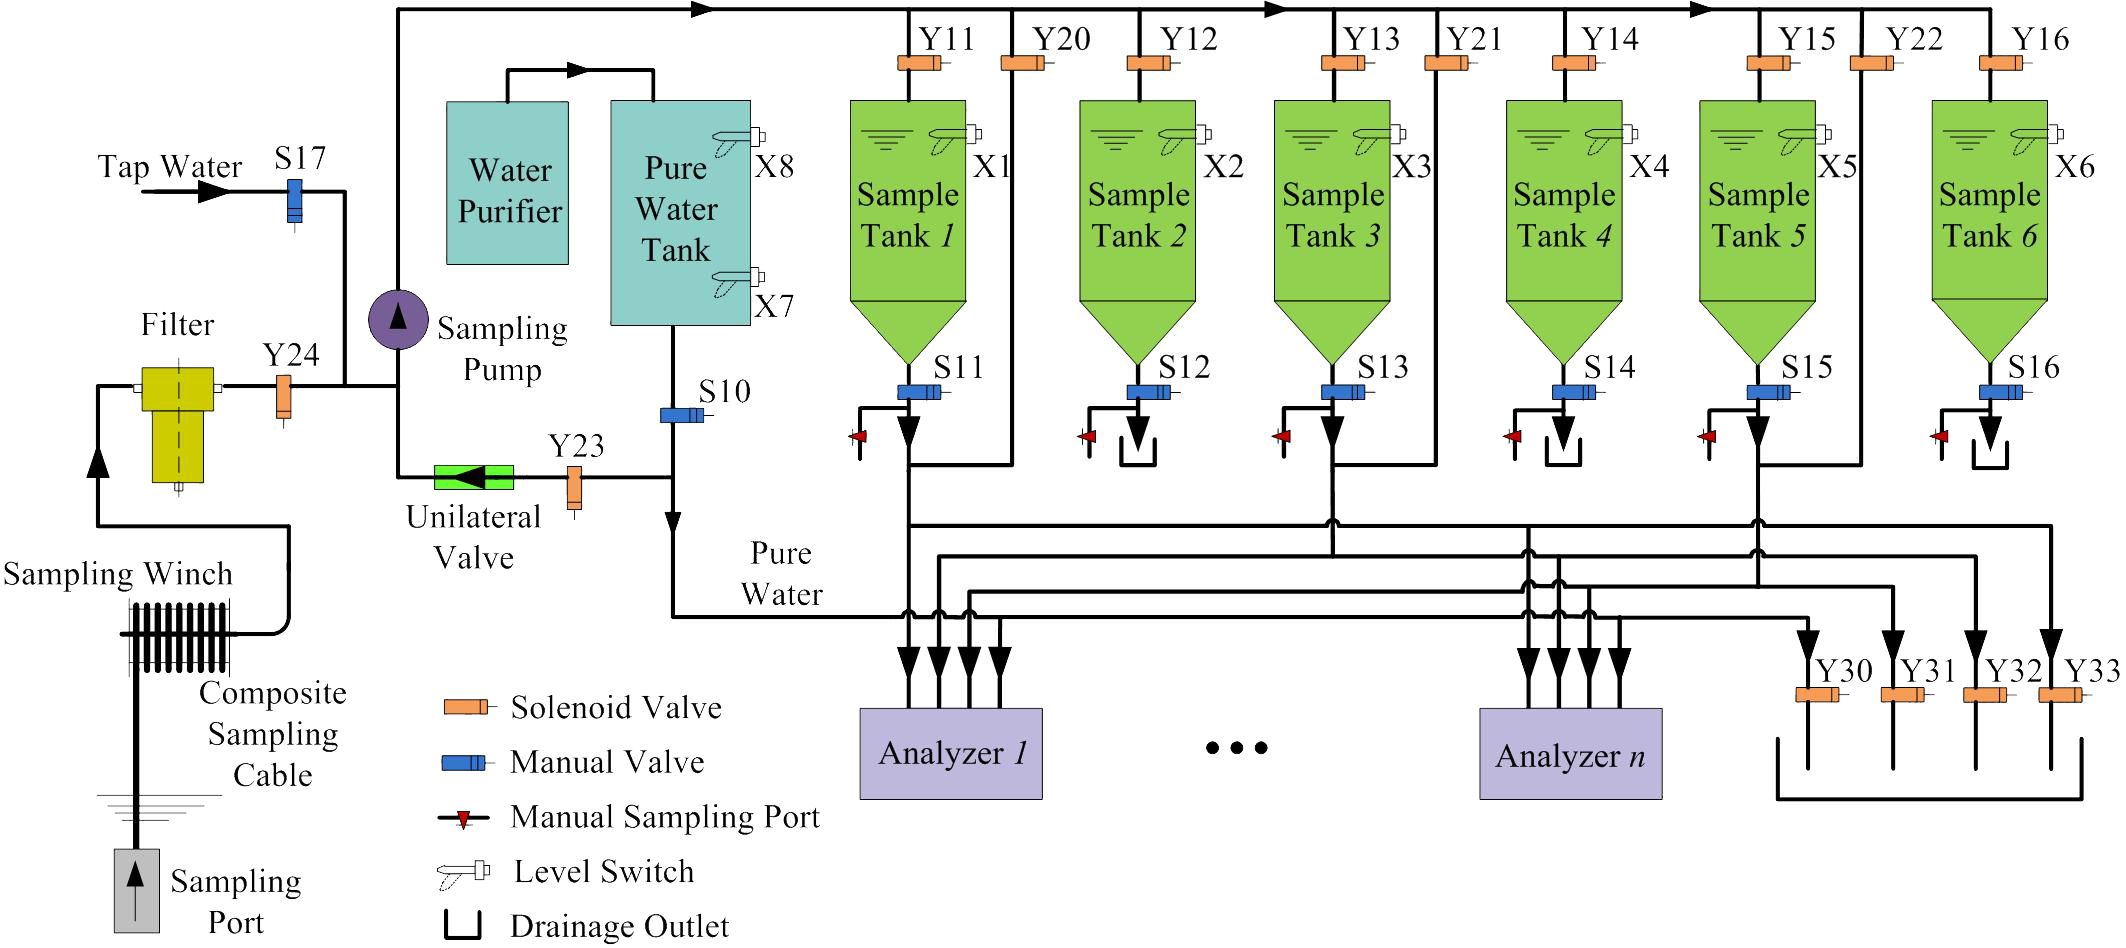
Figure 3 Schematic of water sample collection and distribution system(WSCDS).
The main parts of the deck unit are the composite sampling cable and the sampling winch. The composite sampling cable is wound around the drum of the sampling winch, and as the drum rotates, the sampling port moves in the water to obtain water samples at different depths.
The composite sampling cable consists of a water pipe, a communication cable, and a Kevlar rope, serving the functions of sample collection, communication, and loadbearing. The water pipe is made of PVC (polyvinyl chloride) and has an inner diameter of 16 mm and an outer diameter of 20 mm. The communication cable is linked to the pressure sensor to transmit a 4–20-mA signal, with the current being proportional to the pressure. In traditional sampling methods, manual water samplers are typically used; however, because of the angle at which the rope pulls the water sampler in the sea, controlling and recording the sampling depth accurately is challenging, and operators often have to estimate the depth visually (Si et al., 2011). Using a pressure sensor is effective for addressing this issue, offering significantly lower errors in the sample collection depth. One end of the Kevlar rope is attached to a plastic-sealed lead fish as a counterweight, while the other end is fastened securely to the winch to prevent the composite sampling cable from detaching. The Kevlar rope has a breaking force exceeding 5000 newtons, thereby ensuring that it can withstand ocean currents and the cable’s weight without snapping. Considering a maximum sampling depth of 50 m along with factors such as the cable’s inclination angle and the distance from the sea surface to the winch, the total length of the composite sampling cable was chosen as 70 m.
For the original composite sampling cable, tape was used to bundle the water pipe, communication cable, and Kevlar load-bearing rope together (Figure 4A). However, while that design served the purpose of collecting water samples, it had functional drawbacks: the configuration was susceptible to snagging on foreign objects, and more significantly it prevented the cable from being arranged automatically on the sampling winch. Consequently, we innovated by introducing an integrated composite water cable (Figure 4B). By analyzing the forces acting on the communication cable, water pipe, and Kevlar rope, we determined their optimal distribution positions. The outer layer was encased in a polyurethane protective sleeve, resulting in a post-molding outer diameter of ca. 40 mm. Given the limited operational space onboard, a small bending radius could lead to the communication cable breaking under tension while lowering or retrieving the integrated composite cable; to address this issue, we passed the communication cable through a hollow plastic tube, thereby allowing it to expand and retract freely within the plastic tube and effectively mitigating excessive tension during the lowering and retrieval process. The successful outcomes of the sea trials further validated the efficacy of this design.

Figure 4 Comparison of composite sampling cables: (A) original; (B) improved.
The electrical transmission system of the specialized sampling winch uses a Mitsubishi FR-E740 frequency converter to control the variable-frequency motor, driving the winch drum to rotate both forward and in reverse. The circumferential speed can be adjusted within the range of 0–0.7 m/s. The winch is also equipped with an RS-232 communication interface for remote control capabilities. Automatic cable laying is a crucial function of the winch, achieved by installing a cable layer to ensure the even arrangement of the composite sampling cable on the drum during the sampling process. As shown in Figure 5, the cable layer comprises a lead screw, a smooth screw, a slide frame, and a pulley. As the drum rotates, the gear rack and sprocket transmission system drive the lead screw to move at a specific speed ratio. With each rotation of the drum, the sliding frame on the lead screw moves horizontally by a distance equivalent to the diameter of the composite sampling cable. The combined lateral movement of the sliding frame on the lead screw and the rotation of the drum work together to achieve automatic cable arrangement.
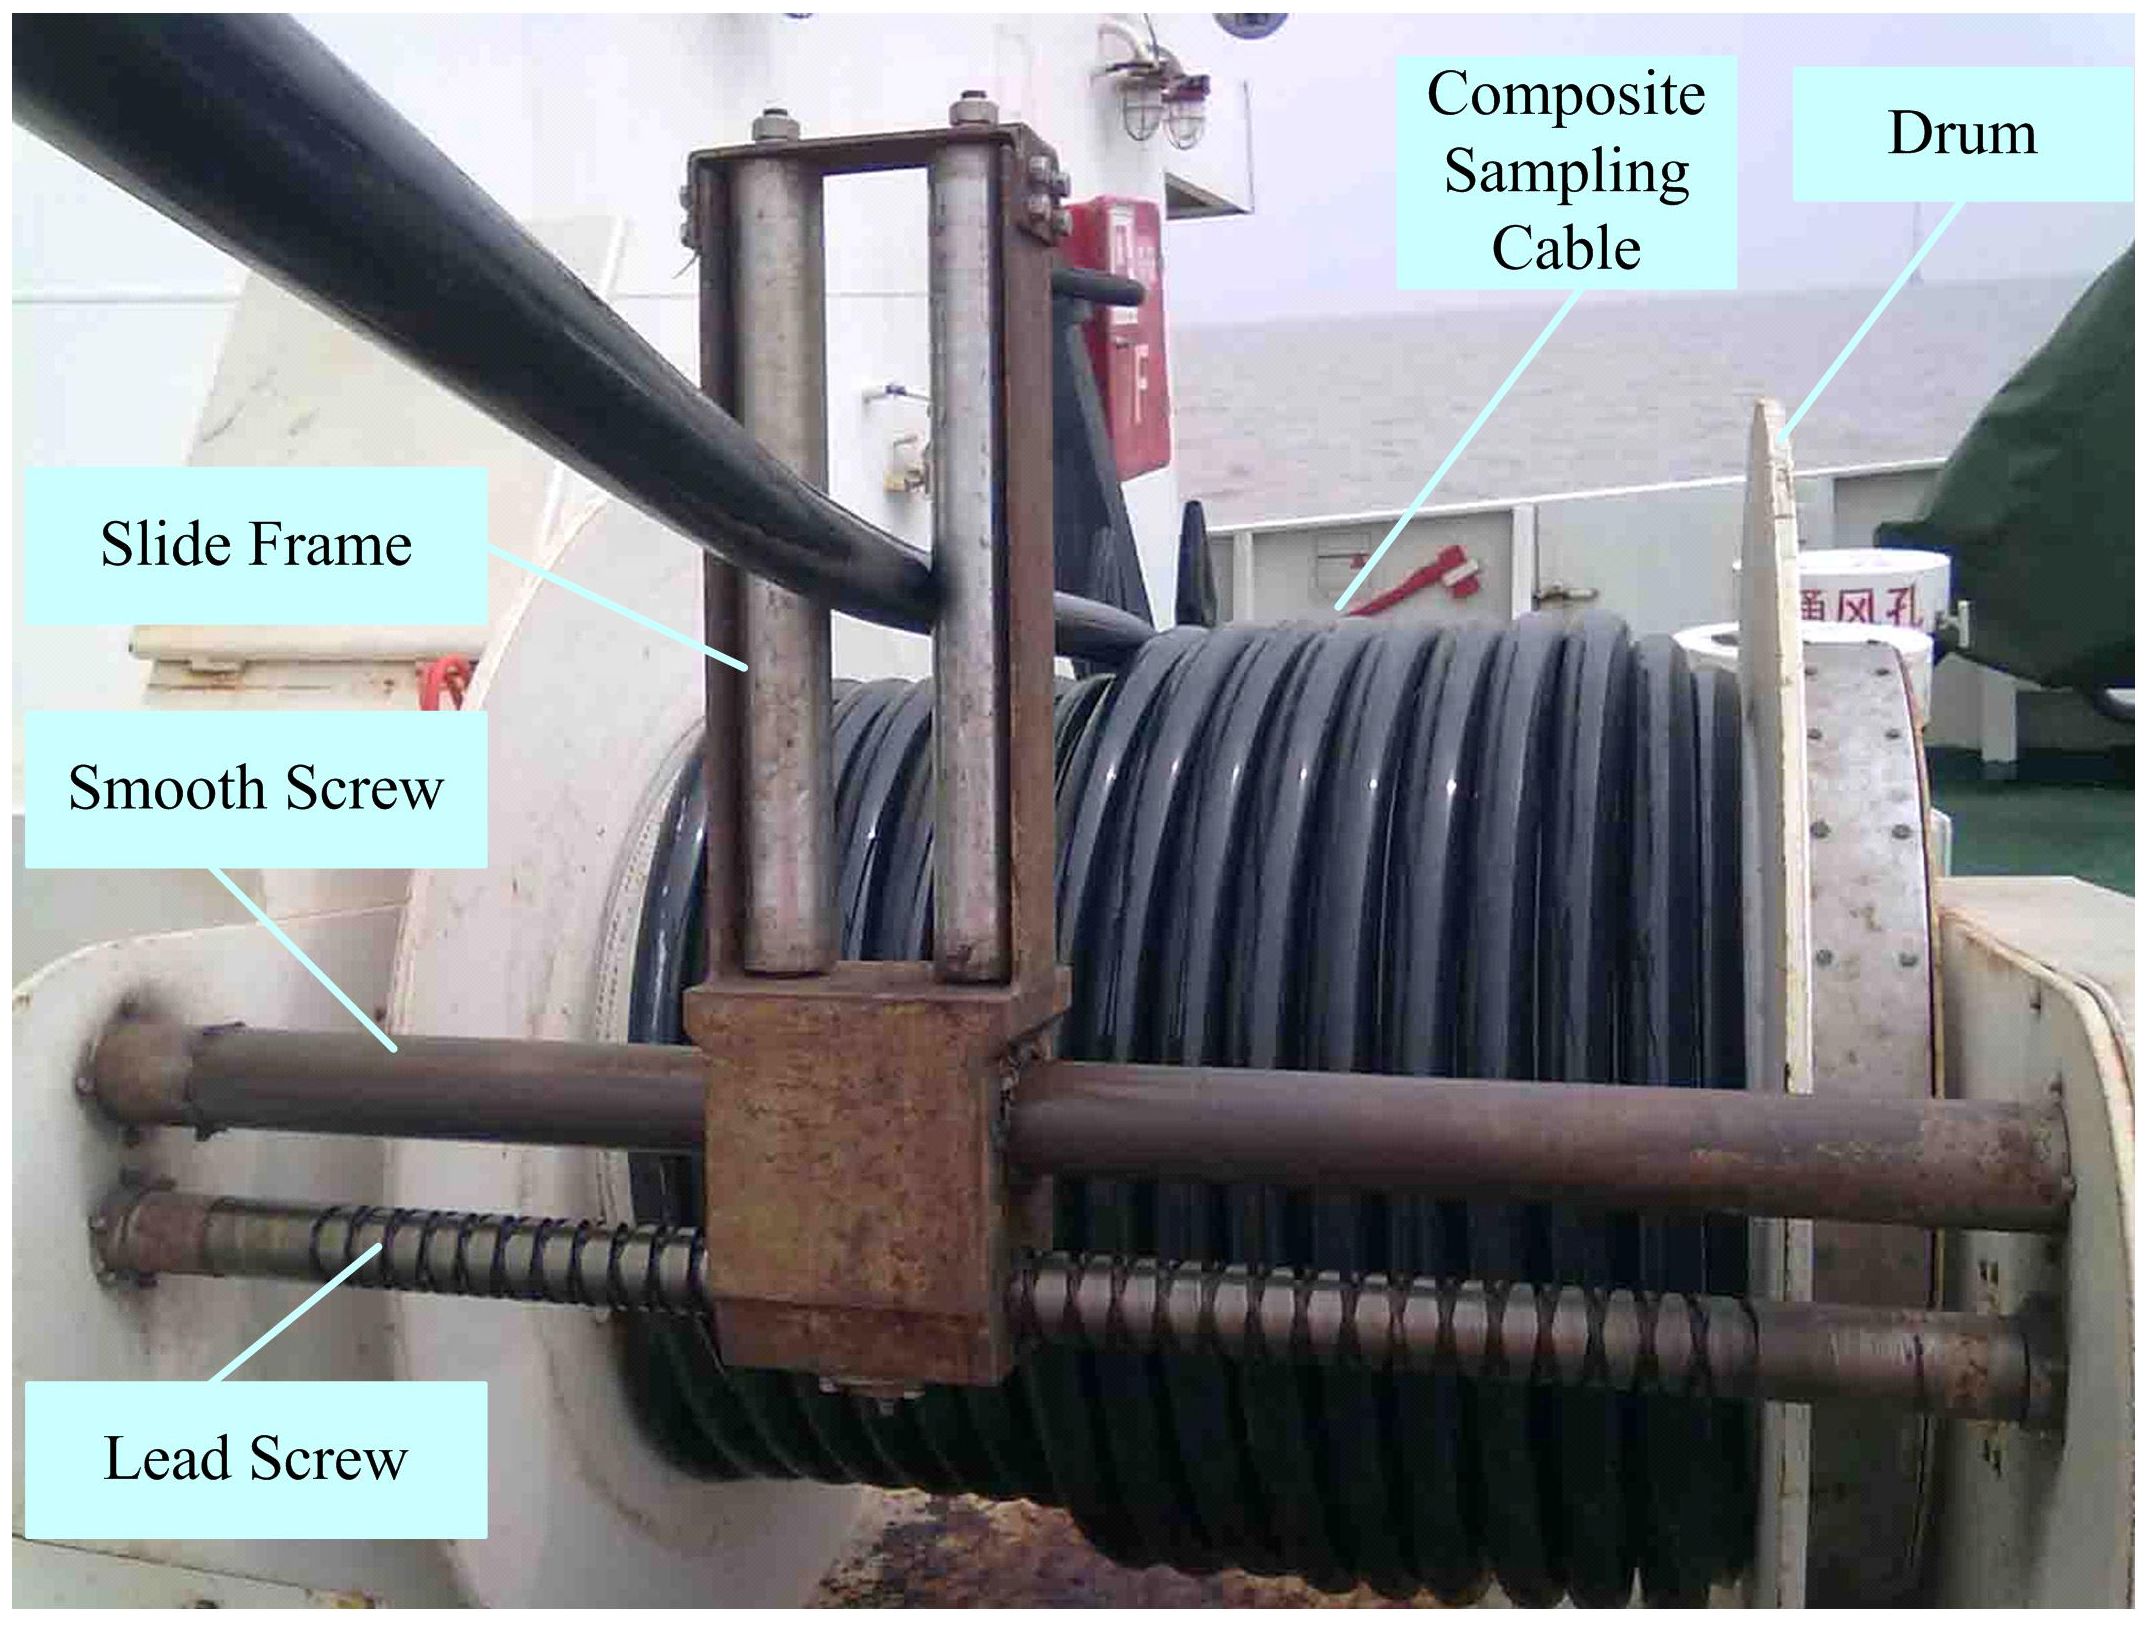
Figure 5 Cable layer of sampling winch.
The outer surface of the sampling winch is coated with marine-grade protective paint, and the exposed components are constructed from 316L stainless steel to mitigate corrosion caused by seawater exposure. The positioning of the sampling winch during installation dictates the precise location of the sampling point. It is crucial to ensure that the sampling process remains unaffected by the ship’s domestic sewage and engine cooling water, so the winch is situated strategically on the side of the front deck that is free from any wastewater discharge outlets.
The main parts of the indoor unit are a controler, a sampling pump, pipelines, sampling tanks, and valves (Figure 6). The controller is the brain of WSCDS, responsible for receiving instructions from IMPS and controlling the operation of corresponding components. The sampling pump sucks the water onto the ship and distributes it to the sampling tanks through the pipelines, and the valves are connected in series on the pipelines to control the flow directions of the water samples by being opened or closed.
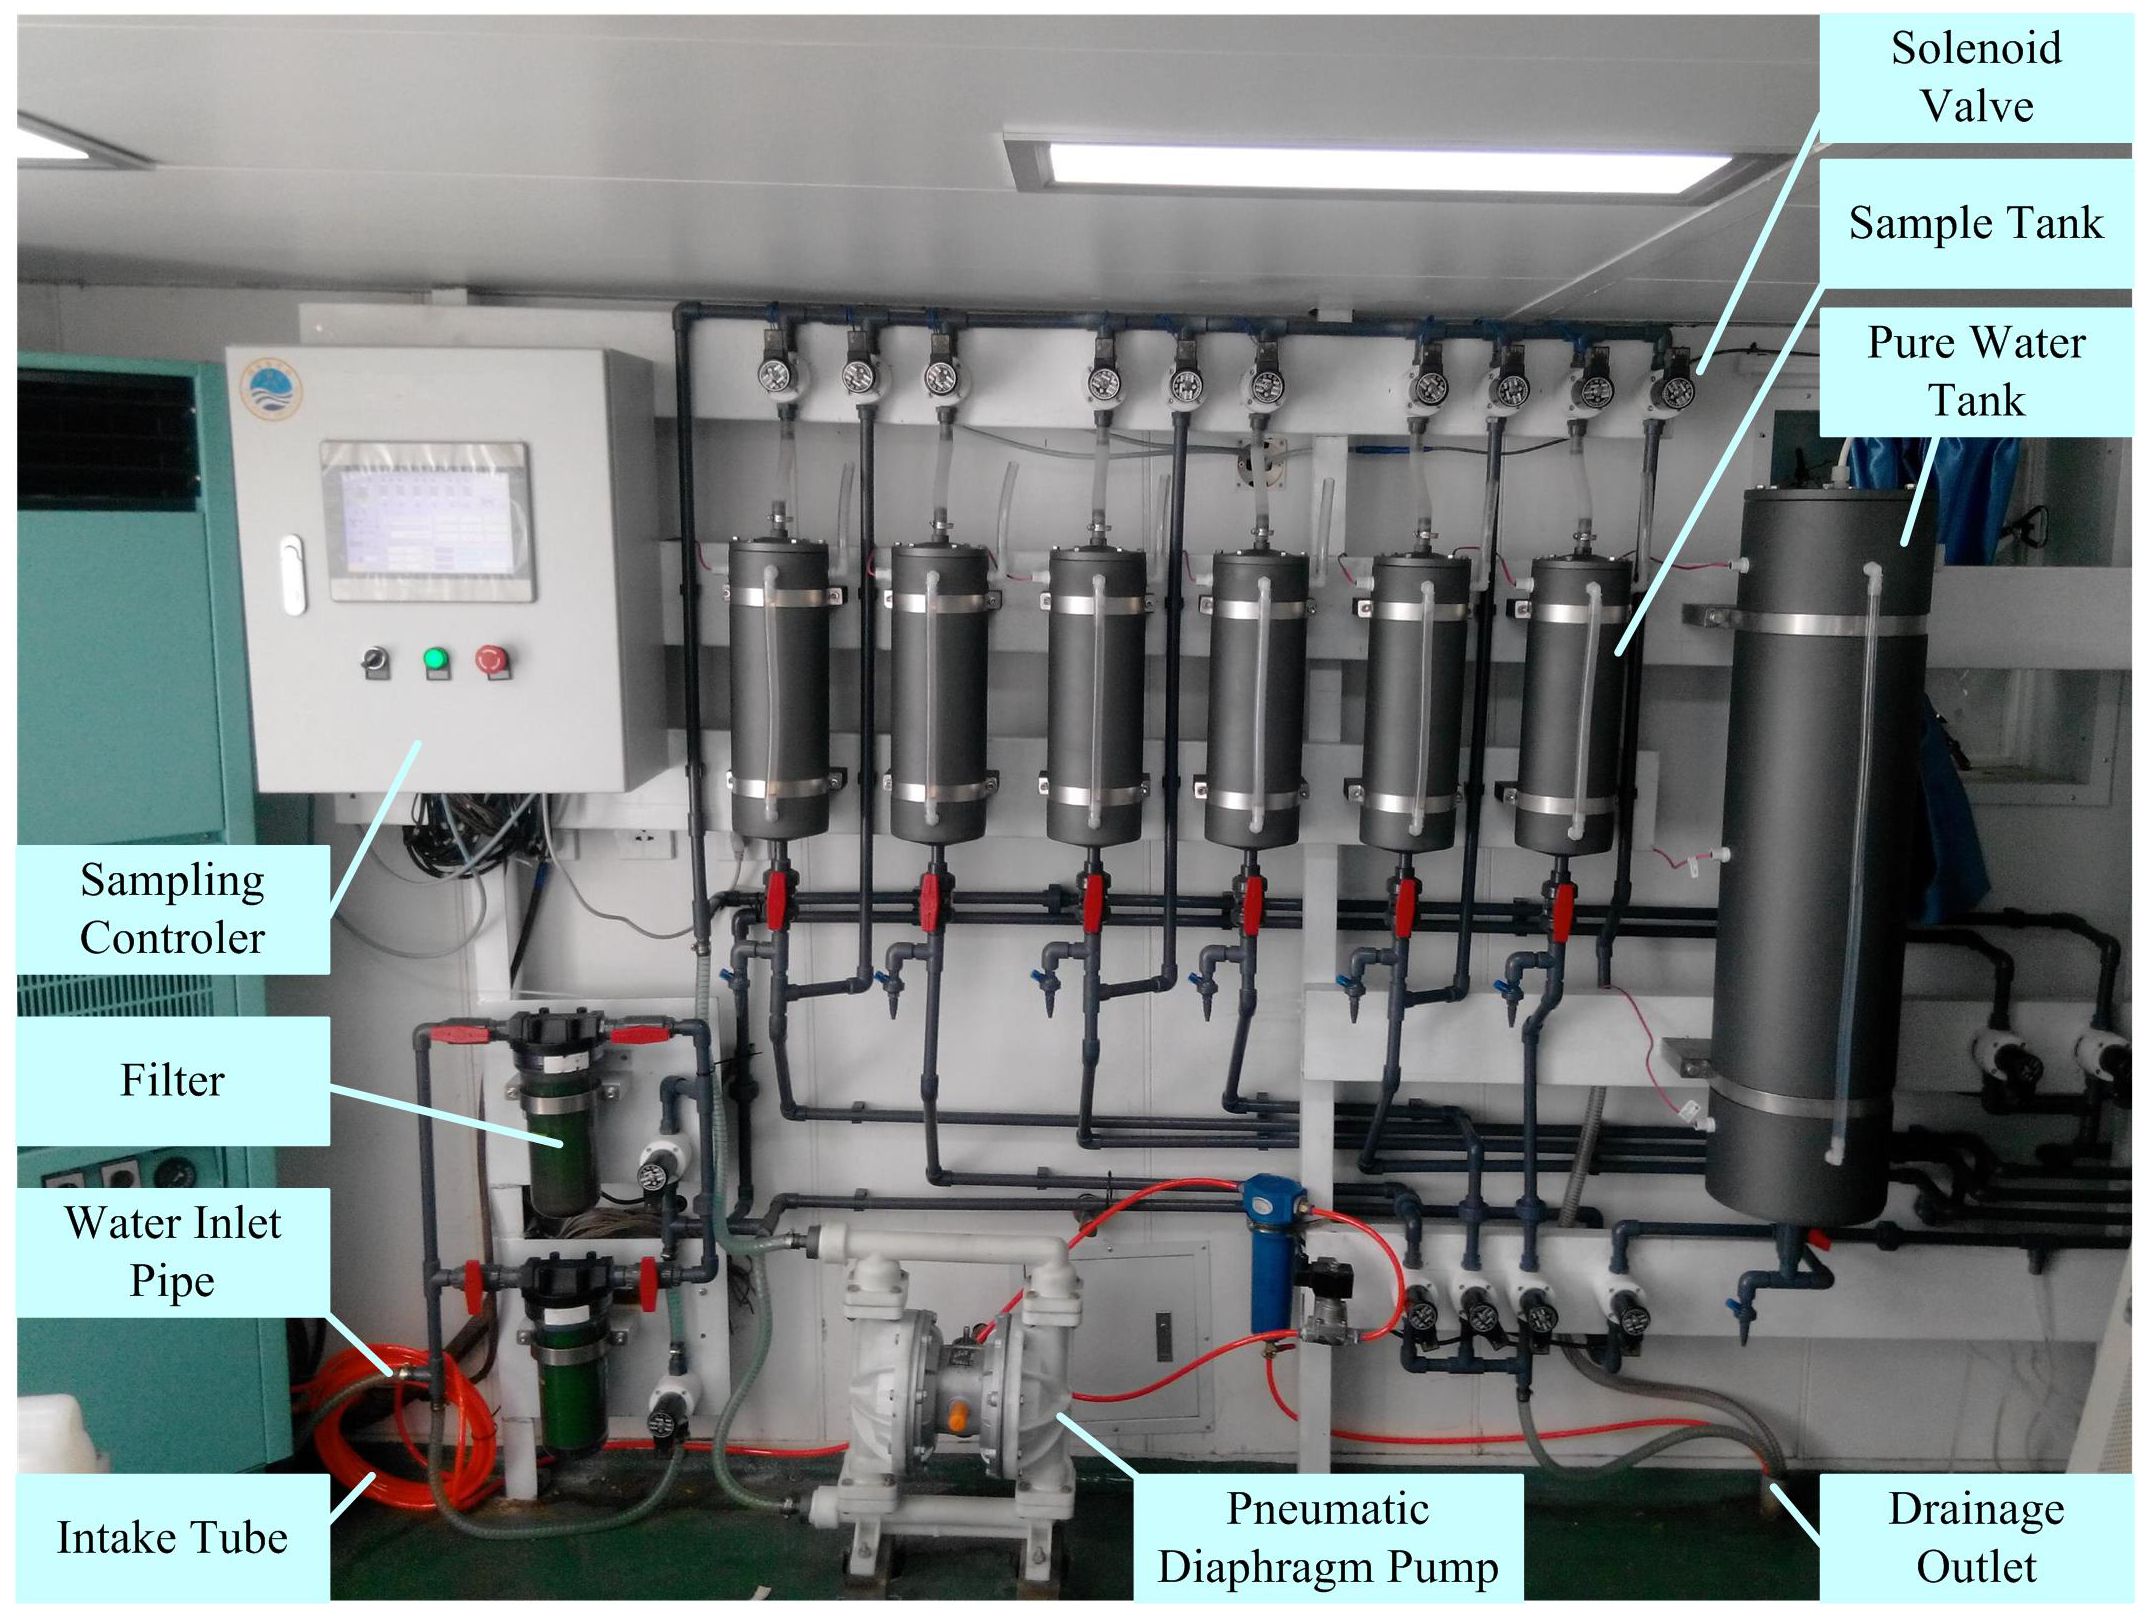
Figure 6 Physical image of WSCDS indoor unit.
The sampling controler is based on a programmable logic controller (PLC) (FX2N-64MR; Mitsubishi Corporation) complemented by an analog-to-digital conversion module (FX2N-4AD) and a communication module (FX2N-232-BD). The FX2N series developed by Mitsubishi are top-tier integrated small PLCs known for their high performance; the FX2N-64MRPLC has a compact design, generous storage capacity, and fast processing speeds, and its wide range of expansion modules enables analog control and network communication functionalities.
As shown in Figure 7, the PLC controller is connected upstream to IMPS and downstream to the pump, sampling winch, water purifier, solenoid valves, liquid level switches, and pressure sensor. FX2N-64MR features two communication interfaces: one is an RS-485 serial communication interface for interacting with the touch screen on the control box, while the other communicates with IMPS via the extended FX2N-232BD serial communication module. With 32 relay-type output ports capable of driving loads up to 2 A, FX2N-64MR can directly control devices such as the pump, sampling winch, water purifier, and solenoid valves. The pressure sensor integrated into the sampling port generates a current-type analog signal that is converted into a digital signal by the FX2N-4AD module. The PLC then converts this digital signal into a depth value, which is displayed in real-time on the monitoring screen. The master monitoring screen is a 10.4-inch touch screen, while the slave monitoring screen is a 5.7-inch touch screen located on the sampling-winch control panel. The two screens are connected via an RS-485 communication interface to enable dual-screen synchronous display. The master screen offers a virtual network console service function, allowing remote access by any computer connected to the ship’s LAN. The PLC control program is written in ladder logic programming language, known for its graphical representation, clear logic, and ease of understanding (Ding and Li, 2009). The control program has six functional modules: system initialization, depth judgment, pure water control, pipeline cleaning, clock timing, and network communication. Each module jointly completes the automatic collection of samples as part of the main automatic-sampling program. Also, the system includes a manual control mode, enabling independent operation of WSCDS from IMPS.
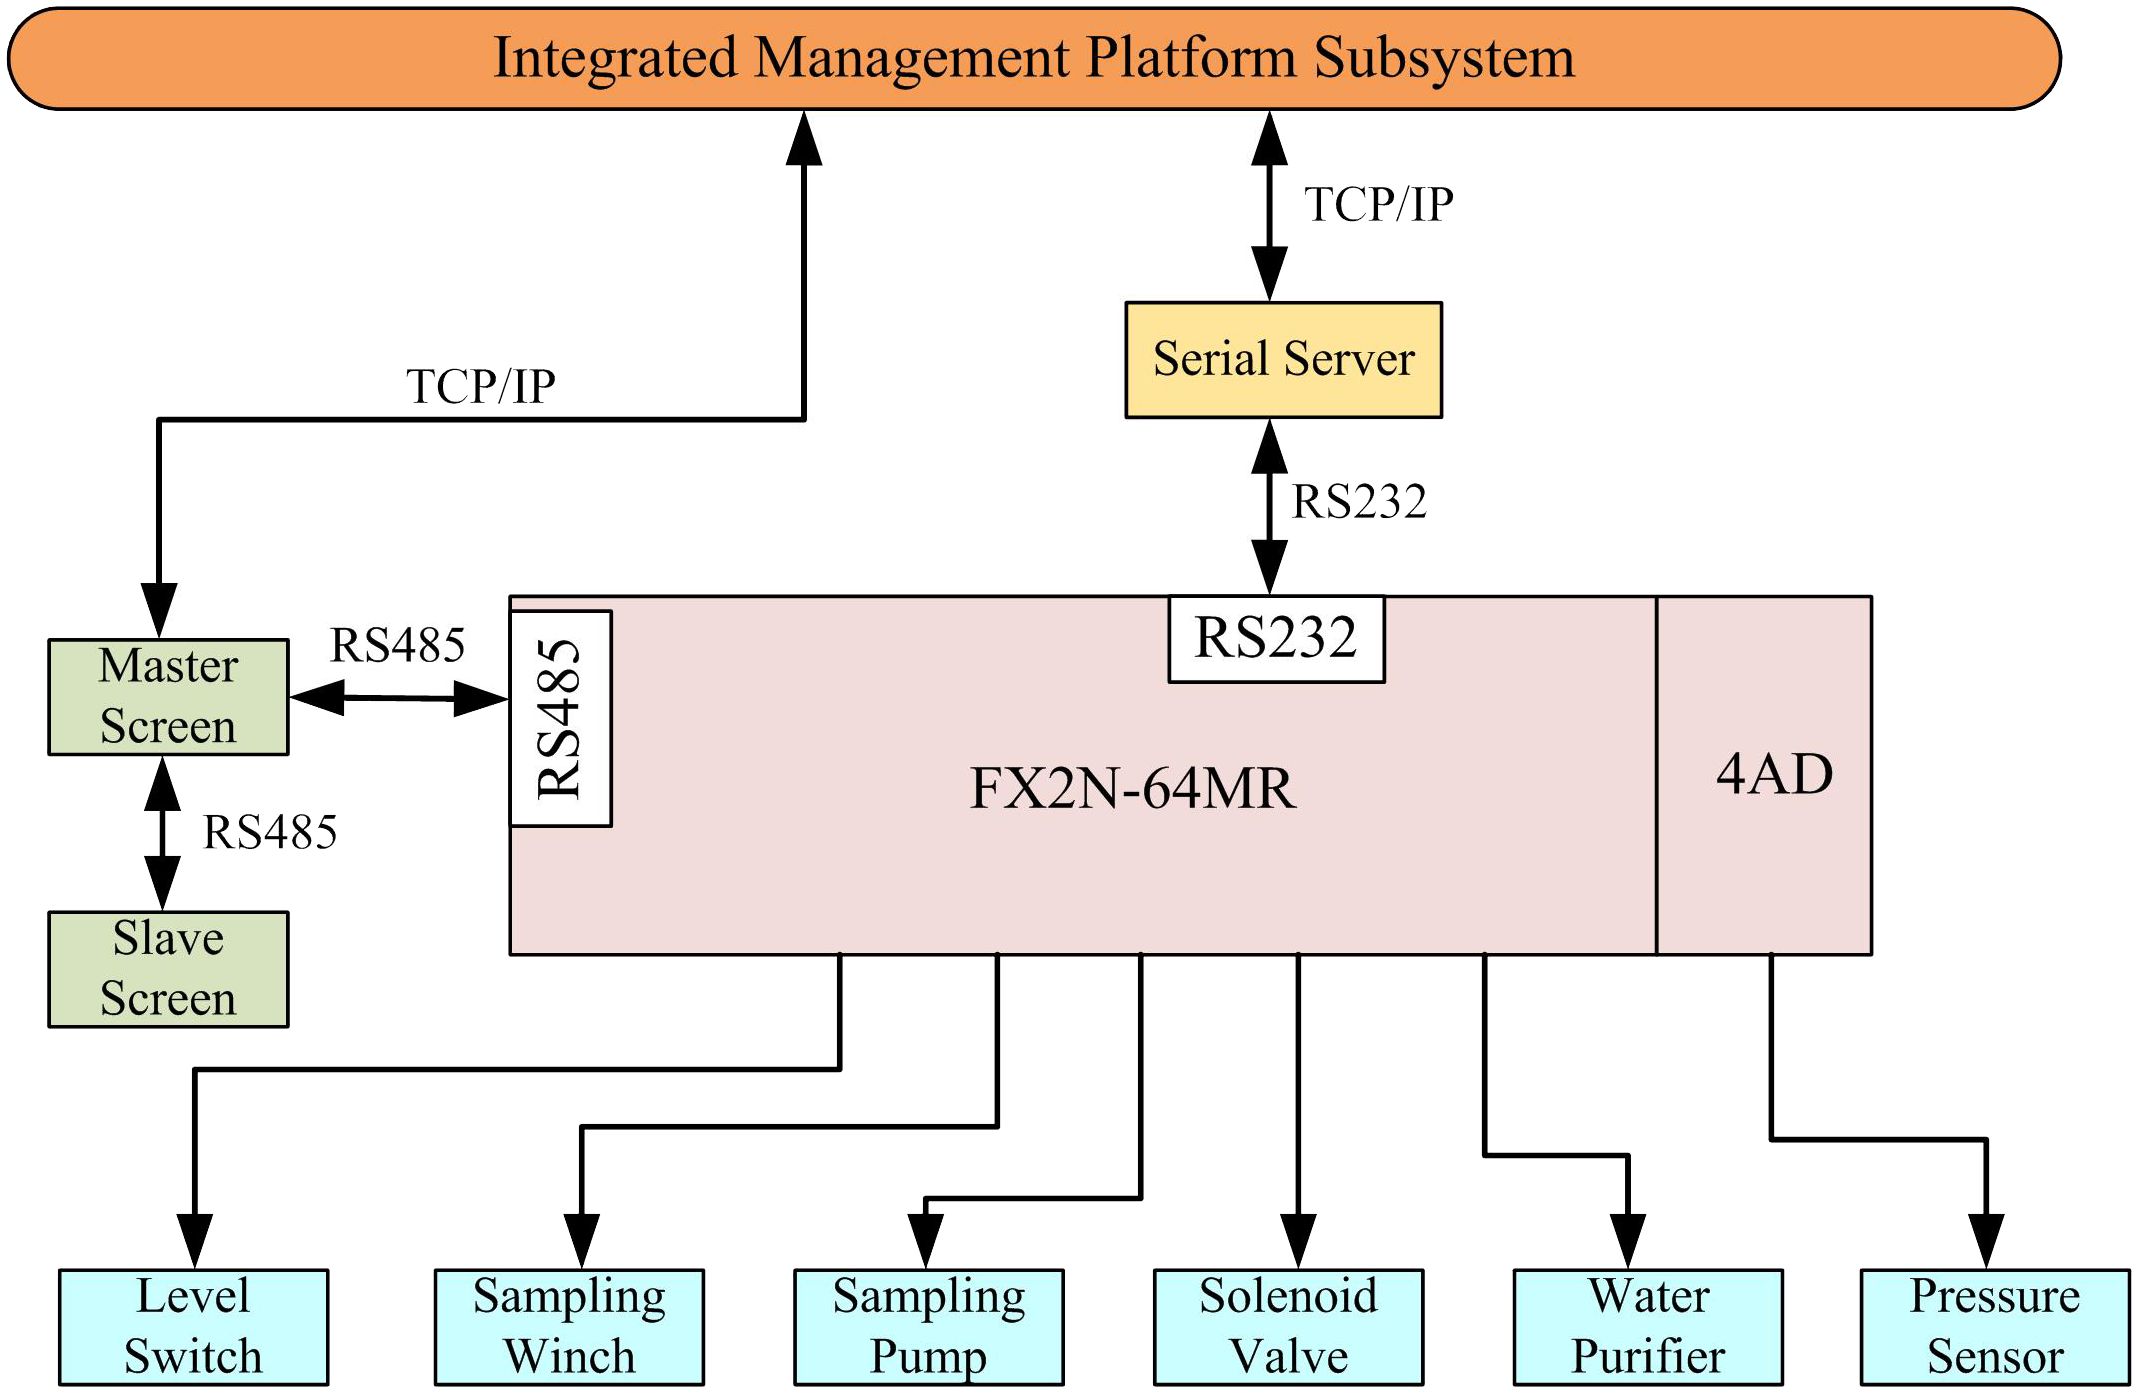
Figure 7 Block diagram of sampling controller.
The sampling pump is a pneumatic diaphragm pump (model QBY3-25; Changzheng Pump and Valve Co., Ltd), which operates by using compressed air to drive the diaphragm to undergo lateral stretching and reciprocating movements within the pump body, thereby facilitating the transfer of seawater. The pump body and diaphragm are made of PTFE (polytetrafluoroethylene), thereby providing excellent sealing capabilities and corrosion resistance. This type of pump is used widely in various industries (e.g., chemical, pharmaceutical, food) as a crucial device for transferring liquids (Duan and Wu, 2017). Its robust self-priming feature allows it to extract liquids with particles and prevents clogging, making it ideal for use in turbid water conditions. The compressed air is supplied by the ship’s air compressor with a maximum pressure of 0.07 MPa, and by adjusting the pressure of the compressed air, the pump’s flow rate is easily controlled.
The sample tanks and indoor pipelines are made of uPVC (unplasticized PVC). Each water sample tank has a capacity of 10 L, ensuring the delivery of adequate water samples to MPWQAS. The water inlet pipe enters the room from the deck and is connected to a filter. The filter’s outlet is linked to a solenoid valve through a uPVC pipe, and the solenoid valve’s outlet is connected to the sample tank. A sprinkler head is installed inside the water inlet of the sample tank. The water sample is sprayed in a complete circle under the pressure of the diaphragm pump and then flows down the inner wall of the tank; this design is aimed at cleaning the water sample residue on the inner wall from the previous station. The outlet of the sample tank is equipped with a manual valve and a sampling port. The manual valve is typically open but can be closed manually in an unexpected situation. The lower end of the manual valve is connected to the distribution pipeline, which leads to the lower laboratory and provides samples for the water quality analysis instruments. The water purifier produces ultrapure water and stores it in a 60-L tank equipped with a UV sterilization lamp.
MPWQAS is installed in the dry laboratory below WSCDS,comprising three water quality analysis instruments, all of which underwent measurement calibration before being installed on board. The three instruments are as follows: (i) automatic nutrient analyzer (ANA), which uses discontinuous photometry to measure the concentrations of ammonia, nitrite, nitrate, phosphate, and silicate in seawater; (ii) online heavy-metal analyzer (OHMA), which uses electrode and electrochemical detection principles to measure the concentration of trace metal ions such as zinc, cadmium, copper, and lead in seawater; (iii) total phosphorus and total nitrogen analyzer (TPTNA), which determines the content of total phosphorus (TP) and total nitrogen (TN) via chemical analysis methods. The instrument photograph is shown in Figure 8, and the specifications of the instruments are outlined in Table 1.
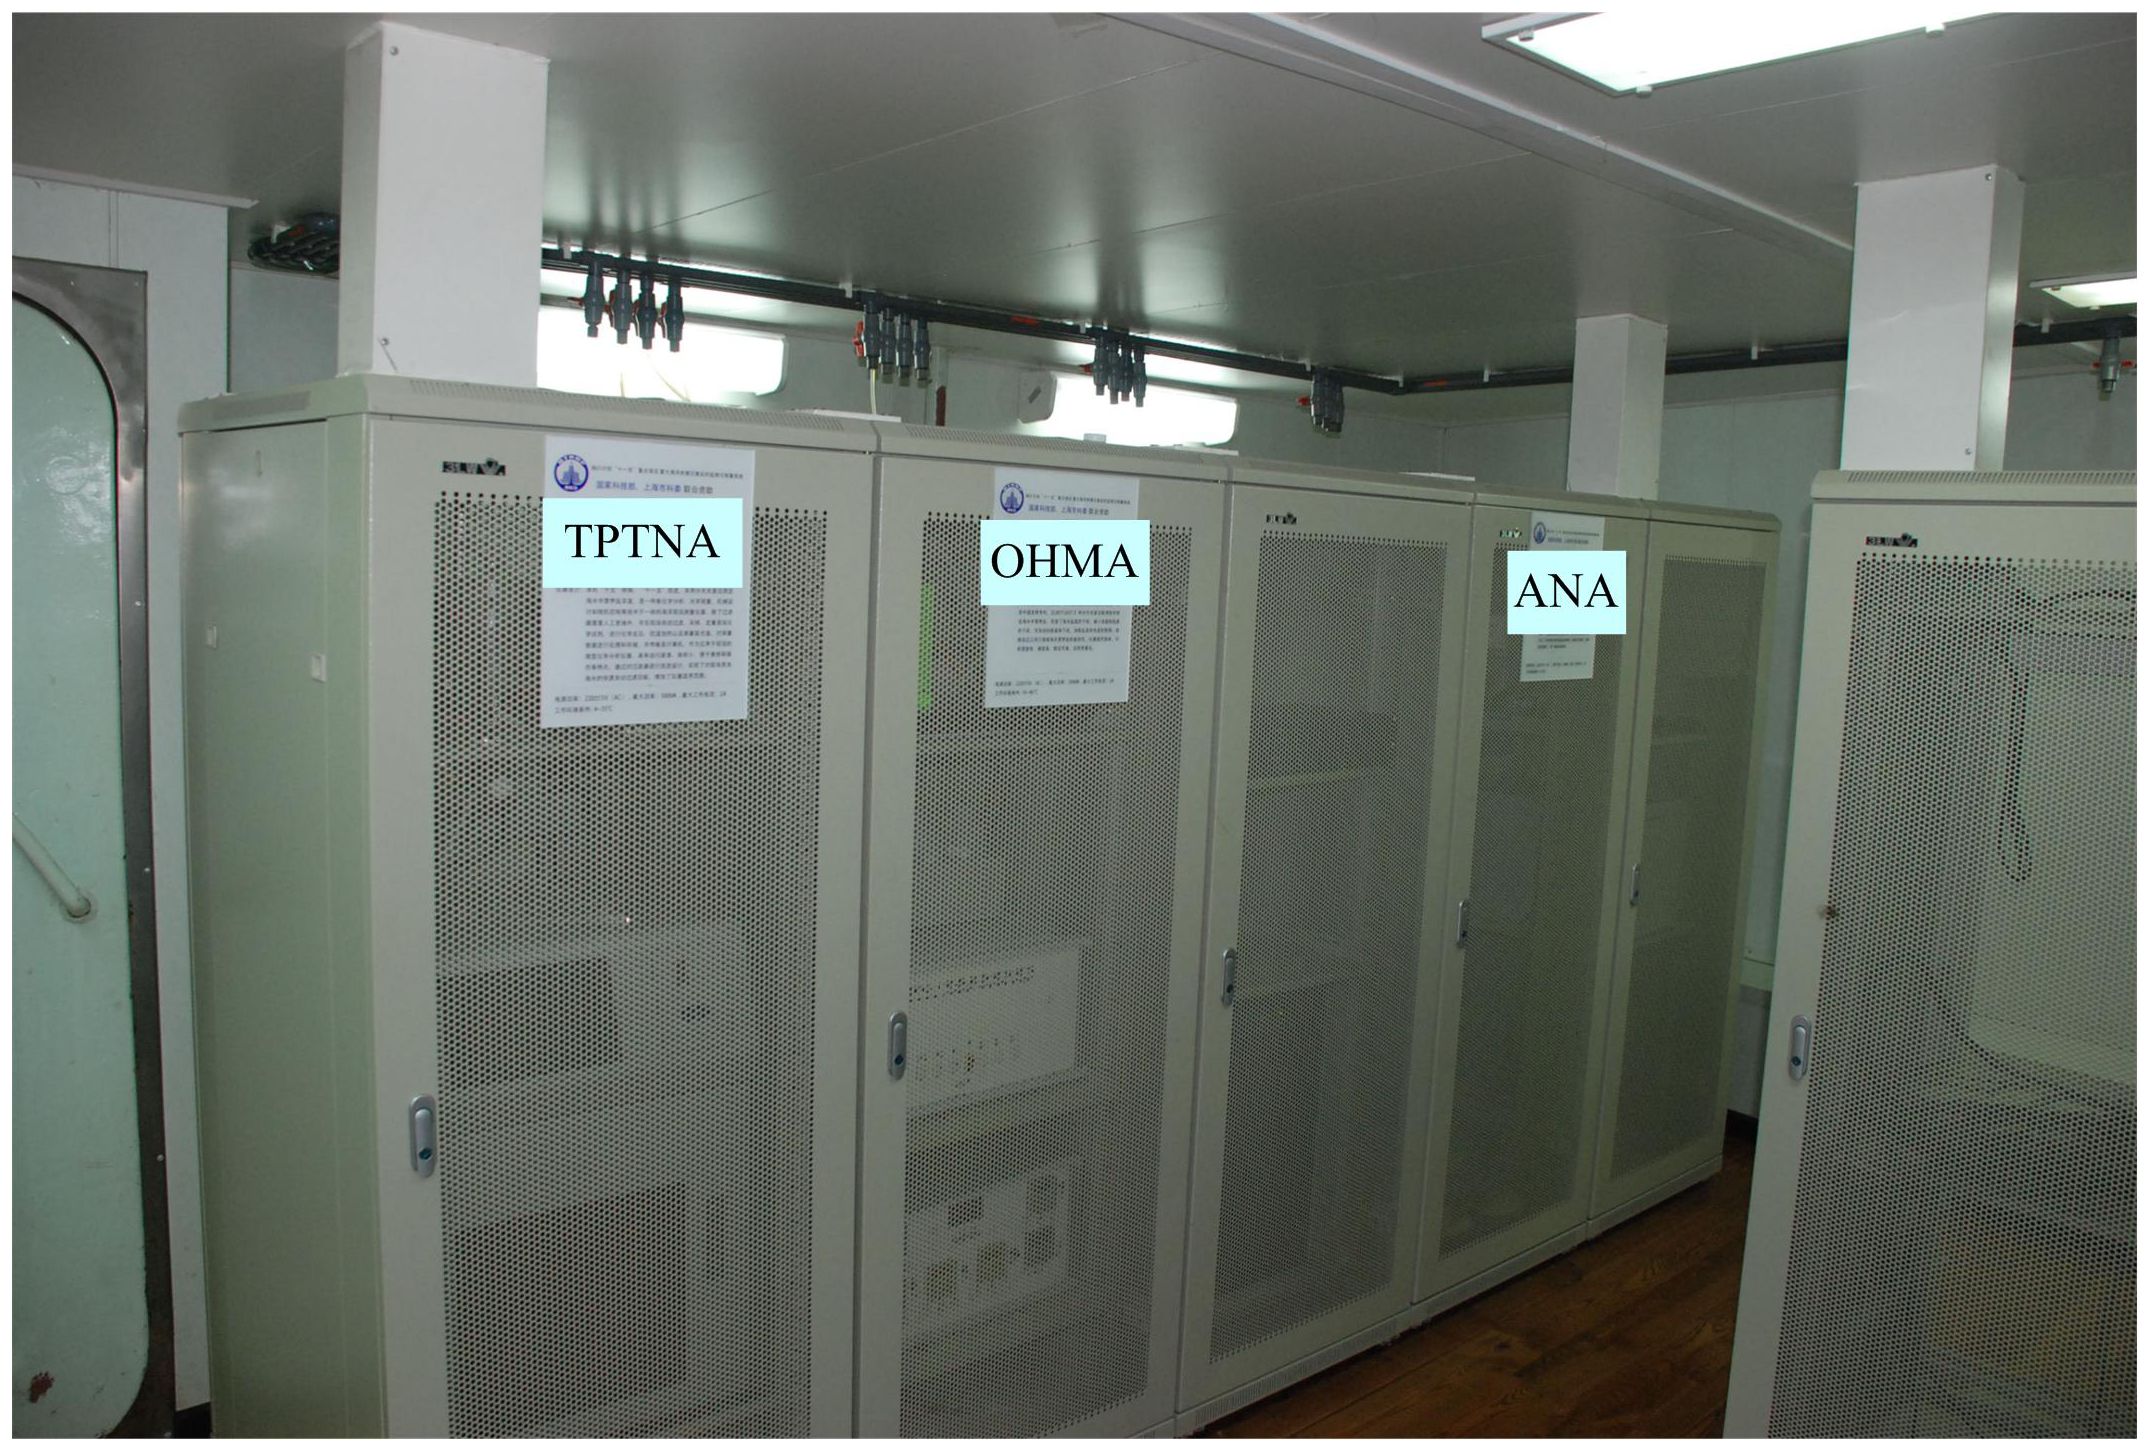
Figure 8 Physical image of the instruments.
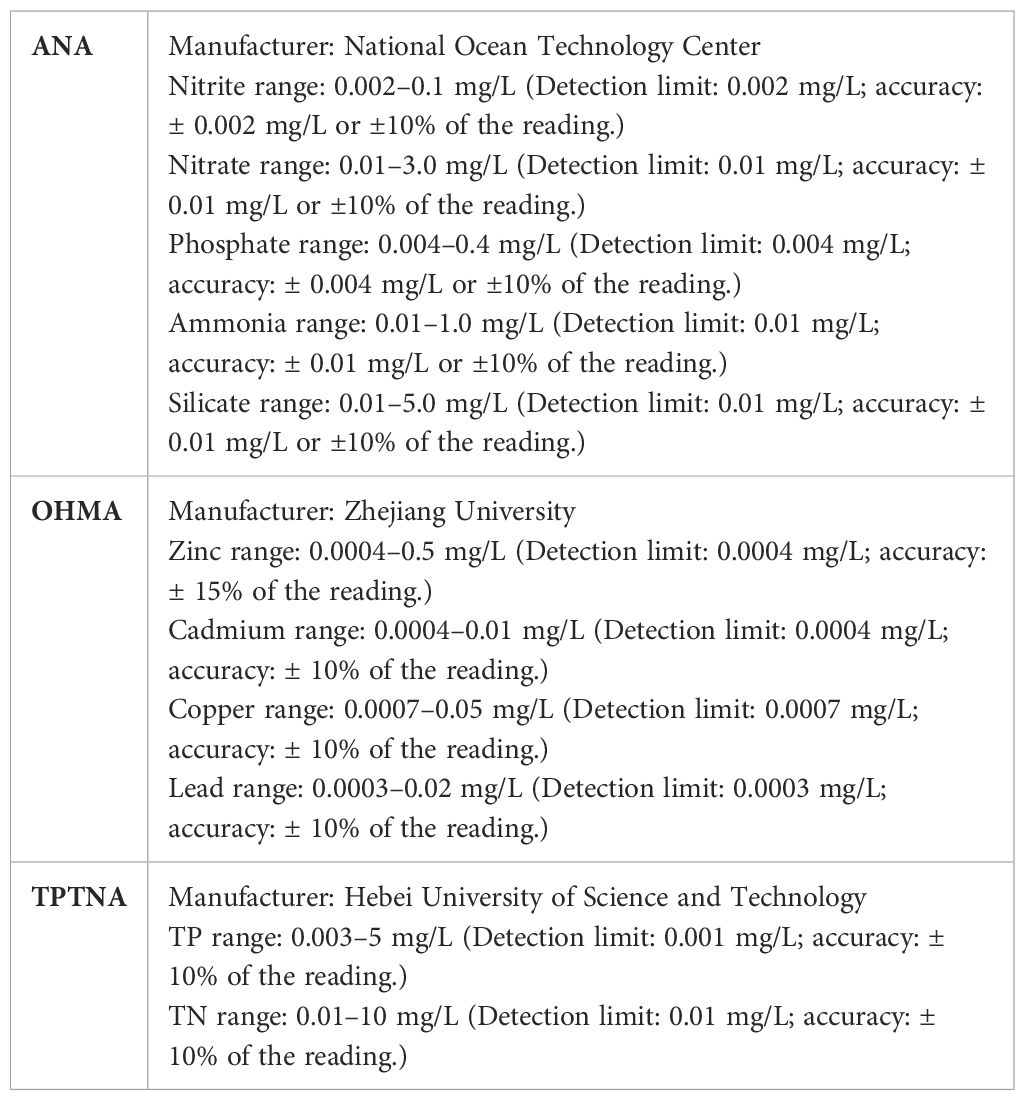
Table 1 Specifications of instruments for analyzing water quality.
The analysis methods and detection parameters of the water quality analyzers may vary, but they share common working principles in terms of power supply, communication, and water sample acquisition. The analyzers are typically powered by a 220-V alternating voltage that is distributed through the laboratory’s distribution box. They use the RS-232 serial communication protocol and are linked to the ship’s LAN via a serial server, assigning each analyzer a unique internet protocol address. The sampling ports of the analyzers are connected to the seawater sample distribution pipelines, with sampling time and volume controlled by electromagnetic valves within the analyzers.
IMPS encompasses various functions including equipment monitoring, data collection and storage, data analysis and processing, and information services. It effectively manages and controls WSCDS and MPWQAS by establishing a shipborne computer network that adheres to Internet/Intranet technical standards. The application programs of IMPS uses an asynchronous message bus architecture to facilitate message scheduling, and the various application components such as data collection, data display, data processing, and device control are interconnected with IMPS via message exchange. The asynchronous message transmission service uses bus routing technology to enable seamless message transmission and exchange between the application server and monitoring components. By leveraging bus routing, the system publishes service components, handles service requests, and invokes response services, thereby enhancing the operational efficiency of IMPS.
IMPS uses a database management system with Browser/Server architecture for data management. Furthermore, IMPS is responsible for collecting parameters from shipborne GPS, gyrocompass, hydrological, and meteorological equipment, thereby enabling real-time monitoring of the operational status of the shipborne equipment. The data from continuous observation equipment—such as hydrological and meteorological information—are displayed dynamically and vividly in various forms including curves, dials, data tables, vector maps, and LED light conversion. The main interface allows for the input of control information and monitoring of the equipment’s running status through basic control forms such as text data input controls, button controls, list controls, and drop-down list controls, as shown in Figure 9.

Figure 9 Main interface of IMPS.
Having developed ASIPWQI, we conducted two sea trials in China’s Jiaozhou Bay (JB) and four in the Bohai Sea (BS) to verify the stability of the system’s operation. Also, the applicability of the monitoring system was confirmed in comparative experiments with water samples collected by the system and those obtained using traditional manual methods. In the JB sea trials,21 water samples were collected from various depths at 13 stations (Figure 10A), with the maximum sampling depth being 38 m. In the BS sea trials,100 water samples were collected from various depths at 44 stations (Figure 10B), with the maximum sampling depth being 48 m. In accordance with the Ocean Monitoring Specification requirements, only surface water samples were collected at stations with a water depth of less than 10 m, surface and bottom water samples were collected at stations with a water depth of more than 10 m but less than 20 m, and surface, middle, and bottom water samples were collected at stations with a water depth exceeding 20 m. The depth of surface water sample collection was 1–2 m from the sea surface, that of middle water sample collection was 10 m from the sea surface, and that of bottom water sample collection was 1–2 m from the sea floor.
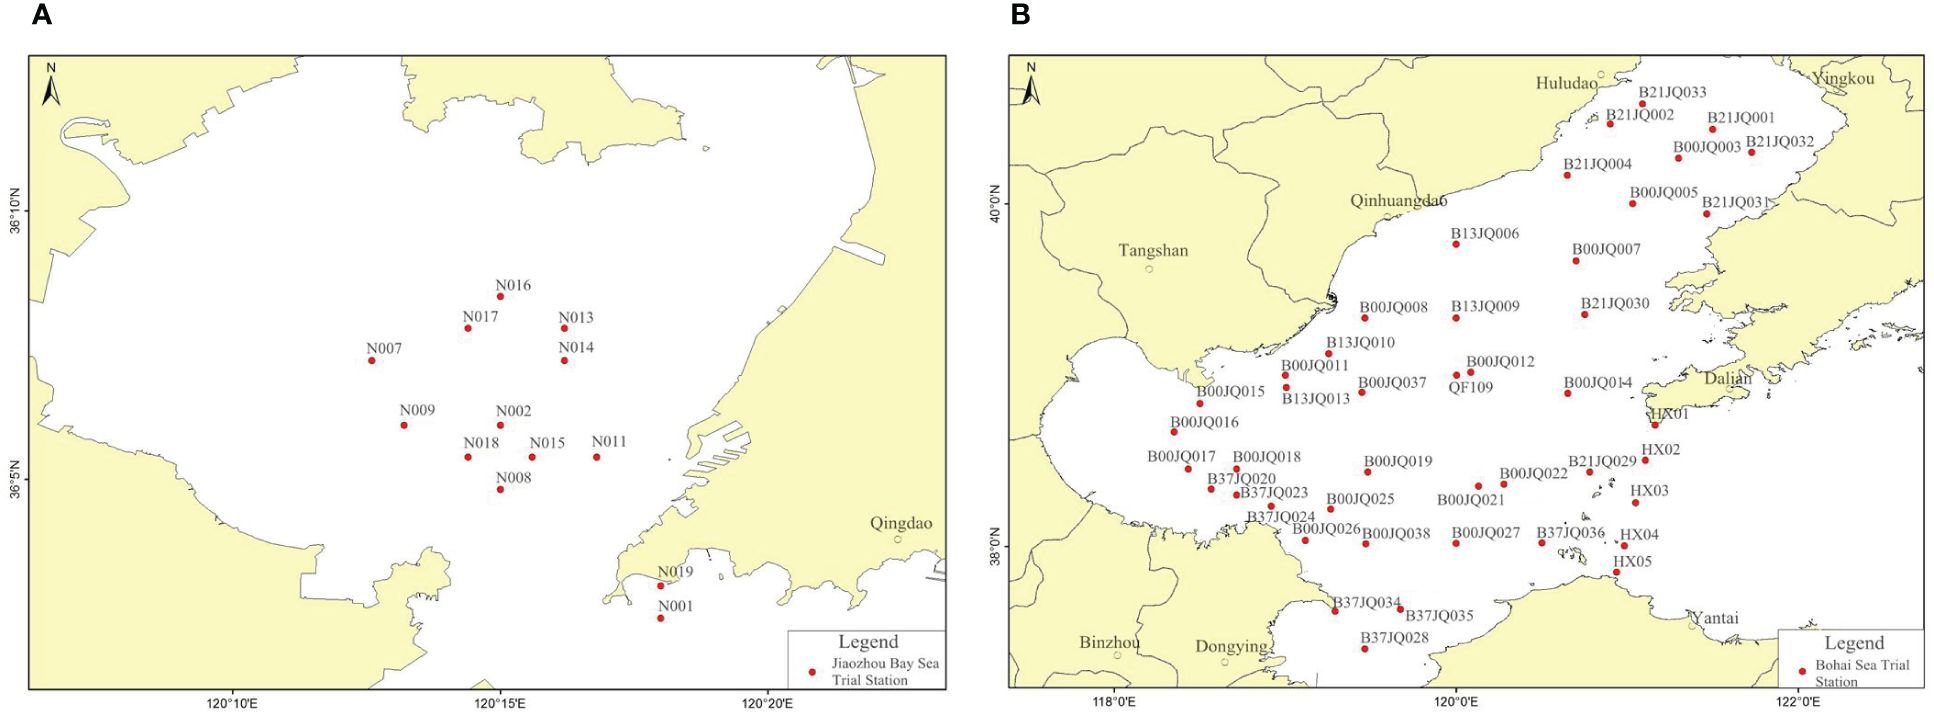
Figure 10 Maps of stations used in sea trials: (A) Jiaozhou Bay; (B) Bohai Sea.
As the ship arrived a sampling station, the operator configured the working mode using IMPS based on the depth information provided by the echo sounder. Upon initiating the start command, WSCDS began collecting water samples sequentially from the bottom layer, middle layer, and surface layer. Simultaneously, the deck test personnel initiated manual sampling using a ball valve water sampler, as shown in Figure 11. The thin rope attached to the ball valve water sampler was marked with a knot every meter, and the test personnel determined the water depth by counting the number of knots. After the sampler was raised onto the deck, the collected samples were transferred into plastic bottles, labeled with the station position, water depth, and layer number (surface, middle, or bottom), and stored in a refrigerator. The test personnel also retained water samples obtained by WSCDS through the designated sampling ports. These samples were similarly labeled with the station position, water depth, and layer number before being stored in the refrigerator. For each layer of water samples at every station, two parallel samples were collected and retained. Following the ship’s return to port, the collected samples were transported to the onshore laboratory for further processing and analysis, and a comparative study was conducted to evaluate the differences between the two methods used for sample collection.
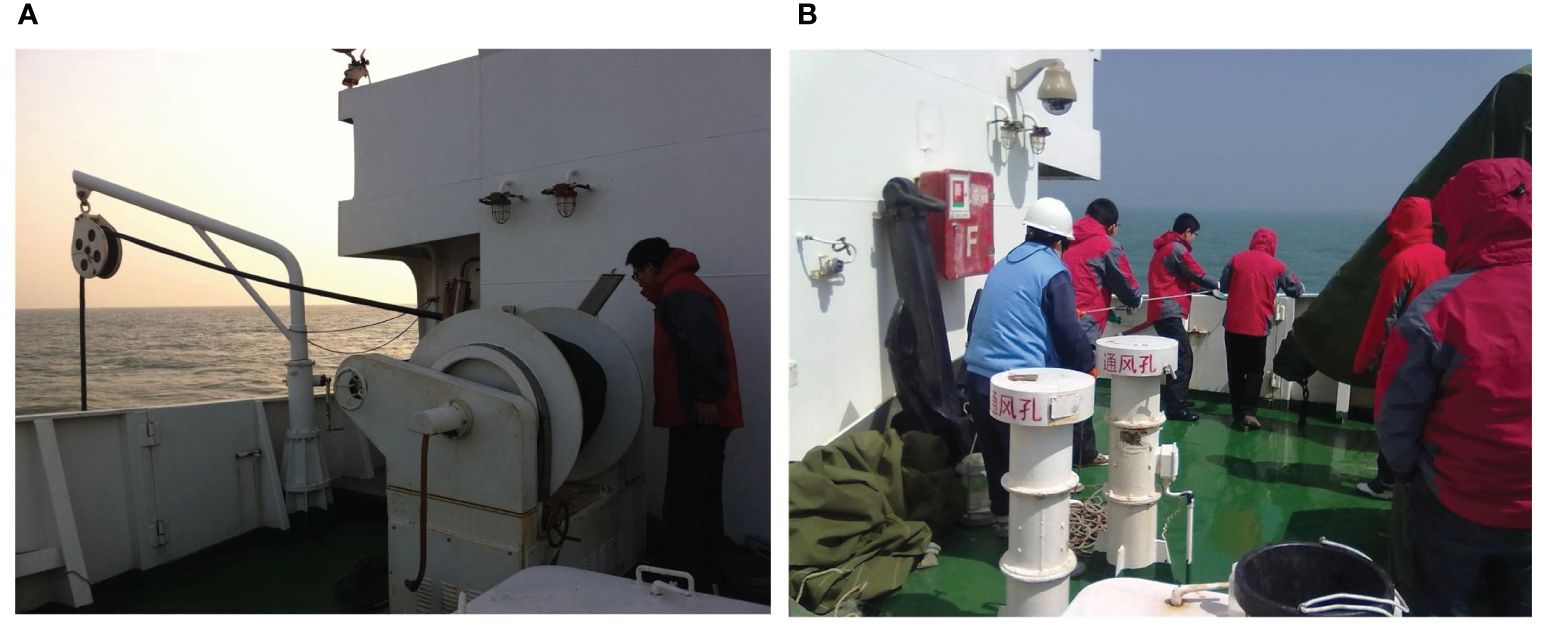
Figure 11 Photographs of sampling methods: (A) automatic; (B) manual.
The JB sea trials were conducted during summer (August), with daytime temperatures exceeding 35°C, whereas the BS sea trials were conducted during winter (December), with temperatures dropping below 0°C. Nevertheless, throughout the sea trials, the mechanical and electrical performance of ASIPWQI was resilient to the temperature extremes. The longest operational period was 44 days during the BS sea trials, with the system operating continuously for 24 h each day under favorable weather conditions. In total, 200 samples were collected from 88 stations at varying depths, and the absence of any system malfunctions during this high-intensity fieldwork underscores the stability and reliability of the system’s performance.
Water sample collection is a crucial step in water quality monitoring because only properly collected seawater samples can ensure the accuracy of the monitoring data. We investigated the differences between the automatic sampling method and the traditional manual sampling method; by comparing the results of laboratory measurements of water samples collected using both methods during the same JB voyage, we aimed to identify any discrepancies and analyze their implications. To conduct these analyses, we used the SPSSAU statistical software to perform analysis of variance(ANOVA) and correlation analysis on the collected data (SPSSAU, 2024) in order to demonstrate the applicability of the system by highlighting the differences and correlations present in the data. Furthermore, we used PRE statistical methods to analyze the measurement results quantitatively.
We conducted one-way ANOVA and correlation analysis to analyze the significant differences and correlations in the data collected during the first JB voyage, and the results are presented in Table 2. As can be seen, all monitored elements exhibit consistency with no significant differences, and a strong correlation is observed at the 0.01 significance level. This suggests that the water samples obtained using the two sampling methods are comparable.

Table 2 Statistical results of one-way ANOVA and correlation analysis.
By creating scatter plots, we can effectively visualize the distributions of the laboratory test data for the two types of water samples, as shown in Figure 12. The graphs show that for monitoring elements other than lead, the slope of the regression equation is close to unity with a low blank value (y-axis intercept), indicating strong correlation and regression. This suggests that ASIPWQI has minimal impact on these elements, making it suitable for their monitoring. While lead also exhibits good correlation, the regression equation’s large and positive blank value may be attributed to lead infiltrating from the pipeline materials of the automatic sampling system into the water samples (Yu et al., 2013). Currently, polymer materials used for laboratory equipment often contain various metal elements and polymeric organic compounds, and lead salts are incorporated as stabilizers during uPVC production (Peng and Liu, 2019). Soaking experiments on uPVC water pipes used for transporting drinking water have indicated that lead can leach into the water during soaking; the precipitation rate is highest at the outset, followed by a rapid decline and ultimately reaching equilibrium within 90 days (Qiao et al., 2000). Therefore, ASIPWQI is also suitable for monitoring lead content if (i) the pipelines are soaked in pure water for longer to address the issue of lead permeation and (ii) blank correction methods are used during data processing to yield more-precise lead values. The data analysis results indicate that the lead concentration in JB seawater complies with Class-II seawater standards, aligning with reported findings (QJPG, 2019).
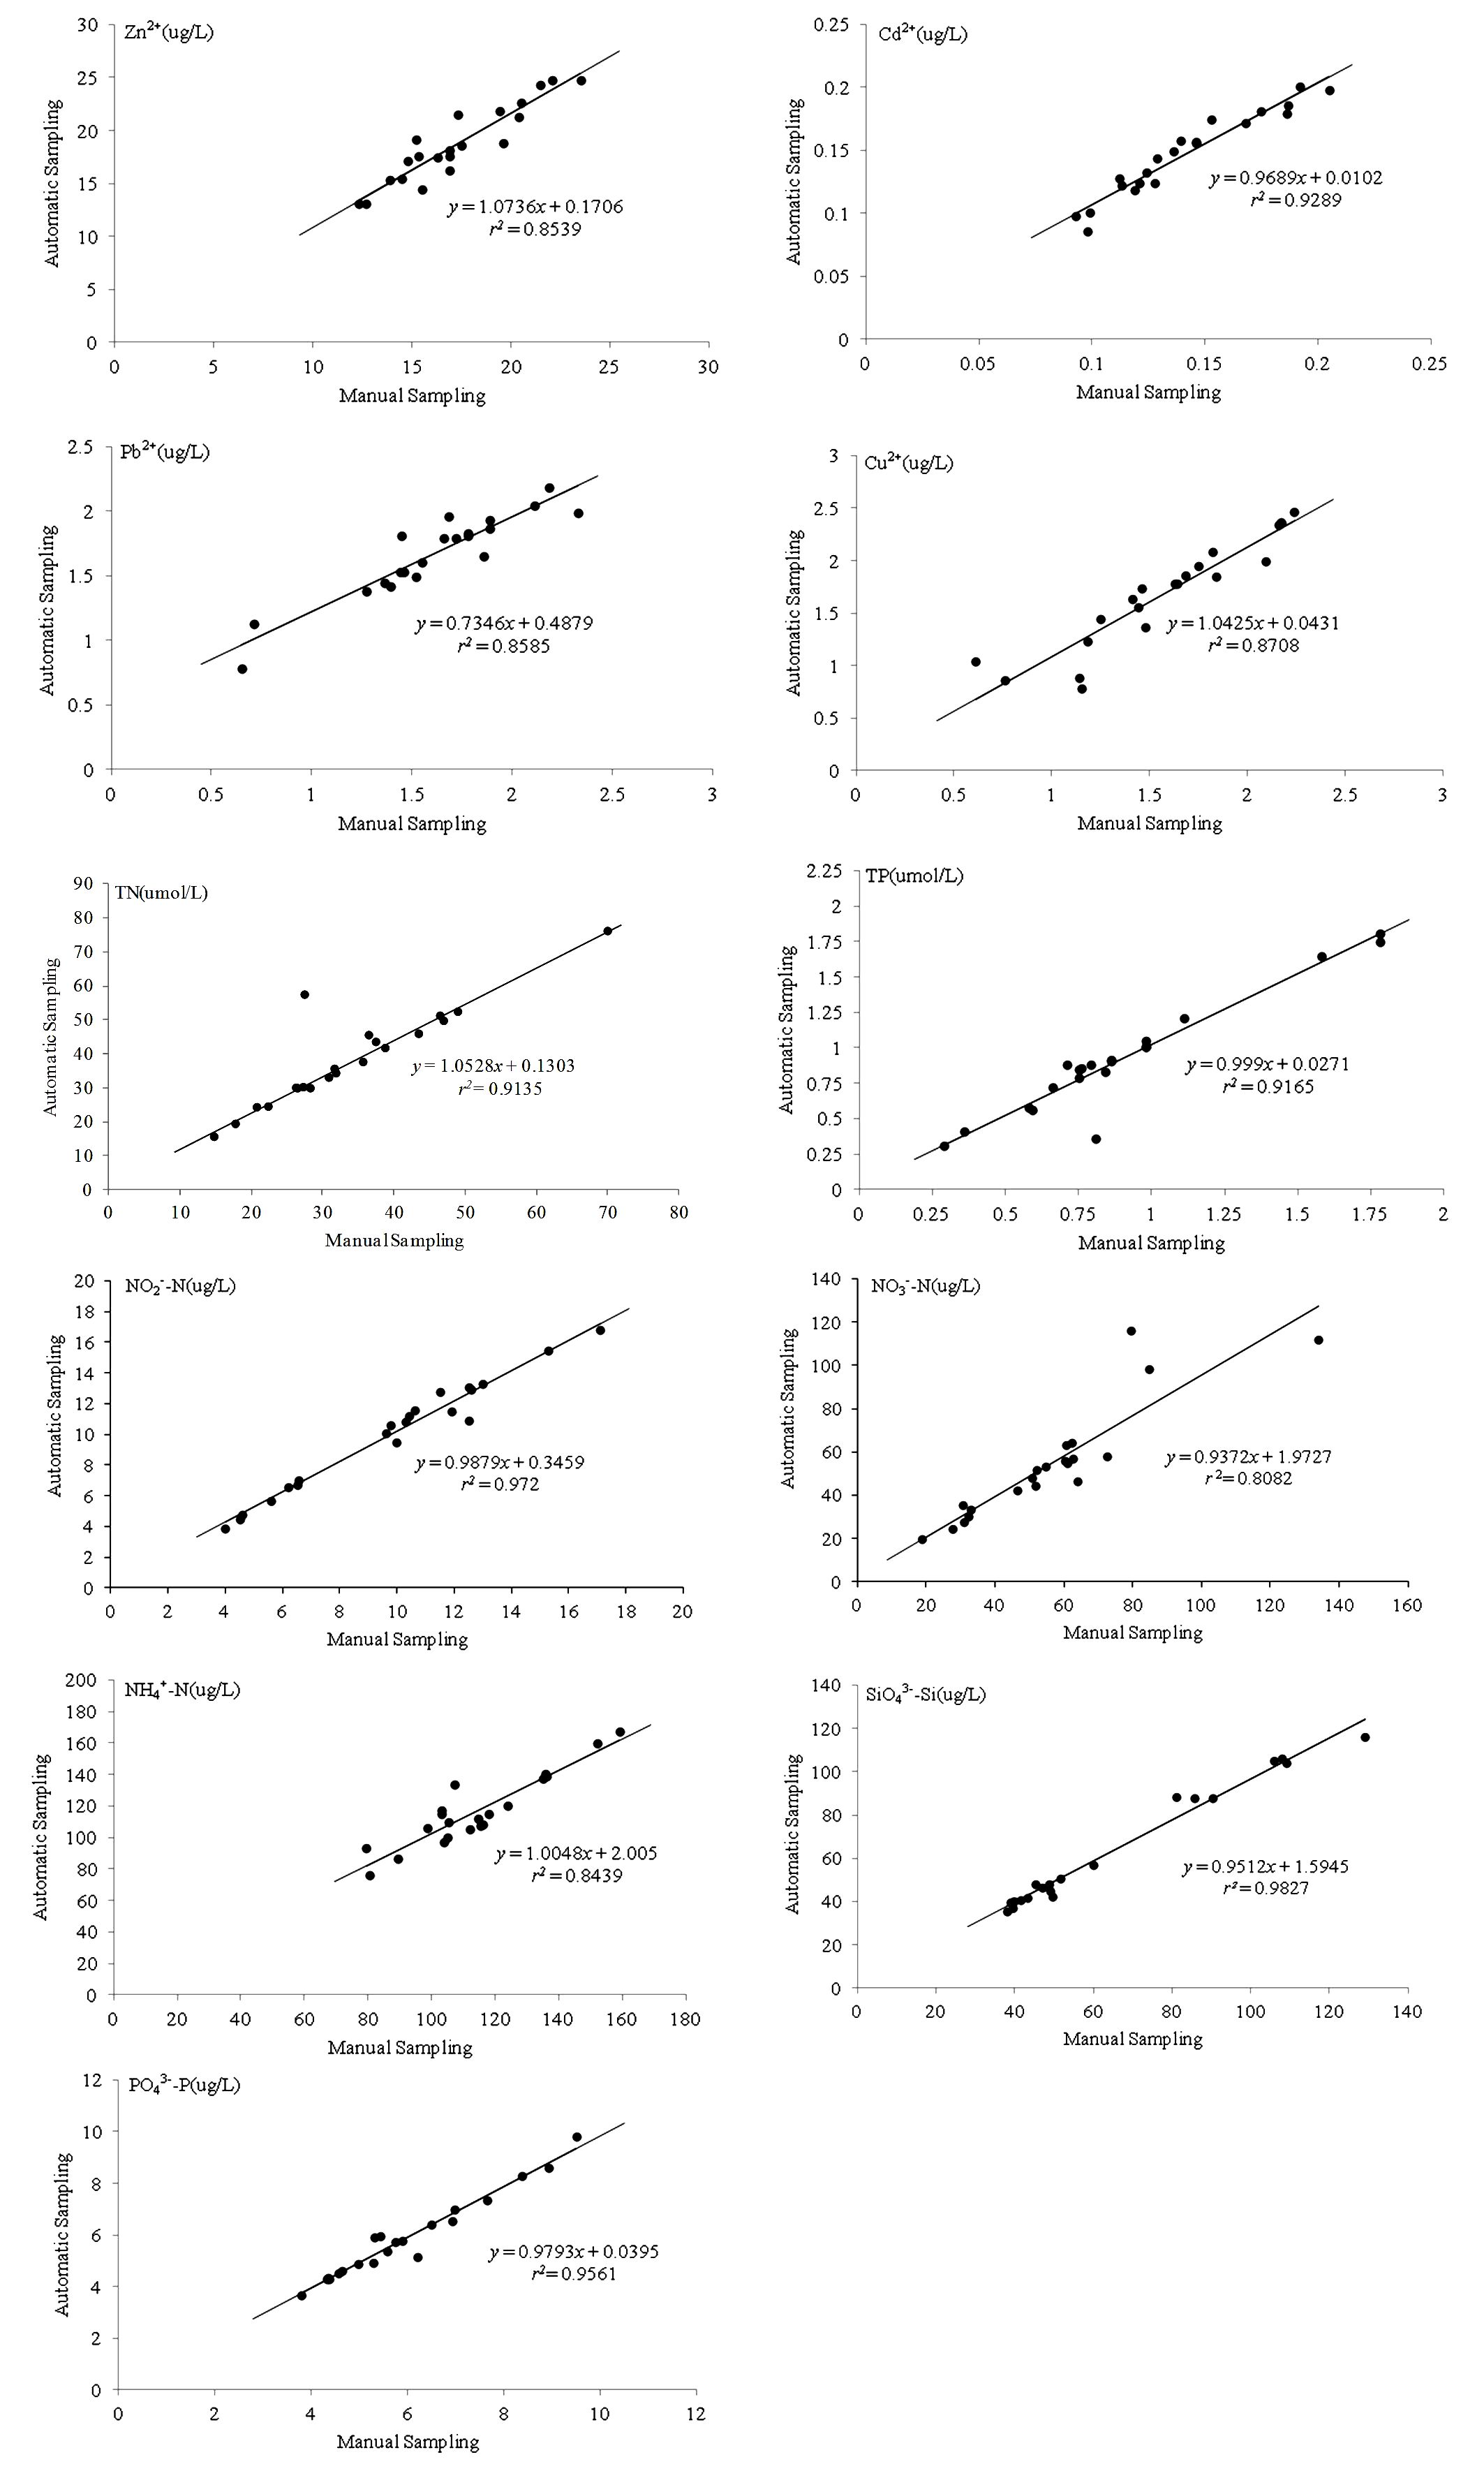
Figure 12 Scatter plots of monitoring elements.
We use PRE statistical methods to analyze quantitatively the measurement results of water samples. Practical relative error is a measurement method used to measure the differences between measurement results and true values, to evaluate the accuracy of measurement results, and to describe the degree of relative difference between measurement results and true values. The smaller the PRE, the closer the measurement result is to the true value, and the higher the accuracy. The PRE δ is calculated as
where, xtest is the measurement value obtained automatically in the laboratory and xrealis that obtained manually in the laboratory.
The minimum error of the shipborne water quality analysis instruments is 10% of the reading, so we set the threshold for δ to 10%: data with PRE below this value are considered qualified, and data with PRE above this value are considered unqualified. After removing obvious erroneous data, we calculated the PRE of each element and calculated the qualified data rate, and the results are presented in Table 3.
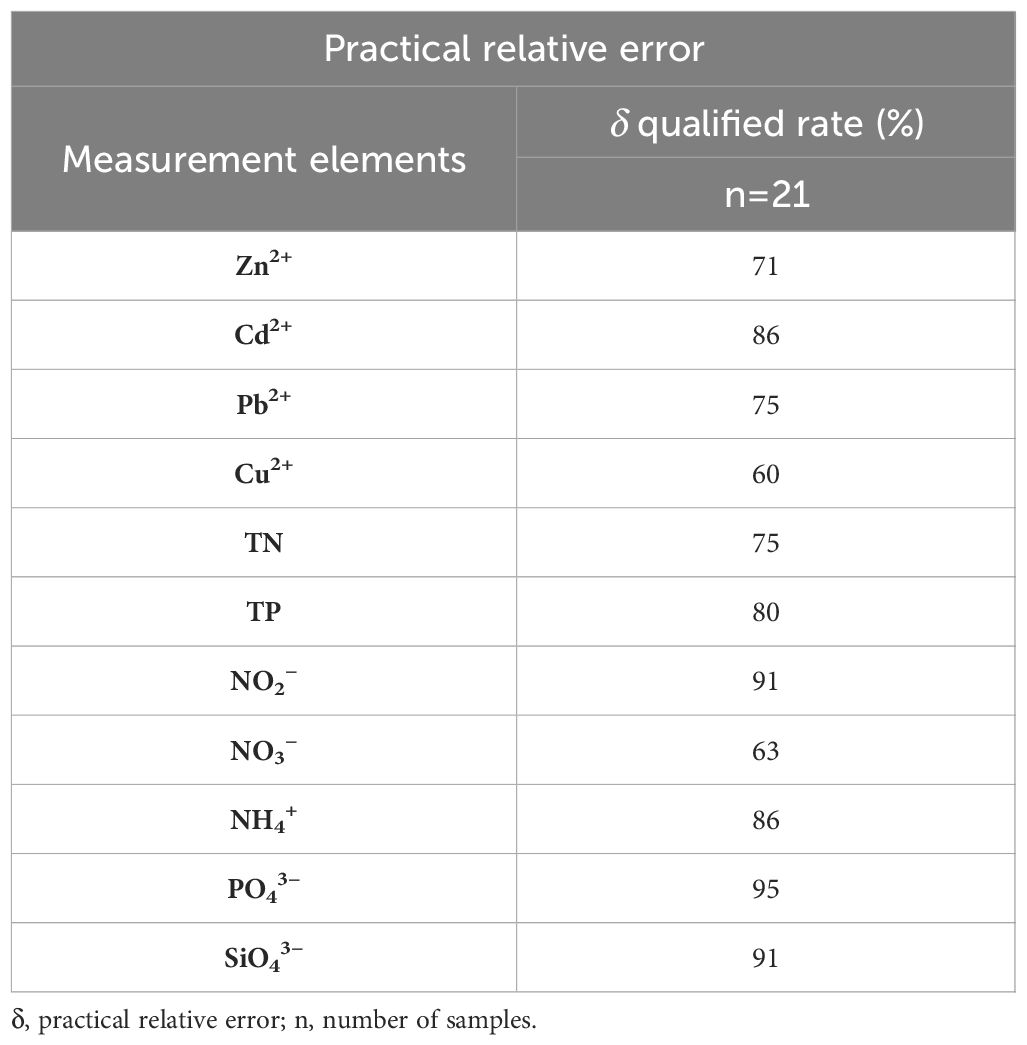
Table 3 Statistical results ofanalysis using practical relative error.
The results show that the qualified data rates for zinc, cadmium, lead, TN, TP, nitrite, ammonia, phosphate, and silica are greater than 70%, indicating that the water samples obtained by the automatic sampling method are fully suitable for monitoring these elements. Because of the fluidity and non-repeatability of seawater, even samples obtained continuously at the same station are not completely identical. Furthermore, the water samples obtained by automatic and manual sampling methods are not seawater from the same location, and there are also differences. We consider the errors caused by these differences to be random errors. The qualified data rates for copper and nitrate are 60% and 63%, respectively. Although the actual qualified data rates for these two elements are relatively low, considering the influence of random errors, a qualified data rate of over 70% can be obtained after correction. Therefore, the water samples obtained through automatic sampling are also suitable for monitoring these two elements.
In summary, ASIPWQI uses onboard LAN for efficient automatic collection, online analysis, and data release of multi-layer water samples, thereby enhancing monitoring efficiency. Sea trials in JB and BS spanning hot summer and severe winter conditions demonstrated the system’s resilience to varying temperatures in China’s nearshore waters. The system operated without malfunctions during high-intensity sea trials, validating the rationality of its design. We use national standard procedures in the laboratory to test parallel water samples obtained by automatic and manual methods. The results of one-way ANOVA and correlation analysis indicate that there are no significant difference in all monitoring elements of parallel water samples, and there is a strong correlation at the 0.01 level. The PRE analysis shows that the data rate with a relative error of less than 10% for monitoring elements is greater than 70%, which meets the technical requirements of marine monitoring equipment. The statistical analysis results indicate that ASIPWQI is suitable for routine monitoring of nutrients, heavy metals, and TP and TN. ASIPWQI is an innovative, real-time and efficient marine water quality monitoring technology.
Certainly, ASIPWQI still has some limitations to be addressed. The system’s sampling depth is constrained by the suction head of the water pump, restricting the maximum depth for water sample collection to 50 m. However, this depth is deemed adequate to fulfill the water quality monitoring requirements for China’s offshore waters. Furthermore, the current system is equipped with only three types of water quality analyzers. To enhance the functionality of ASIPWQI, it is essential to consider expanding the range of analysis instruments. This could include incorporating additional tools such as a multi-parameter water quality detector, a biological oxygen demand analyzer, and a chemical oxygen demand detector, among others. By broadening the array of analysis instruments, ASIPWQI can offer a more comprehensive suite of capabilities.
The original contributions presented in the study are included in the article/Supplementary Material. Further inquiries can be directed to the corresponding author.
CL: Writing – review & editing, Writing – original draft, Validation, Methodology. Y-ZS: Data curation, Writing – review & editing. H-MS: Validation, Methodology, Writing – review & editing.
The author(s) declare financial support was received for the research, authorship, and/or publication of this article. This project was supported by the National Key R&D Program of the Ministry of Science and Technology of the People’s Republic of China (Grant No. 2022YFC3104600, 2022YFC3003801) and the Special Project for Engineering R&D of Natural Disaster Prevention and Control (Grant No. TC210H00L/48).
The author expresses their gratitude to(i) the Beihai Marine Engineering Survey and Research Institute of the State Oceanic Administration for their valuable assistance during the ASIPWQI sea trials and (ii) the National Marine Environment Monitoring Center for conducting sample testing in their laboratory. Also, acknowledgment is made of the significant contributions of numerous past and present team members whose efforts and ideas shaped the results and concepts presented in this paper.
The authors declare that the research was conducted in the absence of any commercial or financial relationships that could be construed as a potential conflict of interest.
All claims expressed in this article are solely those of the authors and do not necessarily represent those of their affiliated organizations, or those of the publisher, the editors and the reviewers. Any product that may be evaluated in this article, or claim that may be made by its manufacturer, is not guaranteed or endorsed by the publisher.
The Supplementary Material for this article can be found online at: https://www.frontiersin.org/articles/10.3389/fmars.2024.1414686/full#supplementary-material
Bai Q. Y., Zhao C. (2019). The main reform development and progress of ecological and environmental monitoring in 40 years of China. Chin. J. Environ. Manage. 11, 30–33. doi: 10.16868/j.cnki.1674-6252.2019.04.030
Barnes C. R., Best M. M. R., Johnson F. R., Pautet L., Pirenne B. (2013). Challenges, benefits, and opportunities in installing and operating cabled ocean observatories: Perspectives from NEPTUNE Canada. IEEE. J. Oceanic. Eng. 38, 144–157. doi: 10.1109/JOE.2012.2212751
Cao N., Jiang Y. F. (2022). An analysis of China’s marine environmental monitoring legal system from the perspective of sustainable development. J. Shenyang Agric. Univ. (Soc. Sci. Edn.). 24, 185–189. doi: 10.3969/j.issn.1008-9713.2022.02.010
Cebe K., Balas L. (2018). Monitoring and modeling land-based marine pollution. Reg. Stud. Mar. Sci. 24, 23–39. doi: 10.1016/j.rsma.2018.06.010
Dai H. L., Mou N. X., Wang C. Y., Tian M. Y. (2014). Development status and trend of ocean buoy in Chia. Meteor. Hydrolog. Mar. Instru. 31, 118–121,125. doi: 10.19441/j.cnki.issn1006-009x.2014.02.031
Ding L. J., Li H. Y. (2009). Design and application of communication between upper computer and PLC. Mach. Tool Hyd. 37, 231–232. doi: 10.3969/j.issn.1001-3881.2009.09.076
Duan S. H., Wu L. X. (2017). Application of pneumatic diaphragm pump for automatic drainage. Colliery Mech. Elec. Technol. 5, 102–104. doi: 10.16545/j.cnki.cmet.2017.05.035
Edinger E. N., Risk M. J. (2013). Effect of land-based pollution on central Java coral reefs. J. Coast. Dev. 3 (2), 593–613.
European Union (2008). Directive 2008/56 edited by of the European Parliament and of the Council of 17 June 2008 (Brussels, Belgium: Official Journal of the European Union 164/136; European Union).
Halverson M. J., Pawlowicz R. (2013). High-resolution observations of chlorophyll-a biomass from an instrumented ferry: Influence of the Fraser River plume from 2003-2006. Cont. Shelf Res. 59, 52–64. doi: 10.1016/j.csr.2013.04.010
He S., Zhai R. R., Pan Y. (2018). Modeling analysis of the relationship between the exploitation and utilization of marine resources and the sustainable development of the marine economy. J. Coast. Res. 83, 964–969. doi: 10.2112/SI83-159.1
Helmi A. H. M. A., Hafiz M. M., Rizam M. S. B. S. (2014). “Mobile buoy for real time monitoring and assessment of water quality,” in IEEE. Conference on Systems, Process and Control (ICSPC 2014), Kuala Lumpur, Malaysia, IEEE Control Systems Society. 19–23. doi: 10.1109/ICSPC34406.2014
Li C., Li Y., Zhu R., Song Y. Z., Yang L. (2021). Design of a cabled seafloor observatory for marine ecological environment monitoring. Mar. Technol. Soc J. 55, 17–24. doi: 10.4031/MTSJ.55.2.17
Lu H. Y., Cheng C. Y., Cheng S. C., Cheng Y. H., Lo W. C., Jiang W. L., et al. (2022). A low-cost AI buoy system for monitoring water quality at offshore aquaculture cages. Sensors 22, 4078. doi: 10.3390/s22114078
Marghany M. (2021). Nonlinear ocean dynamics: synthetic aperture radar (Amsterdam, The Netherlands: Elsevier).
Marrec P., Cariou T., Latimier M., Macé E., Morin P., Vernet M., et al. (2014). Spatio-temporal dynamics of biogeochemical processes and air–sea CO2 fluxes in the Western English Channel based on two years of FerryBox deployment. J. Mar. Syst. 140, 26–38. doi: 10.1016/j.jmarsys.2014.05.010
McEliece R., Hinz S., Guarini J.-M., Coston-Guarini J. (2020). Evaluation of nearshore and offshore water quality assessment using UAV multispectral imagery. Remote Sens 12, 2258. doi: 10.3390/rs12142258
Ministry of Natural Resources of the People’s Republic of China (2011). China Ocean Development Report, (2011). Available online at: https://www.mnr.gov.cn/dt/ywbb/201810/t20181030_2256696.html (Accessed August 22, 2023).
Ministry of Natural Resources of the People’s Republic of China (2023). Revised draft of the marine environmental protection law. Available online at: https://www.mnr.gov.cn/dt/hy/202301/t20230106_2772262.html (Accessed August 22, 2023).
Paerl H. W., Rossignol K. L., Guajardo R., Hall N. S., Joyner A. R., Peierls B. L., et al. (2009). FerryMon: Ferry-based monitoring and assessment of human and climatically driven environmental change in the Albemarle-Pamlico Sound system. Environ. Sci. Technol. 43, 7609–7613. doi: 10.1021/es900558f
Peng Y. L., Liu J. H. (2019). The research on the effect of chemical components in plastic water pipe material on water quality. China Plastics Ind. 47, 157–160. doi: 10.3969/j.issn.1005-5770.2019.02.033
Petersen W. (2014). FerryBox systems: State-of-the-art in Europe and future development. J. Mar. Systems 140, 4–12. doi: 10.1016/j.jmarsys.2014.07.003
Popek M., Dereszewska A., Dembska G., Pazikowska-Sapota G. (2022). The impact of transport on the quality of water in the port of Gdynia. TransNav Int. J. Mar. Navig. Saf. Sea Transp. 16, 167–173. doi: 10.12716/1001.16.01.20
Qi S. P., Li Y. Z. (2019). A review of the development and current situation of marine environment observation technology and instruments. Shandong Sci. 32, 21–30. doi: 10.3976/j.issn.1002-4026.2019.05.002
Qiao Y. J., Zhang B. J., Han H. J., Xia Y. L., Wei L. (2000). Influence of chemical composition of plastic waterpipe on water quality. J. Harbin Univ. Sci.& Technol. 5, 41–43. doi: 10.15938/j.jhust.2000.02.011
Qingdao Jiaozhou People’s Government (2019). Qingdao Ecological Environment Status Bulletin of 2019. Available online at: http://www.jiaozhou.gov.cn/zwgk/bmxxgkml/qdssthjjjzfj/fdzdgknr/ghjh/202301/t20230115_6756379.shtml (Accessed February 10, 2024).
Ruokanen L., Kaitala S., Fleming V., Maunula P. (2003). Alg@line—joint operational unattended phytoplankton monitoring in the Baltic Sea. Elsevier Oceanogr. Series. 69, 519–522. doi: 10.1016/S0422-9894(03)80083-1
Si H. M., Wang X. N., Li C., Li L. P. (2011). Software design of shipborne seawater automatic sampling system. Ocean Technol. 30, 15–19. doi: 10.3969/j.issn.1003-2029.2011.01.004
Singh H., Bhardwaj N., Arya S. K., Khatri M. (2020). Environmental impacts of oil spills and their remediation by magnetic nanomaterials. Environ. Nanotechnol. Monit. Manage. 14, 100305. doi: 10.1016/j.enmm.2020.100305
Statistical Product and Service Software Automatically (2024). Data science analysis platform. Available online at: https://spssau.com/index.html (Accessed February 2, 2024).
Turetta C., Capodaglio G., Cairns W., Rabar S., Cescon P. (2005). Benthic fluxes of trace metals in the lagoon of Venice. Microchem. J. 79, 149–158. doi: 10.1016/j.microc.2004.06.003
Wang J. C., Sun J. C., Liu Y., Liu S. X., Zhang Y. Y., Chen S. Z., et al. (2023). Analysis and prospect of the development of marine monitoring instruments and equipment in China. Chin. Eng. Sci. 25, 1–11. doi: 10.15302/J-SSCAE-2023.07.024
Wang J. C., Wang Z. Q., Wang Y. M., Liu S. X., Li Y. Z. (2016). Current situation and trend of marine data buoy and monitoring network technology of China. Acta Oceanol. Sin. 35, 1–10. doi: 10.1007/s13131-016-0815-z
Wang N., Cheng C. K., Yang P. C., Li Y., Si H. M. (2021). Research and application progress of shipborne marine eco-logical online monitoring technology. Mar. Sci. 45, 133–140. doi: 10.11759/hykx20210105003
Xu G. Y., Bemis K., Jackson D., Ivakin A. (2021). Acoustic and in-situ observations of deep seafloor hydrothermal discharge: an OOI cabled array ASHES vent field case study. Earth Space Sci. 8, e2020EA001269. doi: 10.1029/2020EA001269
Yu H., Si H. M., Li C., Shao J. (2013). Applicability study on seawater sample from shipborne automatic water sampling and distributing device. Ocean Technol. 31, 6–9. doi: 10.3969/j.issn.1003-2029.2012.02.002
Zhang C., Chen H., Wang C. J., Meng Q. H., Zhao J. H. (2021). The develop and prospect of marine ecological environmental monitoring in China. Environ. Prot. 49, 39–42. doi: 10.14026/j.cnki.0253-9705.2021.12.010
Zhang X. L., Ding D. W., Xu J. S., Liu D. W., Wang H. Y., Tao C. F. (2010). Heavy metal in seawater and sediment investigation at Bohai Sea western estuary tidal zone. J. East China Inst. Technol. 33, 276–280. doi: 10.3969/j.issn.1674-3504.2010.03.10
Zhang L. T., Ni G. J., Han L. M., Shi L. (2018). The institutional mechanism experience of overseas marine development and utilization and its enlightenment for China. World Agric. 8, 66–71,212. doi: 10.13856/j.cnll-1097/s.2018.08.011
Zheng M. Z., Liu Y., Li M. J., Qiu J. (2013). Current situation and trends of marine resource development and utilization in China. Ocean Dev. Manage. 12, 13–16. doi: 10.20016/j.cnki.hykfygl.2013.12.003
Keywords: shipborne, marine water quality monitoring, sample collection, real-time online measurement, stability and applicability
Citation: Li C, Song Y-Z and Si H-M (2024) Development and implementation of an advanced shipborne integrated platform for water quality inspection. Front. Mar. Sci. 11:1414686. doi: 10.3389/fmars.2024.1414686
Received: 09 April 2024; Accepted: 17 June 2024;
Published: 04 July 2024.
Edited by:
Terry Eugene Whitledge, Retired, Fairbanks, United StatesReviewed by:
Maged Marghany, Syiah Kuala University, IndonesiaCopyright © 2024 Li, Song and Si. This is an open-access article distributed under the terms of the Creative Commons Attribution License (CC BY). The use, distribution or reproduction in other forums is permitted, provided the original author(s) and the copyright owner(s) are credited and that the original publication in this journal is cited, in accordance with accepted academic practice. No use, distribution or reproduction is permitted which does not comply with these terms.
*Correspondence: Chao Li, NTcxNzQ3ODJAcXEuY29t
Disclaimer: All claims expressed in this article are solely those of the authors and do not necessarily represent those of their affiliated organizations, or those of the publisher, the editors and the reviewers. Any product that may be evaluated in this article or claim that may be made by its manufacturer is not guaranteed or endorsed by the publisher.
Research integrity at Frontiers
Learn more about the work of our research integrity team to safeguard the quality of each article we publish.