- 1Department of Oceanography, Texas A&M University, College Station, TX, United States
- 2Department of Marine and Coastal Environmental Science, Texas A&M University at Galveston, Galveston, TX, United States
Retention of plastics in estuaries and storage in sediments likely contributes to the mass imbalance between the amount of ocean plastic debris and input from land. A sediment transport model, coupled with a hydrodynamic and wave model, was employed to analyze how microplastics of varying settling velocities behave under non-storm conditions and during extreme storm events in Galveston Bay, USA. The model was informed by measured concentrations of microplastics in a main tributary (Buffalo Bayou), which flows through the highly populated Houston-metro area. Under non-storm conditions, concentrations of neutrally buoyant particles are highest near the source location. In contrast, negatively buoyant particles are highest near the bay mouth where bed shear stress, and thus the potential for erosion/resuspension, is highest. Simulation of Hurricane Harvey, an unpreceded 1000-year flood event, shows a drastic increase of overall microplastic levels in Galveston Bay, approximately 5x that of non-storm conditions, and an increase in corresponding flux of microplastics to the Gulf of Mexico. The differences are attributed both to increases in microplastic loading and erosion of microplastics from bed sediments during Harvey. Differences in concentration between storm and non-storm conditions are most clear in the upper bay, where shear stress is low under normal conditions but shows a significant increase during storms due to wave-enhanced stress. Following Harvey, negatively buoyant particles levels return to normal in less than a week, but neutrally buoyant particle concentrations remain elevated over several months. Use of a sediment transport model that simulates erosion/resuspension to understand particle behavior lends further understanding of processes of microplastics not explored through previous use of particle tracking models that do not account for erosion/resuspension. This is of upmost importance for simulation of negatively buoyant particles, which have more potential to interact with the sediment bed layer. Variation of critical shear stress for erosion, erosion rate, and use of a wave model, all show significant impacts on particle behavior. Future parameterization of microplastic behavior in sediments will enhance our understanding of estuarine retention and export ability.
1 Introduction
Human reliance on plastics, particularly single-use plastics, has led to an accumulation of plastic debris at a staggering rate. Recent years have seen an upward trend in interest, both scholarly and publicly, in the topic of microplastics (size between 1 μm and 5 mm) and their impact on the world around us. Microplastics have been documented to carry toxins, affect the growth of algae, and cause internal damage or even death of animals (Rafa et al., 2024). Microplastic presence has become ubiquitous in the environment, with detection in food, tap water, soil, air, and even the human blood stream (Akdogan and Guven, 2019; Wang et al., 2021; Leslie et al., 2022).
It has been estimated that somewhere between 1.7 to 14.5 million metric tons of plastic waste is transferred from coastal cities to the ocean each year (Jambeck et al., 2015; Wayman and Niemann, 2021; Ritchie, 2023). The majority of microplastics enter coastal waterbodies through either wastewater treatment plant effluent or industrial discharge, where they then become suspended in the water column, stored in sediments, or ingested by marine life (Vivekanand et al., 2021). The fate and distribution of these plastics within the water column has been found to be heavily influenced by physical processes such as tides, wind, vertical mixing, estuarine circulation, and settling velocity of the microplastic particle itself (Critchell and Lambrechts, 2016; Hardesty et al., 2017; Summers et al., 2023). However, few studies have so far examined microplastic abundance and interaction with sediments (Ridall and Ingels, 2022).
Tropical storms and hurricanes are known to have a strong influence on estuaries and coastal ecosystems. Storm processes that can impact estuarine sediments, and similarly microplastics, include strong currents induced by storm surge, changes in wave action, flooding from excess rainfall, and drastic alterations in temperature-salinity stratification (Hayes, 1978; Critchell and Lambrechts, 2016; Duis and Coors, 2016). A singular hurricane poses the possibility of causing more erosion and deposition in an estuary in a few hours than what would typically occur in a decade under non-storm conditions (Hayes, 1978). Hydrodynamic effects induced by storms (e.g., increased rainfall, high wind speeds, high levels of storm surge, and fluctuations in salinity) are typically strong, but short lived (Greening et al., 2006; Wilson et al., 2006). However, persistent post-storm effects can be damaging on water quality and ecosystem health, and can cause pollutants to be retained for months, or longer, after a storm’s passing (Du and Park, 2019; Du et al., 2020, 2021).
The increase in frequency of hurricane landfalls in the southern United States has been documented over the past few decades, with a predicted increase in decades to come with global climate change (Goldenberg et al., 2001; Emanuel, 2005). The bathymetric, geometric, and topographical features of the Gulf of Mexico coast make this region extremely susceptible to tropical storms and hurricanes, which have historically caused devastating damages to property, severe coastal flooding, and loss of life (Chen et al., 2008). Of the recent significant storms with direct impact on the Gulf of Mexico coast, e.g., Ivan (2004), Katrina (2005), Rita (2005), Ike (2008), Harvey (2017), Laura (2020), and Ida (2021), Hurricane Harvey was unique in heavy precipitation. It dumped 1.54 m of rain in Southeast Texas, making it the wettest tropical cyclone on record for the United States, necessitating over 120,000 rescues and attributing to over 80 deaths (van Oldenborgh et al., 2018).
Despite the frequent occurrence of seasonal hurricanes and the omnipresence of microplastics in the aquatic environment, little research has been carried out to understand how, and to what extent, severe storm conditions impact the transport of microplastic particles. The Gulf of Mexico has been reported to have comparable microplastic values (particles in m3) to that of the Great Pacific Garbage Patch (Wessel et al., 2016; Di Mauro et al., 2017). However, there currently exists a fundamental lack of knowledge in regard to how the microplastic particles are transported and their concentrations change during extreme storm events (Shruti et al., 2021). It is estimated that Hurricane Harvey alone brought an additional 14×109 m3 of freshwater and delivered 9.9×10⁷ metric tons of sediment into Galveston Bay (Du et al., 2019a). It is likely that during Harvey the huge inflows of freshwater and sediment to the bay were associated with microplastic pollution.
Past modelling studies in riverine environments that account for sediment-water interactions have shown that settling behavior of microplastics coincides with their concentration in the sediment bed (He et al., 2021; Kumar et al., 2021). These studies have indicated that heavy microplastics are prone to accumulate near the source location under normal conditions, with high flow periods having the potential to remobilize microplastics back into the water column (Nizzetto et al., 2016; De Arbeloa and Marzadri, 2024). However, there is currently a fundamental gap in knowledge reflecting equivalent microplastic-sediment interactions in estuarine environments. Most studies that currently exist for estuaries focus on positive or neutrally buoyant particles, or do not account for deposition/erosion/resuspension processes at the water-bed interface (Isobe et al., 2009; Gorman et al., 2020; López et al., 2021). Understanding of these processes is paramount to full understanding of microplastic distributions and transport across estuarine zones. A step towards closing this knowledge gap is modifying currently existing sediment transport models (which already account for deposition/erosion/resuspension processes) to study microplastic transport in estuaries.
Lagrangian particle tracking models (PTMs) have been a popular choice for modelling particle transport in aquatic environments (van Sebille et al., 2018; Nordam et al., 2023; Summers et al., 2023) including sediments (Argall et al., 2004) and microplastic particles (Bigdeli et al., 2022). However, there have not been many studies for PTMs with the parameterization of both sediment particle deposition and erosion/resuspension at water-bed interface. While some PTMs account for deposition to the bed, many do not consider erosion/resuspension at the water-bed interface (Argall et al., 2004; Preziosi-Ribero et al., 2020). A model that operates in the Surface-water Modeling System (SMS) interface (MacDonald et al., 2006; Gailani et al., 2007) does consider deposition and erosion/resuspension (in the form of entrainment), but more studies certainly need to be conducted for the parameterization of deposition and erosion/resuspension in PTMs. Using a sediment transport model in this study based on advection-diffusion mass-balance equations with the parameterization of deposition/erosion/resuspension processes, we aim to assess the importance of these processes at the water-bed interface by comparing the sediment transport model results to those of the PTM presented in Summers et al. (2023).
For this study, we use a 3D validated hydrodynamic model, coupled with a sediment transport model adapted for microplastic particles, and a wave model to account for the wave-enhanced bottom stress, to examine how microplastics behave in Galveston Bay, USA, both under normal conditions and during extreme storm events. Microplastic particles are treated as sediment particles with four different settling velocities determined from laboratory experiments. We analyze how microplastic particles behave within an estuarine environment before, during, and after the storm event. Emphasis is placed on how many particles are being retained overall inside the bay, and what areas of the bay are particularly vulnerable at different periods of time. Hurricane Harvey is the main storm of focus in this study, with additional analysis carried out on Hurricane Nate, Tropical Storm Cindy, and winter storm Jupiter.
2 Methods
2.1 Hydrodynamic model
A Semi-implicit Cross-scale Hydroscience Integrated System Model (SCHISM; Zhang et al., 2015, 2016) is used for this study. SCHISM is an open-source modelling system with an unstructured grid. It uses a semi-implicit finite-element, finite-volume method with an Eulerian-Lagrangian algorithm in order to solve the turbulence-averaged Navier-Stokes equations, using the hydrostatic approximation. It employs a length-scale model (Umlauf and Burchard, 2003) with a stability function (Kantha and Clayson, 1994) for turbulence closure. The model allows for a flexible vertical grid system, resolving the complex topography in estuarine systems without any smoothing (Zhang et al., 2016; Ye et al., 2018).
A hydrodynamic model based on SCHISM was developed for the northwestern Gulf of Mexico with a focus on the Galveston Bay estuary (Du et al., 2019b). The model grid has a horizontal resolution ranging from 10 km in the open ocean to 2.5 km on the shelf. The bathymetry used in the model is based on the coastal relief model (3 arcsec resolution; https://www.ngdc.noaa.gov). A hybrid s-z grid is used in the vertical direction, with 10 sigma layers for depths less than 20 m and another 30 z-layers for depths 20 to 4,000 m. The model, when driven by realistic forcing conditions from the European Centre for Medium-Range Weather Forecasts (ECMWF: https://www.ecmwf.int), the global HYCOM model output (https://www.hycom.org/data/glbu0pt08), and river discharge from USGS gauging stations, and with open boundary conditions from FES2014 global tide, has successfully reproduced observed hydrodynamic parameters, including water level, velocity, salinity, and temperature under fair weather (Du et al., 2019b) and storm conditions (Du and Park, 2019).
The model grid has been upgraded to resolve smaller features, e.g., ship channels and intracoastal waterways, in major estuarine bay systems in Texas and Louisiana west of the Mississippi River outflow. Deep ship channels play a key role for the salt intrusion (Ye et al., 2018) and are major transport pathway for offshore export of microplastics (Summers et al., 2023). To improve model accuracy, special efforts were taken to realistically resolve these narrow (100-150 m wide) and deep (~15 m) ship channels existing in all of the coastal bays in Texas and Louisiana, resulting in an updated model grid with 86,009 nodes. The hydrodynamic conditions are simulated for 2017, the year that experienced four storms affecting Galveston Bay: Hurricane Harvey (the main event of this study), Hurricane Nate, Tropical Storm Cindy, and winter storm Jupiter (Table 1). The model reproduces very well the observed data for water level from NOAA, salinity from the Texas Water Development Board (TWDB), and temperature from TWDB/NOAA (Du and Park, 2019; Du et al., 2019b). Examples of the model validation for 2018 are presented in Summers et al. (2024), and the model-data comparison is as good for 2017.
2.2 Sediment transport model
SCHISM contains a 3D non-cohesive sediment model (SED3D), which was adapted from the Community Sediment Transport Model (Warner et al., 2008; Pinto et al., 2012). SED3D uses the same model grid and timestep as SCHISM. While SED3D can simulate sediment transport by both suspended load and bedload, we consider only the suspended-load transport in this study. SED3D also tracks the evolution of sediment bed. SED3D can represent an unlimited number of user-defined sediment classes, with each class having unique attributes of settling velocity, critical shear stress for erosion, and erodibility constant.
Each sediment class is based on the mass-balance (advection-diffusion) equation. Compared to salt-balance equation, the mass-balance equation for the sediment class m has additional source/sink terms (Csource,m) for settling in the water column and erosion/deposition at the water-bed interface (Warner et al., 2008):
where ws,m is the user specified settling velocity, Cm is the concentration of the sediment class m, s is the vertical sigma coordinate, and Es,m is the erosional flux. The erosion term is applied only to the bottom computational cell where the settling term becomes the depositional flux. The sediment bed layer is modified at each time step to account for erosion and deposition. The erosional flux in Equation 1 is parameterized following Ariathurai and Arulanandan (1978):
where E0 is the erosion rate, i.e., a bed erodibility constant, φ is the porosity of the top bed layer, τsf is the bottom stress (induced by combined wave and current), and τce,m is the critical shear stress for erosion. The erosional flux for each sediment class is further limited by the availability of that class in the top layer of the sediment bed layer.
SED3D has the bottom-boundary layer submodel that parameterizes wave–current interactions that enhance bottom stresses. SED3D hence is run in conjunction with the wind wave model (WWM). This is especially important for shallower areas, such as Galveston Bay, where the presence of waves can significantly affect the bottom stress in the wave bottom boundary layer. Comparison of bed shear stress with and without WWM model is discussed in Section 4.5. A more detailed description of SED3D and WWM can be found in the SCHISM manual (http://ccrm.vims.edu/schismweb/SCHISM_v5.6-Manual.pdf).
2.3 Application of sediment transport model
In the application of SED3D, we choose to consider four sediment classes to represent microplastic particles in Galveston Bay. The microplastic samples collected from Galveston Bay and analyzed in laboratory experiments (Wharton et al., in prep)1 show four size classes associated with the highest concentrations, with the settling velocities of 0 (neutrally buoyant), 7, 13, and 38 m d-1. Microplastic settling behavior in this model is represented by these settling velocities, and their density is not considered at this time. Settling velocities were determined in an elutriation system using countercurrents following the design of Peterson et al. (2005).
The extent to which microplastic erosion/resuspension into the water column occurs, which depends on the properties of particles and sediment bed, has not yet been researched in depth, with no clear consensus on what erosion parameters are necessary to erode/resuspend or deposit microplastic particles (Waldschläger and Schüttrumpf, 2019a). Recent studies have shown that microplastics can have a wide range of critical shear stress for erosion (0.002-0.233 Pa) based on particle and sediment properties (Ballent et al., 2013; Waldschläger and Schüttrumpf, 2019a). The previous studies for sediment erosion in estuaries reported similar results, e.g., 0.026-0.1 Pa for the York River estuary (Maa and Kim, 2001). In our study, τce in Equation 2 is considered constant for all microplastic classes with the default model value of 0.03 Pa. The effect of the variation in τce is discussed in Section 4.3. Like τce, few studies have been conducted for the erosion rate (E0 in Equation 2) for microplastic particles. In this study, E0 for all microplastic classes is set at 24x10-11 kg m−2 s−1. This is estimated using the constant for natural sediments default set in the model (6x10⁻⁵ kg m−2 s−1) and an estimated weight of microplastic particles in total sediment weight (4x10⁻⁶ kg in 1 kg of sediments, assuming 10 g of microplastics in 1 m3 of sediments, ~2500 kg) for Galveston Bay. The effect of the variation in E0 is discussed in Section 4.4.
Very little information is available for microplastic loading into Galveston Bay. We consider in this study the microplastic load only from Buffalo Bayou (see Figure 1 for its location). Buffalo Bayou is an ideal source location to examine microplastic input into Galveston Bay, as it flows through the highly populated Houston metro area, which is home to roughly 40% of the U.S. petrochemical production. Buffalo Bayou is approximately 80 km long, and its watershed houses a population of over 444,000 people (Bukunmi-Omidiran and Sridhar, 2021). Field data indicates concentrations of microplastic loading from Buffalo Bayou are 1.32 (neutrally buoyant), 1.76 (ws = 7 m d-1), 2.54 (ws = 13 m d-1), and 5.80 mg m-3 (ws = 38 m d1) (Wharton et al., in prep.). The median river inflow from Buffalo Bayou for 2017 is 9.6 m3 s-1 (Supplementary Figure 1), which translates to a total of 9.5 kg d-1 of microplastic input into Galveston Bay from Buffalo Bayou on average in 2017. We use this constant loading information (Table 2).
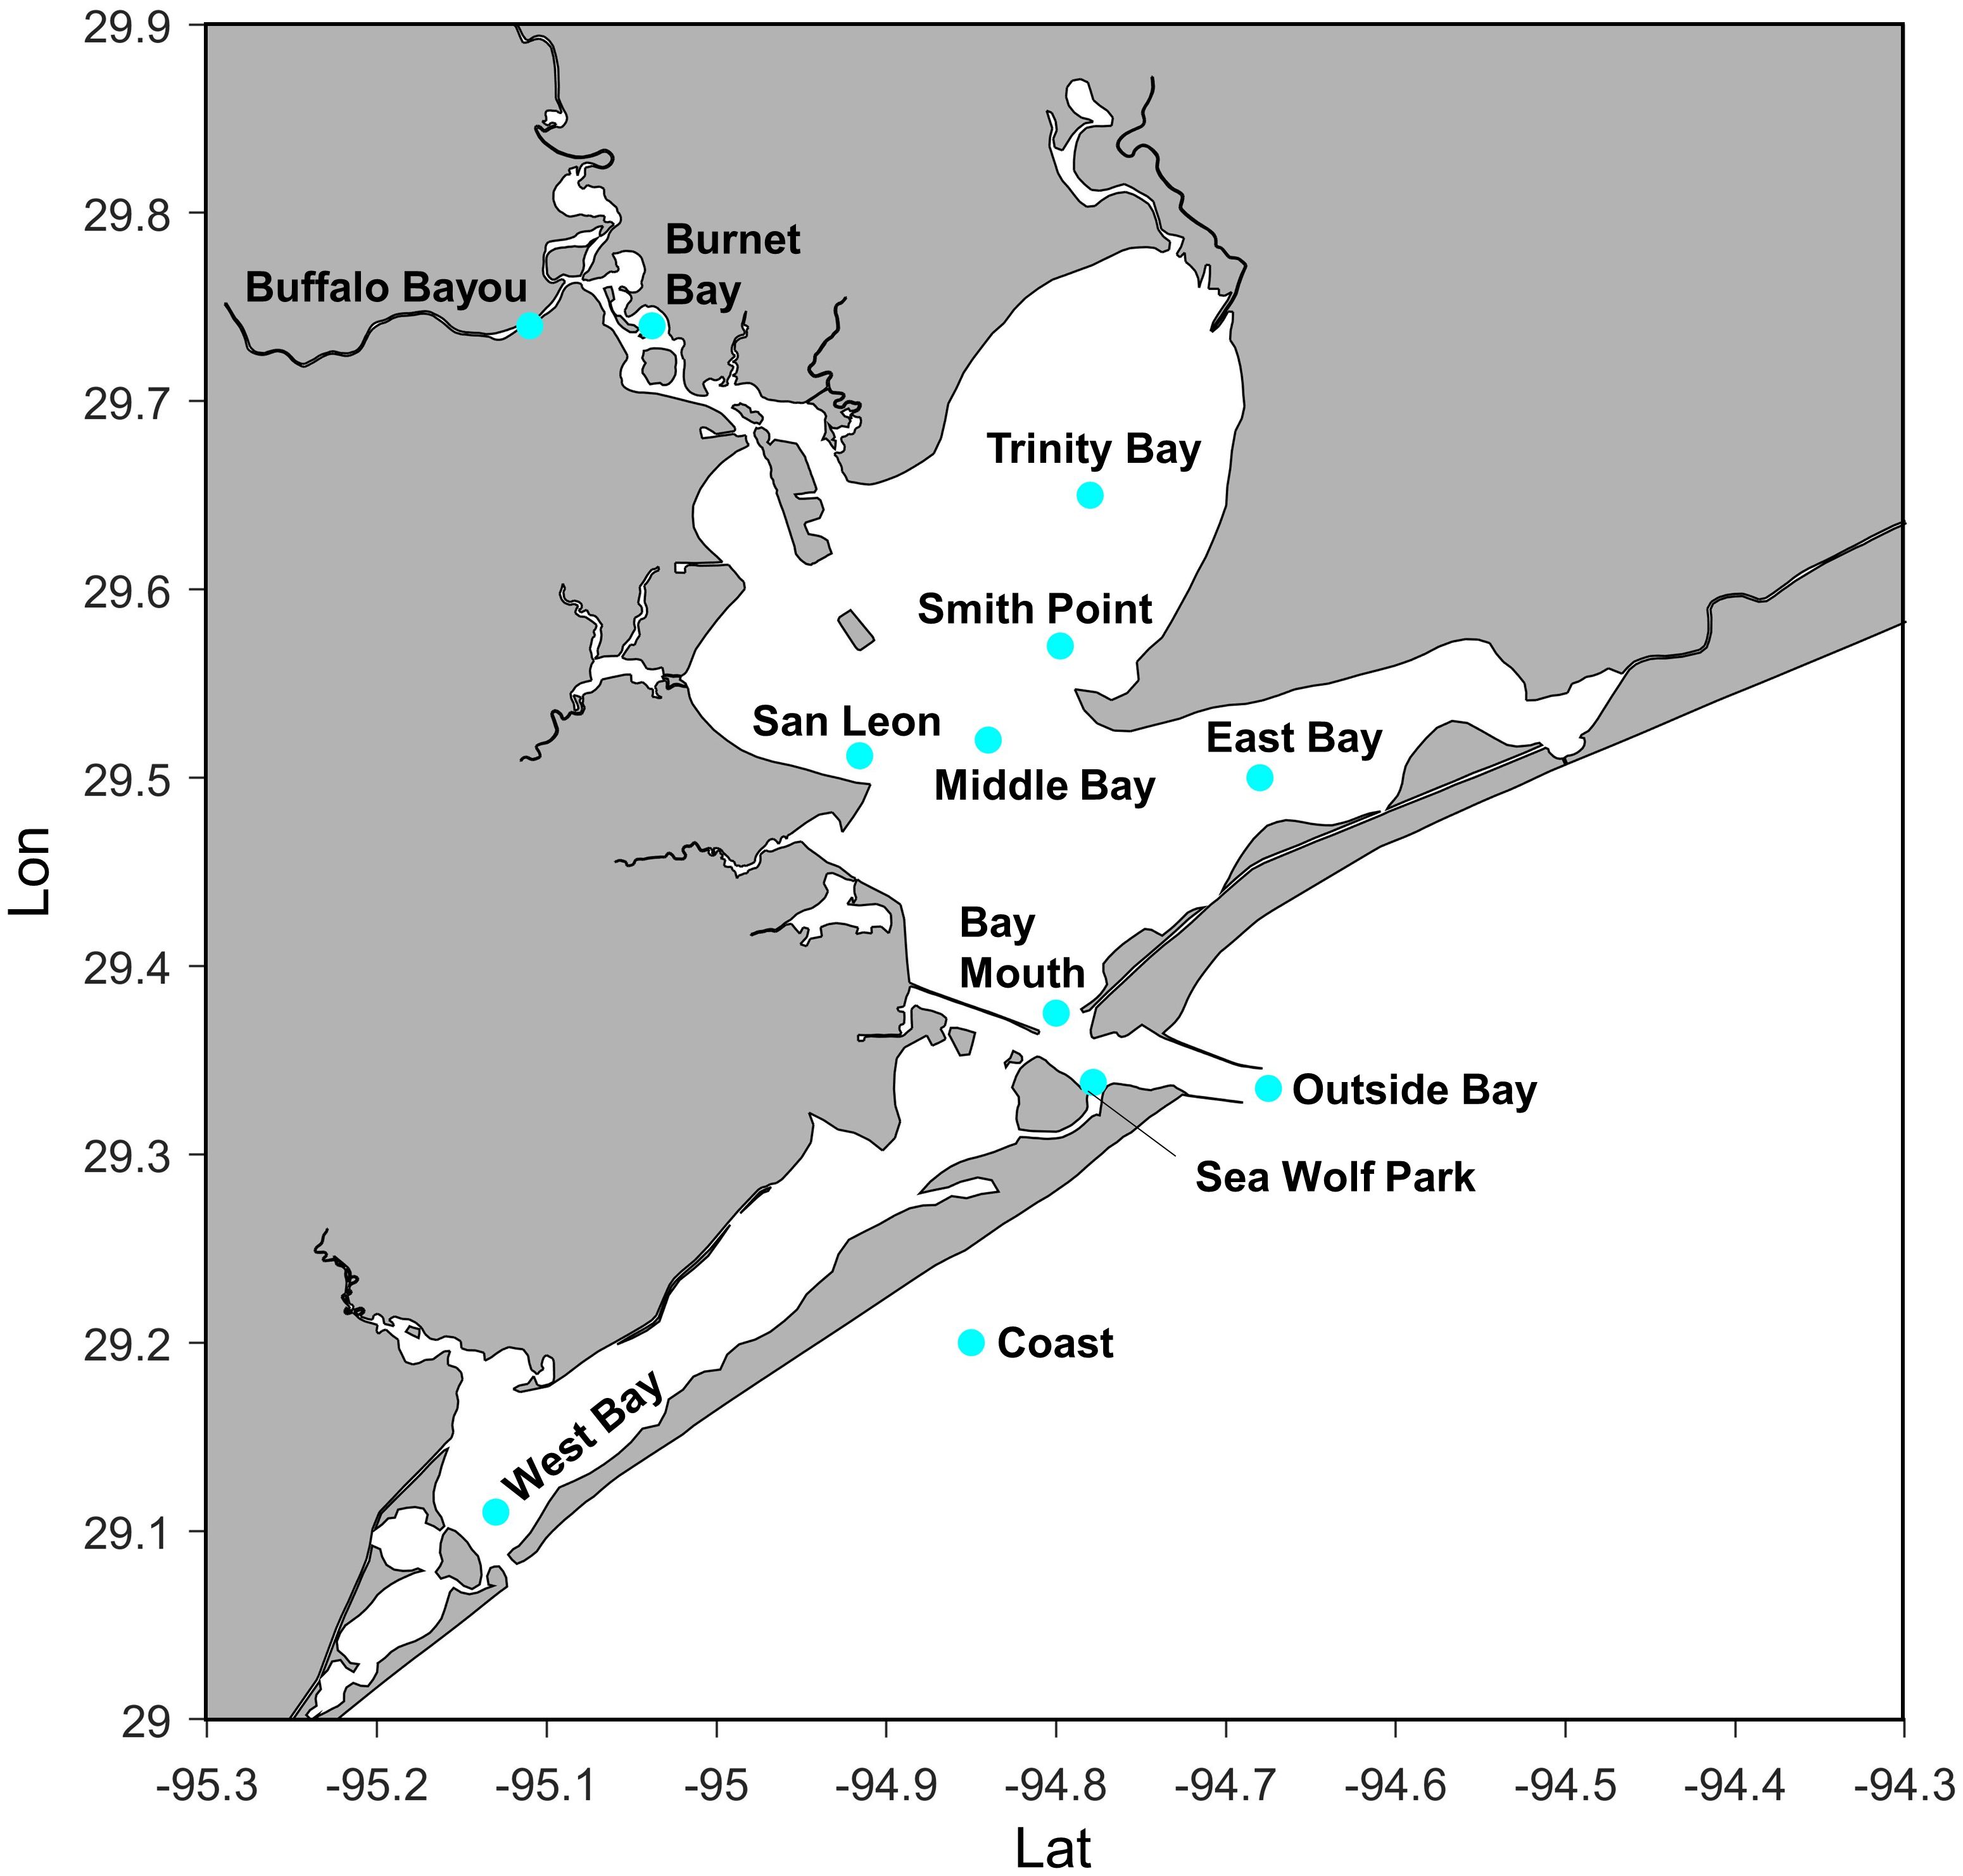
Figure 1. A map of Galveston Bay, Texas showing the locations mentioned in the text. North of 29.5°N (Middle Bay and above) is considered the upper bay, and south of 29.5°N is considered the lower bay.
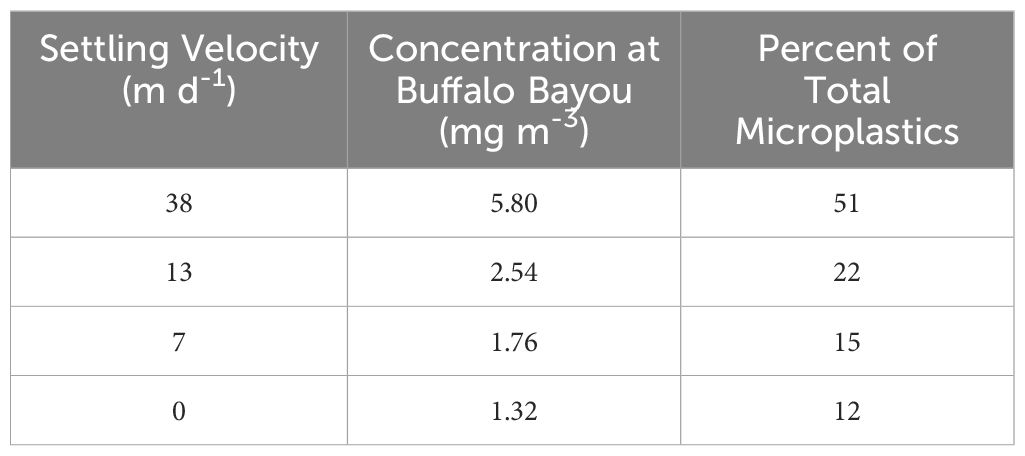
Table 2. Information used to estimate microplastic loading from Buffalo Bayou in Galveston Bay, using the top four microplastic classes identified by different settling velocities and with the assumption of constant concentrations throughout the year.
In this study, we consider only one sediment bed layer. The initial thickness of the sediment bed inside Galveston Bay is set at a constant value of 5 m. It is assumed that no neutrally buoyant particles are present in the sediment bed. The initial thickness of the sediment bed outside of Galveston Bay is set at 0, making all microplastics on the shelf both in the water column and the bed sediment exported from Galveston Bay.
3 Results
3.1 During non-storm conditions
Observational data for microplastic concentrations are rare in estuarine and coastal systems. In Galveston Bay, limited data is available for microplastic concentrations collected at various sites during non-storm conditions in 2023 (Wharton et al., in prep.). This study considers Buffalo Bayou as the most dominant microplastic loading source to Galveston Bay. Model results comparing measured and modeled microplastic concentrations are shown in Figure 2. Measured concentrations are highest at Sea Wolf Park (near the bay mouth) but the model results show the peak at Burnet Bay adjacent to Buffalo Bayou. The model results when normalized to the relative percentage (concentration at a site/total concentration x 100) reproduce the observed spatial pattern of relatively high concentrations at Sea Wolf Park and San Leon (west of the ship channel: see Figure 1), with the relative percentage model results overestimating the data at Burnet Bay and underestimating the data at Trinity Bay (Figure 2B). With Buffalo Bayou being the only loading source in this study, the overestimation at Burnet Bay (just downstream of the loading location) is likely due to variable loadings of microplastics. The underestimation at Trinity Bay is likely due to limited microplastic loading from Trinity River, despite it being the largest freshwater source to Galveston Bay (Du et al., 2019b). Trinity Bay has a 20-year median flow value of 57.5 m3 s-1, which is more than thirteen times higher than Buffalo Bayou, which has a 20-year median flow value of 4.2 m3 s-1 (Summers et al. 2024).
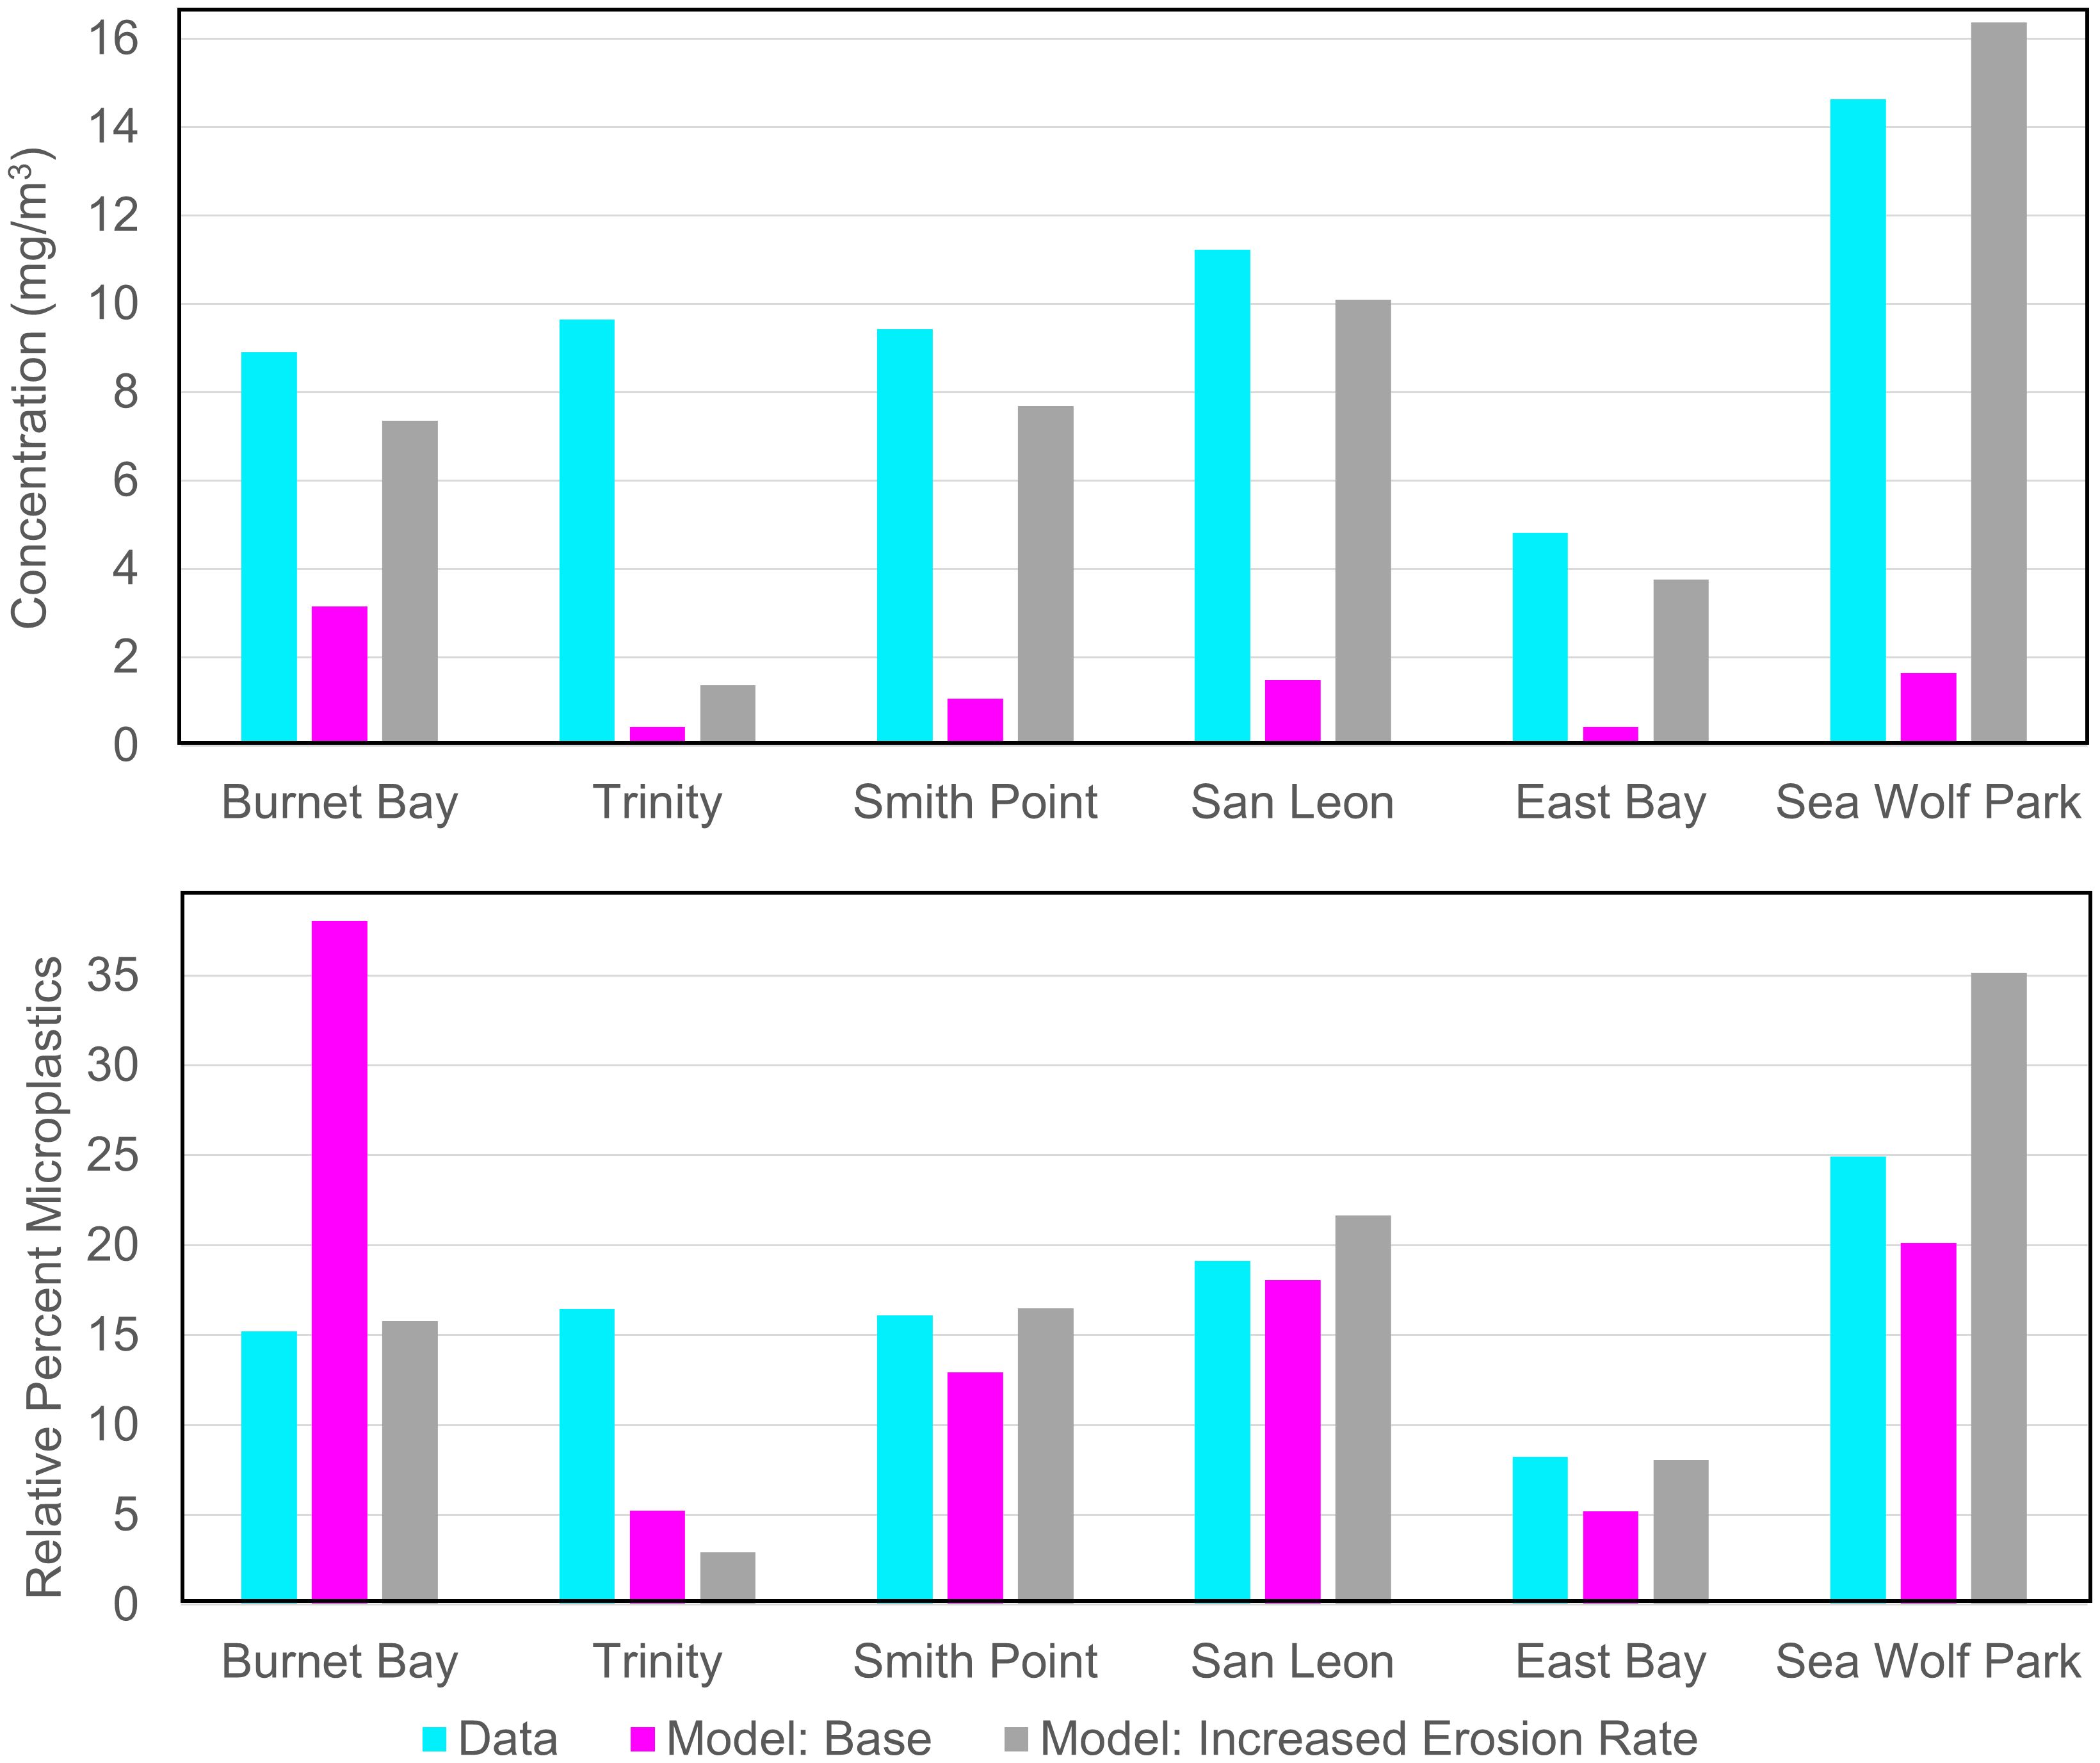
Figure 2. Comparison of data (see Figure 1 for the site locations) in 2023 with the results of the base model run with the erosion rate (E0 in Equation 2) of 24x10-11 kg m−2 s−1 and the model run with E0 = 24x10-10 kg m−2 s−1 (10 times larger). The top panel is for actual concentration (mg m-3) and the bottom panel is for the relative percentage (concentration at location/total concentration x 100). The model results are the averages during non-storm conditions (March-May in 2017).
During the spring non-storm conditions (March-May), total microplastic concentrations appear to be highest near the source location (Burnet Bay), West Bay, and near the bay mouth (Figure 3). The daily weighted-average of total microplastic concentrations inside the bay typically varied between 0.003-0.008 mg m-3 (Figure 4). The particle flux from the bay shows that total microplastics typically left the bay at a rate of 0-75 kg d-1 under non-storm conditions (Figure 5). Variations in concentrations just outside the bay (Figure 3G) and further westward down the coast (Figure 3H) did show that microplastics of all types made it out of Galveston Bay under non-storm conditions. These results indicate that Galveston Bay may not trap 100% of microplastic particles that enter it and thus is a source of microplastics to the Gulf of Mexico, even under normal non-storm conditions.
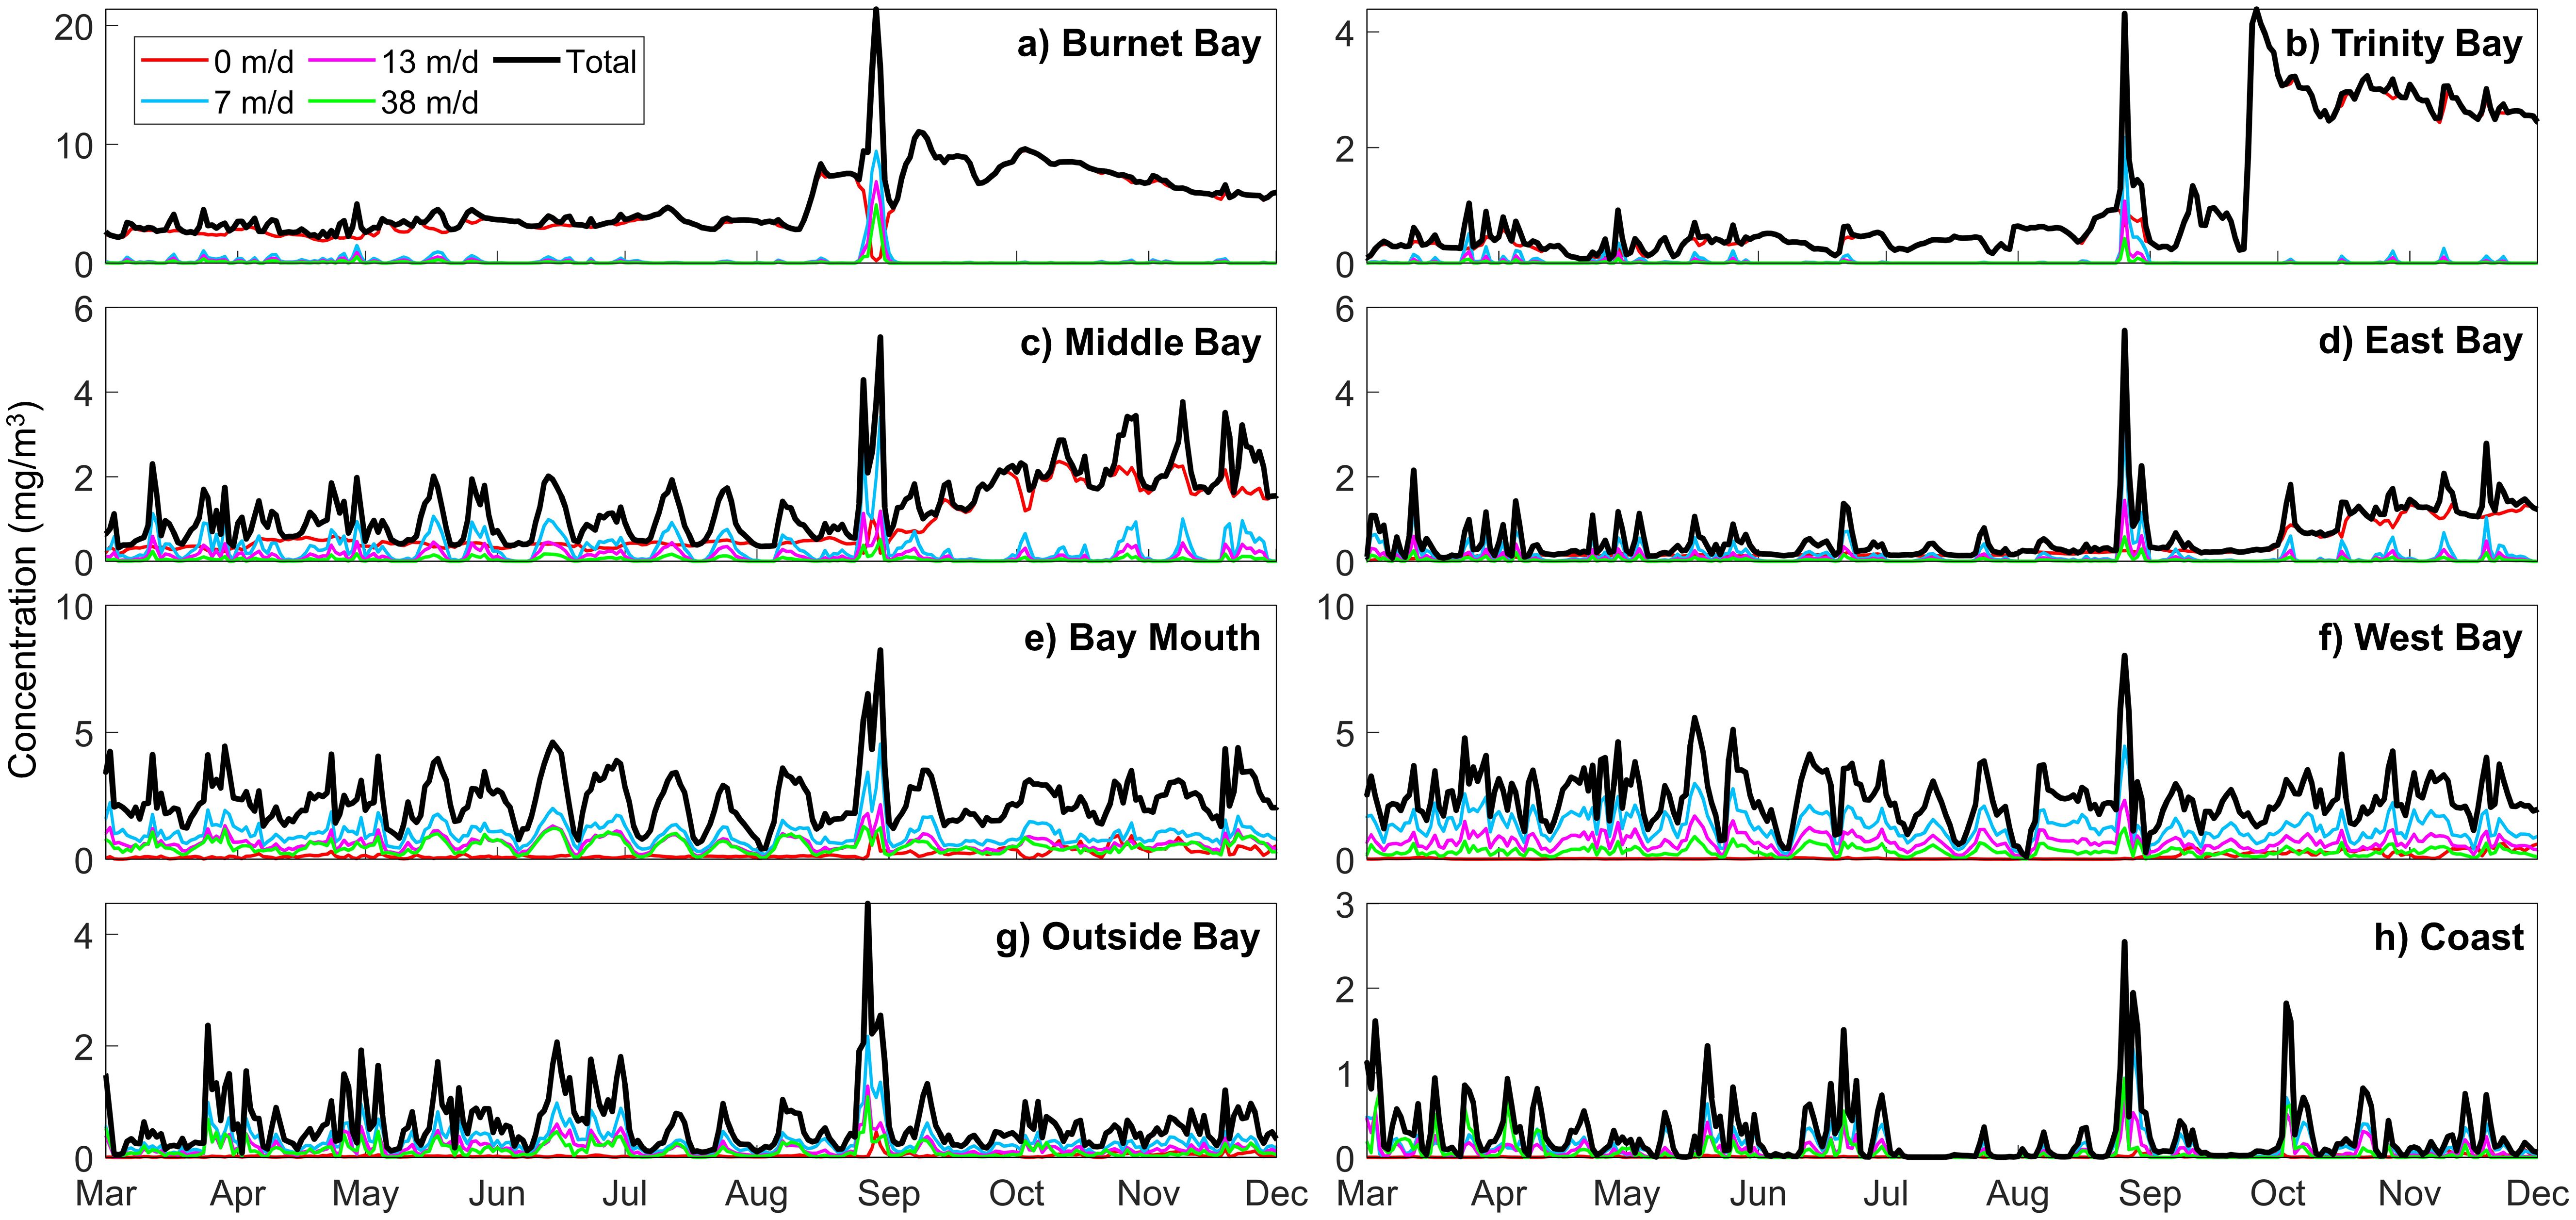
Figure 3. Microplastic concentrations (mg m-3), total and four classes, in 2017 at various sites of (A) Burnet Bay, (B) Trinity Bay, (C) Middle Bay, (D) East Bay, (E) Bay Mouth, (F) West Bay, (G) Outside Bay, and (H) Coast in and around Galveston Bay (see Figure 1 for their locations).
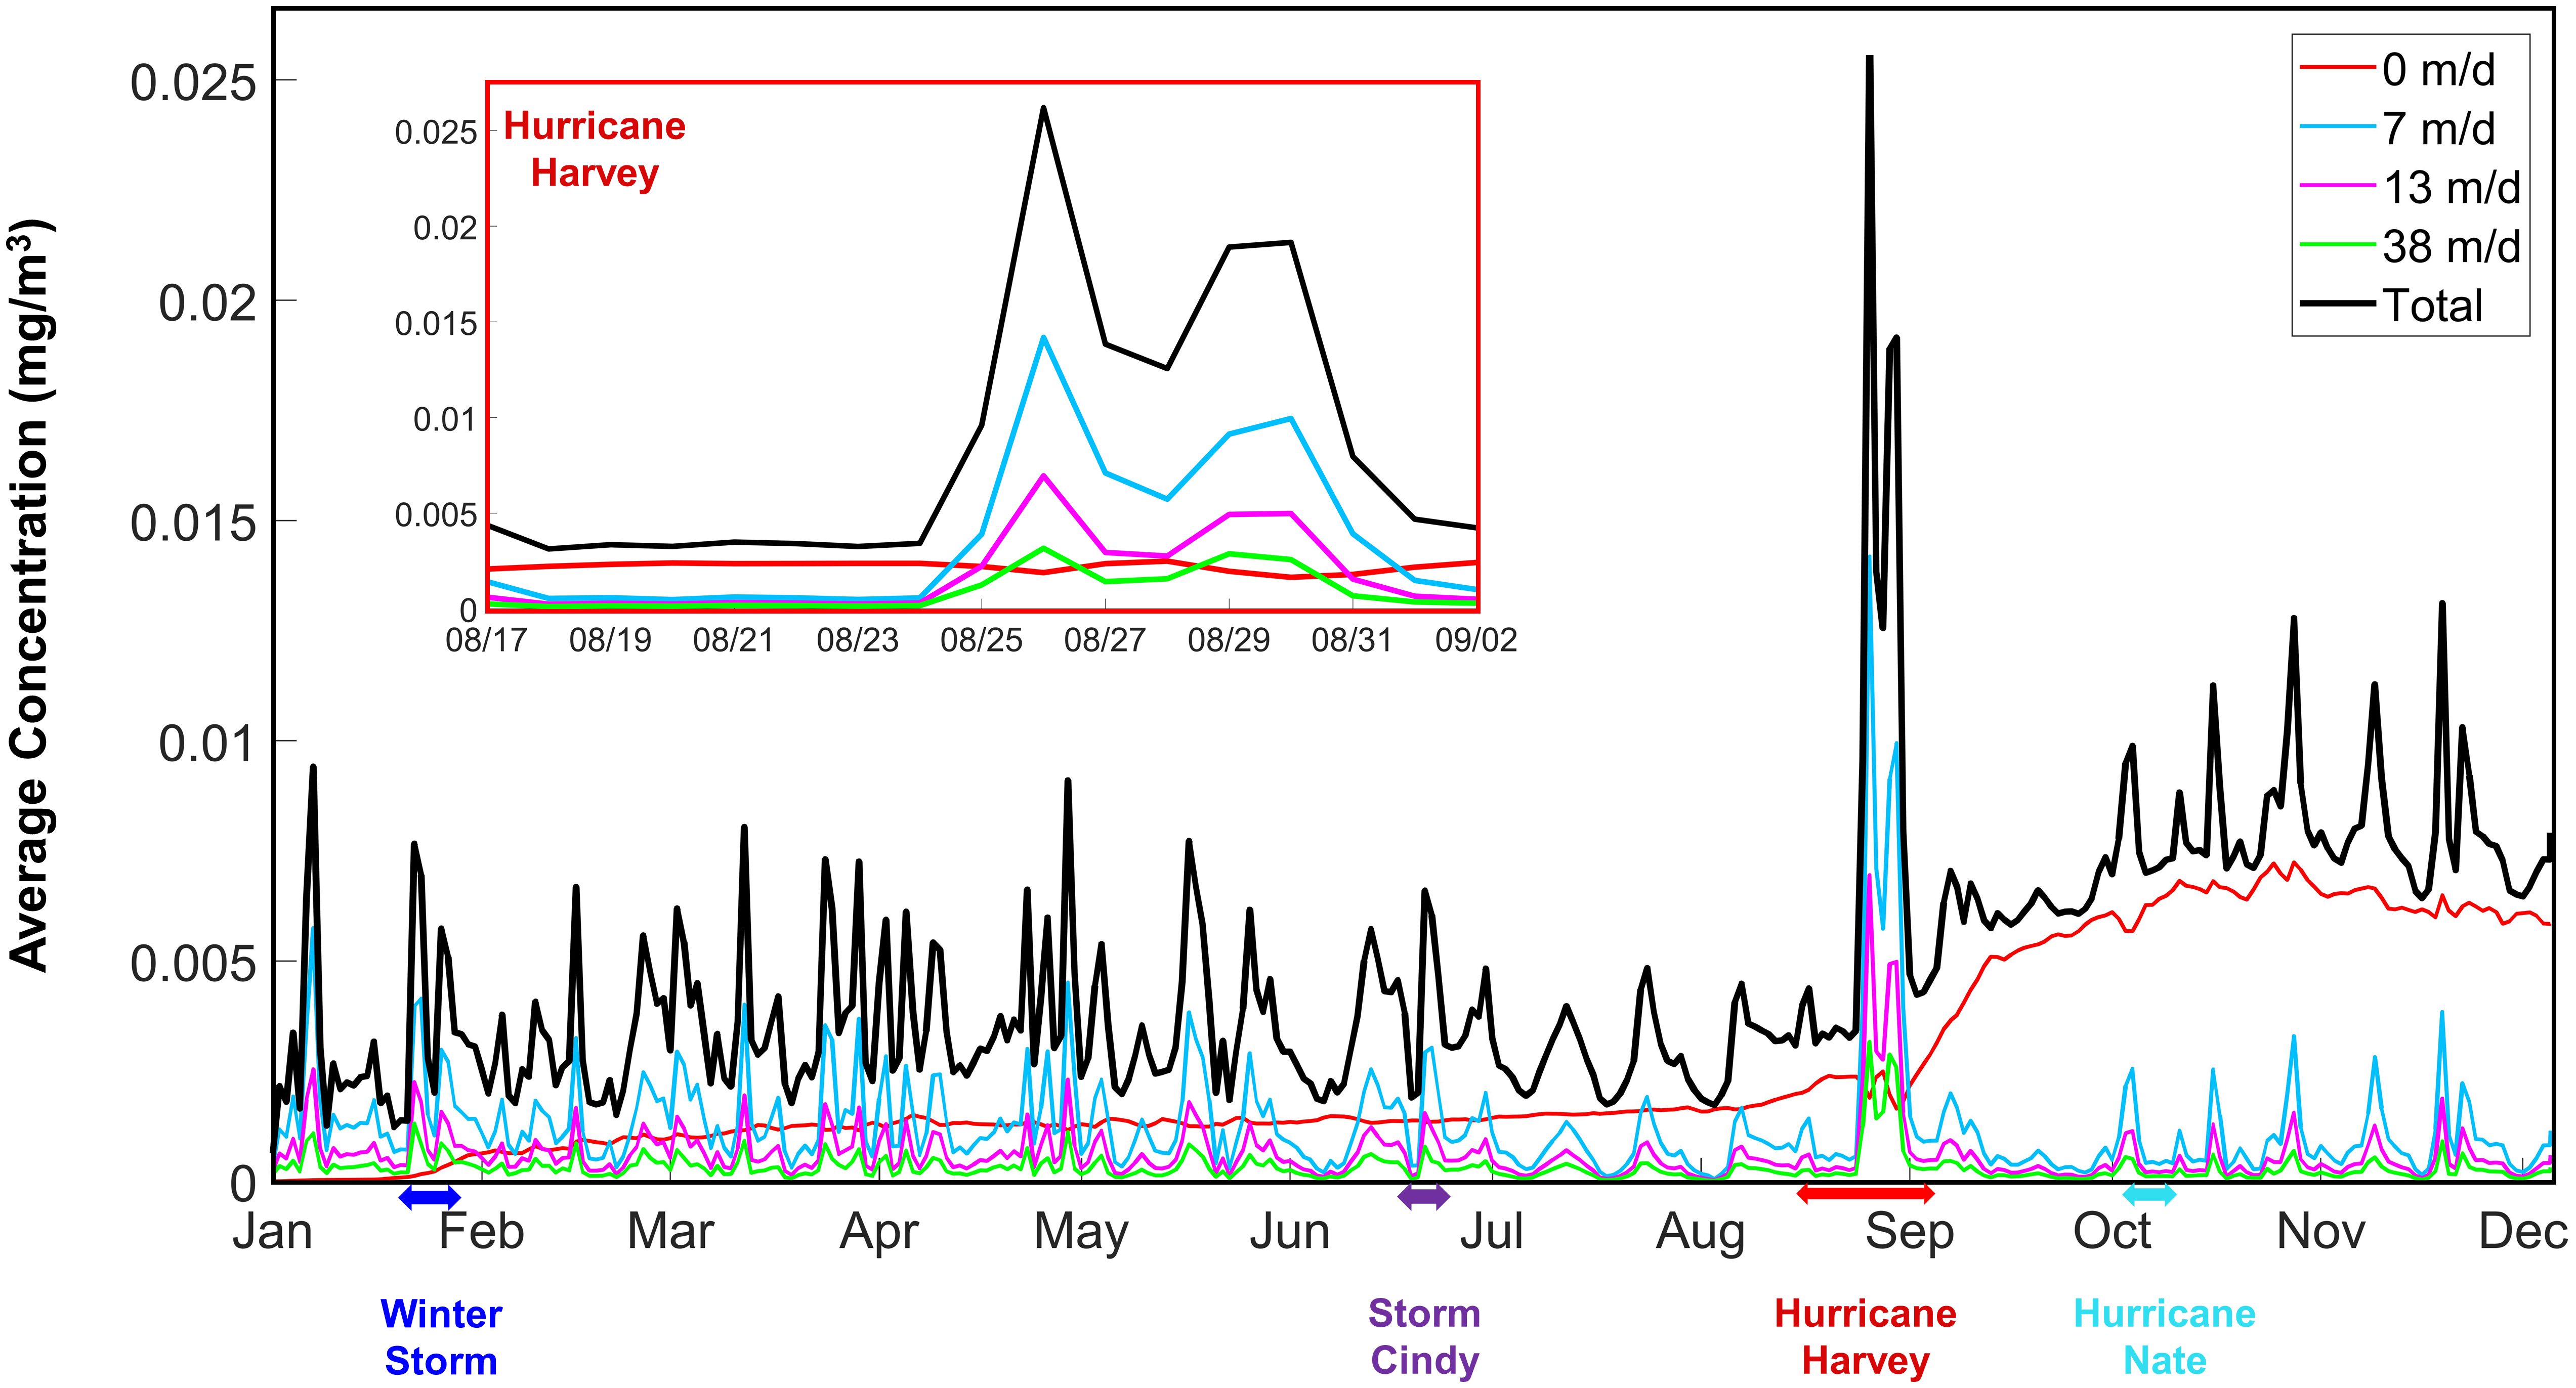
Figure 4. Daily weighted-average concentration (mg m-3) over the entire Galveston Bay (surface area of 4.13x10¹¹ m2 and average depth of 1.8 m) in 2017 of total microplastics and four size classes. The inset shows a zoom-in of the time of Hurricane Harvey.
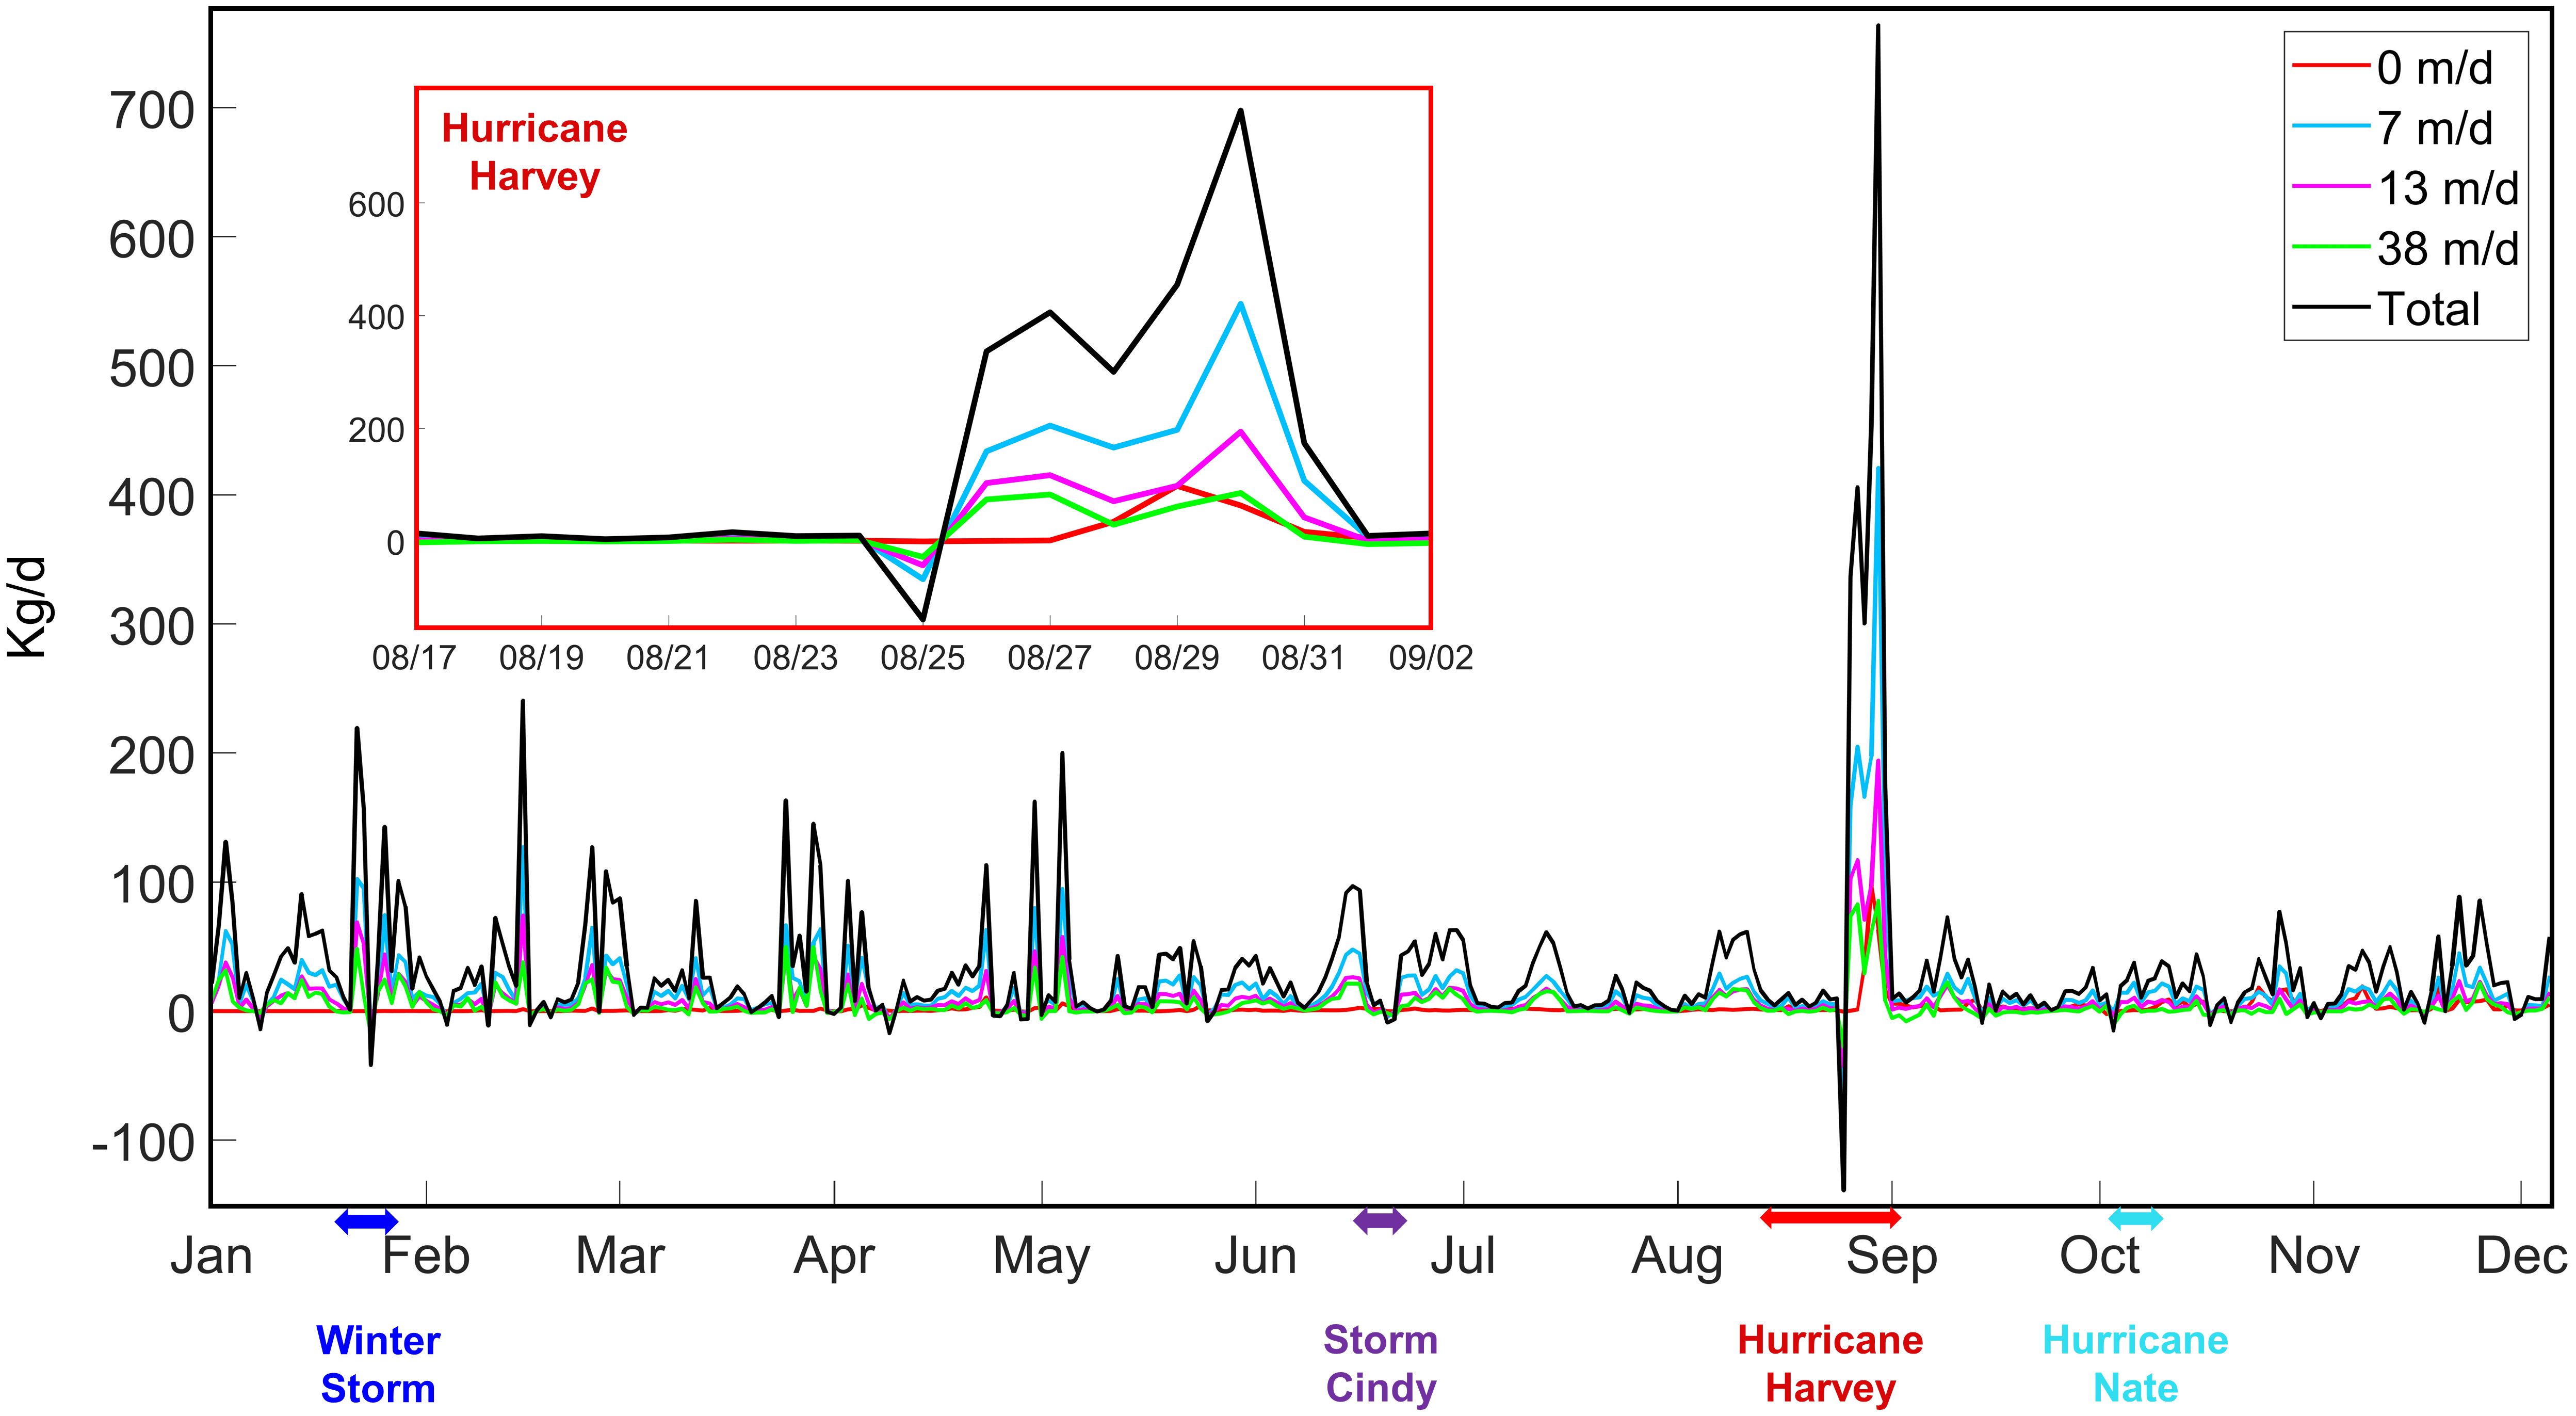
Figure 5. Flux (kg d-1) of microplastics (total and four size classes) leaving Galveston Bay in 2017, with positive [negative] fluxes indicate out of [into] the bay. The inset shows a zoom-in of the time of Hurricane Harvey.
The weighted-average concentrations of the neutrally buoyant particles (settling velocity of 0) were virtually constant at ~0.001 mg m-3 (Figure 4). In July-August before Hurricane Harvey, their concentrations were higher than other classes, despite having the lowest loading from Buffalo Bayou. Spatially, the concentrations in March-May were higher in the upper bay closer to the source location where tidal exchange is weak and lower in the lower bay likely due to strong tidal currents flushing them out to sea (Figures 3, 6). It is important to note that the flux of neutrally buoyant particles leaving the bay was much smaller than that of negatively buoyant particles (Figure 5), probably due to the smaller loading and no erosion/resuspension from the bed for neutrally buoyant particles.
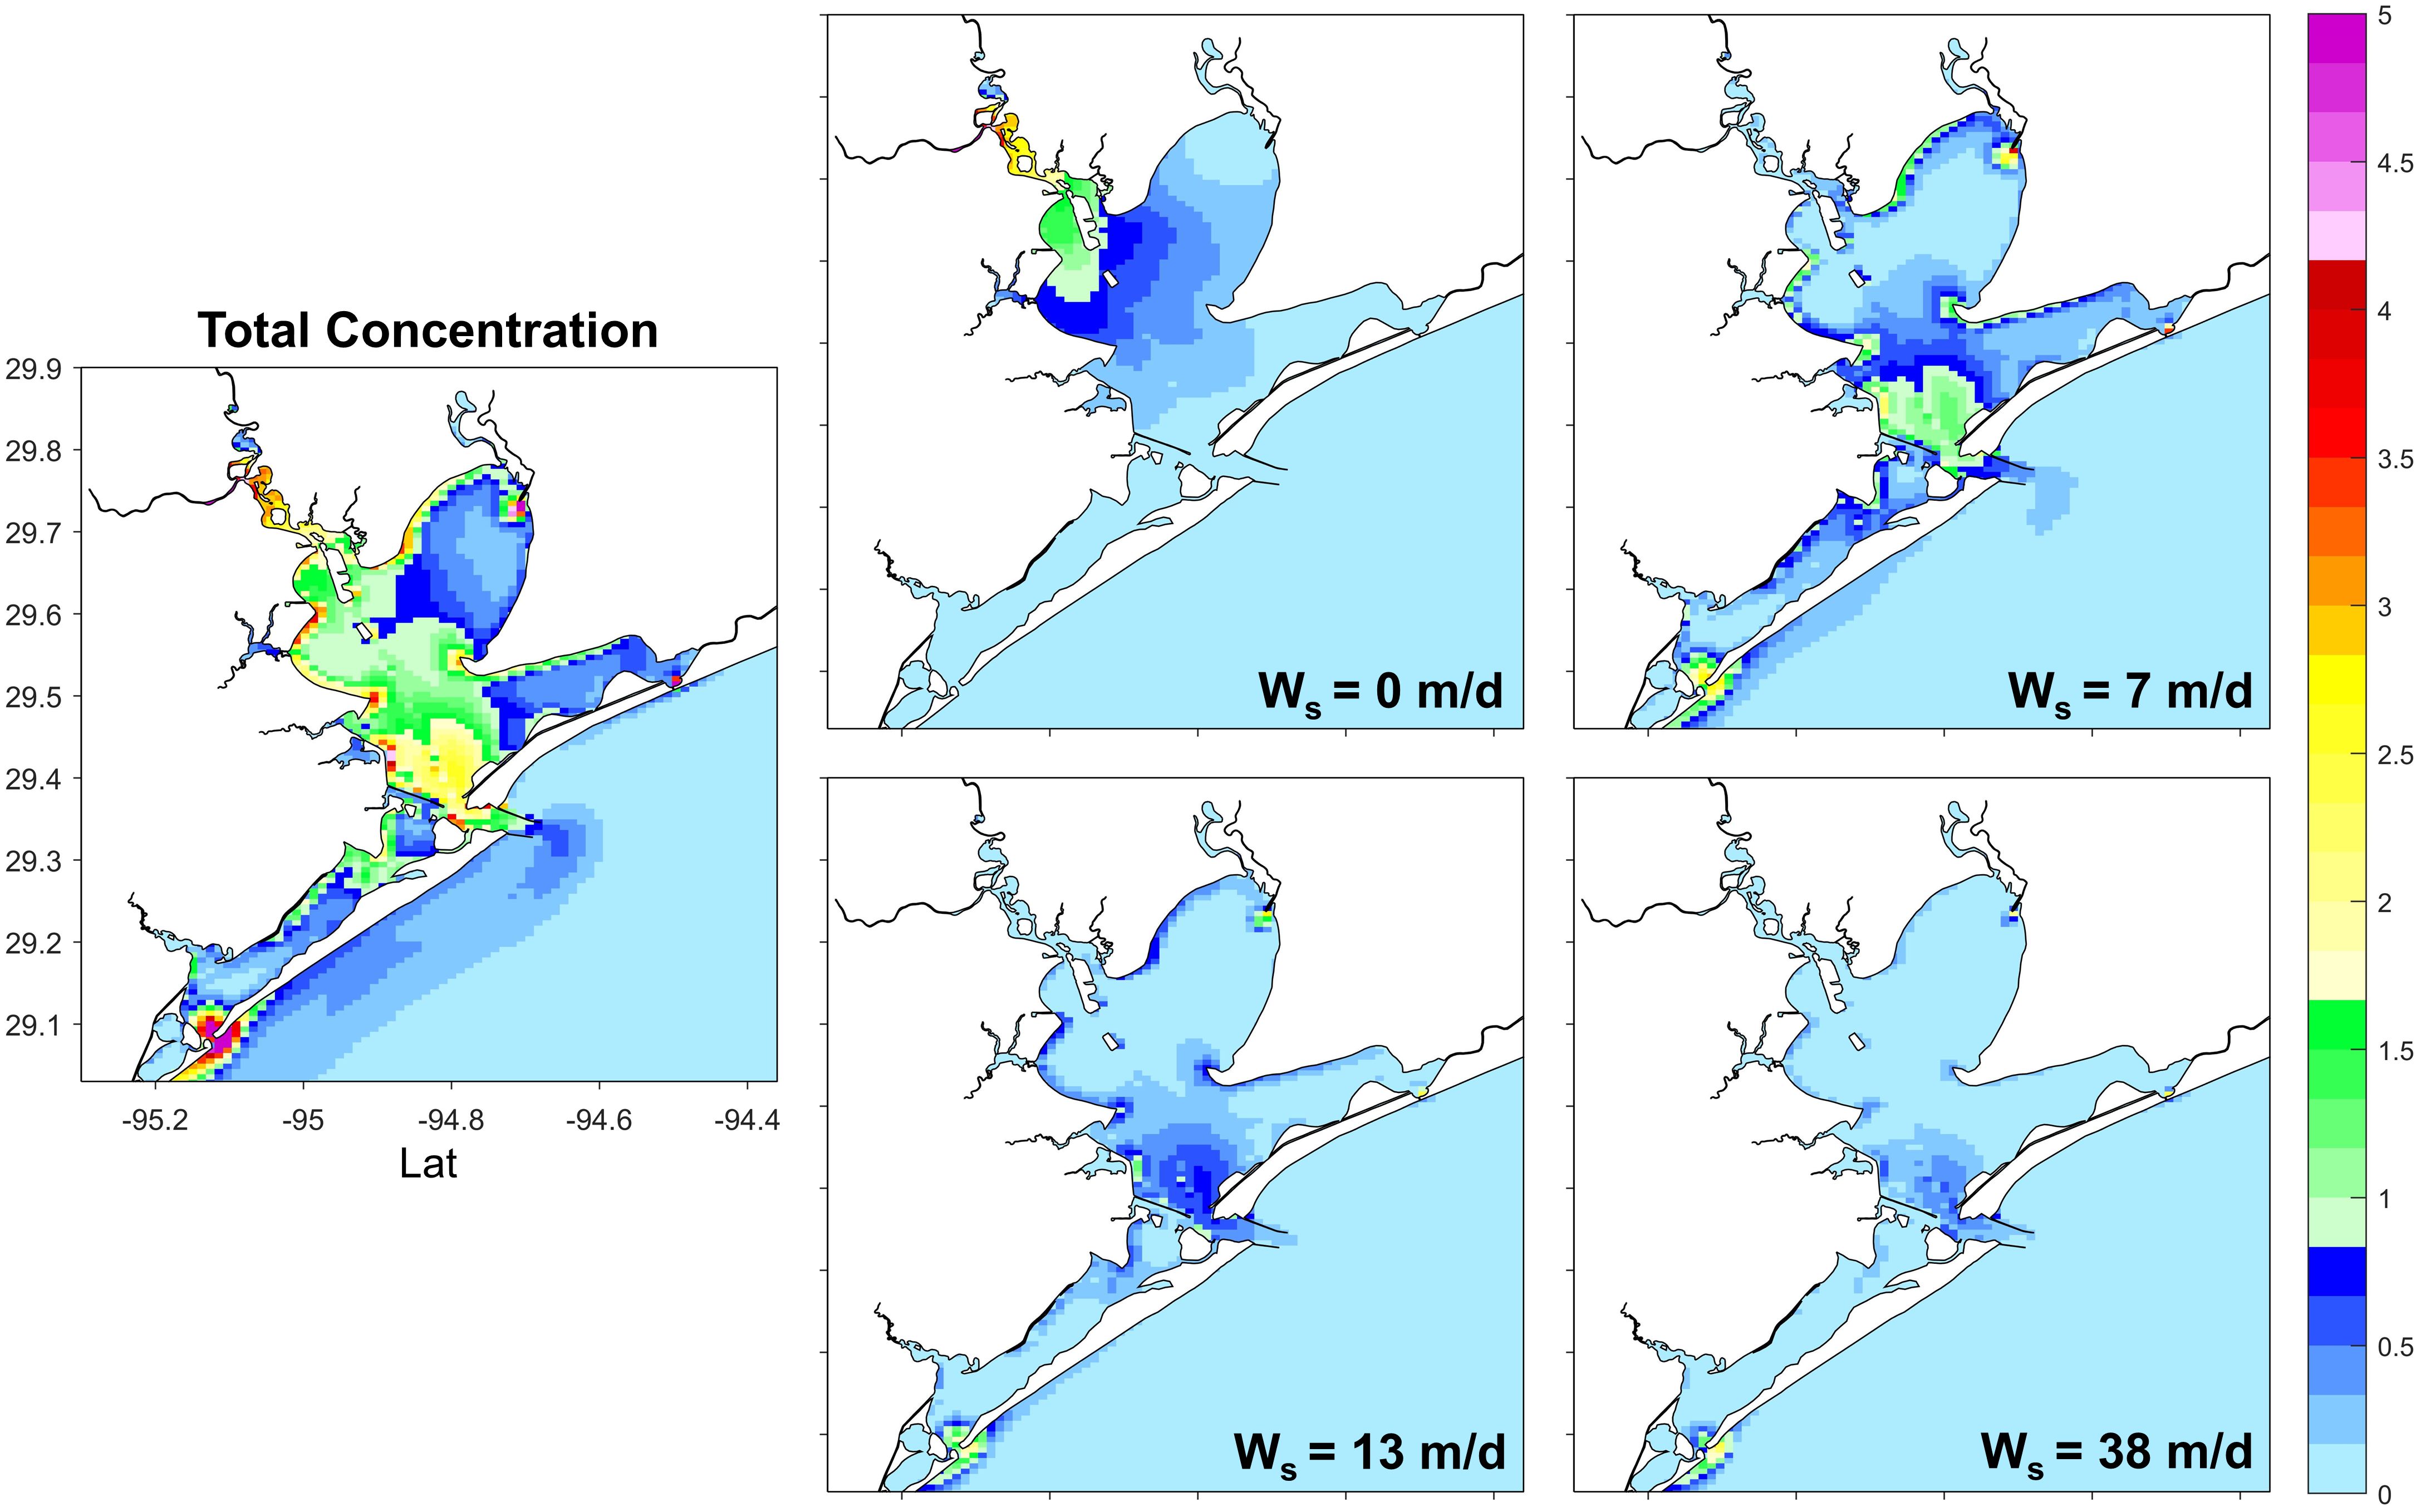
Figure 6. Vertically averaged microplastic concentrations (mg m-3) in Galveston Bay during spring (averaged over March 1 – May 31, 2017) to represent non-storm conditions for total microplastic concentration and the four constituents with the settling velocities of = 0, 7, 13, and 38 m d-1.
All the settling (negatively buoyant) particles show similar behavior during non-storm conditions. These heavy particles likely settled out before entering the main bay, which is evident in the model results at the Burnet and Trinity Bay sites (Figures 3A, B). Burnet Bay, despite being close to the source location (Figure 1), had very low concentrations of negatively buoyant particles, which contrasts with the high concentrations of neutrally buoyant microplastics. At Burnet Bay and Trinity Bay, the bed stress was very weak, with a median value of 0.012 and 0.008 Pa, respectively (Figure 7B). With a critical shear stress for erosion of 0.03 Pa, the settling particles were not likely to be eroded and thus stayed in bed at these sites under non-storm conditions. However, the bed stress at the bay mouth was much higher, with a median value of 0.207 Pa (Figure 7F). The negatively buoyant particles in these areas were less likely to settle indefinitely, and instead be easily re-suspended, resulting in overall high concentrations of negatively buoyant particles closer to the bay mouth (Figure 6). The particle levels in Galveston Bay decrease with increasing settling velocity during non-storm conditions (Figure 4).
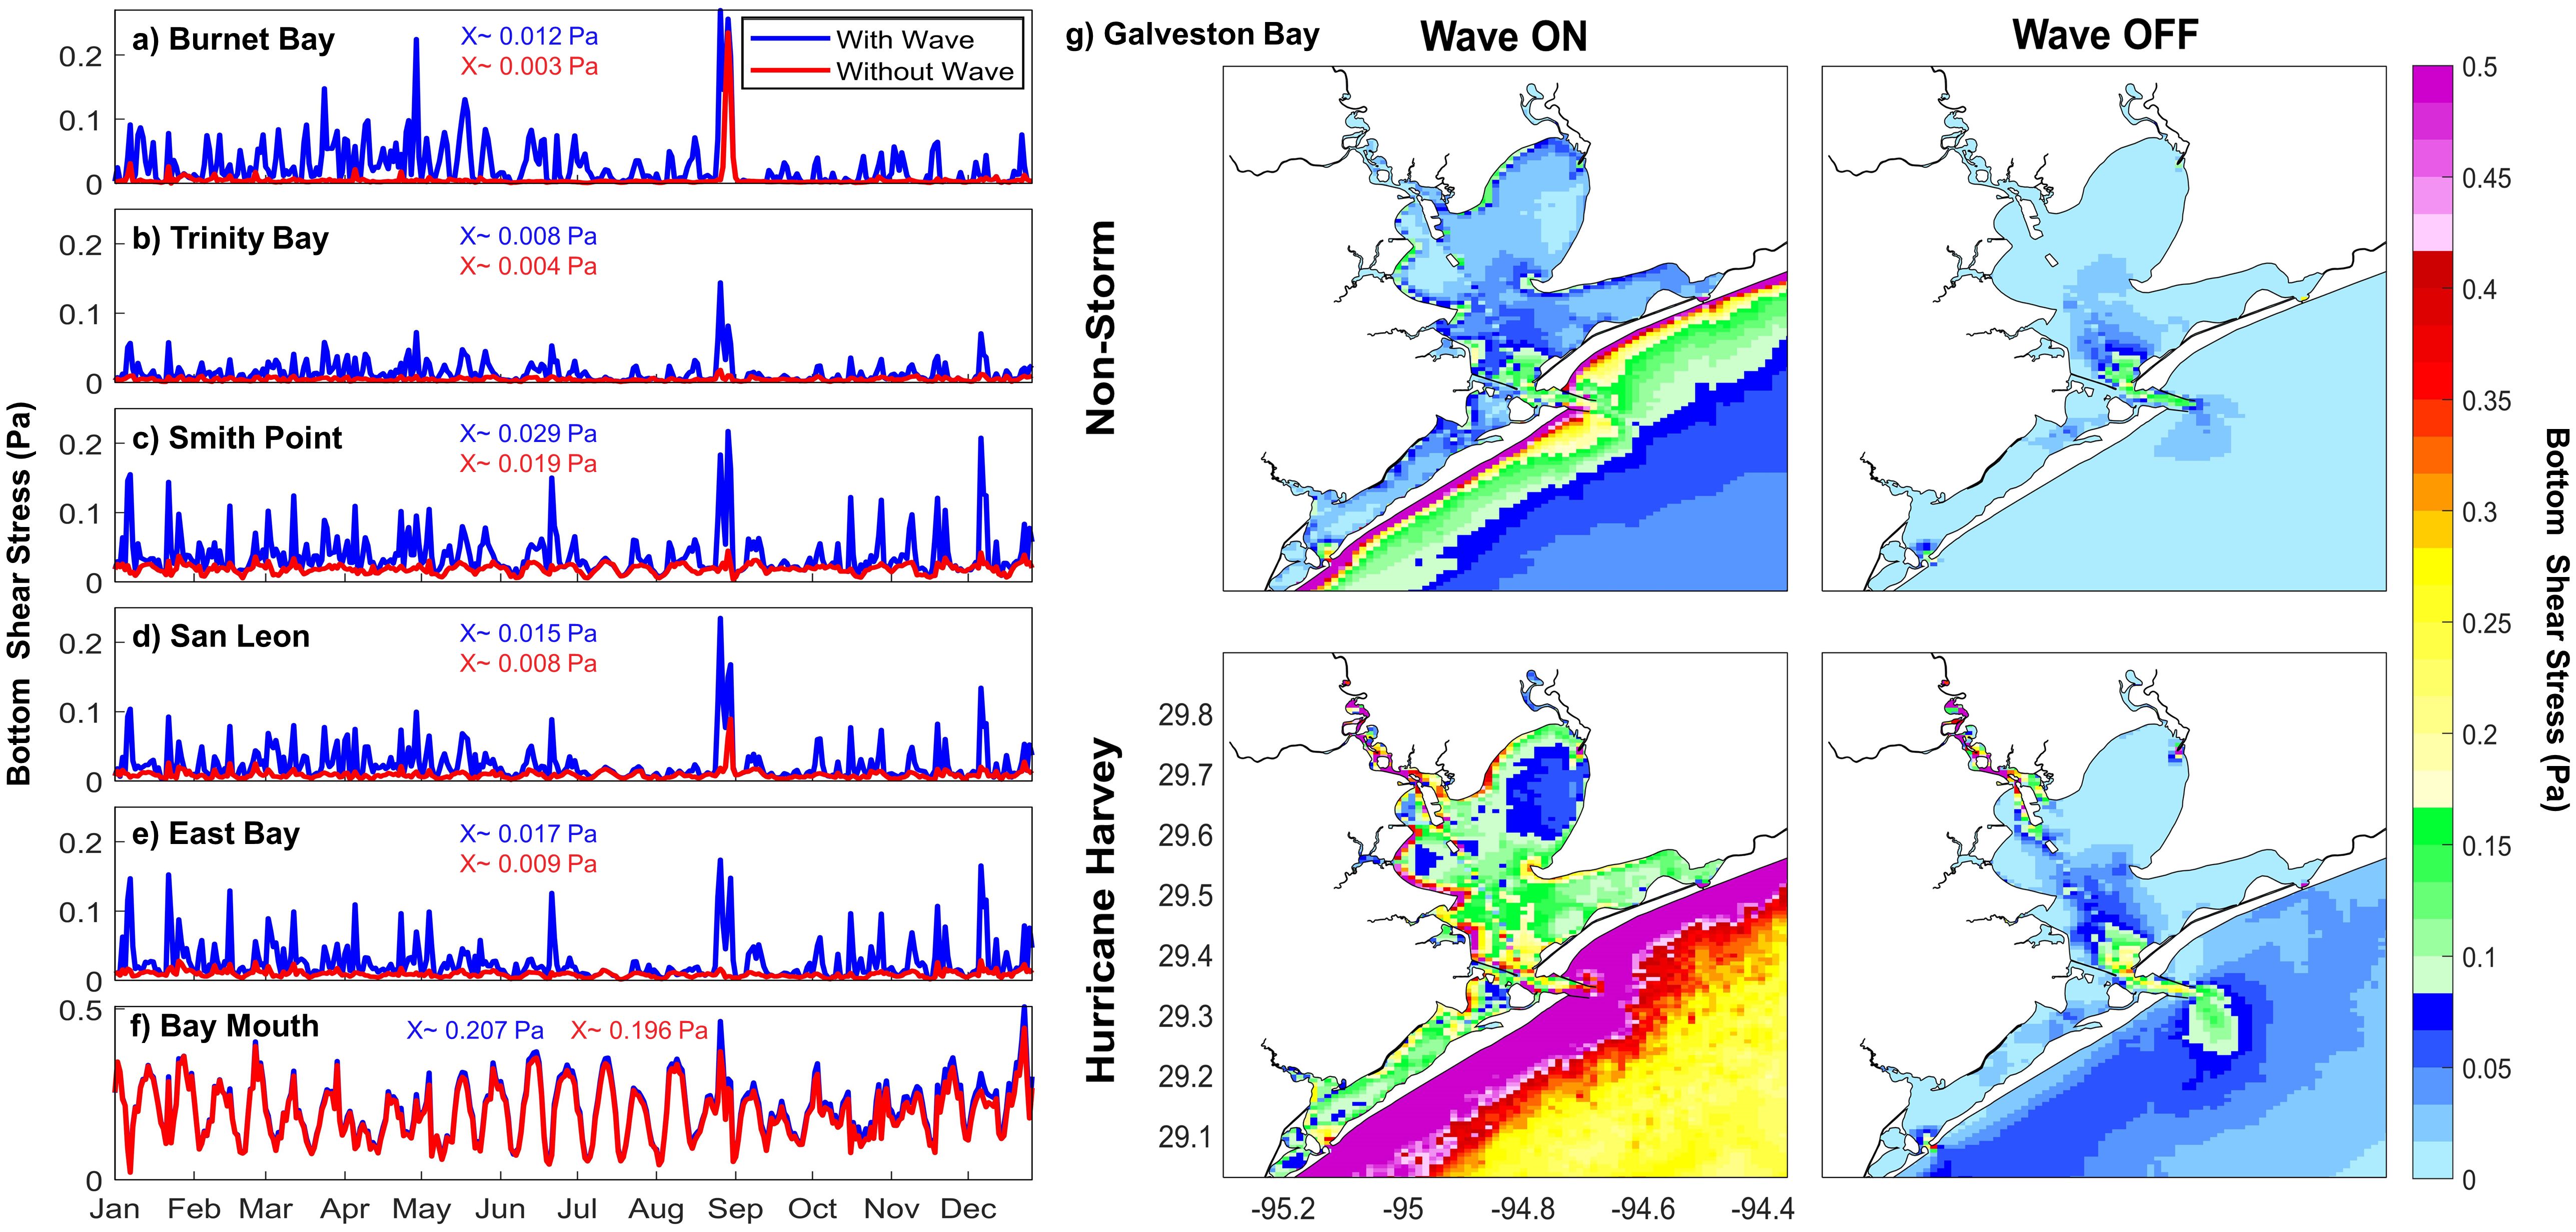
Figure 7. Modeled bed shear stress (Pa) with (blue) and without (red) the wind wave model at various locations in and around Galveston Bay (see Figure 1 for their locations) in 2017, with the median values written in texts (A-F). Modelled shear stress (Pa) under non-storm conditions and during Hurricane Harvey (G).
3.2 During Hurricane Harvey
Hurricane Harvey formed in the Atlantic on August 17, 2017 and did not dissipate until September 1. From August 25 to 30, it had the strongest impact on the Galveston Bay area, and thus we focus on this timeframe as the ‘during storm’ period. We also examine the months following to determine the lasting impact of Harvey after its passing. The total microplastics on August 22-24, just prior to the Hurricane Harvey impact, showed the highest concentrations near the source location and near the bay mouth (Figure 8). The concentrations of neutrally buoyant particles were highest near the source location and the negatively buoyant particles were highest near the bay mouth. This is comparable to the results in Section 3.1, indicating Galveston Bay was likely at normal microplastic concentration levels before Harvey.
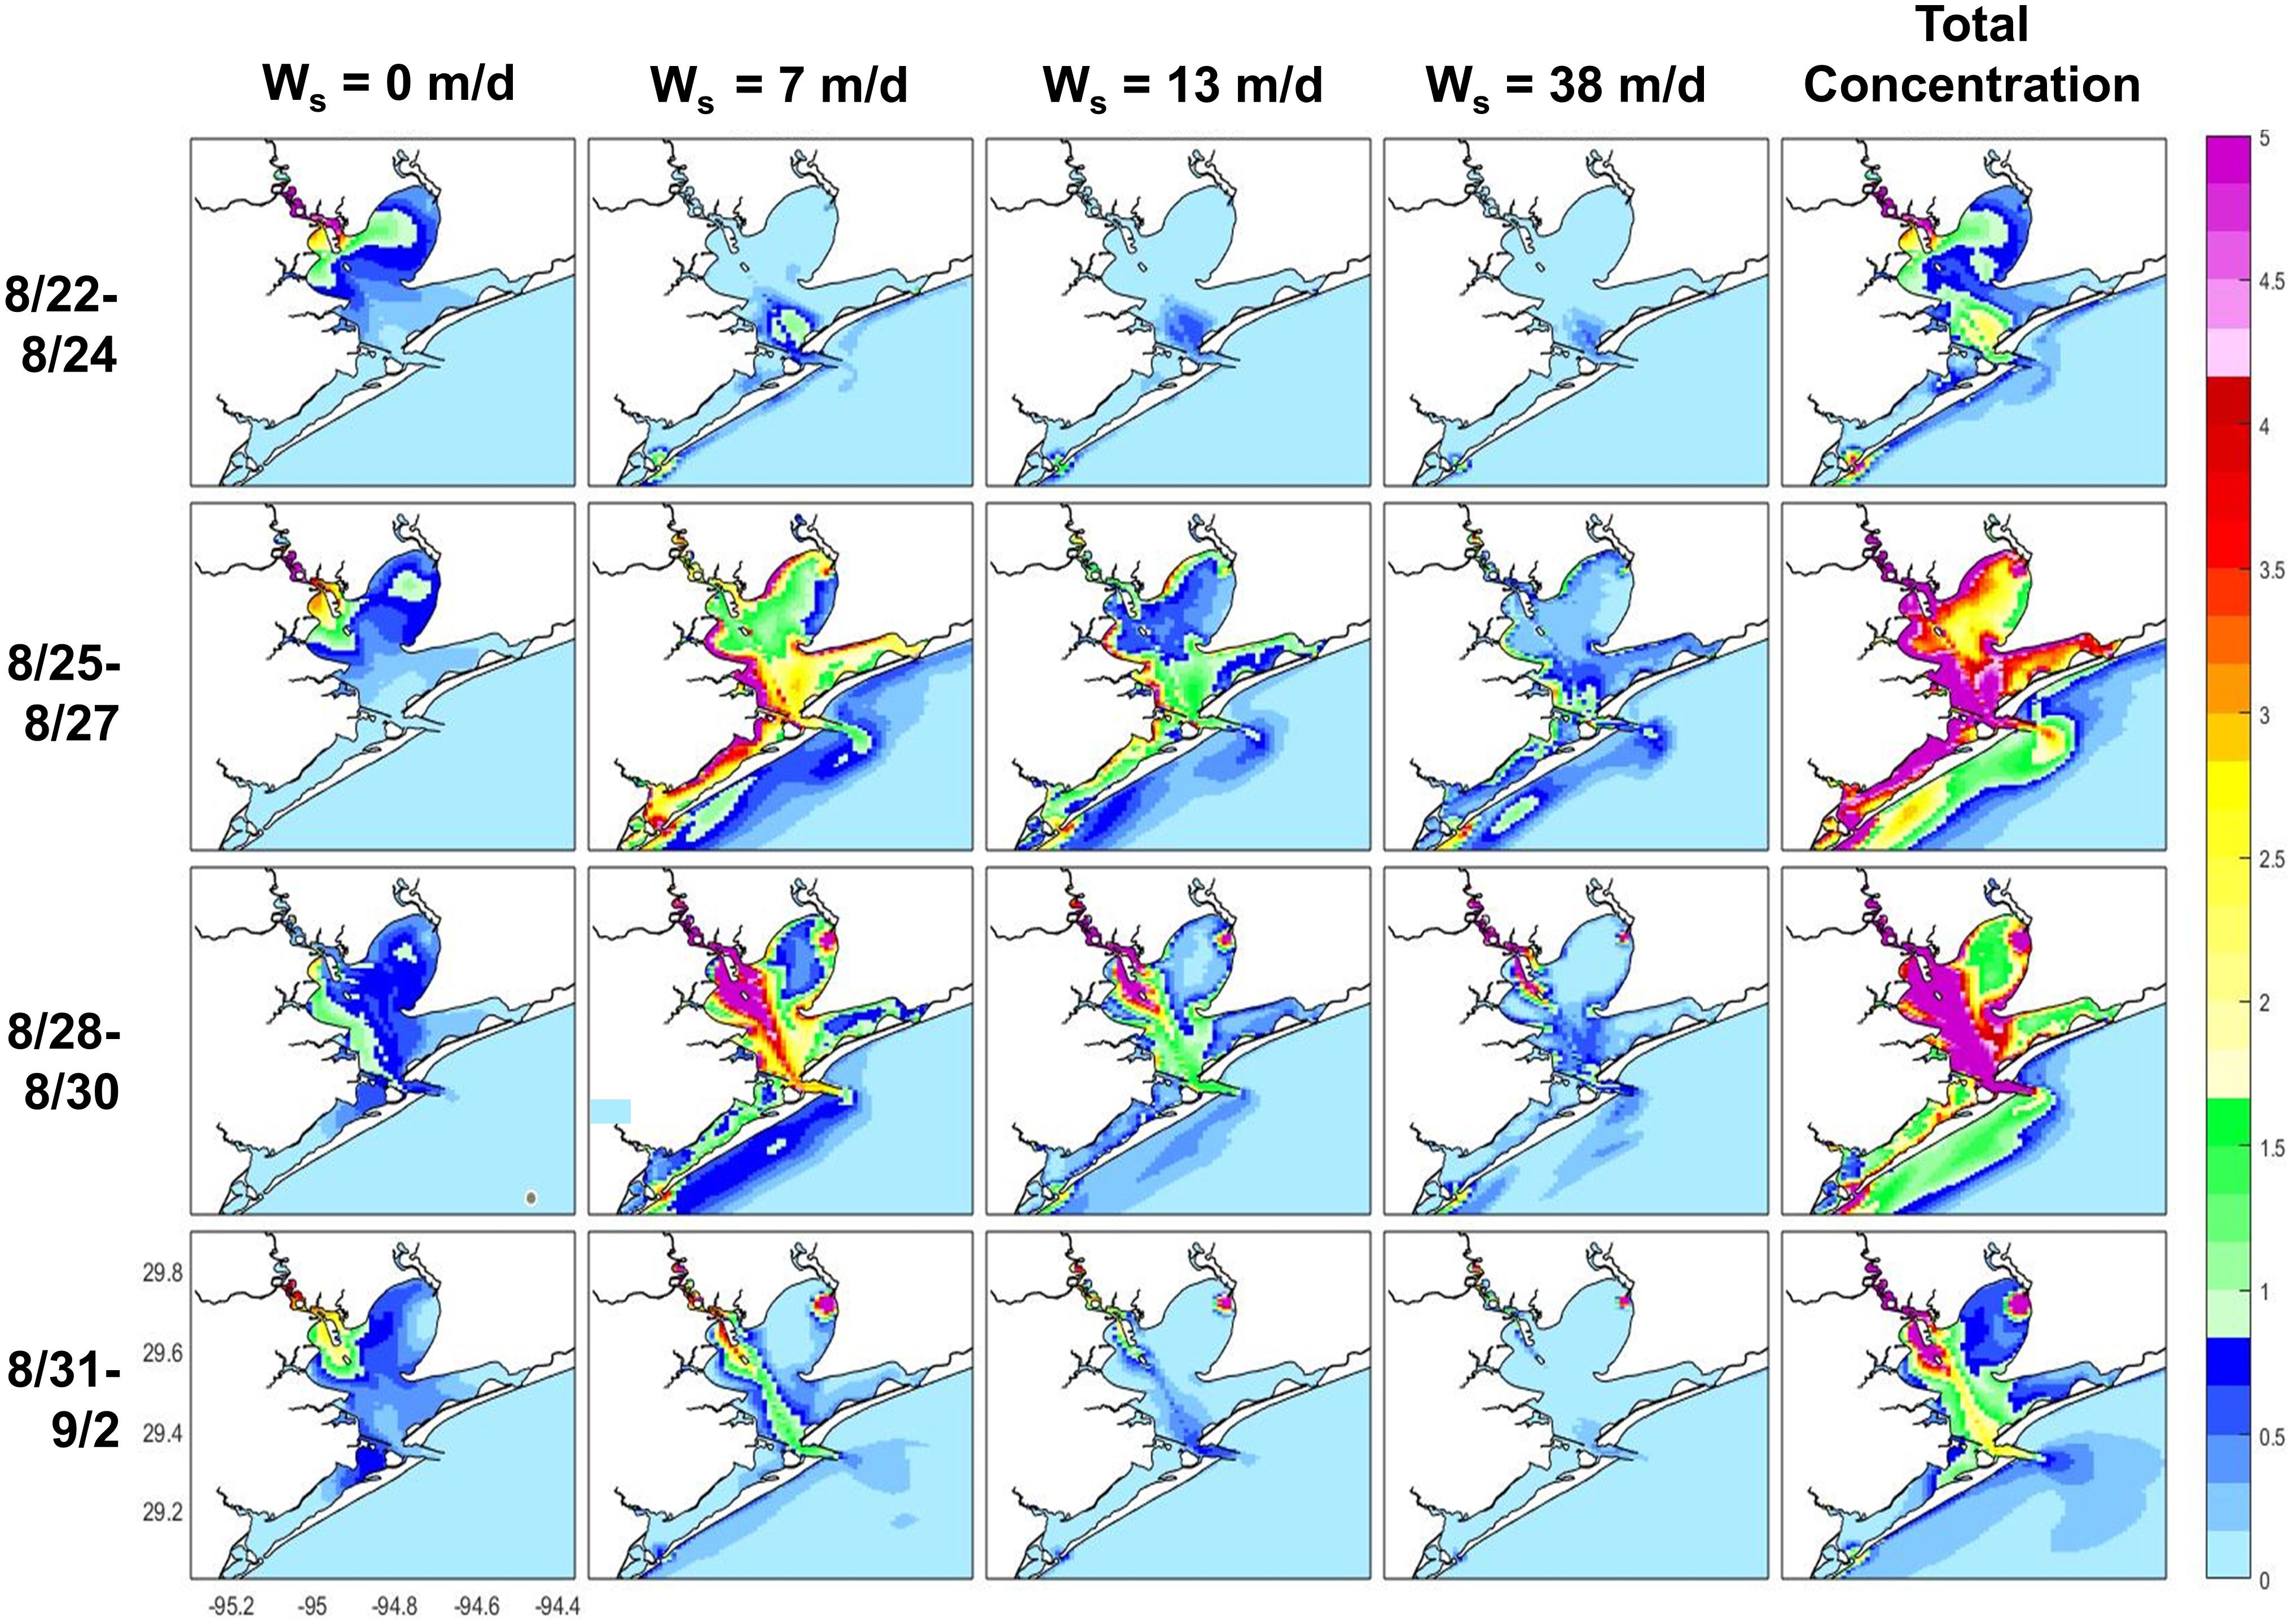
Figure 8. Vertically averaged microplastic concentrations (mg m-3) for total microplastics and the four constituents with the settling velocities of = 0, 7, 13, and 38 m d-1 in Galveston Bay during Hurricane Harvey from 8/22- 9/2 in 2017.
After Harvey hit Galveston Bay on August 25, overall microplastic particle levels increased drastically in Galveston Bay (Figures 2, 3, 7). The highest value of weighted-average microplastics within the bay area was on August 26 at 0.026 mg m-3, over 30 times the concentration during non-storm conditions. Concentrations for total microplastics increased in all areas across Galveston Bay and outside as well (Figures 3, 8). A negative flux (into the bay) occurred at the beginning of Harvey, indicating that particles were pushed into the bay initially, followed by a very large outward flux (Figure 5), corresponding with increased riverine inflow (Supplementary Figure 1). The average export out of the bay during Harvey is estimated at 149 kg d-1. The exported microplastics (QE) exceeded the microplastic input (QR) during Harvey (Supplementary Figure 2), indicating erosion of legacy microplastics in bed sediments during Harvey contributed to the excessive export of microplastics from the bay to the inner shelf. After Harvey, total levels of microplastics within the bay still remained elevated for several months (Figure 4).
A clear difference in particle behavior, however, can be seen between neutrally buoyant particles and all classes of negatively buoyant particles during and following Harvey. Neutrally buoyant particles show less reaction to Harvey on August 25-September 1, with only a slight decrease in their weighted-average concentration in the bay during the storm (Figure 4) and with the discernable difference only near the source location (Figure 3A). This does correspond to an increase in flux of neutrally buoyant particles leaving the bay mouth (Figure 5), and an increase of neutrally buoyant particles in the areas outside of the bay area (Figures 3G, H), indicating that Galveston Bay was a source of neutrally buoyant particles to the inner shelf during Harvey. After Harvey, the weighted-average concentrations of neutrally buoyant particles increased past normal levels (Figure 4), mainly at Burnet Bay, Trinity Bay, Middle Bay, and East Bay (Figures 3A–D), which persisted into the end of 2017. This indicates that Galveston Bay likely has higher vulnerability to long-term exposure to neutrally buoyant plastic pollution in the months following a major storm event.
The negatively buoyant particles behave differently between non-storm and Harvey conditions. The levels of all negatively buoyant particles in Galveston Bay increased significantly during the storm’s passing (Figure 4). The concentrations of microplastics in East Bay and West Bay increased for all classes of negatively buoyant particles, a behavior not seen in neutrally buoyant particles (Figure 8). The most drastic difference shown for negatively buoyant particles is for the size class with a settling velocity of 7 m d-1, which shows significant increases throughout the bay during and after Harvey. The classes with settling velocities of 13 and 38 m d-1 show increases mainly in the lower bay areas. The influx of negatively buoyant particles at the very beginning of Harvey was quickly replaced by an even larger outflux (Figure 5), resulting in elevated concentrations outside of the bay (Figures 3G, H), indicating Galveston Bay was a significant source of negatively buoyant microplastic particles to the inner shelf during Harvey. After Harvey, concentrations of negatively buoyant particles within Galveston Bay returned to normal non-storm levels within a few to several days (Figures 3, 4). This indicates that microplastic particles not flushed out during Harvey likely settled and deposited back into the bed sediments. The differences in microplastic behavior during storms based on settling velocities is further discussed in Section 4.2.
3.3 During relatively weak storms
Hurricane Harvey was an unpreceded 1,000-year flood event. Its impacts are significant, but less likely to occur on a regular basis. Then, it is important to explore storms that are more likely to recur. Relatively weak storms that hit the Gulf of Mexico in the same year (2017) with less direct impact on Galveston Bay are also examined. More information on Tropical Storm Cindy, Hurricane Nate, and winter storm Jupiter is summarized in Table 1.
Beginning with Cindy (June 20-23), the total concentration of microplastics in Galveston Bay shows a dip in weighted-average concentrations, followed by an increase directly following the storm (Figure 4), although on a much smaller scale compared to Harvey. The average flux of particles exiting the bay during Cindy is estimated at 44 kg d-1 (Supplementary Figure 2), which falls within the range expected under normal conditions (Figure 5), indicating this storm did not cause an excessive increase in particle export to the Gulf of Mexico above the typical level. There was a slight change in particle behavior near the bay mouth (Figure 9). The particles here dispersed further west and east, instead of clustering more uniformly at the mouth. However, a week after the storm, this distribution returned to pre-storm conditions. Tropical Storm Cindy overall had minimum impact on Galveston Bay.
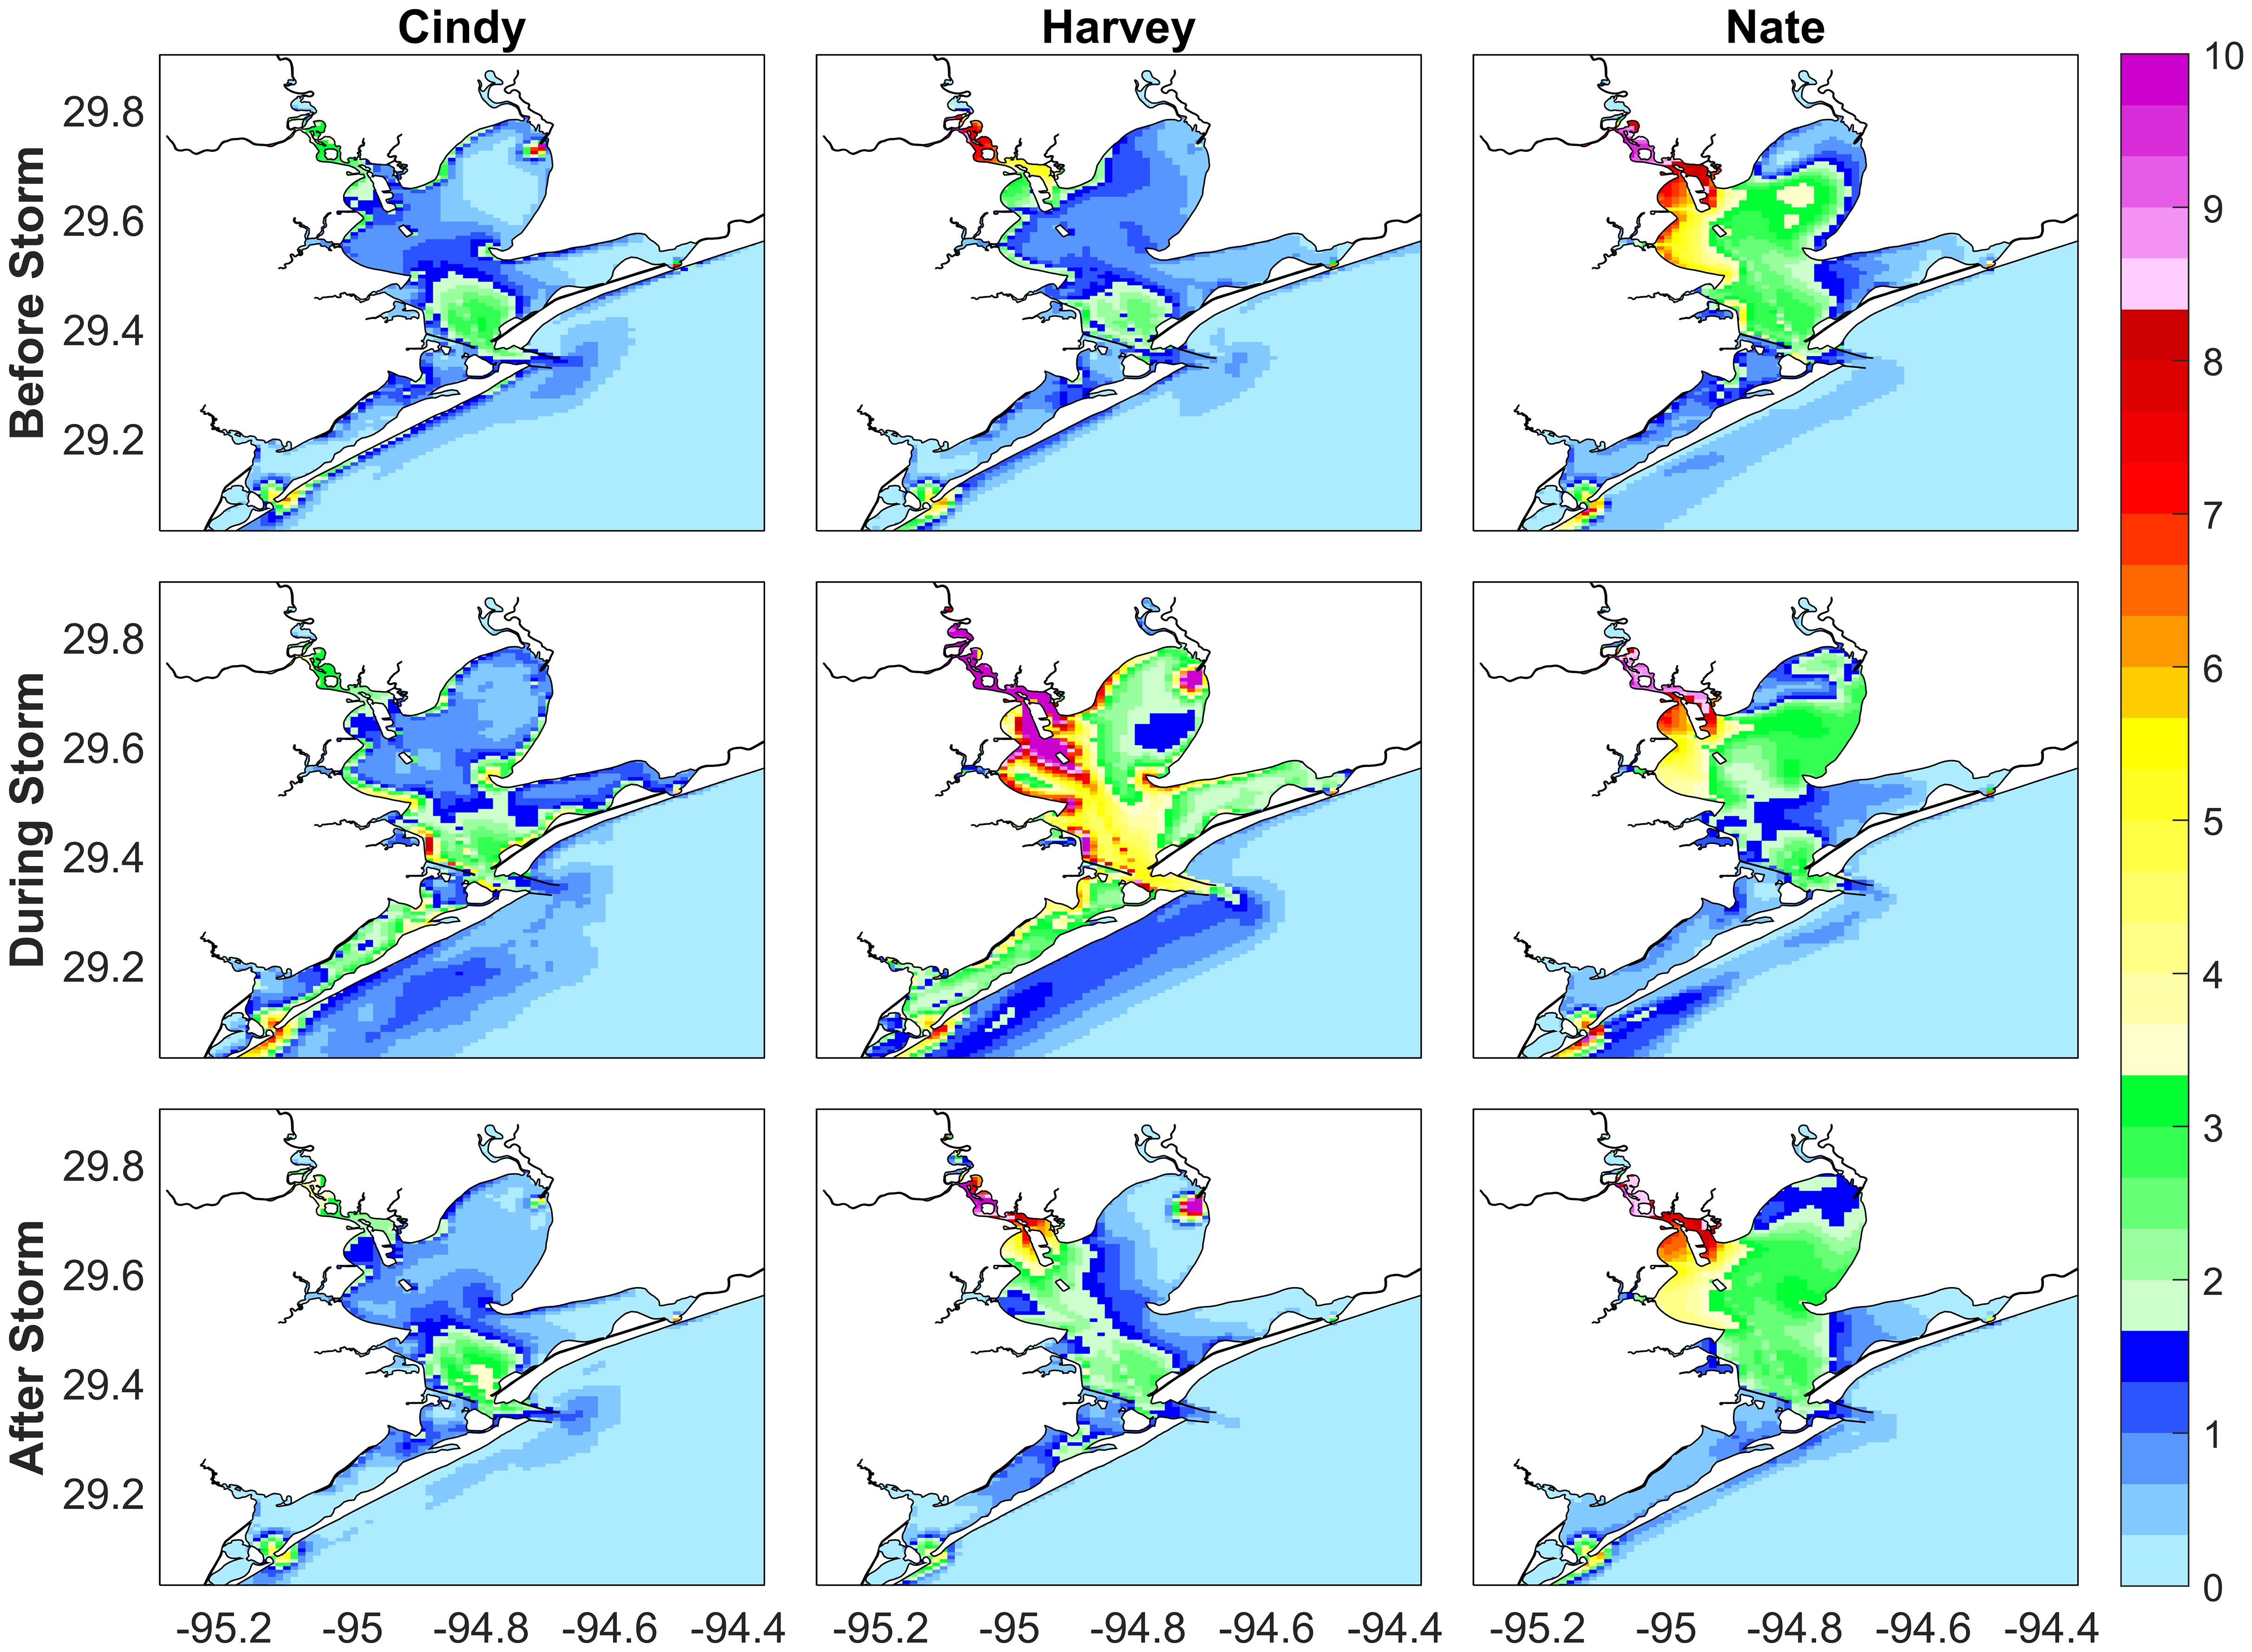
Figure 9. Vertically averaged microplastic concentrations (mg m-3) in Galveston Bay one week before, during, and one week after Tropical Storm Cindy, Hurricane Harvey, and Hurricane Nate (see Table 1 for the duration of each storm).
It is important to note Hurricane Nate (October 4-8) occurred only a month after Harvey, when neutrally buoyant microplastic concentrations were already elevated (Figures 4, 9). Nonetheless, Nate did cause an additional increase in the concentration of neutrally buoyant particles in the areas with weak flows (Figures 3A–D), particularly Trinity Bay. However, this did not correspond to an increase in outflux of particles (Figure 5), with the average flux estimates during Nate at only 15 kg d-1 (Supplementary Figure 2). Even after Nate, therefore, the concentrations of microplastics remained elevated, particularly in the upper bay.
Both Cindy and Nate show a significant increase in the ratio of QE/QR (Supplementary Figure 2), indicating that increases in microplastics during these two storms were likely induced by erosion of legacy microplastics in bed sediments, rather than the increased loading of particles during the storms, similar to the case of Hurricane Harvey but only on smaller scales. We then explore the impact of winter storms, typically associated with high wind levels that hold the potential to cause high erosion of microplastics. A smaller winter storm occurred in late January 2017, which caused a significant negative storm surge in Galveston Bay (Supplementary Figure 1E). This storm was identified as winter storm Jupiter, a Midwestern ice storm that stretched from Oregon to Texas (Belles, 2017; Dean and Loikith, 2017). The maximum wind speed of this storm was reported at 22 m s-1 near Houston (Societal Impacts on the State of Texas: January 2017 Summary Report, https://climatexas.tamu.edu/products/societal-impacts-reports/january-2017-summary.html), which is comparable to Tropical Storm Cindy (27 m s-1). Unlike the other three storms, this storm shows almost entirely positive (outflux) QE/QR (Supplementary Figure 2), indicating particles were being consistently pushed out during the duration of the storm. The average export capacity of this storm (64 kg d-1) was actually higher than Cindy (44 kg d-1) and Nate (15 kg d-1). The highest spike in flux was 219 kg d-1 on January 22. These results indicate that winter storms with direct impact on Galveston Bay might have a larger influence on microplastic export from the bay to the shelf of the Gulf of Mexico than tropical storms and hurricanes that make landfall farther away from Galveston Bay, an interesting topic for future works.
4 Discussion
4.1 Comparison to particle tracking model
We compared the results from a previous study of microplastics using a particle tracking model (Summers et al., 2023) and the results from this study. The purpose is not to directly compare the two models, but to highlight the potential importance of water-bed interactions (deposition/erosion/resuspension) in simulating transport of microplastics in estuarine systems, which are accounted for in the sediment transport model but not in the previously used particle tracking model. A recent study has highlighted the importance of sediment-microplastic interactions in estuaries (Shiravani et al., 2023), but this can be often difficult to parameterize in particle tracking models and to validate due to lack of available data.
Results between the neutrally buoyant microplastics modelled as particles (Summers et al., 2023) and concentrations (this study) are qualitatively comparable during non-storm conditions (Figures 10A, B). Particle levels in both models are higher near the source location and lower in Trinity, East, and West bays. The sediment transport model results further solidify the conclusion in Summers et al. (2023) that neutrally buoyant particles take a more direct path from the source to the middle bay, out through the mouth, resulting in less retention within Galveston Bay than heavy microplastics. Use of either model to simulate neutrally buoyant particles in future study would generate comparable results.
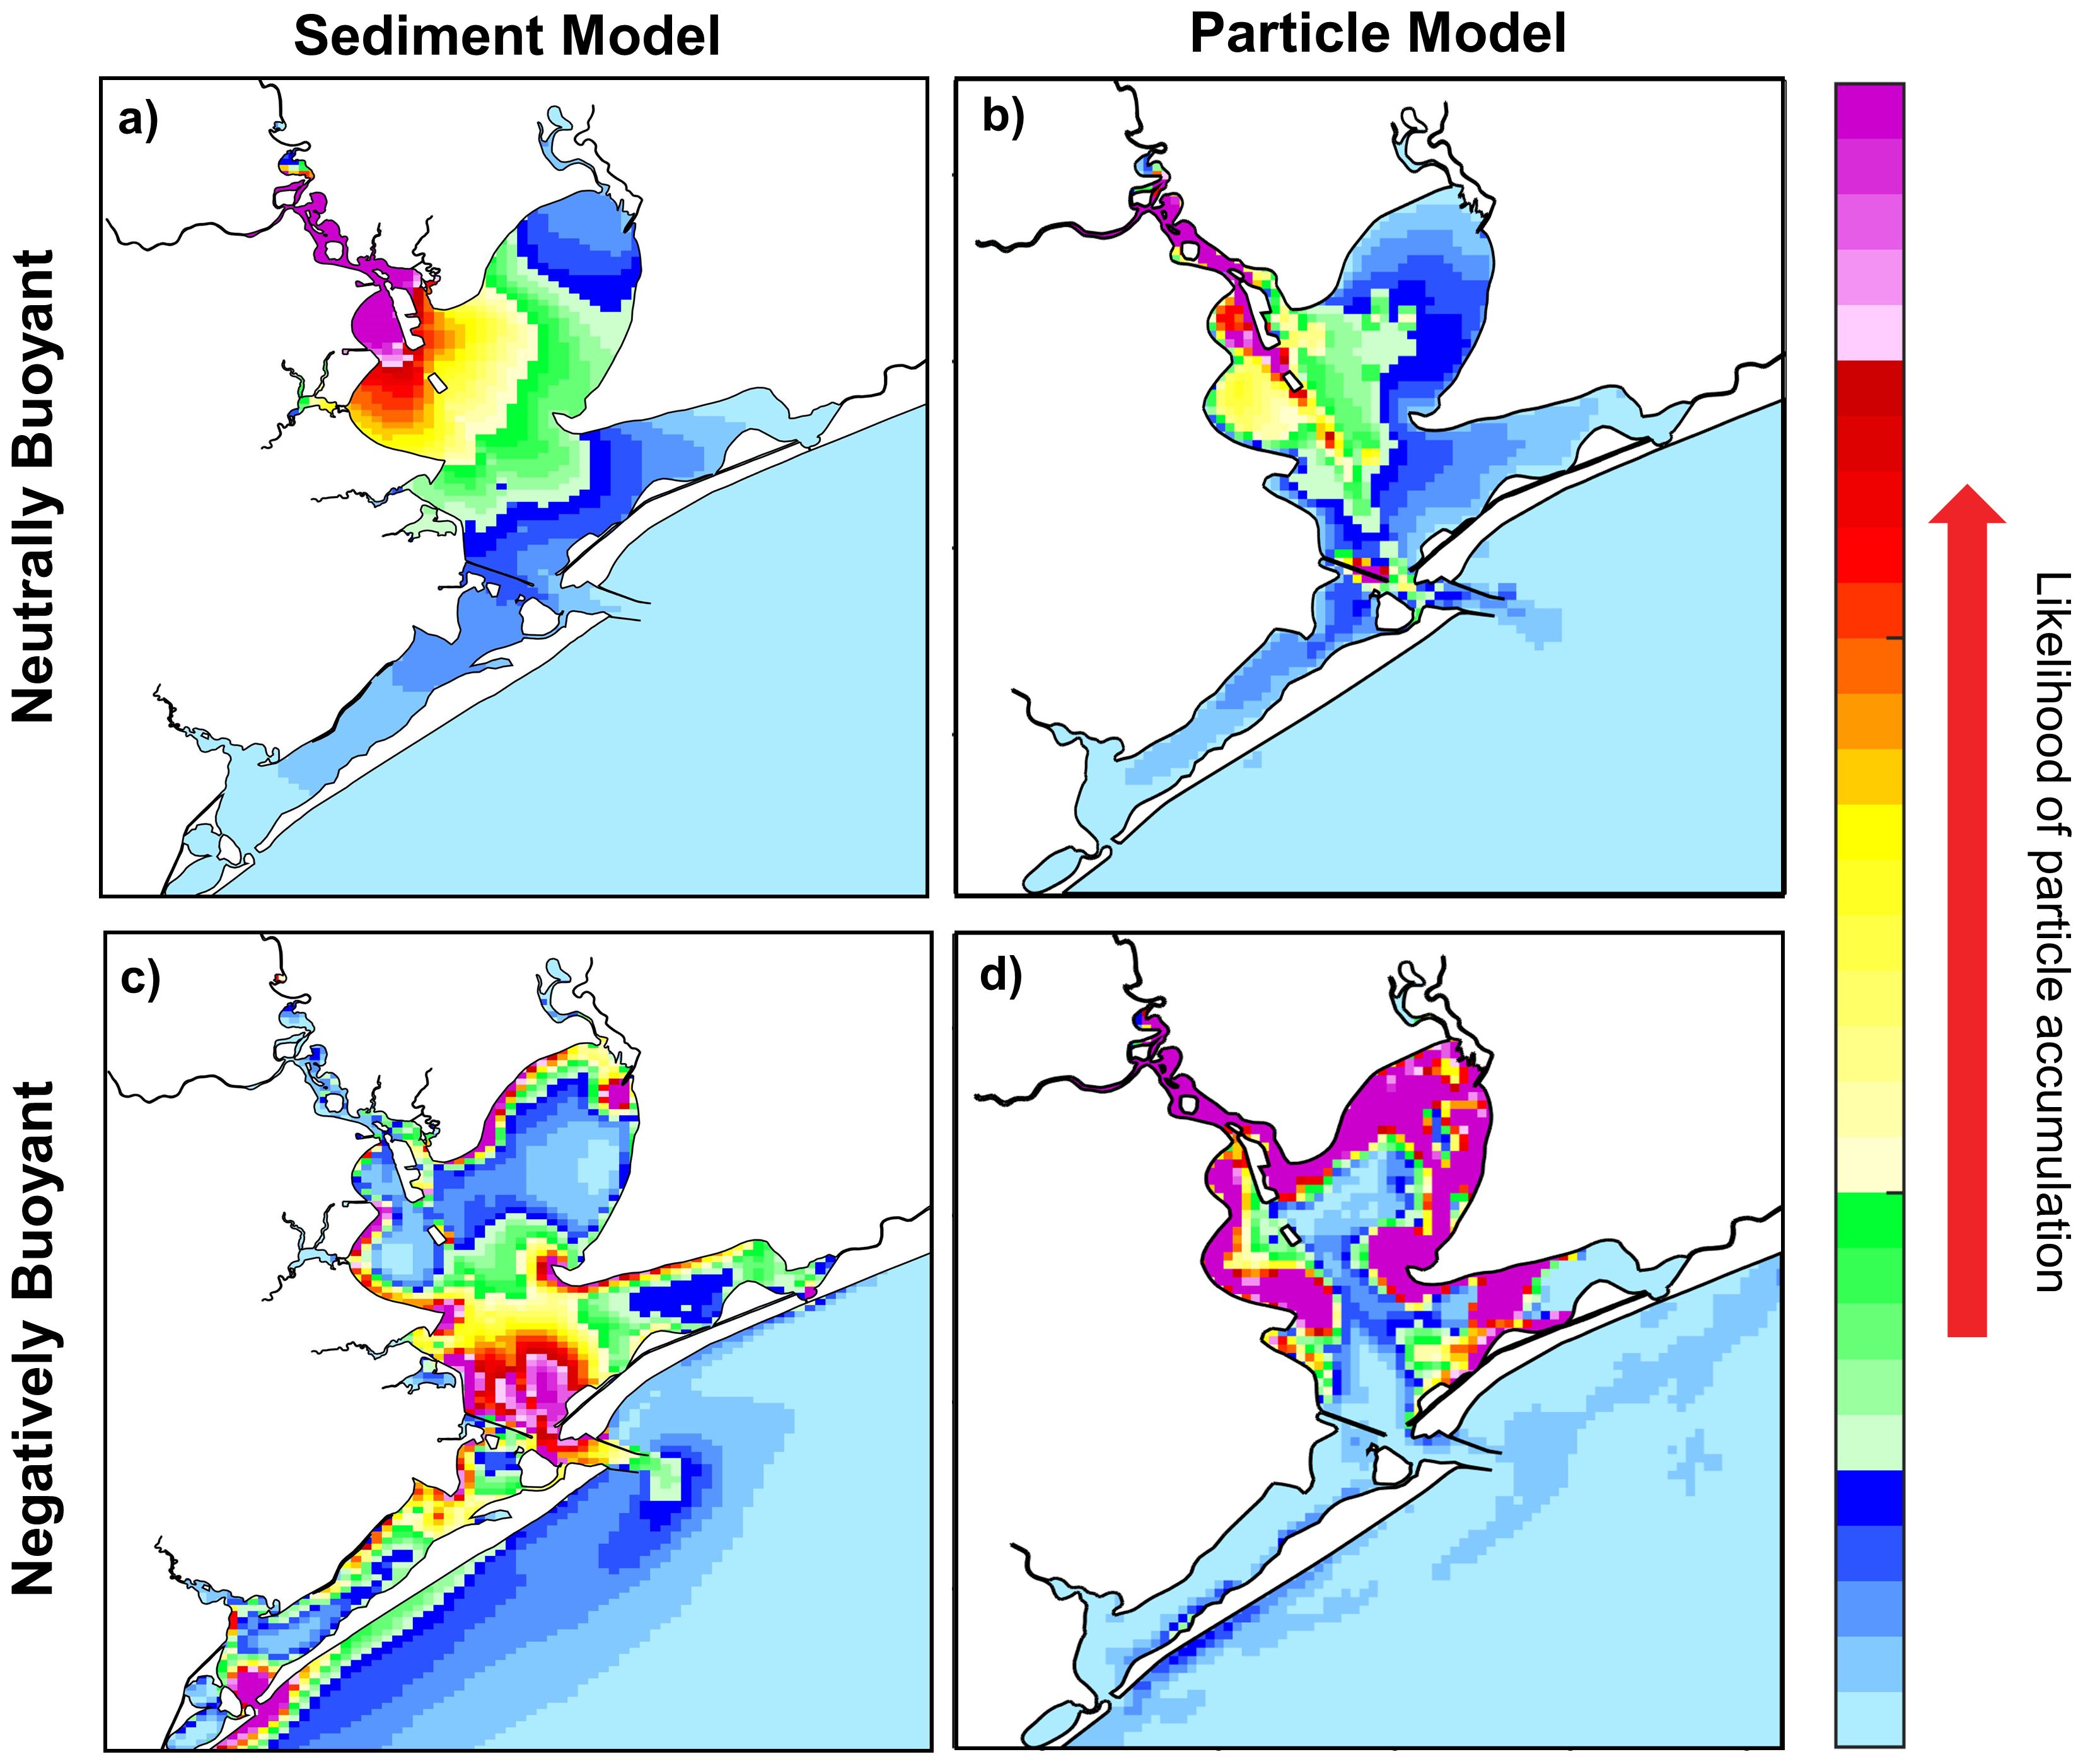
Figure 10. (A–D) Relative comparison of microplastic hotspots simulated by a sediment transport model (this study) and a Lagrangian particle-tracking model (Summers et al., 2023) during non-storm conditions for neutrally and negatively buoyant particles.
However, there are significant differences between the particle tracking and sediment transport models for negatively buoyant particles. The PTM used in Summers et al. (2023) shows very low concentrations of heavy microplastics near the bay mouth (Figure 10D). In contrast, the sediment transport model shows a high accumulation of heavy microplastics near the bay mouth (Figure 10C), which is consistent with the elevated observed concentrations of total particles sampled near the bay mouth (Figure 2); note ~90% of microplastics in these samples being negatively buoyant (Wharton et al., in prep.). The most likely reason for the high accumulation of heavy particles near the bay mouth is erosion/resuspension caused by high bed shear stress (Figure 7). Erosion of particles is not accounted for in the PTM. Since the high concentration near the bay mouth is only seen in the sediment transport model, it is likely that heavy microplastics present near the bay mouth are not transported from Buffalo Bayou, but from erosion of particles in the bed sediments, both initially (legacy) in the bed and those deposited to the bed since the simulation starts. This leads to a further need to accurately quantify legacy microplastics within Galveston Bay sediments. If a high level of microplastics is present in bed sediments, PTMs that do not account for erosion may not be able to accurately simulate microplastic hot spots in high stress areas. Furthermore, if microplastics are stored in bed sediments, this will lead to a significant potential of sediments becoming a source of microplastics in the water column and ultimately to the adjoining shelf, especially during extreme storm events when the bed shear stress will be even greater.
Another clear difference between the two models for negatively buoyant particles is that the PTM shows a high accumulation of heavy microplastics in shallow areas along the coastline, particularly in the upper bay (Figure 10D), while this accumulation is not shown in the sediment transport model (Figure 10C). This is because the particles in the PTM that sink to the bottom are still retained in the water column just above the bed and thus are included in the overall count of particles. As the particles sink to the bottom relatively quickly in shallow areas, a high accumulation of microplastics is shown in shallow water columns, e.g., Trinity and East bays (Figure 10D). In the sediment transport model, however, the particles that sink to the bottom will deposit to the bed and will be eroded when the bed shear stress exceeds the critical value (Figure 10C). In Trinity Bay, for example, bed shear stress is very small, with a median of only 0.008 Pa (Figure 7B). With τce of 0.03 Pa used in this study, the particles in the bed are not likely to be eroded under normal conditions but will be eroded under storm conditions, resulting in high levels of heavy particles in Trinity Bay during Harvey (Figure 8). This means that both models agree that negatively buoyant particles have the potential to travel farther eastward and reach areas such as Trinity Bay. However, the PTM shows accumulation at the bottom layer of the water column, while the sediment transport model shows accumulation in bed sediments.
The difference between the two models highlights the importance of the parameterization of deposition and erosion in PTMs before being used for microplastic transport in an estuarine environment. In addition, this difference could affect whether infauna or benthic organisms in Galveston Bay are more vulnerable to long term microplastic pollution. Both models also show elevated levels of heavy microplastics at shallow Smith Point and San Leon, indicating these locations could be key areas to watch for impacts of long term microplastic exposure. It is important to note that both models have limitations in representation of microplastic transport, with many empirical formulations and parameters that are constrained by lack of available data. As research into microplastics expands and data to inform these models becomes more readily available, understanding of processes most important to simulate microplastic movement will likely improve.
4.2 Particle size classes (different settling velocities)
Based on the stark difference in microplastic particle behavior between particles of different buoyancies seen in this study, the following two suppositions were drawn:
1) Neutrally buoyant particles will be less impacted during a major storm event. However, following the storms passing, neutrally buoyant particles that enter the bay will be retained for longer periods of time. These particles will mainly accumulate in the water column of the upper bay.
2) Negatively buoyant particles will increase in concentration during major storm events. The lower the settling velocity of a microplastic particle, the more drastic the increase in concentration. Some of these particles will be exported to the Gulf of Mexico, and some will settle back into sediments. The concentration of these particles in the water column will return to normal after the storm’s passing.
The slight decrease in neutrally buoyant particles (Figure 4) is likely due to the high influx of freshwater flow from August 25th – September 1st (Supplementary Figures 1A, B). Retention of neutrally buoyant particles within estuaries has shown strong correlation with riverine inflow levels in past studies (Nizzetto et al., 2016; He et al., 2021; Summers et al. 2024). However, the decrease is small, because increased river discharge also brings about increased loading of particles into the bay. Neutrally buoyant microplastics may accumulate in the upper bay areas, as well as East Bay, following the storm’s passing (Figures 3A-D). Past studies have shown that Trinity Bay has small tidal range and slower salinity recovery (Du et al., 2019b; Du and Park, 2019) and neutrally buoyant pollutants have higher exposure time to this region following extreme storm events (Du et al., 2020). This means that the upper bay may be more susceptible to the long-term effect of neutrally buoyant microplastics following storm events.
Different from neutrally buoyant particles, negatively buoyant microplastics increase in concentrations during Hurricane Harvey (Figure 8). This can be best observed in the upper bay areas, due to the differences seen in the bed stress at the bay mouth and in other areas of the bay (Figure 7). The bed stress at the bay mouth is very high even during non-storm conditions (median of 0.207 Pa), significantly greater than τce (0.03 Pa) easily resuspending the deposited particles. The bed stress is much weaker at other areas of the bay during non-storm conditions (median< 0.03 Pa), meaning particles that settle are usually not resuspended. However, a spike in bed stress (0.14-0.24 Pa) was induced during Hurricane Harvey leading to higher resuspension in areas such as Burnet Bay, Trinity Bay, Smith Point, San Leon, and East Bay. This is likely why heavy microplastic particles in the Galveston Bay water column increase so drastically during Hurricane Harvey. This is comparable to studies on sediment response to Harvey with a sediment load during Harvey equivalent to 18 years of the average annual sediment load (Du et al., 2019a). Within the San Jacinto estuary alone, 48 cm of the sediment column were eroded during Harvey, followed by a heavy deposit following its passing (Dellapenna et al., 2020).
Summers et al. (2024) shows that heavy microplastic particles have the potential to be indefinitely retained in the northwestern Gulf of Mexico estuaries under normal non-storm conditions. Then, if Galveston Bay is in fact retaining high amounts of heavy microplastic particles in its bed sediments, it poses a greater potential to be a source of microplastics to the Gulf of Mexico during extreme storm events. Our model results do not show drastic increases in bed stress during Hurricane Nate or Tropical Storm Cindy (Figure 7), which explains why these two storms show little effects on particle concentrations (Figure 9).
4.3 Critical shear stress for erosion, τce
Although the modeling study in the Great Bay estuary in the Gulf of Maine showed that flow rate and bed shear stress are the most important determinant of spatial distribution of microplastic particles, with the highest accumulation likely occurring in regions with weaker hydrodynamic flows and lower bed shear stress (Cheng et al., 2021), much is still unknown about the effect of τce for microplastics. We started with 0.03 Pa for τce in this study, which falls within the typical range in coastal areas (Sanford and Maa, 2001; Bale et al., 2006; Shi et al., 2018). Liu and Wang (2014) used 0.01 Pa for fine sediments and 0.07 Pa for medium-size grains, implying that the microplastic particles with τce of 0.03 Pa would behave closer to fine sediments. Maa et al. (1998) reported for Baltimore Harbor that τce strongly depends on the existence of a flocculent layer, with about 0.05 Pa if a flocculent layer existed and about 0.1 Pa in the absence of a flocculent layer. The value we used (0.03 Pa) represents particles that are more easily erodible, e.g., a likely thin layer of surface materials (Sanford and Maa, 2001). This is believed to be applicable to Galveston Bay, as flocculent visible particles were observed on the surface during field sampling (although the naked eyes could not tell whether these were plastic particles).
Microplastic behavior is often polymer specific (Guo and Wang, 2019; Waldschlager and Schüttrumpf, 2019b; Wang et al., 2021), and heavy, negatively buoyant microplastic particles show such high potential for erosion during Hurricane Harvey (Figures 4, 8). With τce ranging from 0.002- 0.233 Pa in Waldschlager and Schüttrumpf (2019a), we further explore the effect of τce for the values of 0.01, 0.05, and 0.065 Pa. The value 0.065 Pa is chosen from the critical bed shear stress erosion curve vs. particle size (Ballent et al., 2013) for a median diameter value of 0.03 mm from literature review of microplastics collected from coastal and estuarine sediments (Willis et al., 2017; Mendes et al., 2021; Bošković et al., 2022).
The total microplastic concentrations do fluctuate with varying τce during Hurricane Harvey, with lower τce resulting in higher concentrations during the storm (Figure 11A; Supplementary Figure 3). However, the following general trend holds regardless of τce. For a given τce, Burnet Bay shows the highest total concentration, with high concentrations also found at West Bay and the bay mouth (Figure 11A). Microplastics are exported out of Galveston Bay into the shelf during Hurricane Harvey for all simulations (Supplementary Figure 3).
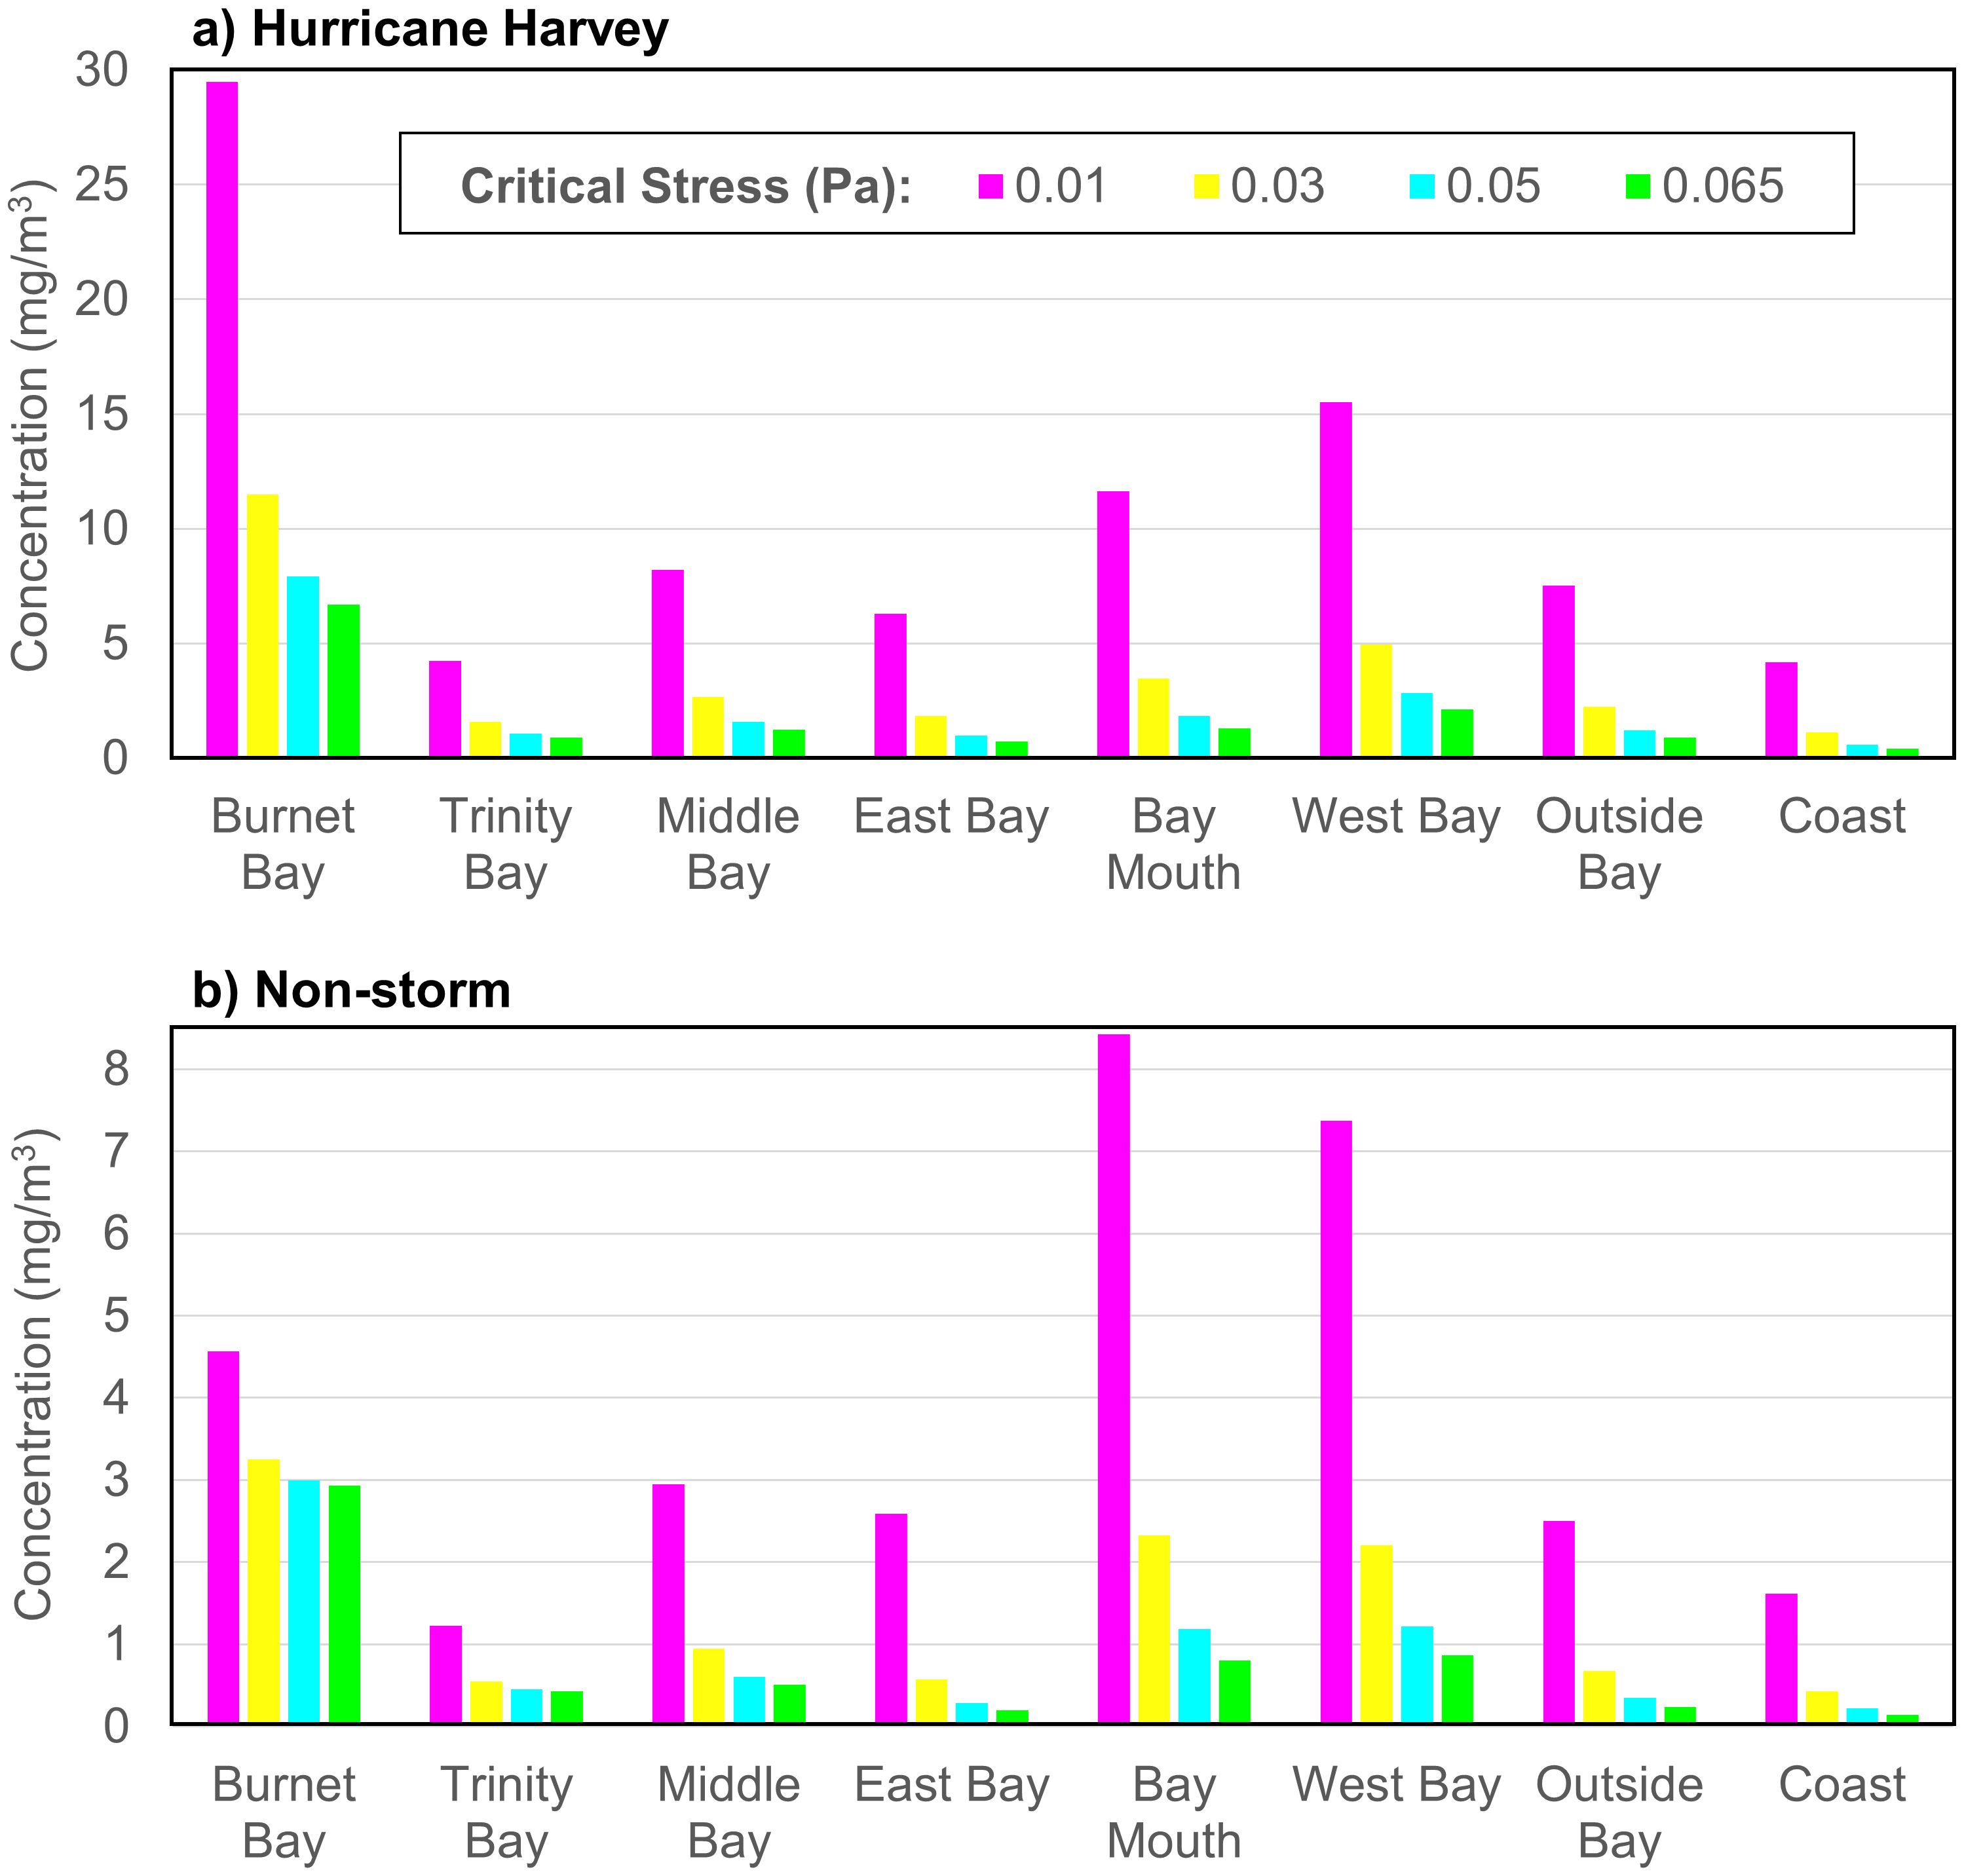
Figure 11. Total microplastic concentrations (mg m-3) at eight sites (see Figure 1 for their locations) for varying critical shear stress for erosion during Hurricane Harvey between August 25-September 1, 2017 (A) and during a week of non-storm conditions between April 1-7, 2017 (B).
As neutrally buoyant particles do not sink, variation in τce does not bring about any changes in their distribution (Supplementary Figure 3). However, negatively buoyant particles do show drastic changes of increases in concentrations with decreasing τce for all size classes. This is especially clear for particles with ws of 7 m d-1, whose concentration increases in almost entire bay to > 5 mg m-3 for τce of 0.01 Pa (Supplementary Figure 3). For τce of 0.01 Pa, even the heaviest particles (ws of 38 m d-1) are noticeably eroded, with Trinity Bay being the only area to have concentrations of these heavy particles< 0.5 mg m-3. This means that microplastics have an even greater potential to be eroded during storm conditions for relatively small τce.
Particles with a lower τce are more easily erodible under non-storm conditions as well. Smaller changes occur for τce > 0.03 Pa, but the concentrations increase drastically when τce is reduced to 0.01 Pa (Figure 11B). The areas with smaller tidal range (e.g., Trinity, Middle, and East bays) behave similarly, since shear stress during non-storm conditions is too small to erode heavy microplastics (Figure 7). However, the concentrations are high, particularly for small τce (0.01 Pa), in the areas with strong tidal exchange (e.g., Bay mouth) (Figure 11B). Large changes in particle concentrations for varying τce (Figure 11) indicate that accurate selection of τce remains as a critical issue for the simulation of erosion for microplastic particles.
The microplastic concentrations outside the bay and on the inner shelf also increase with decreasing τce (Figure 11; Supplementary Figure 3), indicating that τce impacts to what extent Galveston Bay will be a source of microplastic particles to the Gulf of Mexico. Waldschläger and Scḧttrumpf (2019a) shows that polystyrene is more easily erodible from sediments, while polyethylene terephthalate can be harder to erode from sediments (Waldschläger and Scḧttrumpf, 2019a). This could mean that lighter particles such as polystyrene could be flushed during normal non-storm conditions, but a severe storm event may be necessary to flush heavier particles, such as polyethylene terephthalate, out of Galveston Bay. More studies are needed for τce for microplastic particles in estuarine and coastal waters.
4.4 Erosion rate, E0
As in the case of τce, few studies have been conducted for the estimation of the erosion rate (E0 in Eq. 2) for microplastic particles. We use in this study a constant E0 (24x10-11 kg m−2 s−1) for all size classes (Section 2.3). As E0 can vary depending on many factors, including timing of sampling (tidal phase) and influence of external factors (e.g., stirring up of bed sediments by boats), we explore the effect of E0.
When increasing E0 by a factor of 10 (24x10-10 kg m−2 s−1), the microplastic concentrations during non-storm conditions become much higher (Supplementary Figure 4) compared to the base run (Figure 6). For example, the total concentration at the bay mouth (25 mg m-3) is 10 times higher than that in the base run (2.5 mg m-3). It is interesting that this new model results with increased E0 become more comparable to the data in terms of concentrations (Figure 2), but it should be noted that the model runs forced with underestimated loading are expected to underestimate the data, regardless of E0. In relative percentage, the new model with increased E0 gives a better agreement at Burnet Bay but overestimation at Sea Wolf Park (where bed shear stress is very high even under non-storm conditions, Figure 7F). The new model still underestimates the data in Trinity Bay, likely due to no microplastic loading from Trinity River despite it being the largest river input into Galveston Bay (Du et al., 2019b). Additionally, the relative percentage of neutrally buoyant particles becomes smaller with increasing E0, as their concentrations remain the same regardless of erosion, while the concentrations of heavy particles increase drastically with increasing E0 (Figure 6; Supplementary Figure 4), however field data indicates the neutrally buoyant particles should be making up roughly 10% of total particles in the bay (Wharton et al., in prep).
The effect of increasing E0 by a factor of 10 (24x10-10 kg m−2 s−1) is also explored for the three storm events (Supplementary Figure 5). The overall spatial patterns are compatible to those from the base run (Figure 9), but the concentrations are considerably higher, by a factor of around 5. The results indicate that while E0 is less likely to influence the locations of hotspots for microplastic erosion during storm events, it may affect the amount of erosion and thus the quantity of microplastics in the water column available to be exported to the Gulf of Mexico, that is, to what extent Galveston Bay is a source of microplastics during extreme storm events. More studies are needed for E0 for microplastic particles in estuarine and coastal waters.
4.5 Wind wave model
The hydrodynamic and sediment transport models are coupled with a wind wave model (WWM) to account for wave-enhanced bottom shear stress. To assess the importance of wave-enhanced bottom stress, the bed shear stresses from two model runs, with and without WWM, are compared (Figure 7). Both under non-storm conditions and during Hurricane Harvey, both model results with and without WWM show elevated stress near the bay mouth, indicating that the contribution of wave to bed stress is minimum and the current-induced bed stress is dominant near the bay mouth. In the upper bay areas and East Bay, however, the bed stresses with WWM are considerably larger than those without WWM (Figures 7A-E). In all upper bay sites, the bed stresses without WWM are so low compared to τce that erosion is not likely under non-storm conditions and only with WWM erosion will occur at these sites. It means that the bed stress in the upper bay areas is mostly wave induced under non-storm conditions.
The large spikes in bed stress during Hurricane Harvey cannot be reproduced without WWM in all sites except Bay Mouth (Figure 7). At Trinity Bay, Smith Point, San Leon, and East Bay, the bed stresses without WWM are not large enough to cause erosion. The large peak in bed stress without WWM at Burnet Bay was caused by excessively strong current necessary to drain out huge freshwater input during Harvey (Du et al., 2019a): note a time lag between the wave-induced peak and a current-induced peak at Burnet Bay during Harvey (Figure 7A). During extreme storm events, without a wave model, increased erosion of microplastic particles cannot be captured. It is clearly shown in Figure 7G that with WWM, the bed stress in almost entire bay exceeds τce (0.03 Pa). Without WWM, however, this value is exceeded only at the bay mouth.
Previous studies have shown that wave models are necessary to simulate increased wave heights and thus enhanced wave-induced bed stress during hurricanes (Cooper and Pearce, 1982; Xie et al., 2003; Teague et al., 2007). Our study also shows that use of WWM is likewise important to accurately capture microplastic behavior during Harvey. Galveston Bay acts as a source of negatively buoyant microplastics to the Gulf of Mexico during large storm events (Figures 3G, H, 5) via erosion from bed sediments (Figure 7). Without WWM, the enhanced bed stress during a storm like Harvey and thus resuspension of the eroded particles cannot be reproduced. These results highlight the importance of representing wave-enhanced bottom stress when simulating heavy microplastics in estuaries.
5 Conclusion
One explanation that has been proposed to the ‘missing plastic problem’ (Lebreton et al., 2018), a phenomenon where estimates of plastic input into the ocean are magnitudes higher than those of particles actually floating on the ocean surface, is the potential for accumulation of microplastics within sediments (Woodall et al., 2014). Data from Galveston Bay indicates that microplastics have high concentrations in areas (where previous particle tracking models have indicated low risk zones) associated with high bed shear stress and thus high potential for erosion, leading to the necessity to further explore microplastic interaction with bed sediments.
Consistent positive outflux of both neutrally and negatively buoyant particles indicates that Galveston Bay acts as a source of microplastics to the Gulf of Mexico under normal conditions. Neutrally buoyant particle concentrations were typically higher in the upper bay near the source location and lower in the lower bay where tidal exchange is strong. However, all negatively buoyant particles showed higher concentrations near the bay mouth, where bed shear stress is strong and lower concentrations near the source location. This indicates that heavy particles may actually be settling out into the bed sediments near the source, especially in low bed stress areas where bed stress seldom exceeds the critical threshold for erosion. This highlights the importance of using a sediment transport model during storm conditions, to analyze how erosion/resuspension can release the bed-trapped particles to the water column above, and the importance of using a wind wave model to accurately capture wave induced stress during storm events. Hurricane Harvey caused the shear stress for erosion in many typically low stress areas to exceed the critical erosion threshold, inducing erosion and increasing particle concentration in nearly all areas of the bay. This corresponded with an increase in outflux of these particles to the Gulf of Mexico.
The use of the sediment transport model with deposition and erosion/resuspension was determined to be a helpful tool to analyze microplastic behavior that previously had not been captured using a particle tracking model that does not account for deposition/erosion/resuspension. However, this is a relatively new field, and many interactions between microplastic particles and bed sediments have not been well established, especially for the critical shear stress for erosion and the erosion rate; sensitivity analyses show that the results of the sediment transport model are sensitive to both. The following areas are indicated as crucial for future studies: 1) Quantification of microplastic concentrations of different size classes in both suspended and bed sediments; 2) Determination of critical shear stress for erosion for different types of microplastic particles; 3) Determination of erosion rate for different types of microplastic particles; 4) Quantification of microplastic loading; and 5) Further analysis into the impact of winter storms on particle concentrations in estuaries. We look forward to exploring these topics more in our future works.
Data availability statement
The raw data supporting the conclusions of this article will be made available by the authors, without undue reservation.
Author contributions
ES: Formal analysis, Methodology, Visualization, Writing – original draft. JD: Methodology, Software, Writing – review & editing. KP: Supervision, Writing – review & editing. MW: Writing – review & editing, Data curation. KK: Data curation, Writing – review & editing, Funding acquisition.
Funding
The author(s) declare financial support was received for the research, authorship, and/or publication of this article. This work was supported by the US Coastal Research Program (Award No. W912HZ-22-2-0011).
Conflict of interest
The authors declare that the research was conducted in the absence of any commercial or financial relationships that could be construed as a potential conflict of interest.
Publisher’s note
All claims expressed in this article are solely those of the authors and do not necessarily represent those of their affiliated organizations, or those of the publisher, the editors and the reviewers. Any product that may be evaluated in this article, or claim that may be made by its manufacturer, is not guaranteed or endorsed by the publisher.
Supplementary material
The Supplementary Material for this article can be found online at: https://www.frontiersin.org/articles/10.3389/fmars.2024.1414459/full#supplementary-material
Footnotes
- ^ Wharton, M., Summers, E., Du, J., Park, K., and Kaiser, K. M, Concentrations and distributions of microplastics across Gulf of Mexico watersheds. Sci. Total Environment (in preparation).
References
Akdogan Z., Guven B. (2019). Microplastics in the environment: A critical review of current understanding and identification of future research needs. Environ. pollut. 254, 113011. doi: 10.1016/j.envpol.2019.113011
Argall R., Sanders B. F., Poon Y.-K. (2004). Random-walk suspended sediment transport and settling model. Proc. Estuar. Coast. Modeling VIII, 713–730. doi: 10.1061/40734(145)44
Ariathurai R., Arulanandan K. (1978). Erosion rates of cohesive soils. J. Hydraulics Division 104, 279–283. doi: 10.1061/JYCEAJ.0004937
Bale A. J., Widdows J., Harris C. B., Stephens J. A. (2006). Measurements of the critical erosion threshold of surface sediments along the Tamar Estuary using a mini-annular flume. Continental Shelf Res. 26, 1206–1216. doi: 10.1016/j.csr.2006.04.003
Ballent A., Pando S., Purser A., Juliano M. F., Thomsen L. (2013). Modelled transport of benthic marine microplastic pollution in the Nazaré Canyon. Biogeosciences 10, 7957–7970. doi: 10.5194/bg-10-7957-2013
Belles J. (2017).Winter storms 2016-17: 22 winter storms rrecap. In: The weather channel. Available online at: https://weather.com/storms/winter/news/winter-storm-season-so-far-january-2017 (Accessed March 19, 2024).
Bigdeli M., Mohammadian A., Pilechi A., Taheri M. (2022). Lagrangian modeling of marine microplastics fate and transport: The state of the science. J. Mar. Sci. Eng. 10, 481. doi: 10.3390/jmse10040481
Bošković N., Joksimović D., Perošević-Bajčeta A., Peković M., Bajt O. (2022). Distribution and characterization of microplastics in marine sediments from the Montenegrin coast. J. Soils Sediments 22, 2958–2967. doi: 10.1007/s11368-022-03166-3
Bukunmi-Omidiran T., Sridhar B. B. M. (2021). Evaluation of spatial and temporal water and soil quality in the Buffalo and Brays Bayou watersheds of Houston, Texas. Remote Sens. Applications: Soc. Environ. 21, 100455. doi: 10.1016/j.rsase.2020.100455
Chen Q., Wang L., Tawes R. (2008). Hydrodynamic response of northeastern Gulf of Mexico to hurricanes. Estuaries Coasts 31, 1098–1116. doi: 10.1007/s12237-008-9089-9
Cheng M. L. H., Lippmann T. C., Dijkstra J. A., Bradt G., Cook S., Choi J. G., et al. (2021). A baseline for microplastic particle occurrence and distribution in Great Bay Estuary. Mar. pollut. Bull. 170, 112653. doi: 10.1016/j.marpolbul.2021.112653
Cooper C., Pearce B. (1982). Numerical simulations of hurricane-generated currents. J. Phys. Oceanography 12, 1071–1091. doi: 10.1175/1520-0485(1982)012<1071:NSOHGC>2.0.CO;2
Critchell K., Lambrechts J. (2016). Modelling accumulation of marine plastics in the coastal zone; What are the dominant physical processes? Estuarine Coast. Shelf Sci. 171, 111–122. doi: 10.1016/j.ecss.2016.01.036
Dean S., Loikith P. C. (2017). “Winter storm Jupiter of January 2017: Meteorological drivers, synoptic evolution, and climate change considerations in Portland, Oregon,” in Abstracts of the AGU fall meeting 2017. (New Oreleans, LA: American Geophysical Union). Available at: https://ui.adsabs.harvard.edu/abs/2017AGUFM.A53C2261D/abstract.
De Arbeloa N. P., Marzadri A. (2024). Modeling the transport of microplastics along river networks. Sci. Total Environ. 911, 168227. doi: 10.1016/j.scitotenv.2023.168227
Dellapenna T. M., Hoelscher C., Hill L., Al Mukaimi M. E., Knap A. (2020). How tropical cyclone flooding caused erosion and dispersal of mercury-contaminated sediment in an urban estuary: The impact of Hurricane Harvey on Buffalo Bayou and the San Jacinto Estuary, Galveston Bay, USA. Sci. Total Environ. 748, 141226. doi: 10.1016/j.scitotenv.2020.141226
Di Mauro R., Kupchik M. J., Benfield M. C. (2017). Abundant plankton-sized microplastic particles in shelf waters of the northern Gulf of Mexico. Environ. pollut. 230, 798–809. doi: 10.1016/j.envpol.2017.07.030
Du J., Park K. (2019). Estuarine salinity recovery from an extreme precipitation event: Hurricane Harvey in Galveston Bay. Sci. Total Environ. 670, 1049–1059. doi: 10.1016/j.scitotenv.2019.03.265
Du J., Park K., Dellapenna T. M., Clay J. M. (2019a). Dramatic hydrodynamic and sedimentary responses in Galveston Bay and adjacent inner shelf to Hurricane Harvey. Sci. Total Environ. 653, 554–564. doi: 10.1016/j.scitotenv.2018.10.403
Du J., Park K., Jensen C., Dellapenna T. M., Zhang W. G., Shi Y. (2021). Massive oyster kill in Galveston Bay caused by prolonged low-salinity exposure after Hurricane Harvey. Sci. Total Environ. 774, 145132. doi: 10.1016/j.scitotenv.2021.145132
Du J., Park K., Shen J., Zhang Y. J., Yu X., Ye F., et al. (2019b). A hydrodynamic model for Galveston Bay and the shelf in the northern Gulf of Mexico. Ocean Sci. 15, 951–966. doi: 10.5194/os-15-951-2019
Du J., Park K., Yu X., Zhang Y. J., Ye F. (2020). Massive pollutants released to Galveston Bay during Hurricane Harvey: Understanding their retention and pathway using Lagrangian numerical simulations. Sci. Total Environ. 704, 135364. doi: 10.1016/j.scitotenv.2019.135364
Duis K., Coors A. (2016). Microplastics in the aquatic and terrestrial environment: Sources (with a specific focus on personal care products), fate and effects. Environ. Sci. Europe 28. doi: 10.1186/s12302-015-0069-y
Emanuel K. (2005). Increasing destructiveness of tropical cyclones over the past 30 years. Nature , 436, 686–688. doi: 10.1038/nature03906
Gailani J. Z., Lackey T. C., Smith S. J. (2007). “Application of the particle tracking model to predict far-field fate of sediment suspended by nearshore dredging and placement at Brunswick, Georgia,” in Proceedings of the XVIII world dredging congress(Lake Buena Vista, FL: Proceedings XVIII World Dredging Congress 2007). Available at: https://doer.el.erdc.dren.mil/pdf/GAILANIetal_2008.pdf.
Goldenberg S., Landsea C., Mestas-Nunez A., Gray W. (2001). The recent increase in Atlantic hurricane activity: Causes and implications. Science 293, 474–479. doi: 10.1126/science.1060040
Gorman D., Gutierrez A. R., Turra A., Manzano A. B., Balthazar-Silva D., Oliveira N. R., et al. (2020). Predicting the dispersal and accumulation of microplastic pellets within the estuarine and coastal waters of South-Eastern Brazil using integrated rainfall data and Lagrangian particle tracking models. Front. Environ. Sci. 8. doi: 10.3389/fenvs.2020.559405
Greening H., Doering P., Corbett C. (2006). Hurricane impacts on coastal ecosystems. Estuaries Coasts 29, 877–879. Available at: http://www.jstor.org/stable/4124816.
Guo X., Wang J. (2019). The chemical behaviors of microplastics in marine environment: A review. Mar. pollut. Bull. 142, 1–14. doi: 10.1016/j.marpolbul.2019.03.019
Hardesty B. D., Harari J., Isobe A., Lebreton L., Maximenko N., Potemra J., et al. (2017). Using numerical model simulations to improve the understanding of micro-plastic distribution and pathways in the marine environment. Front. Mar. Sci. 4. doi: 10.3389/fmars.2017.00030
Hayes M. O. (1978). “Impact of hurricanes on sedimentation in estuaries, bays, and lagoons,” in Estuarine interactions. Ed. Wiley M. L. (Academic Press), 323–346. doi: 10.1016/B978-0-12-751850-3.50026-1
He B., Smith M., Egodawatta P., Ayoko G. A., Rintoul L., Goonetilleke A. (2021). Dispersal and transport of microplastics in river sediments. Environ. pollut. 279, 116884. doi: 10.1016/j.envpol.2021.116884
Isobe A., Kako S. I., Chang P. H., Matsuno T. (2009). Two-way particle-tracking model for specifying sources of drifting objects: application to the East China Sea shelf. J. Atmospheric Oceanic Technol. 26, 1672–1682. doi: 10.1175/2009JTECHO643.1
Jambeck J., Geyer R., Wilcox C., Siegler T. (2015). Plastic waste inputs from land into the ocean. Science 347, 768–771. doi: 10.1126/science.1260352
Kantha L. H., Clayson C. A. (1994). An improved mixed layer model for geophysical applications. J. Geophysical Res. 99, 25235–25266. doi: 10.1029/94JC02257
Kumar R., Sharma P., Verma A., Jha P. K., Singh P., Gupta P. K., et al. (2021). Effect of physical characteristics and hydrodynamic conditions on transport and deposition of microplastics in riverine ecosystem. Water 13, 2710. doi: 10.3390/w13192710
Lebreton L., Slat B., Ferrari F., Sainte-Rose B., Aitken J., Marthouse R., et al. (2018). Evidence that the Great Pacific Garbage Patch is rapidly accumulating plastic. Sci. Rep. 8, 4666. doi: 10.1038/s41598-018-22939-w
Leslie H. A., van Velzen M. J. M., Brandsma S. H., Vethaak A. D., Garcia-Vallejo J. J., Lamoree M. H. (2022). Discovery and quantification of plastic particle pollution in human blood. Environ. Int. 163, 107199. doi: 10.1016/j.envint.2022.107199
Liu X., Wang M. (2014). River runoff effect on the suspended sediment property in the upper Chesapeake Bay using MODIS observations and ROMS simulations. J. Geophysical Research: Oceans 119, 8646–8661. doi: 10.1002/2014JC010081
López A. G., Najjar R. G., Friedrichs M. A. M., Hickner M. A., Wardrop D. H. (2021). Estuaries as filters for riverine microplastics: Simulations in a large, coastal-plain estuary. Front. Mar. Sci. 8. doi: 10.3389/fmars.2021.715924
Maa J. P.-Y., Kim S. C. (2001). A constant erosion rate model for fine sediment in the York River, Virginia. Environ. Fluid Mechanics 1, 345–360. doi: 10.1023/A:1015799926777
Maa J. P.-Y., Sanford L. P., Halka J. P. (1998). Sediemnt resuspension characteristics in Baltimore Harbor Maryland. Mar. Geology 146, 137–145. doi: 10.1016/S0025-3227(97)00120-5
MacDonald N. J., Davies M. H., Zundel A. K., Howlett J. D., Demirbilek Z., Gailani J. Z., et al. (2006). “PTM: particle tracking model report 1: model theory, implementation, and example applications,” in Technical report TR-06-02, U.S. Army corps of engineers, engineer research and development center (Vicksburg, MS, USA: U.S. Army corps of engineers, engineer research and development center).
Mendes A., Golden M., Bermejo R., Morrison L. (2021). Distribution and abundance of microplastics in coastal sediments depends on grain size and distance from sources. Mar. pollut. Bull. 172, 112802. doi: 10.1016/j.marpolbul.2021.112802
Nizzetto L., Bussi G., Futter M. N., Butterfield D., Whitehead P. G. (2016). A theoretical assessment of microplastic transport in river catchments and their retention by soils and river sediments. Environ. Science: Processes Impacts 18, 1050–1059. doi: 10.1039/C6EM00206D
Nordam T., Kristiansen R., Nepstad R., van Sebille E., Booth A. M. (2023). A comparison of Eulerian and Lagrangian methods for vertical particle transport in the water column. Geoscientific Model. Dev. 16, 5339–5363. doi: 10.5194/gmd-16-5339-2023
Peterson M. L., Wakeham S. G., Lee C., Askea M. A., Miquel J. C. (2005). Novel techniques for collection of sinking particles in the ocean and determining their settling rates. Limnology Oceanography: Methods 3, 520–532. doi: 10.4319/lom.2005.3.520
Pinto L., Fortunato A. B., Zhang Y., Oliveira A., Sancho F. E. P. (2012). Development and validation of a three-dimensional morphodynamic modelling system. Ocean Modeling 57–58, 1-14. doi: 10.1016/j.ocemod.2012.08.005
Preziosi-Ribero A., Packman A. I., Escobar-Vargas J. A., Phillips C. B., Donado L. D., Arnon S. (2020). Fine sediment deposition and filtration under losing and gaining flow conditions: A particle tracking model approach. Water Resour. Res. 56, e2019WR026057. doi: 10.1029/2019WR026057
Rafa N., Ahmed B., Zohora F., Bakya J., Ahmed S., Ahmed S. F., et al. (2024). Microplastics as carriers of toxic pollutants: Source, transport, and toxicological effects. Environ. pollut. 343, 123190. doi: 10.1016/j.envpol.2023.123190
Ridall A., Ingels J. (2022). Seasonal and spatial variations in microplastics abundances in St. Andrew Bay, Florida. Sci. Total Environ. 852, 158422. doi: 10.1016/j.scitotenv.2022.158422
Ritchie H. (2023). - How much plastic waste ends up in the ocean? Published online at OurWorldInData.org. Available online at: https://ourworldindata.org/how-much-plastic-waste-ends-up-in-the-ocean. (accessed March 19, 2024)
Sanford L. P., Maa J. P. Y. (2001). A unified erosion formulation for fine sediments. Mar. Geology 179, 9–23. doi: 10.1016/S0025-3227(01)00201-8
Shi B., Wang Y. P., Wang L. H., Li P., Gao J., Xing F., et al. (2018). Great differences in the critical erosion threshold between surface and subsurface sediments: A field investigation of an intertidal mudflat, Jiangsu, China. Estuarine Coast. Shelf Sci. 206, 76–86. doi: 10.1016/j.ecss.2016.11.008
Shiravani G., Oberrecht D., Roscher L., Kernchen S., Halbach M., Gerriets M., et al. (2023). Numerical modeling of microplastic interaction with fine sediment under estuarine conditions. Water Res. 231, 119564. doi: 10.1016/j.watres.2022.119564
Shruti V. C., Pérez-Guevara F., Kutralam-Muniasamy G. (2021). The current state of microplastic pollution in the world's largest gulf and its future directions. Environ. pollut. 291, 118142. doi: 10.1016/j.envpol.2021.118142
Summers E., Du J., Park K., Kaiser K. (2023). How does buoyancy behavior impact microplastic transport in an estuarine environment? Sci. Total Environ. 899, 165687. doi: 10.1016/j.scitotenv.2023.165687
Summers E., Du J., Park K., Kaiser K. (2024). Quantifying the connectivity of microplastic pollution in the Texas-Louisiana-Texas coastal water. ACS ES&T Water. 4, 2482–2494. doi: 10.1021/acsestwater.3c00839
Teague W. J., Jarosz E., Wang D. W., Mitchell D. A. (2007). Observed oceanic response over the upper continental slope and outer shelf during Hurricane Ivan. J. Phys. Oceanography 37, 2181–2206. doi: 10.1175/JPO3115.1
Umlauf L., Burchard H. (2003). A generic length-scale equation for geophysical turbulence models. J. Mar. Res. 61, 235–265. doi: 10.1357/002224003322005087
van Oldenborgh G., van der Wiel K., Sebastian A., Singh R., Arrighi J., Otto F., et al. (2018). Corrigendum: Attribution of extreme rainfall from Hurricane Harvey. Environ. Res. Lett. 13, 019501. doi: 10.1088/1748-9326/aaa343
van Sebille E., Griffies S. M., Abernathey R., Adams T. P., Berloff P., Biastoch A., et al. (2018). Lagrangian ocean analysis: Fundamentals and practices. Ocean Modeling 121, 49–75. doi: 10.1016/j.ocemod.2017.11.008
Vivekanand A. C., Mohapatra S., Tyagi V. K. (2021). Microplastics in aquatic environment: Challenges and perspectives. Chemosphere 282, 131151. doi: 10.1016/j.chemosphere.2021.131151
Waldschläger K., Schüttrumpf H. (2019a). Erosion behavior of different microplastic particles in comparison to natural sediments. Environ. Sci. Technol. 53, 13219–13227. doi: 10.1021/acs.est.9b05394
Waldschläger K., Scḧttrumpf H. (2019b). Effects of particle properties on the settling and rise velocities of microplastics in freshwater under laboratory conditions. Environ. Sci. Technol. 53, 1958–1966. doi: 10.1021/acs.est.8b06794
Wang Z., Dou M., Ren P., Sun B., Jia R., Zhou Y. (2021). Settling velocity of irregularly shaped microplastics under steady and dynamic flow conditions. Environ. Sci. pollut. Res. 28, 62116–62132. doi: 10.1007/s11356-021-14654-3
Warner J., Sherwood C., Signell R., Harris C., Arango H. (2008). Development of a three-dimensional, regional, coupled wave, current, and sediment-transport model. Comput. Geosci. 34, 1284–1306. doi: 10.1016/j.cageo.2008.02.012
Wayman C., Niemann H. (2021). The fate of plastic in the ocean environment – a minireview. Environ. Science: Processes Impacts 23, 198–212. doi: 10.1039/D0EM00446D
Wessel C. C., Lockridge G. R., Battiste D., Cebrian J. (2016). Abundance and characteristics of microplastics in beach sediments: Insights into microplastic accumulation in northern Gulf of Mexico estuaries. Mar. pollut. Bull. 109, 178–183. doi: 10.1016/j.marpolbul.2016.06.002
Willis K., Eriksen R., Wilcox C., Hardesty B. (2017). Microplastic distribution at different sediment depths in an urban estuary. Front. Mar. Science 4 419. doi: 10.3389/fmars.2017.00419
Wilson N., Meyers S. D., Luther M. E. (2006). Changes in the circulation of Tampa Bay due to Hurricane Frances as recorded by ADCP measurements and reproduced with a numerical ocean model. Estuaries Coasts 29, 914–918. doi: 10.1007/BF02798650
Woodall L. C., Sanchez-Vidal A., Canals M., Paterson G. L., Coppock R., Sleight V., et al. (2014). The deep sea is a major sink for microplastic debris. R. Soc. Open Sci. 1, 140317. doi: 10.1098/rsos.140317
Xie L., Pietrafesa L. J., Wu K. (2003). A numerical study of wave-current interaction through surface and bottom stresses: Coastal ocean response to Hurricane Fran of 1996. J. Geophysical Research: Oceans 108, 3049. doi: 10.1029/2001JC001078
Ye F., Zhang Y. J., Wang H. V., Friedrichs M. A. M., Irby I. D., Alteljevich E., et al. (2018). A 3D unstructured-grid model for Chesapeake Bay: Importance of bathymetry. Ocean Model. 127, 16–39. doi: 10.1016/j.ocemod.2018.05.002
Zhang Y. J., Ateljevich E., Yu H. C., Wu C. H., Yu J. C. S. (2015). A new vertical coordinate system for a 3D unstructured-grid model. Ocean Model. 85, 16–31. doi: 10.1016/j.ocemod.2014.10.003
Keywords: microplastic transport pathways, estuarine export ability, hurricanes, settling velocity, sediment transport model
Citation: Summers E, Du J, Park K, Wharton M and Kaiser K (2024) Importance of the water-sediment bed interactions in simulating microplastic particles in an estuarine system. Front. Mar. Sci. 11:1414459. doi: 10.3389/fmars.2024.1414459
Received: 08 April 2024; Accepted: 14 November 2024;
Published: 05 December 2024.
Edited by:
Hernando Bacosa, Iligan Institute of Technology, PhilippinesReviewed by:
Prabhakar Sharma, Nagaland University, IndiaJin Hwan Hwang, Seoul National University, Republic of Korea
Copyright © 2024 Summers, Du, Park, Wharton and Kaiser. This is an open-access article distributed under the terms of the Creative Commons Attribution License (CC BY). The use, distribution or reproduction in other forums is permitted, provided the original author(s) and the copyright owner(s) are credited and that the original publication in this journal is cited, in accordance with accepted academic practice. No use, distribution or reproduction is permitted which does not comply with these terms.
*Correspondence: Emily Summers, ZW1pbHlqYW5lMTIxNUB0YW11LmVkdQ==
 Emily Summers
 Jiabi Du
 Kyeong Park
 Marcus Wharton
 Karl Kaiser