 Ekin Akoglu
 İsmet Saygu
 Nazli Demirel
- 1Department of Marine Biology and Fisheries, Institute of Marine Sciences, Middle East Technical University, Erdemli, Türkiye
- 2Climate Change and Sustainable Development Application and Research Center, Middle East Technical University, Ankara, Türkiye
- 3Department of Fisheries and Seafood Processing Technology, Faculty of Fisheries, Cukurova University, Adana, Türkiye
- 4Faculty of Environment, Science and Economy, University of Exeter, Exeter, United Kingdom
- 5Department of Physical Oceanography and Marine Biology, Institute of Marine Sciences and Management, Istanbul University, Istanbul, Türkiye
Globally, all marine ecosystems are under pressure by anthropogenic stressors. However, semi-enclosed seas are at a greater risk of degradation due to their limited connectivity to open seas. This leads to a greater accumulation of pollutants and abrupt regime shifts triggered by unsustainable exploitation of living resources, as ecosystems exhibit low degrees of redundancy and more frequent large-scale episodic events such as harmful algal blooms. The Sea of Marmara is a semi-enclosed marine region that has been subjected to various anthropogenic stressors since the 1990s. Recently, local and governmental authorities have employed basin-wide ecosystem management plans to control and manage point and nonpoint (diffuse) sources of pollutants. However, the management of fisheries in relation to the dynamics of the Sea of Marmara food web has attracted less attention from policymakers, even though fisheries exploitation is one of the most significant anthropogenic pressures. In this study, we capitalized on a previous static ecosystem model of the Sea of Marmara by revising and extending it to simulate the changes between 1990 and 2020. We delineated the temporal dynamics and regime shifts in the food web in terms of ecosystem structure and function by using ecological indicators and developed quantitative management advice for its fisheries. The results showed that the ecosystem has experienced three regimes since 1990, with regime shifts occurring with the onset of the 2000s and the mid 2010s. The first regime exhibited high diversity and material cycling, the second regime was characterized by low diversity and increased impact of fisheries, and the third regime culminated in a fished-down food web state. The analysis of fishery dynamics showed that the majority of harvested species were overexploited. We suggest that the implementation of quotas for exploited species should be considered an immediate solution to the unsustainable exploitation of fish stocks and can help restore ecosystem conditions.
1 Introduction
Climate change, pollution, and fishing are the three major stressors jeopardizing the global well-being of marine ecosystems (Pauly and Zeller, 2019). Compared with semi-open (e.g., North Sea) and open (e.g., Philippine Sea) seas, semi-enclosed seas, such as the Mediterranean Sea, are more exposed to anthropogenic stressors that negatively affect biodiversity, increase the susceptibility of marine ecosystems to fishing and deteriorate marine habitats (Caddy, 2000; Hidalgo et al., 2018; Ramírez et al., 2018). These ecosystems are characterized by their limited connectivity to the open sea, which predisposes them to accumulation of pollutants, overexploitation of resources, and occurrence of large-scale episodic events such as harmful algal blooms (Oguz and Su, 2004). Furthermore, stressors can exert cascading effects on marine food webs and initiate abrupt regime shifts, i.e., rapid changes in the structure and function of ecosystems, with catastrophic consequences (Möllmann et al., 2011). When multiple stressors act concomitantly and/or sequentially, the extent of cascading effects can culminate in regime shifts, such as the infamous anchovy collapse in the Black Sea in 1989 (Daskalov, 2002; 2003; Oguz and Gilbert, 2007; Oguz et al., 2008). These phenomena highlight the urgent need for effective management and conservation strategies, particularly for semi-enclosed seas.
Ecosystem-based management (EBM) emphasizes holistic planning of human activities to preserve ecosystem integrity, ensure the sustainable delivery of ecosystem services and maintain biodiversity (Haugen et al., 2024). This approach is necessitated by the escalating impacts of human actions on ecosystems, challenging the resilience of natural systems and their capacity to support human needs (Folke et al., 2016). Within the context of EBM, modeling tools are invaluable for simulating ecosystem dynamics, assessing the implications of various management decisions and predicting responses to environmental changes and anthropogenic pressures (Fulford et al., 2020). Furthermore, ecological indicators, which are important proxies of ecosystems because they combine multiple aspects of the structure and function of food webs, are considered easily interpretable metrics of complicated ecosystem-level data (Smit et al., 2021) and can delineate changes in marine ecosystems under the influence of ecosystem-wide stressors and regime shifts. Therefore, indicator-based ecosystem assessment is the suggested method for achieving EBM and ecosystem-based fisheries management (EBFM; Pikitch et al., 2004). Ecopath with Ecosim (EwE; Christensen et al., 2005) is one of the most widely used ecosystem models for analyzing and simulating energy flows in ecosystems under different scenarios. EwE aids in understanding the effects of fishing, changes in trophic interactions in the food web, and the impacts of anthropogenic activities on ecosystem structure and function (e.g., Piroddi et al., 2017; Akoglu, 2023). In addition, EwE facilitates the computation of various ecological indicators for modeled ecosystems (e.g., Craig and Link, 2023 and references therein). Therefore, EwE can help stakeholders make informed decisions to achieve sustainable resource use and conserve ecosystem health by providing insights into the potential outcomes of management strategies (Keramidas et al., 2023).
The Sea of Marmara (SoM), located in the Northeastern Mediterranean, is an important ecological passage connecting the Aegean and Black Seas. Thus, the rich biodiversity and productive waters of the SoM are characterized by a wide variety of marine species, positioning it as an economically important area (Ulman et al., 2020). For centuries, it has served as a critical nexus for the development of civilizations, most notably evidenced by the establishment of Istanbul along its shores. Today, SoM lies at the heart of Turkey’s most densely populated region and serves as a fulcrum for industrial and commercial activities. Thus, SoM experiences pollution from domestic and industrial effluents (Burak et al., 2009), eutrophication due to nutrient enrichment from agricultural activities (Albay, 2023), and overfishing (Gul and Demirel, 2016; Demirel et al., 2020; Ulman et al., 2020). Furthermore, climate change-related global warming has increased the average sea surface temperatures in the SoM since 1970 and has facilitated the increased establishment of Indo-Pacific species (Turan and Gürlek, 2016), which has changed food web dynamics, a phenomenon known as the Mediterranization of the Marmara and Black Seas (Oğuz and Öztürk, 2011). Consequently, regime shifts were also observed in the SoM (Demirel et al., 2023a). The SoM region is densely populated, and urban and industrial wastes cause intensive pollution (Burak et al., 2009). This basin-wide pollution causes significant deoxygenation and leads to habitat contraction in the water column, driving demersal species to deeper areas where the impact of the more oxygenated Mediterranean waters is pronounced (Kabasakal et al., 2023) and confining pelagic species to the narrow oxygen-saturated upper layer.
SoM fish stocks are at risk of overexploitation (Tsikliras et al., 2015), similar to 80% of fish stocks in the Mediterranean Sea (Froese et al., 2018). Recent stock assessments have found that almost all commercially exploited fish species in the SoM were overexploited, and sardine and horse mackerel were fished at their maximally sustainable levels (Demirel et al., 2020). Studies that applied indirect methods to calculate fishing mortalities also found that whiting and bluefish had high exploitation rates at levels of overexploitation (Akyol and Ceyhan, 2007; Karadurmuş, 2022). Hake, an iconic fish species in the SoM that was once abundant in catches, had almost disappeared as of 2017 (Demirel et al., 2022). Considering the status of the SoM fish species, the need for immediate action for their sustainable utilization is undisputed.
To date, fisheries, ecosystem dynamics, and historical regime shifts in SoM have been studied using statistical stock assessment models and time series of environmental parameters (Demirel et al., 2020; 2023a), traditional knowledge and anecdotal information (Ulman et al., 2020), and a mass balance food web model (Saygu et al., 2023). As precautionary measures against regime shifts and stock collapse, various fishing and environmental management policy options have been proposed (Demirel et al., 2023b), such as reducing fishing effort (Koyun et al., 2022; Yildiz et al., 2023), decreasing the fishing mortality of stocks (Demirel et al., 2020), increasing the selectivity of fishing gear (Yıldız et al., 2020; Gül and Demirel, 2021), revising minimum landing sizes (Yildiz and Ulman, 2020), establishing temporal fishing bans (Yıldız et al., 2020), and shifting the fishing season (Demirel et al., 2023a). However, management advice based on an ecosystem-wide assessment that capitalizes on a time series of ecological indicators using a temporal food web model is lacking. Therefore, in this study, we aimed to i) develop the first temporal food web model of the SoM; ii) determine historical regime shifts by investigating the changes in the structure and function of the SoM ecosystem and its fisheries using ecological indicators derived from ecological network analysis; iii) develop quantitative fisheries management advice considering prey-predator interactions in the food web in addition to fisheries dynamics to aid in the sustainability of the entire SoM ecosystem; and iv) test the viability of the suggested fishing policy measures using the temporal model.
2 Materials and methods
The Sea of Marmara is a semi-enclosed sea with narrow connections to the Mediterranean and Black Seas through two narrow straits (Figure 1). The SoM has a stratified two-layer water structure separated by a strong halocline at 20-25 m (Uysal, 2006). The sub-halocline layer consists of oxygen-rich Mediterranean Sea waters that enter the SoM through the Dardanelles Strait and travel to the Black Sea at the bottom, whereas the supra-halocline layer consists of Black Sea waters that enter the SoM through the Bosphorus Strait and travel to the Mediterranean Sea at the surface (Beşiktepe et al., 1994). This two-layer structure facilitates the cooccurrence of both the Mediterranean and Black Sea species in the SoM and also makes it a pathway for introductions and geographical expansions of alien and indigenous species. The SoM covers an area of 11,500 km², featuring three deep basins (greater than 1,000 m) in the north and a broad shelf region (less than 100 m deep) in the southern half of the basin.
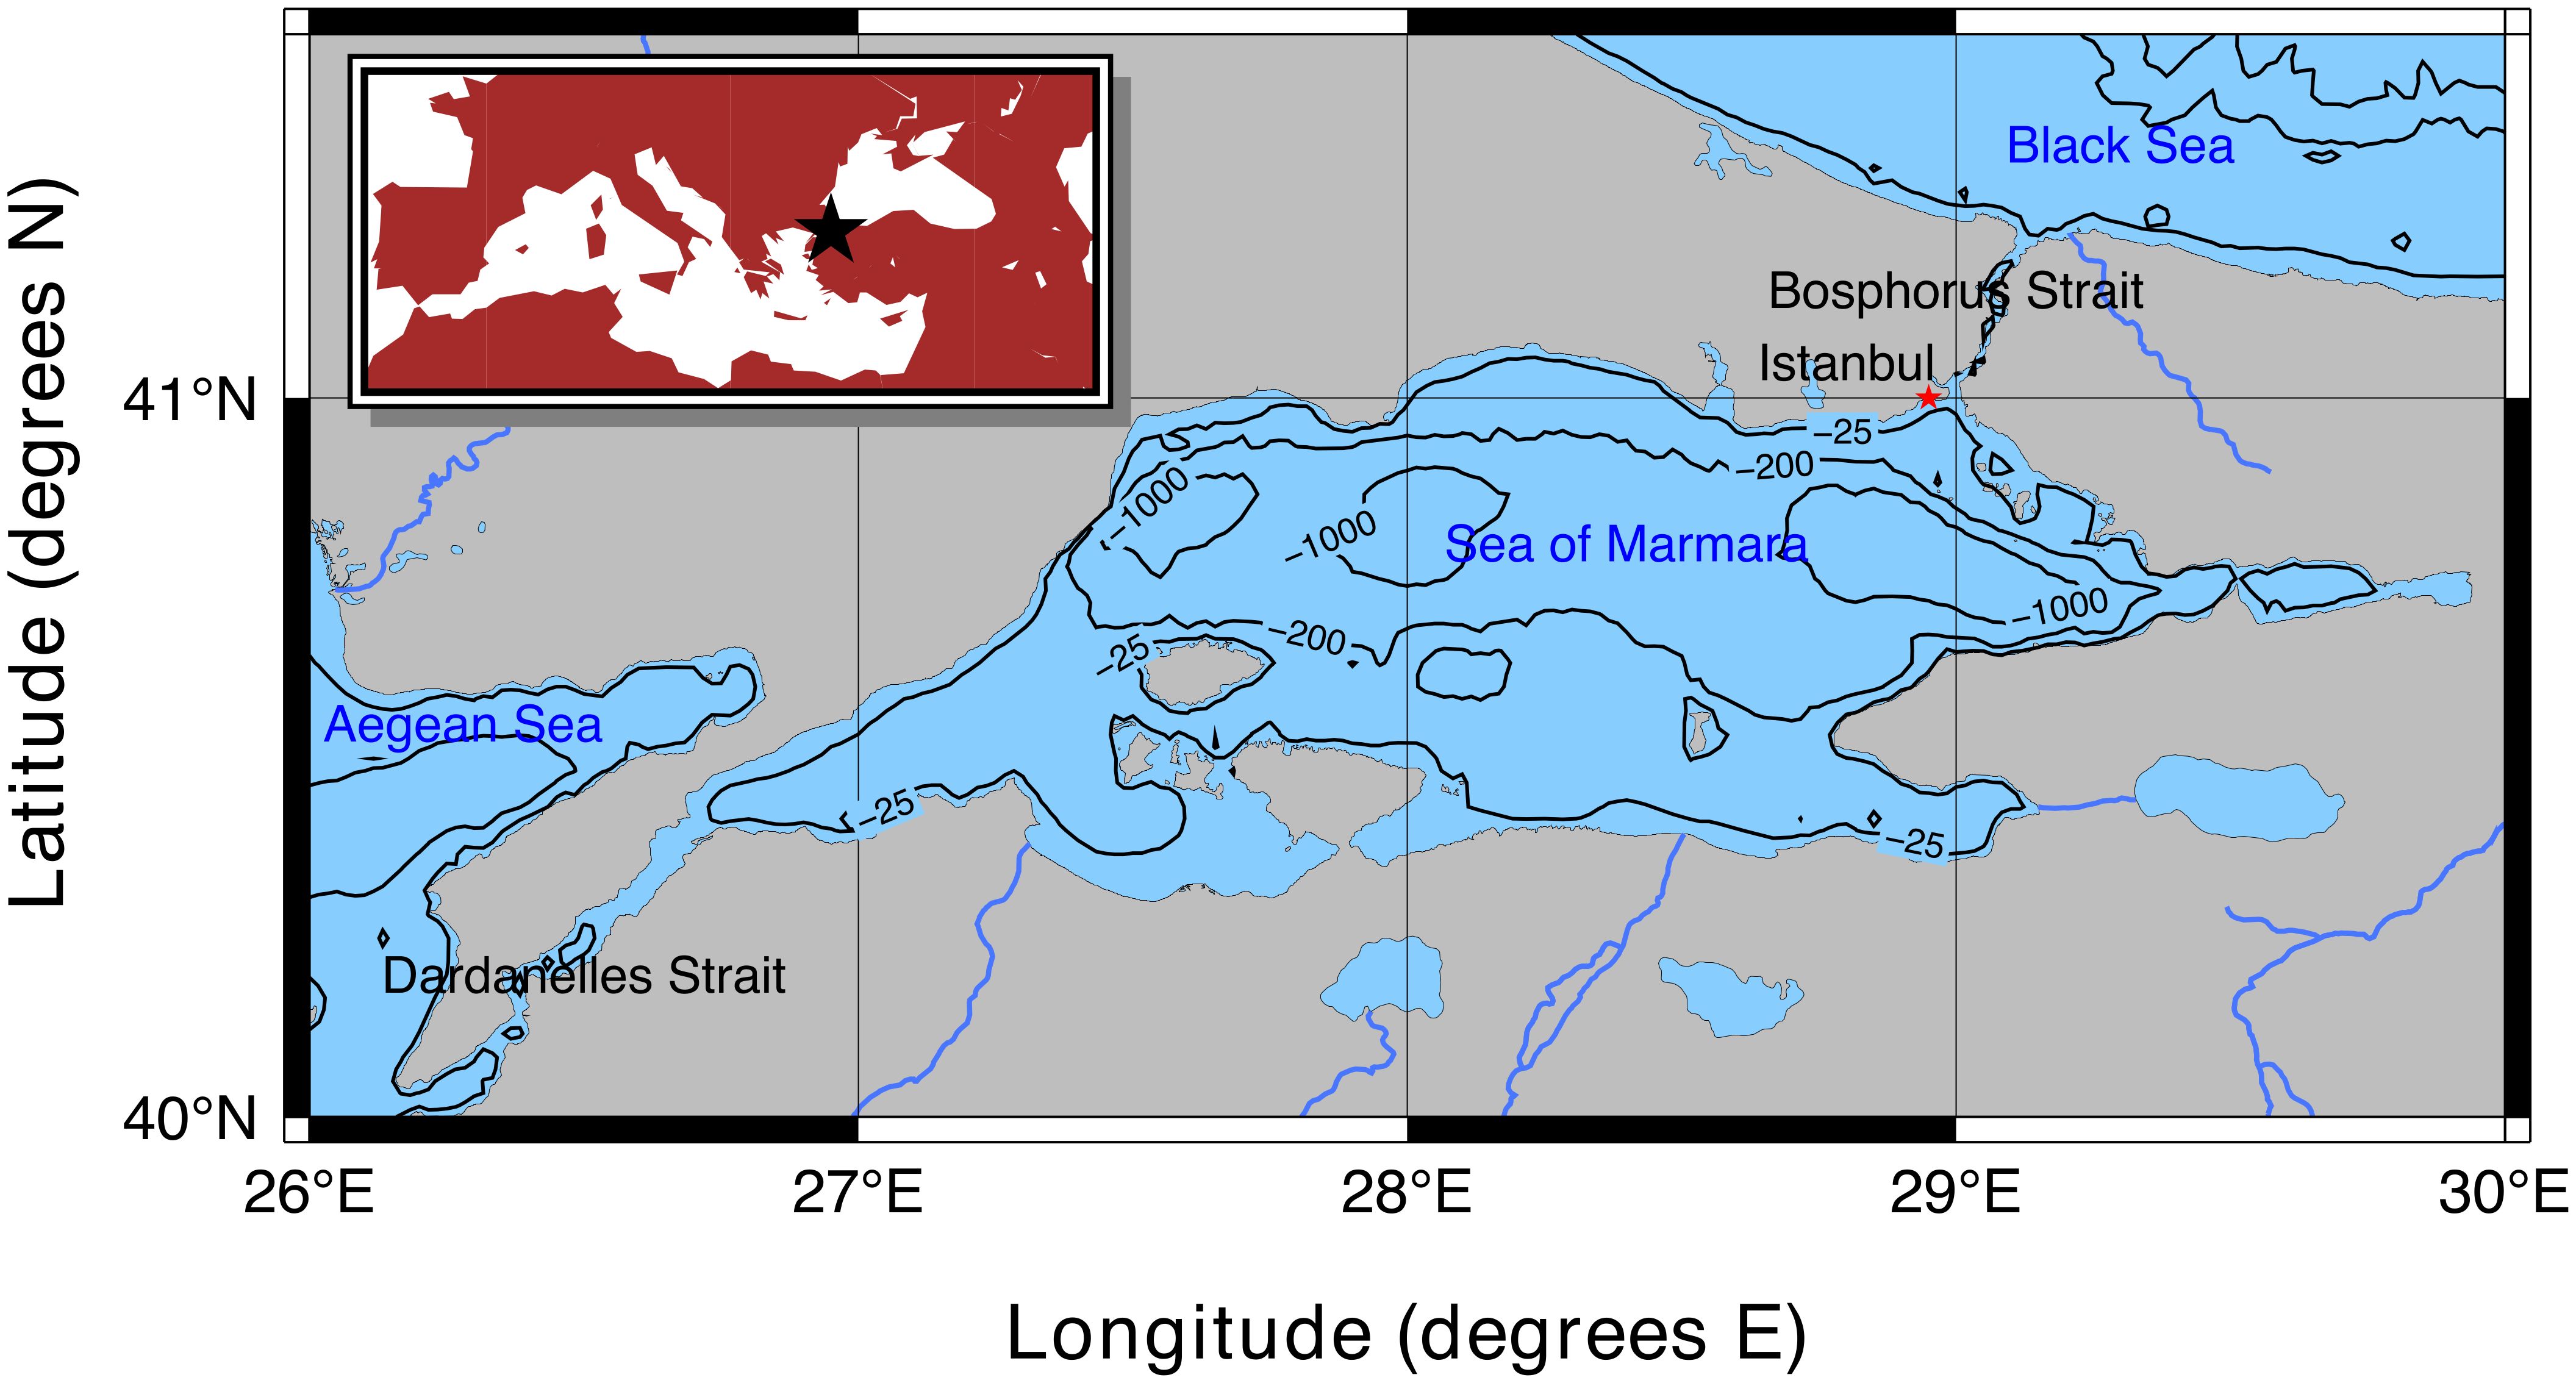
Figure 1. Map of the Sea of Marmara and its location in the Mediterranean Basin with respect to the European and Asian continents (denoted by a black star, top-left inset map).
Fishing practices in the SoM are predominantly inshore, targeting benthic and demersal species with beam trawls. A significant seasonal pelagic fishery using purse-seines, in line with the migration of Atlantic bonito and bluefish between the Black Sea and the Aegean Sea (Zengin and Güngör, 2017), marks a period of increased fishing activity (Koyun et al., 2022). Of the 64 commercially targeted fish and invertebrate species, a significant proportion of the catch, occasionally up to 90%, is dominated by European anchovy, Mediterranean horse mackerel, deep-water rose shrimp, European pilchard, bluefish, Atlantic bonito, whiting, and European hake (Saygu et al., 2023).
2.1 The model
The trophodynamic model Ecopath with Ecosim (Christensen et al., 2005) version 6.6.8 was used to simulate the changes in the SoM ecosystem from 1990 to 2020. Ecopath with Ecosim (EwE) is a modelling package that consists of three modules: i) Ecopath, the static module that provides a mass-balanced snapshot of the ecosystem’s food web in a given period; ii) Ecosim, the dynamic module for temporal simulations; and iii) Ecospace, the two-dimensional spatiotemporal module for spatially explicit temporal simulations. In this study, we used the Ecopath module to establish a model of the SoM ecosystem for the early 1990s (1990-1992). Subsequently, a temporal Ecosim simulation was conducted and validated against time-series data. The equations of the Ecopath with Ecosim model used in this study are provided in the Supplementary Material.
In this study, we updated and used a previously published Ecopath model of SoM (Saygu et al., 2023) to establish a basis for the temporal SoM Ecosim model. The model consisted of 17 functional groups; phytoplankton as primary producers, mesozooplankton, benthic invertebrates (polychaetes, amphipods, isopods and cumaceans), deep-water rose shrimp (Parapenaeus longirostris Lucas, 1846), European anchovy (Engraulis encrasicolus Linnaeus, 1758), European pilchard (Sardina pilchardus Walbaum, 1792), Mediterranean horse mackerel (Trachurus mediterraneus Steindachner, 1868), mullets (Mullus barbatus Linnaeus 1758 and Mullus surmuletus Linnaeus 1758), turbot (Scophthalmus maximus Linnaeus, 1758), whiting (Merlangius merlangus Linnaeus, 1758), European hake (Merluccius merluccius Linnaeus, 1758), bluefish (Pomatomus saltatrix Linnaeus, 1766), Atlantic bonito (Sarda sarda Bloch, 1793), thornback ray (Raja clavata Linnaeus, 1758), spiny dogfish (Squalus acanthias Linnaeus, 1758), dolphins (Tursiops truncatus Montagu, 1821 and Delphinus delphis Linnaeus, 1758) and detritus. The Ecopath model by Saygu et al. (2023) represented the mid-90s (1993-1997); therefore, it was updated and reparametrized to represent the conditions of the early 1990s between 1990-1992 capitalizing on the work by Demirel et al. (2020). First, the biomass values were updated to represent the conditions of the early 1990s. Fishing mortalities show significant annual variations; therefore, as a second step, the P/B values were updated as they were the sum of fishing mortalities (F) and natural mortalities (M) since P/B is assumed to be equal to Z, which is equal to the sum of F and M, under steady state conditions (Allen, 1971). Finally, after the reparameterization of the P/B values, certain Q/B values were increased, considering the P/Q (gross growth efficiency) values, which usually range between 0.1 and 0.3, according to the best practices in Ecopath modelling (Heymans et al., 2016). The original SoM Ecopath model included three fishing fleets commonly used in the SoM, but due to the lack of time-series effort data and gear-specific fishing mortality estimates, we had to combine the three fleets into a single fleet. The revised SoM Ecopath model was evaluated using the pedigree routine, which assigns uncertainty ranges between 0 and 1 depending on the uncertainty of the data used, and the pre-balance diagnostics (PREBAL) analysis (Link, 2010). The specifics of the SoM Ecopath model are already available in the literature; therefore, we have avoided a detailed description and only provided information regarding the modifications. The initial conditions and parameters of the updated SoM Ecopath model for the early 1990s are listed in Supplementary Table 1.
Time series of fishing mortalities or effort, and primary production anomalies are required to drive an Ecosim simulation, and time series of reference biomass and catch values are required for model validation. Here, we capitalized on the time series of absolute statistical catches (Turkstat, 2023) and absolute biomass values from statistical stock assessments to validate the catches and biomasses of fish groups/species simulated by the model. We used a time series of fishing mortalities obtained from stock assessments to drive the dynamics of fished groups in the temporal simulation (Demirel et al., 2020). The basin-averaged time series of zooplankton and phytoplankton absolute biomass values were obtained from the Inter-Sectoral Impact Model Comparison Project (ISIMIP) products by capitalizing on the physical Geophysical Fluid Dynamics Laboratory Modular Ocean Model and biogeochemical COBALT2 model (GFDL-MOM6-COBALT2) simulations for observation-based climate oceanic conditions (Liu et al., 2022) and were used to validate and parameterize mesozooplankton and phytoplankton groups. GFDL-MOM6-COBALT2 zooplankton and phytoplankton outputs had a 15-arcminute resolution and were available until 2010. First, zooplankton and phytoplankton biomasses were interpolated onto a 4 × 4 km grid in SoM with Climate Data Operators (CDO; Schulzweida, 2023) using an inverse distance-weighted interpolation algorithm, and the basin-averaged annual zooplankton and phytoplankton biomasses were calculated for the SoM Ecosim model period. Remote-sensing primary productivity measurements obtained from the Copernicus Marine Environmental Monitoring Service (CMEMS) were used to drive the primary production of phytoplankton group in the SoM Ecosim model relatively. The CMEMS primary productivity product is a multisensor product with a resolution of 4 × 4 km and is interpolated both in space and in time. Basin-wide annual primary productivity anomalies were calculated for the simulation period in SoM. The CMEMS primary productivity product dates back to September 1997, and does not cover the period back to 1990. Therefore, time series of monthly primary productivities were hindcasted to 1990 using “forecast” package (Hyndman and Khandakar, 2008) in R (R Core Team, 2023) before basin- and annual-averaged anomalies were calculated.
Stepwise fitting approach was used to calibrate the SoM Ecosim model (Scott et al., 2016), capitalizing on the automated time series fitting routine of Ecosim. The model with the lowest adjusted Akaike Information Criterion value for small sample sizes (AICc; Akaike, 1974) was selected as the optimized model. The time series of biomasses and catches simulated by the model was compared with the reference biomass and catch values to assess the model skill. Finally, the simulated biomass and catch data were compared with the reference biomass and catch data using Taylor diagrams (Taylor, 2001). Taylor diagrams combine three important metrics of model performance with respect to reference data and show correlations between the simulated and reference values, the root mean square errors/distances (RMSD) of the simulated values with respect to reference data, and their normalized standard deviations. In addition, we included the model bias in the Taylor diagrams to show the cumulative error of the simulated biomasses and catches normalized by the reference biomass and catch values.
2.2 Ecological network analysis and regime shifts
The time series of ecological indicators were calculated from the dynamic Ecosim simulation outputs using the Ecological Network Analysis routine of EwE. The time series of the total system throughput (TST), which is the sum of all flows in the food web, relative ascendancy (A/C), and relative overhead (O/C), indicating the organizational status and resistance of the ecosystem against perturbations, respectively, were analyzed as macro-ecosystem indicators. A/C and O/C are relative indicators that complement each other and indicate the trade-off between the recovery capacity of an ecosystem (i.e., ascendancy) and its strength against perturbations (i.e., resilience). In a healthy ecosystem, a balance between A/C and O/C is desirable (Costanza and Mageau, 1999). The changes in the primary production (PP) were also investigated. Considering recycled flows in the food web, Finn’s cycling index (FCI), which shows the recycled part of the TST (Finn, 1976); the predatory cycling index (PCI), which shows the recycled part of the TST excluding the detrital compartments; the path length (PL), which shows the average number of groups a unit of flow travels in the food web (Finn, 1976); and the proportion of flows going to detritus (PFD), which shows the flows that were diverted back to detritus by means of mortality and defecation fluxes, were calculated. In a healthy ecosystem, the values of FCI, PCI, and PL are expected to be high, whereas the value of PFD is expected to be low (Odum, 1969).
Shannon’s diversity index was used to assess diversity changes in the food web (Shannon, 1948). The time series of the mean trophic level of the catch (mTLc) was calculated to demonstrate the impact of fisheries on the ecosystem. Fisheries prioritize the exploitation of high trophic level (HTL) species at first; however, as the stocks of these species deplete over time, low trophic level (LTL) species become dominant in the catch, a phenomenon known as “fishing down the food web” (Pauly et al., 1998). Therefore, a decrease in mTLc may indicate unsustainability of fisheries. Furthermore, the time series of the Fishing in Balance (FiB) index, which shows the changes in fishing capacity and catches and indicates the ecological impact of fisheries considering the trophic level spectrum of the exploited species, was also used (Pauly and Watson, 2005). FiB can increase when an increase in technological development or geographical expansion of fisheries occurs or when new HTL species are included in the catches. However, the value of FiB can decrease when stocks collapse or fisheries increasingly target LTL, as HTL species become depleted over time. If a decrease in mTLc is matched with an increase in catch, or vice versa, FiB does not change. The relative primary production required to sustain catches (%PPRc) was also calculated to assess the footprint of fisheries in the ecosystem (Pauly and Christensen, 1995). %PPRc shows how much of the ecosystem’s primary productivity is required to produce the harvest by the fisheries. Furthermore, the biomass ratios of predatory fish to forage fish, demersal and cartilaginous fish to other fish, predatory and cartilaginous fish to pelagic fish, and fish to invertebrates were calculated because these ratios indicate proportional levels of organisms in the food web and are expected to be high in well-functioning, diverse, and sustainably exploited ecosystems (Shannon et al., 2009).
A sequential t-test analysis for the detection of regime shifts (STARS) was conducted on the anomalies of the time series of the ecological indicators to detect historical regime shifts (Rodionov, 2004). Time-series outputs from model simulations are generally hampered by autocorrelation; therefore, a prewhitening procedure using ordinary least squares was used before shift detection. Considering the decadal changes in SoM, a 9-year cut-off length with a significance level of 0.05 was used to detect ecosystem shifts. Furthermore, the time series of the ecological indicator anomalies were analyzed using principal component analysis (PCA) (Abdi and Williams, 2010). PCA is a dimensional reduction method used to investigate the variables that explain most of the variability in a given dataset and correlate them. The number of principal components to be retained was determined based on the empirical Kaiser criterion (Braeken and Van Assen, 2017).
2.3 Equilibrium analysis and fishing policy assessment
Maximum sustainable yield (MSY) values and their corresponding fishing mortalities (FMSY) for fished groups/species in the model were calculated by conducting an “equilibrium analysis” with EwE’s “FMSY” routine under a full compensation ecosystem scenario, that is, considering the prey-predator interactions in the food web as well as the consequences of fisheries exploitation by capitalizing on a long-term Ecosim simulation (Walters et al., 2005). The “FMSY” routine calculates MSY values for exploited species/groups by running simulations without time-series data and applying increasing levels of fishing mortalities on exploited species/groups sequentially, while other exploited groups are fished at their base fishing mortality rates in Ecopath, and trophic interactions between the groups/species are allowed. The analysis identifies a calculated MSY value for a group/species as valid if other fished groups/species and prey-predator interactions are maintained in the ecosystem. Finally, we tested the effect of the calculated FMSY values using a long-term equilibrium simulation with Ecosim by applying the calculated FMSY values to their respective fish stocks, and evaluated the stock-level responses of fishing policy by assessing the biomass and catch values when all the biomasses and catches of all the groups/species in the model reached equilibrium.
3 Results
3.1 Model skill
The pedigree of the revised Ecopath SoM model was 0.41 and equal to that reported by Saygu et al. (2023). The PREBAL diagnostics showed that the biomasses of demersal fishes could be underestimated, whereas the biomasses of plankton groups and European hake could be overestimated (Supplementary Figure 1). PREBAL diagnostics of P/B values indicated possible overestimation for plankton groups. Considering Q/B values, dolphins and mesoplankton could be overestimated, whereas demersal groups could be underestimated.
The results of the calibration procedure are given in Supplementary Table 2. Incorporating fishing mortalities to drive fishery dynamics improved the model fit by almost 100% compared with the baseline model. Incorporating trophic effects increased model fit by an additional 50%. Finally, the model fit improved by 6% when primary productivity anomalies were included. The lowest AICc score was -738.4 and belonged to the model with time series of primary production anomalies, fishing mortalities, and trophic interactions; therefore, it was selected as the best model. Comparisons of simulated biomasses and catches with reference time-series data are shown in Supplementary Figures 2, 3, respectively. Simulated biomasses of European pilchard, mullets, turbot, whiting, spiny dogfish, and thornback ray, and the simulated catches of European pilchard, Mediterranean horse mackerel, mullets, turbot, whiting, spiny dogfish, and thornback ray aligned with the stock assessment predicted biomasses and statistical catch data.
Taylor diagrams showed that RMSD values were lower than or close to 1.0 for biomasses except European anchovy and mesozooplankton and were close to or lower than 1.0 for catches (Figure 2). The RMSD values of the simulated biomasses of deep-water rose shrimp, European pilchard, Mediterranean horse mackerel, mullets, turbot, whiting, and spiny dogfish, and the RMSD values of the simulated catches of mullets, spiny dogfish, and thornback ray were close to or lower than 0.5, indicating good performance of the model specifically for these species/groups. The correlations of simulated biomasses and catches with reference data were above 0.8 and 0.6, respectively, for the majority of the groups/species.
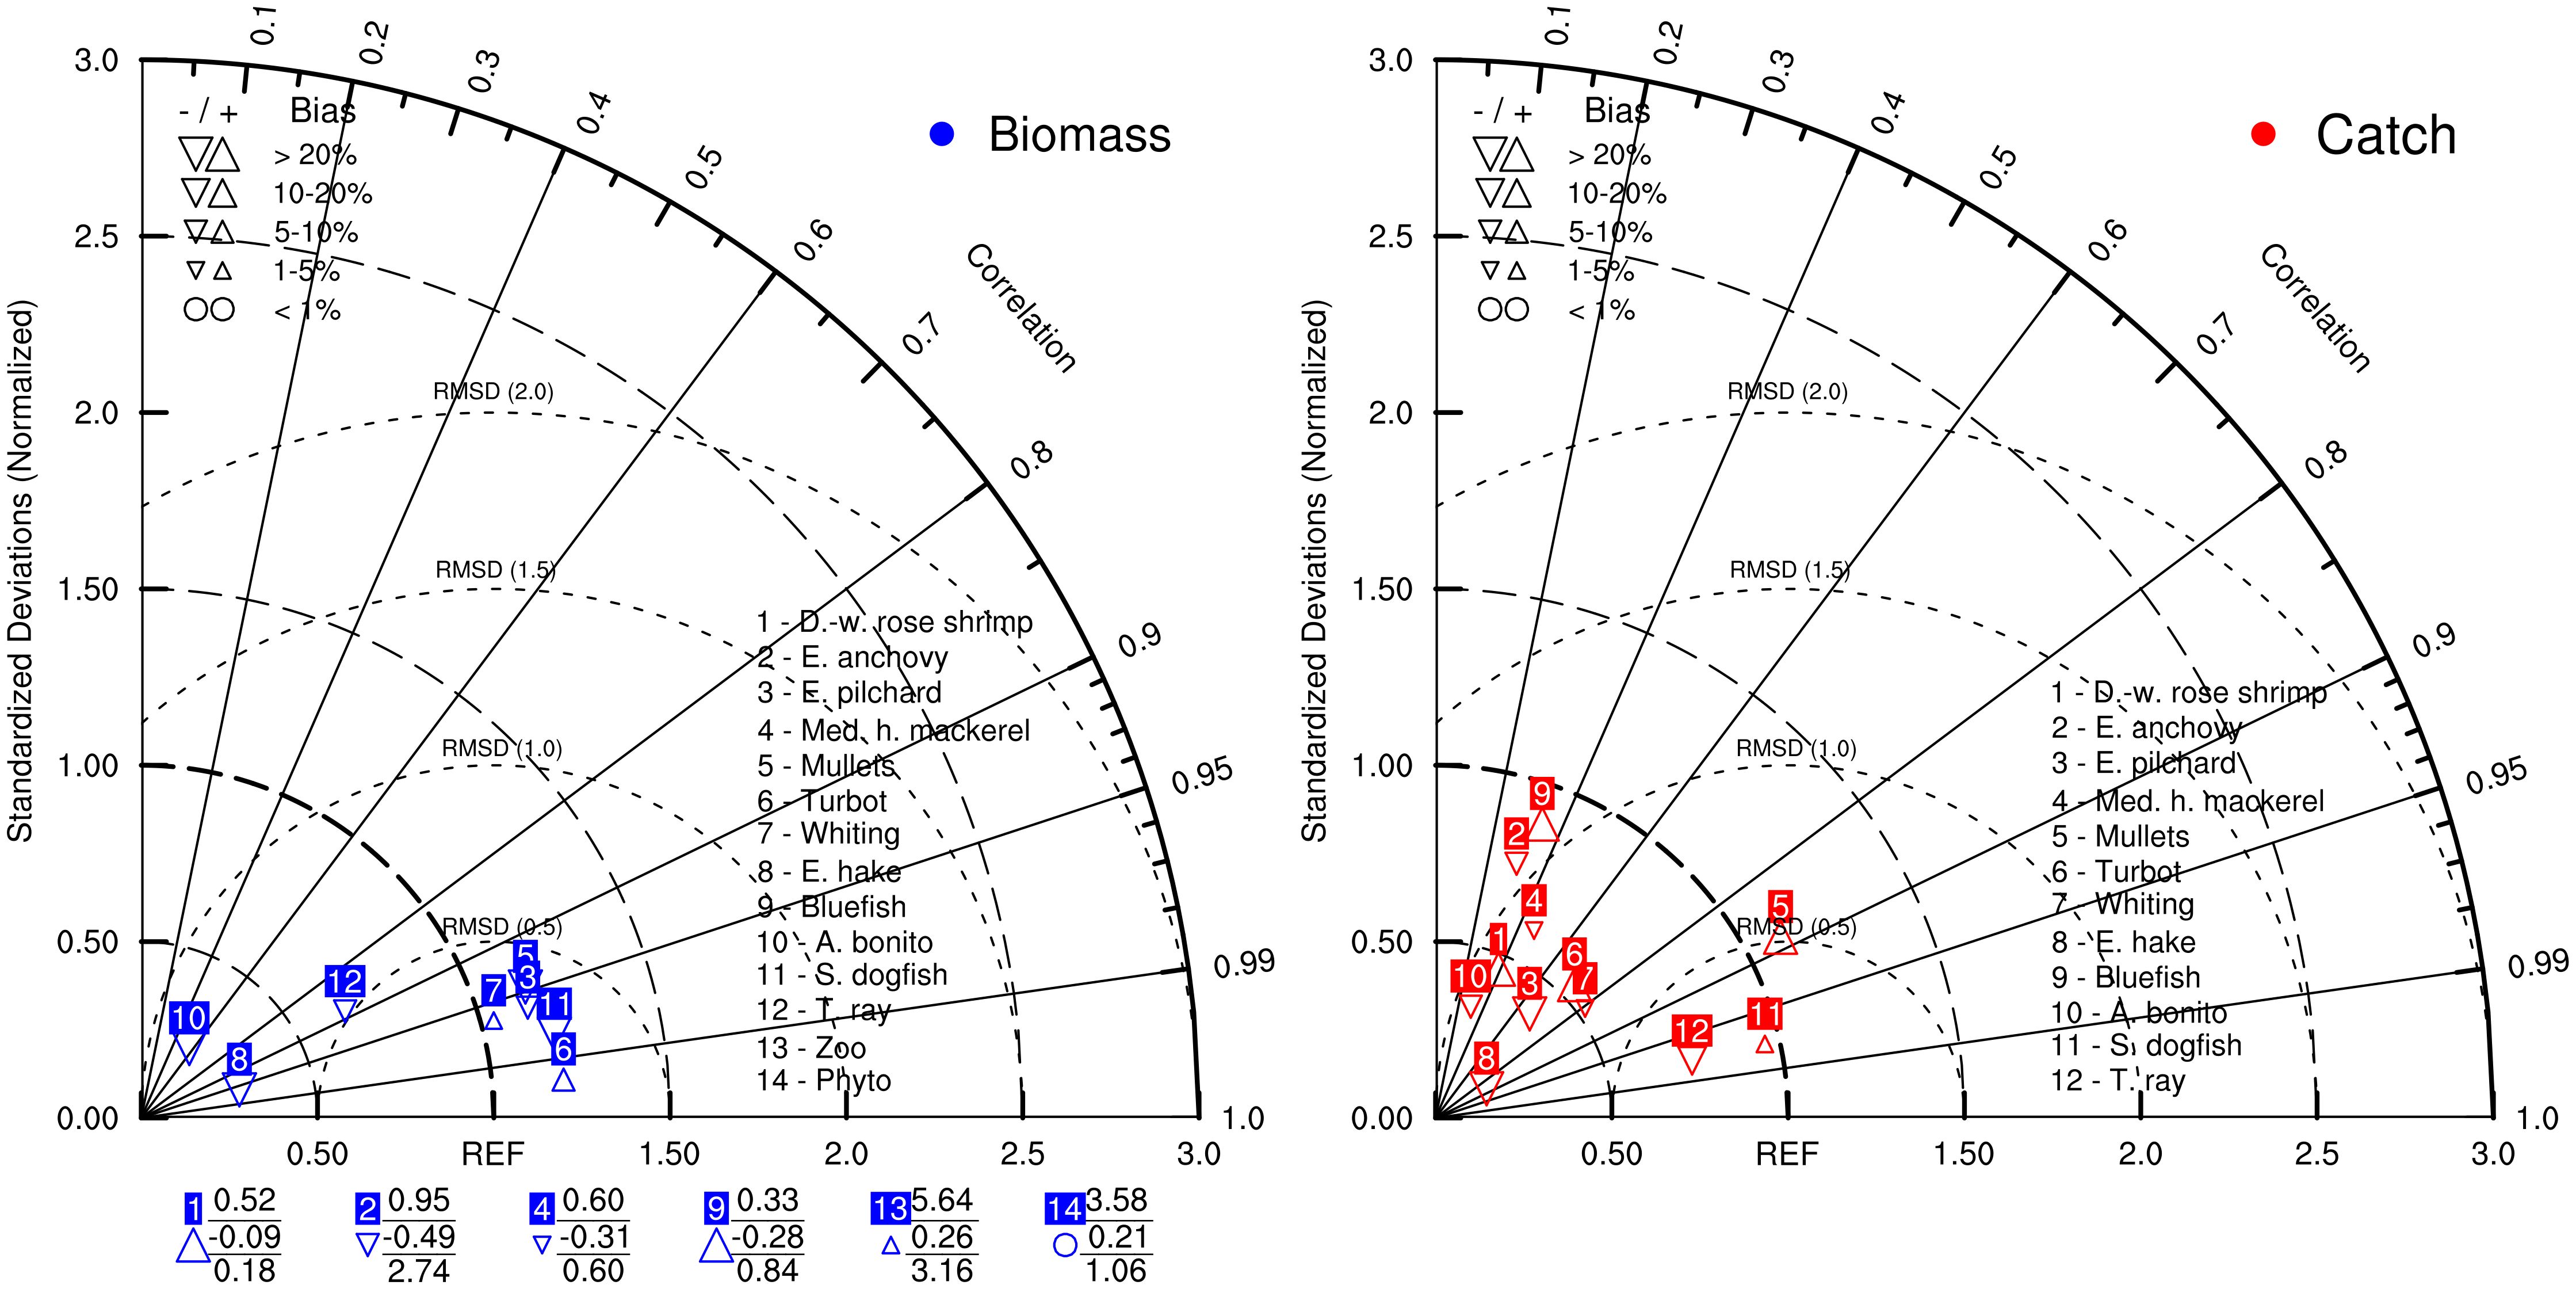
Figure 2. Taylor diagrams showing the model skill considering simulated biomasses (left) and catches (right) with respect to stock assessment predicted biomasses and statistical catch data. Numbers below the Taylor diagram of biomasses indicate groups with either standard deviations greater than three (top) or negative correlations with reference data (middle); root mean square errors/distances (RMSD) values (bottom).
3.2 Ecological network analysis and regime shifts
The STARS analysis detected regime shifts in the majority of the ecological indicators (Figure 3), with two or three regimes in the SoM since 1990. The macroecosystem indicators TST and PP showed three regimes, separated by upward and downward shifts in 2002 and 2016, respectively. A/C and O/C experienced two contrasting shifts in 2003 and 2016, respectively. The cycling indicators FCI and PL showed decreasing shifts in 2002 and 2003, respectively, and did not show any shifts afterwards, whereas PCI showed an increasing shift in 2002 and a downward shift in 2016. STARS did not detect any regime shift in the PFD. The catch and biomass indicators showed positive shifts in 2002 and 2003, respectively, while both indicators showed a final negative shift in 2016. In 1999, a downward shift was detected in the Shannon diversity index. Among the fishery-related indicators, the mTLc showed a decreasing shift in 2016, and the FiB showed an increasing shift in 1998 and a decreasing shift in 2016, which coincided with the decreasing shifts in catch and biomass in 2016. %PPRc showed one upward shift in 1998. Considering community-related indicators, i.e., biomass ratios of functional groups in the ecosystem, STARS analysis detected downward shifts in the biomass ratios of predatory fish to forage fish, predatory and cartilaginous fish to other fish, and fish to invertebrates in 2000 and demersal and cartilaginous fish to pelagic fish in 1999. In 2016, STARS detected an additional upward shift in the ratio of demersal and cartilaginous fish to pelagic fish.
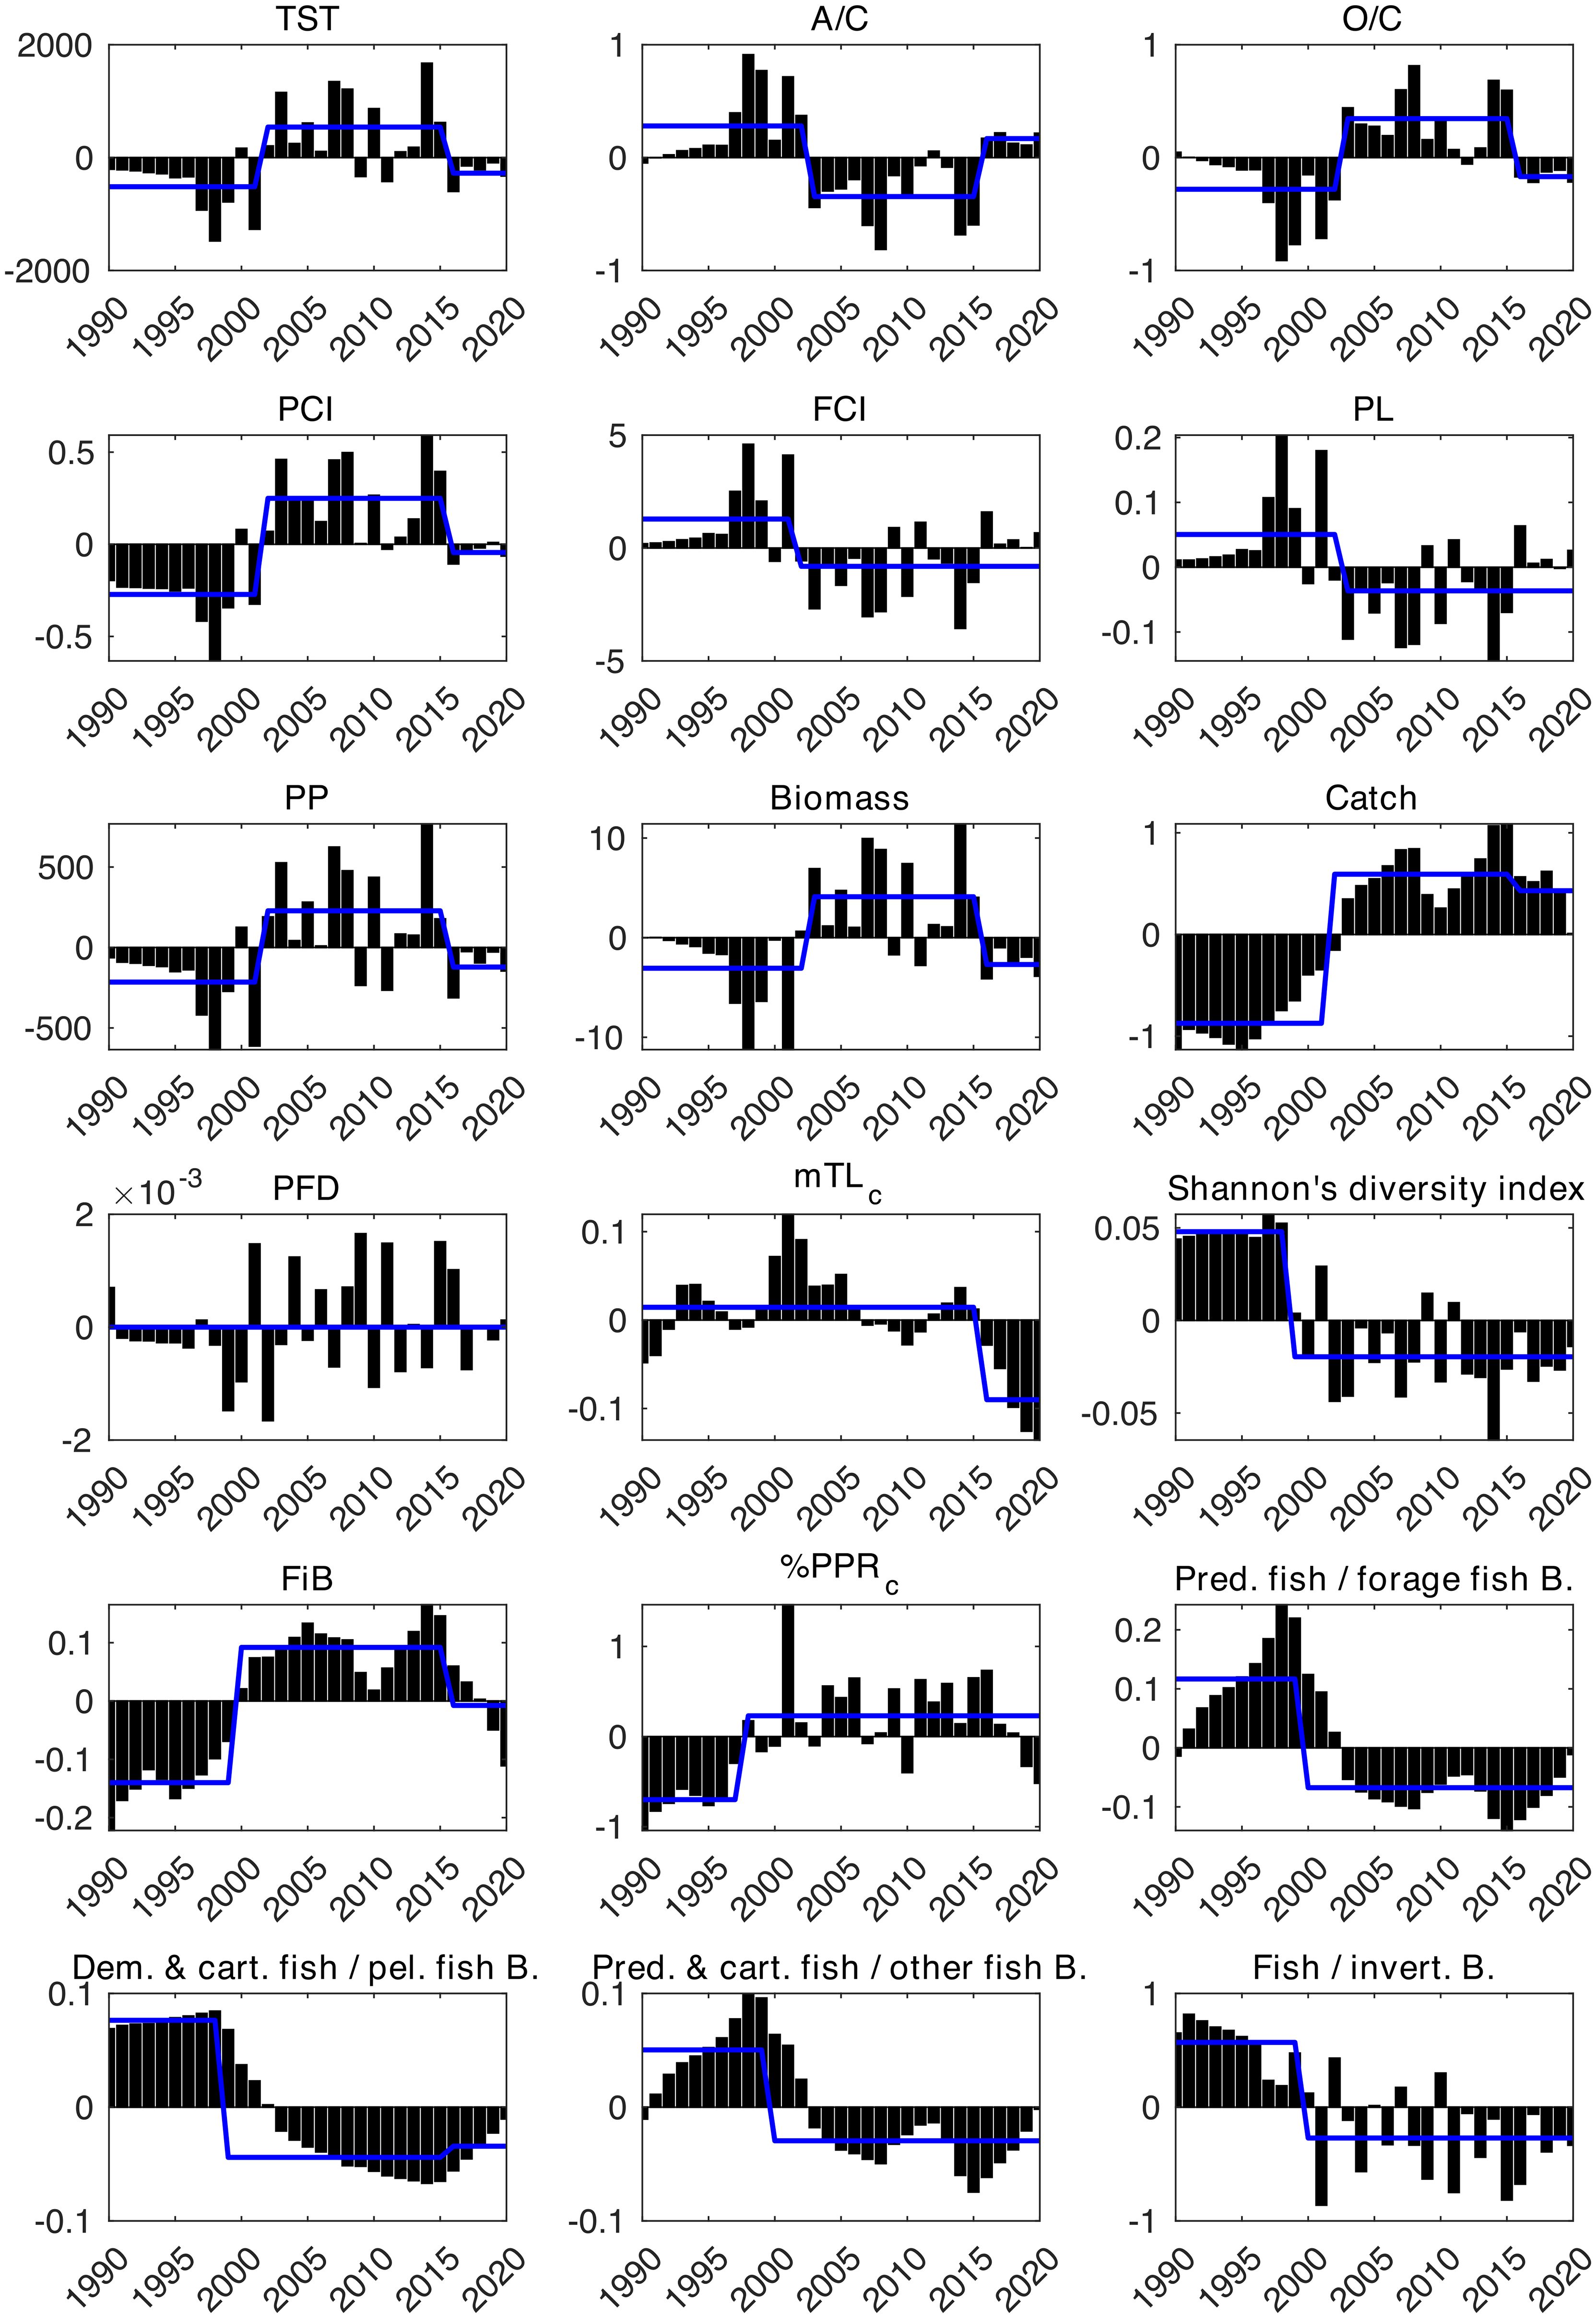
Figure 3. Results of STARS analysis of time-series anomalies of ecological indicators. The bars represent anomaly values, and the blue lines show different regimes.
According to the empirical Kaiser criterion, only two principal components were retained. The first two principal components explained 82% of the variability in the data. PCA of the indicator anomalies showed a temporal separation of the indicators before the 2000s and after the 2000s in the SoM (Figure 4). The 1990s were characterized by high values of A/C, FCI, PL, Shannon’s diversity index, and biomass ratios of predatory and cartilaginous fish to other fish, predatory fish to forage fish, and demersal and cartilaginous fish to pelagic fish. The 2000s and the 2010s were grouped closer together, mostly on the opposite side of the 1990s, and were characterized by higher values of TST, O/C, PP, PCI as well as biomass, catch, and FiB indicators. The 2000s spread between the 1990s and the 2010s but were more closely aligned with the 2010s.
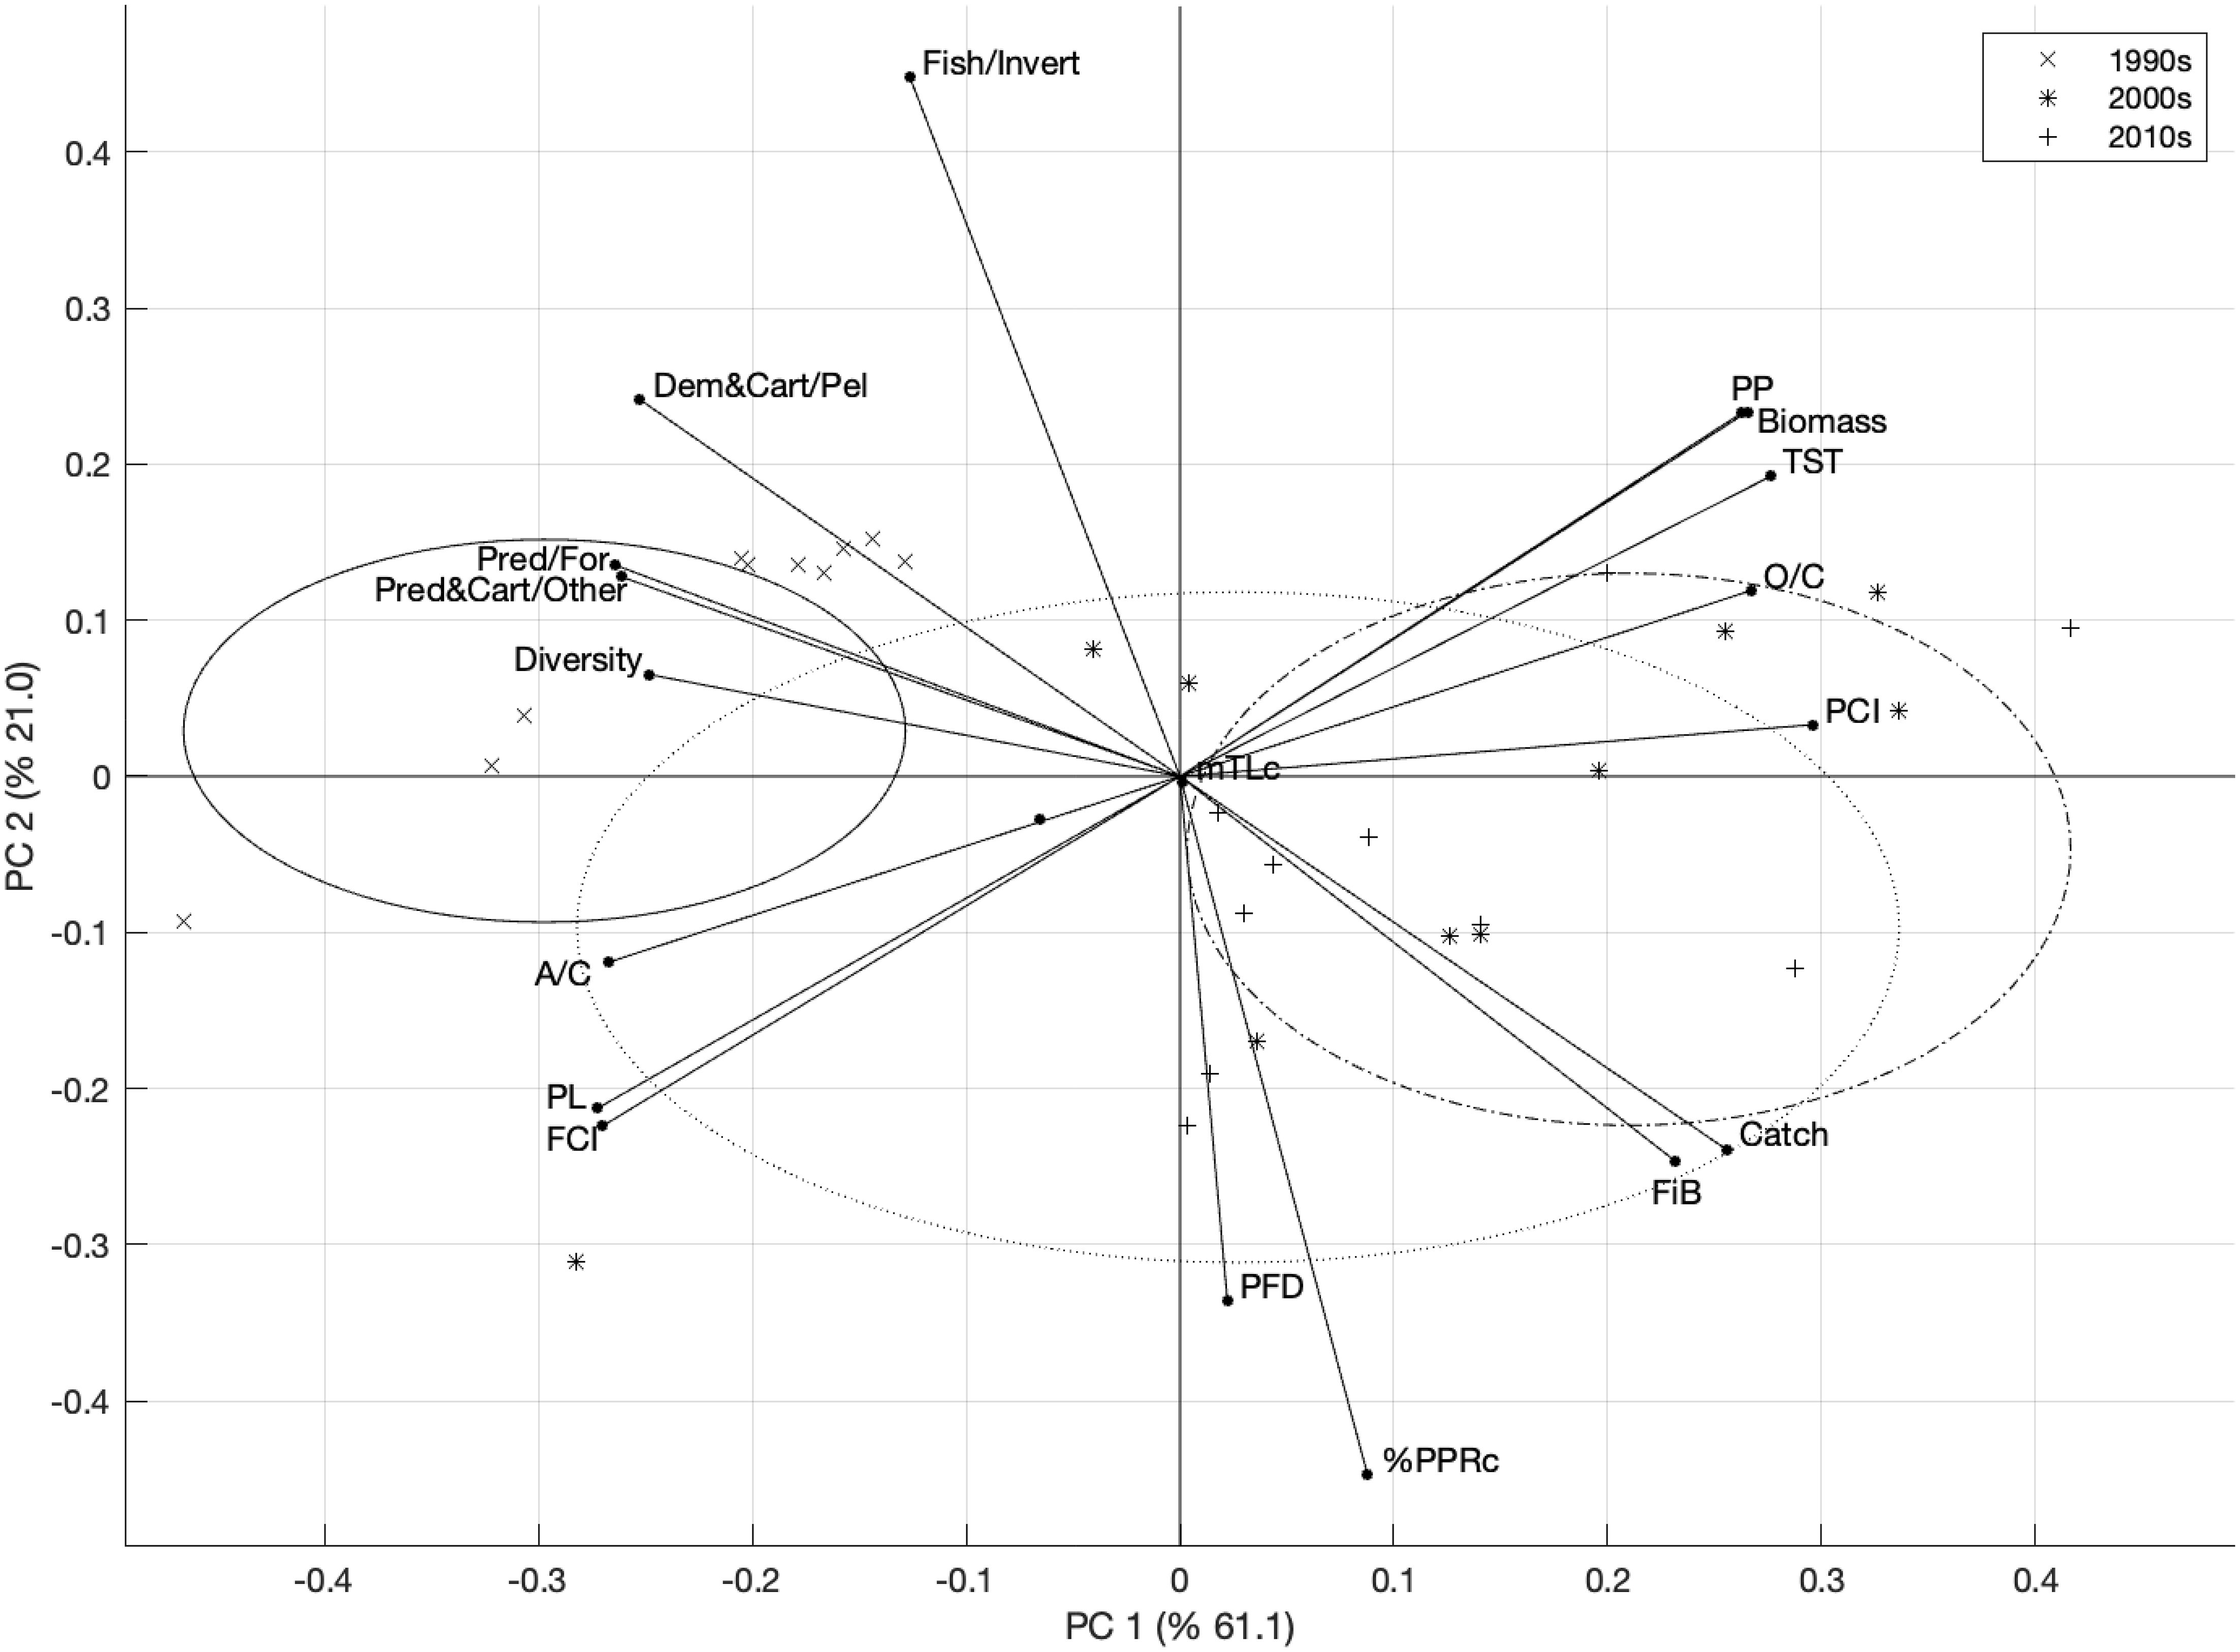
Figure 4. PCA analysis of time series of indicator anomalies in SoM. Fish/Invertebrate: biomass ratio of fish to invertebrates, Pred&Cart/Other: biomass ratio of predatory and cartilaginous fish to other fish, Pred/Forage: biomass ratio of predatory fish to forage fish, Dem&Cart/Pelagic: biomass ratio of demersal and cartilaginous fish to pelagic fish. Circles represent groups of decades, i.e., 1990s (solid line), 2000s (dotted line), 2010s (dash-dotted line).
3.3 Equilibrium analysis and fishing policy assessment
The EwE equilibrium analysis suggested overexploitation of European anchovy, European pilchard, Mediterranean horse mackerel, European hake, thornback ray, and spiny dogfish by comparing the calculated MSY values with the average statistical catches over the modelling period, 1990-2020 (Table 1). The time series of catches and FMSY values from Demirel et al. (2020) with respect to the model-calculated MSY and FMSY values are shown in Figure 5. In line with Table 1, European anchovy, European pilchard, Mediterranean horse mackerel, European hake, thornback ray, and spiny dogfish were overexploited, considering their corresponding MSY values. The catches of Atlantic bonito, bluefish, whiting, and turbot occasionally exceeded the calculated MSY values during the 1990s and the 2000s.
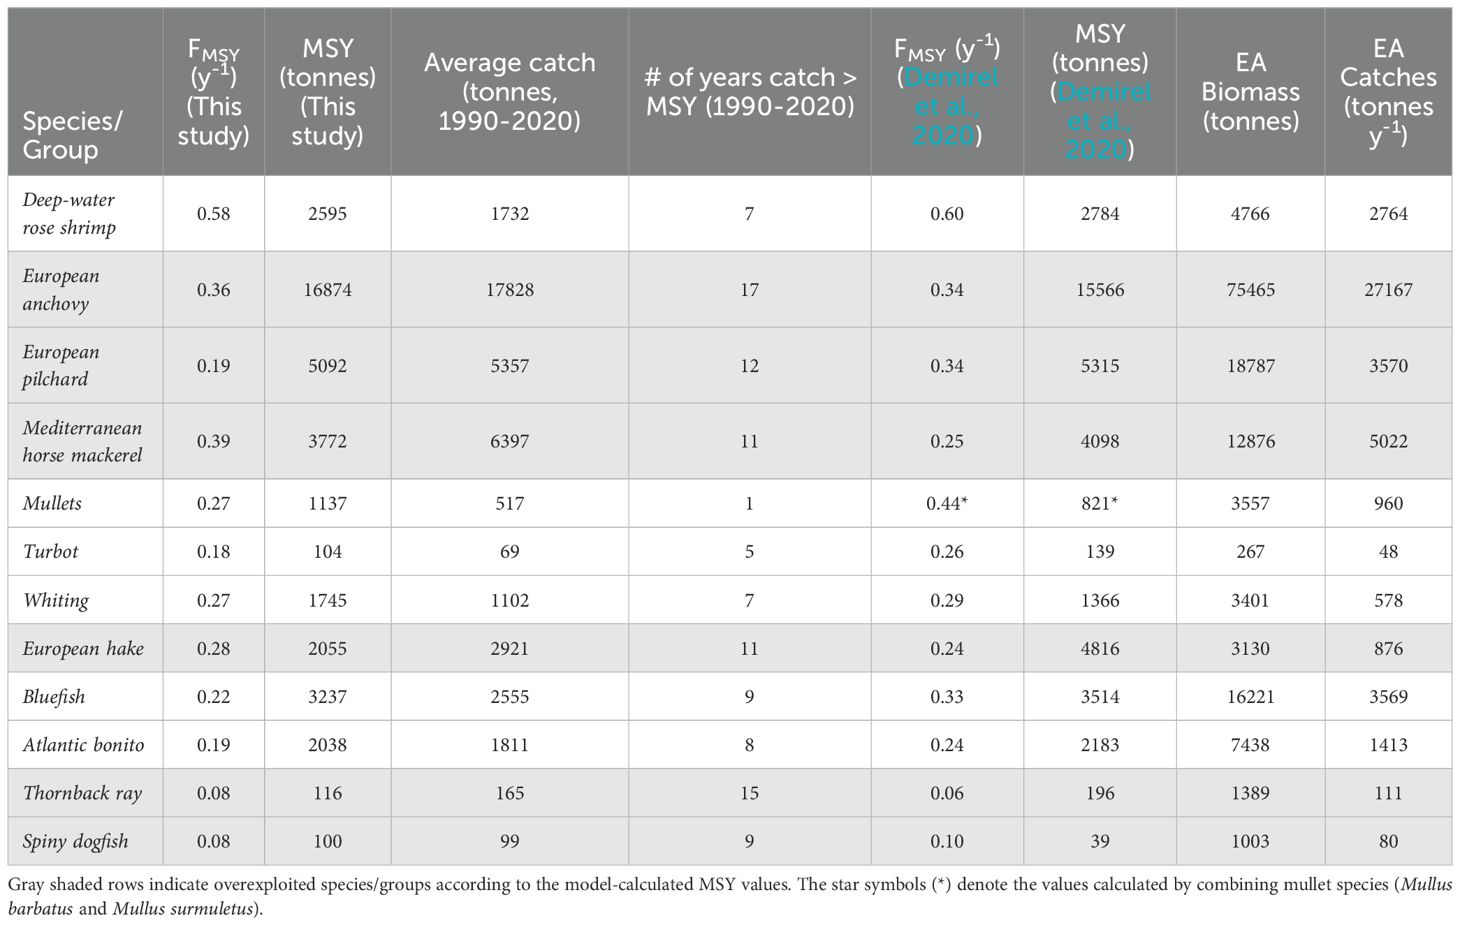
Table 1. Model predictions of maximum sustainable yield (MSY) and their corresponding fishing mortality (FMSY) rates for exploited species/groups and their comparison with average catches over the modelling period (1990-2020) compared with the values reported by Demirel et al. (2020) and the biomass and catch results from the equilibrium analysis (EA) of the long-term Ecosim simulation.
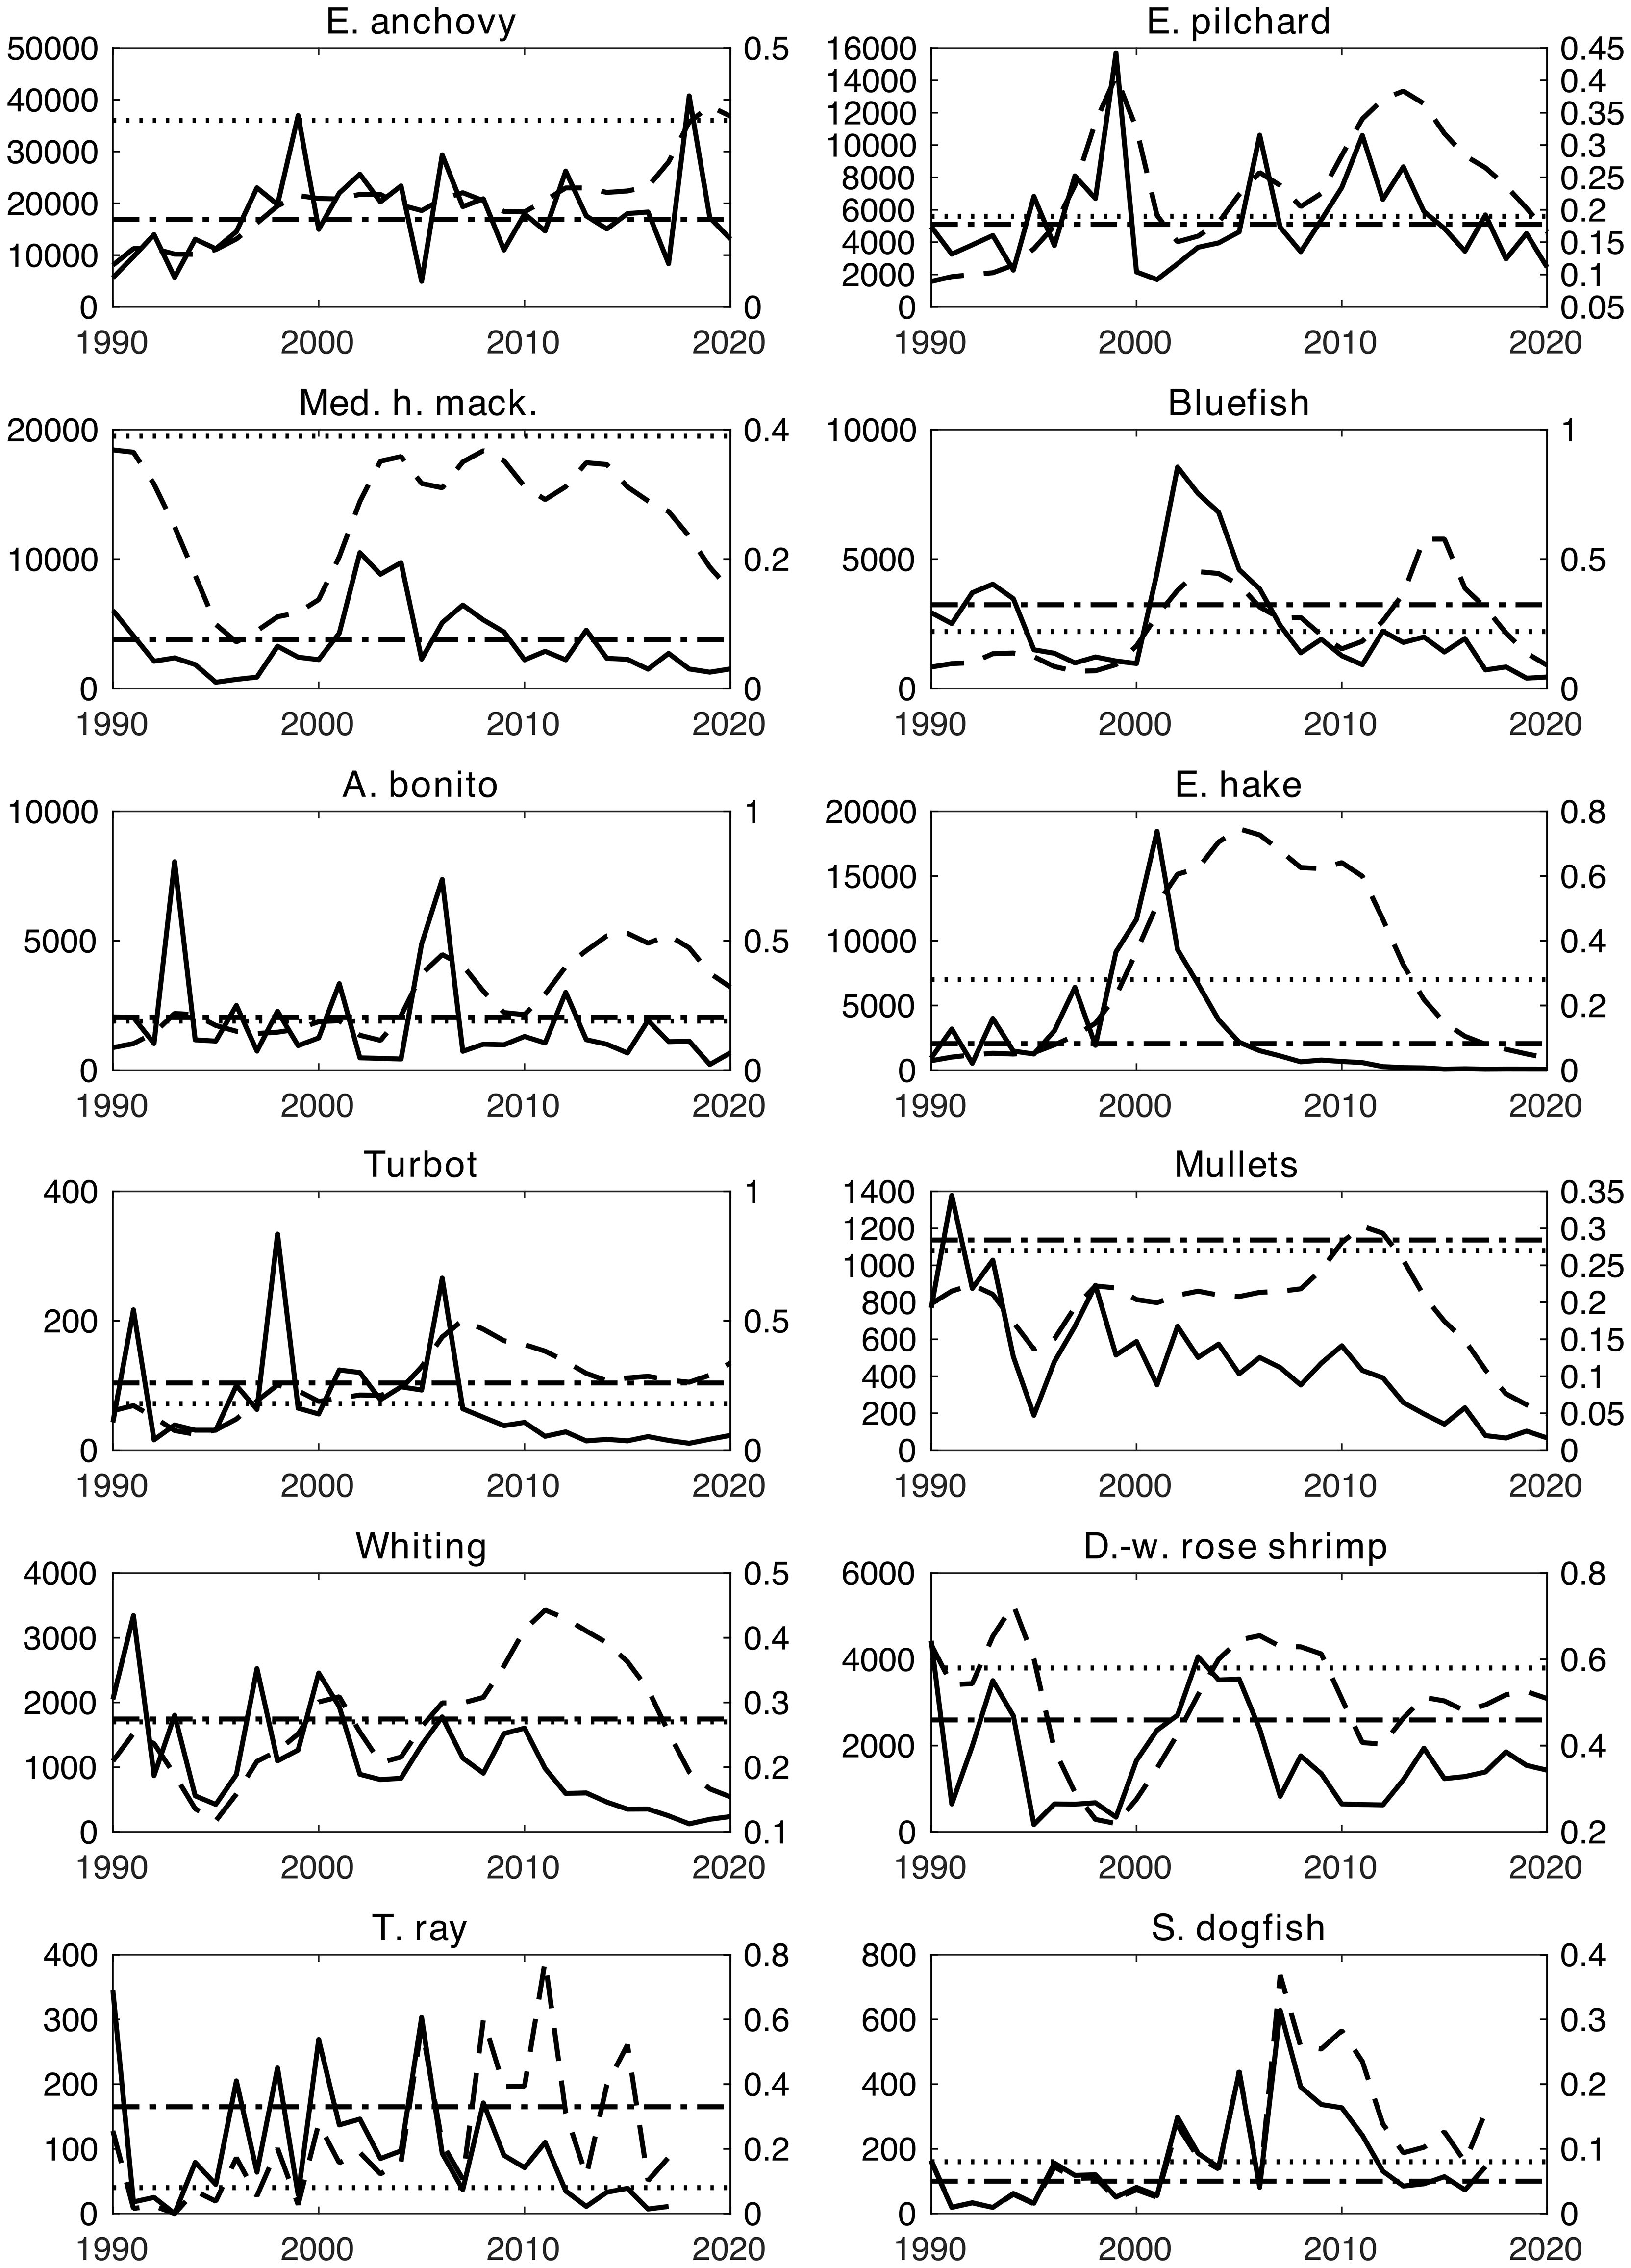
Figure 5. Time series of catches (solid lines) and EwE-calculated MSY values (dash-dotted vertical lines) in tonnes on the left Y-axes, as well as their corresponding time series of fishing mortalities (dashed lines, from Demirel et al. (2020)) and EwE-calculated FMSY values (dotted lines) per year on the right Y-axes. X-axes show simulation years.
When the FMSY values calculated by equilibrium analysis were tested, the long-term equilibrium simulation results showed that the calculated stock-specific MSY values could be achieved at a level of 80% or higher for the majority of the species, except for European pilchard, turbot, whiting, European hake, and Atlantic bonito (Table 1). The catches of European anchovy, deep-water rose shrimp, Mediterranean horse mackerel, and bluefish were calculated to reach values higher than the calculated MSY values, and the catches of turbot, whiting, European hake, and Atlantic bonito were lower than 80% of the predicted MSY values.
4 Discussion
This study presents the first temporal food web model for the Sea of Marmara and enables us to assess its ecosystem-wide changes using time series of ecological indicators. Our results indicated that the SoM ecosystem has experienced three regime shifts since 1990. The first “high biodiversity” regime extended from the early 1990s to the end/onset of the 1990s/2000s and was characterized by high biodiversity and material cycling, as well as relatively higher proportions of predatory, cartilaginous and demersal fish to other fish, indicating low impact of fisheries on the ecosystem and a healthier ecosystem status sensu Odum (1969). At the end of the 1990s and in the early 2000s, the SoM ecosystem shifted to a second regime with decreased biodiversity and material cycling but high biomass and catches supported by increased primary productivity, indicating degraded ecosystem conditions. The footprint of SoM fisheries in the ecosystem increased. The higher fisheries impact during the 2000s culminated in a third regime shift in the second half of the 2010s. This third regime was characterized by lower catches and biomass, indicating a “fishing down the food web” impact. The relative resilience of the system decreased and a higher level of relative ascendency was observed.
4.1 Model skill
The PREBAL analysis of the SoM Ecopath model was considered acceptable as the P/Q values were consistent with the ecological theory, and the P/B and Q/B values mostly followed the increasing trend line from high to low trophic levels with occasional under- and over-estimated groups. Although the individual pedigree values slightly increased considering the reparameterization of the phytoplankton and zooplankton groups using CMEMS data products, the overall pedigree value of the model did not change.
In the SoM Ecosim model, incorporating fishing mortalities and primary productivity anomalies, in addition to trophic effects, significantly improved the model’s fit to reference data, despite the limitations and uncertainties of the available data. However, primary productivity anomalies provided marginal improvement compared to fishing mortalities and trophic effects. All simulated catches and biomasses had low RMSD values, and the majority of the groups had high correlations with the reference biomasses and statistical catches (Figure 2). The model exhibited higher skill in simulating the catch and biomass dynamics of nine out of 12 groups/species (Supplementary Figures 2, 3). The poor representation of the remaining three species was due to the adjustment of initial conditions; i.e., biomasses, to balance the revised Ecopath model. Considering all of these factors, the model successfully reproduced the dynamics of the SoM ecosystem.
4.2 Ecological network analysis and regime shifts
The STARS analysis showed that three main regimes prevailed in the SoM (Figure 3). The first “high biodiversity” regime exhibited lower levels of %PPRc, catches, and FiB, although these indicators increased towards the end of this period. This era was marked by a relatively small footprint of fisheries exploitation in the ecosystem and a top-down control on the food web by piscivorous fish. In the early 2000s, the second “low biodiversity” regime with increased primary productivity and biomass emerged. This first regime shift indicated a reduction in the complexity of the ecosystem and a dominance of small- and medium-sized pelagic fishes, suggesting enhanced fisheries exploitation, as evidenced by increased catch, %PPRc, and FiB values. Furthermore, the decreasing shift in the predatory fish biomass to forage fish biomass ratio indicated a shift from a top-down control to a more bottom-up influence on the food web dynamics. Low values of FCI and PL during this period indicated limited material cycling and shorter pathways for material/energy transfers in the food web, restricting high trophic levels from the ecosystem’s increased primary production. By the mid-2010s, the third “fished down” regime commenced, denoted by the diminishing levels of FiB and mTLc. This period reflected the consequences of over a decade of intensive fishing that started in the 1990s, leading to a significant decrease in pelagic fish biomass. Concurrently, a slight increase in the ratios of demersal and cartilaginous fish to other fish species was observed, indicating a regime shift in catch composition rather than the recovery of demersal fish populations. In addition, PCA confirmed the regime shift analysis, showing distinct clusters for the 1990s with low biomass, high FCI, PL, and high biomass ratios of predatory, cartilaginous and demersal fish to other fish, and the 2010s with low biomass, catches, FiB, and mTLc, and the 2000s bridging them but leaning towards the 2010s (Figure 4). Similar to our findings, Demirel et al. (2023b) also found that the SoM ecosystem has experienced three regimes since 1986, based on an analysis of the time series of environmental and biological parameters. Our analysis enriched the results of the integrated ecosystem assessment by Demirel et al. (2023b) as we based our analysis on a comprehensive time-series dataset of ecological indicators that combined multiple aspects of the SoM ecosystem, allowing us to delineate the structural and functional changes in the food web and examine the ecological transitions of the SoM.
Using three Ecopath mass balance models parameterized for the mid 1990s, mid 2000s and the mid 2010s, Saygu et al. (2023) found that the total biomass in the SoM ecosystem decreased by 13% from the mid 1990s to the mid 2000s, but catches increased by 50%. In our study, considering the decadal scales in our simulation, the total biomass in the SoM ecosystem increased from the 1990s to the 2000s, in line with the increase in statistical catches from the 1990s to the 2000s, and decreased in the third regime. The discrepancies between the two studies may be due to differences in modelling methodologies. The SoM mass balance models were parameterized using the average productivity values over the respective model periods. However, in this study, we utilized the time series of a merged multisensor remote sensing product to drive primary production in the model, allowing the temporal model to capture the dynamics of the SoM ecosystem more accurately. Furthermore, our study revealed a significant increase in PCI during the 2000s, despite lower FCI and PL values, suggesting enhanced prey-predator interactions due to increased biomasses in the food web amidst reduced overall ecosystem cycling. Thus, as reflected in most ecological indicators, our results highlighted the complex response of the SoM marine ecosystem to anthropogenic pressures.
Pollution and overfishing can lead to a decline in biodiversity and the dominance of pelagic species (Caddy, 2000). A subsequent decline in fish stocks due to continuous overfishing, a pattern also observed in SoM, is inevitable in semi-enclosed seas (Williams et al., 2024). The transition from a high to a low biodiversity regime in the SoM was consistent with global observations in semi-enclosed marine systems, including the Mediterranean (Vasilakopoulos et al., 2014) and Red Seas (Spaet et al., 2016), where overexploitation altered community structures, shrank fish stock sizes, and decreased biodiversity. Similar to SoM, ecosystem overfishing deteriorated the fish stocks in the Baltic Sea and resulted in a series of regime shifts (Tomczak et al., 2013; 2022). In the western Mediterranean, overfishing and environmental drivers drove the historical changes in the ecosystem, climate being responsible for the change in the distribution of organisms latitudinally and overfishing being responsible for the declines in stocks (Coll et al., 2024). However, the changes in the SoM closely resembled the degradation of the Black Sea ecosystem in the late 20th century (Kideys, 2002; Llope et al., 2011; Daskalov et al., 2017; Oguz, 2017). Fishing decreased the Black Sea’s biodiversity in the 1960s by first overexploiting predatory larger fish species (Llope et al., 2011; Daskalov et al., 2017), and eutrophication contributed further to this biodiversity decrease by promoting small-sized, opportunistic r-strategist species (Oguz, 2017), culminating in a catastrophic fish stock collapse and a regime shift in the late 1980s (Kideys, 2002). Since then, a low biodiversity and biomass regime have continued in the Black Sea. In this study, we demonstrated that similar changes, with comparable intensities to the Black Sea, have also occurred in the SoM since the 1990s, and the SoM ecosystem has shifted to an overexploited, low diversity, and low biomass regime with degraded food web conditions sensu Odum (1969).
4.3 Equilibrium analysis and fishing policy assessment
The equilibrium analysis showed that European anchovy, European pilchard, Mediterranean horse mackerel, European hake, thornback ray, and spiny dogfish were overexploited during the 2000s. Atlantic bonito, bluefish, whiting, and turbot were also possibly overexploited in the 1990s, 2000s, and the 2010s, as their catches exhibited occasional sharp declines and peaks that exceeded the respective MSY values in their catches (Table 1; Figure 5), indicating unsustainable fishing. This suggested a mechanism realized by episodes of a few years of overexploitation followed by respective stock collapses and gradual recovery over the decades.
The long-term Ecosim simulation with FMSY values applied to their respective stocks showed that all catches and biomasses of the species were maintained at equilibrium levels without any collapse or perturbation, indicating fisheries’ sustainability. The catch levels for most stocks corresponded to the levels of their calculated MSY values or higher. However, the catches of turbot, whiting, and European hake were lower than their respective MSYs. For turbot and whiting, the calculated MSY values in this study and by Demirel et al. (2020) were higher than their long-term average catch levels. According to our long-term equilibrium simulation, the catches of these stocks could not be restored to the levels of their calculated MSYs or long-term average catches. Furthermore, considering European hake, although the calculated MSY value was lower than its average long-term catch in the equilibrium analysis, the catches also stabilized at approximately 43% of the hake’s long-term average catch and 30% of the hake’s calculated MSY value (Table 1). Therefore, we concluded that the sustainable levels of catches for turbot, whiting, and European hake should be much lower than the MSY values calculated in this study or in the literature. However, the equilibrium analysis was carried out using the early 1990s mass balance Ecopath model, and the life history parameters, such as total mortality of the stocks, were assumed not to change significantly over time, and prey-predator dynamics remained stable in the ecosystem. Furthermore, bottom-up effects that can affect the carrying capacity of the ecosystem, such as primary production, could have also played a role in the sustained catches in the long-term equilibrium simulation, as average primary productivity levels were projected to the future due to the unavailability of regional primary production projections. Therefore, the equilibrium analysis may have exhibited a shortcoming in representing the dynamics of these fish stocks compared to other examined stocks because of possible changes in their life history traits that were not represented dynamically in the model or changes in the bottom-up effects that could not be represented in the long-term equilibrium analysis simulation.
Demirel et al. (2020) observed similar trends in their catch-based stock assessment model. However, all calculated MSY values in our study, except for European anchovy, mullets, whiting, and spiny dogfish, were lower than those reported by Demirel et al. (2020). The differences in the calculated FMSY and MSY values between this study and those of Demirel et al. (2020) highlighted methodological variations and emphasized the importance of incorporating prey-predator interactions in MSY calculations, which are not explicitly considered in catch-based stock assessments contrary to the Ecosim equilibrium analysis. Furthermore, the equilibrium analysis ensures that food web dynamics are not disrupted when calculating fisheries exploitation levels, in line with EBFM, so that the ecosystem’s long-term structure and function are not affected. Therefore, supporting stock assessment models with parallel applications of mechanistic models, as well as increasing the adoption of whole-of-ecosystem models to develop management advice for fisheries as a step forward in the implementation of EBFM in marine ecosystems, is necessary.
Individual catch quotas in fisheries management have been successfully implemented in marine ecosystems worldwide (Marchal et al., 2016) and have been proven to improve fisheries economics (Arnason, 2023), as well as the well-being of marine ecosystems and the sustainability of harvested stocks (Chu, 2009; Hoshino et al., 2020). Therefore, we suggest that MSY values should be employed as quotas for species-specific fisheries in the SoM. In a given fishing season, fisheries for the species should halt as soon as the respective quota is reached, regardless of the duration of the fishing season.
4.4 Limitations of the approach
Models are bound by the quality of the data used to initialize and parametrize their variables. SoM is a data-poor marine region, and systematic survey data for fish stocks and plankton with large spatial and temporal coverage are lacking (Saygu et al., 2023). Thus, the degree of uncertainty in our model results should not be overruled. The reference biomass time series used in this study were the products of a catch-based stock assessment model developed for data-poor marine regions (Demirel et al., 2020). Furthermore, the statistical catches used to validate the simulated catches were impaired by methodological discrepancies, such as the questionnaire-based approach used to collect fishery statistics (Turkstat, 2018). Therefore, the skill of the SoM Ecosim model should be tentatively evaluated by considering the uncertainties in the reference data sources.
The SoM is affected by increasing sea surface temperatures (SST) over the modelling period (Akoğlu, 2021). SST anomalies have increased by ~0.5°C since the 1990s (Demirel et al., 2023a). However, we did not incorporate the environmental responses of functional groups to changes in ocean temperature in this study as information on the temperature responses of species in the SoM is limited, and global databases do not contain such data that are statistically representative of the species in the basin, as it is quite small. This may also have limited the ability of our model to capture the dynamics of the SoM ecosystem. Future work should consider including the environmental responses of organisms, e.g., to SST and especially to O2, as more such studies are being conducted considering the recent mucilage events and deoxygenation in the SoM (Yalçın et al., 2017).
Aggregation of species into functional groups is also an important consideration in food web modelling and may have an impact on key species of ecosystems, concealing their roles in the food web, and altering the resulting food web representations. However, aggregation helps reduce the ecological complexity while maintaining the important structural properties of the food webs; thus, facilitating evaluation of models against observations and delineating complex phenomena (Olivier and Planque, 2017; Giacomuzzo and Jordán, 2021). In this study, we capitalized on the model of Saygu et al. (2023) and did not modify the species and functional groups in the model. We aimed to represent all economically important fish species in the model to the greatest extent possible, unless constrained by the data. Therefore, the model included 11 separate commercially important fish species, and the functional group of “mullets” included two commercially exploited Mullidae species because their registration in the statistical data was dubious. For the remaining groups, i.e., planktonic, benthic, and mammalian groups, representation at the functional level was inevitable due to data constraints and their functional role in the ecosystem. This may have created a drawback for the assessment of mullet fisheries; however, because the focus of our study was on the commercially prevalent organisms in the food web, the aggregation level and representation of state variables in our model were fit for our purpose.
The use of global earth system model products for parameterizing plankton groups could have impaired the lower-trophic-level dynamics simulated by the SoM Ecosim model. Global models are optimized for larger spatial scales and lack the skill to capture mesoscale and sub-mesoscale dynamics in marginal seas and small semi-enclosed marine basins such as SoM. Therefore, plankton and other lower-trophic-level dynamics simulated by the SoM Ecosim model could have been adversely affected by the use of coarse global products, although they were re-interpolated to a higher spatial resolution in our study.
5 Conclusion
Our study showed notable decadal changes in the SoM ecosystem with an indicator-based approach using a temporal food web model for the first time. Our findings delineate three distinct ecological regimes, characterized by their unique characteristics and responses to anthropogenic pressures, particularly fisheries exploitation and environmental degradation. Initially, the SoM ecosystem exhibited attributes of high biodiversity, efficient material cycling, and a balanced trophic structure, which were progressively compromised by increased fishing activities and environmental stressors. The transition from a regime of high ecological complexity and biodiversity to a state characterized by hampered trophic interactions, reduced biodiversity, and a “fished down” marine food web signals a critical need for urgent and comprehensive management strategies. These shifts highlight the pressing challenges of overfishing, habitat degradation, and the broader implications of anthropogenic influences on semi-enclosed marine ecosystems.
The identification of overexploited species and the recommendation for EBFM practices, including the implementation of species-specific MSY values as quotas, offer a pathway towards mitigating biodiversity loss and promoting the resilience of the SoM ecosystem. The application of global earth system models and reliance on data-poor methodologies underscored the critical need for enhanced regional data collection, model validation, and integration of mechanistic models with conventional stock assessments. Future research should prioritize the refinement of input data, the adoption of regional model outputs, and the exploration of novel management strategies that incorporate the complex interplay between species dynamics, environmental variability, and human impacts. Such endeavors are essential for advancing our understanding of the SoM ecosystem and developing more effective conservation and management strategies, ensuring the long-term sustainability of this fragile marine environment and its invaluable resources.
Data availability statement
The original contributions presented in the study are included in the article/Supplementary Material. Further inquiries can be directed to the corresponding author.
Author contributions
EA: Conceptualization, Data curation, Formal analysis, Investigation, Methodology, Visualization, Writing – original draft, Writing – review & editing. İS: Conceptualization, Data curation, Investigation, Writing – review & editing. ND: Conceptualization, Data curation, Investigation, Writing – review & editing.
Funding
The author(s) declare financial support was received for the research, authorship, and/or publication of this article. This study is a contribution to the projects supported by The Scientific and Technological Research Council of Türkiye (TUBITAK - Project No: 119Y294), The Scientific Research Projects Coordination Unit of Istanbul University, Türkiye (FBA-2022-39143) and the Turkish Ministry of Environment, Urbanization and Climate Change (Project code: MARMOD Phase II)
Acknowledgments
This study was partly conducted under the auspices of the DEKOSIM project (National Excellence Centre for Marine Ecosystem and Climate Research (Project Code: BAP-08-11-DPT.2012K120880), and the Middle East Technical University Climate Change and Sustainable Development Application and Research Center. The study has been conducted using data provided by E.U. Copernicus Marine Service Information (https://doi.org/10.48670/moi-00281).
Conflict of interest
The authors declare that the research was conducted in the absence of any commercial or financial relationships that could be construed as a potential conflict of interest.
The author(s) declared that they were an editorial board member of Frontiers, at the time of submission. This had no impact on the peer review process and the final decision.
Publisher’s note
All claims expressed in this article are solely those of the authors and do not necessarily represent those of their affiliated organizations, or those of the publisher, the editors and the reviewers. Any product that may be evaluated in this article, or claim that may be made by its manufacturer, is not guaranteed or endorsed by the publisher.
Supplementary material
The Supplementary Material for this article can be found online at: https://www.frontiersin.org/articles/10.3389/fmars.2024.1412656/full#supplementary-material
References
Abdi H., Williams L. J. (2010). Principal component analysis. WIREs Comput. Stat 2, 433–459. doi: 10.1002/wics.101
Akaike H. (1974). A new look at the statistical model identification. IEEE Trans. Automatic Control 19, 716–723. doi: 10.1109/TAC.1974.1100705
Akoğlu E. (2021). Exploring the dynamics of small pelagic fish catches in the Marmara Sea in relation to changing environmental and bio-optical parameters. Turkish J. Zoology 45, 257–265. doi: 10.3906/zoo-2012-23
Akoglu E. (2023). Ecological indicators reveal historical regime shifts in the Black Sea ecosystem. PeerJ 11, e15649. doi: 10.7717/peerj.15649
Akyol O., Ceyhan T. (2007). Exploitation and mortalities of bluefish (Pomatomus saltatrix L.) in the Sea of Marmara, Turkey. J. Appl. Biol. Sci. 1, 25–27.
Albay M. (2023). Marmara Denizi’nin Müsilaj Sorunu (İstanbul, Türkiye: Istanbul University Press). doi: 10.26650/B/LS32.2023.002
Allen K. R. (1971). Relation between production and biomass. Can. J. Fisheries Aquat. Sci. 28, 1573–1581. doi: 10.1139/f71-236
Arnason R. (2023). Improving fisheries management in developing countries. Mar. Resource Economics 38, 263–283. doi: 10.1086/724933
Beşiktepe Ş.T., Sur H.İ., Özsoy E., Latif M. A., Oğuz T., Ünlüata Ü. (1994). The circulation and hydrography of the Marmara Sea. Prog. Oceanography 34, 285–334. doi: 10.1016/0079-6611(94)90018-3
Braeken J., Van Assen M. A. (2017). An empirical Kaiser criterion. Psychol. Methods 22. (3), 450. doi: 10.1037/met0000074
Burak S., Unlu S., Gazioglu C. (2009). Environmental stress created by chemical pollution in the Marmara Sea (Turkey). Asian J. Chem. 21, 3166–3174.
Caddy J. F. (2000). Marine catchment basin effects versus impacts of fisheries on semi-enclosed seas. ICES J. Mar. Sci. 57, 628–640. doi: 10.1006/jmsc.2000.0739
Christensen V., Walters C. J., Pauly D. (2005). Ecopath with Ecosim: a user’s guide, Vol. 154 (Vancouver, Canada: Fisheries Centre, University of British Columbia), 31.
Chu C. (2009). Thirty years later: the global growth of ITQs and their influence on stock status in marine fisheries. Fish Fisheries 10, 217–230. doi: 10.1111/j.1467-2979.2008.00313.x
Coll M., Bellido J. M., Pennino M. G., Albo-Puigserver M., Báez J. C., Christensen V., et al. (2024). Retrospective analysis of the pelagic ecosystem of the Western Mediterranean Sea: Drivers, changes and effects. Sci. Total Environ. 907, 167790. doi: 10.1016/j.scitotenv.2023.167790
Costanza R., Mageau M. (1999). What is a healthy ecosystem? Aquat. Ecol. 33, 105–115. doi: 10.1023/A:1009930313242
Craig J. K., Link J. S. (2023). It is past time to use ecosystem models tactically to support ecosystem-based fisheries management: Case studies using Ecopath with Ecosim in an operational management context. Fish Fisheries 24, 381–406. doi: 10.1111/faf.12733
Daskalov G. M. (2002). Overfishing drives a trophic cascade in the Black Sea. Mar. Ecol. Prog. Ser. 225, 53–63. doi: 10.3354/meps225053
Daskalov G. M. (2003). Long-term changes in fish abundance and environmental indices in the Black Sea. Mar. Ecol. Prog. Ser. 255, 259–270. doi: 10.3354/meps255259
Daskalov G. M., Boicenco L., Grishin A. N., Lazar L., Mihneva V., Shlyakhov V. A., et al. (2017). Architecture of collapse: regime shift and recovery in an hierarchically structured marine ecosystem. Global Change Biol. 23, 1486–1498. doi: 10.1111/gcb.13508
Demirel N., Gül G., Yüksek A. (2022). Recovery potential and management options for European hake, Merluccius merluccius (Linnaeus, 1758), stocks in Turkish waters. Acta Biol. Turc. 35, 3–9.
Demirel N., Akoglu E., Ulman A., Ertor-Akyazi P., Gül G., Bedikoğlu D., et al. (2023b). Uncovering ecological regime shifts in the Sea of Marmara and reconsidering management strategies. Mar. Environ. Res. 183, 105794. doi: 10.1016/j.marenvres.2022.105794
Demirel N., Akoglu E., Yıldız T. (2023a). Shifts in the pelagic fishery dynamics in response to regional sea warming and fishing in the Northeastern Mediterranean. Regional Environ. Change 23, 141. doi: 10.1007/s10113-023-02139-7
Demirel N., Zengin M., Ulman A. (2020). First large-scale eastern mediterranean and black sea stock assessment reveals a dramatic decline. Front. Mar. Sci. 7. doi: 10.3389/fmars.2020.00103
Finn J. T. (1976). Measures of ecosystem structure and function derived from analysis of flows. J. Theor. Biol. 56, 363–380. doi: 10.1016/S0022-5193(76)80080-X
Folke C., Biggs R., Norström A. V., Reyers B., Rockström J. (2016). Social-ecological resilience and biosphere-based sustainability science. Ecol. Soc. 21, 41. doi: 10.5751/ES-08748-210341
Fulford R. S., Heymans S. J. J., Wu W. (2020). “Mathematical Modeling for Ecosystem-Based Management (EBM) and Ecosystem Goods and Services (EGS) Assessment,” in Ecosystem-Based Management, Ecosystem Services and Aquatic Biodiversity: Theory, Tools and Applications. Eds. O’Higgins T. G., Lago M., DeWitt T. H. (Springer International Publishing, Cham), 275–289. doi: 10.1007/978-3-030-45843-0_14
Froese R., Winker H., Coro G., Demirel N., Tsikliras A. C., Dimarchopoulou D., et al. (2018). Status and rebuilding of European fisheries. Mar. Policy 93, 159–170. doi: 10.1016/j.marpol.2018.04.018
Giacomuzzo E., Jordán F. (2021). Food web aggregation: effects on key positions. Oikos 130, 2170–2181. doi: 10.1111/oik.08541
Gul G., Demirel N. (2016). “Status of Small Pelagic Fishes in the Sea of Marmara,” in The Sea of Marmara: Marine Biodiversity Fisheries, Conservation and Governance, vol. 42 . Eds. Özsoy E., Çağatay N. M., Balkıs N., Balkıs N., Öztürk B. (Turkish Marine Research Foundation, Istanbul, Türkiye), 612–629.
Gül G., Demirel N. (2021). Evaluation of the comprehensive feeding strategy and trophic role of overexploited mesopredator species in the Sea of Marmara (northeastern Mediterranean). Estuar. Coast. Shelf Sci. 259, 107448. doi: 10.1016/j.ecss.2021.107448
Haugen J. B., Link J. S., Cribari K., Bundy A., Dickey-Collas M., Leslie H. M., et al. (2024). Marine ecosystem-based management: challenges remain, yet solutions exist, and progress is occurring. NPJ Ocean Sustainability 3, 1–11. doi: 10.1038/s44183-024-00041-1
Heymans J. J., Coll M., Link J. S., Mackinson S., Steenbeek J., Walters C., et al. (2016). Best practice in Ecopath with Ecosim food-web models for ecosystem-based management. Ecol. Model. 331, 173–184. doi: 10.1016/j.ecolmodel.2015.12.007
Hidalgo M., Mihneva V., Vasconcellos M., Bernal M. (2018). “Climate change impacts, vulnerabilities and adaptations: Mediterranean Sea and the Black Sea Marine Fisheries,” in Impacts Climate Change on Fisheries and Aquaculture: Synthesis of Current Knowledge, Adaptation and Mitigation Options, vol. 627 . Eds. Barange M., Bahri T., Beveridge M. C. M., Cochrane K. L., Funge-Smith S., Poulain F. (Food and Agriculture Organisation, Rome, Italy), 139–158.
Hoshino E., van Putten I., Pascoe S., Vieira S. (2020). Individual transferable quotas in achieving multiple objectives of fisheries management. Mar. Policy 113, 103744. doi: 10.1016/j.marpol.2019.103744
Hyndman R. J., Khandakar Y. (2008). Automatic time series forecasting: the forecast package for R. J. Stat. Software 26, 1–22. doi: 10.18637/jss.v027.i03
Kabasakal H., Sakınan S., Lipej L., Ivajnšič D. (2023). A preliminary life history traits analysis of sharks in the Sea of Marmara (Türkiye), where deoxygenation and habitat deterioration are raising concerns. Aquat. Res. 6, 72–82. doi: 10.3153/AR23008
Karadurmuş U. (2022). Current status, management, and future prospects of whiting (Merlangius merlangus) in the sea of marmara. Acta Aquatica Turcica 18, 314–331. doi: 10.22392/actaquatr.1059877
Keramidas I., Dimarchopoulou D., Ofir E., Scotti M., Tsikliras A. C., Gal G. (2023). Ecotrophic perspective in fisheries management: a review of Ecopath with Ecosim models in European marine ecosystems. Front. Mar. Sci. 10. doi: 10.3389/fmars.2023.1182921
Kideys A. E. (2002). Fall and rise of the Black Sea ecosystem. Science 297, 1482–1484. doi: 10.1126/science.1073002
Koyun S. F., Yıldız T., Ulman A. (2022). The rich get stronger: the purse seine fishery of the turkish straits system. Fishes 7, 301. doi: 10.3390/fishes7060301
Link J. S. (2010). Adding rigor to ecological network models by evaluating a set of pre-balance diagnostics: A plea for PREBAL. Ecol. Model. 221 (12), 1580–1591. doi: 10.1016/j.ecolmodel.2010.03.012
Liu X., Stock C., Dunne J., Lee M., Shevliakova E., Malyshev S., et al. (2022). ISIMIP3a ocean physical and biogeochemical input data [GFDL-MOM6-COBALT2 dataset] (Postdam, Germany: Potsdam Institute for Climate Impact Research). doi: 10.48364/ISIMIP.920945
Llope M., Daskalov G. M., Rouyer T. A., Mihneva V., Chan K.-S., Grishin A. N., et al. (2011). Overfishing of top predators eroded the resilience of the Black Sea system regardless of the climate and anthropogenic conditions. Global Change Biol. 17, 1251–1265. doi: 10.1111/j.1365-2486.2010.02331.x
Marchal P., Andersen J. L., Aranda M., Fitzpatrick M., Goti L., Guyader O., et al. (2016). A comparative review of fisheries management experiences in the European Union and in other countries worldwide: Iceland, Australia, and New Zealand. Fish Fisheries 17, 803–824. doi: 10.1111/faf.12147
Möllmann C., Casini M., Daskalov G. M., De Young B. (2011). Regime shifts in marine ecosystems: how overfishing can provoke sudden ecosystems changes. Directorate General for Internal Policies Policy Department B: Structural and Cohesion Policies (Brussels, Belgium: European Parliament). doi: 10.2861/52551
Odum E. P. (1969). The Strategy of Ecosystem Development: An understanding of ecological succession provides a basis for resolving man’s conflict with nature. Science 164, 262–270. doi: 10.1126/science.164.3877.262
Oguz T. (2017). Controls of multiple stressors on the black sea fishery. Front. Mar. Sci. 4. doi: 10.3389/fmars.2017.00110
Oguz T., Gilbert D. (2007). Abrupt transitions of the top-down controlled Black Sea pelagic ecosystem during 1960–2000: evidence for regime-shifts under strong fishery exploitation and nutrient enrichment modulated by climate-induced variations. Deep Sea Res. Part I: Oceanographic Res. Papers 54, 220–242. doi: 10.1016/j.dsr.2006.09.010
Oğuz T., Öztürk B. (2011). Mechanisms impeding natural Mediterranization process of Black Sea fauna. J. Black Sea/Mediterranean Environ. 17, 234–253.
Oguz T., Salihoglu B., Fach B. (2008). A coupled plankton–anchovy population dynamics model assessing nonlinear controls of anchovy and gelatinous biomass in the Black Sea. Mar. Ecol. Prog. Ser. 369, 229–256. doi: 10.3354/meps07540
Oguz T., Su J. (2004). “Semi-enclosed seas, islands and Australia pan regional overview (s),” in The Sea: The Global Coastal Ocean Interdisciplinary Regional Studies and Syntheses, vol. 14 . Eds. Robinson A. H., Brink K. H. (Harvard University Press, Cambridge, MA), 83–116.
Olivier P., Planque B. (2017). Complexity and structural properties of food webs in the Barents Sea. Oikos 126, 1339–1346. doi: 10.1111/oik.04138
Pauly D., Christensen V. (1995). Primary production required to sustain global fisheries. Nature 374, 255–257. doi: 10.1038/374255a0
Pauly D., Christensen V., Dalsgaard J., Froese R., Torres F. Jr (1998). Fishing down marine food webs. Science 279, 860–863. doi: 10.1126/science.279.5352.860
Pauly D., Watson R. (2005). Background and interpretation of the ‘Marine Trophic Index’ as a measure of biodiversity. Philos. Trans. R. Soc. B Biol. Sci. 360, 415–423. doi: 10.1098/rstb.2004.1597
Pauly D., Zeller D. (2019). “The Making of a Global Marine Fisheries Catch Database for Policy Development,” in World Seas: An Environmental Evaluation. Ed. Shepperd C. (London, UK: Academic Press), 221–235. doi: 10.1016/B978-0-12-805052-1.00012-7
Pikitch E. K., Santora C., Babcock E. A., Bakun A., Bonfil R., Conover D. O., et al. (2004). Ecosystem-based fishery management. Science 305, 346–347. doi: 10.1126/science.1098222
Piroddi C., Coll M., Liquete C., Macias D., Greer K., Buszowski J., et al. (2017). Historical changes of the Mediterranean Sea ecosystem: modelling the role and impact of primary productivity and fisheries changes over time. Sci. Rep. 7, 44491. doi: 10.1038/srep44491
Ramírez F., Coll M., Navarro J., Bustamante J., Green A. J. (2018). Spatial congruence between multiple stressors in the Mediterranean Sea may reduce its resilience to climate impacts. Sci. Rep. 8, 14871. doi: 10.1038/s41598-018-33237-w
R Core Team (2023). R: A Language and Environment for Statistical Computing (Vienna, Austria: R Foundation for Statistical Computing). Available at: https://www.R-project.org/.
Rodionov S. N. (2004). A sequential algorithm for testing climate regime shifts. Geophysical Res. Lett. 31, L09204. doi: 10.1029/2004GL019448
Saygu İ., Akoglu E., Gül G., Bedikoğlu D., Demirel N. (2023). Fisheries impact on the Sea of Marmara ecosystem structure and functioning during the last three decades. Front. Mar. Sci. 9. doi: 10.3389/fmars.2022.1076399
Scott E., Serpetti N., Steenbeek J., Heymans J. J. (2016). A Stepwise Fitting Procedure for automated fitting of Ecopath with Ecosim models. SoftwareX 5, 25–30. doi: 10.1016/j.softx.2016.02.002
Shannon C. E. (1948). A mathematical theory of communication. Bell System Tech. J. 27, 379–423. doi: 10.1002/j.1538-7305.1948.tb01338.x
Shannon L. J., Coll M., Neira S. (2009). Exploring the dynamics of ecological indicators using food web models fitted to time series of abundance and catch data. Ecol. Indic. 9, 1078–1095. doi: 10.1016/j.ecolind.2008.12.007
Smit K. P., Bernard A. T. F., Lombard A. T., Sink K. J. (2021). Assessing marine ecosystem condition: A review to support indicator choice and framework development. Ecol. Indic. 121, 107148. doi: 10.1016/j.ecolind.2020.107148
Spaet J. L. Y., Nanninga G. B., Berumen M. L. (2016). Ongoing decline of shark populations in the Eastern Red Sea. Biol. Conserv. 201, 20–28. doi: 10.1016/j.biocon.2016.06.018
Taylor K. E. (2001). Summarizing multiple aspects of model performance in a single diagram. J. Geophysical Research: Atmospheres 106, 7183–7192. doi: 10.1029/2000JD900719
Tomczak M. T., Heymans J. J., Yletyinen J., Niiranen S., Otto S. A., Blenckner T. (2013). Ecological network indicators of ecosystem status and change in the Baltic Sea. PloS One 8, e75439. doi: 10.1371/journal.pone.0075439
Tomczak M. T., Müller-Karulis B., Blenckner T., Ehrnsten E., Eero M., Gustafsson B., et al. (2022). Reference state, structure, regime shifts, and regulatory drivers in a coastal sea over the last century: The Central Baltic Sea case. Limnology Oceanography 67, S266–S284. doi: 10.1002/lno.11975
Tsikliras A. C., Dinouli A., Tsiros V.-Z., Tsalkou E. (2015). The mediterranean and black sea fisheries at risk from overexploitation. PloS One 10, e0121188. doi: 10.1371/journal.pone.0121188
Turan C., Gürlek M. (2016). Climate change and biodiversity effects in Turkish Seas. Natural Eng. Sci. 1, 15–24. doi: 10.28978/nesciences.286240
Turkstat (2018). Fishery Statistics Micro Data Set 2018 (Turkish Statistical Institute). Available online at: www.tuik.gov.tr (Accessed June 21, 2023).
Turkstat (2023). (Turkish Statistical Institute). Available online at: www.tuik.gov.tr (Accessed June 21, 2023).
Ulman A., Zengin M., Demirel N., Pauly D. (2020). The lost fish of Turkey: A recent history of disappeared species and commercial fishery extinctions for the turkish marmara and black seas. Front. Mar. Sci. 7. doi: 10.3389/fmars.2020.00650
Uysal Z. (2006). Vertical distribution of marine cyanobacteria Synechococcus spp. in the Black, Marmara, Aegean, and eastern Mediterranean seas. Deep Sea Res. Part II Topical Stud. Oceanography 53, 1976–1987. doi: 10.1016/j.dsr2.2006.03.016
Vasilakopoulos P., Maravelias C. D., Tserpes G. (2014). The alarming decline of mediterranean fish stocks. Curr. Biol. 24, 1643–1648. doi: 10.1016/j.cub.2014.05.070
Walters C. J., Christensen V., Martell S. J., Kitchell J. F. (2005). Possible ecosystem impacts of applying MSY policies from single-species assessment. ICES J. Mar. Sci. 62, 558–568. doi: 10.1016/j.icesjms.2004.12.005
Williams C. T., Garzon F., Cochran J. E. M., Tanabe L. K., Hawkes L. A., McIvor A. J., et al. (2024). Low diversity and abundance of predatory fishes in a peripheral coral reef ecosystem. Ecol. Evol. 14, e10920. doi: 10.1002/ece3.10920
Yalçın B., Artüz M. L., Pavlidou A., Çubuk S., Dassenakis M. (2017). Nutrient dynamics and eutrophication in the Sea of Marmara: Data from recent oceanographic research. Sci. Total Environ. 601, 405–424. doi: 10.1016/j.scitotenv.2017.05.179
Yildiz T., Ulman A. (2020). Analyzing gaps in policy: Evaluation of the effectiveness of minimum landing size (MLS) regulations in Turkey. Mar. Policy 115, 103829. doi: 10.1016/j.marpol.2020.103829
Yildiz T., Ulman A., Karakulak F. S., Uzer U., Demirel N. (2023). Bio-economic indicators of fisheries: impact of variations in landings and fish size on market prices in Istanbul Fish Market. PeerJ 11, e15141. doi: 10.7717/peerj.15141
Yıldız T., Ulman A., Demirel N. (2020). A comparison of market landings during fish spawning seasons to better understand the effectiveness of the temporal fishery closure in Turkey. Ocean Coast. Manage. 198, 105353. doi: 10.1016/j.ocecoaman.2020.105353
Keywords: Ecopath with Ecosim, Sea of Marmara, regime shifts, fisheries, food web, ecosystem-based fisheries management
Citation: Akoglu E, Saygu İ and Demirel N (2024) Decadal changes in the Sea of Marmara indicate degraded ecosystem conditions and unsustainable fisheries. Front. Mar. Sci. 11:1412656. doi: 10.3389/fmars.2024.1412656
Received: 05 April 2024; Accepted: 05 August 2024;
Published: 26 August 2024.
Edited by:
Gideon Gal, Israel Oceanographic and Limnological Research, IsraelReviewed by:
Ferenc Jordan, Hungarian Academy of Science, HungaryGeorgia Papantoniou, Hellenic Centre for Marine Research (HCMR), Greece
Copyright © 2024 Akoglu, Saygu and Demirel. This is an open-access article distributed under the terms of the Creative Commons Attribution License (CC BY). The use, distribution or reproduction in other forums is permitted, provided the original author(s) and the copyright owner(s) are credited and that the original publication in this journal is cited, in accordance with accepted academic practice. No use, distribution or reproduction is permitted which does not comply with these terms.
*Correspondence: Ekin Akoglu, ZWFrb2dsdUBtZXR1LmVkdS50cg==