- 1School of Business, Ningbo University, Ningbo, China
- 2Marine Economic Research Center, Dong Hai Strategic Research Institute, Ningbo University, Ningbo, China
- 3School of Economics and Management, Zhejiang Ocean University, Zhoushan, China
Marine fisheries are a critical component of the marine economy. Examining the changes in the economic resilience of marine fisheries allows for identifying potential development risks and supports informed decision-making to optimize growth patterns and mitigate risks. This study applied the CRITIC-based combined weights model to calculate China’s Marine Fisheries Economic Resilience (MFER). It investigated the temporal and spatial evolution of MFER and analyzed the influencing factors using the Geographical Detector and a Two-way fixed-effects model. Furthermore, the future development trends of MFER were predicted using the Markov chain. The results show that the overall MFER in China’s coastal provinces increased steadily from 2001 to 2020. Second, MFER exhibits a clear pattern, with low-value regions improving and high-value areas shifting toward medium- and low-value provinces. Fourth, the trajectory of the MFER center is moving from north to south, with high-value regions expanding in the same direction. Fourth, factors such as EDL, TEC, SPE, and SYS positively impact MFER, while OPE has a negative effect. Finally, the results of the Markov chain indicate that the current development state of MFER is relatively stable, with evidence of club convergence. However, the probability of maintaining the current development level is gradually decreasing. Based on these findings, provide suggestions for the preservation of marine economic security.
1 Introduction
The expansion of marine fisheries production and the fisheries economy is essential for supporting the nutrition, livelihoods, and cultural well-being of millions globally. It is also critical for ensuring global food security (Zhai et al., 2023; Hill et al., 2012). Recently, the United Nations launched the Decade of Marine Science for Sustainable Development, an initiative focused on highlighting the significance of sustainable fisheries management in enhancing community well-being and securing food security (Claudet et al., 2020). However, environmental degradation and globalization are introducing new challenges to marine fisheries, compounding existing pressures. Events such as tropical cyclones, harmful algal blooms, and ocean heatwaves have caused significant damage to fishing communities (Knutson et al., 2010; Cavole et al., 2016; Gianelli et al., 2021). These events are expected to worsen with rising global temperatures, potentially leading to overexploitation or diminished profitability of fisheries (Berkes et al., 2006; Schmitt and Kramer, 2009). Therefore, addressing the issue of fisheries resilience is an urgent and critical priority.
The concept of “resilience” in marine fisheries, referring to their ability to rapidly adapt to and recover from disturbances, has garnered considerable global attention (Fabinyi and Liu, 2014). According to the latest FAO data, China accounted for nearly 15% of the global catch in 2023, surpassing the combined total of the second and third-ranked countries. As a leading nation in fishery resources, China plays a growing role in global fisheries production, trade, and consumption (Clarke, 2008; Clarke et al., 2007; Buluswar et al, Villasante et al., 2013).
However, China’s marine fisheries economy and efforts to improve its industrial structure have encountered significant challenges due to the pressures of economic transformation, escalating international trade disputes, and geopolitical conflicts. These challenges have created substantial barriers to the growth of China’s marine fisheries (Yan, 2020; Wang and Wang, 2019). In addition, secondary marine hazards and extreme weather events driven by climate change threaten fishery ecosystems, increasing the vulnerability and sensitivity of marine fisheries economies (Du et al., 2020; Sun et al., 2017). Therefore, it is crucial to assess and analyze the Marine Fisheries Economic Resilience (MFER) of China and investigate its influencing factors through comprehensive research (Lai et al., 2021). This study seeks to predict future development trends by identifying key patterns in the development of the MFER system. Ultimately, it provides empirical evidence to help adapt to the risks posed by marine diversification, enhance the resilience of fishery ecosystems to shocks, and promote growth and adaptive capacity.
The primary goal of this paper is to develop a framework for assessing MFER and explore the driving mechanisms behind changes in MFER. To achieve this, we have set the following objectives. First, to build a framework that evaluates MFER through Resistance and Recovery capability, Adaptation and Restructuring capability, and Innovation and transformation capability. Second, to analyze the spatial and temporal changes in China’s MFER from 2001 to 2020. Third, to identify the spatial heterogeneity of economic, social, and other factors influencing MFER. Finally, based on the current state of MFER development, we aim to predict its long-term evolution and trends, providing policy recommendations to support coastal provinces in safeguarding marine economic security. In considering this background, the marginal contributions of this study are as follows. First, we calculated the MFER index, which effectively reflects the level of regional MFER. The study explores the temporal evolution trends and spatial correlation characteristics of MFER, highlighting the essential features of provincial MFER in China. Second, the spatial dimension has been integrated into the econometric model, using both the geographic detectors method and fixed-effects regression to analyze the factors influencing MFER. Comparing the results of these two methods strengthens the reliability of the findings. Finally, the evaluation results of MFER are combined with the Markov transfer method to predict its long-term evolution and development tendency, thus providing a foundation for reference strategies for coastal provinces that maintain marine economic security.
The remaining parts of this study are organized as follows. Section 2 provides a concise overview of the existing literature, while Section 3 explains the particular models and methods employed in this study. Section 4 presents the results and discussion. Section 5 provides conclusions and policy implications from the result of this study.
2 Literature review
Resilience was originally a concept in engineering. However, in 1973, Holling introduced resilience into the field of ecology. Since then, resilience research has expanded significantly across various fields and disciplines (Holling, 1973). It has also followed an evolutionary trajectory, progressing from engineering resilience to ecological resilience, and then to evolutionary resilience (Chen, 2017; Zhu et al., 2021). Reggiani was the first to explore the evolution of spatial economic systems through the lens of resilience, and it has since gained prominence in economic geography and regional economics (Aura et al., 2000). Briguglio et al. (2014) developed a composite economic resilience index based on four dimensions: market efficiency, governance efficiency, social development, and economic stability. Building on this, Gong et al. (2022) created a resilience evaluation system for urban agglomerations, emphasizing three dimensions: risk resistance, adaptability, and innovation and transformation capacity. He et al. (2019) and Luo et al. (2023) employed geographic analysis techniques to examine the heterogeneity of trade resilience. Zhu et al. (2021) measured the resilience of industrial clusters by analyzing their resistance and adaptability and examined the factors influencing these dimensions. Previous studies reveal a lack of comprehensive research into resilience within specialized industries, such as marine fisheries.
Previous research on fisheries resilience has predominantly focused on coastal fishermen’s livelihoods and ocean policy. Gibbs (2009) examined resilience deficiencies in coastal communities from the perspective of marine policymakers. He advocates for the implementation of coastal community resilience management and the evaluation of resilience performance. (Lomboy et al., 2019) focused on developing economic resilience strategies for offshore fishers in the Philippines. These strategies aim to strengthen household assets, reduce risk, and align fishers’ livelihoods with sustainable fishing practices. Bakker et al. (2019), through fieldwork in Scotland’s Orkney Islands, found that strong social capital improves community resilience among fishermen and facilitates their participation in maritime spatial planning. Various policies have been developed to address risks in fisheries management. These include the Precautionary Principle (González-Laxe, 2005), Evaluation of Management Strategies (Punt, 2010), Robust Decision-Making (Regan et al., 2005), Proactive Adaptive Management (McCarthy and Possingham, 2007), Ecosystem-Based Management (Curtin and Prellezo, 2010), and the use of marine protected areas (Grafton et al., 2005; Humphreys and Clark, 2020). However, there remains a lack of research on the economic resilience of fisheries.
The key drivers of marine economic resilience primarily center on the impact of natural, political, social, and economic capital on marine ecosystem vulnerability. In this context, the relationship between marine ecosystems and economic resilience indicates that initiatives such as establishing nature reserves (Micheli et al., 2012), preserving marine ecosystems (Levin and Lubchenco, 2008), and protecting marine biodiversity (Cheung et al., 2017) contribute to sustaining the resilience and adaptability of marine economic systems. Moreover, regional policies and the marine economic system’s capacity for self-organization and coordination are critical for enhancing marine economic resilience (Gelcich et al., 2006). Within the fisheries sector, research has emphasized the effects of population growth on tropical marine and coastal ecosystems (Rice and Garcia, 2011). Additional studies have revealed that fisheries activities are also influenced by population growth (Butchart et al., 2010; Österblom et al., 2015). Climate change exacerbates these challenges by introducing new ecological and economic risks or intensifying existing vulnerabilities (Sumaila et al., 2011; Cheung et al., 2009; Diop et al., 2018; Lagarde et al., 2018). However, despite the critical role of marine fisheries in the maritime economy, research on the driving mechanisms behind their resilience remains limited.
In summary, extensive scholarly discussions on economic resilience have provided valuable insights into mitigating the harmful impacts of shocks on economic systems. However, most research has focused on terrestrial systems, with limited attention given to the resilience of the maritime economy. The fisheries economy plays a crucial role in the marine economy and is a key component of the “blue breadbasket” in the global food system. Nevertheless, the development of marine fisheries has faced complex challenges such as ecological pollution, disaster impacts, depletion of offshore fishery resources, reduced industrial opportunities, and changes in the international landscape (Yan, 2020). As a result, the sustainable development of the marine fisheries economy has become more complex, requiring the ability to cope with external uncertainties and adapt to internal structural changes. This underscores the need for diverse resilience strategies.
3 Methods and data
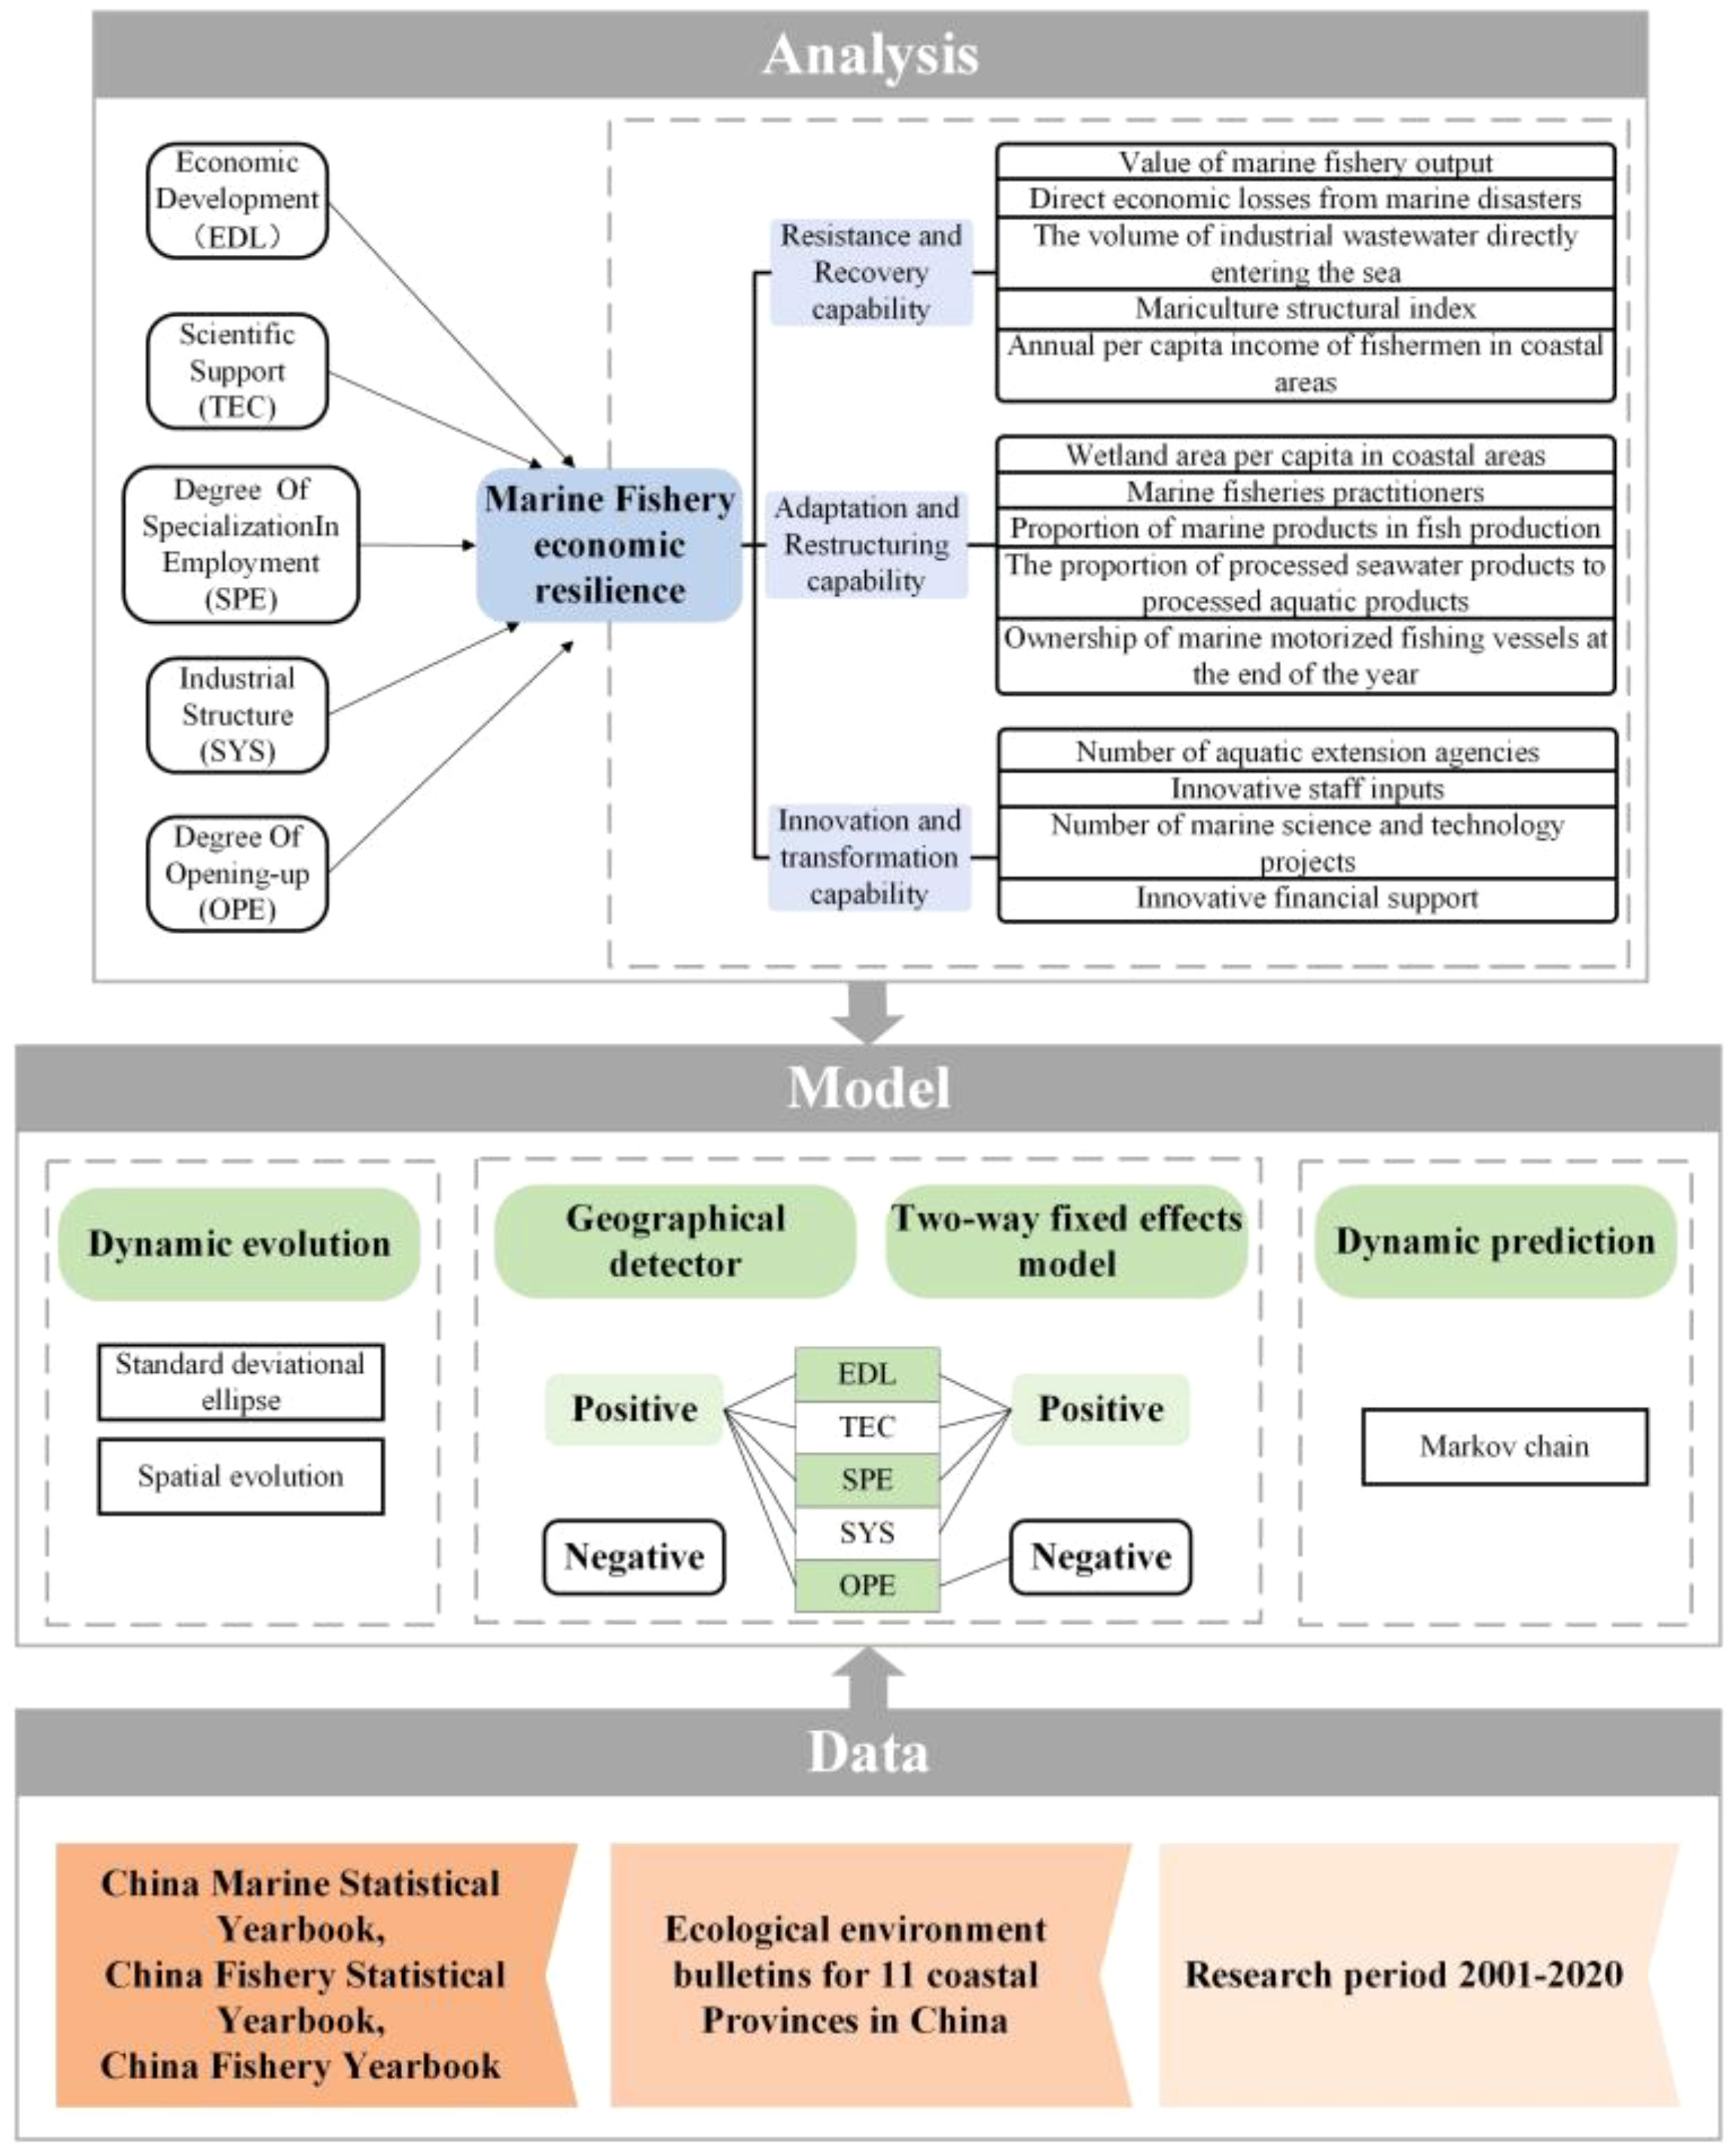
We measured the MFER index to evaluate the capacity of marine fisheries to withstand risks. Through exploratory spatial data analysis, we examined the spatial and temporal evolution of MFER across regions. We then used geographic detectors and a two-way fixed effects model to assess the influence of various driving factors on MFER. Furthermore, the Markov chain was applied to forecast future development trends, offering a scientific foundation for the coordinated improvement of MFER across provinces. The specific technical research framework is shown in Figure 1.
3.1 Construction of the evaluation indicator system
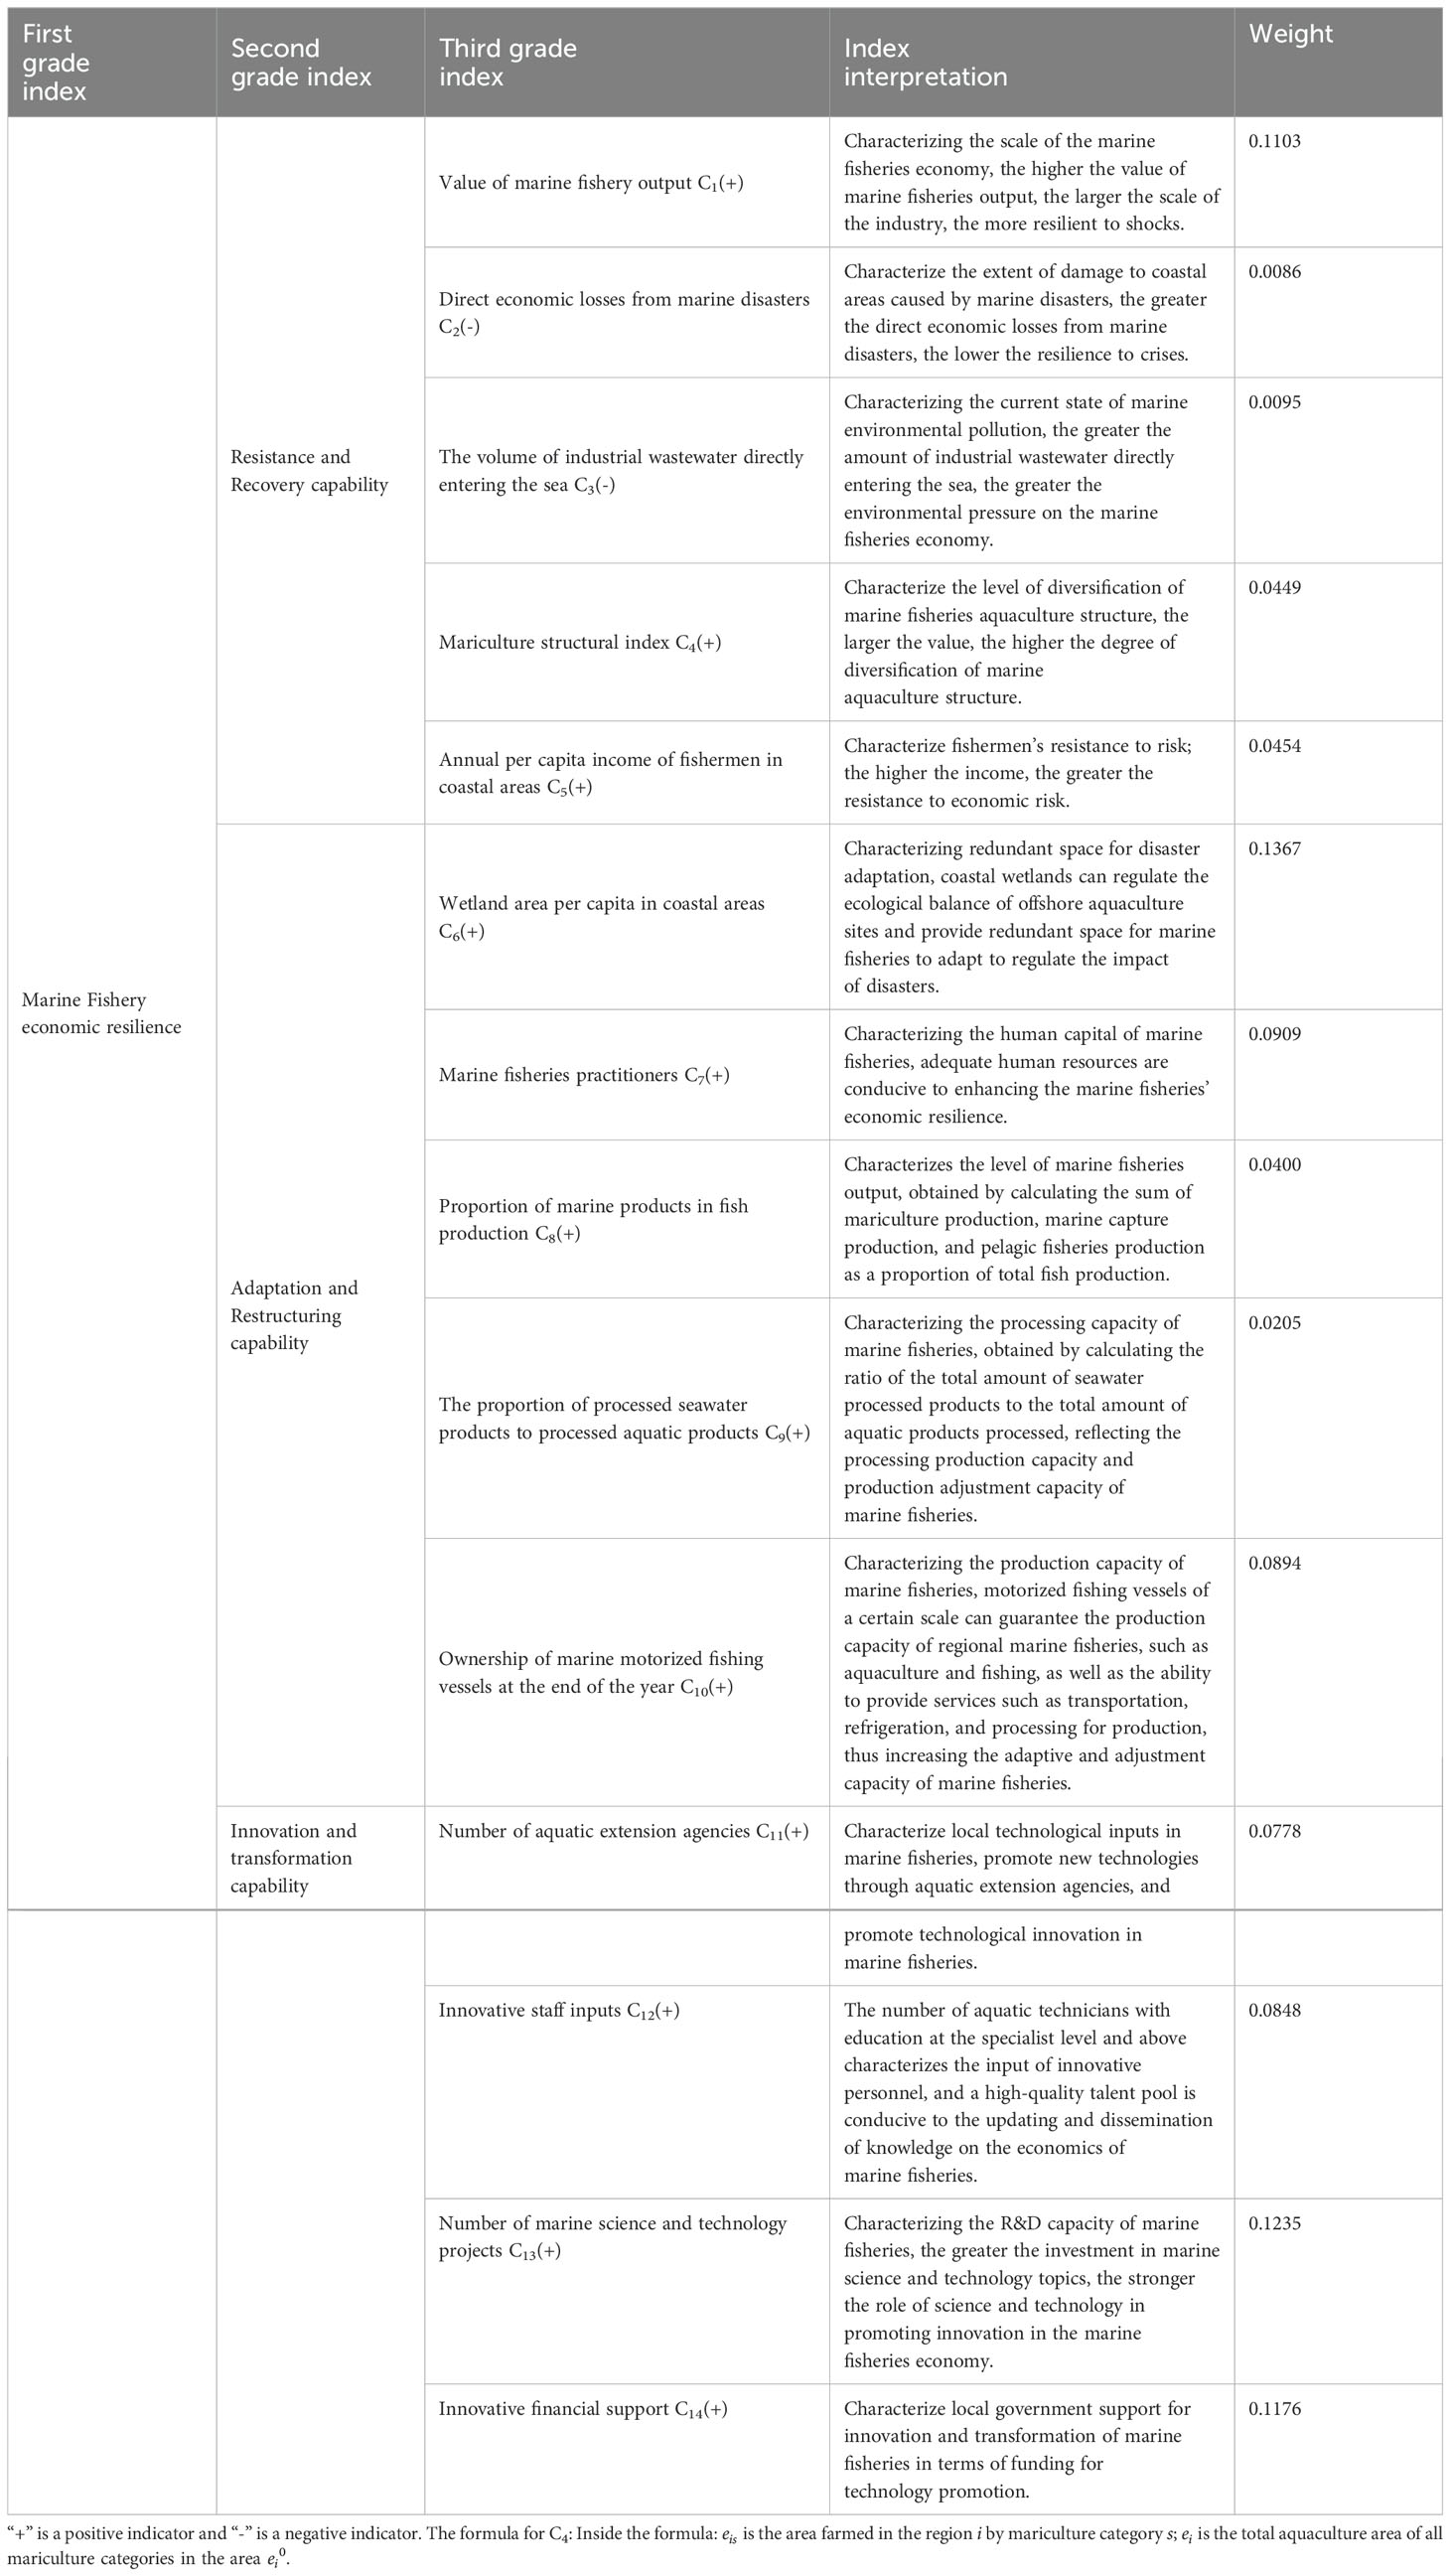
According to Wang and Wang (2019), economic resilience refers to a regional economy’s capacity to withstand disruptions, recover to its prior level of development, adapt to crises, reorganize internal factors, and pursue new models of development and rejuvenation. This concept of regional economic resilience integrates both “adaptation” and “transformation” attributes. The relevance of these four characteristics to the economic resilience of marine fisheries is significant, as fisheries are a vital part of the regional economy. Since resistance and resilience both refer to the system’s vulnerability and recovery from disturbances and are strongly correlated, they are combined into a single dimension in the evaluation. Finally, based on relevant research findings (Walker and Salt, 2012; Briguglio et al., 2014; Ding et al., 2020; Chen et al., 2010) and adhering to the principles of objectivity, scientific rigor, comprehensiveness, and practicality, we constructed an evaluation index system for MFER. This system is structured around three key dimensions: resistance and recovery capability, adaptation and restructuring capability, and innovation and transformation capability (Table 1).
Specifically, the scale of the industry, mariculture diversity, and fishermen’s income positively influence MFER, while land-based pollution and marine disasters have negative impacts, increasing vulnerability. Thus, resistance and recovery capability are represented by metrics such as marine fisheries output, direct economic losses from marine disasters, the volume of industrial wastewater directly entering the sea, the mariculture structure index, and the annual per income of fishermen in coastal areas. Furthermore, abundant human resources, coastal ecological buffer zones, and significant production capacity allow the marine fisheries economy to adapt dynamically during crises. Thus, adaptation and restructuring capability is represented by indicators such as Wetland area per capita in coastal areas, the marine fisheries practitioners, the proportion of marine products in fish production, the proportion of processed seawater products to processed aquatic products, and the ownership of marine motorized fishing vessels at the end of the year. Lastly, innovation and transformation capabilities are reflected in the number of aquatic extension agencies, innovative staff inputs, marine science and technology projects, and innovative financial support. The government has established specialized fisheries training institutions and deployed technical staff to support the introduction and dissemination of fisheries technology. Through knowledge renewal and technological innovation, path dependence is overcome, enabling the fisheries sector to recover from crises and progress to a new stage of development.
3.2 Methods
3.2.1 Coefficient of variation method
1. Standardization processing of raw data. The MFER consists of three subsystems, each of which contains several evaluation indicators under which the indicators themselves are positively or negatively differentiated. Therefore, to make the indicators comparable with each other, the raw data were standardized. The formulas are as follows:
Among them represent the methods used to standardize the treatment of positive and negative indicators, respectively. For the th indicator in the year , denotes the standardized value of the indicator, denotes the original value of the indicator, and the max and min denote the max and min values of the indicator, respectively.
2. Calculate the coefficient of variation. The formulas are as follows:
Where is the coefficient of variation, is the standard deviation, and is the mean.
3. The indicator weights are obtained. The formulas are as follows:
Where is the weight of each indicator and is the number of indicators in each subsystem.
3.2.2 Entropy weight method
1. Calculate the information entropy with the following formula:
where is the information entropy of the indicator, is the number of years of observation, and is the share of the th indicator in the -th year in the overall calendar year. The formulas are as follows:
2. Calculate the coefficient of variation between indicators with the following formula:
Where is the coefficient of variation, the larger its value, the smaller the entropy value of the corresponding indicator and the more important the indicator.
3. Obtain the indicator weights. The formula is as follows:
3.2.3 CRITIC-based portfolio weighting approach
1. Calculating weighted information content. The formulas are as follows:
Where, and are the information content of the two assignment results of (CV) and (EWM), respectively, is the correlation coefficient of and , and , are the standard deviation of and .
2. Compute the weight vector. The formulas are as follows:
where and are the weight vectors of and respectively.
3. The portfolio weights are obtained. The formulas are as follows:
where and are the results of the assignment of indicator in the and methods, respectively.
3.2.4 Standard deviational ellipse
The long and short axes of the standard deviational ellipse indicate the direction and range of the distribution of the data, respectively, and the center point shows the center position of the data. In this paper, the spatial distribution of economic resilience of the fishery economy is analyzed for inter-annual changes with the help of the standard deviational ellipse. The model equations can be found in Ref (Zhao and Zhao, 2014).
3.2.5 Geographical detector
The Geographical detector is less constrained in terms of assumptions than traditional statistical methods. The formulas are as follows:
Where, is the explanatory power of influencing factors =1, 2, ···. is the number of classifications. and are the number of sample units in the stratum and the whole area, respectively; and are the variance of the stratum and the whole area, respectively. takes the value of the range of [0,1], and the larger the value of is, the stronger the explanatory power of influencing factors on the marine fisheries’ economic resilience is.
3.2.6 Two-way fixed effects model
Based on the panel data of coastal provinces from 2001 to 2020 to test and compare different models, the following two-way fixed effects model is constructed:
Where subscript denotes province; denotes the year. denote the coefficients of economic development, scientific and technological innovation, marine fishery employment specialization index, industrial structure, and openness to the outside world on the resilience of the marine fishery economy. denotes the resilience denote the economic development, scientific support, degree of specialization in employment, industrial structure, and degree of opening-up. denotes the unobservable individual effect and the time effect, respectively, and denotes the random error term.
3.2.7 Markov chain
Markov chains are a method for studying stochastic transfer problems in which both time and state are discrete under conditions of no posteriority. The transfer of states in the evolution of many geographical or regional economic phenomena is characterized by the absence of posteriority(Pu et al.,2005). Thus, Markov chains are an effective way to analyze the convergence of regional growth clubs(Qin and Tang, 2007). The specific application of the Markov chain is to discretize the data of continuous attribute values at different moments of geographic phenomena, convert them into types by hierarchical classification of values, calculate the probability distribution of each type and its changes, and thus approximate the evolution of things as a Markov process.
By expressing the distribution of this class of attribute types at moment in terms of the state probability vector of , the whole state transfer process of the thing can be abstractly represented by a Markovian transfer probability matrix with a probability value of for . denotes the probability value of a spatial unit belonging to type in year transforming to type in year , using the following formula:
Where denotes is the sum of the number of spatial units transformed from type in the year to type in the year during the study period, and is the sum of the number of spatial units of type in all years of the study period. At the same time, the direction of the shift is defined according to the increase, no change, and decrease in the level of economic types of spatial units. Markov chain analysis is used to construct the Markov shift probability matrix, discretize the continuous comprehensive evaluation value of marine fisheries’ economic resilience into types, calculate the corresponding type probability distribution and its inter-annual change, and study the whole process of China’s marine fisheries’ economic resilience development, as well as make a dynamic prediction of how it will evolve in the future.
3.3 Data source
The study spans from 2001 to 2020, while the geographic focus is on the Chinese coastal provinces, including autonomous areas and municipalities directly under the central government. These provinces include Tianjin, Hebei, Liaoning, Shanghai, Jiangsu, Zhejiang, Fujian, Shandong, Guangdong, Guangxi, and Hainan. The primary sources of data utilized in this study were the China Marine Statistical Yearbook, China Fishery Statistical Yearbook, China Fishery Yearbook, province ecological environment bulletins, etc. Linear interpolation was used to fill in the missing data points.
4 Results and discussion
4.1 Results of the evaluation
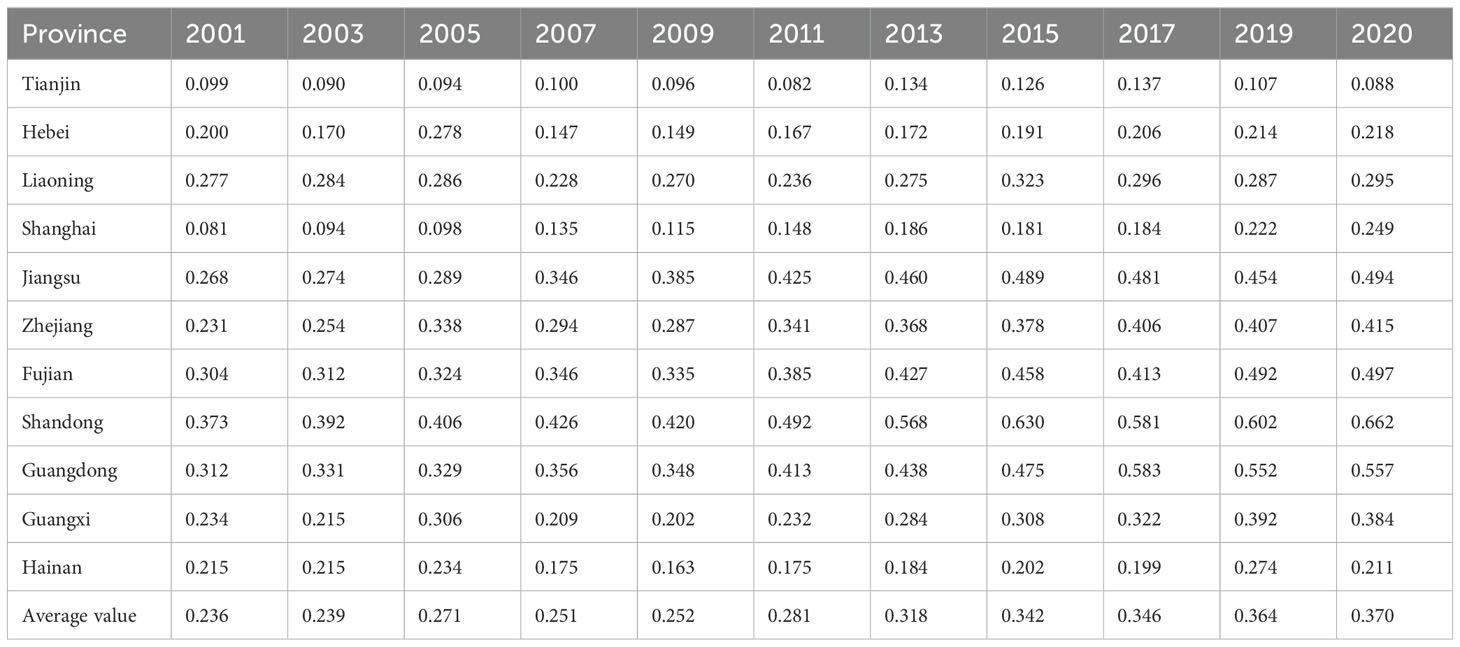
MFER was calculated for 11 coastal provinces and regions in China from 2001 to 2020, using Equations 1-10), with results shown in Table 2. China’s MFER has followed a fluctuating upward trend, increasing from 0.236 in 2001 to 0.370 in 2020, with an average annual growth rate of 2.4%. Between 2001 and 2005, the Ministry of Agriculture introduced a seasonal fishing moratorium across all sea areas. They also restructured marine fishing and economic growth models, promoting artificial reefs and stock enhancement, which improved the sustainable use of marine fishery resources. As a result, MFER showed a gradual upward trend. However, from 2005 to 2007, marine fishery resource exploitation declined, along with a reduction in the value added by the industry, causing China’s overall MFER to drop to 0.251. From 2007 to 2020, China’s MFER showed a significant increase. In 2020, the MFER was approximately 1.47 times higher than in 2007. In 2013, the average MFER value exceeded 0.30, marking a substantial improvement in the risk-resistance of China’s marine fisheries over 14 years.
4.2 Spatial and temporal characteristics of MFER
4.2.1 Center of gravity shift in the MFER
According to the results of marine fisheries economic resilience measurement, relying on Arc⁃GIS10.8 software, analyze the migration of the center of gravity of resilience (Figure 2) and draw the spatial pattern evolution of marine fisheries economic resilience (Figure 3).
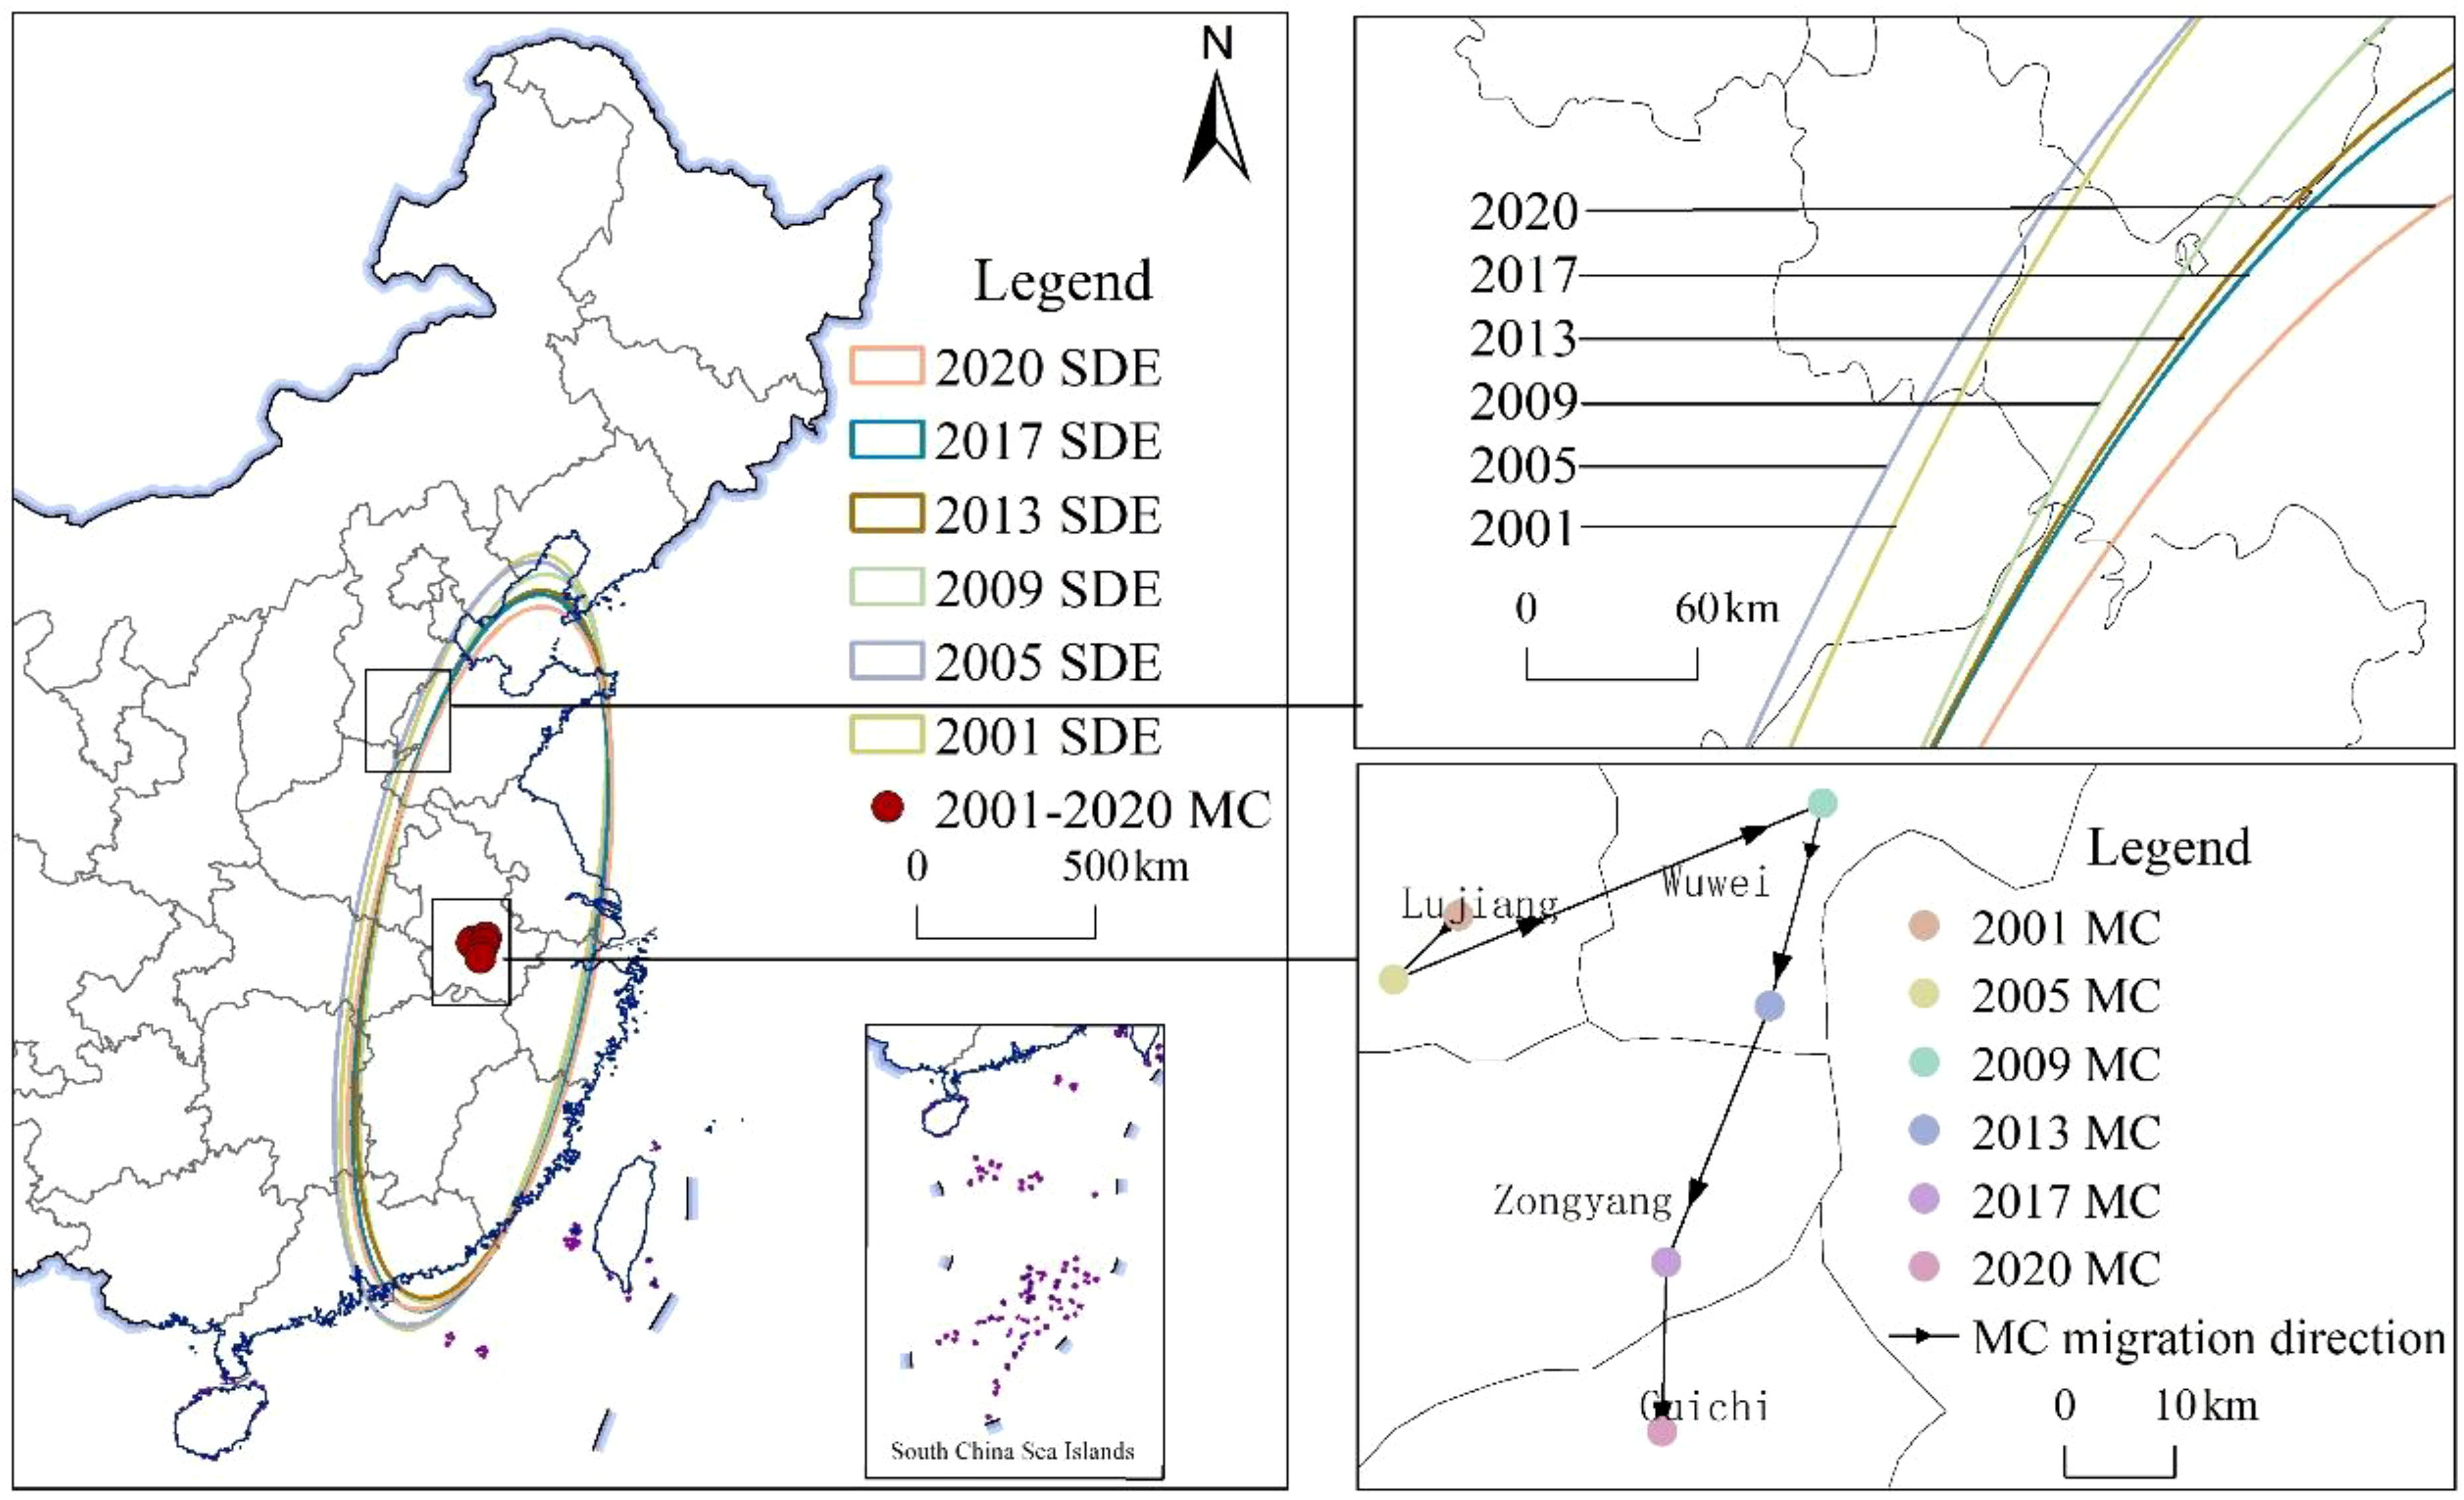
Figure 2. Spatial distributions in SDE and MC of marine fishery economic resilience in China from 2001 to 2020.
The center of gravity migration path from the Northwest (2001-2005)→ Northeast(2005-2009)→Southwest(2009-2013)→Southwest(2013-2017)→Southwest(2017-2020), generally showing a discernible moving trend from North to South (2001-2020). Analysis reveals that the center of MFER exhibits an escalating movement rate over the years, as observed from 2001-2005 (1.45 km/year) to 2017-2020 (3.21 km/year). The center of gravity moved at a faster rate during 2005-2009 (11.34 km/year) and 2009-2013 (5.75 km/year) but slowed slightly during 2013-2017 (5.66 km/year). China’s MFER concentration is mainly located in the central region of the 11 coastal provinces, autonomous regions, and municipalities (Shanghai). Additionally, the economic center of gravity has noticeably shifted southward, aligning with the development patterns of the coastal fisheries economy.
The changes in the spatial distribution of MFER reveal that the patterns of economic resilience among China’s coastal provinces are generally similar. Notably, the SDE representing China’s MFER has shown a decreasing trend, with its area shrinking from 1,105,000 km² in 2001 to 1,019,900 km² in 2020. During the 2001-2009 period, the SDE exhibited a northwest-southeast orientation. The length of the long semiaxis decreased from 1,107.69 km in 2001 to 1,038.48 km in 2009, while the short semiaxis shrank from 319.20 km to 306.35 km during the same period. Additionally, the disparity between the long and short semiaxes tended to widen. This indicates that the spatial distribution of MFER has become more defined in terms of directionality and discreteness, with the SDE especially prominent in the northern direction. From 2010 to 2020, the SDE showed more pronounced development in the southwestern direction as the centroid shifted. The longitudinal axis significantly declined, while the latitudinal axis exhibited an upward trend. Specifically, the longitudinal semiaxis shortened from 1,020.53 km in 2010 to 1,005.21 km in 2020, while the latitudinal semiaxis expanded from 308.82 km to 323.02 km during the same period. These results suggest that the spatial distribution of MFER in coastal provinces remained relatively stable during this period. The dominant direction remains north-south, with the longitudinal axis gradually shifting southward. In summary, the spatial distribution of resilience in the marine fisheries industry is characterized mainly by a north-south orientation, with an emerging east-west pattern.
4.2.2 Trends in the spatial and temporal evolution of MFER
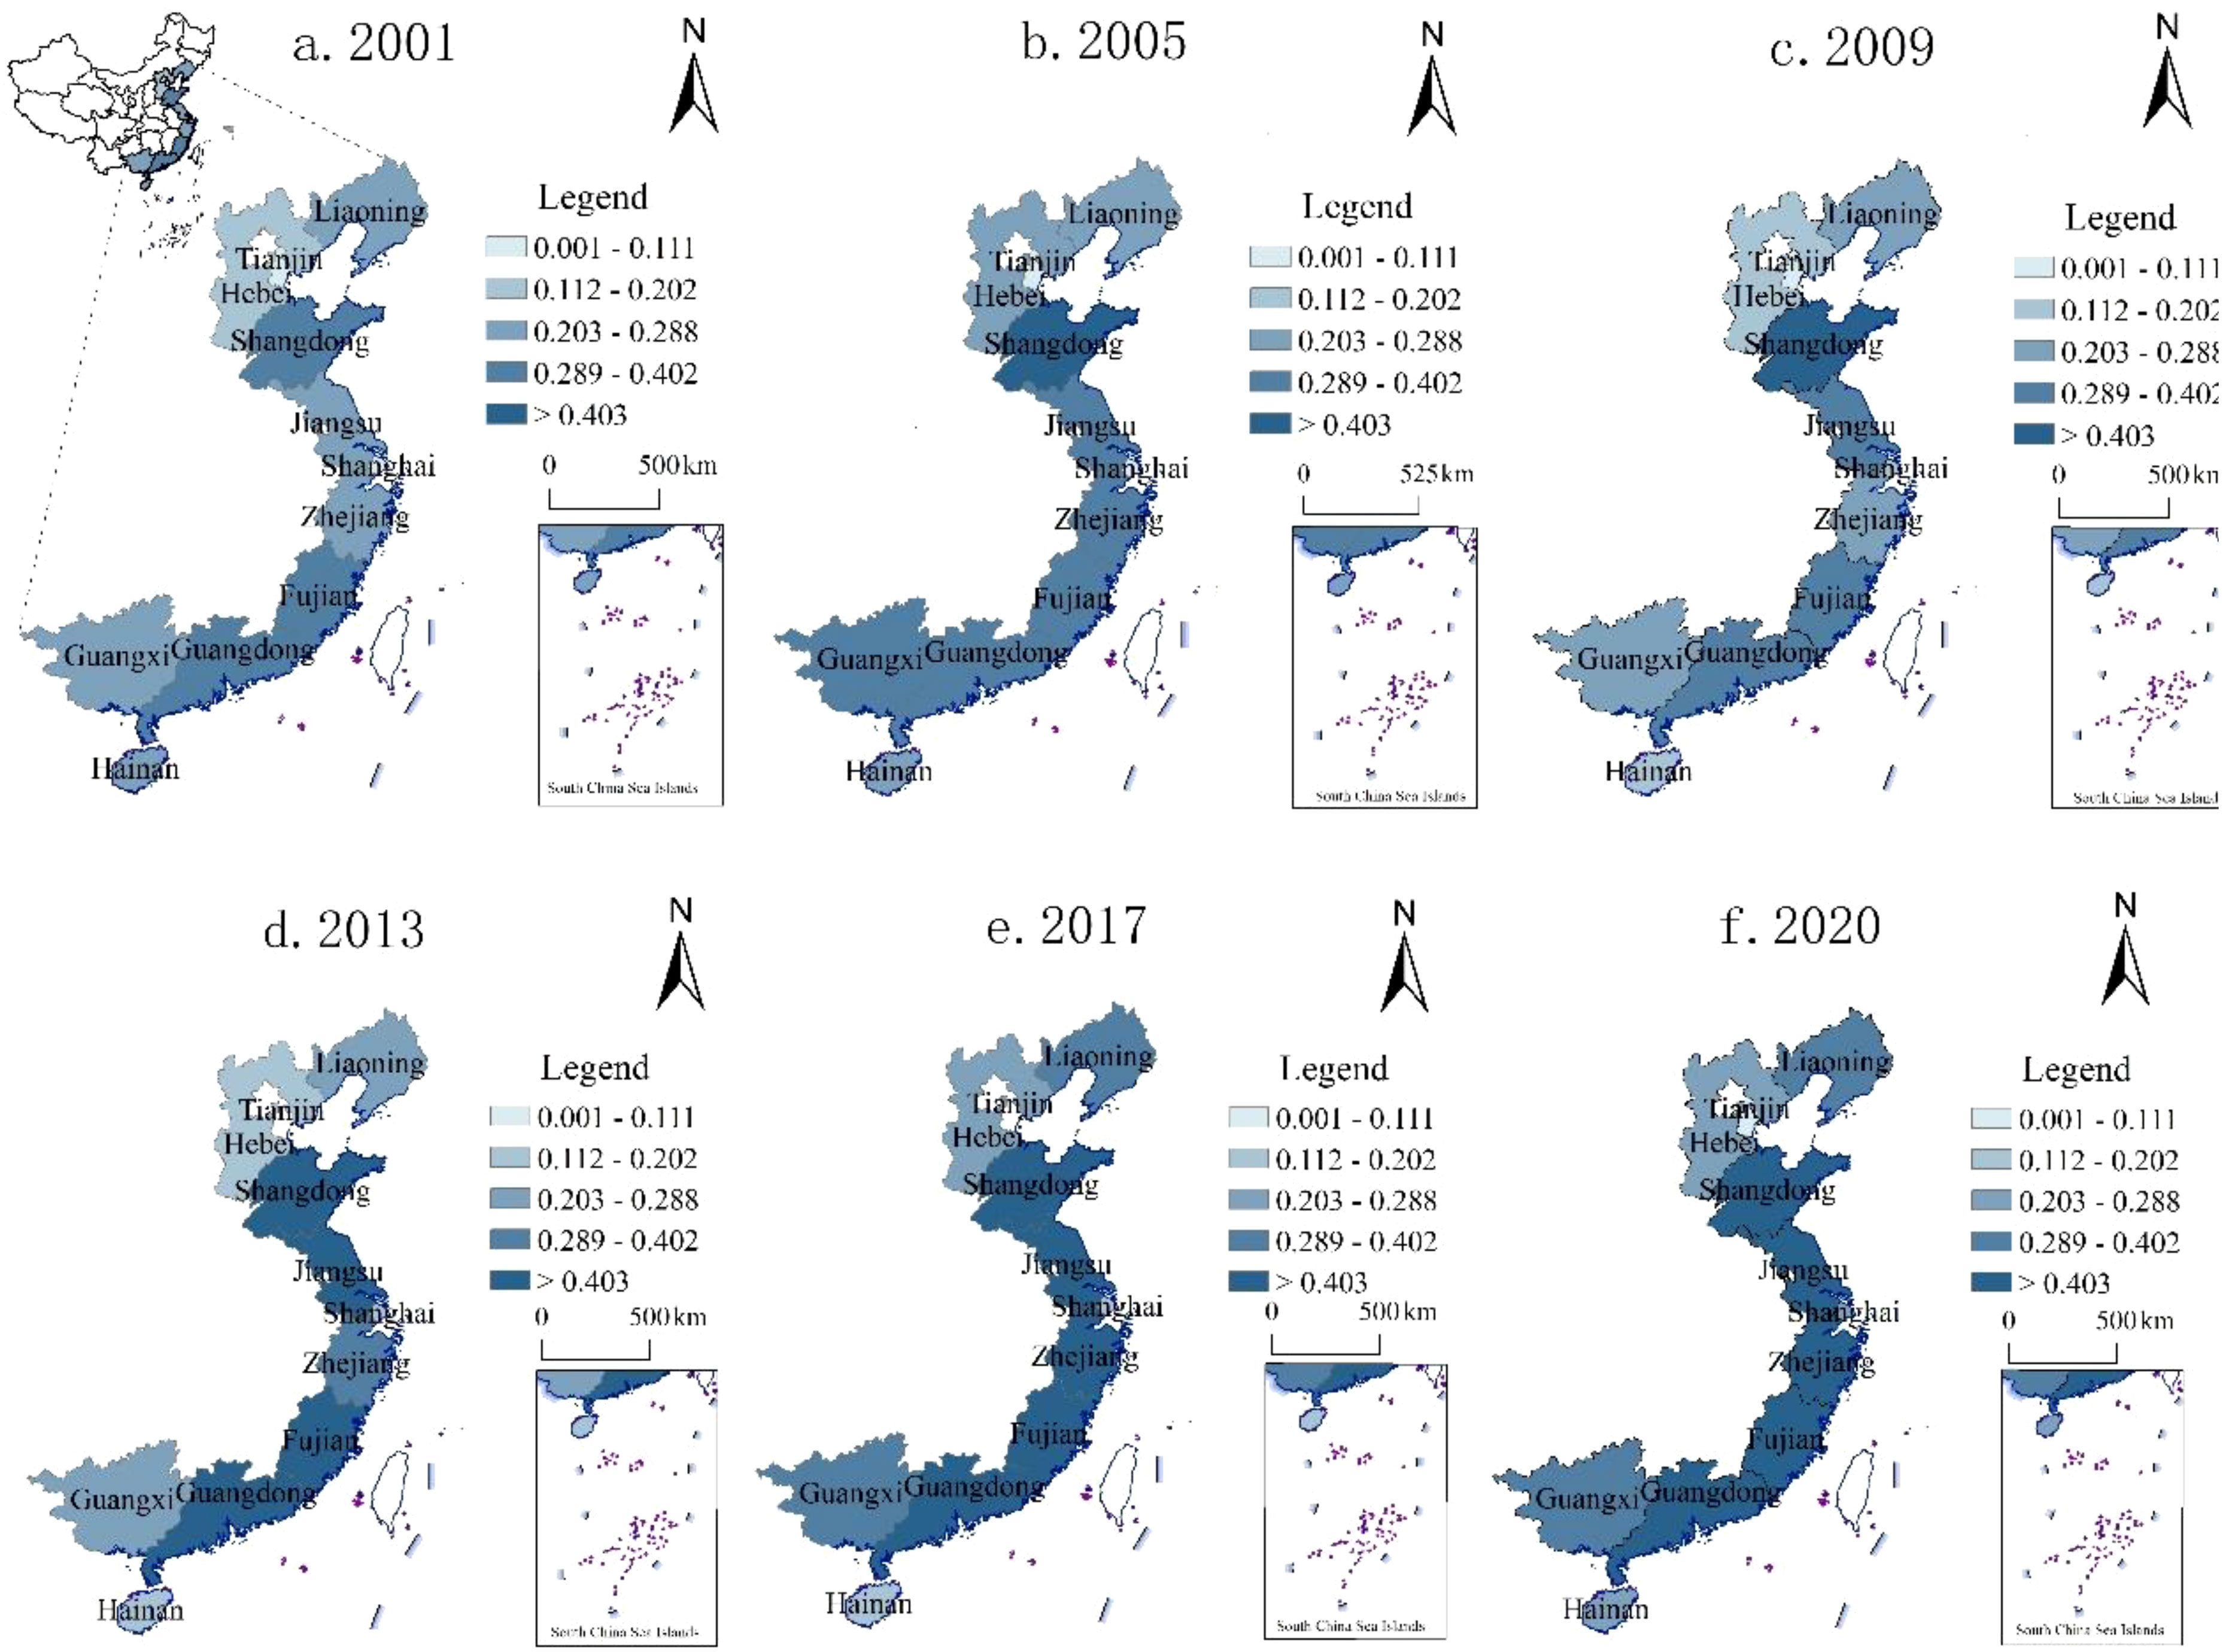
The natural breakpoint classification method was employed to categorize the resilience level of the marine fisheries economy in each province into five distinct categories: lower value (0.001~0.111), low value (0.112~0.202), medium value (0.203~0.288), high value (0.289~0.402), and higher value (>0.403). These categories were selected for mapping the spatial pattern of the evolution of the resilience level of the marine fisheries economy in coastal provinces in the years 2001, 2005, 2009, 2013, 2017, and 2020 (Figure 3).
Overall, the MFER has been improved in 2001-2020, but there are significant regional differences. Using the Yangtze River Delta as the central dividing line between southern and northern coastal provinces, the southern provinces exhibit slightly higher resilience than the northern ones. The number of provinces with high MFER has grown over time. In 2005, only one province (Shandong) showed high resilience, but by 2020, this had expanded to five provinces (Zhejiang, Jiangsu, Fujian, Shandong, and Guangdong). The overall number of provinces in high, medium, low, and lower resilience categories has remained relatively stable.
Specifically, the spatial and temporal evolution in resilience can be classified into three distinct scenarios: First, the marine fisheries economy has shown strong resilience, particularly in Liaoning, Zhejiang, Fujian, Shandong, and Jiangsu. These regions benefit from effective resource allocation, strong industrial infrastructure, large market sizes, and a supportive policy environment. As a result, they have demonstrated a remarkable ability to quickly adapt to external shocks and navigate long-term challenges, surpassing reliance on established patterns to create new growth opportunities. Additionally, their capacity to proactively adapt their industrial structure and drive innovation and transformation has been key to fostering resilient development despite internal challenges. Second, MFER in Tianjin and Shanghai is declining due to various factors. Marine fisheries are not the primary drivers of the local economy, leading to reduced competitiveness in production, trade, and market participation. Moreover, these regions suffer from limited marine fisheries resources and an over-reliance on a single sector. Together, these issues weaken the MFER in both Tianjin and Shanghai. Third, MFER in Guangdong, Hainan, Guangxi, and Hebei has experienced significant fluctuations. In these areas, the marine fisheries industry is hindered by inefficient resource exploitation and outdated production technologies, which have led to the depletion of near-shore fisheries and weakened social capital. These regions are also highly vulnerable to natural disasters like typhoons, which further exacerbate the fragility of their marine fisheries economy. Additionally, low policy support and insufficient innovation momentum pose challenges. While these regions may temporarily endure due to existing industrial conditions, they struggle to adapt to long-term disruptions and risks, especially post-crisis. As a result, MFER in these regions consistently ranks lower than in the other 11 coastal provinces and regions.
4.3 Analysis of influencing factors
4.3.1 Selection of influencing factors
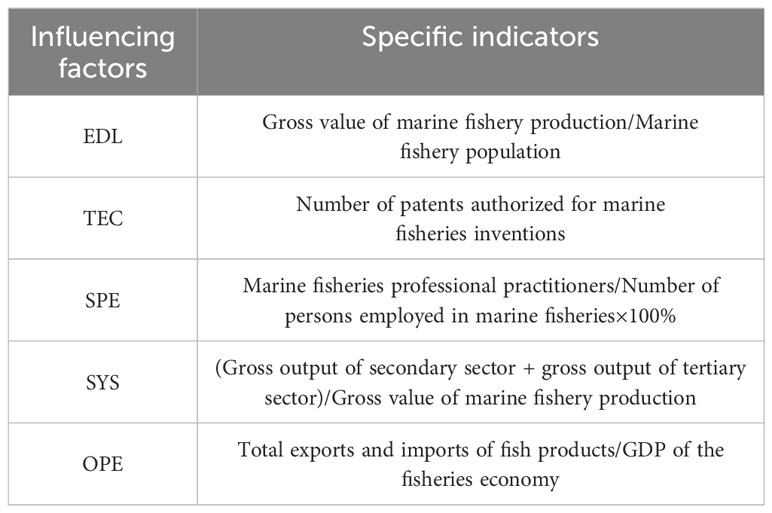
The MFER is influenced by various factors, selected based on the developmental levels of coastal provinces and regions. These specific factors are detailed in Table 3. The per capita total economic output of marine fisheries reflects the economic benefits fishermen receive from participating in fishery production. Economic returns are influenced by the development of the fishery economy and the incentives that motivate fishermen’s participation in production. The level of scientific and technological advancement in regional fisheries reflects the extent of scientific support. Science and technology are key drivers of productivity, and their integration is crucial for improving fishery development and economic efficiency. Employment specialization in marine fisheries reflects the extent of structured training fishermen receive for fishery production and management. Increasing fishermen’s professionalism significantly boosts expected output and reduces unexpected outcomes, thereby impacting MFER. MFER depends on optimizing the industry’s structure, which directly affects the marine fisheries economy. The degree of openness is critical for determining how resources, technology, and talent are exchanged with external environments. This exchange strengthens the resilience of marine fisheries, particularly by fostering innovation. Therefore, the factors influencing the MFER include economic development (EDL), scientific support (TEC), employment specialization (SPE), industrial structure (SYS), and openness (OPE).
4.3.2 Analysis of the model regression results
To investigate the influencing factors using a Geographical detector, it is necessary to initially assign discrete grades (5 levels) to the independent variables using the quantile grading method. Subsequently, a Geographical detector is employed to determine the explanatory power q-value of the chosen influencing factors on the MFER. Additionally, the correlation coefficient between the respective variables and the dependent variables is calculated using Pearson’s method (Table 4).
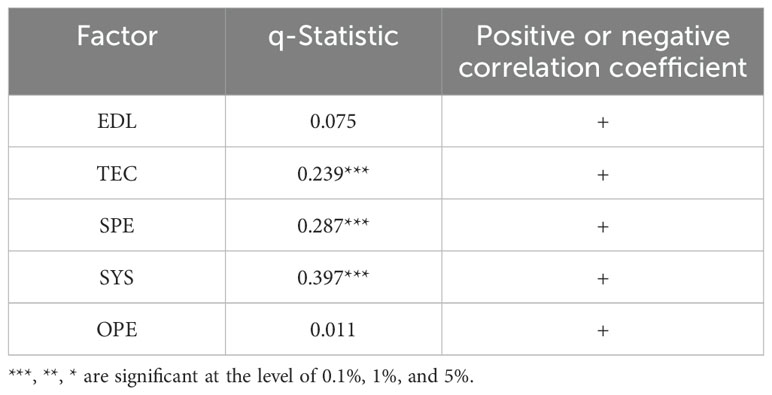
Table 4. The explanatory power and Pearson correlation coefficient of the factors affecting the resilience of the marine fishery economic.
Constructing a two-way fixed effect model to test the data for the problems of cross-sectional correlation of error terms, autocorrelation of error terms and model heteroskedasticity showed the presence of the three problems mentioned above. To ensure the robustness of the estimation results, Stata 16.0 was applied to treat each of the three problems using multiple regressions and report the results (Table 5).
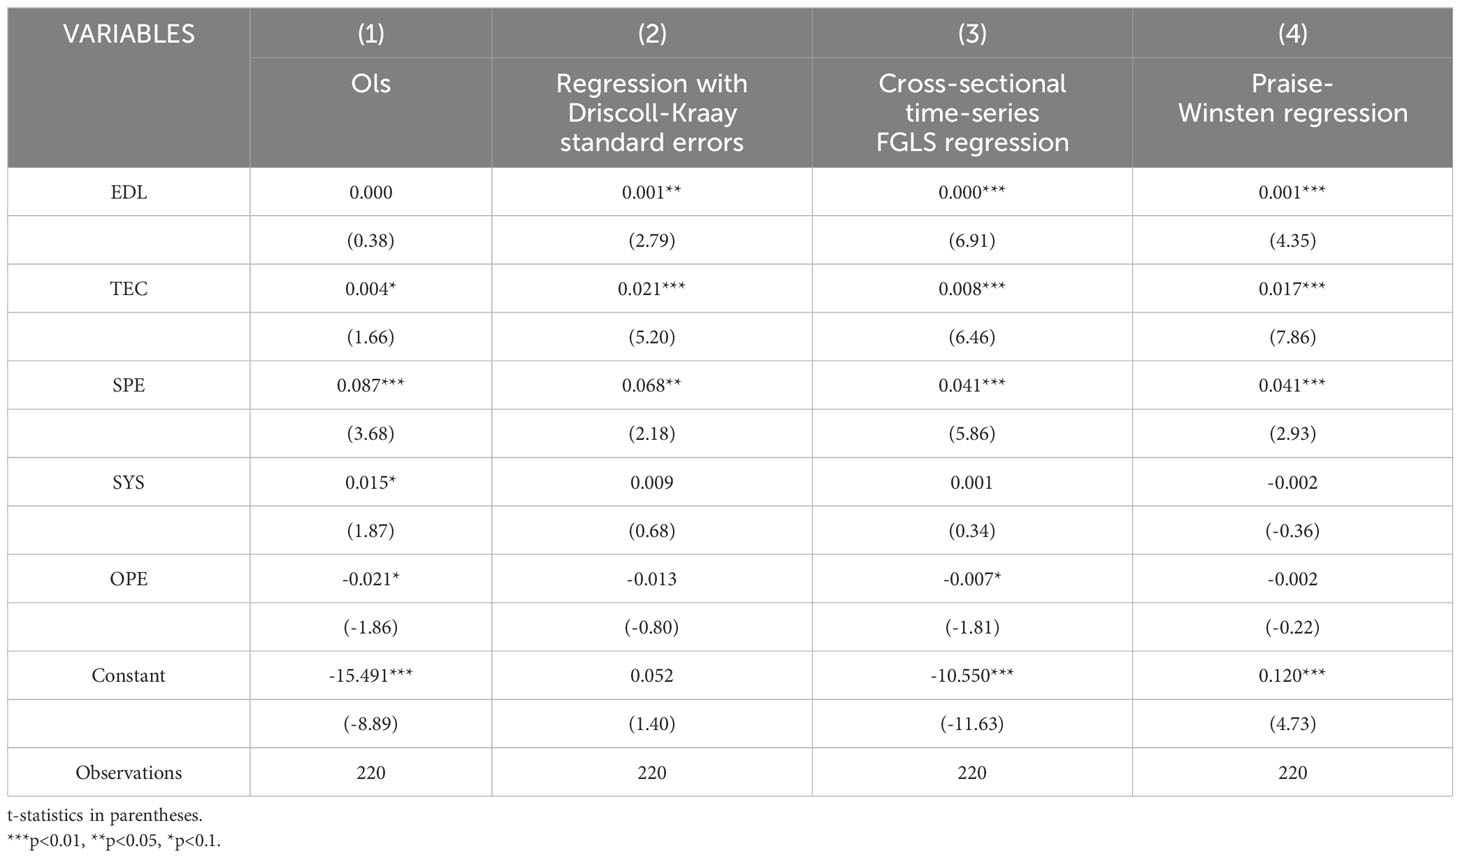
Table 5. Parameter estimation results of the influencing factors of marine fisheries’ economic resilience.
The Geographical detector analysis indicates that the presence of EDL and its legal framework positively influences the overall resilience of the marine fisheries industry. However, this relationship’s explanatory power is weak and lacks statistical significance. The two-way fixed effects regression analysis revealed a statistically significant positive relationship between EDL and MFER. The economic development of marine fisheries in coastal provinces has shown a clear upward trend. This growth indicates that fishermen’s income levels have been significantly affected by the development of marine fisheries. Additionally, improvements in capital, technology, and fishery infrastructure have significantly boosted the motivation of coastal fishermen. Consequently, improvements in capital, technology, and fishery infrastructure have significantly boosted the motivation of coastal fishermen. Thus, it can be concluded that the positive influence of economic development has a significant impact on MFER.
By combining the q-value from the Geographical detector analysis with the correlation coefficients, it is clear that TEC in fisheries has a statistically significant positive impact on MFER. This result is consistent with the findings from the fixed effects regression analysis. Regions with high levels of TEC tend to use advanced scientific and technological methods in marine fisheries. These advancements improve fish fry quality, raise standards for fishery breeding and cultivation, and promote the development of deep-processing techniques. This strengthens the MFER against economic shocks and disturbances, increasing its ability to manage risks.
The implementation of SPE has shown a significant positive impact on MFER. SPE reflects the level of specialization among fishermen engaged in fishery production. The increasing focus on protecting the marine ecological environment has highlighted the need for standardized marine fishery practitioners, who play a vital role in reducing the environmental impact during fishery development.
The positive SYS in the marine fisheries industry aligns with global development trends in the sector. This progress supports the optimization and advancement of the SYS in marine fisheries, contributing to improved MFER. Compared to the traditional primary sector, the secondary and tertiary fisheries sectors are less resource-dependent and offer higher returns (Sun et al., 2017). Additionally, these sectors cause less harm to the marine ecosystem while providing greater economic benefits for the development of marine fisheries. As a result, these developments enhance the ability of marine fisheries to manage and adapt to unexpected disruptions and disturbances.
The Geographical detector analysis shows that OPE has a positive impact on MFER but with weak explanatory power (0.011) and no statistical significance. However, Pearson correlation analysis and fixed effects regression offer different perspectives on the impact of OPE as a variable. Pearson correlation analysis focuses only on the relationship between MFER and a single factor, ignoring other variables. When considering the actual context, higher levels of OPE reflect a greater influence of international economic conditions on the marine fisheries economy. This increases dependence on external factors and leads to greater fluctuations in the marine fisheries economy, especially in peripheral areas where uncertainty is more pronounced. Therefore, the fixed effects regression analysis suggests that OPE negatively impacts MFER.
4.4 Further study: dynamic prediction of the MFER
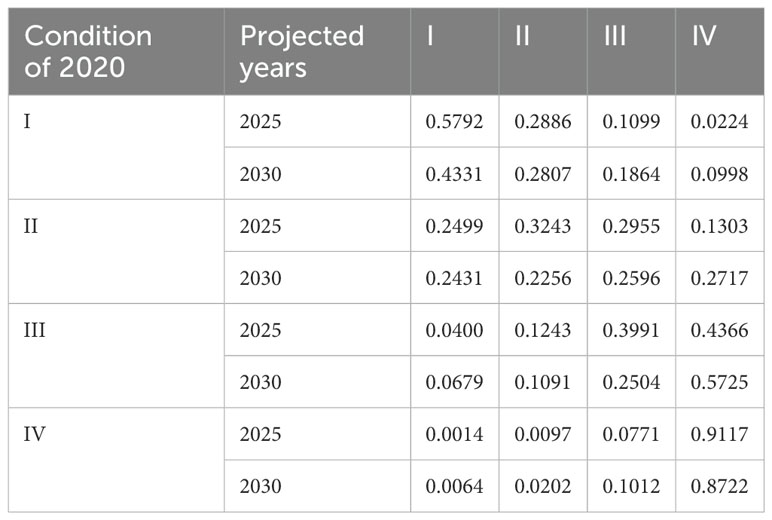
To conduct a comprehensive analysis of the spatial-temporal evolution characteristics of China’s MFER, we have developed a Markov chain transfer probability matrix. The MFER was categorized into four states: low, medium, high, and very high, denoted as k = I, II, III, and IV, respectively. The objective was to investigate the presence of a club convergence phenomenon at each development state, assess its stability (Table 6), and provide dynamic predictions for the development level of the MFER in the years 2025 and 2030 (Table 7). The concept of transferring from lower to higher values is referred to as upward transfer, while the act of transferring from higher to lower values is termed downward transfer.
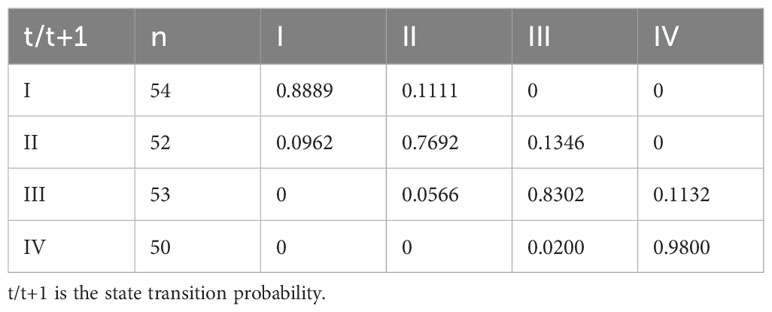
Table 6. Distribution of state transfer matrix of the marine fishery economic resilience based on the Markov chain.
4.4.1 Spatial M-transformation
The higher diagonal values compared to non-diagonal values indicate greater stability in China’s MFER at each stage of development. First, the higher probabilities on the diagonal show that China’s MFER is more stable at each development stage, with provinces more likely to maintain their original state. Second, China’s MFER can be classified into four stages of convergence. A “club convergence” phenomenon is evident, where marine fisheries’ economic resilience tends to remain in the same state in subsequent stages. The probability of maintaining a lower level of resilience is 88.89%, while for the higher level, it is 98%. Finally, the geographical factor plays a significant role in the MFER transfer process among China’s coastal provinces. Specifically, there is a mutual influence between neighboring provinces and regions. The MFER development in neighboring provinces either promotes or inhibits the development of MFER in adjacent regions.
4.4.2 Projection results
To comprehensively analyze the phases and patterns of China’s marine fisheries sector, it is crucial to understand the fluctuations in MFER and dynamically predict changes in MFER of China by 2025 and 2030 (Table 6).
Using data from the 2020 base period, projections for 2025 show a 57.92% likelihood that MFER will remain concentrated in provinces with lower development levels. There is also a 28.86% probability of transitioning to medium-level development and a 10.99% chance of progressing to higher levels. By 2030, the likelihood of maintaining the same development level decreases by 14.61% compared to 2025, while the probability of reaching a higher level rises to 9.98%. In 2025, there is a 32.43% chance that provinces will remain at the intermediate level and maintain their current stage of development. Additionally, there is a 29.55% chance of progressing to a higher level of development and a 13.03% chance of advancing to a high-level stage. By 2030, the probability of maintaining the original state decreases to 22.56%, while the chances of progressing to higher and high-level stages rise to 25.96% and 27.17%, respectively. In 2025, provinces at higher development levels have a 39.91% probability of maintaining their state and a 43.66% chance of progressing further. By 2030, the probability of remaining in the initial state decreases to 25.04%, while the chance of progressing to a higher level increases to 57.25%.
5 Conclusions, policy implications, and research prospects
5.1 Conclusions
This paper based on resilience theory, defines the concept of MFER and develops an evaluation index system encompassing three dimensions: resistance and recovery capability, adaptation and restructuring capability, and innovation and transformation capability. It systematically examines the spatial and temporal evolution of MFER in China’s coastal provinces from 2001 to 2020. Using the geographical detector method and a two-way fixed effects model, the study explores the influencing factors of MFER. Additionally, the Markov chain is applied to analyze the dynamic evolution characteristics of MFER. The main conclusions are as follows.
First, regarding evolutionary characteristics in Spatial and temporal, China’s MFER has exhibited a fluctuating upward trend, with its center of gravity shifting southward at an accelerating rate. The center of MFER has generally moved towards the southeast, with a stable spatial pattern, predominantly oriented along the north-south axis while also developing in an east-west direction. This may be due to the leading MFER in southern regions such as Fujian and Guangdong, where the fisheries economy has been continually transforming. These regions have established national aquatic germplasm resource protection zones and actively implemented marine ranching, promoting ecological sustainability and industrialization in the fisheries economy. It is worth noting that the MFER levels in Guangdong, Hainan, Guangxi, and Hebei have exhibited fluctuations, highlighting a degree of uncertainty and volatility.
Second, the empirical results indicate that EDL, TEC, SPE, and SYS, have a significant positive impact on MFER. However, OPE to foreign trade has a negative effect on MFER. It is important to note that OPE is an inherent requirement for integrating the marine fisheries industry into the global division of labor. Therefore, further analysis is needed to understand the complex effects and mechanisms through which openness influences MFER and to explore ways to mitigate its negative impacts on economic resilience within the “dual circulation” strategy.
Third, dynamic predictions indicate that the likelihood of coastal provinces maintaining their current MFER levels will gradually decrease, while the probability of advancing to higher stages will increase. A “leapfrog” progression across stages may occur, with the probability of such transitions expected to strengthen over time. However, provinces and cities already at higher levels are expected to maintain their current development without significant changes.
5.2 Policy implications
This study offers the following policy implications based on the findings. First, strengthen regional coordination to promote collaborative development between northern and southern coastal provinces. Enhancing regional coordination through the establishment of cooperative mechanisms can facilitate the sharing of fisheries technology and resource integration. High-resilience regions such as Fujian and Guangdong should take the lead, sharing advanced experiences with northern and eastern provinces to foster mutual improvement and coordinated development.
Second, promote innovation in fisheries technology and optimize the industrial structure. Increased investment in fisheries R&D will foster innovation and accelerate the translation of research into practical applications. At the same time, the industrial structure should be optimized by expanding tertiary sectors such as recreational and tourism fisheries, reducing dependence on primary industries. This approach will encourage diversification and specialization in the fisheries economy, strengthening overall economic resilience.
Third, support “leapfrog” development to enhance the resilience of mid- and low-resilience regions. Provide technical assistance, policy guidance, and financial incentives to help these regions accelerate resilience improvement and promote leapfrog development. Meanwhile, continued support for high-resilience provinces should ensure they remain stable at advanced levels, preventing any potential decline in resilience.
5.3 Limitations and research prospects
Although this study systematically analyzes the spatial-temporal evolution, influencing factors, and dynamic characteristics of MFER in China’s coastal provinces, and offers corresponding policy recommendations for the sustainable development of fisheries, certain limitations remain. These limitations need to be addressed and further explored in future research.
First, data limitations pose a significant challenge. Due to restricted access to data, this study is based on provincial-level information, which does not fully capture regional variations or micro-level factors. Future research could employ more detailed data at the municipal or county level to provide a more comprehensive understanding of MFER characteristics across different regions. Second, the complexity of intermediary mechanisms has not been sufficiently explored. While this study focuses on factors such as EDL, TEC, SPE, SYS, and OPE, the potential influence of other mechanisms remains an area for further investigation.
Data availability statement
The raw data supporting the conclusions of this article will be made available by the authors, without undue reservation.
Author contributions
XC: Writing – review & editing, Writing – original draft, Software, Methodology, Investigation, Data curation. HW: Writing – review & editing, Visualization, Supervision, Resources, Project administration, Methodology, Funding acquisition, Conceptualization. YZ: Writing – original draft, Software, Data curation.
Funding
The author(s) declare that financial support was received for the research, authorship, and/or publication of this article. This study was supported by The National Natural Science Foundation of China (Grant No. 72373078).
Conflict of interest
The authors declare that the research was conducted in the absence of any commercial or financial relationships that could be construed as a potential conflict of interest.
Publisher’s note
All claims expressed in this article are solely those of the authors and do not necessarily represent those of their affiliated organizations, or those of the publisher, the editors and the reviewers. Any product that may be evaluated in this article, or claim that may be made by its manufacturer, is not guaranteed or endorsed by the publisher.
References
Aura R., Thomas D. G., Peter N. (2000). Resilience: An evolutionary approach to spatial economic systems. Networks Spatial Economics 2, 211–229. doi: 10.1023/A:1015377515690
Bakker Y. W., de Koning J., van Tatenhove. J. (2019). Resilience and social capital: The engagement of fisheries communities in marine spatial planning. Mar. Policy 99, 132–139. doi: 10.1016/j.marpol.2018.09.032
Berkes F., Hughes T. P., Steneck R. S., Wilson J. A., Bellwood D. R., Crona B., et al. (2006). Globalization, roving bandits, and marine resources. Science 311, 1557–1558. doi: 10.1126/science.1122804
Briguglio L., Cordina G., Farrugia N., Vella S. (2014). Economic vulnerability and resilience: concepts and measurements. In Measuring Vulnerability in Developing Countries (47–65). Routledge.
Buluswar S., Cook S., Stephenson J., Au B., Mylavarapu S., Ahmad N. (2011). Sustainable fisheries and aquaculture in China: scoping opportunities for engagement. Report prepared for the David and Lucile Packard Foundation, Los Altos, CA, USA, by Dalberg Global Development Advisors, Seaweb and Sustainable Fisheries Partnership, in association with M. Sigfigs of Seaweb, K Short and W. Songlin of WWF and D. Jones of Sustainable Fisheries Partnership.
Butchart S. H. M., Walpole M., Collen B., Van Strien A., Scharlemann J. P., Almond R. E., et al. (2010). Global biodiversity: Indicators of recent declines. Science 328, 1164–1168. doi: 10.1126/science.1187512. ISSN: 0036-8075.
Cavole L. M., Demko A. M., Diner R. E., Giddings A., Koester I., Pagniello C. M., et al. (2016). Biological impacts of the 2013–2015 warm-water anomaly in the Northeast Pacific: winners, losers, and the future. Oceanography 29(2), 273–285. doi: 10.5670/oceanog.2016.32
Chen M. (2017). Progress in research on international regional economic resilience -Introduction to a theoretical analysis framework based on evolution theory. Prog. Geogr. 36, 1435–1444. doi: 10.18306/dlkxjz.2017.11.012
Chen Z. Z., Lin Z. J., Qiu Y. S. (2010). Evaluation of sustainability of fisheries resources for the South China Sea based on the AHP. J. Natural Resour. 25, 249–257. doi: 10.11849/zrzyxb.2010.02.009
Cheung W. W., Jones M. C., Lam V. W., D Miller D., Ota Y., Teh L., et al. (2017). Transform high seas management to build climate resilience in marine seafood supply. Fish Fisheries 18, 254–263. doi: 10.1111/faf.2017.18.issue-2
Cheung W. W., Lam V. W., Sarmiento J. L., Kearney K., Watson R., Pauly D. (2009). Projecting global marine biodiversity impacts under climate change scenarios. Fish Fisheries 10, 235–251. doi: 10.1111/j.1467-2979.2008.00315.x
Clarke S. C. (2008). Use of shark fin trade data to estimate historic total shark removals in the Atlantic Ocean. Aquat. Living Resour. 21, 373–381. doi: 10.1051/alr:2008060
Clarke S., Milner-Gulland E. J., Bjørndal T. (2007). Social, economic, and regulatory drivers of the shark fin trade. Mar. Resource Economics 22, 305–327. doi: 10.1086/mre.22.3.42629561
Claudet J., Bopp L., Cheung W. W. L., Devillers R., Escobar-Brionesg E., Haugan P., et al. (2020). A roadmap for using the UN decade of ocean science for sustainable development in support of science, policy, and action. One Earth 2(1), 34–42. doi: 10.1016/j.oneear.2019.10.012
Curtin R., Prellezo R. (2010). Understanding marine ecosystem-based management: A literature review. Mar. Policy 34, 821–830. doi: 10.1016/j.marpol.2010.01.003
Ding J. J., Wang Z., Liu Y. H., Yu F. (2020). Measurement of economic resilience of contiguous poverty-stricken areas in China and influencing factor analysis. Prog. Geogr. 39, 924–937. doi: 10.18306/dlkxjz.2020.06.004
Diop B., Blanchard F., Sanz N. (2018). Mangrove increases resiliency of the French Guiana shrimp fishery facing global warming. Ecol. Model. 387, 27–37. Available at: https://linkinghub.elsevier.com/retrieve/pii/S0304380018302837.
Du J., Kou J. L., Zhao P. Y. (2020). Marine environmental regulation, marine science and technology innovation and marine economic green total factor productivity: An analysis based on DEA-Malmquist index and PVAR model. Ecol. Economy 36, 144–153. doi: CNKI:SUN:STJJ.0.2020-01-025
Fabinyi M., Liu N. (2014). The Chinese policy and governance context for global fisheries. Ocean Coast. Manage. 96, 198–202. doi: 10.1016/j.ocecoaman.2014.03.022
Gelcich S., Edwards-Jones G., Kaiser M. J., Castilla J. C. (2006). Co-management policy can reduce resilience in traditionally managed marine ecosystems. Ecosystems 9, 951–966. doi: 10.1007/s10021-005-0007-8
Gianelli I., Ortega L., Pittman J., Vasconcellos M., Defeo O. (2021). Harnessing scientific and local knowledge to face climate change in small-scale fisheries. Global Environ. Change 68, 102253. doi: 10.1016/j.gloenvcha.2021.102253
Gibbs M. T. (2009). Resilience: What is it and what does it mean for marine policymakers? Mar. Policy 33, 322–331. doi: 10.1016/j.marpol.2008.08.001
Gong C., Zhang X., Xu C. (2022). Research on the spatiotemporal evolution and synergistic improvement of economic resilience in China's three major urban agglomerations. Soft Sci. 36, 38–46. doi: 10.13956/j.ss.1001-8409.2022.05.06
González-Laxe F. (2005). The precautionary principle in fisheries management. Mar. Policy 29, 495–505. doi: 10.1016/j.marpol.2004.09.002
Grafton R. Q., Kompas T., Schneider V. (2005). The bioeconomics of marine reserves: A selected review with policy implications. J. Bioeconomics 7, 61–178. doi: 10.1007/s10818-005-6885-1
He C., Xia X., Li M. (2019). A study on the spatial differences of resilience in China's export trade. Prog. Geogr. 38, 1558–1570. doi: 10.18306/dlkxjz.2019.10.011
Hill E., Clair T. S., Wial H., Wolman H., Atkins P., Blumenthal P., et al. (2012). “Economic shocks and regional economic resilience,” in Urban and regional policy and its effects: Building resilient regions (Brookings Institution Press), 193–274. doi: 10.7591/cornell/9780801451690.003.0002
Holling C. S. (1973). Resilience and stability of ecological systems. Annu. Rev. Ecol. systematics 4, 1–23. doi: 10.1146/annurev.es.04.110173.000245
Humphreys J., Clark R. W. E. (2020). A critical history of marine protected areas. In Marine protected areas (pp. 1–12). (Elsevier).
Knutson T. R., McBride J. L., Chan J., Emanuel K., Holland G., Landsea C., et al. (2010). Tropical cyclones and climate change. Nat. Geosci. 3, 157–163. doi: 10.1038/ngeo779
Lagarde A., Doyen L., Ahad-Cissé A., Caill-Milly N., Gourguet S., Le Pape O., Thébaud O., et al. (2018) How does MMEY mitigate the bioeconomic effects of climate change for mixed fisheries. Ecol. Economics 154, 317–332. Available at: https://linkinghub.elsevier.com/retrieve/pii/S0921800917317688.
Lai M., Jiang J. L., Xie M. (2021). Research progress on evaluating marine resources and environment carrying capacity. Ecol. Economy 37(07), 75–87. (in chinese)
Levin S. A., Lubchenco J. (2008). Resilience, robustness, and marine ecosystem-based management. Bioscience 58, 27–32. doi: 10.1641/B580107
Lomboy C. G., Belinario F., Pomeroy R., Pedrajas J., Tirona R. S., Box S., et al. (2019). Building household economic resilience to secure a future for near shore fishers in the Philippines. Mar. Policy 99, 334–342. doi: 10.1016/j.marpol.2018.11.013
Luo W., He L., Yang Z., Zhang S., Wang Y., Liu D. (2023). Spatio-temporal heterogeneity in the international trade resilience during COVID-19. Applied Geography 154, 102923.
McCarthy M. A., Possingham H. P. (2007). Active adaptive management for conservation. Conserv. Biol. 21, 956–963. doi: 10.1111/j.1523-1739.2007.00677.x
Micheli F., Saenz-Arroyo A., Greenley A., Vazquez L., Espinoza Montes J. A., Rossetto M., et al. (2012). Evidence that marine reserves enhance resilience to climatic impacts. PloS One 7, e40832. doi: 10.1371/journal.pone.0040832
Österblom H., Jouffray J. B., Folke C., Crona B., Troell M., Merrie A., et al. (2015). Transnational corporations as ‘keystone actors’ in marine ecosystems. PloS One 10, e0127533. doi: 10.1371/journal.pone.0127533
Punt A. E. (2010). “Harvest control rules and fisheries management,” in Handbook of Marine Fisheries Conservation and Management. Eds. Grafton R. Q., Hilborn R., Squires D., Tait M., Williams M. (Oxford University Press, New York, NY), 582–594.
Qin C. L., Tang Y.. (2007). Club convergence of regional economic growth in Henan Province. Geogr. Res. 26, 548–556.
Regan H. M., Ben-Haim Y., Langford B., Wilson W. G., Lundberg P., Andelman S. J., et al. (2005). Robust decision-making under severe uncertainty for conservation management. Ecol. Appl. 15, 1471–1477. doi: 10.1890/03-5419
Rice J. C., Garcia S. M. (2011). Fisheries, food security, climate change, and biodiversity: characteristics of the sector and perspectives on emerging issues. ICES J. Mar. Sci. 68, 1343–1353. Available at: https://academic.oup.com/icesjms/article/68/6/1343/704758.
Schmitt K. M., Kramer D. B. (2009). Road development and market access on Nicaragua's Atlantic coast: implications for household fishing and farming practices. Environ. Conserv. 36, 289–300. doi: 10.1017/S0376892910000159
Sumaila U. R., Cheung W. W., Lam V. W., Pauly D., Herrick S. (2011). Climate change impacts on the biophysics and economics of world fisheries. Nat. Climate Change 1, 449–456. doi: 10.1038/nclimate1301
Sun K., Ji J. W., Li L. D., Zhang C., Liu J. F., Fu M. (2017). Marine fishery economic efficiency and its spatio-temporal differences based on undesirable outputs in China. Resour. Sci. 39, 2040–2051. doi: 10.13249/j.cnki.sgs.2016.05.004
Villasante S., Rodríguez-González D., Antelo M., Rivero-Rodríguez S., de Santiago J. A., Macho G. (2013). All fish for China? Ambio 42(8), 923–936. doi: 10.1007/s13280-013-0448-9
Walker B., Salt D. (2012). Resilience thinking: sustaining ecosystems and people in a changing world (Island press).
Wang Z. Y., Wang Y. X. (2019). Spatial and temporal differentiation and influencing factors of the marine economy resilience in China. Economic Geogr. 39, 139–145. doi: 10.15957/j.cnki.jjdl.2019.02.017
Yan X. (2020). Linkage of coastal fishermen, fishery, fishing village transformation, and industrial poverty alleviation: Internal connections, dilemmas, and implementation paths. Chin. Fisheries Economics 38, 18–27. (in chinese)
Zhai X., Sun C., Zou W., Hao S. (2023). Spatiotemporal characteristic and evolution of China's marine economic resilience. Ocean Coast. Manage. 238, 106562. doi: 10.1016/j.ocecoaman.2023.106562
Zhao L., Zhao Z. Q. (2014). Projecting the spatial variation of economic based on the specific ellipses in China. Sci. Geogr. Sin. 34(8), 979–986. doi: 3249/j.cnki.sgs.2014.08.015
Keywords: marine fishery, economic resilience, sustainable development, influencing factor, geographical detectors, spatial-temporal evolution, trend prediction
Citation: Chen X, Wang H and Zhang Y (2024) Casting a sustainable future: a study on dynamic prediction and influencing factors of economic resilience in fisheries management. Front. Mar. Sci. 11:1403923. doi: 10.3389/fmars.2024.1403923
Received: 20 March 2024; Accepted: 16 October 2024;
Published: 11 November 2024.
Edited by:
Bin Xia, Qingdao Agricultural University, ChinaReviewed by:
Sahar Fahmy Mehanna, National Institute of Oceanography and Fisheries (NIOF), EgyptQingji Zhou, Tianjin University, China
Copyright © 2024 Chen, Wang and Zhang. This is an open-access article distributed under the terms of the Creative Commons Attribution License (CC BY). The use, distribution or reproduction in other forums is permitted, provided the original author(s) and the copyright owner(s) are credited and that the original publication in this journal is cited, in accordance with accepted academic practice. No use, distribution or reproduction is permitted which does not comply with these terms.
*Correspondence: Haohan Wang, d2FuZ2hhb2hhbkBuYnUuZWR1LmNu
 Xiaoyu Chen
 Haohan Wang
 Yujie Zhang3