 Inna M. Sokolova
 Anton Kovalev
 Stefan Timm
 Julia Marchenko
 Alexey Sukhotin
- 1Department of Marine Biology, Institute for Biological Sciences, University of Rostock, Rostock, Germany
- 2Department of Maritime Systems, Interdisciplinary Faculty, University of Rostock, Rostock, Germany
- 3White Sea Biological Station, Zoological Institute of the Russian Academy of Sciences, St. Petersburg, Russia
- 4Department of Marine Biology, Charney School of Marine Sciences, University of Haifa, Haifa, Israel
- 5National Institute of Oceanography, Israel Oceanographic and Limnological Research, Haifa, Israel
- 6Department of Plant Physiology, Institute for Biological Sciences, University of Rostock, Rostock, Germany
- 7Department of Ichthyology and Hydrobiology, St. Petersburg State University, St. Petersburg, Russia
The blue mussels Mytilus edulis and Mytilus trossulus are ecologically and economically important species distributed widely across the Northern Hemisphere. Understanding their behavioral and physiological disparities is crucial for assessing their ecological success and aquacultural value. The recent finding of non-native M. trossulus in the White Sea raises concerns regarding its potential competition with native M. edulis and its prospective spread in light of climate change and surface water freshening. We investigated the responses of M. edulis and M. trossulus to salinity variations by examining shell closure thresholds and tissue levels of 35 metabolic intermediates in mussels acclimated to different salinities (25, 16, and 10). The salinity threshold for valve closure was similar in both studied species, but M. trossulus consistently opened at lower salinities (by 0.2–0.7 practical salinity units) compared to M. edulis. Salinity-induced changes in metabolite levels were similar between the two species. Taurine emerged as the dominant osmolyte, comprising over 50% of the total free amino acid pool, with aspartate and glycine contributing 15–30%. Concentrations of taurine, glycine, and total free amino acids declined with decreasing salinity. Taurine to glycine ratios were higher in M. edulis and increased in both species with declining salinity. Acclimation salinity significantly influenced urea cycle intermediates and methionine sulfoxide content, a cellular biomarker of amino acid oxidation. Species-specific differences were observed in purine metabolism, with higher levels of GMP and AMP found in M. edulis. Likewise, aromatic amino acids and histidine levels were higher in M. edulis compared to M. trossulus. However, no evidence suggests superior adaptation of M. trossulus metabolism to hypoosmotic stress compared to M. edulis. Further research is necessary to elucidate the functional implications of subtle metabolic differences between these Mytilus congeners and their ecological consequences in changing marine environments.
Introduction
The blue mussels Mytilus edulis Linnaeus, 1758 and Mytilus trossulus A. Gould, 1850 are evolutionary lineages of Pliocene origin belonging to the Mytilus edulis species complex, broadly distributed in the Northern Hemisphere. They are cryptic hybridizing species usually identified by molecular markers due to the lack of diagnostic morphological characters (Khaitov et al., 2021). M. edulis inhabits both eastern and western Atlantic coasts, while M. trossulus is typical in North Pacific with outposts in Atlantic Canada, Greenland, Western Scotland and north European coastal seas (Wenne et al., 2020). The distributions of M. edulis and M. trossulus partially overlap forming hybrid zones (Wenne et al., 2020). In areas where M. edulis and M. trossulus co-occur, they compete for space, have to share a fundamental ecological niche, and hence even small behavioral or physiological differences can be important for habitat segregation. Geographical distribution of Mytilus congeners along salinity gradients suggests that M. trossulus might outperform M. edulis in brackish biotopes (McDonald et al., 1991; Väinölä and Strelkov, 2011). In the Baltic Sea, Danish Straits and Norwegian fjords around Bergen, correlation between habitat salinity and the abundance of M. trossulus or M. edulis was reported, with a dominance of M. edulis in more saline and M. trossulus in more brackish locations (Johannesson et al., 1990; Ridgway and Naevdal, 2004; Riginos and Cunningham, 2005; Strelkov et al., 2017; Knöbel et al., 2021). In contrast, no correlation between salinity and the relative abundance of M. edulis and M. trossulus in mixed settlements were recorded in the Western Atlantic (Riginos and Cunningham, 2005), the Tyuva Inlet of the Barents Sea (Marchenko et al., 2023), or the Loch Etive in Scotland (Dias et al., 2009). The sub-Arctic White Sea is inhabited by M. edulis, and a non-native M. trossulus has been discovered there relatively recently, mostly in the brackish areas of the Kandalaksha Bay (Väinölä and Strelkov, 2011; Katolikova et al., 2016).
As a typical ecosystem-engineering species, the mussels Mytilus spp. play an important ecological role in benthic communities, providing habitat for associated fauna and serving as a major food source for numerous birds, fish and invertebrate predators (Gosling, 1992; Buschbaum et al., 2009). In addition, mussels are of economic significance as a traditional and valuable aquaculture species, with annual global production of approximately 1.5 million tons (McKindsey et al., 2011). In the White Sea, Mytilus edulis is abundant in intertidal and upper subtidal zones (Lukanin, 1985) and has been introduced into the aquaculture in 1980s (Khalaman and Sukhotin, 2012). Therefore, invasion of a related species, Mytilus trossulus may have an impact on both natural benthic communities and aquaculture in the region. There is evidence that M. trossulus is more susceptible to predation by a starfish Asterias rubens than M. edulis (Lowen et al., 2013; Khaitov et al., 2023). Consequently, co-occurrence of these species in the White Sea may influence trophic links in intertidal and shallow subtidal habitats. Furthermore, due to its relatively thin and fragile shell, M. trossulus is a less valuable aquaculture species than M. edulis (Beaumont et al., 2008; Dias et al., 2011), and its dominance in aquaculture in the White Sea is highly undesirable.
The data on geographical distribution of M. trossulus and M. edulis indirectly indicate preference of M. trossulus for low salinity habitats, but it remain unclear whether this preference reflects differences in physiological tolerances to low salinity between the two related species. Existing studies on salinity tolerance of M. edulis and M. trossulus yielded contradictory results. Some studies comparing the larval performance of M. edulis and M. trossulus reported superior performance of M. trossulus larvae under hypoosmotic conditions (Qiu et al., 2002; Knöbel et al., 2021), while others found no salinity-dependent differences in larval performance between the species (Beaumont et al., 2005). Comparative studies on physiological responses of adult M. edulis and M. trossulus to salinity fluctuations are scarce. In the field, similar salinity-dependent growth rates were found in M. trossulus and M. edulis (Kautsky et al., 1990; Gardner and Thompson, 2001). Furthermore, no differences in feeding rates, absorption efficiency, or soft tissues C:N ratio were found between M. trossulus and M. edulis in a hybrid zone in Newfoundland under fluctuating salinity conditions (Gardner and Thompson, 2001). However, species-specific differences in ammonia excretion rates and hyposalinity-induced suppression of the heart rate were reported between M. edulis and M. trossulus (Tedengren and Kautsky, 1986; Braby and Somero, 2006).
Given the recent spread of M. trossulus into the White Sea (Väinölä and Strelkov, 2011), it is important to understand the potential role of salinity in determining the ability of this species to colonize White Sea habitats and potentially compete with the native M. edulis. Salinity of the White Sea in the upper 50–70 m water layer is about 24–26 with strong gradients in the estuaries of big rivers (Berger et al., 2001). Moreover, during spring snow and ice melting, the top 1–2 m of the surface waters become essentially fresh until the breakup of the ice cover enables wind mixing. Taking into consideration the existing controversy surrounding the geographical distribution of these congeners along salinity gradients and their relative tolerance to salinity, there is a pressing need for further investigations of the physiological and behavioral responses of the White Sea M. edulis and M. trossulus to low salinity conditions that would enable prediction of the fitness outcomes and the distribution patterns of these species in different salinity habitats in the White Sea.
In this study, we measured the behavioral responses of the White Sea M. edulis and M. trossulus to salinity fluctuations, and determined their species-specific metabolic changes in response to low salinity acclimation. To assess the salinity-induced metabolic shifts, we focused on the concentrations of organic osmolytes (free amino acids) that play an important role in cell volume regulation during salinity change, as well as metabolites involved in bioenergetics (nucleotide monophosphates, carnitine, tricarboxylic acid cycle intermediates and lactate), cell signaling (γ-aminobutyric acid) and urea cycle. The relative molar ratio of taurine and glycine (Tau:Gly ratio) was assessed as a general indicator of stress in mollusks (Scholz, 1987; Babarro et al., 2006). Additionally, concentrations of methionine sulfoxide and hydroxyproline were assessed as markers for oxidative stress and collagen degradation, respectively (Bin et al., 2017; Belostotsky and Frishberg, 2022). Metabolite concentrations were measured in the gills, as the main osmoregulatory and gas exchange organ of the mussels directly exposed to seawater, and the digestive gland, a metabolically important organ involved in digestion and energy storage (Gosling, 1992; Lobo-da-Cunha, 2019). Assuming that M. trossulus is more tolerant than M. edulis to brackish environments (Ridgway and Naevdal, 2004; Knöbel et al., 2021), we hypothesized that M. trossulus will withstand lower salinities during acute short-term exposures and show a stronger salinity-induced change in the tissue concentrations of organic osmolytes and less pronounced shifts in energy- and cellular stress-related intermediates compared with M. edulis.
Materials and methods
Sample collection
Mussels with a shell length of 20–30 mm were collected in June 2021 from two locations in the Kandalaksha Bay of the White Sea: 1) fucoid belt in the lower intertidal of Oleniy Island (OI site; N 67.09485, E 32.34515), 2) the intertidal mussel bed near the village of Luvenga (LU site; N 67.09889, E 32.70194). About 200 specimens were collected from each site. The OI site is situated near the apex of the bay, and is exposed to fluctuations in surface water salinity from 7 to 26 (with an average salinity of 17 in summer months) due to the proximity of the Niva River estuary (Khaitov, 2013). The LU site is located in the bay’s more maritime area, where the surface water average summer-month salinity reaches 20 (Khaitov, 2013). The mussels’ populations at these two sites are dominated by either M. trossulus (Oleniy Island) or M. edulis (Luvenga), as determined by population genetic surveys (Katolikova et al., 2016).
Experimental exposures
The mussels collected from the two locations on 17 June were transported to the White Sea Biological Station “Kartesh”. The mussels from the OI and LU sites were designated M. trossulus (MT) and M. edulis (ME), respectively, based on earlier reports (Katolikova et al., 2016). The mollusks from both populations were placed in two separate 200 L reservoirs for further acclimation to common garden conditions (10°C, constant salinity of 25) in the laboratory. The water was changed daily using natural unfiltered seawater from the Chupa Inlet of the White Sea, which provided natural phytoplankton as a food source to the mussels. Mortality rate of both species during the common garden acclimation was <10%. Animals for behavioral tests (Experiment 1) and for a long-term acclimation to low salinity (Experiment 2) were randomly withdrawn from the reservoirs on the 10th of July and the 9th of August 2021, respectively.
Experiment 1: behavioral response to fluctuating salinity
The behavioral reaction (isolation response) of mussels to lowering and increasing salinity was assessed by monitoring the salinity that triggered closing and opening of shell valves (Lajus and Sukhotin, 1998; Sukhotin et al., 2003). Briefly, after 22 days of acclimation, 45 mussels from each OI and LU sites were randomly selected from the common garden tanks, individually marked and placed in three 20 L tanks, 15 ME and 15 MT in each tank. Temperature was maintained at +10°C, initial salinity in all three tanks was 25. Two of these three tanks (A and B) served as replicates and were subject to salinity fluctuations: salinity was gradually reduced at a rate of 1 (practical salinity unit) per 10 min by adding natural freshwater from a nearby lake Krivoye until all mussels closed their shells. All mussels closed at salinity 10, and were kept at this salinity for 30 min. After that, the salinity was gradually increased to 20 at a rate of 1 (practical salinity unit) per 10 min by adding water of salinity 25. To test for the repeatability of the behavior, the experiment was repeated for three successive cycles of downshift and upshift of salinity in the same tanks with the same set of mussels. The total volume of water in tanks was maintained constant by removing excess water after additions of fresh or saline water to the tank. The third tank (C) with 15 ME and 15 MT served as a control with a constant salinity of 25. The same volume of seawater of salinity 25 was added to and removed from the control tank at the same time as in the experimental tanks to test for the potential effects of water change on mussel behavior. Adding and removing water from the tanks was done manually. The state of all mussels (shell valves open/closed) in all three tanks was visually observed and individually recorded prior to every dilution event, i.e., every 10 min. A mussel was considered closed if the edges of its mantle were not visible. Thus, for each mussel a threshold value of salinity (closing and opening of shell valves) was recorded for each of three cycles. Three replicates of this experiment, on July 10, 13 and 19, were performed. Between these replicate experiments, mussels were maintained in the same tanks at a control salinity of 25. Because mussels in all tanks were marked, the individual response of all specimens was recorded across all cycles/days.
Experiment 2: long-term exposure to reduced salinity
On August 9, after 52 days of acclimation to common garden conditions, 60 mussels from each of the two sites were haphazardly divided into three groups of 20 individuals. Each of the three species-specific groups were placed in 20 L tanks under one of the three salinity conditions: high (25, control), intermediate (16) and low (10) salinity. Tanks were divided in half by a plastic mesh wall, so that each tank contained mussels from both studied populations, separated by the mesh. Mussels were acclimated at different salinities for 35 days at 10°C. The experiments were carried out in temperature-controlled aquarium room, where a constant air temperature of +10°C was maintained. Salinity was checked daily with a WTW portable conductivity meter LF330i, and adjusted as needed to maintain the target values. Tank water was replaced twice daily with natural seawater from the bay diluted by natural freshwater from the lake Krivoye to the target salinity and cooled down to 10°C. The water contained natural phytoplankton as a source of food for the mussels, and no supplementary food was introduced during the common garden acclimation or salinity exposures. Mortality was recorded daily, and all dead mussels were immediately removed from the tanks. After 35 days of exposure, we dissected the mussels, determined the shell length and wet tissue mass, and excised the foot, gill and digestive gland tissues. Gill and digestive gland tissues were immediately frozen in liquid nitrogen for metabolite analysis. Foot tissues were preserved individually in 96% ethanol for genetic species identification.
Metabolite analysis
After species identification by molecular methods (see below), metabolite concentrations were analyzed in 43 M. edulis and 39 M. trossulus. Samples (50–100 mg) of gill and digestive gland tissues were weighed, placed into plastic tubes containing two metal balls, cooled using liquid nitrogen and homogenized on a rotor mill for 10 min. The rotor mill cassettes were pre-chilled to -80°C and cooled with liquid nitrogen before tissue homogenization. Shredded tissues were mixed with 1 ml of 80% ethanol containing 1 μg ml−1 of 2-(N-morpholino)ethanesulfonic acid (MES) as an internal standard. The metabolites were extracted by shaking on the rotor mill for 5 min followed by 15 min sonication in an ice-chilled ultrasonic bath. Samples were centrifuged at 13,000 g at 4°C for 10 min. 800 μl of the resulting supernatant per sample was carefully transferred into new plastic tubes, frozen at -80°C and dried in a speedvac for 4 h at room temperature. The dried extracts were stored at -80°C until further analysis.
Prior to analysis, the extracts were reconstituted in 400 μl of MS-grade distilled water (ROTISOLV® LC-MS-grade, Roth, Germany), filtered through 0.2 μm filters (Omnifix®-F, Braun, Germany), and diluted 1:10 (or 1:50 for taurine quantification) with MS-grade distilled water. Samples were analyzed using a high-performance liquid chromatograph-mass spectrometer LCMS-8050 system (Shimadzu, Japan) as described earlier (Haider et al., 2020). The extracts (1 μl per sample) were separated on a pentafluorophenylpropyl (PFPP) column (Supelco Discovery HS FS, 3 μm, 150 × 2.1 mm) with a mobile phase containing 0.1% formic acid. The elution program consisted of the following steps: 1 minute at 0.1% formic acid, 95% water, 5% acetonitrile; a linear gradient over 15 minutes to 0.1% formic acid, 5% water, 95% acetonitrile; and 10 minutes at 0.1% formic acid, 5% water, 95% acetonitrile, at a flow rate of 0.25 ml min−1. Primary metabolites were quantified using the LC-MS/MS method package for primary metabolites Ver. 2 (Shimadzu, P/N 225–24,862–92) and the LabSolutions software package (Shimadzu, Japan). Taurine was additionally analyzed in the positive ion mode using selective ion monitoring (SIM) for m/z 126, corresponding to the protonated taurine ion [MH]+. The retention time acquisition window (2 min) was verified through co-elution experiments with taurine standard (Sigma-Aldrich, Germany) at varying concentrations. To account for potential variations during sample extraction and loading, the signal intensity (peak area) of the target compounds was normalized to the peak of the internal standard (MES) in each sample. Authentic standard substances (Merck, Germany) were used for calibrations. The concentrations of the metabolites were expressed as μmole g−1 wet tissue mass.
Species identification
DNA was isolated from the foot tissues of the mussels using the ExtractDNA kit (Eurogen, Russia). Mussels were genotyped using three PCR-based markers routinely used for discriminating M. edulis and M. trossulus: two nuclear markers - ME15/16 (Inoue et al., 1995) and ITS (Heath et al., 1995), and a 16S mitochondrial marker (Rawson et al., 1996) using protocols from original publications. Only mussels identified as M. edulis or M. trossulus (homozygous genotypes for two nuclear markers with the matching species-mitochondrial marker) were included in further analysis. We found six hybrids (one and five in the acclimation salinities 16 and 25, respectively) and one misidentified individual in acclimation salinity 10 in the OI population, and two hybrids (one each in the acclimation salinities 10 and 25) in LU population. Hybrids (8 out of the total of 91 mussels) and the misidentified specimen were excluded from analyses. The remaining 82 mussels from two species and three salinity acclimation groups were included in the final analyses.
Data analysis
Behavioral experiment
The readouts of the behavioral experiments consisted of the individual values of threshold salinity at which ME and MT mussels closed and opened shells during successive cycles of stepwise salinity changes, and were used as dependent variable in the analyses. The effects of factors “Day” (three experimental repeats on 10, 13 and 19 July), “Cycle” (three successive cycles of lowering/increasing salinity per experiment), “Phase of the Cycle” (two levels: salinity downshift inducing shell closure or salinity upshift), “Species” (ME and MT) on the dependent variable were tested using generalized linear mixed models (GLMM) ANOVA based on beta distribution. Replicate tanks (two per condition) and individual mussels were included into the models as random effects. Optimal model has been chosen based on the backward stepwise selection method (Zuur et al., 2009). Threshold salinity values of opening or closing of individual mussels were divided by the maximal threshold salinity in the dataset (20.5) to meet beta distribution.
Concentrations of metabolites
To reduce the dimensionality of the multivariate data, we conducted redundancy analysis (RDA) of the metabolite concentrations using two model predictors: species (categorized with two levels) and salinity (treated as a continuous variable), separately for the gills and the digestive gland. The concentrations of metabolites were subjected to transformations and scaling to achieve normalization. The significance of models was validated using permutation analyses as well as effect of factors (type I test) (Borcard et al., 2011).
We conducted additional ANOVA using generalized linear models (GLM) to assess the effects of salinity and species on the metabolite concentrations that were transformed to achieve normal data distribution. We identified and excluded outliers from the dataset based on visual analysis of QQ-plots and Rosner’s test. In GLM analyses, we used salinity and species as categorical predictors and examined their single and interactive effects on metabolite concentrations. The full models were compared with the models without interaction term based on Akaike information criteria, and, if the interaction term did not significantly improve the model fit, it was excluded from models. Resulting seventy-four models were tested for significance using F-test, and Holm-Bonferroni adjustment has been implemented to correct for multiple comparisons. The effects of factors “Salinity” and “Species” and (where applicable) their interactions are reported based on ANOVAs, and the models that were significant after the Holm-Bonferroni correction are identified in Supplementary Table 1. To determine which group means were significantly different from each other, Tukey’s Honest Significant Differences (HSD) post-hoc tests were performed. To allow comparisons with previously published studies, the means of the raw (untransformed) metabolite concentrations are shown on the graphs and in Supplementary Tables 2 and 3.
The impacts of salinity on metabolic pathways of the mussels were analyzed using the pathway enrichment analysis as implemented in Metaboanalyst 6.0 (Pang et al., 2021). Pathway enrichment analysis was conducted separately for the gills and the digestive gland tissues within each of the two studied species. The pathway enrichment analysis is more sensitive than over-representation analysis and can identify subtle but consistent changes amongst metabolites compounds involved in the same biological pathway (Pang et al., 2021). Concentrations of 35 measured metabolites were used as input variables for pathway enrichment analysis, and salinity (10, 16 and 25) was used as a continuous effect variable using regression approach. The metabolic reference library of Drosophila melanogaster was used, with pathway enrichment analysis conducted via the Globaltest method. Pathway topology analyses used relative betweenness centrality as a measure of node importance. To correct for multiple comparisons, the false discovery rate approach was used, and the pathways were considered significantly enriched if the false discovery rate (FDR) probability was <0.05. Pathways with FDR <0.05 and pathway impact >0 were further analyzed and discussed. Correlation analysis was used to assess the correlated patterns of change in different metabolites. Random Forest Analysis (a machine learning algorithm for high dimensional data analysis) was used to estimate the classification accuracy of the samples into different experimental exposure groups by species and salinity and determine the importance of different metabolites for the classification accuracy. For pathway enrichment, Random Forest, and correlation analyses, the data were auto scaled (mean-centered and divided by standard deviation of each variable) to minimize the effects of different baseline concentrations of metabolites.
Statistical analyses and data visualization were conducted in MetaboAnalyst 6.0 (for pathway enrichment analyses, Random Forest analyses and correlation heatmaps) (Pang et al., 2021) and in R programming language using packages ‘stat’ (R Core Team, 2023), ‘nlme’ (Pinheiro and Bates, 2000; Pinheiro et al., 2023), glmmTMB (Brooks et al., 2017), ‘ggplot2’ (Wickham, 2009), ‘vegan’ (Oksanen et al., 2022), and ‘ggvegan’ (Simpson and Oksanen, 2023) for all other analyses.
Results
Mortality
The cumulative mortality after 35 days of acclimation to salinities 25, 16 and 10 respectively, was 15, 24 and 24% in M. trossulus, and 6, 6 and 11% in M. edulis.
Behavioral response to fluctuating salinity
Mussels began to close the shell valves at a salinity of 18 (Figure 1). Further freshening led to mass shell closures, and at salinity 10 all mussels closed. Stepwise increase of salinity stimulated gradual opening of mussels at salinity of 14–16 (Figure 1). GLMM ANOVA showed a significant effect of “Day”, “Cycle”, “Phase of the Cycle” and some interactions of “Day x Phase of the Cycle”, “Species x Phase of the Cycle”, and “Day x Species x Phase of the Cycle” on the threshold salinity for opening/closing (Table 1). The threshold salinity for opening/closing consistently declined with each subsequent cycle, and changed on sequential days of experiment albeit in a slightly different way for the studied species. While the threshold of valve closing during salinity downshift in ME declined with the day number, in MT it was similar on days 1 and 2 of the experiment and declined on day 3 (as shown by significant interaction between “Day”, “Phase of the Cycle” and “Species”, Table 1). Considered separately for each of the three experimental days, mussels showed habituation to lowering salinity during three full salinity cycles lasting for 12 h; with each subsequent cycle, the mussels tended to close at lower salinity and reopen faster (Figure 1A). The threshold salinity of both closing and opening of mussels declined from cycle 1 to cycle 3 by about 1–1.5 practical salinity units (Figures 1B–D). The phase of salinity cycle (upshift or downshift) also significantly influenced the threshold salinity (Table 1). In all experiments, the threshold salinity of closing during salinity downshift was approximately 1 practical salinity unit higher than the threshold salinity of opening during the salinity upshift (Figures 1B–D).
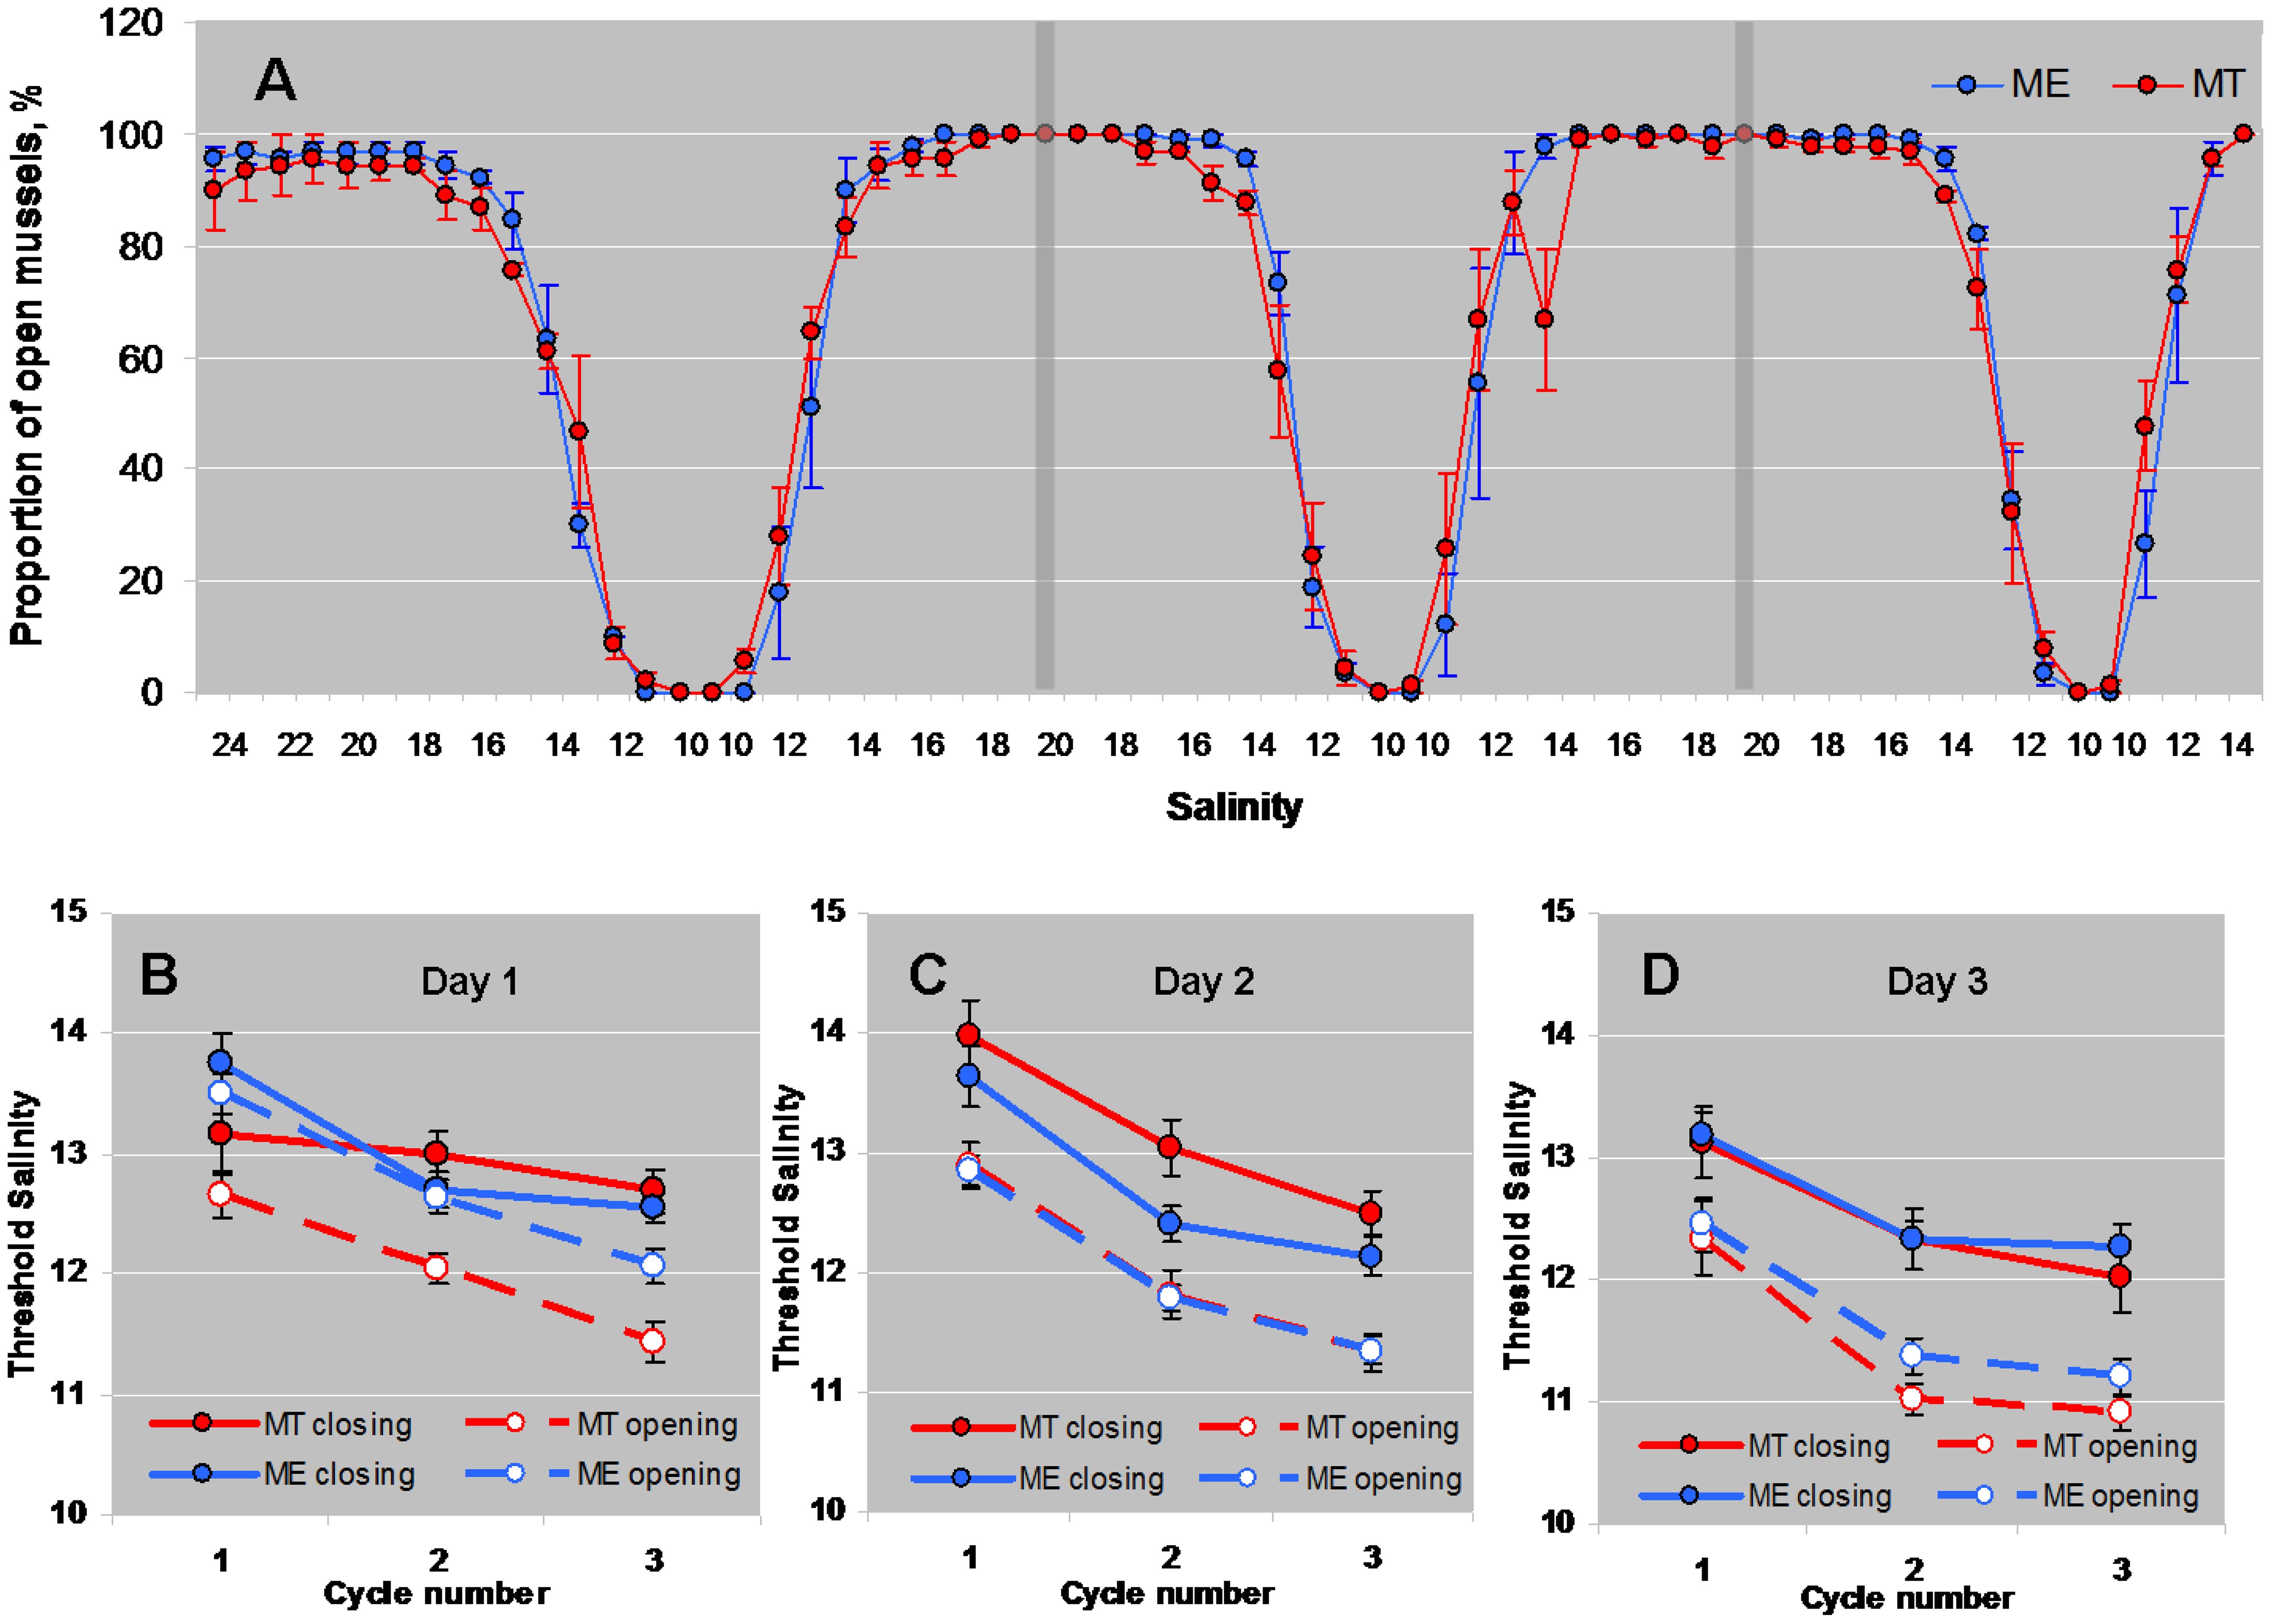
Figure 1 Behavioral responses of M. edulis and M. trossulus from the White Sea to salinity up- and downshifts. (A) - changes in the proportion of open mussels in the course of three successive cycles (separated by vertical bars) of lowering and increasing salinity (average for three experimental replicates (days), N=3). (B–D) - threshold salinities of closing and opening of mussels Mytilus edulis (ME) and Mytilus trossulus (MT) in the course of lowering and increasing salinity in three experimental replicates (days). N=30 for both ME and MT. Means ± SE's are presented.
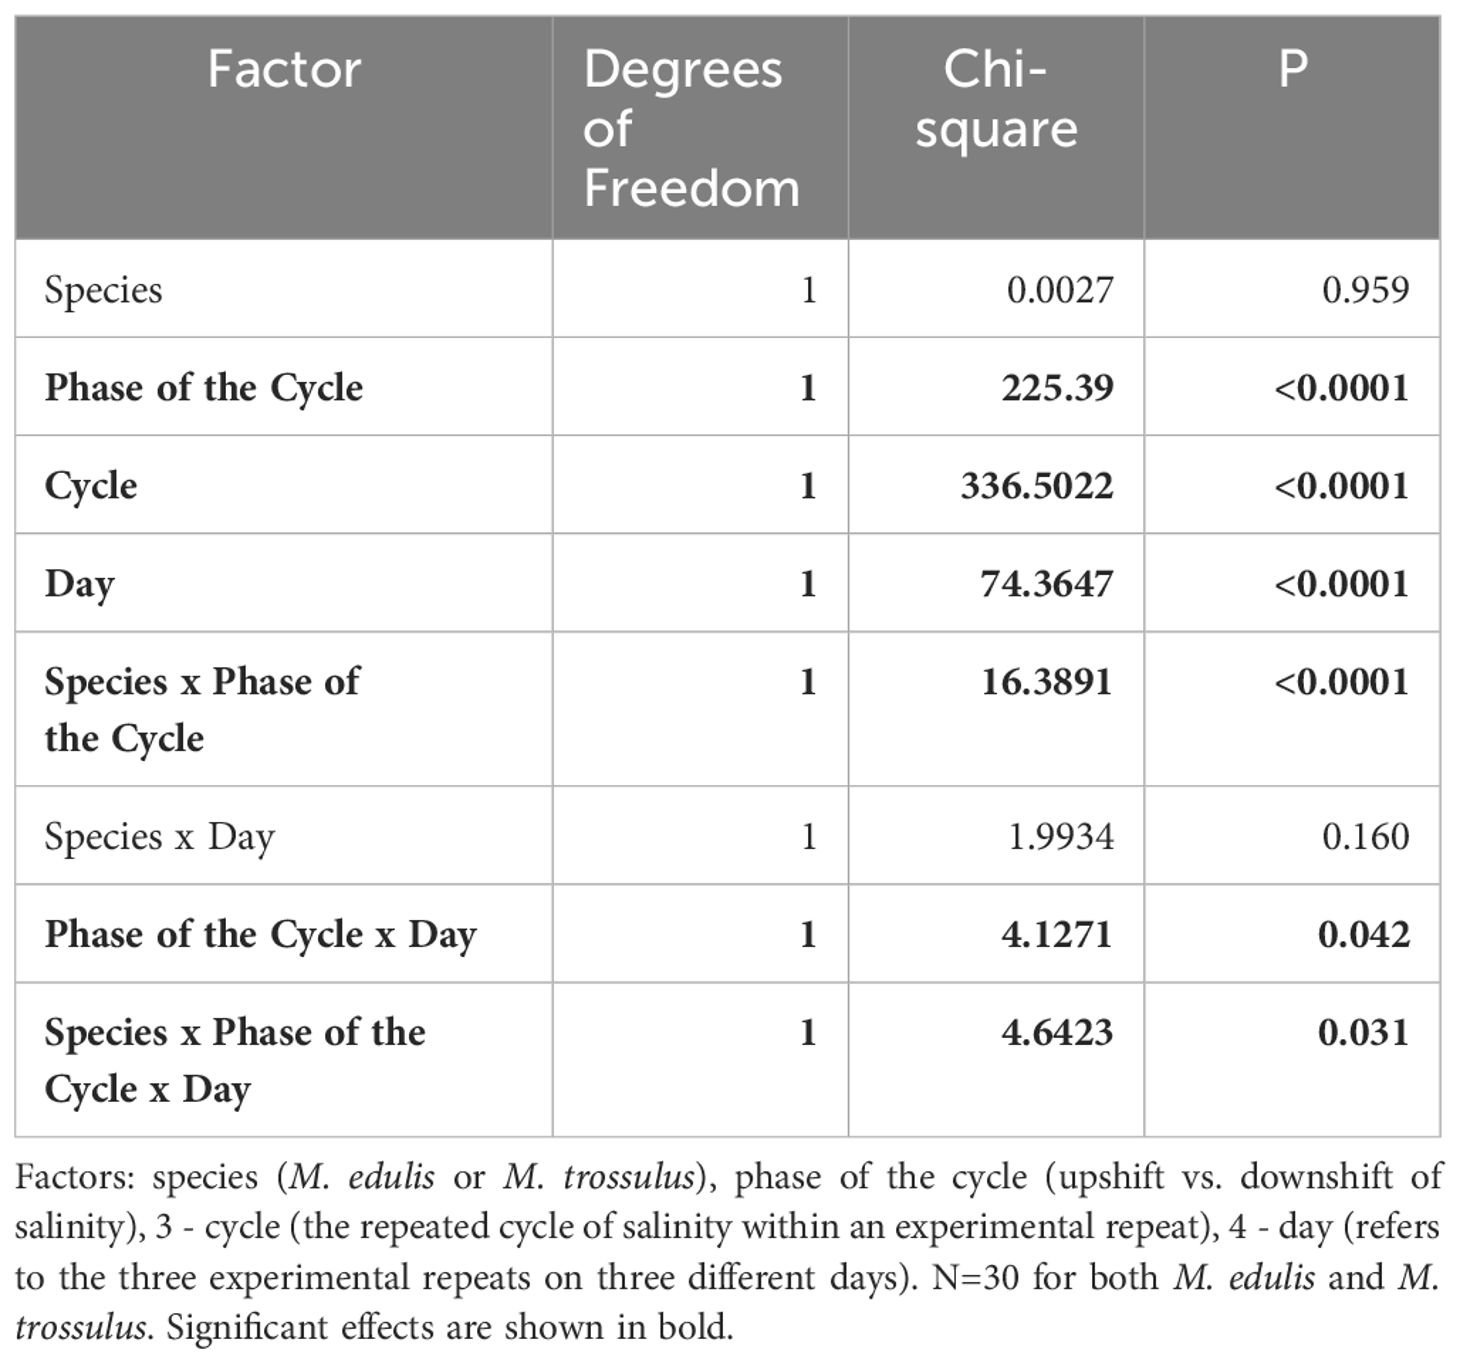
Table 1 GLMM ANOVA: Effects of species and experimental conditions on the threshold salinity of closing or opening of ME and MT mussels as a response to fluctuating salinity.
The interactions between factors “Species” and “Phase of Cycle” was significant (Table 1). The threshold salinity of closing during salinity downshift did not differ between M. edulis and M. trossulus, but during the increase of salinity, the mean value of the threshold salinity for shell opening was by 0.2–0.7 practical salinity units lower in M. trossulus than in M. edulis (Figures 1B–D).
Species- and tissue-specific metabolite profiles
A total of 35 metabolites were quantified in mussels’ tissues (Supplementary Tables 1–3), including 20 amino acids that act as organic osmolytes in molluscan cell volume regulation (Yancey, 2005). Taurine (Tau) was the dominant osmolyte in the tissues of the White Sea Mytilus spp., constituting >50% of the total free amino acid (FAA) pool (Figure 2). Aspartate (Asp) accounted for 10–17% and 6–10% of the FAA pool in the gills and the digestive gland, respectively. At low salinity (10), alanine (Ala) constituted approximately 5–6% of the total FAA pool. The proportion of Ala decreased to <5% at salinities 16 and 25 (Figure 2). Conversely, the relative contribution of glycine (Gly) to the total osmolyte pool increased with increasing salinity from ~5% at salinities 10 and 16 to 9–14% at salinity 25 (Figure 2). Additionally, glutamate (Glu) contributed ~3–5% to the total organic osmolyte pool in the tissues of two studied species. Other FAAs accounted for <2% each in the organic osmolyte pool (Figure 2).
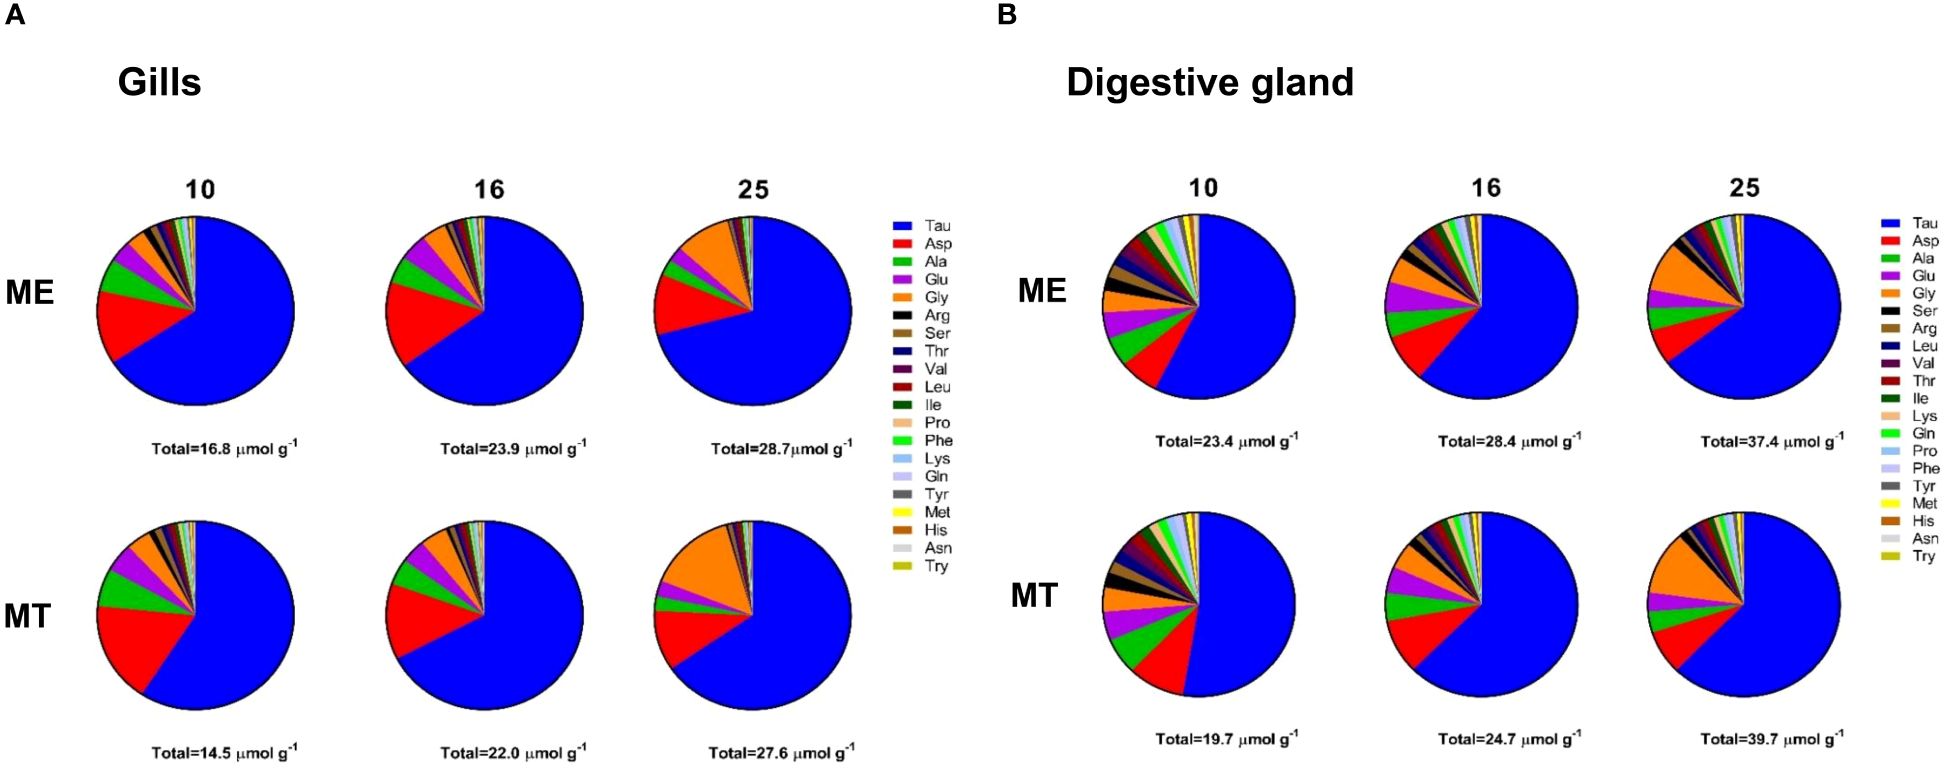
Figure 2 Molar composition of the FAA pool in the gills (A) and the digestive gland (B) tissues of mussels acclimated under different salinity conditions. ME, M. edulis; MT, M. trossulus. Data for acclimation salinities 10, 16 and 25 are shown. The sum of the molar concentrations of 20 FAAs is given under each pie chart.
Correlation analysis across both species and all salinity treatments identified a cluster of highly positively correlated amino acids in the gills including tyrosine (Tyr), histidine (His), tryptophan (Trp), phenylalanine (Phe), methionine (Met), valine (Val), isoleucine (Ile), and leucine (Leu) (Supplementary Figure 1). Concentrations of proline (Pro), serine (Ser), threonine (Thr), lysine (Lys) and glutamine (Gln) were also positively, albeit more weakly, correlated with the amino acids in the first cluster. The levels of two major osmolytes (Tau and Gly) showed a positive correlation with each other and a negative correlation with the urea cycle intermediates arginine (Arg), argininosuccinate, ornithine, as well as with guanosine monophosphate (GMP) and methionine sulfoxide (MetO) (Supplementary Figure 1). A correlation pattern of metabolites in the digestive gland was generally similar to that in the gills. Thus, in the digestive gland, a cluster of positively correlated amino acids included Lys, Gln, Thr, Leu, Ile, Val, Pro, Ser, Phe, Met, Trp, His and Asn (Supplementary Figure 2). The digestive gland levels of Tau and Gly were positively correlated with each other and negatively correlated with the concentrations of arginine (Arg), argininosuccinate, ornithine, nucleotide monophosphates (CMP, AMP and GMP) and methionine sulfoxide (MetO) (Supplementary Figure 2).
The RDA with a permutation type I test demonstrated significant effects of both salinity (gill: pseudo-F-criteria = 12.95, P<0.001; digestive gland: pseudo-F-criteria = 13.8, P<0.001) and species (gill: pseudo-F-criteria = 4.48, P<0.001; digestive gland: pseudo-F-criteria = 5.14, P<0.001) on the metabolic profiles of mussels (Supplementary Table 4). The two factors extracted from the RDA analyses jointly accounted for 18.08% of the total variance in gill tissue and for 20.16% - in digestive gland (Figure 3; Supplementary Table 4). The first RDA1 axis (13.43% of the total variance in the gill and 14.72% in the digestive gland) was associated with salinity. High negative scores on RDA1 (associated with high salinity) were found for Tau and Gly in both gills and digestive gland, tyrosine (Tyr), aspartate (Asp) and carnitine in the digestive gland, and γ-aminobutyric acid (GABA) in the gills (Figures 3C, D). High positive RDA1 scores (showing association with low salinity) were found for urea cycle intermediates ornithine, argininosuccinate and Arg, as well as methionine sulfoxide (MetO), and GMP both in the gill and digestive gland. The second RDA2 axis (4.65% of the total variance in the gill and 5.44% in the digestive gland) was associated with the differences of the metabolite profiles between the two studied species regardless of salinity (Figures 3A, B). Positive scores of RDA2 were linked to M. trossulus and showed increased concentrations of methionine sulfoxide, Gly and cystine in both studied tissues. Asparagine (Asn), Arg and cytidine monophosphate (CMP) were associated with M. trossulus in the gill, and Asp was associated with M. trossulus in digestive gland. Conversely, negative scores of RDA2 were associated with M. edulis and linked with elevated concentrations of Tyr, tryptophan (Trp) and adenosine monophosphate (AMP) in the gills and digestive gland, higher levels of Phe in the gills, and elevated concentrations of histidine (His) and Asn in the digestive gland (Figures 3C, D).
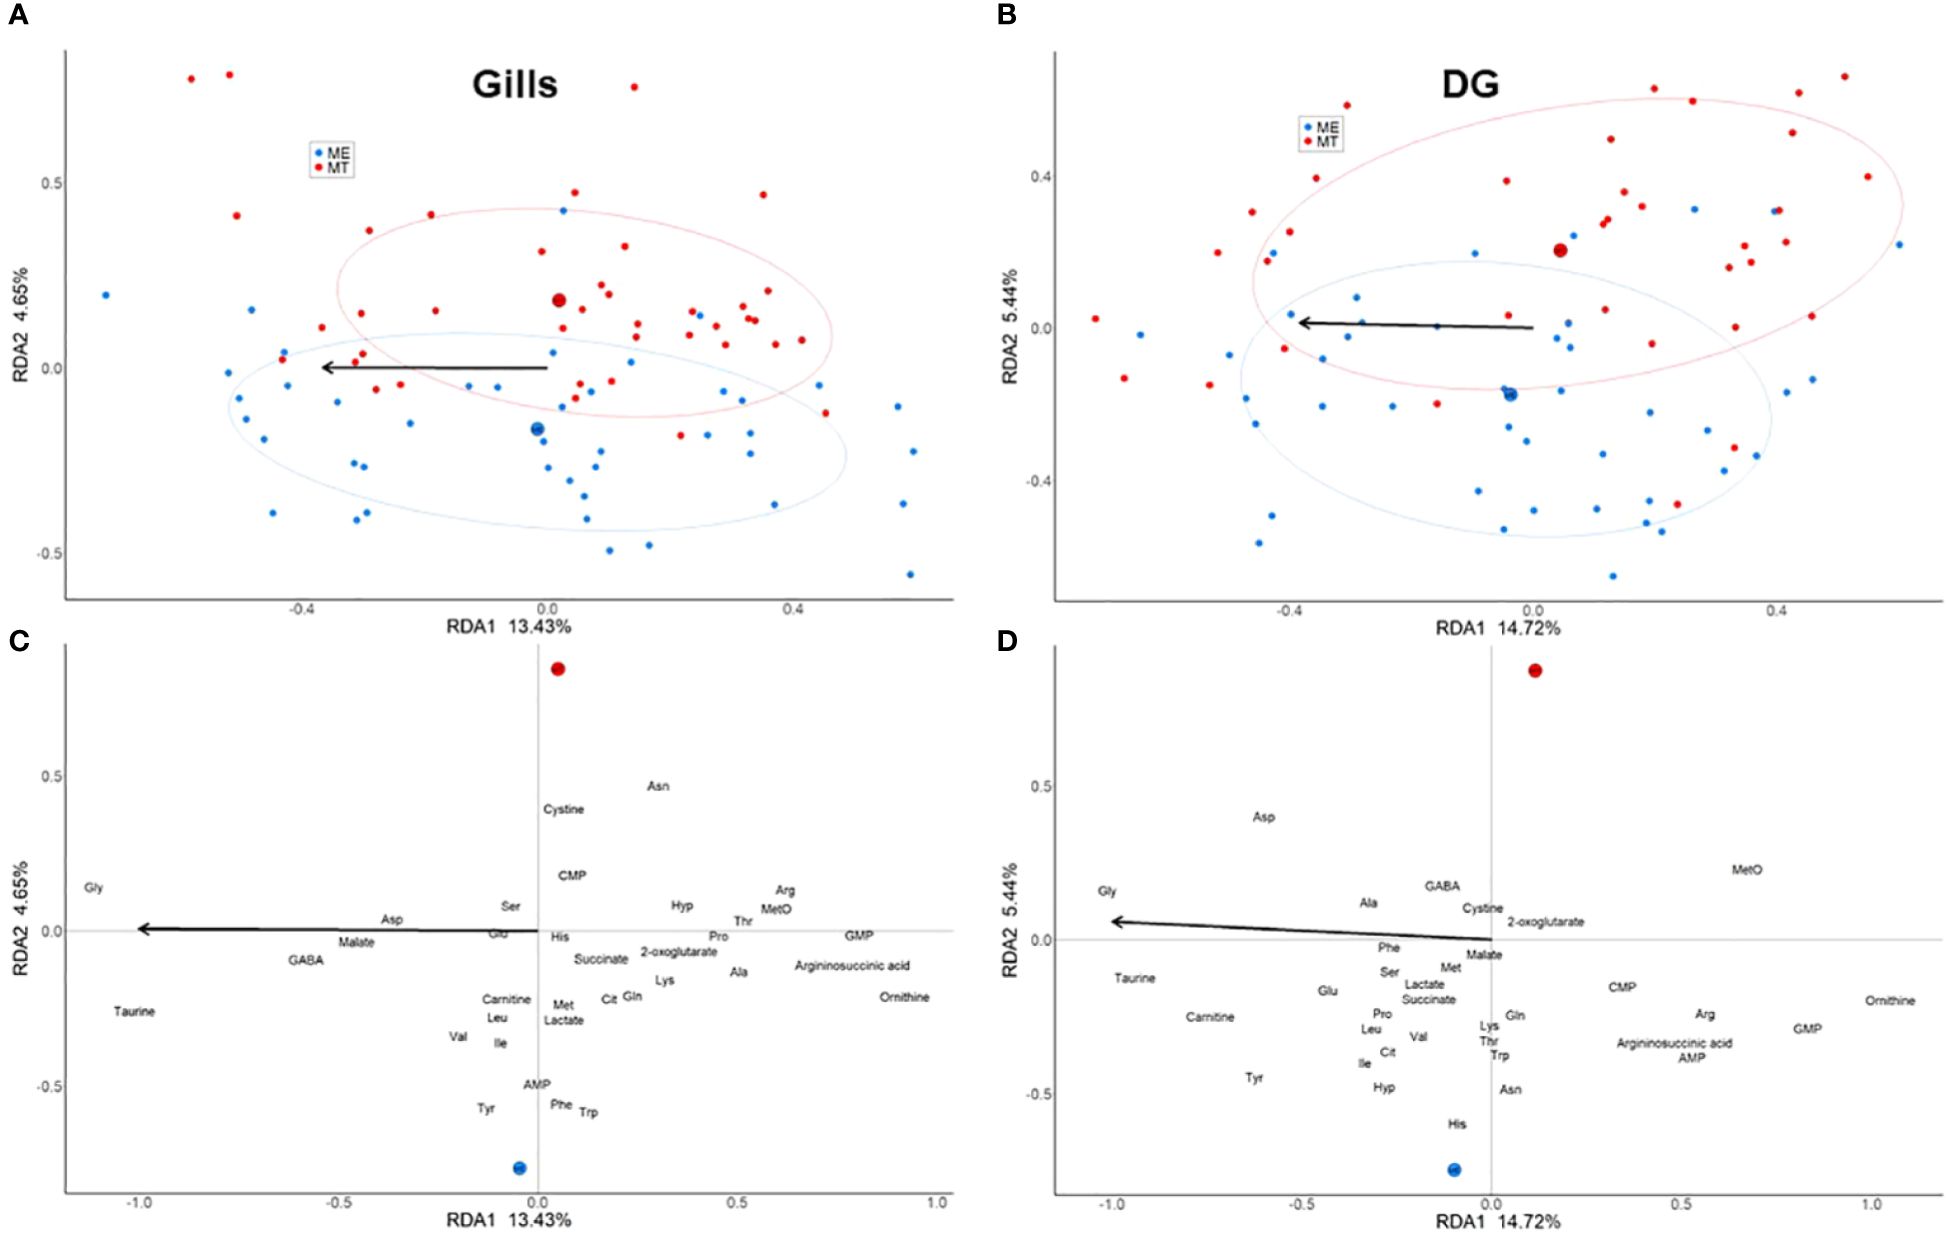
Figure 3 Ordination of individuals [(A) - gills, (C) - digestive gland] and metabolites [(B) - gills, (D) - digestive gland] in the two canonical RDA axes. (A, C) –red and blue symbols correspond to M. trossulus and M. edulis, respectively. (B, D) - an arrow points in the direction corresponding to an increase in salinity. The large red and blue filled circles mark the centroids corresponding to the two species (MT, M. trossulus; ME, M. edulis), the ellipses show the 95% confidence intervals.
GLM ANOVA showed consistent differences in several important metabolites between the two studied species regardless of the acclimation salinity (Supplementary Table 1). Thus, M. edulis tissues showed higher content of Tau, carnitine, AMP and GMP than tissues of M. trossulus (Figures 4A, F, 5D, I, 6A, B, D, E). Ornithine cycle intermediates also tended to be higher in M. edulis than in M. trossulus (Figure 7), although these differences were not always significant. Likewise, concentrations of aromatic amino acids Phe, Trp and Tyr were higher in the tissues of M. edulis than in M. trossulus, with the more pronounced interspecific differences found in the gill than in the digestive gland (Figure 8). Other studied metabolites showed either similar concentrations in the two studied species, or an inconsistent pattern of species-specific differences that depended on the acclimation salinity.
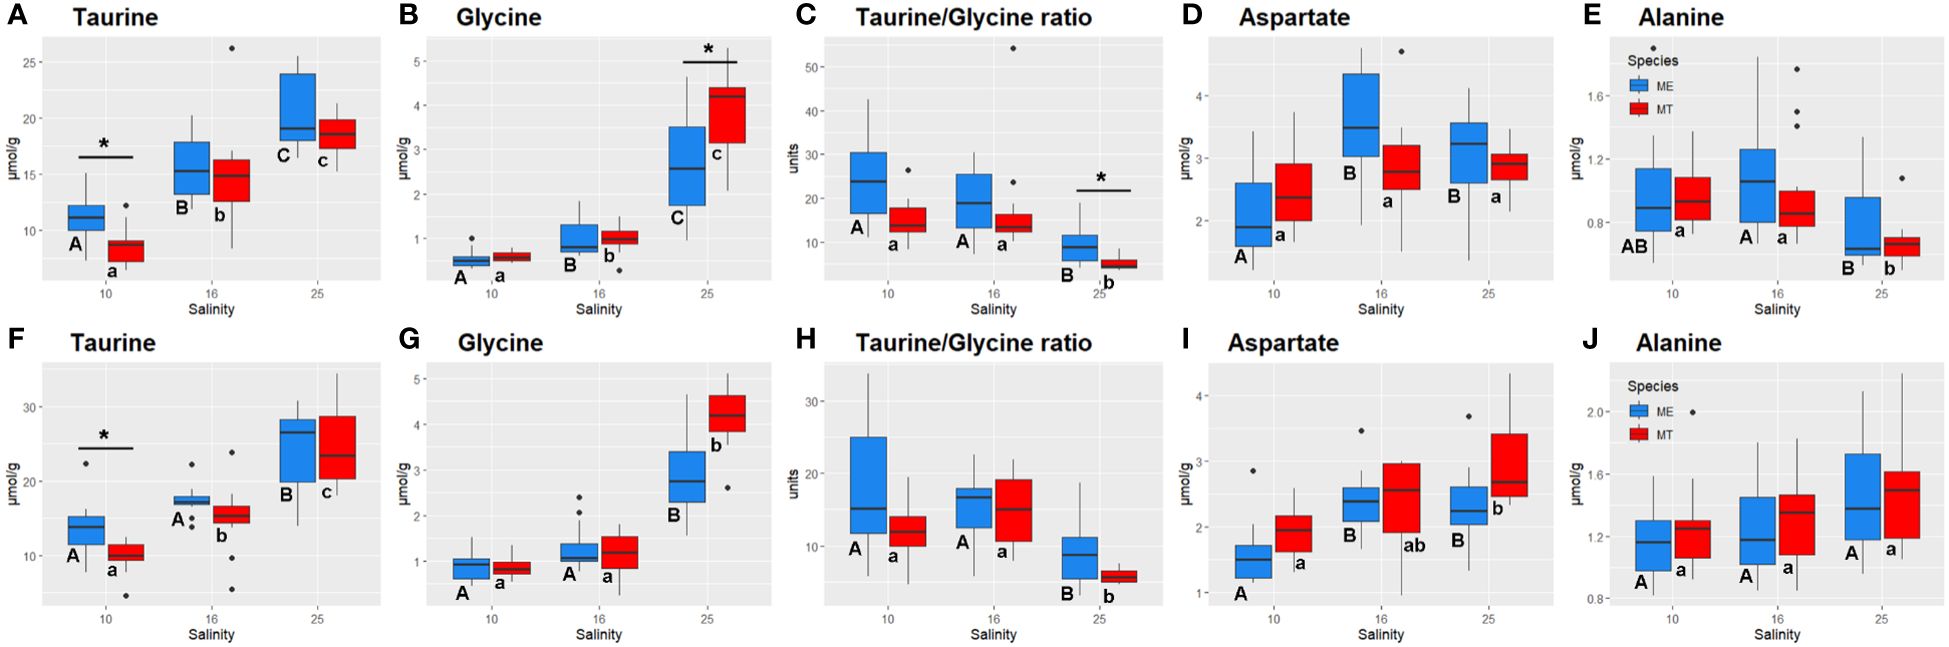
Figure 4 Salinity- and species-specific concentrations of the key osmolytes and Taurine:Glycine ratio in the tissues of the White Sea Mytilus spp. Significantly different values (P<0.05) in mussels at different salinities are indicated with different letters (upper case letters for M. edulis, and lower case letters for M. trossulus). Significant (P<0.05) difference between species within each salinity is indicated by horizontal bar with an asterisk. N = 10–15 (for sample sizes within each species- and salinity-specific group see Supplementary Tables 2 and 3). (A–E) – gills; (F–J) – digestive gland. (A, F) – taurine, (B, G) – glycine, (C, H) – Taurine:Glycine ratio, (D, I) - aspartate, (E, J) – alanine. ME, M. edulis; MT, M. trossulus.
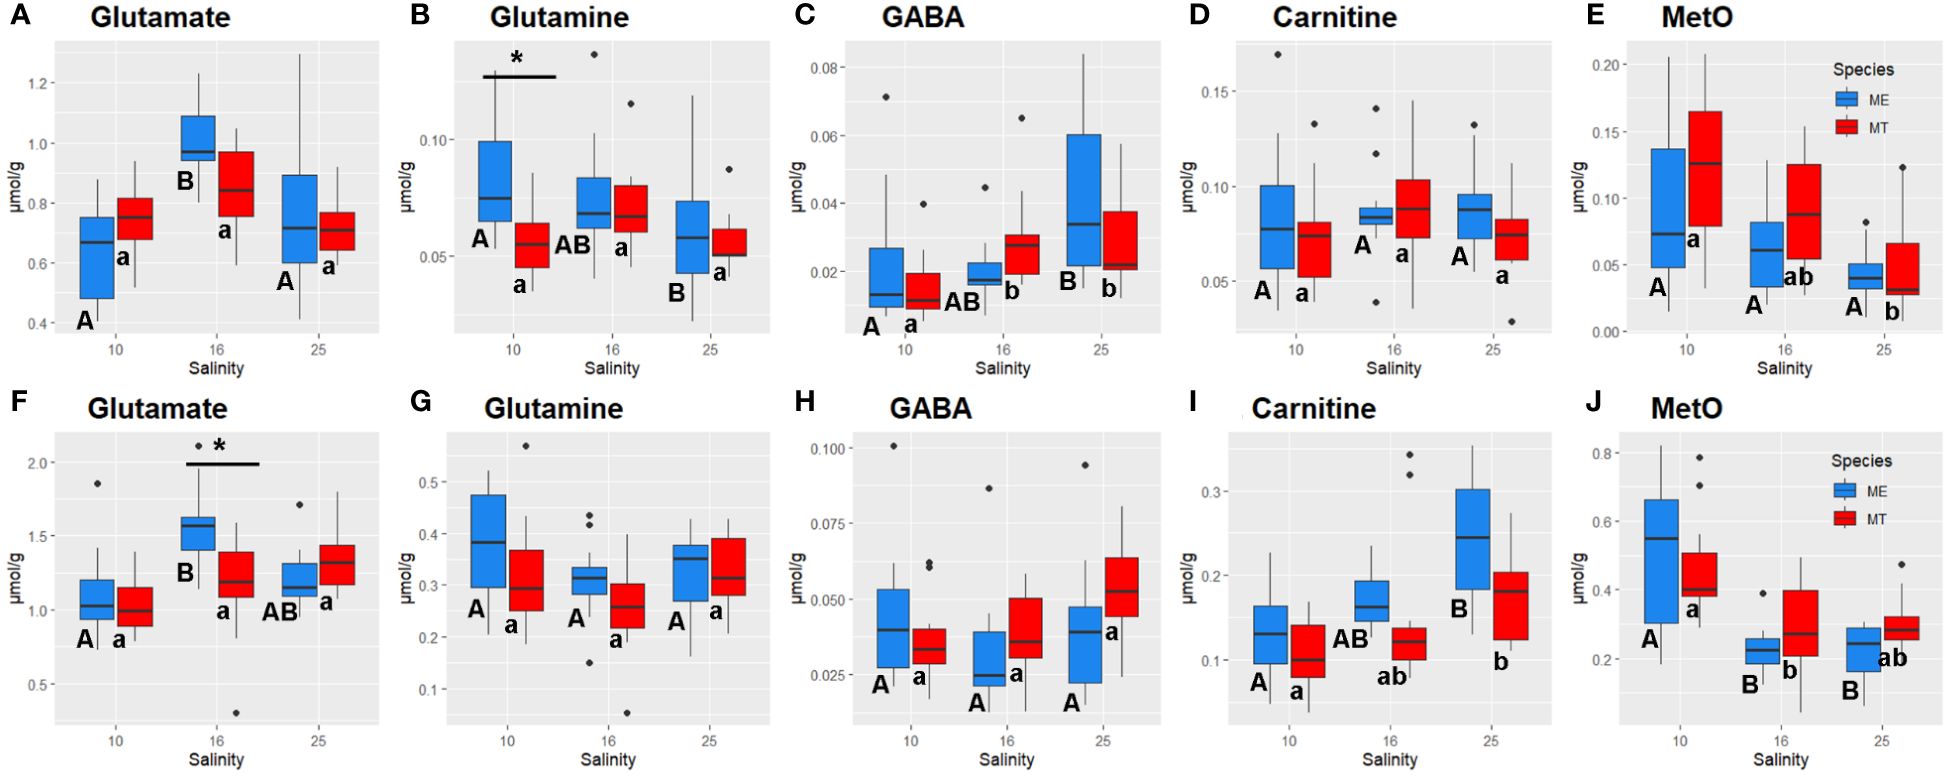
Figure 5 Salinity- and species-specific concentrations of glutamate (A, F), glutamine (B, G), GABA (C, H), carnitine (D, I) and methionine sulfoxide (E, J) in the tissues of the White Sea Mytilus spp. Significantly different values (P<0.05) in mussels at different salinities are indicated with different letters (upper case letters for M. edulis, and lower case letters for M. trossulus). Significant (P<0.05) difference between species within each salinity is indicated by horizontal bar with an asterisk. N = 10–15 (for sample sizes within each species- and salinity-specific group see Supplementary Tables 2, 3). (A–E) – gills; (F–J) – digestive gland. ME, M. edulis; MT, M. trossulus.
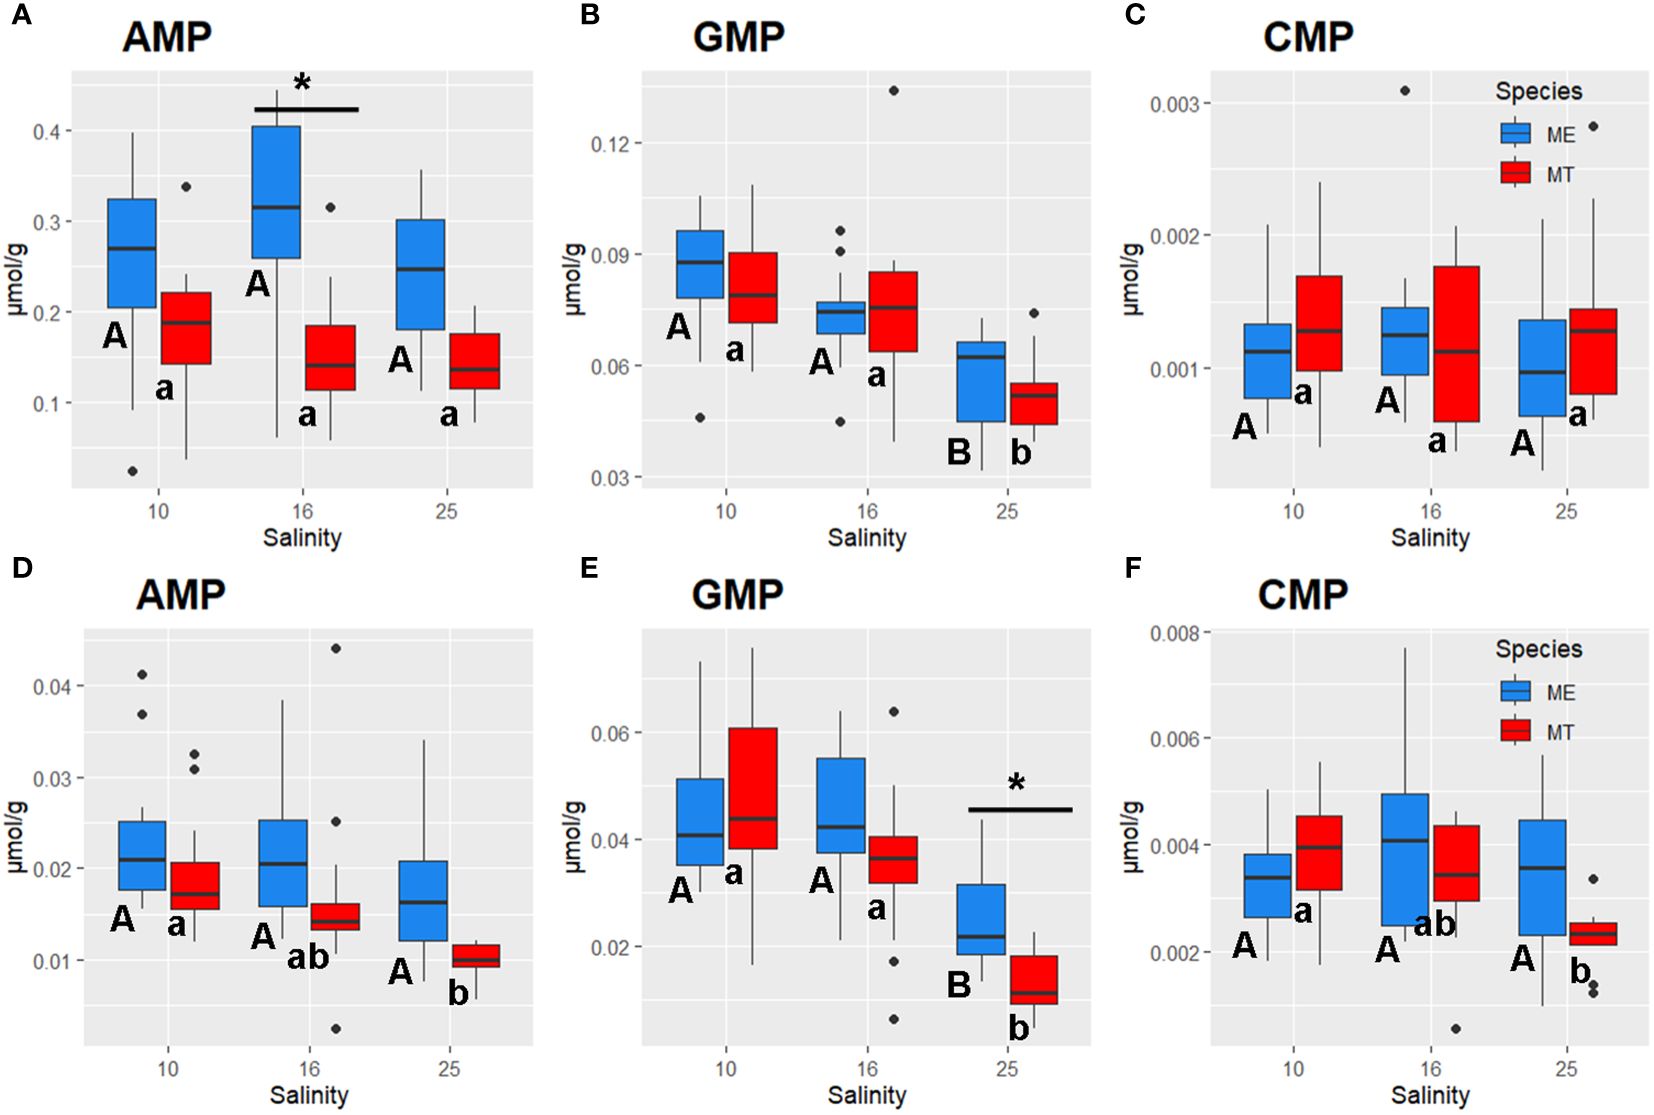
Figure 6 Salinity- and species-specific concentrations of nucleoside monophosphates in the tissues of the White Sea Mytilus spp. Significantly different values (P<0.05) in mussels at different salinities are indicated with different letters (upper case letters for M. edulis, and lower case letters for M. trossulus). Significant (P<0.05) difference between species within each salinity is indicated by horizontal bar with an asterisk. N = 10–15 (for sample sizes within each species- and salinity-specific group see Supplementary Tables 2, 3). (A–C) – gills; (D–F) – digestive gland. (A, D) – AMP, (B, E) – GMP, (C, F) – CMP. ME, M. edulis; MT, M. trossulus.
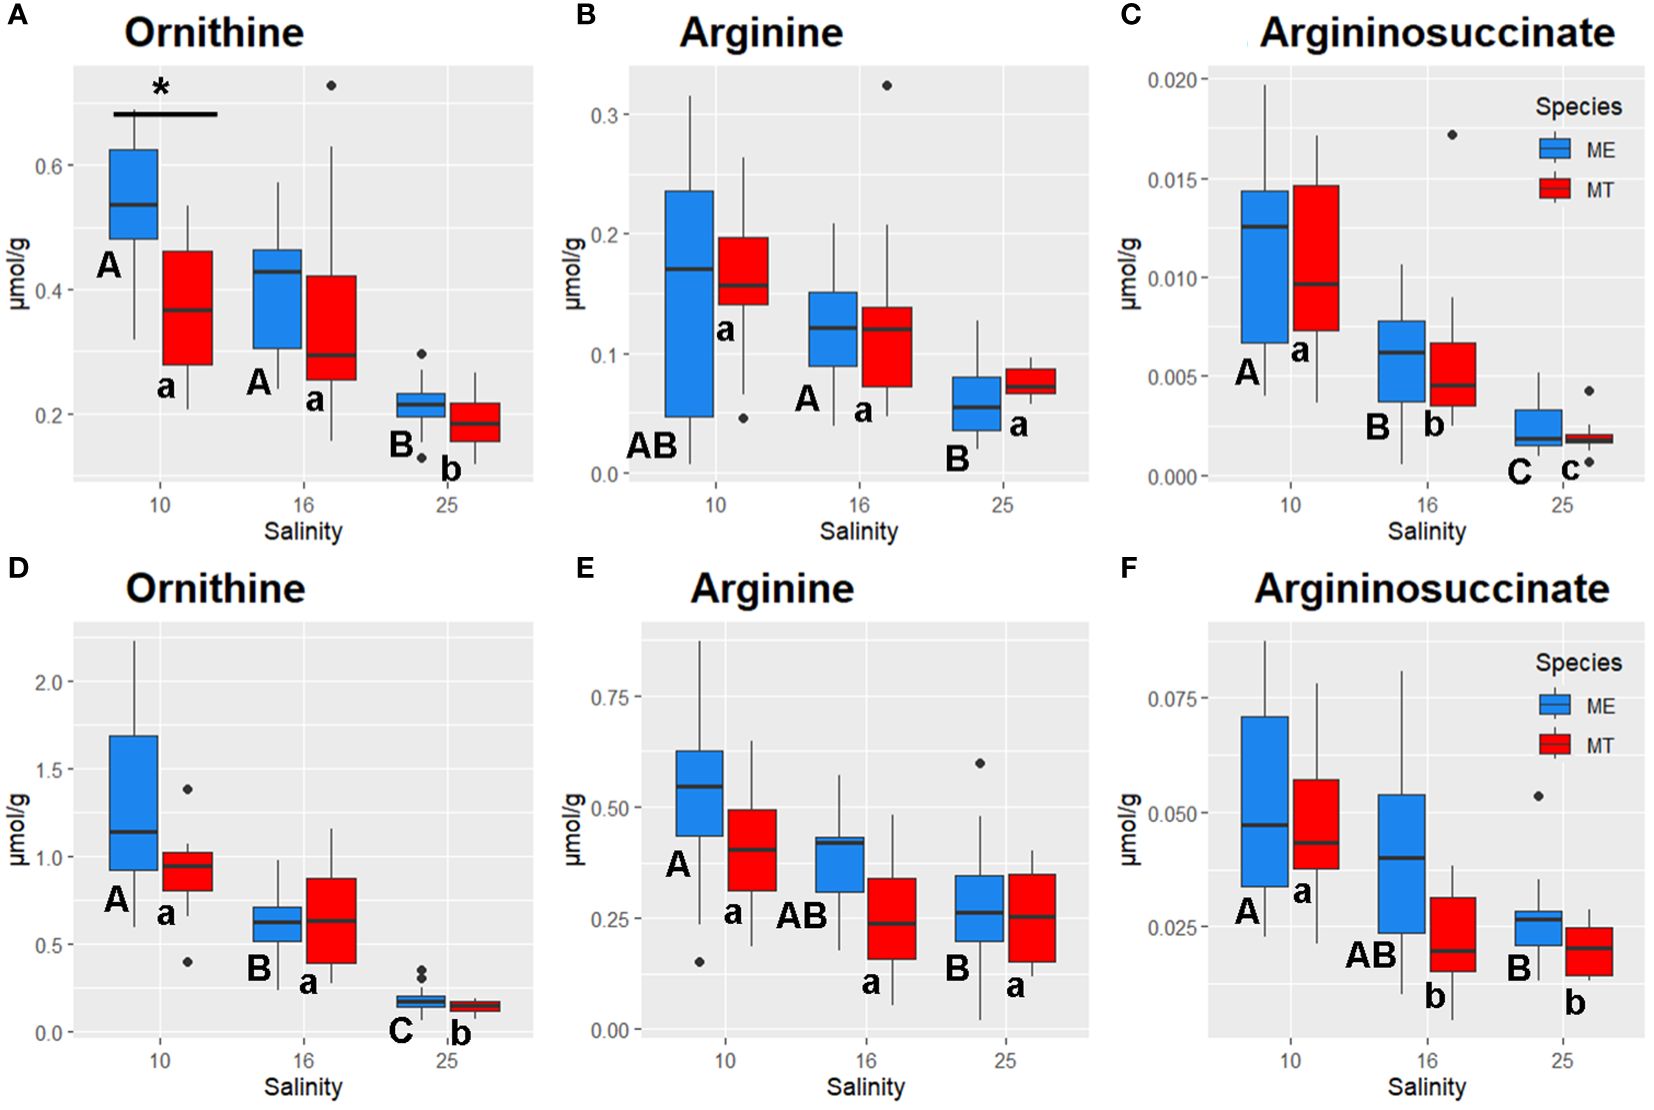
Figure 7 Salinity- and species-specific concentrations of urea cycle intermediates in the tissues of the White Sea Mytilus spp. Significantly different values (P<0.05) in mussels at different salinities are indicated with different letters (upper case letters for M. edulis, and lower case letters for M. trossulus). Significant (P<0.05) difference between species within each salinity is indicated by horizontal bar with an asterisk. N = 10–15 (for sample sizes within each species- and salinity-specific group see Supplementary Tables 2 and 3). (A–C) – gills; (D–F) – digestive gland. (A, D) – ornithine, (B, E) – arginine, (C, F) – argininosuccinate. ME, M. edulis; MT, M. trossulus.
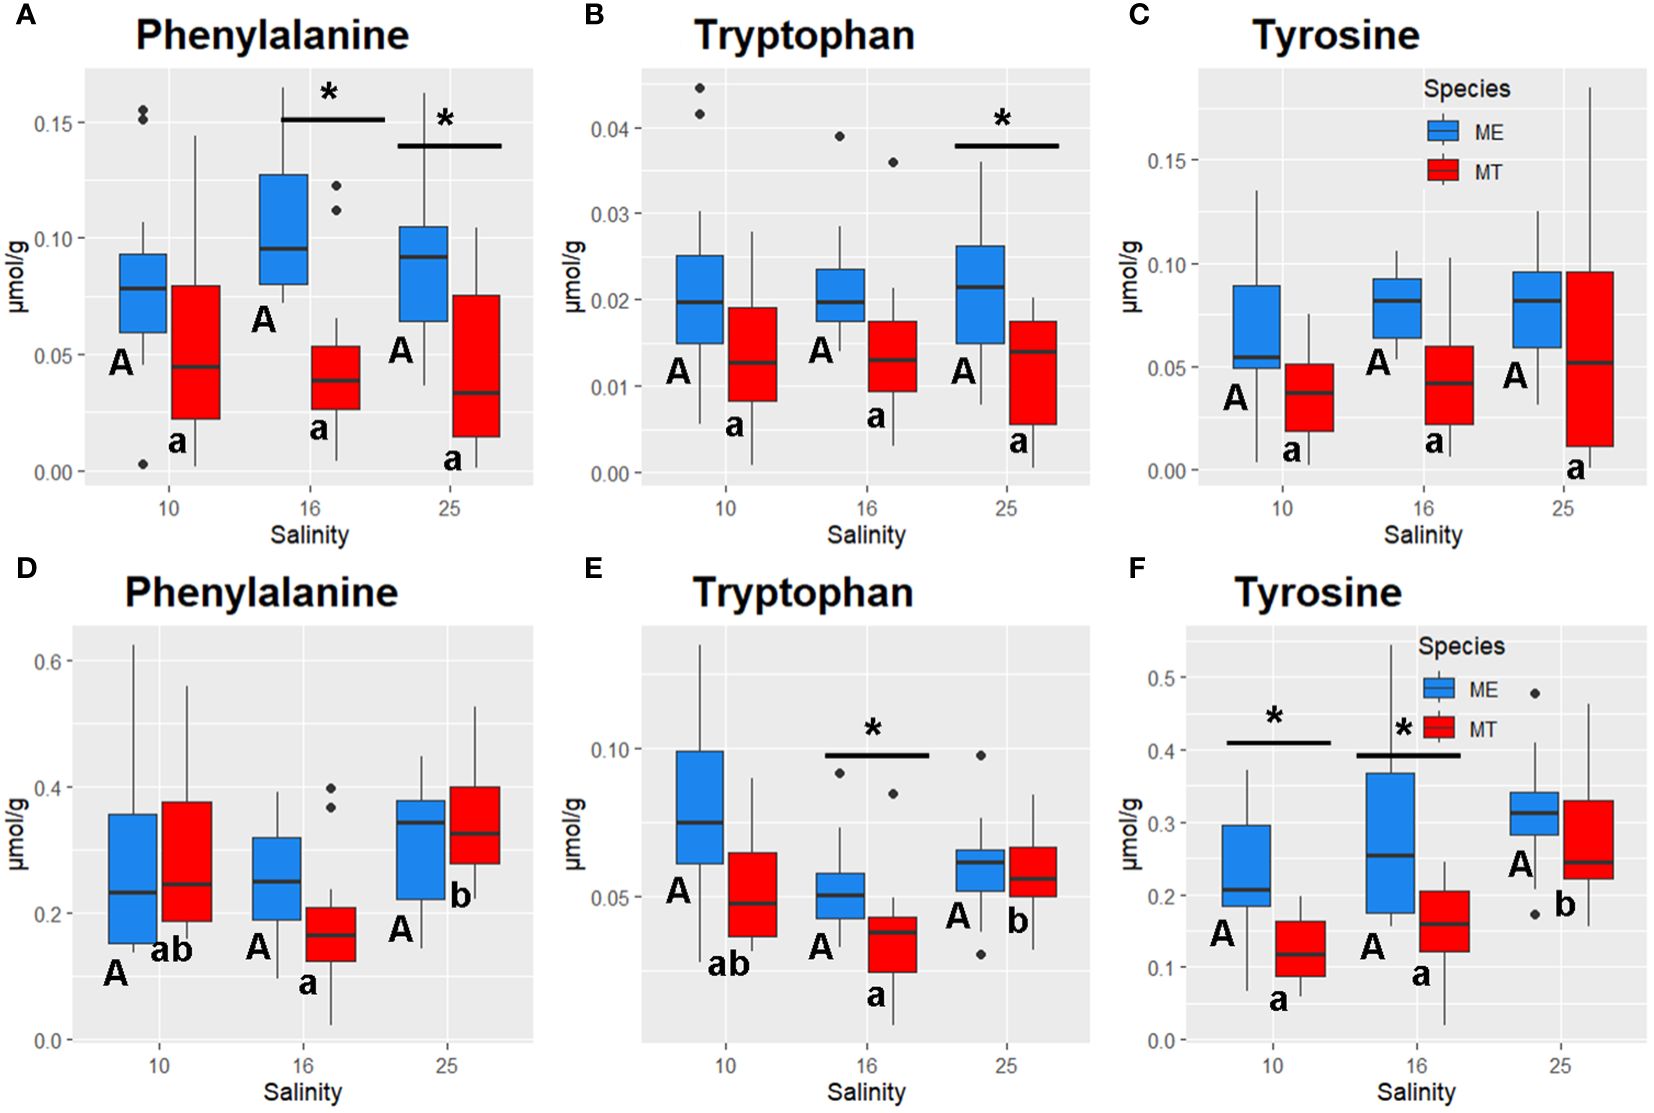
Figure 8 Salinity- and species-specific concentrations of aromatic amino acids in the tissues of the White Sea Mytilus spp. Significantly different values (P<0.05) in mussels at different salinities are indicated with different letters (upper case letters for M. edulis, and lower case letters for M. trossulus). Significant (P<0.05) difference between species within each salinity is indicated by horizontal bar with an asterisk. N = 10–15 (for sample sizes within each species- and salinity-specific group see Supplementary Tables 2 and 3). (A–C) gills; (D–F) – digestive gland. (A, D) – phenylalanine, (B, E) – tryptophan, (C, F) – tyrosine. ME, M. edulis; MT, M. trossulus.
Effects of salinity on mussel metabolome
Acclimation salinity had a significant effect on the concentrations of 30 out of 35 studied primary metabolic compounds in M. trossulus and M. edulis (Supplementary Table 1). The concentrations of Tau and Gly showed a consistent decrease with decreasing salinity, with this trend being particularly pronounced for Gly (Supplementary Tables 1, 4; Figures 4A, B, F, G). Tau:Gly ratio significantly increased under low salinity conditions in gills and digestive gland in both species (Figures 4C, H). In general, Mytilus edulis demonstrated higher values of Tau:Gly, than M. trossulus, and these interspecific differences reached significance in gills at control salinity (Figure 4C). Unlike Tau and Gly, Asp concentrations showed a non-monotonic response to salinity in Mytilus spp. In both studied species, Asp levels remained constant between salinities of 25 and 16 and decreased at salinity 10 (Figures 4D, I). Ala showed opposite salinity-related trends in the two studied tissues with an increase in the gill and a decrease in the digestive gland under hypoosmotic conditions (Figures 4E, J).
Acclimation salinity markedly influenced the tissue concentrations of the urea cycle intermediates in both species (Figure 7). Ornithine levels showed a gradual increase with decreasing salinity in the gill and the digestive gland tissues. In the gills, ornithine concentrations were similar at low (10) and intermediate (16) salinities and 2–3-fold higher than in the tissues of mussels kept at salinity 25 (P<0.05) (Figure 7A). In the digestive gland, the same pattern was observed in M. trossulus, while in M. edulis all salinity treatments showed significant differences in ornithine concentrations (Figure 7B). Arg and argininosuccinate also accumulated in the mussels’ tissues in response to the decrease in salinity (Figures 7B, C, E, F).
Metabolites involved in ammonium detoxification, Glu and glutamine (Gln), showed tissue- and species-specific responses to salinity acclimation. Glu concentrations peaked at the intermediate salinity in the gills of both studied species and in the digestive gland of M. edulis (Figures 5A, F). Gln levels in M. edulis gills increased with decreasing salinity, whereas in the gills of M. trossulus, slightly higher Gln concentration was found in the intermediate (16) salinity relative to the control (25) and low (10) salinity (Figure 5B). In the digestive gland of both studied species, Gln concentration tended to be the lowest at the intermediate salinity compared to the low or high salinity conditions (Figure 5G). GABA levels decreased in the gill tissues of the mussels under hypoosmotic (10 and 16) conditions compared with the gills of the mussels kept at salinity 25 (Figure 5C). A similar trend was seen in digestive gland, although it did not achieve statistical significance (Figure 5H). Carnitine concentrations declined under the hypoosmotic (10 and 16) conditions in the digestive gland of the mussels but remained relatively stable across all salinity conditions in the gills (Figures 5D, I).
Tissue concentrations of TCA cycle intermediates (malate and succinate) did not significantly differ between the salinity treatments in Mytilus spp., except for a modest decline in malate levels in the gill tissue at low (10) salinity (Supplementary Tables 2 and 3). A glycolysis end product lactate showed somewhat higher concentrations in gill tissue of M. edulis than that in M. trossulus, while in digestive gland no difference in lactate content between the species was observed (Supplementary Tables 2 and 3). However, acclimation to low (10) salinity led to significant accumulation of MetO in both studied tissues (Figures 5E, J). Nucleoside monophosphates accumulated in the tissues of the mussels under hypoosmotic conditions (Figure 6). Thus, concentrations of AMP in both species and CMP in M. trossulus increased in the digestive gland of the specimens exposed to low (10) salinity (Figures 6D, F). Concentrations of GMP increased in both the gills and the digestive gland of the mussels at intermediate (16) and low (10) salinity compared with the high (25) salinity conditions (Figures 6B, E).
Pathway enrichment analysis revealed nine key metabolic pathways that were significantly altered by acclimation salinity in both studied tissues of both Mytilus species (FDR<0.05). These salinity-modulated pathways included arginine biosynthesis; arginine and proline metabolism; alanine, aspartate and glutamate metabolism; glycine, serine and threonine metabolism; taurine and hypotaurine metabolism; glutathione metabolism; glyoxylate and dicarboxylate metabolism; purine metabolism; and lipoic acid metabolism (Supplementary Table 5). Furthermore, salinity influenced additional four (in M. edulis) to six (in M. trossulus) metabolic pathways in a tissue- and species-specific manner. These included TCA cycle and butanoate metabolism in M. edulis gills, tyrosine metabolism in M. edulis digestive gland, and metabolism of aromatic amino acids (tyrosine metabolism, phenylalanine, tyrosine, and tryptophan biosynthesis, and phenylalanine metabolism), histidine metabolism, butanoate metabolism and pyrimidine metabolism in M. trossulus digestive gland (FDR<0.05) (Supplementary Table 5).
Species-specific differences in the mussels’ metabolome
Pathway enrichment analysis showed metabolic differences between M. edulis and M. trossulus acclimated at salinities 10 and 16 but not in those acclimated at salinity 25 (Supplementary Table 6). At salinities 10 and 16, significant species-specific differences were found in the gills and the digestive gland tissues in the pathways related to metabolism of aromatic amino acids including phenylalanine, tyrosine and tryptophan biosynthesis; phenylalanine metabolism; and tyrosine metabolism (Supplementary Table 6). Furthermore, at salinity 10 significant differences between M. edulis and M. trossulus were detected with respect to arginine biosynthesis; and taurine and hypotaurine metabolism in both studied tissues, as well as alanine, aspartate and glutamate metabolism; nucleotide (purine and pyrimidine) metabolism in the gills, and histidine, tryptophan and pyruvate metabolism in the digestive gland (Supplementary Table 6). At salinity 16, differences between M. edulis and M. trossulus were found with respect to purine metabolism in the gills, and arginine biosynthesis; arginine and proline metabolism; alanine, aspartate and glutamate metabolism; histidine metabolism; butanoate metabolism; and glyoxylate and dicarboxylate metabolism in the digestive gland tissues (Supplementary Table 6). No significantly different pathways between M. edulis and M. trossulus were found at salinity 25.
Out of 35 studied metabolites, only a few (two in the gills, and four in the digestive gland) showed significant interactive effects of species and salinity, whereas for the remaining metabolites the effects of species x salinity interaction were not statistically significant (P>0.05) (Supplementary Table 1). Lack of significant interactive effects indicates similarity of the salinity-induced shifts in most studied metabolites between the two studied species. However, several metabolites showed significant interactive effects (P<0.05) indicating that salinity-induced changes in the levels of these compounds differed between M. edulis and M. trossulus (Supplementary Table 1). This included Glu (in the gills and the digestive gland), Asp in the gills, and Gly, GMP and histidine in the digestive gland. Thus, digestive gland tissue of M. edulis contained about 1.5-fold more Gly under high (25) salinity conditions compared to M. trossulus tissues, albeit this species-specific difference disappeared at intermediate (16) and low (10) salinities (Figure 4G). Concentrations of Glu in the gill and the digestive gland of M. edulis peaked at salinity 16, whereas in M. trossulus tissues, Glu levels were lower at salinity 10 and levelled off between salinities 16 and 25 (Figures 5A, F). Concentrations of GMP in digestive gland of M. trossulus increased with decreasing salinity, while in M. edulis GMP showed similar concentrations at salinities 10 and 16 (Figure 6E; Supplementary Table 3).
Random Forest (RF) analysis based on 1000 permutations showed robust assignment of the tissue metabolite profile to the respective acclimation salinity groups, particularly at low (10) and high (25) salinity. Thus, metabolite profiles of mussels from different salinity acclimation groups were accurately classified in 93–100% cases for salinities 10 and 25, and in 85–92% cases for salinity 16 (Table 2). The classification error for species assignment based on the metabolite profiles was generally higher (Table 2). Thus, based on 1000 permutations, the metabolite profiles of the gill tissues were misclassified with regard to the species in 21–36% of cases, with exception of the metabolite profiles of M. edulis acclimated to salinity 16 and 25, which were only misclassified in 7–8% of cases (Table 2). In the digestive gland tissues of M. edulis, the classification error for species assignment based on the metabolite profiles was 13–25%. In M. trossulus, the classification error of the digestive gland metabolite profiles with respect to species was 0%, 8% and 30% at salinities 10, 16 and 25, respectively (Table 2). The three top metabolites that contributed most to the classification accuracy of the metabolite profiles in different species and salinity groups included ornithine, Gly and Tau (Figure 9).
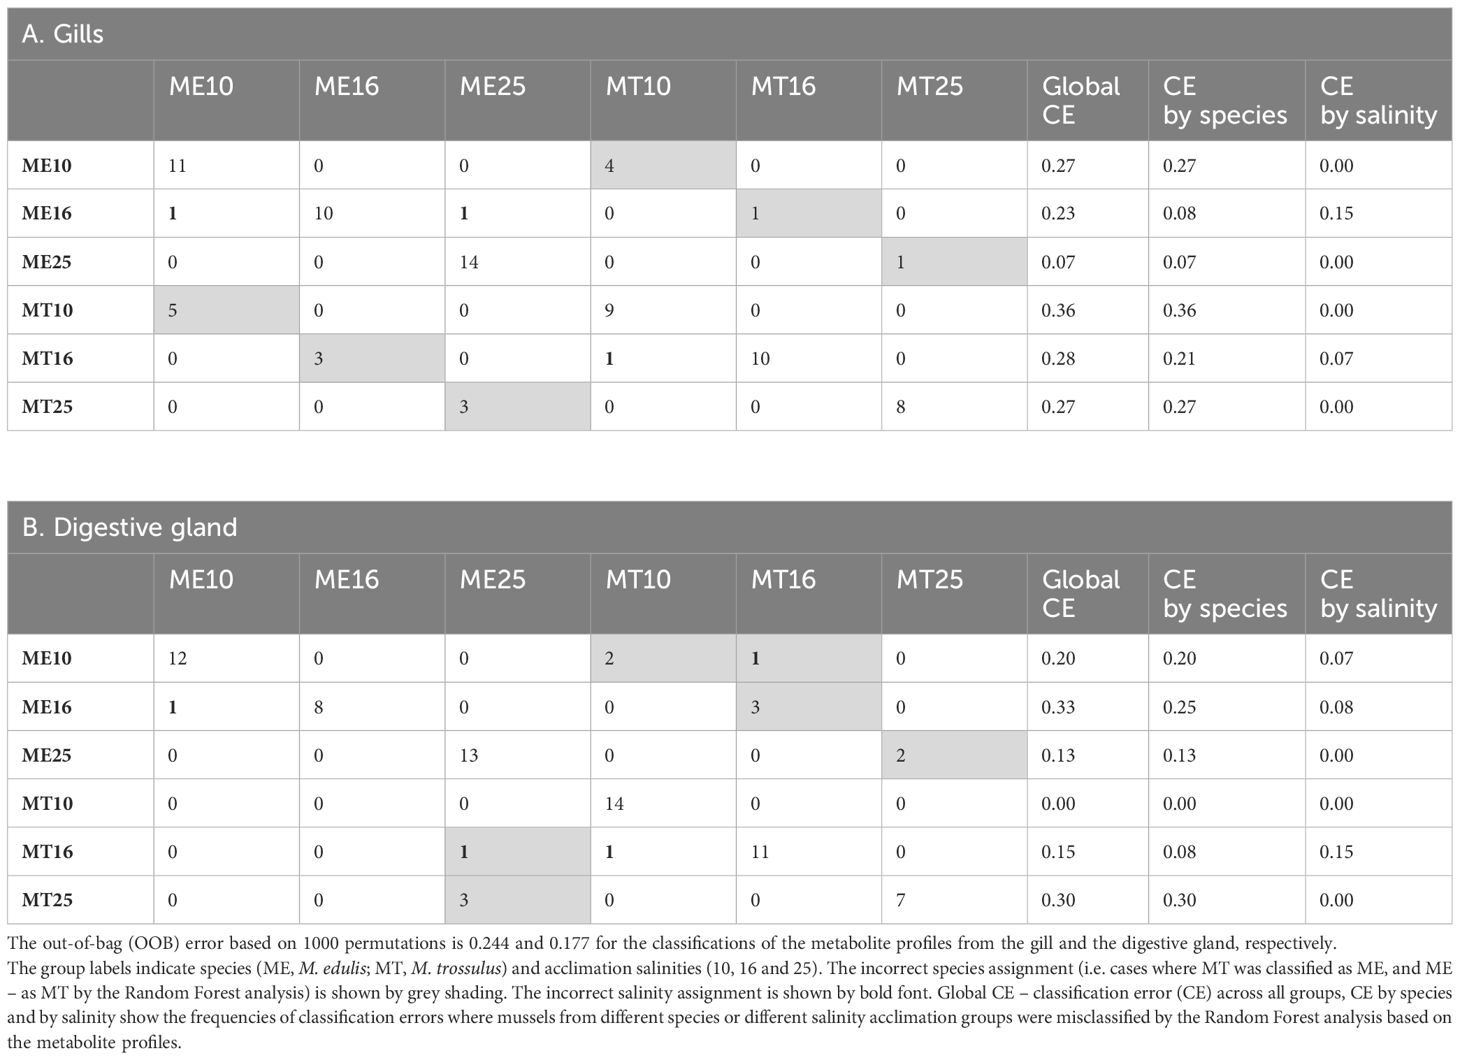
Table 2 The Random Forest classification performance of the species- and salinity-specific metabolite profiles from the gills and the digestive glands of the White Sea mussels.
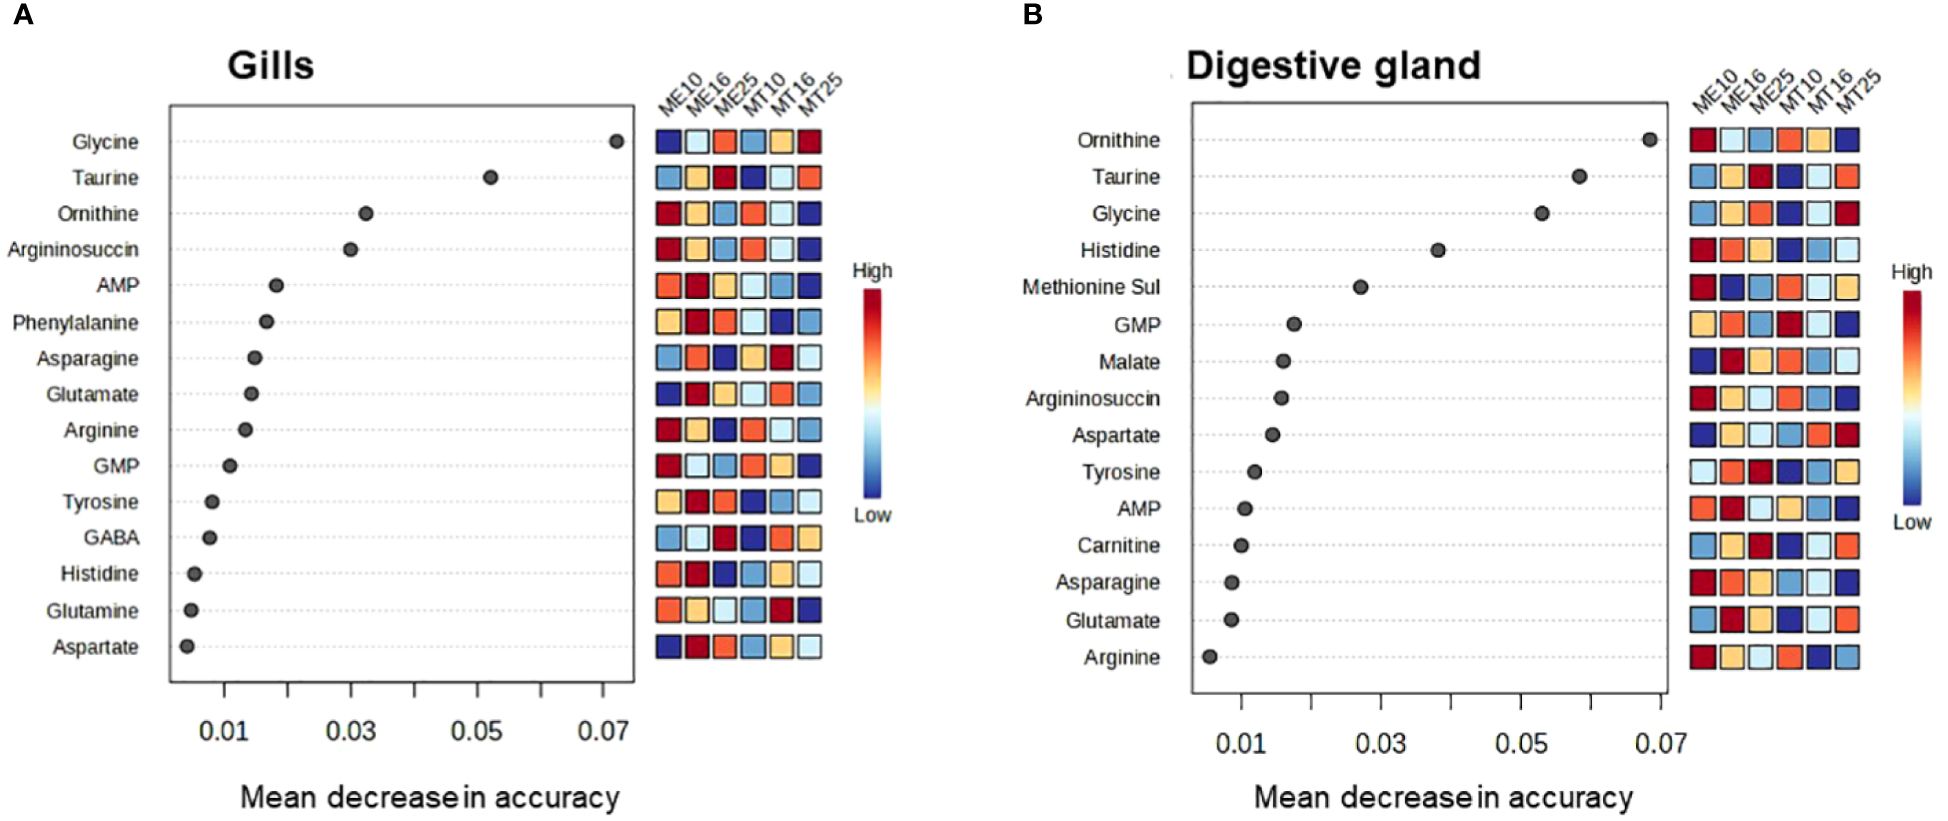
Figure 9 Significant features identified by Random Forest analysis of the metabolite profiles of M. edulis and M. trossulus acclimated at different salinities. (A) – gills, (B) – digestive gland. Overall, 12 groups were used in classification analysis, separately for the two studied species and three acclimation salinities (10, 16 and 25). The significant features are ranked by the mean decrease in classification accuracy based on 1000 permutations.
Discussion
Behavioral response of mussels to acute salinity changes
Closing of shell valves is a typical avoidance response of bivalve mollusks to unfavorable stimuli, such as mechanical disturbance, exposure to air (de Zwaan and Mathieu, 1992), heat stress (Grimmelpont et al., 2024), chemical contaminants (Vereycken and Aldridge, 2023), harmful algae (Hégaret et al., 2007), and salinity extremes (Shumway, 1977; Davenport, 1979). Isolation of mantle cavity by closing exhalant siphon, mantle edges, and shell valves in response to rapid lowering of salinity reduces exchange of water and solutes with the ambient seawater and conserves the composition of body fluids. Upon salinity rising over a certain level, the osmoreceptors trigger opening of shell valves and resuming pumping activity (Davenport, 1981). The threshold salinity at which mussel closes and opens can be an estimate of tolerance limits at acute exposures that is suitable in comparative studies (Sukhotin et al., 2003; Chaparro et al., 2009; Kurihara, 2017). The normal salinity of the surface sea water in the White Sea is about 25, while in the estuaries, in intertidal habitats, and during the spring desalination of surface waters mussels can be exposed to much lower salinities. In our experiments, salinity around 13–12 caused massive closure of mussels irrespective of species. The experiments involved three successive cycles of decreasing and then increasing salinity. With each cycle, the average salinity at which mussels tended to close or open decreased. This pattern persisted in all three experiments (days), and clearly indicated an acclimation to reduced salinity in the course of each experiment. Shell closure in response to sharp reduction of salinity to half the normal value is typical for Mytilus living in full saline waters (Widdows, 1985; de Vooys, 1991), and also for those from the White Sea (present data). In our acute experiments all mussels were closed when ambient salinity reached 10, which is consistent with the earlier data on Mytilus spp. from the White Sea (Sukhotin et al., 2003). This value, however, was not immediately lethal for either species, as mussels in this study lived at a salinity of 10 for over one month during chronic exposure. Threshold value for opening shells at salinity increase was somewhat lower than that for closing in both species (Figures 1B–D). Similar effect was observed in M. edulis from British waters (Davenport, 1981; Widdows, 1985). Shell closure protects tissues from osmotic shock, but leads to the cessation of filtration and respiration activity causing metabolic rate suppression, switch to anaerobiosis, and build-up of metabolic wastes. Therefore, mussels likely aim for resuming normal activities as soon as osmotic concentration and ion composition of the external millieu is suitable. Receptors for Na+, Mg2+ and Cl-, located on the tentaculate region of the inhalant siphon are responsible for triggering shell opening (Davenport, 1981). We did not observe difference between M. edulis and M. trossulus in the threshold salinity for shell closing, while shell opening occurred earlier (at lower salinity on average) in M. trossulus than in M. edulis. Earlier opening of M. trossulus compared to M. edulis may indicate both slightly greater tolerance of M. trossulus to low salinity, and their greater urge to open, e.g. due to higher oxygen debt. This earlier opening may contribute to a better ability of M. trossulus than M. edulis to recover from hypoosmotic stress (Riisgård et al., 2013). The causes of the observed behavioral differences between studied congeners warrant further investigation.
Species-specific differences in intermediary metabolism of Mytilus spp.
Two closely related species of the blue mussels Mytilus edulis species complex, M. edulis and M. trossulus often occur sympatrically and readily interbreed in nature (McDonald et al., 1991; Kijewski et al., 2011; Śmietanka et al., 2014). This interbreeding underscores their genetic similarity and suggests a lack of significant reproductive barriers between these distinct genetic lineages (Kijewski et al., 2011; Śmietanka et al., 2014). Our present study on sub-Arctic populations of the blue mussels showed that at control salinity (25) the tissue metabolic make-up is generally similar between M. edulis and M. trossulus, with the species-specific metabolic differences becoming more prominent under hypoosmotic conditions. Thus, the pathway enrichment analysis (which is sensitive to subtle consistent changes amongst metabolites compounds involved in the same biological pathway) could not identify any significantly different metabolic pathways in M. edulis vs. M. trossulus acclimated to salinity 25. In contrast, acclimation to intermediate (16) and low (10) salinity revealed significant species-specific differences in multiple metabolic pathways between M. edulis and M. trossulus.
Under hypoosmotic conditions (salinities 16 and 10), consistent species-specific differences involved metabolism of aromatic amino acids (AAAs) including Phe, Tyr, and Trp biosynthesis; Phe metabolism; and Tyr metabolism both in the gills and the digestive gland tissues. This conclusion is supported by the results of the RDA analysis where concentrations of AAAs were associated with the RDA2 axis separating the two studied Mytilus spp. Since animals lack the enzymes to synthesize AAAs de novo, they must obtain these essential metabolites from their diet, making the metabolism of these amino acids crucial for overall health (Allen and Kilgore, 1975; Harrison, 1975; Fitzgerald and Szmant, 1997; Han et al., 2019). Besides their role in protein synthesis, the AAAs act as crucial precursors for hormones and neurotransmitters in animals (Kutchko and Siltberg-Liberles, 2013). Thus, Tyr is the precursor for the biosynthesis of L-Dopa and dopamine, as well as for melanic pigments (Kutchko and Siltberg-Liberles, 2013; Han et al., 2019). Dopamine functions as a significant neurotransmitter in mollusks (Sweeney, 1963; Kotsyuba and Dyachuk, 2023), while L-Dopa is essential for shell formation and byssus thread adhesion in Mytilus spp (Almeida et al., 1998; Lee et al., 2006; Xu et al., 2012). Furthermore, Tyr is crucial for the biosynthesis of melanin, a pigment involved in shell pigmentation and immune function of bivalves (Newkirk, 1980; Luna-Acosta et al., 2017; Komura et al., 2018). Trp is the initial precursor for synthesizing serotonin that plays a key role in the neurotransmission and regulation of reproductive behavior (like spawning) in mollusks (Sayyed Mohammad Hadi et al., 2017) as well as for biosynthesis of melatonin involved in the regulation of circadian and tidal rhythms (Blanc et al., 2003; Tran et al., 2020; Zhu et al., 2022). Overall, tissue concentrations of AAAs tended to be higher in M. edulis compared with M. trossulus at all acclimation salinities. In M. trossulus, a decrease in Phe, Tyr and Trp concentrations was found in the digestive gland at salinities 10 and 16 compared with the control (25) salinity, whereas in M. edulis, no salinity-dependent change of AAAs content was detected. These findings indicate M. edulis can better regulate the AAA concentrations during salinity downshift than M. trossulus. The lower baseline levels of AAAs and their decrease under hypoosmotic conditions in M. trossulus may result in limitations of these essential amino acids and have implications for the key biological processes controlled by the AAA-derived hormones including the regulation of the circadian rhythms (Tran et al., 2020; Zhu et al., 2022), feeding, reproduction (Gibbons and Castagna, 1984; Frank et al., 2015; Foster et al., 2021; Canesi et al., 2022), immunity and shell growth (Newkirk, 1980; Luna-Acosta et al., 2017; Komura et al., 2018). These findings indicate that hypoosmotic stress may result in a greater perturbation of the balance of hormones and neurotransmitters in the White Sea M. trossulus than in M. edulis and warrant further investigation.
Additionally, species-specific differences were detected in nucleotide (purine and pyrimidine) metabolism of the mussels’ gills in hypoosmotic treatments (10 and 16). Purine and pyrimidine phosphates are major energy carriers in the cells, and the three studied compounds (AMP, GMP and CMP) represent the final hydrolysis products of the high-energy nucleotide phosphates ATP, GTP and CTP. Concentrations of a pyrimidine monophosphate (CMP) in the gills did not significantly differ between M. trossulus and M. edulis. In contrast, studied purines (GMP and AMP) showed higher levels in the tissues of M. edulis compared to M. trossulus, with the stronger interspecific differences found for AMP concentrations. AMP concentrations were also associated with RDA2 axis separating the metabolic profiles of the two studied species. AMP plays a pivotal role in cellular energy metabolism, serving as both an end product of ATP hydrolysis and an allosteric regulator for energy-related enzymes. AMP can be transformed into ADP by adenylate kinase, a process crucial for ATP regeneration (Hardie, 2003; Zhou et al., 2022). Additionally, AMP activates AMP-activated protein kinase (AMPK), a master regulator of cellular energy expenditure, which stimulates catabolic pathways to facilitate ATP regeneration (Hardie, 2003). Elevated levels of AMP suggest higher rates of cellular catabolic processes in M. edulis than in M. trossulus. Interestingly, concentrations of carnitine, an essential metabolite involved in the mitochondrial fatty acid transport via the carnitine shuttle, was also elevated in M. edulis tissues relative to those of M. trossulus, with the most pronounced differences in the digestive gland. The hypothesis proposing higher rates of cellular catabolism in M. edulis is supported by the elevated levels of urea cycle intermediates (ornithine, arginine, and argininosuccinic acid) observed in M. edulis compared to M. trossulus. This suggests higher rates of nitrogen excretion in M. edulis, a notion indirectly supported by previous findings showing elevated expression of the gene encoding ornithine aminotransferase in M. edulis relative to M. trossulus (May and Rawson, 2023). On the contrary, in the Baltic M. trossulus ammonia excretion was significantly higher than in the North Sea M. edulis even 1 year after transplantation and maintenance in the North Sea (Tedengren et al., 1990). The Baltic M. trossulus have longer history of adaptation to extremely low salinity than the same species from other regions in Europe, including the White Sea (Riginos and Cunningham, 2005).
At the lowest tested salinity (10), species-specific differences were found between the White Sea M. edulis and M. trossulus with regard to the metabolism of key intracellular organic osmolytes including Tau in both studied tissues, and Gly in the gills as shown by both the pathway enrichment and GLM ANOVA analyses. Concentrations of Tau were higher and those of Gly – lower in the tissues of M. edulis compared to M. trossulus. As a result, the Tau:Gly ratios were higher in M. edulis compared with M. trossulus. This finding is consistent with an earlier report of very low proportion of taurine in tissues of M. trossulus from the Eastern Baltic, compared to M. edulis from the Mecklenburg Bight and the Atlantic coast (Kube et al., 2006). Thus, it appears that despite genetic and metabolic similarities, M. edulis and M. trossulus might utilize different biochemical mechanisms to cope with hyposalinity stress, with Tau being a more preferred osmolyte in M. edulis than in M. trossulus.
Salinity-induced changes in the osmolyte metabolism of White Sea Mytilus spp.
Despite the species-specific differences in some metabolic pathways like the metabolism of AAAs, nucleotides and Tau, the metabolome shifts caused by acclimation to hyposalinity showed remarkable similarities in M. edulis and M. trossulus. Of 35 studied metabolites, only Asp and Glu (in the gills) and Gly, Glu, His, and GMP (in the digestive gland) showed evidence of significant interactive effects of species and salinity, suggesting that the salinity-induced changes in these metabolites differed between M. edulis and M. trossulus. The remaining metabolites showed a consistent pattern of salinity-induced changes in both studied species and both tissues, suggesting that salinity predominantly drove the shifts in the metabolome.
The concentrations of FAAs declined with decreasing salinity in the tissues of M. edulis and M. trossulus, consistent with the well-established role of FAAs as important organic osmolytes in marine bivalves (Zurburg and de Zwaan, 1981; de Vooys, 1991; Yancey, 2005; Podbielski et al., 2022b). Two FAAs (Tau and Gly) showed a consistent pattern of salinity-dependent change in both studied tissues of M. edulis and M. trossulus. Of these FAAs, Tau was the dominant one contributing well over 50% to the total osmolyte pool at all tested salinities. Gly was quantitatively more important as osmolyte at high (25) salinity (9–15% of the osmolyte pool) compared with salinities 16 and 10 (4–5%). A similar pattern was observed in oyster Crassostrea virginica populations from marine and estuarine regions, with marine populations primarily relying on taurine for adjustments to high salinity, while estuarine populations depended on glycine, alanine, and proline (Pierce et al., 1992). Tau dominated and Gly was the second contributor to the FAA pool of Mytilus spp. along European coasts from Sardinian Sea to Western Baltic, while in M. trossulus from the most brackish area (Askö) Tau took less than 3% to the FAA pool (Kube et al., 2006). Notably, the taurine to glycine molar ratios (Tau:Gly) were higher in the tissues of M. edulis (9–24) than in M. trossulus (5–15) in our present study. In bivalves, Tau:Gly ratio broadly varies among species and populations. Thus, in the Baltic Sea Mytilus spp. from the M. edulis-M. trossulus hybrid zone, Tau:Gly ratio was ~2–3 at salinity 15 (Scholz, 1987; Haider et al., 2020). A Tau:Gly ratio of ~2.5 was reported in the hard shell clam Mercenaria mercenaria from the western Atlantic (salinity 30–32) (Jeffries, 1972), whereas in Crassostrea gigas from the Wadden Sea (salinity 30), this ratio reached 8–53 (Haider et al., 2020; Bruhns et al., 2023).
In bivalves, exposure to abiotic stressors leads to an increase in the Tau:Gly ratio as it was shown in M. edulis exposed to trace metals (cadmium and copper) and starvation (Scholz, 1987), and in Mercenaria mercenaria and Mytilus galloprovincialis exposed to hydrocarbon pollution (Jeffries, 1972; Babarro et al., 2006). Our data indicate that an increase in the Tau:Gly ratio might also be involved in response to hypoosmotic stress in the two studied Mytilus spp. Thus, in the White Sea M. edulis Tau:Gly ratio increased from 9 at salinity 25 to 17–24 at salinity 10. In the White Sea M. trossulus, Tau:Gly ratio increased from 5–6 (salinity 25) to 12–15 (salinity 10). Enhanced biosynthesis of Tau associated with upregulation of cysteine sulfinate decarboxylase (CSAD1), a key enzyme in taurine biosynthesis pathway, was also reported in the Pacific oyster C. gigas in response to hypoosmotic stress (Zhao et al., 2017). Tau is a cytoprotective compound that stimulates metabolism and mitigates oxidative stress (Schaffer et al., 2003; Baliou et al., 2021). In bivalves, Tau can protect the mitochondria from osmotic stress and enhance ATP synthesis capacity (Sokolov and Sokolova, 2019). Higher Tau:Gly ratios could indicate a cellular defense mechanism aimed at reducing cellular stress by protecting the mitochondria. This hypothesis finds indirect support in the observation that extreme stress, such as prolonged anoxia or hypoxia combined with elevated temperatures leading to mortality, correlates with the breakdown of this protective mechanism and a decrease in Tau:Gly ratios (Haider et al., 2020; Bruhns et al., 2023).
The pathway enrichment analysis highlighted the significance of changes in Tau and Gly in the metabolic adjustments of Mytilus spp. under varying salinity conditions. This is evident in the alteration of two important pathways, namely taurine and hypotaurine metabolism, and glycine, serine, and threonine metabolism, observed in both the gills and the digestive gland. Furthermore, acclimation to different salinities altered glutathione metabolism in the gills and the digestive gland of the mussels reflecting the salinity-induced changes in Gly and Glu that serve as precursors for glutathione synthesis (Lu, 2013). Glutathione is an important antioxidant (Forman et al., 2009), and dysregulation of glutathione metabolism may have negative implications for the redox balance of the mussels’ cells. Studies show that hypoosmotic stress can cause oxidative stress in marine osmoconformers (Rivera-Ingraham and Lignot, 2017; Bal et al., 2021; Zhou et al., 2022), which stems from the heightened aerobic metabolism and enhanced oxidative deamination of FAAs (McAllen et al., 2002). In our study, an increase in the tissue concentrations of MetO, a cellular biomarker of amino acid oxidation, was observed under hypoosmotic conditions in both studied Mytilus spp., indicating oxidative stress caused by salinity downshift. These findings underscore the potential conflict between the cellular need for intracellular osmoregulation, which entails a decrease in free amino acid concentrations with decreasing salinity, and the requirement for antioxidant protection in mussels’ cells.
Besides Tau and Gly, Asp was a quantitatively important contributor (6–17%) to the osmolyte pool of the White Sea Mytilus spp. The contribution of other FAAs ranged between 3–6% (Ala and Glu) to <2% each in the osmolyte pool. In contrast to the monotonic rise in concentration observed with increasing salinity for Tau and Gly, the salinity-dependent alterations in the concentrations of other FAAs often exhibited non-monotonic patterns (e.g., as seen with Asp, Glu or Gln) or a decrease with increasing salinity (e.g., Arg). The diversity in organic osmolyte composition among various species and populations of marine osmoconformers suggests that multiple free FAAs can be used interchangeably for intracellular volume regulation (Yancey et al., 1982; Yancey, 2005). This flexibility enables cells to finely regulate the pool of free amino acids under different salinity conditions, balancing the requirements for biosynthesis, redox balance maintenance (which may involve increasing the abundance of certain amino acid precursors), and intracellular osmoregulation, which relies more on the total concentration of organic osmolytes rather than any particular amino acid (Yancey et al., 1982; Yancey, 2005).
A strong negative correlation between the tissue levels of key osmolytes (Tau, Gly and Asp) with the urea cycle intermediates Arg, argininosuccinate, and ornithine indicate that urea cycle plays an important role in elimination of nitrogen caused by the breakdown of organic osmolytes during salinity downshift in the White Sea Mytilus spp. This correlation was observed in the gills and the digestive gland indicating the importance of this mechanism in both studied species and tissues. At intermediate (16) salinity, the detoxication of the FAA breakdown products may be further facilitated by Gln-mediated ammonium scavenging as indicated by accumulation of Gln and its precursor, Glu in the gills of both studied species and in the digestive gland of M. edulis, but is not observed in the digestive gland of M. trossulus. In bivalves, as in other aquatic animals, the conversion of ammonia to glutamine by glutamate synthase and its transformation to urea through the ornithine-urea cycle are two complementary and highly effective detoxification pathways for managing ammonium buildup (Hongxing et al., 2021). Our research findings suggest that these mechanisms also play a role in mitigating ammonium toxicity resulting from the breakdown of organic osmolytes during intracellular osmoregulation in Mytilus spp.
Interestingly, acclimation to hyposalinity also altered metabolism of glutathione and lipoic acid in the tissues of both studied Mytilus spp. Glutathione is a major antioxidant in the cell that scavenges a variety of reactive oxygen species and prevents oxidative damage to essential cellular components (Forman et al., 2009; Razak et al., 2017). Lipoic acid is also an important metabolite involved in redox regulation acting as an essential co-factor for stabilization and redox-dependent regulation of mitochondrial enzyme complexes and contributing to antioxidant protection of the cell (Packer et al., 1995; Solmonson and Deberardinis, 2018; Skibska et al., 2023). Salinity fluctuations, including hyper- and hypoosmotic stress, are commonly associated with oxidative stress in aquatic invertebrates (Rivera-Ingraham and Lignot, 2017; Bal et al., 2021). Thus, salinity-dependent modulation of the metabolism of antioxidant compounds like glutathione and lipoic acid might help mitigate the negative effects of hypoosmotic conditions on the tissue redox balance and reduce oxidative stress in Mytilus spp.
Conclusions, limitations and outlook
Our comparative analysis revealed species-specific differences in intermediary metabolism and behavioral responses under low salinity conditions between M. edulis and M. trossulus from the sub-Arctic White Sea. While the salinity threshold inducing valve closure was similar in M. edulis and M. trossulus, M. trossulus opened the shell valves at a slightly lower salinity than M. edulis. While both species exhibited similar patterns of salinity-induced changes in most metabolites, distinct metabolic signatures were observed under hypoosmotic conditions in certain pathways, such as AAA metabolism, nucleotide metabolism, and (at salinity of 10) Tau metabolism, suggesting subtle physiological distinctions between these closely related species. Despite these subtle differences in metabolism, hyposalinity-induced shifts in tissue levels of major organic osmolytes like Tau, Gly, Asp and Ala were similar between M. edulis and M. trossulus, suggesting that the mechanisms of cell volume regulation, reliant on organic osmolytes, are conserved across these species. This finding agrees with earlier comparative studies on M. edulis and M. trossulus populations that showed that environmental salinity is of much greater importance than genetic factors in determining the physiological performance of Mytilus congeners (Tedengren and Kautsky, 1986; Tedengren et al., 1990; Gardner and Thompson, 2001; Qiu et al., 2002; Riisgård et al., 2013). The pronounced decrease in tissue concentrations of free amino acids (FAAs), particularly taurine (Tau) and glycine (Gly), with declining salinity underscores the importance of these compounds as organic osmolytes in marine bivalves. However, despite the dominance of Tau over Gly in the osmolyte pool of both studies species, higher Tau:Gly ratios in M. edulis compared to M. trossulus suggest species-specific preferences for FAA-dependent strategies of cell volume regulation. It is worth noting that our study focused solely on organic osmolytes and did not consider inorganic osmolytes, such as Na+ and Cl-, which play a role in intracellular osmoregulation in mollusks (Berger and Kharazova, 1997; Podbielski et al., 2022b). However, recent meta-analysis has shown that the composition and concentration of inorganic osmolytes exhibit minimal variations among bivalve mollusks (Podbielski et al., 2022a, Podbielski et al., 2022b). Given the close relatedness of the two species used in this study, we do not anticipate substantial differences in the inorganic ion composition of their tissues. Overall, we found no conclusive evidence that intracellular osmoregulation or intermediary metabolism of M. trossulus is better adapted to hypoosmotic conditions than that of M. edulis. Further research should elucidate the functional significance of the metabolic differences between these two closely related species and their implications for the ecological performance of Mytilus spp. in changing marine environments.
Data availability statement
The raw data supporting the conclusions of this article will be made available by the authors, without undue reservation.
Ethics statement
The manuscript presents research on animals that do not require ethical approval for their study.
Author contributions
IS: Conceptualization, Resources, Supervision, Writing – original draft, Writing – review & editing. AK: Data curation, Investigation, Methodology, Validation, Visualization, Writing – original draft, Writing – review & editing. ST: Investigation, Methodology, Resources, Validation, Writing – review & editing. JM: Investigation, Methodology, Resources, Writing – review & editing. AS: Conceptualization, Funding acquisition, Investigation, Project administration, Resources, Supervision, Writing – original draft, Writing – review & editing.
Funding
The author(s) declare financial support was received for the research, authorship, and/or publication of this article. The research was supported by the Russian Science Foundation (grant no. 23-24-00226 awarded to AS).
Acknowledgments
The authors are grateful to Elena Likhareva and Elizaveta Gafarova for their help with laboratory work and to Dr. Vadim Khaitov for his valuable statistical advice. We also thank three reviewers whose constructive comments have helped to improve the manuscript.
Conflict of interest
The authors declare that the research was conducted in the absence of any commercial or financial relationships that could be construed as a potential conflict of interest.
The author(s) declared that they were an editorial board member of Frontiers, at the time of submission. This had no impact on the peer review process and the final decision.
Publisher’s note
All claims expressed in this article are solely those of the authors and do not necessarily represent those of their affiliated organizations, or those of the publisher, the editors and the reviewers. Any product that may be evaluated in this article, or claim that may be made by its manufacturer, is not guaranteed or endorsed by the publisher.
Supplementary material
The Supplementary Material for this article can be found online at: https://www.frontiersin.org/articles/10.3389/fmars.2024.1403774/full#supplementary-material
Supplementary Table 1 | ANOVA: Effects of salinity and species on concentration of primary metabolites in the gill and digestive gland of Mytilus spp. from the White Sea. Results acquired from models that remained significant after Holm-Bonferroni correction are marked with asterisks.
Supplementary Table 2 | Mean concentrations of the studied metabolites in the gill tissues of M. edulis and M. trossulus acclimated to different salinities. Acclimation salinities- 10, 16 and 25. Mean values, standard deviations (SD) and sample sizes (N) are given for each group. The initial sample sizes (after removal of hybrids) were as follows: for M. edulis - salinity 10 N=15; salinity 16 N=13, salinity 25 N=15; for M. trossulus - salinity 10 N=14; salinity 16 N=14, salinity 25 N=11. The small deviation of the sample sizes used in the GLM ANOVA and the calculation of means and SDs for some metabolites (as indicated in the column N of the Supplementary Table 2) was due to the removal of outliers (1–3 per group).
Supplementary Table 3 | Mean concentrations of the studied metabolites in the digestive gland tissues of M. edulis and M. trossulus acclimated to different salinities. Acclimation salinities- 10, 16 and 25. Mean values, standard deviations (SD) and sample sizes (N) are given for each group. The initial sample sizes (after removal of hybrids) were as follows: for M. edulis - salinity 10 N=15; salinity 16 N=13, salinity 25 N=15; for M. trossulus - salinity 10 N=14; salinity 16 N=14, salinity 25 N=11. The small deviation of the sample sizes used in the GLM ANOVA and the calculation of means and SDs for some metabolites (as indicated in the column N of the Supplementary Table 3) was due to the removal of outliers (1–3 per group).
Supplementary Table 4 | RDA analysis of the metabolite profiles in the gills and the digestive gland tissues of the White Sea Mytilus edulis and M. trossulus. (A) – Results of the RDA partitioning analysis, including eigenvalues and their contributions to the data variance for 35 metabolites (PC1–35), (B) - summary of the permutation tests based on 9999 permutations.
Supplementary Table 5 | Pathways modulated by the salinity exposures in the tissues of the mussels from the White Sea. The pathway enrichment analysis was conducted using Metaboanalyst 6.0 software. Only significantly modulated pathways (FDR<0.05) with impact >0 are shown. Total: the total number of compounds in the respective pathway according to Kyoto Encyclopedia of Genes and Genomes (KEGG) pathway database. Hits and Metabolites: The number and the names of metabolites analyzed in the present study that belong to the corresponding pathway. The pathways that are modulated by salinity in both studied species and tissue types are highlighted in bold.
Supplementary Table 6 | Metabolic pathways that significantly differ between M. edulis and M. trossulus at the common acclimation salinities. The pathway enrichment analysis was conducted using Metaboanalyst 6.0 software. Only significantly modulated pathways (FDR<0.05) with impact >0 are shown. Total: the total number of compounds in the respective pathway according to Kyoto Encyclopedia of Genes and Genomes (KEGG) pathway database. Hits and Metabolites: The number and the names of metabolites analyzed in the present study that belong to the corresponding pathway. The pathways that are different between M. edulis and M. trossulus at salinities 10 and 16 and in both studied tissues are highlighted in bold. No significantly different pathways between the two species were found in the gills or the digestive gland of the mussels of acclimated at salinity 25.
Supplementary Table 7 | Post-hoc analyses for differences in the group means of concentrations of different metabolites in the tissues of the White Sea Mytilus spp. Differences between the means (Δ means), upper and lower 95% confidence intervals (CI), and p values adjusted for multiple comparisons are given. Species: ME – M. edulis, MT – M. trossulus, acclimation salinities: 10, 16 and 25. DG – digestive gland.
Supplementary Figure 1 | Correlation heat map of the studied metabolites in the gill tissue of the White Sea mussels. Color coding shows the Pearson correlation coefficient between the respective metabolite concentrations. The correlation coefficient values corresponding to different colors and shades are shown in a bar next to the correlation matrix. The metabolite concentrations were auto scaled (mean-centered and divided by standard deviation of each variable). N=82.
Supplementary Figure 2 | Correlation heat map of the studied metabolites in the digestive gland tissue of the White Sea mussels. Color coding shows the Pearson correlation coefficient between the respective metabolite concentrations. The correlation coefficient values corresponding to different colors and shades are shown in a bar next to the correlation matrix. The metabolite concentrations were auto scaled (mean-centered and divided by standard deviation of each variable). N=79.
References
Allen W. V., Kilgore J. (1975). The essential amino acid requirements of the red abalone, Haliotis rufescens. Comp. Biochem. Physiol. A 50, 771–775. doi: 10.1016/0300-9629(75)90144-9
Almeida M. J., MaChado J., Vieira Coelho M. A., Soares da Silva P., Coimbra J. (1998). l-3,4-Dihydroxyphenylalanine (l-DOPA) secreted by oyster (Crassostrea gigas) mantle cells: functional aspects. Comp. Biochem. Physiol. B 120, 709–713. doi: 10.1016/S0305-0491(98)10066-4
Babarro J. M. F., Fernández Reiriz M. J., Garrido J. L., Labarta U. (2006). Free amino acid composition in juveniles of Mytilus galloprovincialis: Spatial variability after Prestige oil spill. Comp. Biochem. Physiology Part A 145, 204–213. doi: 10.1016/j.cbpa.2006.06.012
Bal A., Panda F., Pati S. G., Das K., Agrawal P. K., Paital B. (2021). Modulation of physiological oxidative stress and antioxidant status by abiotic factors especially salinity in aquatic organisms. Comp. Biochem. Physiol. Part C: Toxicol. Pharmacol. 241, 108971. doi: 10.1016/j.cbpc.2020.108971
Baliou S., Adamaki M., Ioannou P., Pappa A., Panayiotidis M. I., Spandidos D. A., et al. (2021). Protective role of taurine against oxidative stress (Review). Mol. Med. Rep. 24, 605. doi: 10.3892/mmr.2021.12242
Beaumont A. R., Hawkins M. P., Doig F. L., Davies I. M., Snow M. (2008). Three species of Mytilus and their hybrids identified in a Scottish loch: Natives, relicts and invaders? J. Exp. Mar. Biol. Ecol. 367, 100–110. doi: 10.1016/j.jembe.2008.08.021
Beaumont A. R., Turner G., Wood A. R., Skibinski D. O. F. (2005). Laboratory hybridizations between Mytilus species and performance of pure species and hybrid veliger larvae at lowered salinity. J. Molluscan Stud. 71, 303–306. doi: 10.1093/mollus/eyi026
Belostotsky R., Frishberg Y. (2022). Catabolism of hydroxyproline in vertebrates: physiology, evolution, genetic diseases and new siRNA approach for treatment. Int. J. Mol. Sci. 23, 1005. doi: 10.3390/ijms23021005
Berger V. J., Kharazova A. D. (1997). Mechanisms of salinity adaptations in marine molluscs. Hydrobiologia 355, 115–126. doi: 10.1023/A:1003023322263
Berger V., Dahle S., Galaktionov K., Kosobokova X., Naumov A., Rat’kova T., et al. (2001). White Sea. Ecology and Environment (St.-Petersburg-Tromsø: Derzavets Publisher).
Bin P., Huang R., Zhou X. (2017). Oxidation resistance of the sulfur amino acids: methionine and cysteine. BioMed. Res. Int. 2017, 9584932. doi: 10.1155/2017/9584932
Blanc A., Vivien-Roels B., Pévet P., Attia J., Buisson B. (2003). Melatonin and 5-methoxytryptophol (5-ML) in nervous and/or neurosensory structures of a gastropod mollusk (Helix aspersa maxima): synthesis and diurnal rhythms. Gen. Comp. Endocrinol. 131, 168–175. doi: 10.1016/S0016-6480(03)00008-X
Borcard D., Gillet F., Legendre P. (2011). Numerical Ecology with R (New York: Springer). doi: 10.1007/978-1-4419-7976-6
Braby C., Somero G. (2006). Ecological gradients and relative abundance of native (Mytilus trossulus) and invasive (Mytilus galloprovincialis) blue mussels in the California hybrid zone. Mar. Biol. 148, 1249–1262. doi: 10.1007/s00227-005-0177-0
Brooks M. E., Kristensen K., van Benthem K. J., Magnusson A., Berg C. W., Nielsen A., et al. (2017). glmmTMB balances speed and flexibility among packages for zero-inflated generalized linear mixed modeling. R J. 9, 378–400. doi: 10.32614/RJ-2017-066
Bruhns T., Timm S., Feußner N., Engelhaupt S., Labrenz M., Wegner M., et al. (2023). Combined effects of temperature and emersion-immersion cycles on metabolism and bioenergetics of the Pacific oyster Crassostrea (Magallana) gigas. Mar. Envir. Res. 192, 106231. doi: 10.1016/j.marenvres.2023.106231
Buschbaum C., Dittmann S., Hung J.-S., Hwang I. S., Strasser M., Thiel M., et al. (2009). Mytilid mussels: global habitat engineers in coastal sediments. Helgoland Mar. Res. 63, 47–58. doi: 10.1007/s10152-008-0139-2
Canesi L., Miglioli A., Balbi T., Fabbri E. (2022). Physiological roles of serotonin in Bivalves: possible interference by environmental chemicals resulting in neuroendocrine disruption. Front. Endorinol. (Lausanne) 13. doi: 10.3389/fendo.2022.7925899
Chaparro O. R., Segura C. J., Montory J. A., Navarro J. M., Pechenik J. A. (2009). Brood chamber isolation during salinity stress in two estuarine mollusk species: from a protective nursery to a dangerous prison. Mar. Ecol. Prog. Ser. 374, 145–155. doi: 10.3354/meps07777
Davenport J. (1979). The isolation response of mussels (Mytilus edulis L.) exposed to falling seawater concentrations. J. Mar. Biol. Ass. U.K. 59, 123–132. doi: 10.1017/S0025315400046221
Davenport J. (1981). The opening response of mussels (Mytilus edulis L.) exposed to rising seawater concentrations. J. Mar. Biol. Ass. U.K. 61, 667–678. doi: 10.1017/S0025315400048116
de Vooys C. G. N. (1991). Anaerobic metabolism in sublittoral living Mytilus galloprovincialis in the Mediterranean - IV. Role of amino acids in adaptation to low salinities during anaerobiosis and aerobiosis. Comp. Biochem. Physiol. 100A, 423–431. doi: 10.1016/0300-9629(91)90494-W
de Zwaan A., Mathieu M. (1992). “Cellular biochemistry and endocrinology,” In: The Mussel Mytilus. Ecology, Physiology, Genetics and Culture, ed. Gosling E.. (Amsterdam, New York: Elsevier). Developments in Aquaculture and Fisheries Sciences 25, 223–307.
Dias P., Bland M., Shanks A., Beaumont A., Piertney S., Davies I., et al. (2009). Mytilus species under rope culture in Scotland: implications for management. Aquaculture Int. 17, 437–448. doi: 10.1007/s10499-008-9214-6
Dias P. J., Piertney S. B., Snow M., Davies I. M. (2011). Survey and management of mussel Mytilus species in Scotland. Hydrobiologia 670, 127–140. doi: 10.1007/s10750-011-0664-x
Fitzgerald L. M., Szmant A. M. (1997). Biosynthesis of ‘essential’ amino acids by scleractinian corals. Biochem. J. 322, 213–221. doi: 10.1042/bj3220213
Forman H. J., Zhang H., Rinna A. (2009). Glutathione: overview of its protective roles, measurement, and biosynthesis. Mol. Aspects Med. 30, 1–12. doi: 10.1016/j.mam.2008.08.006
Foster T., Eid M., Hinkley C., Carroll M., Catapane E. (2021). Genomic study of GABA receptors in the bivalve Crassostrea virginica. FASEB J. 35 (S1). doi: 10.1096/fasebj.2021.35.S1.01688
Frank D. M., Deaton L., Shumway S. E., Holohan B. A., Ward J. E. (2015). Modulation of pumping rate by two species of marine bivalve molluscs in response to neurotransmitters: comparison of in vitro and in vivo results. Comp. Biochem. Physiol. A: Mol. Integr. Physiol. 185, 150–158. doi: 10.1016/j.cbpa.2015.03.015
Gardner J. P. A., Thompson R. J. (2001). The effects of coastal and estuarine conditions on the physiology and survivorship of the mussels Mytilus edulis, M. trossulus and their hybrids. J. Exp. Mar. Biol. Ecol. 265, 119–140. doi: 10.1016/S0022-0981(01)00328-8
Gibbons M. C., Castagna M. (1984). Serotonin as an inducer of spawning in six bivalve species. Aquaculture 40, 189–191. doi: 10.1016/0044-8486(84)90356-9
Gosling E. G. (1992). The Mussel Mytilus: Ecology, Physiology, Genetics and Culture Vol. 25 (Amsterdam; New York: Elsevier. Dev Aquac Fish Sci), 589 pp.
Grimmelpont M., Payton L., Lefrançois C., Tran D. (2024). Molecular and behavioral responses of the mussel Mytilus edulis exposed to a marine heatwave. Mar. Envir. Res. 196, 106418. doi: 10.1016/j.marenvres.2024.106418
Haider F., Falfushynska H. I., Timm S., Sokolova I. M. (2020). Effects of hypoxia and reoxygenation on intermediary metabolite homeostasis of marine bivalves Mytilus edulis and Crassostrea gigas. Comp. Biochem. Physiol. Part A Mol. Integr. Physiol. 242, 110657. doi: 10.1016/j.cbpa.2020.110657
Han Q., Phillips R. S., Li J. (2019). Aromatic amino acid metabolism. Front. Mol. Biosci. 6, 1–3. doi: 10.3389/fmolb.2019.00022
Hardie D. G. (2003). Minireview: the AMP-activated protein kinase cascade: the key sensor of cellular energy status. Endocrinology 144, 5179–5183. doi: 10.1210/en.2003-0982
Heath D. D., Rawson P. D., Hilbish T. J. (1995). PCR-based nuclear markers identify alien blue mussel (Mytilus spp.) genotypes on the west coast of Canada. Can. J. Fish Aquat. Sci. 52, 2621–2627. doi: 10.1139/f95-851
Hégaret H., Wikfors G. H., Shumway S. E. (2007). Diverse feeding responses of five species of bivalve mollusk when exposed to three species of harmful algae. J. Shellfish Res. 26, 549–559. doi: 10.2983/0730–8000(2007)26[549:DFROFS]2.0.CO;2
Hongxing G., Xiafei L., Jialing L., Zhenquan C., Luoyu G., Lei L., et al. (2021). Effects of acute ammonia exposure on antioxidant and detoxification metabolism in clam Cyclina sinensis. Ecotoxicology Environ. Saf. 211, 111895. doi: 10.1016/j.ecoenv.2021.111895
Inoue K., Waite J. H., Matsuoka M., Odo S., Harayama S. (1995). Interspecific variations in adhesive protein sequences of Mytilus edulis, M. galloprovincialis, and M. trossulus. Biol. Bull. 189, 370–375. doi: 10.2307/1542155
Jeffries H. P. (1972). A stress syndrome in the hard clam, Mercenaria mercenaria. J. Invertebrate Pathol. 20, 242–251. doi: 10.1016/0022-2011(72)90151-6
Johannesson K., Kautsky N., Tedengren M. (1990). Genotypic and phenotypic differences between Baltic and North Sea populations of Mytilus edulis evaluated through reciprocal transplantations. II. Genetic variation. Mar. Ecol. Prog. Ser. 59, 211–219. doi: 10.3354/meps059211
Katolikova M., Khaitov V., Väinölä R., Gantsevich M., Strelkov P. (2016). Genetic, Ecological and Morphological Distinctness of the Blue Mussels Mytilus trossulus Gould and M. edulis L. in the White Sea. PloS One 11, e0152963. doi: 10.1371/journal.pone.0152963
Kautsky N., Johannesson K., Tedengren M. (1990). Genotypic and phenotypic differences between Baltic and North Sea populations of Mytilus edulis evaluated through reciprocal transplantations. I. Growth and morphology. Mar. Ecol. Prog. Ser. 59, 203–210. doi: 10.3354/meps059203
Khaitov V. (2013). “Dynamics of salinity, temperature of seawater, and wave characteristics, Yuzhnaya inlet, Ryashkov Island, 01.06–19.08.2012,” in The Chronicle of Nature of the Kandalaksha Reserve. Ed. Koryakin A. S. (Ministry of Nature Resources and Ecology of the Russian Federation, Kandalaksha State Nature Reserve) 58, 152–163.
Khaitov V. M., Makarycheva A. Y., Nematova R. B., Evdokimova A. I. (2023). Predators regulate the taxonomic structure of mixed Mytilus edulis L. and M. trossulus Gould settlements in the shallow waters of the White Sea. Proc. Zoological Institute RAS 327, 8–24. doi: 10.31610/trudyzin/2023.327.1.8
Khaitov V., Marchenko J., Katolikova M., Väinölä R., Kingston S. E., Carlon D. B., et al. (2021). Species identification based on a semi-diagnostic marker: Evaluation of a simple conchological test for distinguishing blue mussels Mytilus edulis L. and M. trossulus Gould. PloS One 16, e0249587. doi: 10.1371/journal.pone.0249587
Khalaman V. V., Sukhotin A. A. (2012). “Mariculture,” in Biological resources of the White Sea: study and use. Chapter 9, Investigations of the Fauna of the Seas 69(77). Ed. Berger V. (Zoological Institute of the Russian Academy of Sciences, St. Petersburg), 294–319.
Kijewski T., Śmietanka B., Zbawicka M., Gosling E., Hummel H., Wenne R. (2011). Distribution of Mytilus taxa in European coastal areas as inferred from molecular markers. J. Sea Res. 65, 224–234. doi: 10.1016/j.seares.2010.10.004
Knöbel L., Nascimento-Schulze J. C., Sanders T., Zeus. D., Hiebenthal C., Barboza F. R., et al. (2021). Salinity driven selection and local adaptation in Baltic Sea mytilid mussels. Front. Mar. Sci. 8. doi: 10.3389/fmars.2021.692078
Komura T., Kagi H., Ishikawa M., Yasui M., Sasaki T. (2018). “Spectroscopic investigation of shell pigments from the family neritidae (Mollusca: gastropoda),” in Biomineralization. Eds. Endo K., Kogure T., Nagasawa H. (Springer Singapore, Singapore), 73–82.
Kotsyuba E., Dyachuk V. (2023). Role of the neuroendocrine system of marine bivalves in their response to hypoxia. Int. J. Mol. Sci. 24, 1202. doi: 10.3390/ijms24021202
Kube S., Gerber A., Jansen J. M., Schiedek D. (2006). Patterns of organic osmolytes in two marine bivalves, Macoma balthica, and Mytilus spp., along their European distribution. Mar. Biol. 149, 1387–1396. doi: 10.1007/s00227-006-0303-7
Kurihara T. (2017). Tolerance of the bivalve Trapezium liratum (Reeve 1843) to decrease in salinity. Plankton Benthos Res. 12, 44–52. doi: 10.3800/pbr.12.44
Kutchko K. M., Siltberg-Liberles J. (2013). Metazoan innovation: from aromatic amino acids to extracellular signaling. Amino Acids 45, 359–367. doi: 10.1007/s00726-013-1509-x
Lajus D. L., Sukhotin A. A. (1998). A new approach for the assessment of stochastic variation: analysis of behavioral response in blue mussel (Mytilus edulis L.). Helgol. Meeresunt. 52, 141–145. doi: 10.1007/BF02908743
Lee H., Scherer N. F., Messersmith P. B. (2006). Single-molecule mechanics of mussel adhesion. Proc. Natl. Acad. Sci. 103, 12999–13003. doi: 10.1073/pnas.0605552103
Lobo-da-Cunha A. (2019). Structure and function of the digestive system in mollusks. Cell Tissue Res. 377, 475–503. doi: 10.1007/s00441-019-03085-9
Lowen J. B., Innes D. J., Thompson R. J. (2013). Predator-induced defenses differ between sympatric Mytilus edulis and M. trossulus. Mar. Ecol. Prog. Ser. 475, 135–143. doi: 10.3354/meps10106
Lu S. C. (2013). Glutathione synthesis. Biochim. Biophys. Acta (BBA) - Gen. Subj. 1830, 3143–3153. doi: 10.1016/j.bbagen.2012.09.008
Lukanin V. V. (1985). “Distribution of mussels Mytilus edulis in the White Sea,” in Investigation of Mussels of the White Sea. Ed. Lukanin V. V. (Zoological Institute, Leningrad), 45–58.
Luna-Acosta A., Breitwieser M., Renault T., Thomas-Guyon H. (2017). Recent findings on phenoloxidases in bivalves. Mar. pollut. Bull. 122, 5–16. doi: 10.1016/j.marpolbul.2017.06.031
Marchenko J., Khaitov V., Katolikova M., Sabirov M., Malavenda S., Gantsevich M., et al. (2023). Patterns of spatial and temporal dynamics of mixed Mytilus edulis and M. trossulus populations in a small subarctic inlet (Tyuva Inlet, Barents Sea). Front. Mar. Sci. 10. doi: 10.3389/fmars.2023.1146527
May M. A., Rawson P. D. (2023). Ornithine metabolism and the osmotic stress response in mytilid congeners. Mar. Freshw. Behav. Physiol. 56, 33–53. doi: 10.1080/10236244.2023.2208724
McAllen R., Walker D., Taylor A. (2002). The environmental effects of salinity and temperature on the oxygen consumption and total body osmolality of the marine flatworm. Procerodes littoralis. J. Exp. Mar. Biol. Ecol. 268, 103–113. doi: 10.1016/S0022-0981(01)00381-1
McDonald J. H., Seed R., Koehn R. K. (1991). Allozymes and morphometric characters of three species of Mytilus in the Northern and Southern Hemispheres. Mar. Biol. 111, 323–333. doi: 10.1007/BF01319403
McKindsey C. W., Archambault P., Callier M. D., Olivier F. (2011). Influence of suspended and off-bottom mussel culture on the sea bottom and benthic habitats: a review. Can. J. Zool. 89, 622–646. doi: 10.1139/z11-037
Newkirk G. F. (1980). Genetics of shell color in Mytilus edulis L. and the association of growth rate with shell color. J. Exp. Mar. Biol. Ecol. 47, 89–94. doi: 10.1016/0022-0981(80)90140-9
Oksanen J., Simpson G. L., Blanchet F. G., Friendly M., Kindt R., Legendre P., et al. (2022) vegan community ecology package version 2.6–4. Available online at: https://cran.r-project.org/package=vegan.
Packer L., Witt E. H., Tritschler H. J. (1995). alpha-Lipoic acid as a biological antioxidant. Free Radic. Biol. Med. 19, 227–250. doi: 10.1016/0891-5849(95)00017-R
Pang Z., Chong J., Zhou G., de Lima Morais D. A., Chang L., Barrette M., et al. (2021). MetaboAnalyst 6.0: narrowing the gap between raw spectra and functional insights. Nucleic Acids Res. 49, W388–W396. doi: 10.1093/nar/gkab382
Pierce S. K., Rowland-Faux L. M., O’Brien S. M. (1992). Different salinity tolerance mechanisms in Atlantic and Chesapeake Bay conspecific oysters: glycine betaine and amino acid pool variations. Mar. Biol. 113, 107–115. doi: 10.1007/BF00367644
Pinheiro J. C., Bates D. M. (2000). Mixed-Effects Models in S and S-PLUS (New York: Springer). doi: 10.1007/b98882
Pinheiro J., Bates D., R Core Team (2023) nlme: Linear and Nonlinear Mixed Effects Models. R package version 3.1–164. Available online at: https://CRAN.R-project.org/package=nlme.
Podbielski I., Hiebenthal C., Hajati M.-C., Bock C., Bleich M., Melzner F. (2022a). Capacity for cellular osmoregulation defines critical salinity of marine invertebrates at low salinity. Front. Mar. Sci. 9. doi: 10.3389/fmars.2022.898364
Podbielski I., Schmittmann L., Sanders T., Melzner F. (2022b). Acclimation of marine invertebrate osmolyte systems to low salinity: A systematic review & meta-analysis. Front. Mar. Sci. 9. doi: 10.3389/fmars.2022.934378
Qiu J.-W., Tremblay R., Bourget E. (2002). Ontogenetic changes in hyposaline tolerance in the mussels Mytilus edulis and M. trossulus implications for distribution. Mar. Ecol. Prog. Ser. 228, 143–152. doi: 10.3354/meps228143
Rawson P. D., Secor C. L., Hilbish T. J. (1996). The effects of natural hybridization on the regulation of doubly uniparental mtDNA inheritance in blue mussels (Mytilus spp.). Genetics 144, 241–248. doi: 10.1093/genetics/144.1.241
Razak M. A., Begum P. S., Viswanath B., Rajagopal S. (2017). Multifarious beneficial effect of nonessential amino acid, glycine: A review. Oxid. Med. Cell. Longevity 2017, 1716701. doi: 10.1155/2017/1716701
R Core Team (2023). R: A Language and Environment for Statistical Computing (Vienna, Austria: R Foundation for Statistical Computing). Available at: https://www.R-project.org/.
Ridgway G., Naevdal G. (2004). Genotypes of Mytilus from waters of different salinity around Bergen, Norway. Helgol. Mar. Res. 58, 104–109. doi: 10.1007/s10152-004-0175-5
Riginos C., Cunningham C. W. (2005). Local adaptation and species segregation in two mussel (Mytilus edulis x Mytilus trossulus) hybrid zones. Mol. Ecol. 14, 381–400. doi: 10.1111/j.1365-294X.2004.02379.x
Riisgård H. U., Lüskow F., Pleissner D., Lundgreen K., López M.Á.P. (2013). Effect of salinity on filtration rates of mussels Mytilus edulis with special emphasis on dwarfed mussels from the low-saline Central Baltic Sea. Helgol. Mar. Res. 67, 591–598. doi: 10.1007/s10152-013-0347-2
Rivera-Ingraham G. A., Lignot J.-H. (2017). Osmoregulation, bioenergetics and oxidative stress in coastal marine invertebrates: raising the questions for future research. J. Exp. Biol. 220, 1749–1760. doi: 10.1242/jeb.135624
Sayyed Mohammad Hadi A., Kazue N., Keisuke G. T., Makoto O. (2017). “Pharmacology and molecular identity of serotonin receptor in bivalve mollusks,” in Serotonin. Ed. Fatima S.K. (IntechOpen, Rijeka). doi: 10.5772/intechopen.69680
Schaffer S., Azuma J., Takahashi K., Mozaffari M. (2003). “Why is taurine cytoprotective?,” in Taurine 5: Beginning the 21st Century. Eds. Lombardini J. B., Schaffer S. W., Azuma J. (Springer US, Boston, MA), 307–321.
Scholz N. (1987). Significance of the taurine-glycine ratio as an indicator of stress. Bull. Envir. Contam. Toxicol. 38, 15–21. doi: 10.1007/BF01606551
Shumway S. E. (1977). The effects of fluctuating salinity on the osmotic pressure and Na+, Ca2+ and Mg2+ concentrations in the hemolymph of bivalves. Mar. Biol. 41, 153–177. doi: 10.1007/BF00394023
Simpson G. (2019). _ggvegan: ‘ggplot2’ Plots for the ‘vegan’ Package. R package version 0.1.999 commit 058c08c2f085575965cc5501461ddbbe05792ef5. Available at: https://github.com/gavinsimpson/ggvegan.
Skibska B., Kochan E., Stanczak A., Lipert A., Skibska A. (2023). Antioxidant and anti-inflammatory effects of α-lipoic acid on lipopolysaccharide-induced oxidative stress in rat kidney. Arch. Immunol. Ther. Exp. (Warsz) 71, 16. doi: 10.1007/s00005-023-00682-z
Śmietanka B., Burzyński A., Hummel H., Wenne R. (2014). Glacial history of the European marine mussels Mytilus, inferred from distribution of mitochondrial DNA lineages. Heredity 113, 250–258. doi: 10.1038/hdy.2014.23
Sokolov E. P., Sokolova I. M. (2019). Compatible osmolytes modulate mitochondrial function in a marine osmoconformer Crassostrea gigas (Thunberg 1793). Mitochondrion 45, 29–37. doi: 10.1016/j.mito.2018.02.002
Solmonson A., Deberardinis R. J. (2018). Lipoic acid metabolism and mitochondrial redox regulation. J. Biol. Chem. 293, 7522–7530. doi: 10.1074/jbc.TM117.000259
Strelkov P., Katolikova M., Väinölä R. (2017). Temporal change of the Baltic Sea–North Sea blue mussel hybrid zone over two decades. Mar. Biol. 164, 214. doi: 10.1007/s00227-017-3249-z
Sukhotin A. A., Lajus D. L., Lesin P. A. (2003). Influence of age and size on pumping activity and stress resistance in the marine bivalve Mytilus edulis L. J. Exp. Mar. Biol. Ecol. 284, 129–144. doi: 10.1016/S0022-0981(02)00497-5
Sweeney D. (1963). Dopamine: its occurrence in molluscan ganglia. Science 139, 1051. doi: 10.1126/science.139.3559.1051
Tedengren M., Andre C., Johannesson K., Kautsky N. (1990). Genotypic and phenotypic differences between Baltic and North Sea populations of Mytilus edulis evaluated through reciprocal transplantations. III. Physiology. Mar. Ecol. Prog. Ser. 59, 221–227. doi: 10.3354/meps059221
Tedengren M., Kautsky N. (1986). Comparative study of the physiology and its probable effect on size in blue mussels (Mytilus edulis L.) from the North Sea and the Northern Baltic Proper. Ophelia 25, 147–155. doi: 10.1080/00785326.1986.10429746
Tran D., Perrigault M., Ciret P., Payton L. (2020). Bivalve mollusk circadian clock genes can run at tidal frequency. Proc. Biol. Sci. 287, 20192440. doi: 10.1098/rspb.2019.2440
Väinölä R., Strelkov P. (2011). Mytilus trossulus in northern Europe. Mar. Biol. 158, 817–833. doi: 10.1007/s00227-010-1609-z
Vereycken J. E., Aldridge D. C. (2023). Bivalve mollusks as biosensors of water quality: state of the art and future directions. Hydrobiologia 850, 231–256. doi: 10.1007/s10750-022-05057-7
Wenne R., Zbawicka M., Bach L., Strelkov P., Gantsevich M., Kuklinski P., et al. (2020). Trans-Atlantic distribution and introgression as inferred from single nucleotide polymorphism: mussels Mytilus and environmental factors. Genes (Basel). 11, 530. doi: 10.3390/genes11050530
Wickham H. (2009). ggplot2: Elegant Graphics for Data Analysis (New York: Springer). doi: 10.1007/978-0-387-98141-3
Widdows J. (1985). “The effects of fluctuating and abrupt changes in salinity on the performance of Mytilus edulis,” in Proc 18th EMBS: Marine Biology of Polar Regions and Effect of Stress on Marine Organisms. Eds. Gray J. S., Christiansen M. E. (John Wiley & Sons, Oslo. Chichester, etc), 555–566.
Xu J., Soliman G. M., Barralet J., Cerruti M. (2012). Mollusk glue inspired mucoadhesives for biomedical applications. Langmuir 28, 14010–14017. doi: 10.1021/la3025414
Yancey P. H. (2005). Organic osmolytes as compatible, metabolic and counteracting cytoprotectants in high osmolarity and other stresses. J. Exp. Biol. 208, 2819–2830. doi: 10.1242/jeb.01730
Yancey P. H., Clark M. E., Hand S. C., Bowlus R. D., Somero G. N. (1982). Living with water stress: evolution of osmolyte systems. Science 217, 1214–1222. doi: 10.1126/science.7112124
Zhao X., Li Q., Meng Q., Yue C., Xu C. (2017). Identification and expression of cysteine sulfinate decarboxylase, possible regulation of taurine biosynthesis in Crassostrea gigas in response to low salinity. Sci. Rep. 7, 5505. doi: 10.1038/s41598–017-05852–6
Zhou C., Song H., Feng J., Hu Z., Yang M. J., Shi P., et al. (2022). Metabolomics and biochemical assays reveal the metabolic responses to hypo-salinity stress and osmoregulatory role of cAMP-PKA pathway in Mercenaria mercenaria. Comput. Struct. Biotechnol. J. 20, 4110–4121. doi: 10.1016/j.csbj.2022.08.004
Zhu Y., Yu Z., Liao K., Zhang L., Ran Z., Xu J., et al. (2022). Melatonin in razor clam Sinonovacula constricta: Examination of metabolic pathways, tissue distribution, and daily rhythms. Aquaculture 560, 738548. doi: 10.1016/j.aquaculture.2022.738548
Zurburg W., de Zwaan A. (1981). The role of amino acids in anaerobiosis and osmoregulation in Bivalves. J. Exp. Zool. 215, 315–325. doi: 10.1002/jez.1402150309
Keywords: intracellular osmoregulation, mussels, cryptic species, metabolomics, amino acid metabolism, energy metabolism, hyposalinity, isolation response
Citation: Sokolova IM, Kovalev A, Timm S, Marchenko J and Sukhotin A (2024) Species-specific metabolome changes during salinity downshift in sub-Arctic populations of Mytilus edulis and M. trossulus. Front. Mar. Sci. 11:1403774. doi: 10.3389/fmars.2024.1403774
Received: 19 March 2024; Accepted: 05 June 2024;
Published: 19 June 2024.
Edited by:
Fernando Diaz, Center for Scientific Research and Higher Education in Ensenada (CICESE), MexicoReviewed by:
Silvia Gomez-Jimenez, National Council of Science and Technology (CONACYT), MexicoLuis Vargas-Chacoff, Austral University of Chile, Chile
Lauric Feugere, University of Hull, United Kingdom
Copyright © 2024 Sokolova, Kovalev, Timm, Marchenko and Sukhotin. This is an open-access article distributed under the terms of the Creative Commons Attribution License (CC BY). The use, distribution or reproduction in other forums is permitted, provided the original author(s) and the copyright owner(s) are credited and that the original publication in this journal is cited, in accordance with accepted academic practice. No use, distribution or reproduction is permitted which does not comply with these terms.
*Correspondence: Inna M. Sokolova, aW5uYS5zb2tvbG92YUB1bmktcm9zdG9jay5kZQ==